Management of Low and Variable Bit Rate ATM … › files › 3214883 › Voo...CONTENTS MANAGEMENT...
166
Western Australian Telecommunications Research Institute and The University of Western Australia Management of Low and Variable Bit Rate ATM Adaptation Layer Type 2 Traffic Charles Voo This thesis is presented for the Degree of Doctor of Philosophy of The University of Western Australia School of Electrical, Electronic and Computer Engineering October 2003
Transcript of Management of Low and Variable Bit Rate ATM … › files › 3214883 › Voo...CONTENTS MANAGEMENT...

Western Australian Telecommunications Research Institute
and
The University of Western Australia
Management of Low and Variable Bit Rate
ATM Adaptation Layer Type 2 Traffic
Charles Voo
This thesis is presented for the
Degree of Doctor of Philosophy
of
The University of Western Australia
School of Electrical, Electronic and Computer Engineering
October 2003

MANAGEMENT OF LOW AND VARIABLE BIT RATE ATM ADAPTATION LAYER TYPE 2 TRAFFIC
i
Acknowledgments
I wish to express my sincere thanks to my supervisors, Associate Professor John
Siliquini and Professor Zigmantas Budrikis for their guidance and assistance throughout
my studies towards the Ph.D. degree.
I would also like to acknowledge the support of the Western Australia
Telecommunications Research Institute (WATRI) throughout my Ph.D.
In addition, I would like to acknowledge the financial support provided to me for my
Ph.D. studies by an Australian Postgraduate Award and an Australian
Telecommunications Cooperative Research Centre Award.
More thanks are due to my parents for their encouragement and support throughout my
studies. Special thanks to Tarith Devadason for his valuable comments.
Finally, I would like to thank Jin for her continual love and support.

ABSTRACT
MANAGEMENT OF LOW AND VARIABLE BIT RATE ATM ADAPTATION LAYER TYPE 2 TRAFFIC
ii
Abstract
Asynchronous Transfer Mode (ATM) Adaptation Layer Type 2 (AAL2) has been developed to carry low and variable bit rate traffic. It provides high bandwidth efficiency with low packing delay by allowing voice traffic from different AAL2 channels to be multiplexed onto a single ATM virtual channel connection. Examples of where AAL2 are used include the Code Division Multiple Access and the Third Generation mobile telephony networks. The main objective of this thesis is to study traditional and novel AAL2 multiplexing methods and to characterise their performance when carrying low and variable bit rate (VBR) voice traffic.
This work develops a comprehensive QoS framework which is used as a basis to study the performance of the AAL2 multiplexer system. In this QoS framework the effects of packet delay, delay variation, subjective voice quality and bandwidth utilisation are all used to determine the overall performance of the end-to-end system for the support of real time voice communications.
Extensions to existing AAL2 voice multiplexers are proposed and characterised. In the case where different types of voice applications are presented to the AAL2 multiplexer, it was observed that increased efficiency gains are possible when a priority queuing scheme is introduced into the traditional AAL2 multiplexer system.
Studies of the voice traffic characteristics and their effects on the performance of the AAL2 multiplexer are also investigated. It is shown that particular source behaviours can have deleterious effect on the performance of the AAL2 multiplexer. Methods of isolating these voice sources are examined and the performance of the AAL2 multiplexer re-evaluated to show the beneficial effects of a particular source isolation technique.
The extent to which statistical multiplexing is possible for real time variable VBR sources is theoretically examined. These calculations highlight the difficulties in multiplexing VBR real time traffic while maintaining guaranteed delay bounds for these sources. Based on these calculations, multiplexing schemes that incorporate data transfers within the real time traffic transfer are proposed as alternatives for utilising unused bandwidth caused by the VBR nature of the voice traffic.

CONTENTS
MANAGEMENT OF LOW AND VARIABLE BIT RATE ATM ADAPTATION LAYER TYPE 2 TRAFFIC
iii
Table of Contents
Chapter 1 Introduction 1
1.1 Broadband Integrated Services Digital Network (B-ISDN) 1
1.2 Asynchronous Transfer Mode (ATM) 2
1.2.1 ATM Cell Structure 3
1.2.2 ATM Switching Principles 5
1.2.3 ATM Transfer Capabilities 6
1.2.3.1 Deterministic Bit Rate (DBR) 7
1.2.3.1.1 Using the DBR ATC to Transport CBR Traffic 8
1.2.3.1.2 Using the DBR ATC to Transport VBR Traffic 9
1.2.3.2 Statistical Bit Rate (SBR) 11
1.3 ATM Adaptation Layer (AAL) 13
1.3.1 AAL1 14
1.3.2 Original AAL2 16
1.3.3 AAL3/4 16
1.3.4 AAL5 19

CONTENTS
MANAGEMENT OF LOW AND VARIABLE BIT RATE ATM ADAPTATION LAYER TYPE 2 TRAFFIC
iv
1.3.5 AAL Summary 20
1.3.6 The New AAL2 22
1.3.6.1 Comparisons 25
1.3.6.1.1 AAL1 and AAL2 25
1.3.6.1.2 AAL5 and AAL2 30
1.3.6.2 AAL2 Work 33
1.4 Objectives 33
1.5 Thesis Contents 34
Chapter 2 Establishing Real Time Connections in ATM Networks Using AAL2 36
2.1 AAL2 Network Structure 37
2.2 Real Time Communications 38
2.2.1 Delay Constancy 39
2.2.1.1 Source 40
2.2.1.2 Network 44
2.2.1.3 Destination 46
2.2.1.4 Continuity of Data Flow 47
2.2.1.4.1 Spacer buffer 47
2.2.1.4.2 Play-out buffer overflow 50

CONTENTS
MANAGEMENT OF LOW AND VARIABLE BIT RATE ATM ADAPTATION LAYER TYPE 2 TRAFFIC
v
2.2.1.4.3 Sink starvation 51
2.2.1.5 Establishing the real time connection 54
2.2.2 Quality of Service (QoS) Framework 57
Chapter 3 AAL2 Multiplexer Model 59
3.1. AAL2 Multiplexer System Model 60
3.1.1. Voice Sources 60
3.1.2. AAL2 Multiplexer Model 66
3.2 Simulation in OPNET 69
Chapter 4 Priority Queuing 76
4.1 Delay Budget 76
4.2 Scenario Example 79
4.2.1 General AAL2 Multiplexer Performance 81
4.2.2 Performance of Prioritised AAL2 Multiplexer 83
Chapter 5 Source Sensitivity 89
5.1 Simulation Example 89
5.2 Performance Sensitivity of AAL2 Multiplexer 91
5.3 Usage Parameter Control (UPC) 93
5.3.1 Token Bucket Policer 94

CONTENTS
MANAGEMENT OF LOW AND VARIABLE BIT RATE ATM ADAPTATION LAYER TYPE 2 TRAFFIC
vi
5.3.2 Selection of Token Bucket Parameters 97
5.4 Conclusion 103
Chapter 6 Alternative Multiplexing Method 104
6.1 Simulation Example 104
6.2 Worst Case Behaviour of the Token Bucket Parameters 107
6.3 Future Work - Integrated Multiplexing Scheme 111
6.4 Conclusion 114
Chapter 7 Conclusion 115
References 118
Appendix A Implementation of the DBR and SBR Cell Dispatch Processes 127
Appendix B An Analysis Establishing the Equivalence between DBR and SBR ATCs 139
Appendix C UPC – Software Implementation 148

ACRONYMS
MANAGEMENT OF LOW AND VARIABLE BIT RATE ATM ADAPTATION LAYER TYPE 2 TRAFFIC
vii
Acronyms
3G Third Generation
AAL1 ATM Adaptation Layer Type 1
AAL2 ATM Adaptation Layer Type 2
AAL5 ATM Adaptation Layer Type 5
ATM Asynchronous Transfer Mode
CDMA Code Division Multiple Access
CDV Cell Delay Variation
CID Channel Identifier
CPS Common Part Sublayer
DBR Deterministic Bit Rate
E-ADPCM Embedded-Adaptive Differential Pulse Code Modulation
ETSI European Telecommunications Standards Institute
FCFS First Come First Serve
HEC Header Error Control
IP Internet Protocol
ITU-T International Telecommunications Union – Telecommunications

ACRONYMS
MANAGEMENT OF LOW AND VARIABLE BIT RATE ATM ADAPTATION LAYER TYPE 2 TRAFFIC
viii
LI Length Indicator
MBS Maximum Burst Size
MOS Mean Opinion Score
OSF Offset Field
P Parity
PCM Pulse Code Modulation
PDU Protocol Data Unit
PPR Peak Packet Rate
PSTN Public Switched Telephone Network
QoS Quality of Service
SAP Service Access Point
SBR Sustainable Bit Rate
SMG Statistical Multiplexing Gain
SN Sequence Number
SNR Signal to Noise Ratio
SPR Sustainable Packet Rate
SSCS Service Specific Convergence Sublayer
UPC Usage Parameter Control
UTRAN Universal Mobile Telecommunications System Terrestrial Radio

ACRONYMS
MANAGEMENT OF LOW AND VARIABLE BIT RATE ATM ADAPTATION LAYER TYPE 2 TRAFFIC
ix
Access Network
UUI User to User Indication
VAD Voice Activity Factor
VBR Variable Bit Rate

AUTHOR‘S PUBLICATIONS LIST
MANAGEMENT OF LOW AND VARIABLE BIT RATE ATM ADAPTATION LAYER TYPE 2 TRAFFIC
x
Author’s Publications List
[1]. C. Voo, J. F. Siliquini, and G. Mercankosk, “Service differentiation of variable
bit rate voice in AAL2 multiplexers”, in Proceedings of IEEE Region 10
International Conference on Electrical and Electronic Technology
(TENCON’01), vol. 2, pp. 631-635, 2001.
[2]. C. Voo, J. F. Siliquini and G. Mercankosk, “Performance of AAL Type 2 Voice
Multiplexers”, Proceedings of the 9th IEEE International Conference on
Telecommunications (ICT’02), vol. 1, pp. 1045-1049, June, 2002.
[3]. C. Voo and J. F. Siliquini, “Performance Comparison of Multiplexing Methods
for Voice over ATM using AAL2”, in Proceedings of the 9th IEEE
International Conference on Telecommunications (ICT’02), vol. 1, pp. 593-597,
June, 2002.
[4]. C. Voo, “A Review of the New Adaptation Layer Type 2”, Inter-University
Postgraduate Electrical Engineering Symposium (IUPEES’99), pp. 17-18, July
1999.
[5]. C. Voo, “Performance of Statistical Multiplexed Voice over ATM using AAL2
and Deterministic Bit Dropping”, Inter-University Postgraduate Electrical
Engineering Symposium (IUPEES’00), pp. 71-74, July 2000.
[6]. J. F. Siliquini, G. Mercankosk, S. Ivandich, C. Voo, Z. L. Budrikis, and A.
Cantoni, “On Statistical Multiplexing Gain for Variable Bit Rate Voice
Sources”, in Proceedings of the 8th IEEE International Conference on
Telecommunications (ICT’01), vol. 2, pp. 328-333, June, 2001.

CHAPTER 1 INTRODUCTION
MANAGEMENT OF LOW AND VARIABLE BIT RATE ATM ADAPTATION LAYER TYPE 2 TRAFFIC
1
Chapter 1
Introduction
The Broadband Integrated Services Digital Network (B-ISDN) has been defined for
integrating the transport of different traffic types onto a single network infrastructure.
The underlying technology chosen for the B-ISDN is the Asynchronous Transfer Mode
(ATM). In this chapter, some important characteristics of the ATM such as cell
structure, switching principles and transfer capabilities are described. Also, descriptions
for the roles of ATM adaptation layers (AAL) are given. Comparisons between existing
AAL protocols will highlight the need for the recently defined AAL type 2. Finally, the
AAL2 is described and the thesis’ aims listed.
1.1 Broadband Integrated Services Digital Network (B-ISDN)
Historically, land based telecommunications systems started with the integration of data
communications equipment into the existing Public Switched Telephone Network
(PSTN). The connection of remote computer equipment across different countries was
financially economical as the network infrastructure was already installed
internationally. However, the PSTN was designed for low bandwidth voice traffic and
therefore not suitable for transmitting data, especially when speed requirements
increased. As a result, these networks were later modified with the addition of high
speed cabling but still requiring Modem (Modulator Demodulators using analogue
signalling) connections. These networks had become known as Public Switched Data
Networks (PSDN).

CHAPTER 1 INTRODUCTION
MANAGEMENT OF LOW AND VARIABLE BIT RATE ATM ADAPTATION LAYER TYPE 2 TRAFFIC
2
As the demands on bandwidth increased, the need for a true digital media became
apparent and this led to the development of the Integrated Service Digital Network
(ISDN). The ISDN supports telephony and a wide range of data applications such as
teletext and facsimile in the same network at connection speeds of 64kbit/s. This rate
was chosen because, at that time, it was the standard rate for digitised voice.
With the development of ISDN, the possibility of new services such as video
conferencing, video telephony and other multimedia type applications were being
investigated. However the introduction of these new services into the ISDN was
hampered by the limitation that ISDN can only support applications compatible with the
64kbit/s switched digital connections. Therefore, the Broadband Integrated Service
Digital Network (B-ISDN) was developed and standardised by the International
Telecommunications Union – Telecommunications (ITU-T) to support multimedia
services with different bandwidths and delay requirements.
At the time B-ISDN was developed, there were two existing technologies that could be
used to support the B-ISDN. These were the Synchronous Digital Hierarchy (SDH) and
the Asynchronous Transfer Mode (ATM) technologies. ATM was chosen as a candidate
to be the transport mechanism for B-ISDN due to its simplicity and its capability to
support a variety of both delay and loss sensitive traffic types.
1.2 Asynchronous Transfer Mode (ATM)
ATM is a cell based networking and switching technology which can support a variety
of both delay and loss sensitive traffic. As a cell based transmission technology, ATM
packs data from various sources attached to the B-ISDN into a standard ATM cell
format and the network transports these cells across the network. This uniform cell
structure standardises the processing of cells and simplifies the integration of network
components. ATM has been standardised by both the International Telecommunications
Union (ITU) [1] [2] and the ATM Forum for use in the planned public network of the
future.
CHAPTER 1 INTRODUCTION
MANAGEMENT OF LOW AND VARIABLE BIT RATE ATM ADAPTATION LAYER TYPE 2 TRAFFIC
3
ITU was established on May 17, 1865. It was formed to allow the interconnection of
telegraph networks between countries. Now there are three general ITU sectors:
Telecommunications (ITU-T), Radiocommunications (ITU-R) and Development (ITU-
D). The main objective of the ITU is to define international standards that are to be
adopted by all countries. Because the standardisation body is large, much time is
required before a standard is adopted. Therefore the ATM Forum was established in
October 1991 and was meant to accelerate the development of ATM products and
services through a rapid convergence of interoperability specifications. In addition, it
was supposed to promote industry cooperation and market awareness. For the work
presented in this thesis, descriptions of any ATM terms will be based on the ITU-T
standards as ITU is internationally recognised.
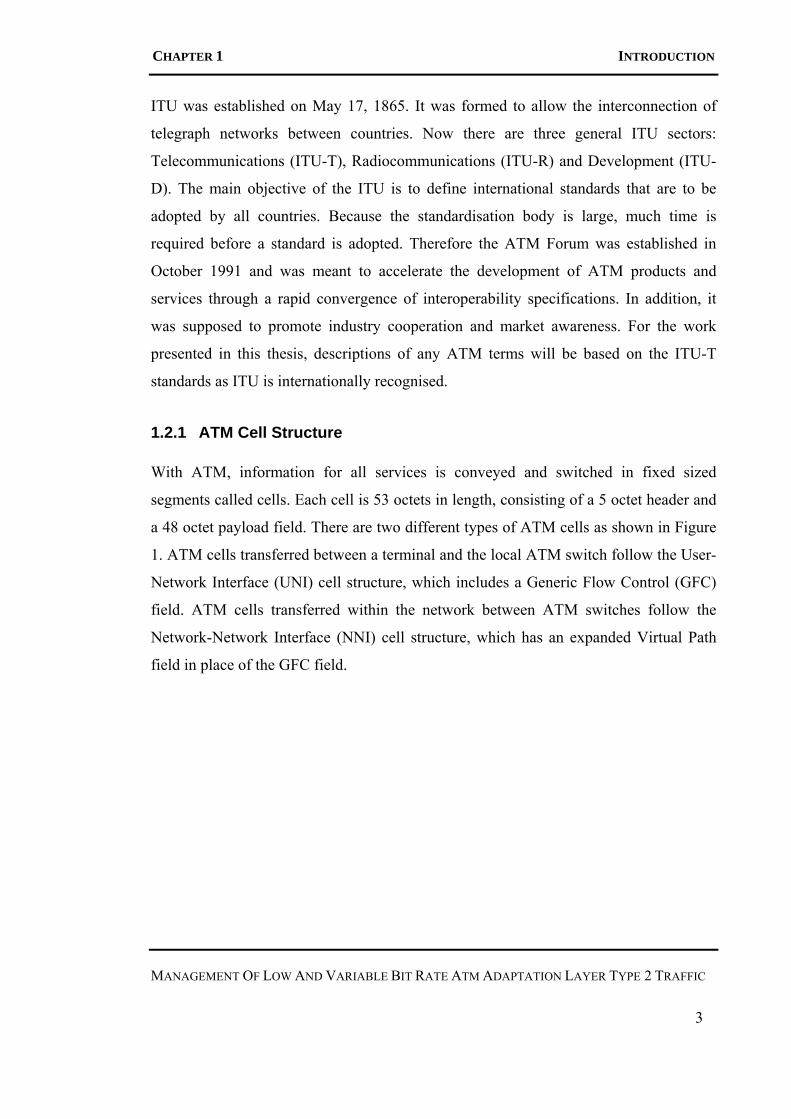
1.2.1 ATM Cell Structure
With ATM, information for all services is conveyed and switched in fixed sized
segments called cells. Each cell is 53 octets in length, consisting of a 5 octet header and
a 48 octet payload field. There are two different types of ATM cells as shown in Figure
1. ATM cells transferred between a terminal and the local ATM switch follow the User-
Network Interface (UNI) cell structure, which includes a Generic Flow Control (GFC)
field. ATM cells transferred within the network between ATM switches follow the
Network-Network Interface (NNI) cell structure, which has an expanded Virtual Path
field in place of the GFC field.

CHAPTER 1 INTRODUCTION
MANAGEMENT OF LOW AND VARIABLE BIT RATE ATM ADAPTATION LAYER TYPE 2 TRAFFIC
4
UNI Octet NNI
GFC VPI
VPI VCI
VCI
VCI PTI CLP
HEC
1ST octet of payload
2nd octet of payload
48 octet of payload
7
6
5
4
3
2
1
VPI
VCI PTI
48 octet of payload
2nd octet of payload
1ST octet of payload
HEC
CLP
VCI
VCI
VPI
53
0 77 bit bit 0
Figure 1: UNI and NNI ATM cell structure.
The following gives a description of the various ATM fields:
• Generic Flow Control (GFC): Consists of 4 bits and is optionally used to
regulate the entry of cells into the ATM network.
• Virtual Path Identifier (VPI): Consists of 12 bits in the NNI and 8 bits in the
UNI, and is used for the identification and routing of cells.
• Virtual Channel Identifier (VCI): Consists of 16 bits and is also used for the
identification and routing of cells.
• Payload Type Identifier (PTI): Consists of 3 bits and is used to identify the type
of information contained in the ATM cell.
• Cell Loss Priority (CLP): Consists of 1 bit and is used to identify the priority of
the cell with regards to its discard potential. Cells with CLP = ‘1’ are considered

CHAPTER 1 INTRODUCTION
MANAGEMENT OF LOW AND VARIABLE BIT RATE ATM ADAPTATION LAYER TYPE 2 TRAFFIC
5
low priority and discarded first when a network element experiences congestion.
• Header Error Control (HEC): Consists of 8 bits and is used for error checking on
the first 4 octets of the header.
1.2.2 ATM Switching Principles
The VPI and VCI fields within each ATM cell are used to identify and switch cells
across the ATM network. The size of the fields are minimised by only providing
switching information between the current and next switching elements and not an end-
to-end global address as in the Internet Protocol (IP) address. The VPI/VCI fields within
the cells are updated as they are passed from switch to switch.
VPI_1 VPI_2
VPI_3
VCI_1 VCI_1
VCI_2
VCI_1
ATM Switch
Figure 2: VPI/VCI Translation within an ATM switch.
Figure 2 shows the relationship between VPIs and VCIs and how they are translated
when processed in an ATM switch. From Figure 2, there are two connections both
having a VPI of 1. Within a single virtual path, there can be theoretically up to 216
virtual connections. In the above example, there are only 2 VCI labelled 1 and 2.

CHAPTER 1 INTRODUCTION
MANAGEMENT OF LOW AND VARIABLE BIT RATE ATM ADAPTATION LAYER TYPE 2 TRAFFIC
6
1.2.3 ATM Transfer Capabilities
Applications with different service requirements are supported in ATM by different
transfer schemes [2] [3] [4]. Delay-sensitive applications, such as telephony and video
require a timing relation between source and destination and there are transfer
capabilities which exist for these. These real-time applications require a limit on the
variation in the end-to-end delay to allow the communications to be real-time in nature.
It also allows for the relevant transmit and receive buffers to be dimensioned. On the
other hand, for applications such as data transfers, which are non-delay sensitive but
loss-sensitive, no timing relation is required between source and destination. There are
also transfer capabilities to support this type of communications.
ATM supports four different transfer capabilities, these being the Deterministic Bit Rate
(DBR), Statistical Bit Rate (SBR), Available Bit Rate (ABR) and Unspecified Bit Rate
(UBR) transfer capabilities.
In Table 1 we summarise the characteristics of each of the ATM transfer capabilities in
terms of their suitability for the transport of real time and non-real time traffic. Since
this thesis is primarily concerned with the transfer of real time traffic, only DBR and
SBR ATM transfer capabilities will be described in more detail.
SBR Service
Characteristics
DBR
Type 1 Type 2 and 3
ABR UBR
Bandwidth Guarantee Yes Yes Yes Optional No
Real time traffic Yes Yes No No No
Bursty data traffic No No Yes Yes Yes
Table 1: Summary of the ATM service characteristics.

CHAPTER 1 INTRODUCTION
MANAGEMENT OF LOW AND VARIABLE BIT RATE ATM ADAPTATION LAYER TYPE 2 TRAFFIC
7
The difference in SBR types (excluding SBR Type 1 (SBR1)) is in the handling of cells
based on the value of the CLP field in the ATM header (described in Section 1.2.3). For
cells with CLP=1, selective cell discard applies to both SBR Type 2 (SBR2) and SBR3
Type 3 (SBR3). However SBR3 also allow cells with CLP=1 to be tagged. For voice
and other real time applications, only DBR and SBR Type 1 (SBR1) transfer
capabilities are suitable.
1.2.3.1 Deterministic Bit Rate (DBR)
Deterministic Bit Rate (DBR) ATM transfer capability (ATC) is used for the transport
of real time traffic with guaranteed bandwidth for delay sensitive applications. Quality
of Service commitments provided by DBR ATC are guaranteed for each connection.
The traffic characteristic of the DBR ATC is modelled by a single traffic descriptor,
namely the Peak Cell Rate (PCRDBR). Under ITU standardisation, the DBR ATC can be
used to support both constant bit rate (CBR) traffic and variable bit rate (VBR) traffic.
The general case of transporting ATM cells using DBR ATC is shown in Figure 3.
Incoming cells
tk+1Spacer
DBR
dspacer,k , 'k k spacer k p kt d Dζ τ= + + +
tk tk-1 ζk+1 ζk ζk-1
timetime
ATMτκ’
Tk,k+1
Source Network Destination
Figure 3: General model showing distribution of cells through an ATM network
using the DBR ATM transfer capability.
Source
Referring to Figure 3, tk denotes the time at which the last bit of the kth cell is presented
to the spacer. The interarrival time between the kth and the k+1th cell is defined as Tk,k+1.

CHAPTER 1 INTRODUCTION
MANAGEMENT OF LOW AND VARIABLE BIT RATE ATM ADAPTATION LAYER TYPE 2 TRAFFIC
8
Spacer
The function of the spacer is to limit the presentation of cells into the ATM network to a
rate less than or equal to the peak cell rate of the DBR connection i.e. PCRDBR. Let
dspacer,k denote the waiting time experienced by the kth cell in the spacer buffer. This
value is assumed to be statistically bounded by τspacer (i.e. 0 ≤ dspacer,k < τspacer).
Network
There are two components of delay associated with the transport of cells through the
ATM network. The first component delay is the fixed propagation delay and is the time
it would take a cell to traverse the ATM network if the cell experienced no queuing
delay along its path. It also includes the packet transmission and processing delay
within the switches in the network. This component of delay is denoted as Dp. The
second component of delay is the queuing delay. Let τk’ denote the total queuing delay
experience by the kth cell along its path. The value of τk’ is dependent on the amount of
jitter or queuing delay experienced by the cells travelling through the ATM network.
According to DBR traffic contract, the value of τk’ is statistically bounded by the cell
delay variation tolerance, τCDV [5].
Destination
At the destination, the last bit of the kth cell arrives at time ζk defined as
, 'k k spacer k p kt d Dζ τ= + + + (1.1)
1.2.3.1.1 Using the DBR ATC to Transport CBR Traffic
Constant bit rate (CBR) sources are sources that produce traffic at fixed rates and are
characterised by a single traffic parameter, their peak cell rate. Figure 4 shows the
transport of these CBR cells through the ATM network using the DBR ATC.

CHAPTER 1 INTRODUCTION
MANAGEMENT OF LOW AND VARIABLE BIT RATE ATM ADAPTATION LAYER TYPE 2 TRAFFIC
9
, 11
k kDBR
T PCR+ ≥
Incoming cells
Spacer
dspacer,k
DBR
'k k p kt Dζ τ= + +PCRDBR
tk+1 tk tk-1
time
ζk+1 ζk ζk-1
time
ATMτκ’
Network DestinationSource
Figure 4: Transport of CBR cells through an ATM network using the DBR ATM
transfer capability.
Referring to Figure 4, to conform to the DBR traffic contract the CBR input traffic rate
must be less than or equal to the peak cell rate of the DBR connection (i.e. Tk,k+1 ≥
1/PCRDBR). In this case, the waiting time for each cell in the spacer, dspacer,k is 0. Note
that the CBR input traffic rates cannot be greater than the PCR of the DBR connection
because incoming cells will be discarded when the spacer inevitably overflows. Using
(1.1) and τCDV as the bound for τk’, we can write for ζk:
k p k k p CDt D t D Vζ τ+ ≤ ≤ + + (1.2)
1.2.3.1.2 Using the DBR ATC to Transport VBR Traffic
The DBR ATC can also be used to transport Variable Bit Rate (VBR) sources. VBR
sources are characterised by variable inter-cell arrival times. We assume that the VBR
sources generate packets that conform to the Generic Cell Rate Algorithm (GCRA) [6]
that has three parameters; Peak Cell Rate (PCRsource), Sustainable Cell Rate (SCRsource)
and Intrinsic Burst Tolerance (τIBTsource). In this case, the GCRA is a policer that
discards non-conforming cells before sending them to the spacer buffer to prevent the
possibility of spacer buffer overflow. Therefore the sustainable cell rate of the source
(i.e. SCRsource) must be smaller or equal to the peak cell rate of the DBR ATC (i.e.
PCRDBR). The characteristics of the cell transport for a VBR source using the DBR ATC
is shown in Figure 5.

CHAPTER 1 INTRODUCTION
MANAGEMENT OF LOW AND VARIABLE BIT RATE ATM ADAPTATION LAYER TYPE 2 TRAFFIC
10
ATMτκ’
Incoming cells
Spacer
dspacer,k
DBR
, 'k k spacer k p kt d Dζ τ= + + +PCRDBR
Cells conform to GCRA(PCRsource, SCRsource, τIBTsource)
tk+1 tk tk-1
time
ζk+1 ζk ζk-1
time
Source Network Destination
Figure 5: Distribution of VBR packets through an ATM network with DBR
transfer capabilities.
Referring to Figure 5, the VBR input traffic rate can be greater than the PCR of the
DBR connection (i.e. Tk,k+1 ≤ 1/PCRDBR) when the burst of cells conform to GCRA
(PCRsource, SCRsource and τIBTsource). The maximum burst size of the traffic source is
given by
11 1
IBTsource
source source
MBS
SCR PCR
τ= +
⎛ ⎞−⎜ ⎟⎝ ⎠
(1.3)
For VBR traffic, dspacer,k is statistically bounded by the intrinsic burst tolerance, τIBTsource
(i.e. 0 ≤ dspacer,k < τIBTsource). The maximum network delay, τk’ experienced by each cell
is again statistically bounded by τCDV. At the destination, each cell arrives at time ζk that
has bounds in the range given by (1.4).
, k p k k spacer k p CDVt D t d Dζ τ+ ≤ ≤ + + + (1.4)

CHAPTER 1 INTRODUCTION
MANAGEMENT OF LOW AND VARIABLE BIT RATE ATM ADAPTATION LAYER TYPE 2 TRAFFIC
11
1.2.3.2 Statistical Bit Rate (SBR)
Statistical Bit Rate (SBR Type 1) ATM transfer capability (ATC) has 3 traffic
parameters associated with it, namely the PCRSBR, SCRSBR and τIBT SBR. The input rate
into the network is limited to the PCRSBR, which with the specified τIBT SBR provides a
limit on the volume of traffic that may be input above the SCRSBR. Therefore, VBR
sources must first be shaped according to the GCRA with its PCRSBR, SCRSBR and
τIBT SBR parameters before they are carried by the SBR ATC. The SBR service
guarantees that the actual transfer will be a rate at least equal to the SCRSBR. However, at
times the VBR traffic can be serviced at a higher rate than the SCRSBR. But that is not
guaranteed. The model for VBR cell transport through an ATM network with SBR
ATM transfer capability is shown in Figure 6. Note that no spacer is required in this
case.
ATMτκ’
Incoming cells
Policer
SBR 'k k p kt Dζ τ= + +PCRSBR, SCRSBR, τIBT SBRtime
tk+1 tk tk-1time
ζk+1 ζk ζk-1
Source Network DestinationCells conform to GCRA(PCRsource, SCRsource, τIBTsource)
Figure 6: Distribution of VBR packets through an ATM network with SBR
transfer capabilities.
Referring to Figure 6, incoming cells pass through a policer according to the GCRA
(PCRSBR, SCRSBR and τIBT SBR). Conforming cells are passed to the ATM network with
no delay incurred by the policer. Note that any cells found non-conforming by the
GCRA (PCRSBR, SCRSBR and τIBT SBR) are unconditionally discarded. Within the ATM
network, each cell will be subject to a variable queuing delay. The composition of the
queuing delay includes not only the constant delay Dp and the delay due to phase
coincidences with other traffic (i.e. τCDV) but also a possible smoothing delay whenever
the service rate within the network is less than the rate at which the cells enter the ATM
network (i.e bounded by the intrinsic burst tolerance, τIBT SBR). The bounds on these

CHAPTER 1 INTRODUCTION
MANAGEMENT OF LOW AND VARIABLE BIT RATE ATM ADAPTATION LAYER TYPE 2 TRAFFIC
12
various delay components for a number of scheduling disciplines used in the ATM
switches are summarised in Table 2.
Scheduling disciplines Variable delay bounds
Parekh-Gallager [7]
PGPSi MUX IBT SBR
SBR
KD SCRτ τ ⎛ ⎞< + + ⎜ ⎟⎝ ⎠
Golestani [8] 1 ...SCFQ
i MUX IBT SBR KSBR
KD NSCR N Kτ τ δ⎛ ⎞< + + + + + −⎜ ⎟⎝ ⎠
δ δ
Stiliadis-Varma [9] ( ) ( )( )1 ... KLR
i MUX IBT SBR i iD τ τ θ θ< + + + +
Goyal-Vin-Cheng [10] ( ) 1 ...SFQi MUX IBT SBR KD N N Kτ τ δ δ< + + + + − δ
Table 2: Variable transfer delay bounds for various scheduling disciplines.
Referring to Table 2, the bracketed term in each of the bounds corresponds to the delay
due to phase coincidences (i.e. τCDV) with other traffic across the network. The number
of hops a cell goes through is denoted by K and δ denotes one cell transmission time in
seconds. Nj denotes the number of connections competing for access at hop j. It can be
seen in Table 2 that for any of the scheduling disciplines, the smoothing delay is
bounded by τIBT SBR.
Therefore, when using the SBR ATC for transporting VBR traffic, cells arrive at the
destination at time ζk that has bounds in the range given by
' k p k k pt D t D kζ τ+ ≤ < + + (1.5)
Where the term τ’k is given by
' k CDV IBT SBτ τ τ= + R (1.6)

CHAPTER 1 INTRODUCTION
MANAGEMENT OF LOW AND VARIABLE BIT RATE ATM ADAPTATION LAYER TYPE 2 TRAFFIC
13
1.3 ATM Adaptation Layer (AAL)
Transfer capabilities are supported by ATM Adaptation Layers (AAL). AALs provide a
mapping protocol between higher layers and the ATM layer. In terms of hierarchy
within the B-ISDN Protocol Reference Model, it rests on top of the ATM layer as
shown in Figure 7.
ATM Adaptation
Layer (AAL) (3)
Convergence Sublayer (CS)
Segmentation & Reassembly
Sublayer (SAR)
ATM Layer (2)
Physical Layer (1)
Higher Layers (4+)
Figure 7: B-ISDN Protocol Reference Model.
Referring to Figure 7, the lowest layer is the Physical layer. This layer is concerned with
the transmission of data as well as other low level functions such as bit timing,
transmission of frames and error checking. The second layer is the ATM layer, which
provides VPI/VCI translation as described in Section 1.2, cell header creation/retrieval
and Generic Flow Control.
Currently, there are four AAL protocols specified to cover the transfer capabilities
described in Section 1.2.3. The AAL chosen for use is one that best suits the
characteristics of the higher layer applications. The characteristics of each AAL is
summarised in Table 3.

CHAPTER 1 INTRODUCTION
MANAGEMENT OF LOW AND VARIABLE BIT RATE ATM ADAPTATION LAYER TYPE 2 TRAFFIC
14
ATM Adaptation Layer Type Characteristics
AAL1 AAL2 (old)
AAL3/4 AAL5
Timing Relationship
Yes Not Required
Bit Rate Constant Variable
Mode Connection Oriented
Connectionless / Connection Oriented
Connection Oriented
Table 3: ATM Adaptation Layer Characteristics.
The AAL layer consists of two sublayers known as the Convergence Sublayer (CS) and
the Segmentation and Reassembly sublayer (SAR). The functionality of the CS is to
receive/send packets from/to higher layers. For each AAL, the packet structure is
different and as such, each AAL supports a different type of CS packet. The
functionality of the SAR sublayer is to segment packets into sizes equivalent to the
length of the ATM cell payload before sending these onto the ATM layer.
1.3.1 AAL1
AAL1 has been designed to provide a DBR, connection oriented service wherein the
timing relationship between the source and the destination is required. This timing
relationship is obtained by the use of the Source Clock Frequency Recovery [11] [12].
The use of AAL1 is suitable for delay sensitive applications such as telephony.
The Segmentation and Reassembly Protocol Data Unit (SAR-PDU) packet structure of
AAL1 is shown in Figure 8. The size of the packet structure is exactly 48 octets in
length (i.e. corresponding to the length of an ATM cell payload). A SAR-PDU is
formed by prepending a Segmentation and Reassembly Service Data Unit (SAR-SDU)
with an octet header when it leaves for the ATM layer. Note that the header is extended
to 2 octets when the CSI field is set to 1 and the SCF field is of even count (i.e. 0, 2, 4

CHAPTER 1 INTRODUCTION
MANAGEMENT OF LOW AND VARIABLE BIT RATE ATM ADAPTATION LAYER TYPE 2 TRAFFIC
15
or 6). The offset field in the additional octet is used as a pointer to indicate the end of
the payload and the parity bit is used to provide protection over the offset field. For this
SAR-PDU, the maximum payload is 46 octets.
1 3 3 1 1 Bits7
CSI SCF CRC SAR-SDU
1 Octet
SAR-SDU=47 Octets when CSI=0
PAR PAR Offset Field
Present when CSI=1 and
SCF=0, 2, 4, or 6
Figure 8: AAL1 SAR-PDU Packet Structure.
The following gives a description of the various AAL1 fields:
• Convergence Sublayer Indication (CSI): Consists of 1 bit. This indicates the
presence of the convergence sublayer function. Some examples of CS functions
include the handling of SAR-PDU for partially filled SAR-PDU payloads, the
handling of cell delay variation for delivery of AAL-SDUs to an AAL user at a
constant bit rate, and timing information transfers.
• Sequence Count Field (SCF): Consists of 3 bits. This is provided by the CS layer
and is used for the detection of lost or mis-inserted SAR-SDUs at the receiver.
• Cyclic Redundancy Checksum (CRC): Consists of 3 bits. This is used for bit
error detection and correction over the SAR-PDU header.
• Parity (PAR): Consists of 1 bit. This is set such that the 1 octet SAR-PDU
header has even parity and is used to protect the CRC.
The one octet header is checked and removed by the AAL1 SAR sublayer on reception
and the payload sent to the higher layer from the CS layer.

CHAPTER 1 INTRODUCTION
MANAGEMENT OF LOW AND VARIABLE BIT RATE ATM ADAPTATION LAYER TYPE 2 TRAFFIC
16
As previously mentioned, partially filled SAR-PDU payloads can be handled by the CS
sublayer using the Structure Data Transfer (SDT) method where an additional octet in
the SAR-PDU header (i.e. extended to 2 octets) is used as a pointer to indicate the end
of the payload [13]. This cell format can only be used when the sequence count value
(i.e. SCF) in the SAR-PDU header is 0, 2, 4, or 6. For delay-sensitive applications
where the SAR-SDUs are always less than 47 octets, [13] defines a CS procedure for
partially filling the payload of a SAR-PDU. This method (known as the partial fill
procedure) requires the receiving AAL CS to know when the payload contains
overhead, the number of overhead octets and the position of these octets in the payload.
Using this method, the number and position of AAL user information octets and CS
generated dummy value octets in the remaining payload octets can be determined.
However, [13] does not specify how the receiver will be able to distinguish AAL user
information from padding (i.e. dummy octets) using information obtained from the
AAL header. This has yet to be implemented for the AAL1.
1.3.2 Original AAL2
Referring to Table 3, the original AAL2 was intended to provide real time services that
have variable bit rates. However, due to the standard having many undefined properties,
it is no longer under development. Note that this AAL bears no structural relation to the
new AAL2 that will be described later in Section 1.3.6.
1.3.3 AAL3/4
AAL3 and AAL4 merged to become AAL3/4 and provide both connection and
connectionless data service for variable bit rate (VBR) traffic. However, the AAL itself
does not perform all functions required by a connectionless service, since functions such
as routing and network addressing are performed at the network layer. There are two
modes in which the AAL can operate; Stream Mode and Message Mode. If the
preservation of message boundaries is required, then Message Mode must be used.

CHAPTER 1 INTRODUCTION
MANAGEMENT OF LOW AND VARIABLE BIT RATE ATM ADAPTATION LAYER TYPE 2 TRAFFIC
17
The size of an AAL3/4 packet can be as large as 65,535 octets. The large packet size
introduces transmission latencies, thus making it unsuitable for real time traffic. Figure
9 shows both the AAL3/4 CS and SAR PDU packet structures. Note that the SAR-SDU
can be smaller than 44 octets.
1 1 2 Octets =<65535 0-3 1 1 2
CPI BETag BA AAL-SDU Pad AL BETag
ST SN MID 44 Octets of CS-PDU LI
SAR-PDU
CS-PDU
6 10 bits 4 102
CRC
Length
Figure 9: AAL3/4 CS and SAR packet structures.
The following gives a description of the various AAL3/4 CS-PDU fields:
• Common Part Indicator (CPI): Consist of 1 octet. This is used to interpret
subsequent fields for the CS functions in the CS-PDU header. Examples include
identifying related AAL layer management messages such as performance and
fault monitoring, and the transfer of Operation and Management (OAM)
messages.
• Begin End Tag (BETag): Consist of 1 octet. This is a sequence number used for
checking packet synchronisation. Made redundant for connectionless services.
Note that it is also repeated in the tail.
• Buffer Allocation (BA): Consists of 2 octets. This allows the receiving CS to
allocate the appropriate amount of memory resources for incoming data. When
AAL3/4 operates in message mode, the BA value is encoded equal to the CS-

CHAPTER 1 INTRODUCTION
MANAGEMENT OF LOW AND VARIABLE BIT RATE ATM ADAPTATION LAYER TYPE 2 TRAFFIC
18
PDU payload length. In streaming mode, the BA value is encoded equal to or
greater than the CS-PDU payload length.
• AAL-Service Data Unit (AAL-SDU): Allows up to 65,535 octets of data to pass
between the higher layer application and the CS.
• Pad: Consists of up to 3 octets. Size of padding required must be such that the
total packet length is a multiple of 4.
• Alignment (AL): Consists of 1 octet. This is similar to Pad but ensuring that the
trailer is 4 octets long.
• Length: Consists of 2 octets. This indicates the length of the CS-PDU payload
field in octets and is also used by the receiver to detect loss or gain of
information.
For transmission, the CS-PDUs are segmented by the SAR sublayer into 44 octet blocks
and prepended 2 octet headers and appended 2 octet trailers. Note that the SAR-SDUs
can be smaller than 44 octets. The resultant 48 octet SAR-PDUs are sent to the ATM
layer where they are encapsulated into ATM cells through the prepending of 5 octet
headers.
The following gives a description of the various AAL3/4 SAR-PDU fields:
• Segment Type (ST): This identifies a SAR-PDU as containing a Beginning of
Message (BOM), a Continuation of Message (COM), an End of Message (EOM)
or a Single Segment Message (SSM).
• Sequence Number (SN): Consists of 4 bits and can be used for the detection of
missing SAR-SDUs.
• Multiplexing Identifier (MID): Consists of 10 bits used to identify which CS-
PDU the received SAR-PDU relates to. This allows AAL3/4 to multiplex data

CHAPTER 1 INTRODUCTION
MANAGEMENT OF LOW AND VARIABLE BIT RATE ATM ADAPTATION LAYER TYPE 2 TRAFFIC
19
from different AAL3/4 connections.
• Length Indicator (LI): Consists of 6 bits to indicate the length of SAR-SDU
information in the SAR-PDU payload.
• Cyclic Redundancy Checksum (CRC): Consists of 10 bits used for bit error
detection on transfer of SAR-PDU.
1.3.4 AAL5
Due to the merging of AAL3 and AAL4, AAL3/4 has large overheads. AAL5 was then
developed to replace AAL3/4. It provides similar connectionless services support as
AAL3/4 but with less transmission overheads and better error detection. However,
unlike AAL3/4, AAL5 does not support multiplexing of different AAL5 connections
onto a single VCC.
The CS for AAL5 is further divided into two parts, the Common Part Convergence
Sublayer (CPCS) and the Service Specific Convergence Sublayer (SSCS) [11]. The
SSCS provides signalling functions as required by the higher layers, and may
sometimes be null. Similar to AAL3/4, AAL5 has two modes of operations; Streaming
Mode and Message Mode. This has been discussed in Section 1.3.3. The AAL5 CS-
PDU packet structure is shown in Figure 10.
octets 0-47 1 1 2 4
=< 65535 octets payload Pad UU CPI Length CRC
CS-PDU
Figure 10: AAL5 CS-PDU packet structure.

CHAPTER 1 INTRODUCTION
MANAGEMENT OF LOW AND VARIABLE BIT RATE ATM ADAPTATION LAYER TYPE 2 TRAFFIC
20
The following gives a description of the various AAL5 CS-PDU fields:
• Pad: Padding of 0 - 47 octets added to ensure that the CS-PDU length is an
integral number of 48 octet segments. This helps to simplify SAR segmentation
process and receiver packet field decoding.
• User to User identifier (UU): Consists of 1 octet. It enables the AAL user layers
to identify the associated Service Access Point (SAP).
• Common Part Indicator (CPI): Consist of 1 octet. This is not used but is included
to ensure trailer without padding is 8 octets in length.
• Length: Consists of 2 octets. It indicates the length of the CS-PDU payload field
and is also used by the receiver to detect loss or gain of information.
• Cyclic Redundancy Checksum (CRC): Consists of 4 octets used for error
detection on transfer of CS-PDU.
The SAR-PDUs are created by segmenting CS-PDUs into 48 octet blocks. There are no
prepended header or appended trailer fields. AAL5 uses the ATM User to User (AUU)
parameter in the ATM cell PTI field to indicate the existence of the end of a CS-PDU in
a SAR-PDU payload. Note a SAR-PDU where the value of AUU is ‘1’ indicates the
end of a CS-PDU; the value of ‘0’ indicates the beginning or continuation of a CS-PDU.
1.3.5 AAL Summary
From the above descriptions of AALs, it is found that each different AAL is used for a
different service class.
AAL1 supports DBR real time, connection-oriented services and is therefore suitable
for the transportation of voice band signals (e.g. One 64kbit/s A-law or µ-law coded
G711 signal), video and high quality audio traffic.

CHAPTER 1 INTRODUCTION
MANAGEMENT OF LOW AND VARIABLE BIT RATE ATM ADAPTATION LAYER TYPE 2 TRAFFIC
21
AAL3/4 is suitable for services that utilise long packets. This is because the longer the
packet, the smaller the percentage of the transmission overheads. However, having a
long packet may result in a received packet being discarded when only a bit is in error.
AAL3/4 supports multiplexing of different AAL3/4 data streams unto a virtual channel
through the use of the MID field.
AAL5 is the improved version of AAL3/4. It provides the same functions but with less
transmission overheads and better error detection than the AAL3/4. Hence, AAL5 has
been adopted as the standard for the ATM signalling protocol. It does not support
multiplexing of packets on a virtual channel.
In summary, any real time services such as multimedia require the use of AAL1 and
non real time services require the use of either AAL3/4 or AAL5.
Since the mid 1990s, there has been an increasing need for the support of low bit rate
time sensitive traffic. Although AAL1 is able to support this type of traffic, it is at the
expense of inefficient use of bandwidth since the cell rate must be high to maintain real
performance but for low bit rate traffic, only a small portion of the ATM cell payload is
utilised. Here it has been assumed that AAL1 has the capability to support partially
filled payloads using the partial fill method described in Section 1.3.1.
An example of such an application is the transfer of voice data using AAL1. Audio
sources are usually sampled at 8kHz and quantified into an 8-bit word, therefore
requiring a 64kbits/s channel. Using an ATM cell to transfer just one voice data word is
very inefficient use of available bandwidth (i.e. 1 octet out of a possible 47-octet
payload space). Packing more voice data words into the ATM cell payload can increase
the bandwidth efficiency, but can only be done at the expense of delaying transmission
of some data until the cell is partly or completely full.
If ATM cells can only be transmitted when the payload is completely filled, then the
first cell in the payload would have to wait for a total of 47 octets. Byte arrivals occur
once every 125µs. Once the first byte in an ATM cell payload has been received, it

CHAPTER 1 INTRODUCTION
MANAGEMENT OF LOW AND VARIABLE BIT RATE ATM ADAPTATION LAYER TYPE 2 TRAFFIC
22
would have to wait for another 46 octets. In terms of time to accumulate 47 octets, this
corresponds to a total time of 47×125µs=5. 875ms at an effective rate of 64kbits/s.
At this point, it should be noted that most voice sources compress their voice data prior
to transmission. An operational characteristic of compressors is to buffer the voice data
until sufficient data is obtained before transmitting them. This introduces additional
delay especially when the system is already waiting for enough data to fill an entire
ATM cell payload. So in the above example, if voice was compressed to an effective
data rate of 8kbits/s, the total packetisation delay would increase to 8×5.875ms=48ms.
This is unacceptable because for a voice connection, the delay budget that consists of
delay components such as queuing delay, propagation delay, network delay and
equalisation delay is tight (i.e. around 100ms one way). Hence with such a large
packetisation delay, it is difficult to meet this delay budget, given the existence of the
other delay components (refer to Section 4.1 for more details).
The solution then is to provide an AAL that can multiplex data packets from multiple
sources into a single ATM cell payload. This requires a small but variable length
packet. It should also allow for processing of concurrent packet arrivals from different
higher layer applications since a number of packets of different sizes can be multiplexed
into the same ATM cell. This can greatly increase bandwidth efficiency and reduce
transmission latencies due to the reduced time in filling the ATM payloads. The
recently defined AAL2 supports such requirements.
1.3.6 The New AAL2
The new AAL2 standardised by the ITU-T in November 2000 [14] [15] [16] and the
ATM Forum in [17] was developed specifically to support the transfer of low and
variable bit rate traffic across the ATM network. It does this efficiently by supporting
the multiplexing of AAL2 packets from different higher layer applications into the same
ATM cell for transmission. The AAL2 SAR-PDU packet structure is shown in Figure
11.

CHAPTER 1 INTRODUCTION
MANAGEMENT OF LOW AND VARIABLE BIT RATE ATM ADAPTATION LAYER TYPE 2 TRAFFIC
23
8 6 5 5 bits
CID LI UUI HEC
3 octets =< 44 octets
Payload
Figure 11: AAL2 SAR-PDU packet structure.
Descriptions of the AAL2 packet fields are as follows:
• Channel Identifier (CID): Denotes the corresponding Convergence Part Sublayer
(CPS) connection using 8 bits. Note that there are 8 reserved values.
• Length Indicator (LI): Indicates the number of valid octets in the payload within
the range of 1 to 45 using 6 bits in the header.
• User to User Indication (UUI): Consists of 5 bits and is used by the Service
Specific Convergence Sublayer (SSCS) for traffic management such as
Operation Administration and Maintenance (OAM), long packet segmentation
and carrying audio encoding format profiles for code points 0 to 15. Code points
between 16 and 22 are reserved.
• Header Error Control (HEC): Consists of 5 bits and is used for error detection in
the packet header.
The AAL2 packet is variable in size and can be much smaller than an ATM cell payload
of 48 octets. Due to its variable size, many AAL2 packets from different connections in
the application layers can be packed into the same ATM cell for transfer. As mentioned
previously, this reduces the network latency and improves bandwidth efficiency at high
rates.
The AAL2 Common Part Sublayer (CPS) provides the multiplexing capability for
AAL2 packets when multiple packets are packed into a single ATM cell payload. To do
this, the first byte in the ATM cell payload is used to carry the Start Field byte, shown
in Figure 12. The first six bits of the Start Field define the location of the first new

CHAPTER 1 INTRODUCTION
MANAGEMENT OF LOW AND VARIABLE BIT RATE ATM ADAPTATION LAYER TYPE 2 TRAFFIC
24
AAL2 packet. From there, the AAL2 packet lengths are used to maintain packet
alignment within the 47-octet payload. The remaining bits in the Start Field are used for
cell sequence checking and bad parity detection within the Start Field.
6 1 1 bits
Hdr Offset SEQ PAR Payload = AAL2 SAR-PDUs Start Field 47 octets
ATM Cell Payload
Figure 12: AAL2 CPS-PDU packet structure.
The multiplexing process for AAL2 is illustrated in Figure 13.
1 2 3
Common Part Sublayer (CPS)
1 2
Sources
1 a b 3Service Specific Convergence Sublayer (SSCS)
AAL2 SAR-PDU
AAL2 CPS-PDU
3-byte header
Start Field header
Source Packets
3
ATM Cells
ATM header
48 Octet
47 Octet
Figure 13: Voice transportation using AAL2.

CHAPTER 1 INTRODUCTION
MANAGEMENT OF LOW AND VARIABLE BIT RATE ATM ADAPTATION LAYER TYPE 2 TRAFFIC
25
Referring to Figure 13, source packets (labelled 1 to 3) are collected by the SSCS and
segmented into 44 octet segments. Note that source packets can be of variable sizes.
Segmentation of packets is illustrated by Packet 2 whereby it is segmented into 2
smaller segments, labelled ‘a’ (full 44 octets) and ‘b’ (remaining octets). Each segment
is AAL2 encapsulated (i.e. prepended a 3 byte header) to form AAL2 SAR-PDU
packets. These AAL2 SAR-PDUs are then segmented by the CPS to form AAL2 CPS
PDUs each with a Start Field header. Note that the CPS-PDU payload is fully utilised.
1.3.6.1 Comparisons
The performance of the AAL2 is now compared with the performance of AAL1 and
AAL5 in terms of packing efficiency and the transmission delay.
1.3.6.1.1 AAL1 and AAL2
As mentioned previously, even though AAL1 is suitable for real time traffic, it is not
able to efficiently carry low and variable bit rate real time traffic such as voice due to
bandwidth inefficiency. The example of Figure 13 used to show the transportation of
source packets via AAL2 will be used to illustrate the transportation of the same packets
using AAL1. This is shown in Figure 14.

CHAPTER 1 INTRODUCTION
MANAGEMENT OF LOW AND VARIABLE BIT RATE ATM ADAPTATION LAYER TYPE 2 TRAFFIC
26
1 2
1 2 Source Packets
1 octet header
AAL1 Layer AAL1 packets
3 Padding
VCC1 VCC2 VCC2 VCC3
Sources (Applications)
3
ATM Layer ATM packets
5 octet header
Figure 14: Voice transportation using AAL1.
Referring to Figure 14, each packet (whole or segmented) is encapsulated to form
AAL1 packets. Note that partial fill procedure described in [13] is used. Due to the
fixed length AAL1 payload, padding is required to fill the remaining spaces, thus
resulting in poor bandwidth utilisation. The problem of low bandwidth utilisation is
solved for the case of the AAL2, in which packets from different connections are
multiplexed onto the same ATM payload, thereby utilizing the whole payload space. A
case scenario shown in Figure 15 is used to compare the performance of AAL1 and
AAL2.

CHAPTER 1 INTRODUCTION
MANAGEMENT OF LOW AND VARIABLE BIT RATE ATM ADAPTATION LAYER TYPE 2 TRAFFIC
27
8 kb/s Codec
Figure 15: Case scenario for comparisons between AAL1 and AAL2.
Referring to Figure 15, a number of 8kbits/s codecs are used. The size of the packets is
dependent on the allowed packetisation delay. For AAL1, source packets are
encapsulated into a fixed size payload of 47 octets. The remaining unused payload not
filled by the SAR-SDU is padded and an AAL1 header is prepended. Each AAL1
packet is then further encapsulated into an ATM cell. Also packets from each source
require a different Virtual Channel Connection (VCC).
For the AAL2, source packets are encapsulated and prepended 3 octets header to form
an AAL2 packet. These are then further segmented into fixed size AAL2 CPS PDU
packets before being ATM encapsulated. AAL2 packets from different sources are
multiplexed onto an AAL2 CPS-PDU packet. The remaining AAL2 packet that cannot
AAL2 Packet
1 n 1 n
Source Packet
AAL1 Packet
ATM Packet
1 octet header
5 octet header
Padding
VCC1 VCCn VCC1 VCC1
3 octet header
Source Packet
AAL2 CPS PDU
Packetisation Delay
AAL1 AAL2
ATM Packet
1 octet header

CHAPTER 1 INTRODUCTION
MANAGEMENT OF LOW AND VARIABLE BIT RATE ATM ADAPTATION LAYER TYPE 2 TRAFFIC
28
be filled into the first CPS-PDU payload is filled into the second CPS-PDU payload,
thus resulting in little to no bandwidth wastage (see Section 1.3.6). Note that packets
from different sources share a common VCC.
The bandwidth efficiency for the AAL1 can be calculated by dividing the number of
useful octets over the total size (i.e. the total number of ATM cells used) as given by
(1.7). The size of an ATM cell is 53 octets (i.e. 5 octet header and 48 octet payload).
The size of an AAL1 PDU is 48 octets, which includes the one octet header.
No. of useful octetsEfficiency total No. of ATM packets × 53
= (1.7)
The maximum efficiency is obtained when number of useful octets equal 47 resulting in
an efficiency of 88.7%.
The bandwidth efficiency for the AAL2 requires obtaining the total number of AAL2
packets that result from the source packet, and then dividing the useful octets over the
total size (i.e. the total number of ATM cells used). AAL2 packets are variable in length
with a maximum of 47 octets (i.e. 3-octet header and 44-octet payload). The AAL2
CPS-PDU is 48 octets in length including the one octet header. Using (1.8), the total
number of AAL2 packets that is required by the source packet can be determined. The
bandwidth efficiency is calculated using the resultant value through the application of
(1.7).
( )Size of source packet in bitsNo. of AAL2 packets
44 8 bits⎡ ⎤
= ⎢ ⎥×⎢ ⎥
(1.8)
Where , 1x R n n x x n x∀ ∈ ∈ = ⇔ ≤ < +⎡ ⎤⎢ ⎥¢

CHAPTER 1 INTRODUCTION
MANAGEMENT OF LOW AND VARIABLE BIT RATE ATM ADAPTATION LAYER TYPE 2 TRAFFIC
29
The performance comparison between AAL1 and AAL2 is shown in Figure 16. Values
in this figure is obtained using (1.7) and (1.8). The horizontal scale is obtained with
reference to an 8kbit/sec sampling rate.
0 10 20 30 40 500
20
40
60
80
1008kb/sec voice codec
Typical codec generation times
AAL Type 1 AAL Type 2
Band
wid
th E
ffic
ienc
y (%
)
Packetisation Delay (ms)
Figure 16: Bandwidth efficiency vs codec delay.
Referring to Figure 16, it can be observed that AAL2 performs better than AAL1 over a
wide packetisation range. The performance of AAL1 is comparable to AAL2 only when
the packet length reaches a certain size. The bandwidth efficiency for the AAL1 is
directly proportional to the size of the packet whereas for the AAL2, it reaches seven-
eighths of its maximum bandwidth efficiency (i.e. 70%) for a packetisation delay of
10ms.

CHAPTER 1 INTRODUCTION
MANAGEMENT OF LOW AND VARIABLE BIT RATE ATM ADAPTATION LAYER TYPE 2 TRAFFIC
30
1.3.6.1.2 AAL5 and AAL2
Although this thesis is primarily concerned with the transport of real time data, it is
interesting to examine the use of AAL2 for the transport of non-real time data. As was
mentioned earlier, AAL5 is most suitable for carrying time insensitive traffic. The
transportation of data traffic using AAL5 is shown in Figure 17.
1 Source Packets
AAL5 packet length a multiple of 48 octets
Padding AAL5 trailer
AAL5 Layer AAL5 Packets
ATM Layer ATM Packets
Source
1
Figure 17: Data transportation using AAL5.
Referring to Figure 17, the data packet is first padded to ensure that its overall length is
a multiple of 48 octets, given that a trailer of 8 octets is appended. In this example, the
disadvantages of using the AAL5 are:
• Padding the length of AAL5 packets so that they map directly into 48 octet
ATM cell payload results in bandwidth wastage, especially if packets are short.
• For short packets, the 8-octet trailer takes up a relatively large percentage of the
overall payload capacity.
• Each separate data channel requires its own Virtual Channel Connection (VCC).

CHAPTER 1 INTRODUCTION
MANAGEMENT OF LOW AND VARIABLE BIT RATE ATM ADAPTATION LAYER TYPE 2 TRAFFIC
31
As the AAL5 packet size increase, the trailer and padding required become a lesser
percentage of the overall payload being transferred, thus resulting in better bandwidth
efficiency.
The use of AAL2 for transporting data packets has the advantage that for short packet
lengths, it introduces less overhead than AAL5, thus better bandwidth efficiency. For
larger packet lengths, the bandwidth efficiencies of AAL5 and AAL2 are comparable.
A case scenario shown in Figure 18 is used to compare the performance of AAL5 and
AAL2 for the transport of non-real time data. The performance criterion considered is
bandwidth efficiency.
1 1 Packet Source
AAL5 AAL2
Figure 18: Case scenario for comparisons between AAL5 and AAL2.
Referring to Figure 18, for the AAL5, each source packet is padded and appended with
an AAL5 trailer to ensure that the AAL5 packet length is a multiple of 48 octets. The
AAL5 packet is then segmented into 48 octets before being ATM encapsulated. Note
Source Packet
AAL5 Packet
ATM Packet
5 octet header Padding
VCC1
VCC1
AAL2 Packet
3 octet header
Source Packet
AAL2 CPS PDU
AAL5 trailer
1 octet header
ATM Packet
Contains another partial AAL2 packet

CHAPTER 1 INTRODUCTION
MANAGEMENT OF LOW AND VARIABLE BIT RATE ATM ADAPTATION LAYER TYPE 2 TRAFFIC
32
that a different VCC is used for packets from each different source.
The performance comparison between the AAL5 and AAL2 for the case scenario of
Figure 18 is shown in Figure 19. Figure 19 shows the corresponding bandwidth
efficiency for a range of data packet lengths.
0 200 400 600 800 10000
10
20
30
40
50
60
70
80
90
100
AAL2 AAL5
Band
wid
th E
ffici
ency
(%)
Data Packet Length (octets)
Figure 19: Bandwidth efficiency vs packet length.
The values of Figure 19 can be calculated or obtained from [18]. Before calculating the
bandwidth efficiency of AAL5, the total size of the AAL5 packet (including 8 octet
trailer and padding) and the number of ATM cells required to transmit the whole data
packet have to be determined. Once these values are obtained, the bandwidth efficiency
can be calculated by dividing the number of useful octets over the total size (i.e. the
total number of ATM cells required).
Referring to Figure 19, the bandwidth efficiency of AAL2 is much better than AAL5 for
packet lengths smaller than 100 octets. For larger packet lengths, the bandwidth

CHAPTER 1 INTRODUCTION
MANAGEMENT OF LOW AND VARIABLE BIT RATE ATM ADAPTATION LAYER TYPE 2 TRAFFIC
33
efficiency of both AAL2 and AAL5 are comparable. Note that the saw-tooth effect of
AAL5 is due to the padding required to ensure the whole AAL5 packet is a multiple of
48 octets.
1.3.6.2 AAL2 Work
Work published incorporating the use of this relatively new AAL2 are as follows: in
[18] [19], the authors compare the performance of AAL2 against existing AALs. From
these papers, AAL2 outperforms AAL1 when carrying low bit rate traffic by being able
to multiplex across many virtual channels when packing an AAL2 payload seen in
Figure 16. However performance of AAL2 for large and bursty data is only comparable
to AAL5 for large packets seen in Figure 19. This is largely due to the many headers
required for these AAL2 packets resulting in low bandwidth efficiency.
The use of AAL2 has found its place in many applications. These applications include
Code Division Multiple Access (CDMA) in [20] [21] [22], 3G in
[23] [24] [25] [26] [27] [28], Universal Mobile Telecommunications System Terrestrial
Radio Access Network (UTRAN) in [29] [30] [31] [32] and Internet protocol (IP) [33].
Much of the work on AAL2 is based on traffic management issues. These include work
on congestion control involving AAL2 [34] [35] [36] [37], Quality of Service (QoS)
requirements [38], packing efficiency [39] [40] [41], trunking efficiency [42], bandwidth
management issues [43], performance issues of AAL2 [44] [45], AAL2 implementation
[46] and various other issues [47]. This thesis focuses on the traffic management issues
incorporating AAL2 for low and variable bit rate traffic.
1.4 Objectives
The main objective of this thesis is to examine the performance of AAL2 multiplexers
and in particular the traffic management issues associated with the multiplexer. The
specific objectives of this thesis are:

CHAPTER 1 INTRODUCTION
MANAGEMENT OF LOW AND VARIABLE BIT RATE ATM ADAPTATION LAYER TYPE 2 TRAFFIC
34
• To develop a QoS framework (i.e. a set of QoS parameters) for describing the
performance of AAL2 voice multiplexers.
• To examine the performance limitation of the single-queued AAL2 multiplexer for
the transport of Variable Bit Rate (VBR) voice.
• To propose and examine an extension to the single-queued AAL2 multiplexer for
achieving a higher trunking efficiency.
• To examine performance sensitivity of the AAL2 multiplexer with respect to input
voice traffic.
• To examine source policing of VBR voice sources to improve the delay
performance of the AAL2 multiplexer in the presence of misbehaving voice sources.
• To examine statistical multiplexing and the extent to which it is possible for real
time VBR voice.
• To propose and examine an alternative multiplexing method to statistical
multiplexing for utilising available unused bandwidth.
1.5 Thesis Contents
The content of this thesis provides a step by step approach to investigating the traffic
management issues associated with AAL2 multiplexer design and is organised as
follows:
Chapter 2 outlines an ATM network used to study the transport of real time
communications using AAL2. This includes a study on the requirements for
establishing a real time voice connection. Once a connection has been established, the
resulting voice quality is then examined and described using a set of Quality of Service
(QoS) parameters. Also in this chapter, the use of DBR and SBR ATM Transfer
Capabilities (ATC) for the transportation of voice traffic in AAL2 connections are

CHAPTER 1 INTRODUCTION
MANAGEMENT OF LOW AND VARIABLE BIT RATE ATM ADAPTATION LAYER TYPE 2 TRAFFIC
35
described and compared. Based on the comparisons, a suitable ATC is then chosen and
adopted in the chapters that follow.
Chapter 3 describes the general AAL2 multiplexer system that consists of input sources
and the AAL2 multiplexer itself. The input sources are modelled as voice codecs with
silence suppression and are characterised in terms of bandwidth and a subjective quality
score. The AAL2 multiplexer performance is described via the statistical multiplexing
gain that can be achieved while maintaining QoS requirements. The study of the AAL2
multiplexer and its performance is investigated using the network simulation tool called
OPNET.
Chapter 4 extends the single-queued AAL2 model to two prioritised queues where
priority levels are assigned based on their input traffics’ multiplexing delay
requirements. A high priority is assigned to traffic that have tighter multiplexing delay
requirements and is determined via comparing their associated delay budgets. The delay
performance of the prioritised AAL2 multiplexer is compared to the single-queued
AAL2 multiplexer in terms of the statistical multiplexing gain that they achieve.
Chapter 5 examines the effects of source sensitivity on the performance of the AAL2
multiplexer. The desired behaviour of a source can be obtained by enforcing its traffic
through some form of usage parameter control. A common UPC and the selection of its
parameters are described in this chapter.
Chapter 6 examines again the delay performance of the AAL2 multiplexer by
considering the worst case traffic behaviour that can pass the UPC for statistically
multiplexed sources. This is achieved by obtaining the number of sources that can be
accommodated using the derived worst case delay within the multiplexer. Based on
these results alternative multiplexing schemes are proposed to utilise unused bandwidth
caused by the VBR nature of the voice traffic.
Finally, conclusions are drawn in Chapter 7.

CHAPTER 2 ESTABLISHING REAL TIME CONNECTIONS IN ATM NETWORKS USING AAL2
MANAGEMENT OF LOW AND VARIABLE BIT RATE ATM ADAPTATION LAYER TYPE 2 TRAFFIC
36
Chapter 2
Establishing Real Time Connections in ATM Networks Using AAL2
In Chapter 1, AAL2 was defined and described as the most suitable adaptation layer for
the transportation of low and variable bit rate traffic such as voice. With its multiplexing
capability, it is able to achieve high packing efficiency at low transmission delays.
Hence, AAL2 has found its place in many applications. An example where AAL2 has
been used is in third generation (3G) mobile technology.
In this chapter, a general network incorporating the use of AAL2 is described. Using
this network, we proceed to examine the requirements for establishing a real time voice
connection. Once this has been established, it is important then to quantify the resulting
voice quality. This is described using a set of Quality of Service (QoS) parameters.
As previously mentioned in Chapter 1, real time traffic can be transported using either a
DBR or SBR transfer capability. In this chapter, an analysis is presented to illustrate
that the use of either ATM transfer capability will give equal performance under certain
conditions.
CHAPTER 2 ESTABLISHING REAL TIME CONNECTIONS IN ATM NETWORKS USING AAL2
MANAGEMENT OF LOW AND VARIABLE BIT RATE ATM ADAPTATION LAYER TYPE 2 TRAFFIC
37
2.1 AAL2 Network Structure
ATM Cloud
Workstation
Fax
Telephone
ATM Switch
ATM Switch
ATM Switch
ATM Switch
AAL2
DeM
ultiplexer
AAL2
Mul
tiple
xer
Workstation
Fax
Telephone
Virtual ChannelConnection
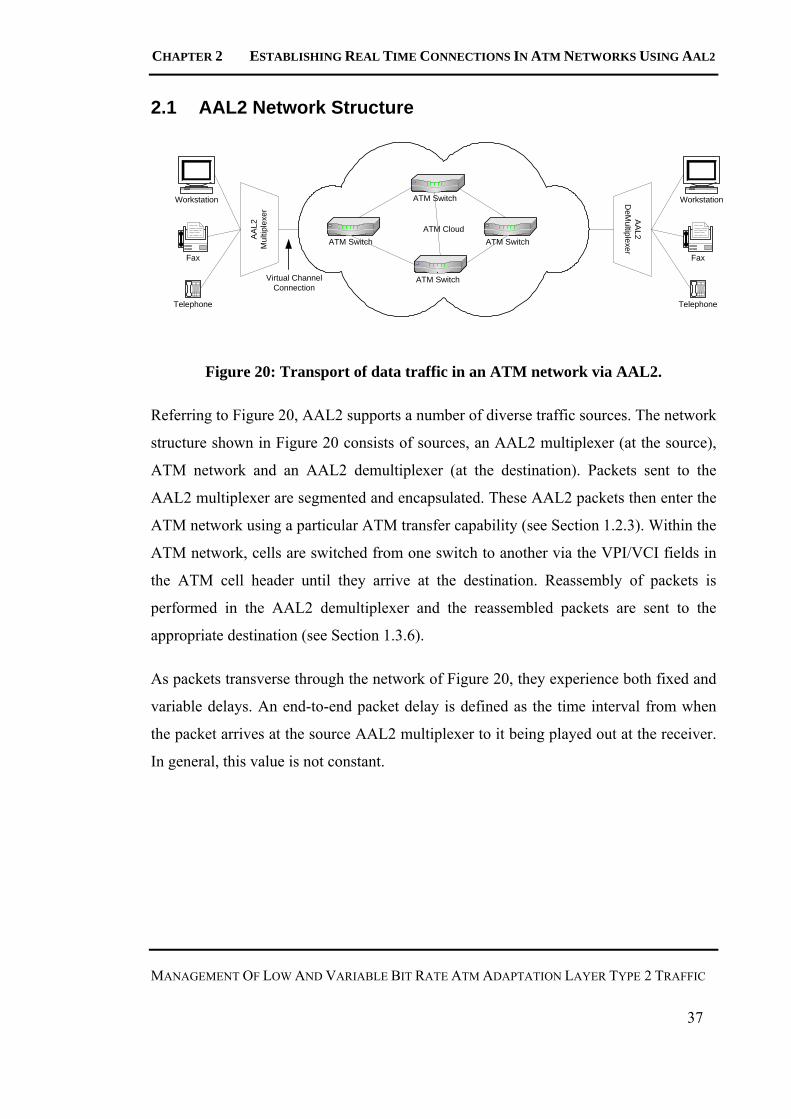
Figure 20: Transport of data traffic in an ATM network via AAL2.
Referring to Figure 20, AAL2 supports a number of diverse traffic sources. The network
structure shown in Figure 20 consists of sources, an AAL2 multiplexer (at the source),
ATM network and an AAL2 demultiplexer (at the destination). Packets sent to the
AAL2 multiplexer are segmented and encapsulated. These AAL2 packets then enter the
ATM network using a particular ATM transfer capability (see Section 1.2.3). Within the
ATM network, cells are switched from one switch to another via the VPI/VCI fields in
the ATM cell header until they arrive at the destination. Reassembly of packets is
performed in the AAL2 demultiplexer and the reassembled packets are sent to the
appropriate destination (see Section 1.3.6).
As packets transverse through the network of Figure 20, they experience both fixed and
variable delays. An end-to-end packet delay is defined as the time interval from when
the packet arrives at the source AAL2 multiplexer to it being played out at the receiver.
In general, this value is not constant.

CHAPTER 2 ESTABLISHING REAL TIME CONNECTIONS IN ATM NETWORKS USING AAL2
MANAGEMENT OF LOW AND VARIABLE BIT RATE ATM ADAPTATION LAYER TYPE 2 TRAFFIC
38
2.2 Real Time Communications
For real time communications, a voice signal at the transmitter must be reproduced at
the receiver with the same timing. This means that voice packets should be played out
by the receiver using the same timing structure as created by the source transmitter. At
the destination, packets that have arrived are decoded into voice samples which are then
played out.
The quality of real time communications is affected by packet loss when packets are
discarded due to buffer overflows or when at the sink, a packet is unavailable at its play-
out interval. The case where a packet is unavailable to be played out at the sink can arise
as follows. Given that the end-to-end packet delay as described previously is variable,
when the receiver plays out the voice samples decoded from the first packet
immediately upon its arrival, it may not be possible for the receiver to play the next set
of voice samples (decoded from the next packet) after the designated time interval due
to the packet arriving too late. Noise samples are played out in place of these voice
samples and the late packet is discarded resulting in poor quality. This effect is known
as sink starvation. A method of overcoming this problem is to delay playing out the first
packet such that after the designated time interval, the receiver is able to play out the
subsequent set of voice samples from the next packet. Introducing such a fixed delay is
known as equalisation. Generally, the required equalisation delay is dependent on the
variable delays experienced by the packets.
The quality of real time communications is also affected by packet loss when the buffer
overflows (spacer/policer buffer at the source and playout buffers at the receivers). This
happens when packet arrivals into the buffer are greater than the packet departures. A
method of eliminating this effect is to dimension the buffers such that overflows will
not occur.

CHAPTER 2 ESTABLISHING REAL TIME CONNECTIONS IN ATM NETWORKS USING AAL2
MANAGEMENT OF LOW AND VARIABLE BIT RATE ATM ADAPTATION LAYER TYPE 2 TRAFFIC
39
In the following sub-section, the requirements for establishing a real time connection
are described. The equalisation process and the dimensioning of buffers are also
described.
2.2.1 Delay Constancy
As outlined in the previous section, to provide quality of service to real time connection,
it is necessary to achieve constant end-to-end delay across the network. Constancy of
end-to-end delay can be achieved by maintaining continuity of data flow for the
duration of the call. Such continuity breaks down either when buffers overflow or
underflow. To minimise these problems, dimensioning of these buffers can avoid the
possibility of buffer overflow while equalisation can prevent buffer underflow (or sink
starvation). Note that it is important not to use a large equalisation delay as it will cause
large delay with only slight improvement in the possibility of buffer underflow.
In Figure 20, there is a delay associated with each element in the model, which is
illustrated in Figure 21. The end-to-end packet delay is the sum of these delay
components experienced by the packet as it travels from the transmitter to the receiver.
In the following sub-sections, the end-to-end packet delay is analysed. From this, the
equalisation delay as well as the required buffer sizes (such that overflows will not
occur) can be obtained [38].

CHAPTER 2 ESTABLISHING REAL TIME CONNECTIONS IN ATM NETWORKS USING AAL2
MANAGEMENT OF LOW AND VARIABLE BIT RATE ATM ADAPTATION LAYER TYPE 2 TRAFFIC
40
Figure 21: Delay components of the AAL2 network.
2.2.1.1 Source
Referring to Figure 21, at the source, each voice transmitter (L=1, 2,…, n) generates a
packet at fixed time intervals of length TL and at a rate given by
1L
L
RT
= (2.1)
Note for voice sources (i.e. On/Off sources), (2.1) is only applicable during the talk
intervals.
Packets generated by sources are delivered through the Service Access Points (SAP) to
the AAL2 SSCS without any delay variation. Let tL,k represent the time at which the Lth
transmitter presents the last bit of the kth packet to the SSCS layer and is expressed as
, ,0L k L Lt t kT= + (2.2)
where tL,0 denotes the time at which the Lth transmitter presents the last bit of the first
AAL2 Multiplexer (SSCS and CPS)
1 2 n
Voice Transmitters
t1,k t2,k tn,k
S(t)
1 2 n
Voice Receivers Delay
Constancy required
AAL2 De-Multiplexer
Play-out buffer
ξ1,k ξ2,k ξn,k
B1,ξ B2,ξ Bn,ξ
Spacer/
ATM Network Dp + τi’
Policer
γi
γ1,k γ2,k γn,kBζ
R(t)

CHAPTER 2 ESTABLISHING REAL TIME CONNECTIONS IN ATM NETWORKS USING AAL2
MANAGEMENT OF LOW AND VARIABLE BIT RATE ATM ADAPTATION LAYER TYPE 2 TRAFFIC
41
When a packet arrives at the SSCS from connection L, it is passed onto the CPS layer
packet to the SSCS.
without any delay variation and is encapsulated into an AAL2 packet. Multiplexing of
individual AAL2 connections is performed in the CPS where AAL2 packets are packed
into CPS PDU cells and queued into the spacer/policer buffer before being sent to the
ATM network (see Section 1.3.6). Due to the multiplexing effects experienced in the
CPS, the characteristics of this aggregate cell stream will be of a Variable Bit Rate
(VBR) nature. Thus it can be considered that the rate of cells being generated by the
CPS corresponds to some time series denoted by S(t). These cells are placed into a
buffer of size Bζ for spacing and/or policing. Let ti represent the time at which the CPS
places the last bit of the ith cell in the spacer buffer or policer. Therefore S(t) is shown as
( ) ( )0
ii
S t t tδ∞
=
= −∑ (2.3)
where δ(…) denotes a Dirac delta function. The time series S(t) can be characterised by
a peak rate (PCRAAL2 Aggregate), a mean rate and some measure of its burstiness. It is
assumed that S(t) satisfies some burstiness constraint
( ) ( )1b
sa
S d b a Rτ τ σ< + + −∫ (2.4)
for all b ≥ a, where the constant Rs represent an upper bound for the long term average
rate of the traffic generated. The term Rs is known as the Sustainable Cell Rate (SCR)
that is associated with the aggregate AAL2 traffic stream. The term σ represents the
limit on the amount of traffic that can be generated in excess of 1 + (b - a)Rs during any
interval [a, b]. The term σ is generally in the form
2 IBT AAL Aggregate sRσ τ= (2.5)
where τIBT AAL2 Aggregate is the Intrinsic Burst Tolerance of the aggregate AAL2 traffic

CHAPTER 2 ESTABLISHING REAL TIME CONNECTIONS IN ATM NETWORKS USING AAL2
MANAGEMENT OF LOW AND VARIABLE BIT RATE ATM ADAPTATION LAYER TYPE 2 TRAFFIC
42
The aggregate traffic stream departing the CPS can be transported using either the DBR
For the DBR ATC:
With the use of the DBR transfer capability, the traffic generated at the CPS is required
p
with respect to the Sustainable Cell Rate, Rs. 1 This also represents how early a cell can
arrive before it is theoretically due with respect to the SCR.
or the SBR transfer capabilities.
to be spaced to the Peak Cell Rate (PCR) of the DBR connection which is related to the
bandwidth allocated and is guaranteed for the aggregate traffic stream across the
network. Note the peak cell rate of the DBR connection denoted by Rp must be chosen
greater than or equal to the long term average rate Rs (i.e. Rp ≥ Rs). For the first cell that
arrives into the spacer, it is immediately served. After this, traffic spacing is performed
for subsequent cells and the time between each emission from the spacer buffer is at
least the specified minimum Tp where the term Tp is obtained from the inverse of the
PCR of the DBR connection (i.e. Tp = 1/Rp). Let ζi represent the time at which the
server removes the first bit of the ith cell from the spacer buffer. This is
( )0 0
1max ,i i i
t
t T
ζ
ζ ζ −
=
= +
(2.6)
The transmission delay incurred by the cell is equal to the cell size (i.e. 53 octets)
Let R(t) denote the output time series at which cells are presented to the network by the
divided by the link rate of the ATM connection. This delay is insignificant when the
link rate is large.
1 When individual VBR sources are multiplexed to form an aggregate VBR source, the parameters Rs and
τIBT AAL2 Aggregate of the aggregate traffic can be difficult to determine unless the actual traffic characteristics
are measured. Here we have assumed that it is possible to determine these parameters.

CHAPTER 2 ESTABLISHING REAL TIME CONNECTIONS IN ATM NETWORKS USING AAL2
MANAGEMENT OF LOW AND VARIABLE BIT RATE ATM ADAPTATION LAYER TYPE 2 TRAFFIC
43
spacer buffer. R(t) can be written as
( ) ( )0
ii
R t tδ ζ∞
=
= −∑ (2.7)
Let si denote the time spent in the spacer buffer by the ith cell. Therefore ζi can be
i
obtained as the time the ith cell waits to be served upon arrival into the buffer and is
shown as
i it sζ = + (2.8)
Equation (2.8) can be extended to AAL2 packets within those cells by
( ) ( ),, ,i L k iL k t s L kζ = + (2.9)
where ζi(L,k) represents the time at which the first bit of the cell is removed from the
The maximum time spent in the spacer buffer is bounded by
spacer buffer that contains the kth packet of connection L and si(L,k) represents the time
spent in the spacer buffer of the cell which contains the kth packet of the Lth connection.
In the case where a AAL2 packet has been split over two cells, si(L,k) refers to the time
spent in the spacer buffer by the trailing cell. A description of the DBR cell dispatch
process is given in Appendix A.
0 i spacers D≤ ≤ (2.10)
where
spacerp
BD Rζ= (2.11)

CHAPTER 2 ESTABLISHING REAL TIME CONNECTIONS IN ATM NETWORKS USING AAL2
MANAGEMENT OF LOW AND VARIABLE BIT RATE ATM ADAPTATION LAYER TYPE 2 TRAFFIC
44
For the SBR ATC:
When carrying the aggregate traffic stream in a SBR connection, traffic generated by
the CPS must be policed according to the appropriate peak cell rate, sustainable cell rate
and the intrinsic burst tolerance of the SBR traffic contract (see Section 1.2.3.2). Here, it
is assumed that the aggregate AAL2 traffic stream parameters (i.e PCRAAL2 Aggregate, Rs
and τIBT AAL2 Aggregate) match the SBR traffic contract parameters (i.e PCRSBR, SCRSBR, τIBT
SBR) and is shown by
2
2
SBR AAL Aggregate
SBR s
IBT SBR IBT AAL Aggregate
PCR PCR
SCR Rτ τ
=
=
=
(2.12)
Under these conditions, conforming cells are presented immediately to the ATM
network without the need for spacing (i.e. si = 0). Non-conforming cells are
unconditionally discarded. In the case where traffic generated by the CPS is presented to
the network without policing, the network can only guarantee serving the aggregate
connection at a rate equal to the agreed sustainable cell rate. Therefore during network
congestion, the SBR traffic may still be shaped within the network in any of the
switches along its path (else non-conforming cells may be dropped). A description of
the SBR cell dispatch process is given in Appendix A.
2.2.1.2 Network
Once a cell enters the ATM network, it hops from one switch to the next along its path
within the network before reaching the destination. The cell experiences a propagation
delay, Dp (see Section 1.2.3.1) and a queuing delay. Let τi’ denote the total queuing
delay experienced by the ith cell along its path.

CHAPTER 2 ESTABLISHING REAL TIME CONNECTIONS IN ATM NETWORKS USING AAL2
MANAGEMENT OF LOW AND VARIABLE BIT RATE ATM ADAPTATION LAYER TYPE 2 TRAFFIC
45
V
For the DBR ATC:
In the case when using the DBR ATC, the queuing delay experienced by the cell in the
network is statistically bounded by the Cell Delay Variation Tolerance (τCDV) (see
Section 1.2.3.1) and is given by
'0 i CDτ τ≤ < (2.13)
The value of τCDV can be obtained by some (1 - α) quantile of the queuing delay. Note
that this value refers to the difference between the best and worst case expectation of the
cell transfer delay. The best case is equal to Dp and the worst case is equal to Dp + τCDV,
a value likely to be exceeded with a probability less than α.
Let γi denote the time at which the last bit of the ith cell is presented to the CPS
demultiplexer. Therefore, the ith cell reaches the destination at time
'i i pD iγ ζ τ= + + (2.14)
At the destination, the CPS demultiplexes the individual AAL2 packets with a fixed
interval from the time of arrival of the cell and places them into play-out buffers. Let γL,k
denote the time at which the last bit of the kth packet is inserted into play-out buffer L,
(2.14) is written as
( ) ( )', , ,L k i p iL k D L kγ ζ τ= + + (2.15)
Note in (2.15), the term ζi(L,k) is given in (2.9) and τi’(L,k) represents the total network
queuing delay of the cell that contains the kth packet of connection L. In the case where
a packet is split over two cells, the network delay τi’(L,k) refers to the total queuing
delay of the trailing cell.

CHAPTER 2 ESTABLISHING REAL TIME CONNECTIONS IN ATM NETWORKS USING AAL2
MANAGEMENT OF LOW AND VARIABLE BIT RATE ATM ADAPTATION LAYER TYPE 2 TRAFFIC
46
R
For the SBR ATC:
Equations (2.14) and (2.15) equally apply when using the SBR ATC. However, in the
case when using the SBR ATC, the queuing delay τi’ is statistically bounded by not
only the Cell Delay Variation Tolerance (τCDV) but also a smoothing delay (i.e Intrinsic
Burst Tolerance (τIBT SBR)) (see Section 1.2.3.2) and is given by
' 0 i CDV IBT SBτ τ τ≤ < + (2.16)
2.2.1.3 Destination
As cells arrive at the destination, the timing structure for the sequence γi may not
necessarily be the same as when they left the source (i.e. sequence ti). This is due to the
variable delays experienced by these cells either at the spacer buffer or within the
network, or both. After demultiplexing by the destination CPS, source packets are
placed into play-out buffers of size BL,ξ for each connection L. The functionality of the
play-out buffers is to allow incoming packets to be queued for play-out when the
receiver is busy playing out the previous voice packet. This prevents packet loss. Also,
the timing structure of the sequence γL,k is not necessarily the same as the sequence tL,k.
For each connection L, the sink consumes one packet in every TL time units which is the
same rate at which the source generates packets. A common strategy for recovering the
initial timing structure is to delay the consumption of the first packet by a fixed amount
of time denoted by DL,ξ and set the size of the play-out buffer to be BL, ξ. For each
connection L, the continuity of data flow is maintained by consuming packets from the
play-out buffers using the same timing structure generated by the sequence tL,k. Let ξL,k
represent the time at which the first bit of the kth packet of connection L is read from the
play-out buffer. Therefore, ξL,k is expressed as
( ) ( )', , , 0 ,0 ,L k L k i p i Lt s L D L D ξξ τ= + + + + (2.17)
where si(L,0) and τi’(L,0) correspond respectively to the time spent in the spacer buffer

CHAPTER 2 ESTABLISHING REAL TIME CONNECTIONS IN ATM NETWORKS USING AAL2
MANAGEMENT OF LOW AND VARIABLE BIT RATE ATM ADAPTATION LAYER TYPE 2 TRAFFIC
47
and the network delay of the first packet of connection L. For the SBR ATC, cells are
passed to the network without entering the spacer/policer buffer (i.e. si(L,0) = 0).
The fundamental requirement in any real time connection is that end-to-end packet
delay for all packets must be equal to the end-to-end delay of the first packet in
connection L i.e. ξL,k - tL,k = ξL,0 - tL,0. Equally said, the end-to-end delay (i.e. the
difference of ξL,k - tL,k) must remain constant. Note that for acceptable voice quality, the
end-to-end delay budget for a voice application is limited to approximately 100ms [48].
In the following sections, the requirements for setting up a real time connection and to
maintain the data flow continuity are described.
2.2.1.4 Continuity of Data Flow
As previously described, data flow continuity requires that every packet generated by
the source at fixed intervals is consumed at the sink after a fixed delay but with the
same fixed intervals as generated at the source, without subject to packet loss or play-
out interruption for the duration of the connection. In the case of packet loss, this occurs
when a packet upon arrival finds no storing capacity in the buffer and is consequently
discarded. For the case of play-out interruption, this occurs when the sink is unable to
consume a packet due to unavailability of the packet at the play-out buffer in time.
Therefore it is necessary to determine the minimum buffer sizes (i.e. for the
spacer/policer buffer and the play-out buffer) that will prevent buffer overflow and sink
starvation for maintaining the data flow continuity.
2.2.1.4.1 Spacer buffer
In the case where the aggregate traffic stream is carried by the SBR connection and
under the assumptions in (2.12), cells are immediately presented to the network without
entering a buffer. However for DBR connections, a spacer buffer is required when its
peak cell rate is less than the peak cell rate of the aggregate AAL2 stream departing
from the CPS.

CHAPTER 2 ESTABLISHING REAL TIME CONNECTIONS IN ATM NETWORKS USING AAL2
MANAGEMENT OF LOW AND VARIABLE BIT RATE ATM ADAPTATION LAYER TYPE 2 TRAFFIC
48
For the DBR connection, the departure of cells from the spacer buffer can also be
visualised as contiguous time intervals of variable length on the time axis. The service
rate Rp must be at least equal to or greater than the sustainable cell rate of the AAL2
aggregate traffic Rs (i.e. Rp ≥ Rs). For an arbitrary time t, there exists an integer v such
that
1v vtζ ζ +≤ < (2.18)
Note that ζv has been defined in (2.6). Let Nζ(t) denotes the integral fill level of the
spacer buffer. This value increases when cells arrived into the buffer and decreases
when they depart. Hence the fill level of the spacer buffer at time t is the difference
between the number of cells generated and the number of cells departed up to time t and
can be expressed as
( )
( )
0
( )
v
t
t
t
N t S d v
S d
ζ τ τ
τ τ
+
+
= −
=
∫
∫
(2.19)
There exists a cell denoted by s whose arrival time begins a busy period that includes
the interval (tv, ζv]. The number of cells generated in this interval can be expressed as
( ) ( ) ( )v v v
s sv
t
tt
S d S d S dζ ζ
ζ
τ τ τ τ τ+
= −∫ ∫ ∫ τ
s
(2.20)
Using the bound in (2.4), the first term in (2.20) can be expressed as
( ) ( )1v
s
v sS d Rζ
ζ
τ τ σ ζ ζ< + + −∫ (2.21)
and the second term can be expressed as 1 + (v - s). Using these, (2.20) can be
simplified to

CHAPTER 2 ESTABLISHING REAL TIME CONNECTIONS IN ATM NETWORKS USING AAL2
MANAGEMENT OF LOW AND VARIABLE BIT RATE ATM ADAPTATION LAYER TYPE 2 TRAFFIC
49
)
( ) ( ) ( )
( ) (( ) ( )
( ) 2
1 1
1 1
1 1
v
v
v
v
v s st
v s p
IBT AAL Aggregate st
S d R v s
R v s
v s v s
S d R
ζ
ζ
τ τ σ ζ ζ
σ ζ ζ
σ
σ
τ τ τ
+
+
< + + − − + −⎡ ⎤ ⎡ ⎤⎣ ⎦ ⎣ ⎦
⎡ ⎤≤ + + − − + −⎡ ⎤⎣ ⎦⎣ ⎦= + + − − + −⎡ ⎤ ⎡ ⎤⎣ ⎦ ⎣ ⎦=
<
∫
∫
(2.22)
The maximum possible fill level during the service of the vth cell must occur at the
instant before the (v+1)st cell begins service. This is shown by
( ) ( )
( )
v+1
+v
v+1
+v+1
S
1 S
t
t
N t d
d
ζ
ζ
ζ
τ τ
τ τ
<
< +
∫
∫
(2.23)
The second term in (2.23) is given by (2.22), therefore (2.23) can be re-written as
( )( )
2
2
1 IBT AAL Aggregate s
IBT AAL Aggregate s
N t R
N t Rζ
ζ
τ
τ
< +
⎡ ⎤∴ = ⎢ ⎥
(2.24)
Note in (2.24), we have used the well known result that for every real number x and
integer n, n < x if and only if n < ⎡x⎤. Referring to (2.24), when the spacer buffer size is
chosen to be equal to or larger than ⎡τIBT AAL2 AggregateRs⎤, buffer overflow will not occur.
However if the buffer size is chosen smaller than ⎡τIBT AAL2 AggregateRs⎤, the buffer will
overflow whenever the fill level Nζ (t) reaches ⎡τIBT AAL2 AggregateRs⎤. This is summarised
as

CHAPTER 2 ESTABLISHING REAL TIME CONNECTIONS IN ATM NETWORKS USING AAL2
MANAGEMENT OF LOW AND VARIABLE BIT RATE ATM ADAPTATION LAYER TYPE 2 TRAFFIC
50
1
2
2
no spacer buffer overflow
spacer buffer overflow
IBT AAL Aggregate s
IBT AAL Aggregate s
B R
B R
ζ
ζ
τ
τ
⎡ ⎤≥ ⎢ ⎥⎡ ⎤< ⎢ ⎥
(2.25)
2.2.1.4.2 Play-out buffer overflow
Packet arrivals to the play-out buffer can also be visualised as contiguous time intervals
of variable length on the time axis. For an arbitrary time t, there exists an integer w such
that
, ,L w L wtγ γ +≤ < (2.26)
Note that γL,w has been defined in (2.15). The buffer fill level at time t is the difference
between the number of packets that have arrived at the play-out buffer (denoted by w)
and the number of packets consumed by the sink. Letting NL,ξ(t) denote the fill level of
the play-out buffer, this is expressed as
( ), ,( )L LN t w t Rξ ξ 0 L⎢ ⎥= − −⎣ ⎦ (2.27)
Where , 1x R n n x x n x∀ ∈ ∈ = ⇔ − < ≤⎢ ⎥⎣ ⎦¢
Referring to (2.27), the term ⎣(t - ξL,0)RL⎦ gives the number of packets consumed by the
sink since play-out of the first packet.
In the interval [γL,w, γL,w+1), NL,ξ(t) is a non-decreasing function of t. It obtains its peak
level when the wth packet arrives. Substituting γL,w for t in (2.27), the fill level NL,ξ(t) is
expressed as
( ), , ,( )L L w LN t w Rξ γ ξ 0 L⎢ ⎥≤ − −⎣ ⎦ (2.28)
Equation (2.28) can be expanded using (2.15), (2.9), and (2.2) into
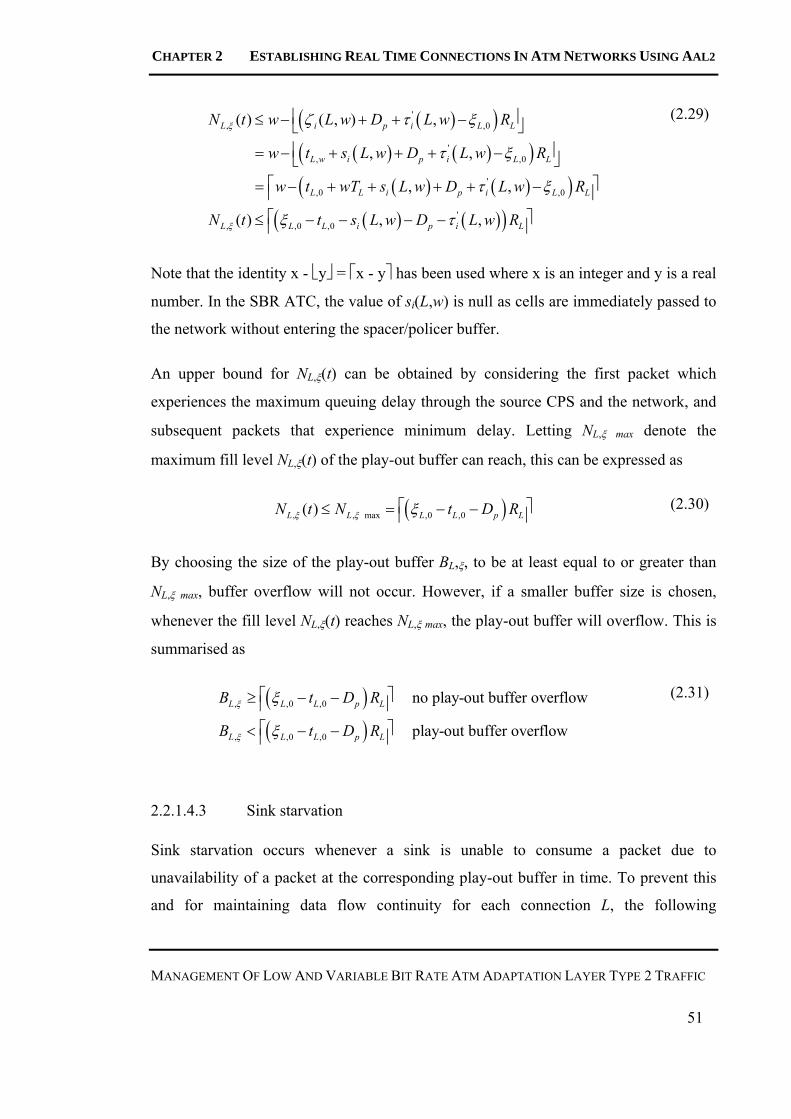
CHAPTER 2 ESTABLISHING REAL TIME CONNECTIONS IN ATM NETWORKS USING AAL2
MANAGEMENT OF LOW AND VARIABLE BIT RATE ATM ADAPTATION LAYER TYPE 2 TRAFFIC
51
0
0
L
( )( )( ) ( )( )
( ) ( )( )( ) ( )( )
', ,
', ,
',0 ,0
', ,0 ,0
( ) ( , ) ,
, ,
, ,
( ) , ,
L i p i L L
L w i p i L L
L L i p i L
L L L i p i L
N t w L w D L w R
w t s L w D L w R
w t wT s L w D L w R
N t t s L w D L w R
ξ
ξ
ζ τ ξ
τ ξ
τ ξ
ξ τ
⎢ ⎥≤ − + + −⎣ ⎦⎢ ⎥= − + + + −⎣ ⎦
⎡ ⎤= − + + + + −⎢ ⎥⎡ ⎤≤ − − − −⎢ ⎥
(2.29)
Note that the identity x - ⎣y⎦ = ⎡x - y⎤ has been used where x is an integer and y is a real
number. In the SBR ATC, the value of si(L,w) is null as cells are immediately passed to
the network without entering the spacer/policer buffer.
An upper bound for NL,ξ(t) can be obtained by considering the first packet which
experiences the maximum queuing delay through the source CPS and the network, and
subsequent packets that experience minimum delay. Letting NL,ξ max denote the
maximum fill level NL,ξ(t) of the play-out buffer can reach, this can be expressed as
( ), , max ,0 ,0( )L L L L pN t N t D Rξ ξ ξ L⎡ ⎤≤ = − −⎢ ⎥ (2.30)
By choosing the size of the play-out buffer BL,ξ, to be at least equal to or greater than
NL,ξ max, buffer overflow will not occur. However, if a smaller buffer size is chosen,
whenever the fill level NL,ξ(t) reaches NL,ξ max, the play-out buffer will overflow. This is
summarised as
( )( )
, ,0 ,0
, ,0 ,0
no play-out buffer overflow
play-out buffer overflow
L L L p L
L L L p L
B t D R
B t D R
ξ
ξ
ξ
ξ
⎡ ⎤≥ − −⎢ ⎥⎡ ⎤< − −⎢ ⎥
(2.31)
2.2.1.4.3 Sink starvation
Sink starvation occurs whenever a sink is unable to consume a packet due to
unavailability of a packet at the corresponding play-out buffer in time. To prevent this
and for maintaining data flow continuity for each connection L, the following

CHAPTER 2 ESTABLISHING REAL TIME CONNECTIONS IN ATM NETWORKS USING AAL2
MANAGEMENT OF LOW AND VARIABLE BIT RATE ATM ADAPTATION LAYER TYPE 2 TRAFFIC
52
relationship is required.
, ,L w L wξ γ> (2.32)
From (2.17), the time at which the first bit of the wth packet of connection L is read from
the play-out buffer is
( ) ( )', , , 0 ,0 ,L w L w i p i Lt s L D L D ξξ τ= + + + + (2.33)
Using (2.9) and (2.15), (2.33) can be rewritten as
( ) ( )( ) ( )
( ) ( )( ) ( )
', , ,
',
', ,
',
, ,
,0 ,0
, ,
,0 ,0
mL w L w i L w p i
i p i
mL w i L w i
i i L
s L w d D L w
s L D L D
s L w d L w
s L L D
L ξ
ξ
ξ γ τ
τ
γ τ
τ
= − − −
+ + + +
= − −
+ + +
(2.34)
Using the condition in (2.32), (2.34) is obtained as
( ) ( )( ) ( )
( ) ( ) ( ) (
', , ,
'
' ',
, 0 ,0
, , 0
, , ,0 ,0
L w L w i i L
i i
L i i i i
s L L D
s L w L w
D s L w L w s L L
ξ
ξ
ξ γ τ
τ
τ τ
− = + +
− − >
)∴ > + − −
(2.35)
For the DBR ATC:
Referring to (2.35), the bound on τi’(L,w) is τCDV as given in (2.13) and the bound on
si(L,w) is given in (2.10). Under the conditions where the peak cell rate of the DBR
connection Rp is equal to the sustainable cell rate of the aggregate traffic Rs with no
spacer buffer overflows, we find that after substituting (2.25) into (2.11), the upper
bound for Dspacer becomes the intrinsic burst tolerance of the aggregate AAL2 traffic
stream (i.e. τIBT AAL2 Aggregate). That is, for the DBR case
( ) 2 0 ,i IBT AAL Aggregates L w τ≤ < (2.36)

CHAPTER 2 ESTABLISHING REAL TIME CONNECTIONS IN ATM NETWORKS USING AAL2
MANAGEMENT OF LOW AND VARIABLE BIT RATE ATM ADAPTATION LAYER TYPE 2 TRAFFIC
53
Furthermore, it is found that a cell accepted by the spacer in the DBR ATC is also found
conforming by the policer in the SBR ATC. Similarly, a cell that is discarded by the
spacer is also found non-conforming by the policer. The analysis showing these
relationships are found in Appendix B. Thus, with the appropriate selected values for
the DBR PCR and the spacer buffer size, there will not be any cell loss due to spacer
buffer overflow.
For sink starvation to occur, it can be considered that the first packet arrives with
minimum queuing delay (i.e. si(L,0) = 0 and τi’(L,0) = 0) and subsequent packets arrived
at the maximum delay. Therefore using (2.35) and making use of the upper bounds for
τi’(L,w) and si(L,w) in the DBR case, we can avoid sink starvation by delaying the first
packet of each connection L an amount DL,ξ which is given by
, 2 L IBT AAL Aggregate CDVD ξ τ τ≥ + (2.37)
For the SBR ATC:
For the SBR ATC and under the assumptions given in (2.12), the value of si(L,w) is nil
and the bound on τi’(L,w) is given in (2.16). That is, for the SBR case
( )' 2 0 ,i CDV IBT AAL AggregateL wτ τ τ≤ < + (2.38)
Similar to the DBR case, for sink starvation to occur, it can be considered that the first
packet arrives with minimum queuing delay (i.e. si(L,0) = 0 and τi’(L,0) = 0) and
subsequent packets arrived at the maximum delay. Therefore using (2.35) and making
use of the upper bounds for τi’(L,w) and si(L,w) in the SBR case, we can also avoid sink
starvation by delaying the first packet of each connection L an amount DL,ξ given by
, 2 L IBT AAL Aggregate CDVD ξ τ τ≥ + (2.39)
Note by comparing (2.37) and (2.39), it is found that the value of DL,ξ required to avoid
sink starvation is the same whether the DBR or SBR ATC is used.

CHAPTER 2 ESTABLISHING REAL TIME CONNECTIONS IN ATM NETWORKS USING AAL2
MANAGEMENT OF LOW AND VARIABLE BIT RATE ATM ADAPTATION LAYER TYPE 2 TRAFFIC
54
2.2.1.5 Establishing the real time connection
When establishing a real time connection, the buffer sizes such as the spacer buffer and
the play-out buffer as well as the initial wait delay (or equalisation delay) for the first
packet to be read from the play-out buffer must be considered. In Section 2.2.1.4.2, the
minimum play-out buffer size has been determined as a function of the end-to-end delay
of the first packet, the propagation delay and the play-out rate. Here, the play-out buffer
size is again determined but will be obtained in terms of the queuing delay bounds that a
packet will experience in the CPS and the network.
For the DBR ATC:
The minimum spacer buffer size can be obtained from (2.25) as
2 IBT AAL Aggregate sB Rζ τ⎡ ⎤= ⎢ ⎥ (2.40)
The minimum equalisation delay can be obtained from (2.37) as
, 2 L IBT AAL Aggregate CDVD ξ τ τ= + (2.41)
The end-to-end delay using the minimum equalisation delay is
( ) ( )', , 2 , 0 ,0L k L k i p i IBT AAL Aggregate CDVt s L D Lξ τ τ τ− = + + + + (2.42)
The Intrinsic Burst Tolerance (τIBT AAL2 Aggregate) is inversely proportional to the
sustainable cell rate Rs (see (1.3)). If the value of Rs is set to the peak cell rate of the
aggregate traffic generated by the source CPS, then τIBT AAL2 Aggregate is 0. In the case of
the DBR transfer capability, if the peak cell rate is chosen larger than Rs then the end-to-
end delay for the connection will be smaller.
The play-out buffer size can be obtained by substituting (2.42) into (2.31) (for the case
of no buffer overflow) as

CHAPTER 2 ESTABLISHING REAL TIME CONNECTIONS IN ATM NETWORKS USING AAL2
MANAGEMENT OF LOW AND VARIABLE BIT RATE ATM ADAPTATION LAYER TYPE 2 TRAFFIC
55
( ) ( )( )', 2 , 0 ,0L i i IBT AAL Aggregate CDV LB s L L Rξ τ τ τ⎡ ⎤≥ + + +⎢ ⎥ (2.43)
From (2.43), the worst case queuing delay is obtained when the first packet experiences
maximum delay. This can be expressed as
( ) ( )( )( ) ( )( )
( )
' 2
' 2
2
, 0 ,0
,0 ,0
2
i i IBT AAL Aggregate CDV L
i i IBT AAL Aggregate CDV L
IBT AAL Aggregate CDV L
s L L R
s L L R
R
τ τ τ
τ τ τ
τ τ
⎡ ⎤+ + +⎢ ⎥⎡ ⎤≤ + + +⎢ ⎥
< +
(2.44)
The minimum play-out buffer size is obtained from the upper bound of (2.44) as
( ), 2 2L IBT AAL Aggregate CDV LB Rξ τ τ= + (2.45)
For a real time DBR connection to be established and data flow continuity to be
maintained, dimensioning of the buffer sizes as well as the initial delay for the first
packet to be played out are important. This can be achieved by implementing the
minimum spacer buffer size given in (2.40), the minimum play-out buffer size given in
(2.45) as well as delaying the first packet to be played out by a minimum equalisation
delay as given in (2.41).
For the SBR ATC:
In the SBR ATC, no spacer buffer is required for the policer as cells are immediately
passed to the network without entering the spacer buffer. Using (2.39), the minimum
equalisation delay for the SBR case is also given by (2.41).
The end-to-end delay using the minimum equalisation delay is
( )', , 2 , 0L k L k p i IBT AAL Aggregate CDVt D Lξ τ τ τ− = + + + (2.46)

CHAPTER 2 ESTABLISHING REAL TIME CONNECTIONS IN ATM NETWORKS USING AAL2
MANAGEMENT OF LOW AND VARIABLE BIT RATE ATM ADAPTATION LAYER TYPE 2 TRAFFIC
56
Similarly, the play-out buffer size can be obtained by substituting (2.46) into (2.31) as
( )( )', 2 , 0L i IBT AAL Aggregate CDV LB Lξ τ τ τ⎡ ⎤≥ + +⎢ ⎥R
)
(2.47)
From (2.47), the worst case queuing delay is obtained when the first packet experiences
maximum delay. This can be expressed as
( )(( )( )
( )
' 2
' 2
2
, 0
,0
2
i IBT AAL Aggregate CDV L
i IBT AAL Aggregate CDV L
IBT AAL Aggregate CDV L
L R
L R
R
τ τ τ
τ τ τ
τ τ
⎡ ⎤+ +⎢ ⎥⎡ ⎤≤ + +⎢ ⎥
< +
(2.48)
The minimum play-out buffer size is obtained from the upper bound of (2.48) as
( ), 2 2L IBT AAL Aggregate CDV LB Rξ τ τ= + (2.49)
Thus for the SBR case, a real time connection can be established and data flow
continuity maintained by implementing the minimum play-out buffer size given in
(2.49) as well as delaying the first packet to be played out by a minimum equalisation
delay as given in (2.41).
A summary of the derived design parameters necessary for the establishment of a real
time connection using AAL2 over a DBR and SBR connection is given in Table 4.
Design Parameter DBR ATC SBR ATC
Spacer Buffer Size ⎡τIBT AAL2 AggregateRs⎤ 0
Equalisation Delay τIBT AAL2 Aggregate + τCDV τIBT AAL2 Aggregate + τCDV
Play-out Buffer Size 2(τIBT AAL2 Aggregate + τCDV)RL 2(τIBT AAL2 Aggregate + τCDV)RL
Table 4: Design parameters for establishing AAL2 real time connections using the
DBR and SBR ATCs.

CHAPTER 2 ESTABLISHING REAL TIME CONNECTIONS IN ATM NETWORKS USING AAL2
MANAGEMENT OF LOW AND VARIABLE BIT RATE ATM ADAPTATION LAYER TYPE 2 TRAFFIC
57
It can be noted from Table 4 that the equalisation delay and the play-out buffers when
using the DBR and SBR real time connections are equivalent. Given that both ATCs
give equal delay performance, the ATC selected for the AAL2 work described in later
chapters of this thesis is based on the DBR ATC for its simplicity.
2.2.2 Quality of Service (QoS) Framework
Once a connection is established, it is important to determine the voice quality across
the connection. This is described by the Quality of Service (QoS) framework where
acceptable QoS has been agreed between the user and the network providers prior to
establishing the voice connection. The QoS framework is defined by three parameters:
fixed delays, delay variation (denoted by Dα) and packet loss (denoted by α). Of these
three parameters, the delay variation parameter is the most important since, as we have
shown in this chapter, it quantifies the level of equalisation required for establishing the
voice connection and must be kept within strict bounds. When delay Dα (or τIBT AAL2
Aggregate) is set as the maximum buffer size, packets that experience delay greater than
this will find the buffer full and are then discarded. In this case, the fraction of packets
that will experience delay greater than Dα (denoted as α) becomes the loss probability.
Therefore when using the QoS framework, the number of connections over a fixed link
rate can be determined for any given sets of QoS requirements (i.e. maximum delay Dα
and packet loss α).
The QoS framework is used in later chapters as a tool for measuring the performance of
the AAL2 multiplexer. For voice applications with stringent delay budgets (i.e. around
100ms for one-way), the performance of the AAL2 multiplexer is measured in terms of
the number of sources that can be accommodated at a fixed link rate while maintaining
minimum acceptable voice quality. Acceptable voice quality for each voice connection
results by limiting source traffic admitted into the AAL2 multiplexer (i.e. by limiting
the number of sources supported). This is explained more clearly with the use of Figure
21. Referring to Figure 21, as the number of sources admitted into the AAL2

CHAPTER 2 ESTABLISHING REAL TIME CONNECTIONS IN ATM NETWORKS USING AAL2
MANAGEMENT OF LOW AND VARIABLE BIT RATE ATM ADAPTATION LAYER TYPE 2 TRAFFIC
58
multiplexer increases, a greater number of AAL2 packets are being sent to the
multiplexer service queue, resulting in increased packet delay for a given fixed ATM
service rate. With a fixed size queue, AAL2 packets on arrival finding the queue full
(i.e. no place to fit in another packet) are then discarded. Continuous discarding of
AAL2 packets has a detrimental effect on the voice quality. Therefore the number of
sources that can be admitted into the queue must be limited so that the minimum
acceptable delay performance can be achieved for all the connections. This gives a
measure of the performance of the AAL2 multiplexer. In quantifying the number of
sources that can be accommodated while maintaining acceptable delay performance, the
(1-α) quantile delay must be specified. It is defined as the packet delay, Dα such that an
α fraction of packets have a delay greater than or equal to Dα. The delay Dα is
associated with the maximum multiplexing delay within the spacer buffer, defined as
Dspacer in (2.11), and is therefore a fraction of the end-to-end delay budget. Once the
values of Dα (or Dspacer) and α are chosen, the spacer buffer size, Bζ can be determined
by multiplying Dα with the PCR, Rp (i.e Bζ = Dα × Rp).

CHAPTER 3 AAL2 MULTIPLEXER MODEL
MANAGEMENT OF LOW AND VARIABLE BIT RATE ATM ADAPTATION LAYER TYPE 2 TRAFFIC
59
Chapter 3
AAL2 Multiplexer Model
In Chapter 2, a general ATM network incorporating AAL2 was examined. It was
determined, based on simplicity and practicality, that DBR was the most suitable ATC
to transport AAL2 traffic across the ATM network. It was also found that the AAL2
multiplexing delay plays an important role in terms of the equalisation delay that is
necessary for establishing an end-to-end voice connection. Therefore it is important to
understand and quantify the AAL2 multiplexer and its performance.
In this chapter, a general AAL2 multiplexer system is described. This system comprises
input sources and the AAL2 multiplexer. The input sources are modelled as voice
codecs with silence suppression and are characterised in terms of bandwidth and a
subjective quality score. The AAL2 multiplexer performance is described via the
statistical multiplexing gain that can be achieved while maintaining QoS requirements.
The study of the AAL2 multiplexer and its performance is investigated using the
network simulation tool called OPNET.

CHAPTER 3 AAL2 MULTIPLEXER MODEL
MANAGEMENT OF LOW AND VARIABLE BIT RATE ATM ADAPTATION LAYER TYPE 2 TRAFFIC
60
3.1. AAL2 Multiplexer System Model
The AAL2 multiplexer system model is shown in Figure 22. This system consists of
input sources (i.e. voice sources) and the AAL2 multiplexer. In the following sub-
sections, models for the input sources and the AAL2 multiplexer are described.
Voice sources
ATM cell creation
AAL2 Packetisation
1 n
FCFS Queue
AAL2 Multiplexer
DBR Service Rate R (kb/s)
Figure 22: General AAL2 multiplexer system model.
3.1.1. Voice Sources
In a voice conversation, it is observed that speech patterns within the conversation
consist of alternating talk and silence periods. A talk period is defined as the user
speaking over the phone (for example) and a silence period is defined as the user
listening to the other end of the phone. A simple speech pattern depicting talk and
silence periods is shown in Figure 23.

CHAPTER 3 AAL2 MULTIPLEXER MODEL
MANAGEMENT OF LOW AND VARIABLE BIT RATE ATM ADAPTATION LAYER TYPE 2 TRAFFIC
61
Voice Signal
Silence Period
Time V
olta
ge
Talk Period
Figure 23: Simple speech pattern.
Referring to Figure 23, talk periods are represented by high amplitude parts in the
waveform and silence periods are represented by the low amplitude areas. Note that
even though speech is not present in silence periods, the amplitude levels for the silence
periods in the analogue waveform in Figure 23 are not zero. This is a result of
background noises.
It has been found that both talk and silence intervals can be modelled as random
variables, with negative exponential distribution but different means [34]
[50] [51] [52] [53] [54]. The values for these means are shown in Table 5. These are taken
from the listed references and were measured using a number of voice conversation
samples. From this, it is observed that in each case the mean talk duration is less than
the mean silence period. The voice activity factor is defined as the ratio of the mean talk
period over a cycle of mean talk and silence periods given by
or 100%αα β= ×+ (3.1) Voice Activity Fact

CHAPTER 3 AAL2 MULTIPLEXER MODEL
MANAGEMENT OF LOW AND VARIABLE BIT RATE ATM ADAPTATION LAYER TYPE 2 TRAFFIC
62
Reference Mean Talk Interval α (ms) Mean Silence Interval β (ms)
[34] 400 600
[50] [51] 352 650
[51] 420 580
[52] 812 1579
Table 5: Typical mean values for talk and silence intervals.
When a voice conversation is to be conveyed across distance, a coder-decoder (codec) is
used. Analogue speech is converted by the coder into a digital form before being
transmitted across the network to be received and decoded by the designated user at the
receiving end. In the following sub-section, a model description for the digitised voice
traffic as well as the bandwidth characteristics for various codecs will be examined.
3.1.1.1. Codec Characteristics
Historically the bandwidth usage of a voice call over the PSTN is fixed at 64kb/s.
However the introduction of mobile telephony over the limited available bandwidth
across the air surface meant that speech was required to be compressed, thus reducing
the bandwidth required to support a connection. Also, silence suppression techniques
have been employed in these codecs in a further effort to reduce the average bandwidth
required to support a voice connection. Codecs with silence suppression techniques are
able to detect silence periods as described in the previous section through a voice
activity detector (VAD) and not generate packets during these periods (i.e. silence
suppression), thus further reducing the average bandwidth of a connection. Therefore
conversations described in Section 3.1.1 when digitised using these codecs can be
modelled as On/Off sources in terms of the packets they generate. The study of these
type of sources is found in many papers [50] [52] [53] [54] [55] [56]. Figure 24 illustrates
the packet creation characteristics of a typical voice codec employing silence
suppression that will be used to model voice sources within the OPNET simulation tool

CHAPTER 3 AAL2 MULTIPLEXER MODEL
MANAGEMENT OF LOW AND VARIABLE BIT RATE ATM ADAPTATION LAYER TYPE 2 TRAFFIC
63
(refer to Section 3.2).
ttalk
Figure 24: On/Off voice model characteristics.
Referring to Figure 24, during a talk period (ttalk), packets of size L bits are created at
fixed time intervals of length T. During a silence period (tsilence), there is no relevant
information except its duration and background noise levels but sending of these is non-
essential. Hence during a silence interval, no data needs to be sent as long as the
receiver is able to produce an adequate proxy of the background noise over the
appropriate silence period duration. This is achieved through the use of silence
suppression algorithms implemented within the voice codec, e.g. [57]. Referring to
Figure 24, the last packet containing the remaining voice information in the talk period
is sent at the beginning of the silence period after T time from the previous sent packet.
Some voice codec examples and their features such as nominal bandwidth, silence
suppression support, and frame interarrival times T are summarised in Table 6. Note
that the packet length L (shown in Figure 24) can be obtained by multiplying the codec
bandwidth with the frame interarrival time T. Note the voice codec G.711 PCM is not
used for mobile telephony and is shown in the table for illustration purposes.
Silence period Negative Exponential Distribution with mean β
T tsilence
T T
Time (secs) Packet Generation Events (L bits)
Talk period Negative Exponential Distribution with mean α
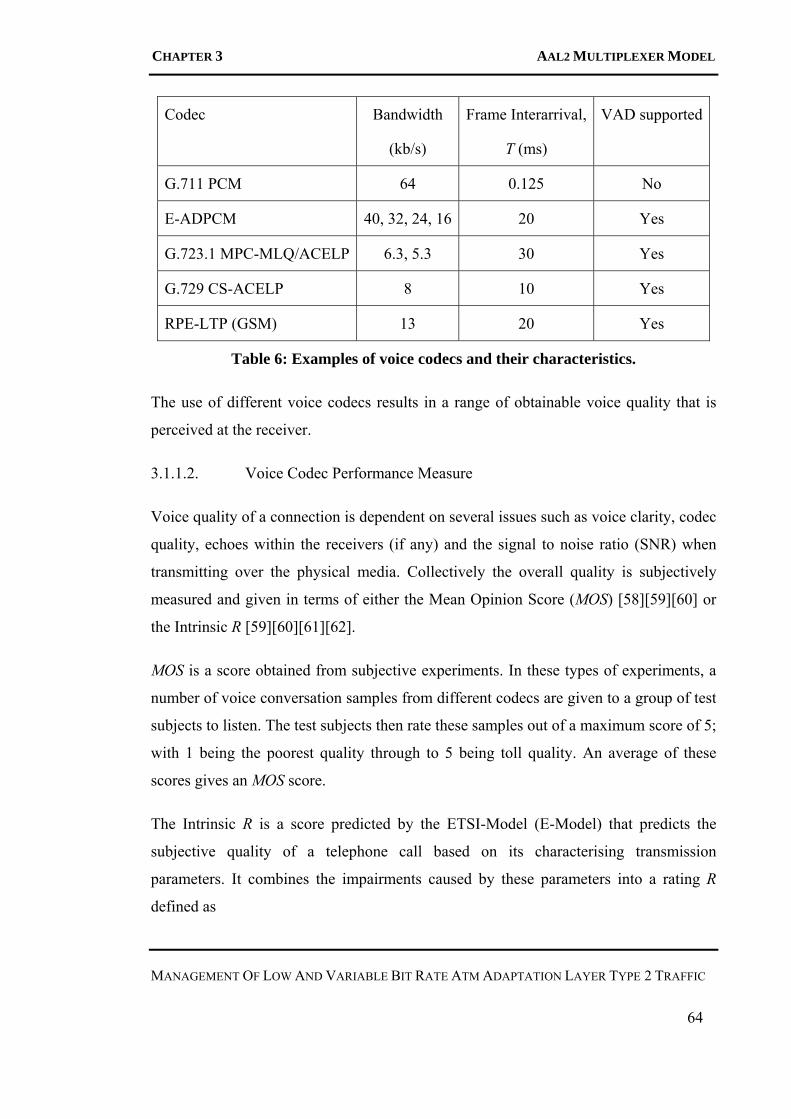
CHAPTER 3 AAL2 MULTIPLEXER MODEL
MANAGEMENT OF LOW AND VARIABLE BIT RATE ATM ADAPTATION LAYER TYPE 2 TRAFFIC
64
Codec Bandwidth
(kb/s)
Frame Interarrival,
T (ms)
VAD supported
G.711 PCM 64 0.125 No
E-ADPCM 40, 32, 24, 16 20 Yes
G.723.1 MPC-MLQ/ACELP 6.3, 5.3 30 Yes
G.729 CS-ACELP 8 10 Yes
RPE-LTP (GSM) 13 20 Yes
Table 6: Examples of voice codecs and their characteristics.
The use of different voice codecs results in a range of obtainable voice quality that is
perceived at the receiver.
3.1.1.2. Voice Codec Performance Measure
Voice quality of a connection is dependent on several issues such as voice clarity, codec
quality, echoes within the receivers (if any) and the signal to noise ratio (SNR) when
transmitting over the physical media. Collectively the overall quality is subjectively
measured and given in terms of either the Mean Opinion Score (MOS) [58] [59] [60] or
the Intrinsic R [59] [60] [61] [62].
MOS is a score obtained from subjective experiments. In these types of experiments, a
number of voice conversation samples from different codecs are given to a group of test
subjects to listen. The test subjects then rate these samples out of a maximum score of 5;
with 1 being the poorest quality through to 5 being toll quality. An average of these
scores gives an MOS score.
The Intrinsic R is a score predicted by the ETSI-Model (E-Model) that predicts the
subjective quality of a telephone call based on its characterising transmission
parameters. It combines the impairments caused by these parameters into a rating R
defined as

CHAPTER 3 AAL2 MULTIPLEXER MODEL
MANAGEMENT OF LOW AND VARIABLE BIT RATE ATM ADAPTATION LAYER TYPE 2 TRAFFIC
65
0 s d eR R I I I A= − − − + (3.2)
Referring to (3.2), the first term R0 represents the basic voice signal-to-noise ratio
(SNR). The second term Is includes impairments that occur simultaneously with the
voice signal, such as those caused by quantisation, by too loud a connection and by too
loud a side tone. The third term Id encompasses delayed impairments, including
impairments caused by talker and listener echo or by a loss of interactivity. The fourth
term Ie covers impairments caused by the use of special equipment; for example, each
low bit rate codec has an associated impairment value. This impairment term can also
be used to take into account the influence of packet loss. The fifth term A is the
expectation factor, which expresses the decrease in the rating R that a user is willing to
tolerate. An example of the factor A for mobile telephony is 10 [59] [60].
Intrinsic R rating covers a range between 0 to a 100. In [59] [60], it states that ratings R
in the ranges [90, 100], [80, 90], [70, 80], [60, 70], [50, 60] correspond to best, high,
medium, low and poor quality respectively. The rating R is related to MOS in reference
[61] and is as follows:
( ) ( )( )( )6
For 0 < R < 100
1 0.035 60 100 7 10MOS R R R −= + × + − − ×
(3.3)
For R < 01MOS =
(3.4)
For R > 1004.5MOS =
(3.5)
When performing subjective measurements to assess only the quality of a particular
voice codec in a test environment, other factors that contribute to voice degradation are
kept at a minimum. Under these conditions, the resulting MOS and Intrinsic R obtained
are essentially measures of the codec voice quality. Therefore either MOS or Intrinsic R
can be used to describe the codec performance. Examples of codec ratings in terms of

CHAPTER 3 AAL2 MULTIPLEXER MODEL
MANAGEMENT OF LOW AND VARIABLE BIT RATE ATM ADAPTATION LAYER TYPE 2 TRAFFIC
66
MOS and Intrinsic R are summarised in Table 7. It has been noted in [63] that a MOS
rating of 3.6 and above, is considered acceptable and will give good voice quality.
Rating Codec Bandwidth (kb/s)
MOS Intrinsic R
G.711 PCM 64 4.3 94.3
40 4.3 92.3
32 4.2 87.3
24 3.6 69.3
E-ADPCM
16 2.3 44.3
6.3 3.7 75.3 G.723.1 MPC-MLQ/ACELP
5.3 4.0 79.3
G.729 CS-ACELP 8 3.95 84.3
RPE-LTP (GSM) 13 3.7 75.3
Table 7: Examples of codec’s MOS and Intrinsic R.
The next part of the AAL2 multiplexer system to be examined is the AAL2 multiplexer
itself. A description of the AAL2 multiplexer as well as its performance will be
examined in the next section.
3.1.2. AAL2 Multiplexer Model
An example of an AAL2 multiplexer model is shown in Figure 22. Referring to Figure
22, n voice traffic sources are multiplexed into the AAL2 multiplexer. In a connection,
packets are collected by the AAL2 SSCS sublayer. These are AAL2 encapsulated (i.e.
prepended a 3-octet header) and queued into a FCFS queue that services at a rate R. At
every ATM cell creation instant (related to the service rate R), AAL2 packets are
removed from the queue and multiplexed into an AAL2 CPS PDU before being sent to

CHAPTER 3 AAL2 MULTIPLEXER MODEL
MANAGEMENT OF LOW AND VARIABLE BIT RATE ATM ADAPTATION LAYER TYPE 2 TRAFFIC
67
the ATM layer. Note that an AAL2 CPS PDU cell can contain AAL2 packets from
different voice connections.
In the next sub-section, a method for evaluating the performance of the AAL2
multiplexer will be described.
3.1.2.1. AAL2 Multiplexer Performance Measure
As was described previously, the average bit rate produced by a codec employing
silence suppression techniques is less than the codec’s peak rate. This results in
inefficient link utilization when peak rate is allocated to individual voice connections. In
an effort to increase bandwidth utilisation, statistical multiplexing is employed. When
considering the service of a number of these type of sources, statistical multiplexing can
be described as the process by which available bandwidth resulting from silence periods
in one voice conversation is used to send traffic from another connection. Because of
the random nature of the On/Off voice activity time, this will result in less aggregate
bandwidth being required to service a given number of voice connection than if the sum
of the codecs’ peak rate were used.
However, it is possible that the sum of the bandwidths from active sources can be
greater than the service rate capacity. Therefore a buffer has been implemented in the
AAL2 multiplexer (as shown in Figure 22) that prevents packet loss during periods
when the aggregate source traffic is greater than the service capacity by allowing
packets to be queued. This is illustrated in Figure 25. Note that is defined
as the sum of the codec peak rate and is defined as the sum of the codec
average rate.
_1
n
peak ratei
BW=∑
_1
n
average ratei
BW=∑

CHAPTER 3 AAL2 MULTIPLEXER MODEL
MANAGEMENT OF LOW AND VARIABLE BIT RATE ATM ADAPTATION LAYER TYPE 2 TRAFFIC
68
Incoming On/Off Traffic
Buffer Fill depends on number of active sources
_ _1 1
Service Raten n
average rate peak ratei i
BW BW= =
≤ <∑ ∑
Figure 25: Buffer in AAL2 multiplexer.
Referring to Figure 25, the buffer fill is dependent on the nature of the sources and the
chosen service rate. The size of this buffer determines the maximum waiting delay an
AAL2 packet will experience and becomes an important part of the QoS framework
described in Section 2.2.2.
It is useful then to quantify the level of statistical multiplexing that can be achieved and
we do this by defining a parameter called the Statistical Multiplexing Gain (SMG). For a
given aggregate AAL2 multiplexer service rate R, and given characteristics of the voice
sources, the statistical multiplexing gain is defined as the ratio of the number of sources
that can be accommodated when statistical multiplexing is employed (denoted by nmux)
to the number of sources that can be accommodated when peak rate is allocated to all
sources (denoted by npeak_rate) and is given by
(3.6)
_
mux
peak rate
nSMGn
=
In the case where AAL2 is used to support the voice connections, the value of npeak_rate
for a particular codec is related to the maximum allowable link loading γ, the
multiplexer service rate R (kb/s), the codec packet size L (bits), the AAL2 packet header
size LAAL2 (i.e. 24 bits) and the codec packet interarrival time T (sec) and is given by

CHAPTER 3 AAL2 MULTIPLEXER MODEL
MANAGEMENT OF LOW AND VARIABLE BIT RATE ATM ADAPTATION LAYER TYPE 2 TRAFFIC
69
( )( )_2
4753peak rate
AAL
RnL L T
γ=+
(3.7)
Note that the 47/53 in (3.7) accounts for payload to total cell ratio of the ATM cell
header.
The value of nmux is dependent on the nature of the source traffic and the QoS
requirements of the individual voice connections. A method of obtaining the value of
nmux and performance of the AAL2 multiplexer is by simulating the general AAL2
multiplexer system in an ATM network using the OPNET simulation tool. Descriptions
for modelling the AAL2 multiplexers and obtaining values for nmux are covered in the
following section.
3.2 Simulation in OPNET
The general AAL2 multiplexer system of Figure 22 is implemented in an ATM network
and is shown in Figure 26 as nodes in the OPNET simulation tool.
Figure 26: OPNET network model.
Referring to Figure 26, the source node is connected to a destination node via a physical
link with properties such as link capacity that can be set in OPNET. Both source and
destination nodes are implemented with identical functions. They contain voice sources,
AAL2 multiplexers at the source (and demultiplexers at the destination), ATM layer,

CHAPTER 3 AAL2 MULTIPLEXER MODEL
MANAGEMENT OF LOW AND VARIABLE BIT RATE ATM ADAPTATION LAYER TYPE 2 TRAFFIC
70
transmitters and receivers as well as a sink for the collection of statistical data. The
OPNET model of a node of the present network is shown in Figure 27.
Figure 27: OPNET node model.
Referring to Figure 27, each icon in the node model is implemented by a state-driven
process. During simulation, n independent voice sources are generated in the voice
codec process with traffic characteristics as described by the On/Off voice model that is
shown in Figure 24. Packet stream interrupts are generated when packets are sent from
one icon to the next (e.g. packets sent from voice sources to the AAL2). In the AAL2
process, voice packets are first prepended with 3 octet headers and then queued into a
FCFS buffer. Note that segmentation is performed for packets larger than 44 octets. At
every 1/PCR of the service rate (using DBR ATM transfer capability), AAL2 packets

CHAPTER 3 AAL2 MULTIPLEXER MODEL
MANAGEMENT OF LOW AND VARIABLE BIT RATE ATM ADAPTATION LAYER TYPE 2 TRAFFIC
71
are taken out of the buffer and multiplexed into an AAL2 CPS PDU cell before being
sent to the ATM to be prepended with ATM headers. These are then sent via the
transmitters and collected by the receivers at the destination.
Received ATM cells are then stripped of their headers before being sent to the AAL2
process from which the appropriate AAL2 headers are stripped. For packets that are
carried over multiple ATM cells, packet reassembly is performed in the AAL2 process.
The reassembled packets are then sent to the sink where statistical information such as
the end-to-end packet delays are obtained.
From the individual end-to-end packet delays, AAL2 multiplexing delays can be
determined and the performance of the AAL2 multiplexer can be obtained. The AAL2
multiplexing delays are calculated by subtracting the arrival times of the voice packets
at the sink with their packet creation times, the fixed propagation delay and the network
delays. To simplify the calculations involved, the propagation delay and the network
delays are made negligible. These calculated delays are then sorted and placed into
appropriate delay bins from which the delay histograms are obtained. Hence each bin
contains the number of packets that would have experienced delays within a certain
range. At the end of the simulation, the number of packets within each delay bin is
converted into a fraction of the total number of packets received and plotted against
delay. This plot gives the delay performance of the AAL2 multiplexer. A simulation
example using the OPNET models described previously will be used to illustrate
statistical multiplexing and the statistical multiplexing gains that are achievable for
different QoS delay requirements.

CHAPTER 3 AAL2 MULTIPLEXER MODEL
MANAGEMENT OF LOW AND VARIABLE BIT RATE ATM ADAPTATION LAYER TYPE 2 TRAFFIC
72
0
Simulation Example:
In this simulation example, voice sources used are based on the 8kb/s CS-ACELP
codecs with silence suppression. Its characteristics are shown in Table 6. It is assumed
that voice conversations follow a mean talk interval of 400ms and a mean silence
interval of 600ms [34]. Voice packets are queued immediately into a First-Come-First-
Serve (FCFS) buffer after being AAL2 encapsulated and are sent at fixed time intervals
using a service rate R of 384 kb/s (i.e. 1/4 of T1 rate).
The resultant delay performance of the AAL2 multiplexer for different number of
sources admitted into the multiplexer is plotted as a function of the delay d against the
probability that the packet delay exceeds d and is shown in Figure 28.
0 10 20 3-4
-3
-2
-1
0
α = 10-3
Dα =
16m
s
Log[
Pr{d
elay
>d}]
d (ms)
55 CELP Sources 57 CELP Sources 58 CELP Sources 59 CELP Sources 60 CELP Sources
Figure 28: Example of delay performance curves.
The number of voice connections that can be accommodated for a service rate of
384kb/s can be determined by choosing a set of QoS parameters: Dα and α (see Section

CHAPTER 3 AAL2 MULTIPLEXER MODEL
MANAGEMENT OF LOW AND VARIABLE BIT RATE ATM ADAPTATION LAYER TYPE 2 TRAFFIC
73
2.2.2) such that the resultant perceived voice quality at the receiver is essentially the
characteristics of the codec. Using typical values that result in negligible degradation of
voice quality from [34], Dα is chosen as 16ms for the maximum AAL2 multiplexing
delay and α is chosen as 10-3. According to this set of QoS parameters, the total number
of voice sources that can be accommodated from Figure 28 is 57 (i.e. nmux). Note that
with different sets of QoS parameters (i.e. Dα and α), a different total number of sources
can be supported. By setting either QoS parameters larger, more connections can be
accommodated. However, increasing these parameters may result in a degradation of
voice quality.
For this simulation example, it is assumed that link loading is close to 100% (i.e. 95%).
Therefore, the total number of CS-ACELP sources possible with peak rate allocation for
a service rate of 384kb/s is calculated using (3.7) to be 32 (i.e. npeak_rate). Therefore the
SMG that can be obtained is thus determined using (3.6) as 1.78.
This simulation example illustrates the statistical multiplexing of voice traffic into a
single-queued general AAL2 multiplexer. The model can be extended into multiple
queues and implemented as a prioritised AAL2 multiplexer. In the next chapter, a two-
queued prioritised AAL2 multiplexer is proposed and described.
Confidence Interval:
A confidence interval is required to show the accuracy of this simulation example as
well as the simulation studies that will follow in later chapters of the thesis. This
interval can be calculated by using the Method of Batch Means [64].
From [64], it is gathered that a sample mean from n simulations (denoted by Mn), a
sample variance (denoted by V2n) and a value (denoted by Zα/2,n-1) obtained from the
Student’s t-distribution for various degrees of freedom are required to calculate the
confidence interval. This is given by (3.8) for the sample variance and (3.9) for the
confidence interval.

CHAPTER 3 AAL2 MULTIPLEXER MODEL
MANAGEMENT OF LOW AND VARIABLE BIT RATE ATM ADAPTATION LAYER TYPE 2 TRAFFIC
74
( )22 11
n
n ii
V Xn
= −− ∑ nM
(3.8)
, 1 , 12 2,n n
n a n an n
V VM z M zn n− −
⎛ ⎞− +⎜ ⎟⎝ ⎠
(3.9)
where X is a value obtained from each simulation and Vn is the standard deviation of the
sample.
Using these equations, a confidence interval for the delay Dα can be calculated for the
simulation example shown in Figure 28. Note that there are a number of confidence
intervals that can be calculated from Figure 28 however we have chosen the point of
interest (i.e. α of -3.8 and Dα of 16ms) from the delay plot of the 55 CELP sources.
Using the same parameters as the simulation example but with different seeds and with
simulation duration of 6000ms, the obtained Dα values at α of -3.8 are shown in Table
8.

CHAPTER 3 AAL2 MULTIPLEXER MODEL
MANAGEMENT OF LOW AND VARIABLE BIT RATE ATM ADAPTATION LAYER TYPE 2 TRAFFIC
75
Simulation Run (with different seed) Delay Dα (ms) 1 14 2 18 3 12 4 14 5 14 6 17 7 12 8 14 9 25 10 17 11 23 12 26 13 12 14 16 15 17 16 12 17 28 18 20 19 15 20 15 21 16
Table 8: Simulation runs with different seeds.
The sample mean for Table 8 is calculated to be 17ms and the sample variance
calculated from (3.8) to be 22.9. For a 95% interval, this corresponds to a Zα/2,n-1 value
of 2.086. Given this information, the confidence interval is calculated from (3.9) to be
in the range 14.8ms to 19.2ms which also covers the point of interest. The simulation
studies to be followed in later chapters of this thesis will be based on this multiplexer
model with simulation durations greater than 6000ms, and thus it can be concluded that
the accuracy of the obtained simulation results will also be within the 95% confidence
interval.

CHAPTER 4 PRIORITY QUEUING
MANAGEMENT OF LOW AND VARIABLE BIT RATE ATM ADAPTATION LAYER TYPE 2 TRAFFIC
76
Chapter 4
Priority Queuing
In Chapter 3, a general AAL2 multiplexer system consisting of voice sources and a
single-queued AAL2 multiplexer was described. Input traffic is multiplexed and served
in a FCFS scheduling manner. This method may be unsuitable in cases where various
voice applications have different delay requirements.
In this chapter, we propose to differentiate these various voice applications within the
AAL2 multiplexer and serve those which require a tighter bound on the AAL2
multiplexing delay with a higher priority than those with a more relaxed delay bound
[65] [66]. In the simulation example shown in this chapter, two different voice call types
are examined. The assigning of high priority to the example call types is obtained by
comparing their associated delay budgets. From this we proceed to examine the delay
performance of the prioritised AAL2 multiplexer and to compare its performance to the
general model in terms of the statistical multiplexing gains (SMG) that they achieve.
4.1 Delay Budget
AAL2 multiplexing delay requirements can be obtained using a delay budget consisting
of various delay components described in Section 2.2.1.3. Note that the spacer/policer
buffer in the model shown in Figure 21 have been implemented as a single FCFS AAL2
multiplexer queue with DBR service shown in Figure 25. The maximum delay budget
DB,L for the Lth voice connection that is allowable in order for conversations to occur
without any lapse is typically around 100ms [48]. This includes the codec packetisation

CHAPTER 4 PRIORITY QUEUING
MANAGEMENT OF LOW AND VARIABLE BIT RATE ATM ADAPTATION LAYER TYPE 2 TRAFFIC
77
delay T, the AAL2 multiplexing delay statistically bounded by Dspacer, the propagation
delay Dp, the network delays statistically bounded by the cell delay variation tolerance
(τCDV) (see Section 2.2.1.2) and the equalisation delay, ξL. Therefore DB,L is summarised
as
,B L spacer p CDV LD T D D τ ξ= + + + + (4.1)
The first delay component in (4.1) is the codec’s packetisation delay, which depends on
the type of codec used. Some examples are shown in Table 6. A typical codec
packetisation delay is around 20ms.
The AAL2 multiplexing delay Dspacer can be re-written as a fraction of the delay budget
DB,L as
,spacer B L p CDV LD D T D τ ξ= − − − − (4.2)
This is the maximum delay a packet can experience while waiting in the AAL2
multiplexer for service and is also the maximum buffer size. When describing the queue
size in terms of the number of AAL2 packets, this can be obtained by dividing the
maximum delay Dspacer with the service time of an AAL2 packet (denoted by Tservice).
The service time for an AAL2 packet is a function of the source packet size (denoted by
L (bits)), the length of the AAL2 header (denoted by LAAL2 (i.e. 24 bits)) and the
effective service rate of the AAL2 multiplexer (denoted by R (bits/sec)).
2AALservice
L LTR
+=
(4.3)
The propagation delay Dp is a function of the signal propagation speed in the physical
medium (denoted by Vs (m/s)) and the total distance transversed by the cell from source
to destination (denoted by Ds (m)).

CHAPTER 4 PRIORITY QUEUING
MANAGEMENT OF LOW AND VARIABLE BIT RATE ATM ADAPTATION LAYER TYPE 2 TRAFFIC
78
sp
s
DDV
= (4.4)
Note in (4.4), the propagation speed in a typical medium such as air is 3×10⁸m/s.
The last delay component in (4.1) is the equalisation delay ξL. In Section 2.2.1.3, the
minimum value of this delay was derived to be the sum of the upper bounds on the
variable delays experienced by the cell. These are the AAL2 multiplexing delay, Dspacer
and the network delay, τCDV (see Section 1.2.3.1.2).
L spacer CDD Vξ τ= + (4.5)
From (4.4) and (4.5), (4.2) can be re-written in terms of the codec packetisation T, the
distance Ds travelled by the cell from source to destination, the velocity Vs of the cell
travelling in the medium and the network delays τCDV.
( )2 2
2
2
2 2 2
spacer B p CDV spacer CDV
sspacer B CDV
s
sB CDV
sspacer
sBCDV
s
D D T D D
DD D T VDD T VD
DD TV
τ τ
τ
τ
τ
= − − − − +
= − − −
− − −=
= − − −
(4.6)
For a given network topology and distance between source-destination pairs, the
maximum multiplexing delay Dspacer tolerable can be determined via (4.6).
In the next section, a simulation example is used to illustrate differences in the
multiplexing delays obtained from the delay budgets for two types of calls (i.e. long
distance and local calls). Also, a prioritised AAL2 multiplexer will be proposed and its
delay performance compared to the single-queue general AAL2 multiplexer.

CHAPTER 4 PRIORITY QUEUING
MANAGEMENT OF LOW AND VARIABLE BIT RATE ATM ADAPTATION LAYER TYPE 2 TRAFFIC
79
4.2 Scenario Example
In this simulation example, two different types of voice traffic; local (or national) calls
and international calls are presented to the single-queue general AAL2 multiplexer and
the proposed prioritised AAL2 multiplexer. A local call is defined as any connection
made within Australia and an international call is defined as any calls made between
Australia and overseas. In this example, both call types follow the characteristics of the
On/Off model described in Section 3.1.1.1. Note that GSM (i.e. RPE-LTP codecs) voice
codecs are used. The characteristics for this codec are shown in Table 6 [57] [67].
In a local call connection, the maximum distance travelled by a cell across the breadth
of Australia from Western Australia (i.e. Perth) to the Eastern states such as Sydney is
typically around 4,000km. For an international call, the maximum distance travelled by
the cell must be at least half the earth’s circumference and is typically around
19,000km. It has been assumed that in a local call, the number of hops a cell
experiences within the network is less than that for international calls. By examining the
travelling distance of a cell, the propagation delay of the international call dominates its
delay budget. Therefore, this results in a tighter delay constraint for the AAL2
multiplexer. With the local call, its delay budget is evenly distributed amongst the delay
components, hence resulting in a looser delay constraint for the AAL2 multiplexer. A
summary of the delay budgets for both call types is shown in Table 9. Note the
propagation delay Dp is obtained via (4.4) and the AAL2 multiplexing delay Dspacer is
derived via (4.6).

CHAPTER 4 PRIORITY QUEUING
MANAGEMENT OF LOW AND VARIABLE BIT RATE ATM ADAPTATION LAYER TYPE 2 TRAFFIC
80
Delay Component Local/National Calls (ms)
International Calls (ms)
Total delay budget (DB,L) 100 100
Packetisation delay (T) 20 20
Propagation delay (Dp) 13 60
Network delay (τCDV) 1 5
Derived AAL2 multiplexing delay, Dspacer
32.5 5
Table 9: Delay budget parameters.
Also in this simulation example, it is assumed that conversations have a mean talk and
silence intervals of 420ms and 580ms respectively [51]. Both call types are assumed to
use GSM codecs that have a nominal bandwidth of 13kb/s and packetisation intervals of
length 20ms, resulting in an AAL2 packet size of 288 bits (i.e. voice packet of 264 bits
+ 24 bits AAL2 header). The service rate for these AAL2 multiplexers is assumed to be
1.536Mb/s. A summary of these simulation parameters is shown in Table 10.
Simulation Parameters Value
Voice packet length 288 bits
Mean Talk spurt interval 420ms
Mean Silence interval 580ms
ATM VCC service rate 1.536 Mb/s
Table 10: Simulation parameters.
In the following sub-sections, the performance for the general and prioritised AAL2
multiplexer are described and compared under this simulation example.

CHAPTER 4 PRIORITY QUEUING
MANAGEMENT OF LOW AND VARIABLE BIT RATE ATM ADAPTATION LAYER TYPE 2 TRAFFIC
81
4.2.1 General AAL2 Multiplexer Performance
In the general AAL2 multiplexer model described in Section 3.1.2, both call types’
packets are serviced in a FCFS discipline regardless of the different delay requirements.
Therefore its delay performance described via the QoS framework (see Section 2.2.2)
must be small enough to accommodate long distance calls.
For the purpose of this study, the value for the probability loss α in the QoS requirement
to be used is 10-3, which is considered acceptable for voice applications [34]. Given that
this is a single-queue AAL2 multiplexer where traffic from both call types are present,
the maximum multiplexing delay Dα in the QoS requirement that can be set is 5ms to
accommodate the call type with the tightest delay requirements. Using the simulation
parameters in Table 10, Figure 29 shows the resultant performance delay curves for a
test stream when different numbers of voice sources are presented to the multiplexer.

CHAPTER 4 PRIORITY QUEUING
MANAGEMENT OF LOW AND VARIABLE BIT RATE ATM ADAPTATION LAYER TYPE 2 TRAFFIC
82
0 5 10 15 20 25 30 3510-4
10-3
10-2
10-1
100
α = 10-3
Dα = 5ms
Dα = 32.5ms
n = 181 sources n = 182 sources n = 197 sources n = 198 sources
Pr {
dela
y >
d}
d (ms)
Figure 29: Delay performance curves for conventional AAL2 voice multiplexing
scheme.
As can be observed from Figure 29, there are two components of delay present when
multiplexing variable bit rate (VBR) voice sources. The first component (shown by the
steeper part of the delay curve) is due to phase coincidences of packets arriving into the
multiplexer at the same time from different sources. This delay is expected to be quite
small. The second component of delay (shown by the shallower part of the delay curve)
is the smoothing delay and results from the sum of the peak rates of the individual
sources being greater than the ATM service rate. In other words, when packets from a
talk spurt arrives into the multiplexer from more than 94 sources (i.e. the total number
of source with peak rate allocation (denoted by npeak_rate) as calculated using (3.7)), then
some form of smoothing will take place within the multiplexer. As can be seen from
Figure 29, this component of delay is dominant especially when the number of admitted
sources is large.

CHAPTER 4 PRIORITY QUEUING
MANAGEMENT OF LOW AND VARIABLE BIT RATE ATM ADAPTATION LAYER TYPE 2 TRAFFIC
83
Figure 29 indicates that under the conditions specified in Table 9, the maximum number
of sources that can be multiplexed (denoted by nmux) while maintaining the required
QoS in delay variation (i.e. α=10-3 and Dα=5ms in this case) is 181 sources. Therefore
the level of statistical multiplexing gain (SMG) this represents can be calculated via
(3.6) as
_
18194
1.92
mux
peak rate
nSMGn
=
=
=
(4.7)
It should also be noted from Figure 29 that if the calls entering the AAL2 multiplexer
were only of the local/national type, then the allowable delay budget for the AAL2
multiplexer is 32.5ms. In this case, 197 sources could be admitted into the multiplexer
while maintaining acceptable delay performance.
4.2.2 Performance of Prioritised AAL2 Multiplexer
The proposed prioritised AAL2 multiplexer method is shown in Figure 30. In this
scheme, the multiplexer is able to distinguish (during call setup) between international
(designated high priority) and local/national (designated low priority) calls. Voice
packets from the high and low priority calls are then placed in separate queues each in a
FCFS manner. Upon an ATM cell transmission boundary, the ATM cell creation
function obtains AAL2 CPS packets from the high priority queue and forms a CPS PDU
for insertion into the ATM cell payload. CPS packets are only taken from the low
priority queue when the high priority queue is empty. Bandwidth starvation for the low
priority sources is avoided by limiting the number of high priority sources admitted into
the multiplexer. In the case where remaining payload results from the previous CPS
PDU transmission, this is placed first into the next CPS PDU payload regardless of the
presence of high priority packets.

CHAPTER 4 PRIORITY QUEUING
MANAGEMENT OF LOW AND VARIABLE BIT RATE ATM ADAPTATION LAYER TYPE 2 TRAFFIC
84
Low Priority voice sources
High Priority voice sources
ATM cell creation
AAL2 Packetization
Low priority Service queue
High priority Service queue
m +1
n 1 m
Codec Sampling
VCC
Figure 30: Simulation model for prioritised AAL2 multiplexing scheme.
Simulations were carried out to determine the delay performance of the high and low
priority traffic classes using the prioritised AAL2 multiplexing scheme in Figure 30.
The parameters used in the study were as indicated in Table 10 with the total number of
sources kept constant at 197. Although the total number of sources was constant, the
mix of high and low priority sources was varied. Figure 31 and Figure 33 show the
performance delay curves for the low and high priority sources, respectively.

CHAPTER 4 PRIORITY QUEUING
MANAGEMENT OF LOW AND VARIABLE BIT RATE ATM ADAPTATION LAYER TYPE 2 TRAFFIC
85
0 5 10 15 20 25 30 3510-4
10-3
10-2
10-1
100Total number of active sources = 197
α = 10-3
Dα = 32.5ms
Pr {
dela
y >
d}
d (ms)
High priority sources = 0 High priority sources = 5 High priority sources = 10
Figure 31: Delay performance curves for low priority sources.
Referring to Figure 31, it is evident that the nature of the performance delay curve for
low priority sources is similar to that of Figure 29, except that the actual delay curves is
a function of the number of high priority sources admitted into the multiplexer. It is
clear that to achieve the required Dα=32.5ms for low priority sources, no more than 10
high priority sources are allowed. This would be achieved in the multiplexer’s call
admission process. Of course, if the total number of sources were limited to less than
197 sources, then the number of admissible high priority sources would be increased. In
Table 11, we show the maximum number of admissible high priority sources when the
total number of connections is limited to 197, 196 and 195 sources, while maintaining
the Dα=32.5ms for the low priority sources (the delay for the high priority sources is
below 5ms in all cases). Note that as the number of high priority sources increases for
decreasing total number of sources, the number of low priority sources decreases.

CHAPTER 4 PRIORITY QUEUING
MANAGEMENT OF LOW AND VARIABLE BIT RATE ATM ADAPTATION LAYER TYPE 2 TRAFFIC
86
Total number of sources
Maximum number of admissible high priority sources
197 8
196 12
195 33
Table 11: Maximum high priority sources for decreasing total number of sources.
Referring to Table 11, it is observed that the maximum number of admissible high
priority sources increases dramatically when the total number of sources decreased from
196 to 195. This can be explained using Figure 32 which shows the delay performance
curves for the number of low priority sources shown in Table 11.
0 5 10 15 20 25 30 35
-3
-2
-1
0
α = 10-3
Dα = 32.5ms
Pr {d
elay
> d
}
d (ms)
197 Sources 196 Sources 195 Sources
Figure 32: Delay performance curves for different number of low priority sources.
Referring to Figure 32, when the number of low priority sources is decreased, the delay
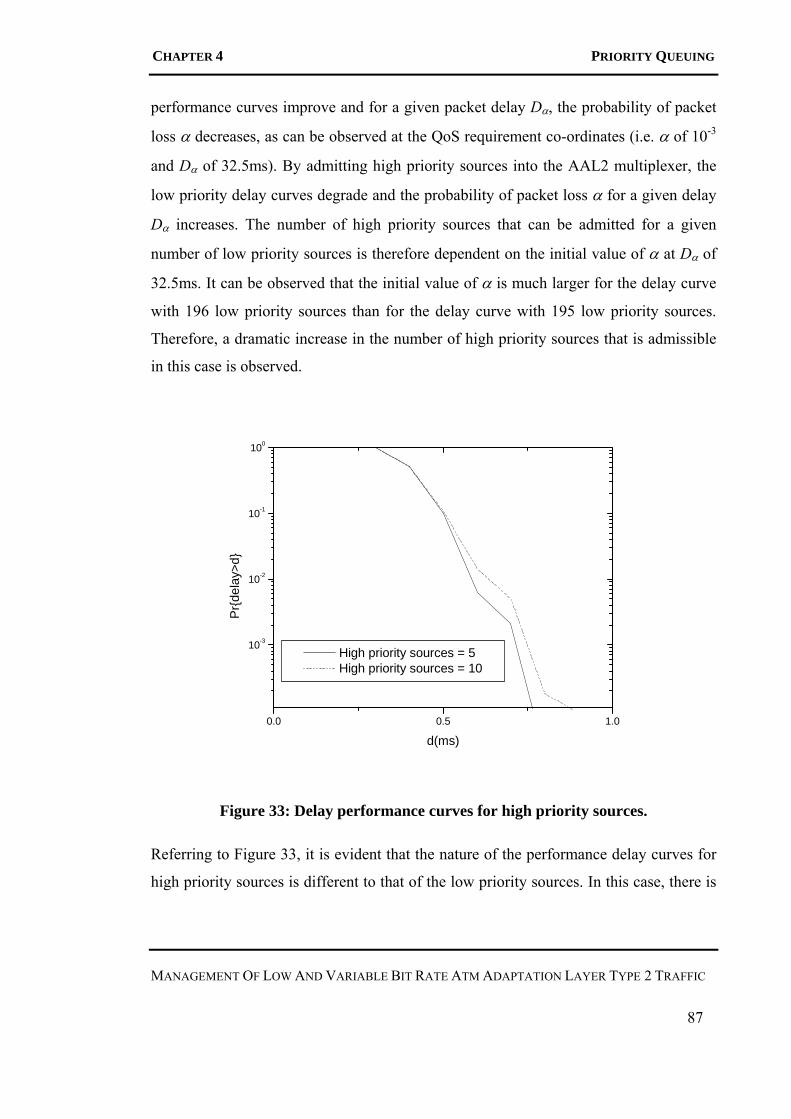
CHAPTER 4 PRIORITY QUEUING
MANAGEMENT OF LOW AND VARIABLE BIT RATE ATM ADAPTATION LAYER TYPE 2 TRAFFIC
87
performance curves improve and for a given packet delay Dα, the probability of packet
loss α decreases, as can be observed at the QoS requirement co-ordinates (i.e. α of 10-3
and Dα of 32.5ms). By admitting high priority sources into the AAL2 multiplexer, the
low priority delay curves degrade and the probability of packet loss α for a given delay
Dα increases. The number of high priority sources that can be admitted for a given
number of low priority sources is therefore dependent on the initial value of α at Dα of
32.5ms. It can be observed that the initial value of α is much larger for the delay curve
with 196 low priority sources than for the delay curve with 195 low priority sources.
Therefore, a dramatic increase in the number of high priority sources that is admissible
in this case is observed.
0.0 0.5 1.0
10-3
10-2
10-1
100
Pr{d
elay
>d}
d(ms)
High priority sources = 5 High priority sources = 10
Figure 33: Delay performance curves for high priority sources.
Referring to Figure 33, it is evident that the nature of the performance delay curves for
high priority sources is different to that of the low priority sources. In this case, there is

CHAPTER 4 PRIORITY QUEUING
MANAGEMENT OF LOW AND VARIABLE BIT RATE ATM ADAPTATION LAYER TYPE 2 TRAFFIC
88
no smoothing delay since the sum of the peak rates of the high priority sources is
always less than the ATM service rate and the only delay component is due to
simultaneous packet arrivals (i.e. phase coincidences) within the high priority service
queue. It can also be seen that the delay for the high priority sources is well below the
requirements of 5ms as indicated in Table 9 and is relatively insensitive to the number
of high priority sources.
The statistical multiplexing gain that is achievable for the prioritised AAL2 multiplexer
is determined to be 2.10 (i.e. nmux=197, npeak_rate=94 and SMG=197/94), which
represents a 9% increase in bandwidth efficiency over when the single queue AAL2
model is used. In general, the priority queuing scheme provides significant statistical
multiplexing gains when the number of low priority sources is much greater than the
high priority sources. In practice this would actually be the case. In fact, the largest
GSM service provider in Australia (Telstra) quotes that the fraction of international calls
at a base station is less than 0.2% of the total number of calls.
From the presented simulation example, significant statistical multiplexing gains were
realised when we based our assumptions that all sources adhere strongly to the
characteristics of the On/Off model. To ensure that all sources exhibit these
characteristics, some form of usage parameter control (UPC) is required. In the next
chapter, we examine the effect of source sensitivity on the delay performance of the
AAL2 multiplexer and describe a common UPC that might be used to enforce a source
to behave with the desired On/Off characteristics.

CHAPTER 5 SOURCE SENSITIVITY
MANAGEMENT OF LOW AND VARIABLE BIT RATE ATM ADAPTATION LAYER TYPE 2 TRAFFIC
89
Chapter 5
Source Sensitivity In previous chapters, it had been observed that due to the variable bit rate nature of
normal voice conversations, a high level of statistical multiplexing gain can be achieved
when multiplexing a number of voice channels onto a single voice trunk using AAL2.
The exact level of statistical multiplexing gain achievable is a function of the nature of
the individual voice sources and also depends on the strict QoS delay requirements of
the voice packets within the multiplexer service queue.
In this chapter, we examine the effects of source sensitivity on the performance of the
AAL2 multiplexer by considering sources that exhibit different characteristics to the
On/Off model described in Section 3.1.1.1. The desired behaviour of a source can be
obtained by enforcing its traffic through some form of usage parameter control. A
common Usage Parameter Control (UPC) and the selection of its parameters will be
described in this chapter.
5.1 Simulation Example
The simulation example under consideration is modelled using the single-queued
general AAL2 multiplexer described in Section 3.1.2. Source packet generation
characteristics such as packetisation time T, packet length L, mean talk and silence
periods of a conversation and link service rate parameters used in the simulation study
are shown in Table 12. Packets from all voice connections enter the multiplexer and are
placed into the service queue in a FCFS scheduling manner.

CHAPTER 5 SOURCE SENSITIVITY
MANAGEMENT OF LOW AND VARIABLE BIT RATE ATM ADAPTATION LAYER TYPE 2 TRAFFIC
90
Simulation parameters Values
Packetisation (T) 5ms (i.e. 32kb/s E-ADPCM [68]
Packet length (L) 184 (20 byte payload + 3 bytes AAL2 header)
Talk interval [51] Negative Exponential
(mean = 420ms)
Silence interval [51] Negative Exponential
(mean = 580ms)
Service rate (R) T1(1.536Mb/s)
Table 12: Simulation attributes for simulation example.
As previously mentioned, the number of voice sources that the multiplexer can support
is dependent on both the aggregate service rate and the QoS requirements of the
individual sources (i.e. Dα and α as described in Section 2.2.2). For the purposes of this
study, typical values of α=10-3 and Dα=20ms are chosen [34]. Using the simulation
parameters in Table 12 the delay curves for a test stream were measured as a function of
the total number of sources admitted into the multiplexer. These results are shown in
Figure 34. From this figure it can be seen that a maximum of 75 sources can be
accommodated in the multiplexer while maintaining the specified QoS requirements.
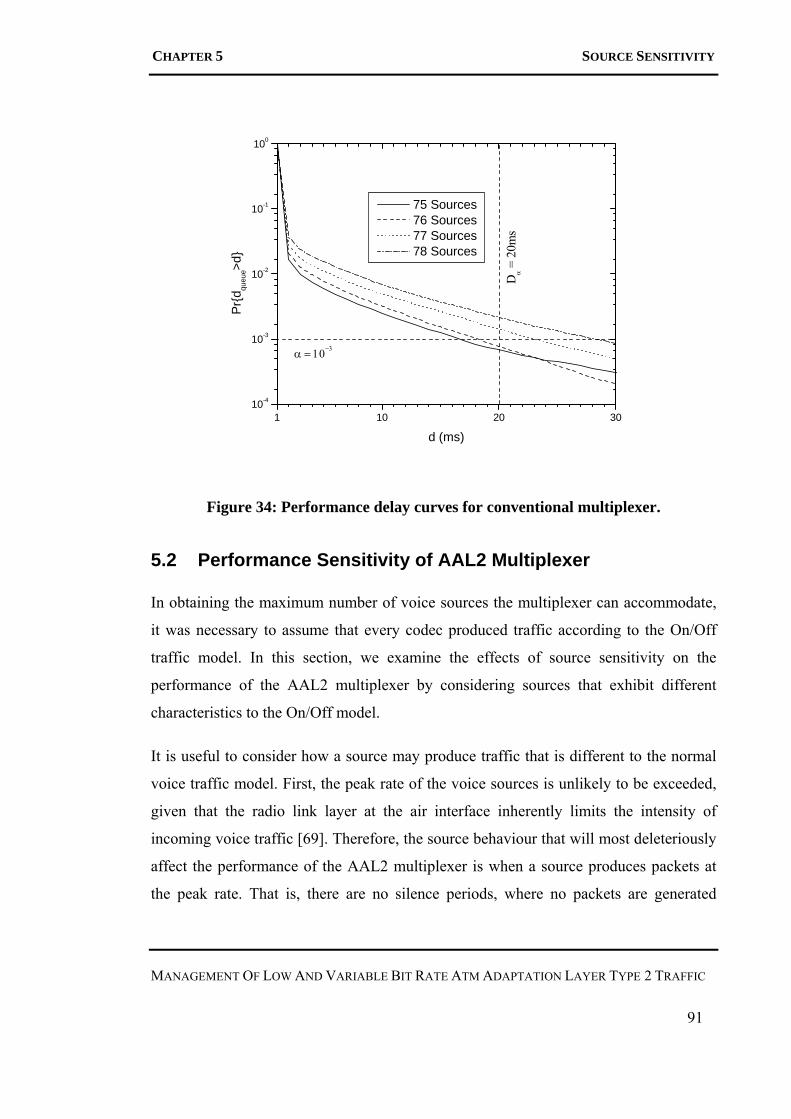
CHAPTER 5 SOURCE SENSITIVITY
MANAGEMENT OF LOW AND VARIABLE BIT RATE ATM ADAPTATION LAYER TYPE 2 TRAFFIC
91
1 10 20 3010-4
10-3
10-2
10-1
100
Dα =
20m
s
α = 10−3
Pr{d
queu
e>d}
d (ms)
75 Sources 76 Sources 77 Sources 78 Sources
Figure 34: Performance delay curves for conventional multiplexer.
5.2 Performance Sensitivity of AAL2 Multiplexer
In obtaining the maximum number of voice sources the multiplexer can accommodate,
it was necessary to assume that every codec produced traffic according to the On/Off
traffic model. In this section, we examine the effects of source sensitivity on the
performance of the AAL2 multiplexer by considering sources that exhibit different
characteristics to the On/Off model.
It is useful to consider how a source may produce traffic that is different to the normal
voice traffic model. First, the peak rate of the voice sources is unlikely to be exceeded,
given that the radio link layer at the air interface inherently limits the intensity of
incoming voice traffic [69]. Therefore, the source behaviour that will most deleteriously
affect the performance of the AAL2 multiplexer is when a source produces packets at
the peak rate. That is, there are no silence periods, where no packets are generated

CHAPTER 5 SOURCE SENSITIVITY
MANAGEMENT OF LOW AND VARIABLE BIT RATE ATM ADAPTATION LAYER TYPE 2 TRAFFIC
92
within a source session. This will increase both the loading on the service queue and the
delays experienced by packets within that queue. A source may behave this way or in a
similar way for a number of reasons, for example:
• Hardware fault (e.g. Microphone) which, causes the voice codec to produce packets
always at the peak rate.
• The voice codec could be behaving correctly but on average, the voice activity is
high. E.g. Different speech patterns due to cultural background differences.
• Malicious users.
We now examine the effect on delay performance when a number of sources generate
constant rate traffic. In Figure 35 we show the effect of the delay performance of a test
stream within the AAL2 multiplexer system examined in Section 5.1 when 1, 2, and 10
out of a total of 75 sources admit traffic into the multiplexer constantly at the peak rate.
This figure shows an immediate and significant degradation in delay performance when
particular sources exhibit behaviour different to the assumed On/Off traffic model. In
fact it can be seen from Figure 35 that when only 2 sources exhibit constant packet
generation behaviour the delay performance of the test stream no longer meets the
specified QoS requirements (i.e. Dα=20ms and α=10-3). It is undesirable for the
multiplexer to be so sensitive to source behaviour and therefore some form of source
isolation is required. This will allow the multiplexer to guarantee performance to a
normal behaving source independent of the behaviour of other sources.

CHAPTER 5 SOURCE SENSITIVITY
MANAGEMENT OF LOW AND VARIABLE BIT RATE ATM ADAPTATION LAYER TYPE 2 TRAFFIC
93
1 5 10 15 2010-4
10-3
10-2
10-1
100
Pro
b{de
lay>
d}
d (ms)
Original (75 Sources) 1 Constant Rate Source 2 Constant Rate Sources 10 Constant Rate Sources
Figure 35: Performance of AAL2 multiplexer for 1, 2 and 10 misbehaving sources.
5.3 Usage Parameter Control (UPC)
In the previous section we saw that if the AAL2 multiplexer is to guarantee a delay
bound it cannot merely assume a particular source behaviour but must be able to enforce
that behaviour. In other words, some form of Usage Parameter Control (UPC)
monitoring of the traffic on each connection is required. The function of the UPC is to
unconditionally discard packets from a connection where the call parameters are
exceeded thereby enabling the multiplexer to make guarantees to a connection
independent of the behaviour of other connections [51] [70] [71]. This is shown in Figure
36.

CHAPTER 5 SOURCE SENSITIVITY
MANAGEMENT OF LOW AND VARIABLE BIT RATE ATM ADAPTATION LAYER TYPE 2 TRAFFIC
94
Voice sources
AAL2 Multiplexer
2 1 n
Policer Policer Policer
FCFS Queue
Service Rate, R (bits/sec)
To ATM layer
Figure 36: Source policing.
Referring to Figure 36, packets from each source are individually policed according to a
set of policer parameters. Conforming packets enter the AAL2 multiplexer while non-
conforming packets are discarded, thus allowing the output traffic from each connection
to exhibit the desired On/Off characteristics. The most common UPC (and also being
used here) is the token bucket policer. This is described in the following sub-section.
5.3.1 Token Bucket Policer
The token bucket policer has three traffic descriptors associated with it. These are the
peak packet rate (PPR), sustainable packet rate (SPR) and maximum burst size (MBS).
The first parameter, peak packet rate (PPR) is associated with the peak rate at which
packets from a connection can enter the multiplexer. In terms of a codec’s packetisation
time, T, this is defined as
1PPRT
= (5.1)
The second parameter, sustainable packet rate (SPR) represents the long-term average
input rate the policer will allow source packets through as conforming traffic. In

CHAPTER 5 SOURCE SENSITIVITY
MANAGEMENT OF LOW AND VARIABLE BIT RATE ATM ADAPTATION LAYER TYPE 2 TRAFFIC
95
principle, the value of this parameter can be chosen from between the sources’ long-
term average rate and the PPR. However if the sum of the SPRs for all connections
entering the AAL2 multiplexer is greater than the service rate, R, then the total load on
the service queue can be greater than unity. To avoid the possibility of service queue
overload, the SPR parameter is considered as the maximum rate that the server can
guarantee service to a connection independent of the behaviour of other connections.
From this definition, and assuming all connections are of the same type with identical
SPR specifications, the maximum value for the SPR of individual connections will be
given by
max
RSPRn
= (5.2)
where nmax is the maximum number of individual connections that can be admitted into
the AAL2 multiplexer. Equivalently, given the specified SPR of a connection, the total
number of connections that can be admitted into the multiplexer without the possibility
of service queue overload is given by (5.3) via rewriting of (5.2).
maxRn
SPR=
(5.3)
The final parameter to be specified is the maximum burst size (MBS). This parameter in
conjunction with the SPR must be chosen by the network service provider such that
there is low probability that normal On/Off voice traffic through the policer is declared
non-compliant. Some studies have investigated the choice of token bucket parameters
for On/Off voice sources [72] [73]. These studies have concluded that it is very difficult
to choose meaningful parameters. Their studies have shown that either the SPR must be
chosen very close to the PPR or the MBS must be chosen very high (i.e. greater than
5000 packets when SPR equals the long term average rate of sources).
The token bucket polices traffic based on the algorithm model shown in Figure 37.

CHAPTER 5 SOURCE SENSITIVITY
MANAGEMENT OF LOW AND VARIABLE BIT RATE ATM ADAPTATION LAYER TYPE 2 TRAFFIC
96
Packet arrival time, ta
ta < TATPPR -
τ
Conforming packet TATPPR = max(ta, TATPPR) + TPPRTATSPR = max(ta, TATSPR) + TSPR
Next packet
Non-conforming packet
No
Yes
No ta < TATSPR - τIBT voice source
Yes
Figure 37: Token bucket algorithm.
Referring to Figure 37, when a packet arrives, it is first tested for peak packet rate
conformance. This is achieved by comparing its arrival time ta with its theoretical
arrival time denoted by TATPPR less the tolerance τ. The value of TATPPR is equal to the
interarrival time T and the tolerance τ is to account for the jitter effect due to timing
differences when sending packets. If the packet is found conforming to the peak packet
rate, it is then tested for sustainable packet rate conformance by comparing the value of
ta with the value obtained from subtracting the Intrinsic Burst Tolerance denoted by
τIBT voice source from the theoretical arrival time associated with the sustainable packet rate
denoted by TATSPR. A packet is declared non-conforming when it fails either tests and is

CHAPTER 5 SOURCE SENSITIVITY
MANAGEMENT OF LOW AND VARIABLE BIT RATE ATM ADAPTATION LAYER TYPE 2 TRAFFIC
97
discarded. However when packets are conforming, the TATPPR and TATSPR values are
updated. Note the intrinsic burst tolerance τIBT voice source in Figure 37 is defined as
( ) 1 11IBT voice source MBS
SPR PPRτ ⎛ ⎞= − −⎜ ⎟
⎝ ⎠
(5.4)
5.3.2 Selection of Token Bucket Parameters
From the previous descriptions in Section 5.3.1, the selection of the appropriate token
bucket parameters for the simulation example are described in this section. The first
bucket parameter to be determined is the peak packet rate (PPR) and is calculated using
the packetisation value in Table 12 and (5.1) as
10.005200 packets/sec
PPR =
=
(5.5)
The SPR is calculated by first obtaining the number of sources that can be admitted into
the AAL2 multiplexer. In Figure 34, it is observed that 75 sources (i.e. nmax) can be
admitted into the AAL2 multiplexer while meeting the QoS requirements. From this
nmax value and the service rate in Table 12, the following SPR is calculated using (5.2)
as
61.536 1075
111 packets/sec
SPR ×=
=
(5.6)
Using the SPR value obtained in (5.6), the violation probability of packets generated
according to the On/Off traffic model through a policer as a function of the SPR and
MBS has been measured through simulation and is shown in Figure 38.

CHAPTER 5 SOURCE SENSITIVITY
MANAGEMENT OF LOW AND VARIABLE BIT RATE ATM ADAPTATION LAYER TYPE 2 TRAFFIC
98
200 400 600 800 1000 1200 1400 1600 180010-5
10-4
10-3
10-2
10-1
100
MBS = 1440 packets/sec
Vio
latio
n P
roba
bilit
y
Maximum Burst Size (MBS)
SPR = 111 pps(nmax = 75 sources)
Figure 38: Influence of SPR and MBS on the violation probability of a token
bucket policer.
The selection of a MBS value is obtained by choosing a suitable violation probability
such that voice quality is still acceptable after being policed. It is assumed that a
violation probability of 10-4 will give acceptable voice quality. In Section 5.3.4 where
source policing is performed in an actual experiment, it is observed that choosing this
violation probability results in acceptable voice quality. Referring to Figure 38, the
violation probability of 10-4 corresponds to a MBS of 1440 packets. The token bucket
parameters for this simulation study are summarised in Table 13.

CHAPTER 5 SOURCE SENSITIVITY
MANAGEMENT OF LOW AND VARIABLE BIT RATE ATM ADAPTATION LAYER TYPE 2 TRAFFIC
99
Token bucket parameters Values
PPR 200 packets/sec
SPR 111 packets/sec
MBS 1440 packets
Table 13: Token bucket parameters for a VBR voice source.
5.3.3 Simulation with Obtained Token Bucket Parameters
Upon obtaining the token bucket parameters, we now consider the delay performance of
the multiplexer with the presence of appropriate UPCs. Using Figure 36 and with the
simulation parameters shown in Table 12, the delay curves of a test stream within the
AAL2 multiplexer when 1, 2, and 10 out of a total of 75 sources admit traffic into the
multiplexer constantly at the peak rate are shown in Figure 39. We note that the delay
performance when the UPC is present is much less sensitive to misbehaving sources
compared to the case when no UPC is used (see Figure 34). In fact, it can be seen from
Figure 39 that the QoS requirements of Dα=20ms and α=10-3 are met even when there
are 10 sources presenting traffic to the multiplexer constantly at the peak rate.

CHAPTER 5 SOURCE SENSITIVITY
MANAGEMENT OF LOW AND VARIABLE BIT RATE ATM ADAPTATION LAYER TYPE 2 TRAFFIC
100
1 2 3 4 5 6 7 8 9 10 11 12 13 14 15 16 17 18 19 201E-5
1E-4
1E-3
0.01
0.1
1
Pro
b{de
lay>
d}
d (ms)
Original (75 sources) Policer - 1 Peak Source Policer - 2 Peak Source Policer - 10 Peak Source
Figure 39: Performance delay curves for misbehaving sources with policer.
The simulation studies described above have shown that implementing a token bucket
policer enables sources to be isolated such that the behaviour of one source has only a
small effect on other sources, thus maintaining QoS guarantees for each connection. In
the next section, a software implementation of the token bucket policer is carried out in
an experiment involving some pre-recorded conversation samples. Descriptions for the
selection of appropriate token bucket parameters in policing these conversation samples
are presented.
5.3.4 Practical Policing Experiment
In the previous section, the MBS policing parameter used for voice sources was
obtained by measuring the violation probability of a theoretical On/Off voice source
through the policer. In this section, an attempt is made to verify the choice of the
policing parameters by applying them to real voice sources.

CHAPTER 5 SOURCE SENSITIVITY
MANAGEMENT OF LOW AND VARIABLE BIT RATE ATM ADAPTATION LAYER TYPE 2 TRAFFIC
101
In this experiment, conversation samples are taken between two test subjects; one of
which is in the laboratory room and the other which is located in a remote location. A
microphone connected to the computer is set up in the laboratory room to record a one
way conversation (i.e. only the voice of the test subject in the laboratory room is
recorded) using 64kb/s Pulse Code Modulation (PCM). Factors (i.e. outside noises and
echoes in the room) that degrade the conversation are kept minimal. Some recorded
voice samples and their associated voice activity are shown in Table 14 (see Appendix
C for silence suppression parameters).
Voice sample Voice activity (%)
Conversation A 50.7
Conversation B 44.8
Conversation C 39.3
Reading a book 91.1
Table 14: Voice activity for some recorded voice samples.
Referring to Table 14, voice activities of these samples correspond to those in [34] [52].
It ranges from 30% to 50% for a normal conversation while for a one-way conversation
such as reading a book, voice activity is well over 50%. For this experiment, we have
chosen conversation A to be policed. Using the token parameters shown in Table 13, the
violation probability is experimentally measured and the resultant curve is obtained and
plotted in Figure 40. This figure also shows two additional violation probability curves:
the curve obtained when a theoretical modelled voice source is used with a voice
activity of 42% (see Figure 38) and when a theoretical modelled voice source is used
but with a voice activity of 50%.

CHAPTER 5 SOURCE SENSITIVITY
MANAGEMENT OF LOW AND VARIABLE BIT RATE ATM ADAPTATION LAYER TYPE 2 TRAFFIC
102
500 1000 1500 2000 25001E-5
1E-4
1E-3
0.01
0.1
MBS = 1440
Violation Probability = 4x10⁻³
MBS = 2010
Violation Probability = 10-4
Viol
atio
n Pr
obab
ility
MBS (Packets)
Theoretical (50% activity) Experiment (50% activity) Theoretical (42% activity)
Figure 40: Comparisons of violation probability.
Referring to Figure 40, it is observed that the curve obtained from Figure 38 does not
match the curve for conversation A. This can be explained by the fact that the voice
activity for conversation A is much higher than the 42% voice activity shown in Figure
38. The violation probability curve for conversation A matches that of the theoretically
modelled case for 50% voice activity.
When applying the MBS obtained in Section 5.3.2 for the conversation A in Figure 40
together with a SPR of 111 packets/sec, a violation probability of 4×10⁻³ is
experimentally measured. When this policer is used, it was noted that voice blurring can
be heard at the end of each long talk interval due to packet discard. This can be
eliminated by choosing a larger MBS value which gives a smaller violation probability.
It was experimentally measured that the minimum required MBS to achieve good voice
quality is 2010 packets (which corresponded to an experimentally measured violation
probability of 10-4). Similar procedures are required to obtain suitable token bucket

CHAPTER 5 SOURCE SENSITIVITY
MANAGEMENT OF LOW AND VARIABLE BIT RATE ATM ADAPTATION LAYER TYPE 2 TRAFFIC
103
parameters for other voice samples shown in Table 14. This is due to fluctuations in
voice activities between different conversations. The experiments carried out above
highlight the difficulties in choosing appropriate policing parameters (especially the
MBS values) for real life VBR voice sources.
5.4 Conclusion
Due to the variable bit rate nature of voice, sources that do not conform to the expected
On/Off behaviour will affect the performance of the AAL2 multiplexer. Source isolation
between sources is required to eliminate the effects of non-conforming sources in the
form of the usage parameter control (UPC). A common UPC is the token bucket
policer. Through the appropriate policer parameters, degradation of the AAL2
multiplexer performance due to non-conforming sources is less significant. Also, the
multiplexer is able to achieve high statistical multiplexing gain while maintaining QoS
guarantees to individual voice connections.
When policing sources, different sets of UPC parameters are required due to the VBR
nature of voice. In the next chapter, we examine the effectiveness of source policing by
considering the worst case traffic behaviour that can pass the UPC and re-evaluate the
delay performance of the AAL2 multiplexer.

CHAPTER 6 ALTERNATIVE MULTIPLEXING METHOD
MANAGEMENT OF LOW AND VARIABLE BIT RATE ATM ADAPTATION LAYER TYPE 2 TRAFFIC
104
Chapter 6
Alternative Multiplexing Method
In Chapter 5, we observed that the behaviour of a source has a significant impact on the
delay performance of the AAL2 multiplexer when it exhibits traffic generating
characteristics different to the conventional On/Off model (i.e. non-conforming
sources). This also impacts on the performance of the conforming sources. Therefore to
maintain QoS guarantees to all connections, it is necessary to enforce a source’s
behaviour through some form of Usage Parameter Control (UPC). A common UPC is
the token bucket policer. Through the appropriate token bucket parameters (i.e. PPR,
SPR and MBS), source isolation is achieved and QoS guarantees can be maintained.
In this chapter, we re-evaluate the performance of the AAL2 multiplexer by considering
the worst case traffic behaviour that can pass the UPC. This is achieved by obtaining the
number of sources that can be accommodated using the derived worst case delay within
the multiplexer. From these results we determine if statistical multiplexing is a suitable
method for increasing link utilisation.
6.1 Simulation Example
The simulation example is based on the model shown in Figure 41 using E-ADPCM
codecs. Voice conversations are assumed to exhibit On/Off characteristics with mean
talk interval of 400ms and mean silence interval of 600ms. Source traffic is individually
policed before being sent to the AAL2 multiplexer that services packets in a FCFS
scheduling manner and at a rate equal to the T1 link (i.e. 1.536Mb/s). These simulation

CHAPTER 6 ALTERNATIVE MULTIPLEXING METHOD
MANAGEMENT OF LOW AND VARIABLE BIT RATE ATM ADAPTATION LAYER TYPE 2 TRAFFIC
105
parameters are summarised in Table 15.
Voice sources
AAL2 Multiplexer
2 1 n
Policer Policer Policer
FCFS Queue
Service Rate, R (bits/sec)
To ATM layer
Figure 41: Simulation model for source policing.
Simulation Parameters Values
Packetisation Time 5ms (E-ADPCM)
AAL2 Packet Length 184 bits (20 byte payload and 3 byte AAL2 header)
Talk Interval Negative exponential with mean 400ms
Link Service Rate, R T1 (1.536Mb/s)
Table 15: Simulation attributes for conventional voice and data multiplexing.
In Figure 42 the resultant probability delay curves are shown for a test stream when
different numbers of voice sources are presented to the multiplexer. This figure
indicates that under the conditions outlined in Table 15, the maximum number of
sources that can be multiplexed while maintaining the required QoS in delay variation
of α=10-3 and Dα=15ms (see Section 2.2.2) is 77 sources. Note that these are typical
scenario values as illustrated in Section 3.2.

CHAPTER 6 ALTERNATIVE MULTIPLEXING METHOD
MANAGEMENT OF LOW AND VARIABLE BIT RATE ATM ADAPTATION LAYER TYPE 2 TRAFFIC
106
0 10 20 30-5
-4
-3
-2
-1
0
Dα = 15 ms
α = 10-3
log(
Pr {d
elay
> d
})
d (ms)
n = 79 sources n = 78 sources n = 77 sources
Figure 42: Delay curves for FCFS multiplexing scheme.
From the results obtained in Figure 42, the level of statistical multiplexing gain (SMG)
can be determined using (3.6). The number of connections allowed with peak rate
allocation denoted as npeak_rate is given by
( ) ( )
peak_rate
6
3
Service RateSource Peak Rate
1.536 10184 5 10
41 sources
n
−
⎢ ⎥= ⎢ ⎥⎣ ⎦⎢ ⎥×⎢ ⎥=
×⎢ ⎥⎣ ⎦=
(6.1)
Therefore the level of SMG that is achievable is 1.88. This value indicates that a
significant increase in the number of sources can be admitted into the multiplexer when
statistical multiplexing is employed. However, the SMG is only possible when it is
based on the assumption that all of these sources exhibit the desired On/Off traffic
generating characteristics (i.e. are conforming sources) or that only a small number of

CHAPTER 6 ALTERNATIVE MULTIPLEXING METHOD
MANAGEMENT OF LOW AND VARIABLE BIT RATE ATM ADAPTATION LAYER TYPE 2 TRAFFIC
107
sources are non-conforming at a time. In the following section, we re-evaluate the delay
performance of the AAL2 multiplexer by considering the worst case traffic behaviour
that is passed by the UPC.
6.2 Worst Case Behaviour of the Token Bucket Parameters
In the analysis to obtain the worst case multiplexer delay, we assume that there are nmax
active connections into the multiplexer and that each connection is policed with
identical sets of token bucket parameters; PPR, SPR and MBS (see Section 5.3.1). For
the FCFS scheduling queue shown in Figure 41, the worst case traffic behaviour occurs
when a burst of packets equal to the MBS arrives at the multiplexer from each
connection at the same time [74].
For this case, the duration of a burst of size MBS packets denoted by TMBS is
( )1MBS
MBST
PPR−
= (6.2)
The total number of packets denoted as Ntotal arriving from nmax active connections
during the time TMBS is then
maxtotalN n MBS= × (6.3)
From (5.3) in Section 5.3.1, the multiplexer service rate R is
maxR n SPR= × (6.4)
The number of packets denoted by NB that can be served in time TMBS is
( ) 1B MBSN T R= × + (6.5)
The unity term in (6.5) appears since we assume that the first packet is served
immediately upon its arrival into the multiplexer. The number of packets left in the
CHAPTER 6 ALTERNATIVE MULTIPLEXING METHOD
MANAGEMENT OF LOW AND VARIABLE BIT RATE ATM ADAPTATION LAYER TYPE 2 TRAFFIC
108
service queue after the last packet of any connection’s burst arrives denoted as NL is
L total BN N N= − (6.6)
The last packet of the last connection’s burst will then be served at a time
maxLN
Rτ =
(6.7)
after its arrival into the multiplexer service queue. Using (6.2) to (6.6), (6.7) can be re-
written as
max phase IBT voice sourceτ τ τ= + (6.8)
where
( )max1 1phase nR
τ = − (6.9)
and
( ) 1 11IBT voice source MBS
SPR PPRτ ⎛ ⎞= − −⎜ ⎟
⎝ ⎠
(6.10)
Equation (6.8) represents the worst-case delay within the multiplexer using the FCFS
service discipline. It consists of two different delay components. The first delay
component, τphase arises due to phase coincidences of packet arrivals into the service
queue. The second component, τIBT voice source arises when a connection’s minimum
guaranteed service rate is less than its peak rate and thus is associated with smoothing
delay within the multiplexer service queue. This component of delay is expected to be
the dominant of the two.
Although (6.8) described the maximum delay for a FCFS service discipline, other types
of service disciplines within the multiplexer can be considered. A list of delay bounds

CHAPTER 6 ALTERNATIVE MULTIPLEXING METHOD
MANAGEMENT OF LOW AND VARIABLE BIT RATE ATM ADAPTATION LAYER TYPE 2 TRAFFIC
109
for some rate based scheduling disciplines that have appeared in the literature is given in
Table 16. In all the studies listed in Table 16, it was assumed that the input traffic
conformed to the token bucket parameters (PPR, SPR, MBS) as it is presented to the
network. Given this assumption, the second term in each of the bounds in Table 16 turns
out to be the τIBT voice source of the signal, as given by (6.10). Also note that the bound on
this smoothing delay is independent of the behaviour of other real time signals. The first
term in each of the bounds given in Table 16 is that associated with phase coincidences
of packet arrivals and its value depends on the actual scheduler being used.
Scheduling disciplines Variable delay bounds
Parekh-Gallager [7] PGPS PGPSphase IBTD τ τ< +
Golestani [8] SCFQ SCFQphase IBTD τ τ< +
Stiliadis-Varma [9] LR LRphase IBTD τ τ< +
Goyal-Vin-Cheng [10] SFQ SFQphase IBTD τ τ< +
Table 16: Variable delay bounds for various scheduling disciplines.
For a given peak packet rate PPR, service rate R, and acceptable loss probability α, the
following procedure can now be followed to determine the maximum delay in the
multiplexer as a function of the number of sources admitted into the multiplexer.
1. Choose a value for maximum number of allowed sources, nmax.
2. Using (5.2), determine the maximum value of SPR that can be allocated to
individual voice connections.
3. Using the value of SPR obtained from the above step, choose the value of MBS
that will achieve the acceptable violation probability α.
4. Use (6.8) to calculate the worst case delay.

CHAPTER 6 ALTERNATIVE MULTIPLEXING METHOD
MANAGEMENT OF LOW AND VARIABLE BIT RATE ATM ADAPTATION LAYER TYPE 2 TRAFFIC
110
Applying the above procedure to the simulation example in this chapter, the maximum
delay through the AAL2 multiplexer under worst case traffic conditions is shown in
Figure 43.
40 50 60 70 80100
101
102
103
104
n = 42
n = 43
Dα = 15msMax
imum
Dela
y (m
s)
Number of Sources
Figure 43: Maximum delay through AAL2 multiplexer under worst case input
traffic behaviour.
Figure 43 indicates the maximum number of sources that can be multiplexed while
maintaining the required QoS in delay variation (i.e. α=10-3 and Dα=15ms) is 42
sources which represents only one additional source that is achievable over peak rate
allocation (see (6.1)). The level of statistical multiplexing gain that this represents is
calculated to be 1.02. This indicates that a significantly lower value of statistical
multiplexing gain is obtained when the worst case traffic behaviour of the multiplexer is
considered than when a particular source behaviour is assumed and not policed [74].
Also these results indicate that policing this type of VBR voice traffic is only
meaningful at the peak packet rate, and therefore peak rate allocation is the only
alternative. To increase link efficiency, alternative methods other than statistical

CHAPTER 6 ALTERNATIVE MULTIPLEXING METHOD
MANAGEMENT OF LOW AND VARIABLE BIT RATE ATM ADAPTATION LAYER TYPE 2 TRAFFIC
111
multiplexing of voice sources must be examined. This is shown in the next section.
6.3 Future Work - Integrated Multiplexing Scheme
In this section, we propose an alternative multiplexing scheme called integrated
multiplexing where the QoS can still be guaranteed to each and every voice connection.
With this scheme, bandwidth utilisation is increased by integrating low volume data
applications with voice within the ATM channel or within the AAL2 channel.
Figure 44 shows data and voice integration within the ATM channel. Note that we have
assumed the total traffic from both voice and data do not exceed the service rate of the
queue. Referring to this figure, data packets and voice packets are queued into different
prioritised FCFS queues within the AAL2 multiplexer where voice is assigned higher
priority than data. Upon an ATM cell transmission boundary, the ATM cell creation
function obtains AAL2 packets from the higher priority queue and forms a CPS PDU
for insertion into the ATM cell payload. AAL2 packets are only taken from the low
priority queue (i.e. data application) when the high priority queue (i.e. voice) is empty.
Bandwidth starvation for the low priority sources is avoided by limiting the number of
high priority sources admitted into the AAL2 multiplexer (see Chapter 4).

CHAPTER 6 ALTERNATIVE MULTIPLEXING METHOD
MANAGEMENT OF LOW AND VARIABLE BIT RATE ATM ADAPTATION LAYER TYPE 2 TRAFFIC
112
Data Sources Voice Sources
1 n 1 m
Low Priority
High Priority FCFS Queue FCFS Queue
ATM
Figure 44: Integration of data and voice within ATM channel.
The advantage of this method is that during silence periods, the entire link bandwidth
can be used to send data packets resulting in relatively low packet delays. However,
when using this integration method and fixed queue size, data packet losses are
expected.
Another method under the integrated multiplexing scheme is to integrate data and voice
within the AAL2 channel. This is shown in Figure 45. We have also assumed the total
traffic from both voice and data do not exceed the service rate of the queue. Referring to
this figure, each voice source has an in-built voice activity detector (VAD) that detects
silence periods and sends segmented data packets. Note that we have assumed constant
data packet generation that is independent of voice packet generation. In each source, a
small buffer is used for storing data packets and is required to prevent packet discard
during speech activity. Both data and voice packets are then sent to a FCFS queue and
served at a constant rate.

CHAPTER 6 ALTERNATIVE MULTIPLEXING METHOD
MANAGEMENT OF LOW AND VARIABLE BIT RATE ATM ADAPTATION LAYER TYPE 2 TRAFFIC
113
ATM
Voice Packet
Data Packets
VAD
Data Packets
Voice Packet
VAD
Sources
FCFS Queue Data packets queued. Segmented packets send during silence periods
AAL2 Multiplexer
Figure 45: Integration of data and voice within AAL2 channel.
This method has not been realised in any technologies. However, the 3G mobile
networks show certain capabilities of incorporating small volume data applications with
voice within the same AAL2 channel. Hence it is proposed to use 3G as the platform to
carry out this multiplexing method. The implementation of this scheme requires the use
of reserved values within the 3G headers. At the source, both voice packets and data
packets are each prepended with a 3G header that contains a specific reserved frame
number within the range 10 to 13 in the Frame Type field [75]. An example of this is to
select reserved frame number 10 for voice traffic and reserved frame number 11 for data
traffic. This field indicates to the codec the type of information contained in the packet.
These packets are then AAL2 encapsulated and multiplexed into AAL2 CPS PDU cells
before being transported across the network. At the destination, associated AAL2
headers are stripped and the packets are then passed to the appropriate 3G receivers.
These receivers are able to distinguish between voice packets and data packets based on
the frame numbers in the Frame Type field and to play these packets accordingly.

CHAPTER 6 ALTERNATIVE MULTIPLEXING METHOD
MANAGEMENT OF LOW AND VARIABLE BIT RATE ATM ADAPTATION LAYER TYPE 2 TRAFFIC
114
Some application examples of this multiplexing scheme include multiparty multimedia
conferencing, picture phones, multimedia bulletin boards and multimedia mail, file
transfer during speech, automated teller machines with voice support, credit card
verification and other small volume data applications [53].
The advantage with this method is that packet loss is non-existent as the data buffer in
the 3G source can never overflow. The packet delay is much larger than those
experienced in the AAL2 multiplexer when data and voice are integrated within the
ATM channel, as data packets can only be sent during silence periods of the
conversations. This is acceptable as the performance of data applications is dependent
only on packet loss. Therefore this method not only increases the link efficiency but
also achieves a better performance for low volume data applications.
6.4 Conclusion
In this chapter, we have re-evaluated the delay performance of the AAL2 multiplexer by
considering the worst case traffic behaviour. It was shown that under worst case
conditions, the statistical multiplexing gain that is achievable is significantly lower and
results in only one additional source over the 41 sources that can be accommodated over
peak rate allocation. An alternative multiplexing method has been proposed (i.e.
integrated multiplexing). Under this multiplexing scheme, link utilisation is increased
by integrating low volume data applications with voice within the ATM channel or
within the AAL2 channel. It is observed that the integration of voice and data within the
AAL2 channel achieves better performance for the data applications in terms of packet
loss.

CHAPTER 7 CONCLUSION
MANAGEMENT OF LOW AND VARIABLE BIT RATE ATM ADAPTATION LAYER TYPE 2 TRAFFIC
115
Chapter 7
Conclusion
AAL2 has been developed to efficiently carry low and variable bit rate traffic such as
voice and small data applications. It is able to achieve high packing efficiency without
incurring additional packet delay. Due to its multiplexing capability, AAL2 has found
its place in many recent mobile technologies such as CDMA and 3G. In this thesis, the
delay performance of AAL2 multiplexers and in particular the traffic management
issues associated with the multiplexer was examined. The specific and original
outcomes of this thesis are:
• A QoS framework for the study of AAL2 voice multiplexers was developed.
The QoS framework is defined by three parameters: fixed delays, delay variation
(denoted by Dα) and packet loss (denoted by α). When delay Dα is set as the
maximum buffer size, packets that experience delay greater than this will find
the buffer full and are then discarded. In this case, the fraction of packets that
will experience delay greater than Dα (denoted as α) becomes the loss
probability. Therefore when using the QoS framework, the number of
connections over a fixed link rate can be determined for any given set of QoS
requirements (i.e. maximum delay Dα and packet loss α).
• The performance limitation of the conventional AAL2 multiplexer system for
the transportation of VBR voice was examined. This general system consists of
input sources and the AAL2 multiplexer itself. Input sources are modelled as
voice sources that exhibit On/Off characteristics. The performance of these

CHAPTER 7 CONCLUSION
MANAGEMENT OF LOW AND VARIABLE BIT RATE ATM ADAPTATION LAYER TYPE 2 TRAFFIC
116
voice sources is measured in terms of the MOS and the intrinsic R. When
measuring the performance of the single queue AAL2 multiplexer, statistical
multiplexing is used. It was observed that through statistical multiplexing, more
sources can be accommodated by the multiplexer than the number of sources
that could be allocated peak rate, thus increasing bandwidth utilisation.
• An extension of the conventional AAL2 multiplexer in the form of prioritised
multiplexer to achieve higher bandwidth utilisation was proposed and examined.
This prioritised multiplexer isolates the multiplexing requirements between
different sources and offers a modest (9%) increase in the statistical
multiplexing gain.
• The performance sensitivity of the AAL2 multiplexer with respect to input voice
traffic was examined. Significant degradation to the delay performance of the
AAL2 was observed when sources exhibit traffic generation characteristics
different to the On/Off voice model.
• Source policing of VBR voice sources are examined. It was observed that when
statistical multiplexing is employed, the behaviour of a source must be enforced
through some form of Usage Parameter Control (UPC). This is to prevent
degradation on the delay performance of the AAL2 due to non-conforming
sources (i.e. sources that exhibit non-On/Off traffic characteristics). A common
UPC is the token bucket policer. Through the appropriate token bucket
parameters, isolation between sources is achieved and QoS guarantees can be
maintained for all connections even when a small fraction of the number of
sources is non-conforming.
• Statistical multiplexing and the extent to which it is possible for real time VBR
voice were examined. Here it was observed that statistical multiplexing is not
able to guarantee a significant gain in the number of sources that can be
accommodated by the multiplexer. In the simulation example, under the worst-

CHAPTER 7 CONCLUSION
MANAGEMENT OF LOW AND VARIABLE BIT RATE ATM ADAPTATION LAYER TYPE 2 TRAFFIC
117
case traffic scenario, only one additional source is gained over that admitted for
peak rate allocation. Therefore given that statistical multiplexing is not able to
guarantee any significant gains, it is only meaningful then to police the peak rate
of the source.
• An alternative multiplexing method to statistical multiplexing in terms of
utilising available bandwidth was proposed and described. The alternative
multiplexing method is peak rate allocation. Under this method, bandwidth
utilisation is increased by integrating small volume data applications with voice
in an ATM channel or an AAL2 channel. For the integration of data and voice in
an ATM channel, this is implemented using prioritised queues (Chapter 4). The
advantage of this method is that packet delay is much lower as the whole link is
used to send data traffic during silence periods of the voice traffic. With the
integration of data and voice in an AAL2 channel, it has been proposed that this
method be implemented based on the 3G mobile technology. Voice and small
volume data applications are distinguished by the 3G codec through the use of
reserved frame values in the 3G packet headers.
Many new low and variable bit rate applications such as picture phone and multiparty
multimedia conferencing are being introduced into mobile telephony. These
applications require guaranteed quality of service. Here AAL2 has been described as a
suitable transport mechanism to carry these traffic types across the network. It not only
achieves high packing efficiency but also low transmission delays. AAL2 has already
been deployed in the 3G networks and can be considered also for the next generation
mobile networks.

REFERENCES
MANAGEMENT OF LOW AND VARIABLE BIT RATE ATM ADAPTATION LAYER TYPE 2 TRAFFIC
118
References [1]. ITU Recommendation I.150, “B-ISDN asynchronous transfer mode (ATM)
functional characteristics”, Nov. 1993.
[2]. ITU Recommendation I.361, “B-ISDN ATM layer specification”, Nov. 1993.
[3]. ITU Recommendation F.811, “Broadband connection-oriented bearer service”,
Aug. 1992.
[4]. ITU Recommendation F.812, “Broadband connectionless data bearer service”,
Aug. 1992.
[5]. ITU Recommendation I.356, “B-ISDN ATM layer cell transfer performance”,
Feb. 1995.
[6]. F. Halsall, 1996, Data Communications, Computer Networks, and Open
Systems, 4th Edition, Addison Wesley, New York.
[7]. A.K. Parekh, R.G. Gallager, “A Generalized Processor Sharing Approach to
Flow Control in Integrated Services Networks: The Multiple Node Case”,
IEEE/ACM Transactions on Networking, vol. 2, no. 2, pp. 137-150, April 1994.
[8]. S.J. Golestani, “Network Delay Analysis of a Class of Fair Queuing
Algorithms,” IEEE Journal on Selected Areas in Communication (JSAC), vol.
13, no. 6, pp 1057-1070, Aug. 1995.
[9]. D. Stiliadis, A. Varma, “Latency-Rate servers: A General Model for Analysis of
Traffic Scheduling Algorithms”, in Proceedings of IEEE INFOCOM’96, vol. 1,
pp. 111-119, March 1996.
[10]. P. Goyal, H.M. Vin, H. Cheng, “Start-time Fair Queuing: A Scheduling

REFERENCES
MANAGEMENT OF LOW AND VARIABLE BIT RATE ATM ADAPTATION LAYER TYPE 2 TRAFFIC
119
Algorithm for Integrated Services Packet Switching Networks,” Proceedings of
SIGCOMM’96, 1996.
[11]. ITU Recommendation I.363, “B-ISDN ATM Adaptation Layer (AAL)
Specification”, Mar. 1993.
[12]. P.M. Gopal, J.W. Wong, and J.C. Majithia, “Analysis of playout strategies for
voice transmission using packet switching techniques”, Performance Evaluation
4, North-Holland, pp 11-18, 1984.
[13]. ITU Recommendation I.363.1, “B-ISDN ATM Adaptation Layer Specification:
Type 1 AAL1”, Aug. 1996.
[14]. ITU Recommendation I.363.2, “B-ISDN ATM Adaptation Layer Type 2
specification”, Nov. 2000.
[15]. ITU Recommendation I.366.1, “Segmentation and Reassembly Service Specific
Convergence Sublayer for AAL Type 2,” Jun. 1998.
[16]. ITU-T Recommendation I.366.2, “AAL Type 2 Service Specific Convergence
Sublayer for Narrow-band Services,” Nov. 2000.
[17]. The ATM Forum Technical Committee “ATM Trunking using AAL2 for
Narrowband Services AF-VTOA-0113”, Feb. 1999.
[18]. M. McLoughlin, and J. O’Neil, “A management Briefing on Adapting Voice for
ATM Networks An AAL2 Tutorial”, General DataComm, 1997.
[19]. J. H. Baldwin, B. H. Bharucha, B. T. Doshi, S. Dravida, and S. Nanda, “AAL-2
– A New ATM Adaptation Layer for Small Packet Encapsulation and
Multiplexing”, Bell Labs Technical Journal, vol. 2, no. 2, pp. 111-131, 1997.
[20]. D.W.Petr, R.R.Vatte, and Y.Q.Lu, “Efficiency of AAL2 for Voice Transport:
Simulation Comparison with AAL1 and AAL5”, in Proceedings of IEEE

REFERENCES
MANAGEMENT OF LOW AND VARIABLE BIT RATE ATM ADAPTATION LAYER TYPE 2 TRAFFIC
120
International Conference on Communications (ICC’99), Vancouver, California,
vol. 2, pp. 896-901, 1999.
[21]. N. Gerlich, and M. Ritter, “Carrying CDMA Traffic over ATM Using AAL2 A
Performance Study”, Report no. 188, University of Wũrzburg, Apr. 1998.
[22]. N. Gerlich, and M. Menth, “The Performance of AAL-2 Carrying CDMA Voice
Traffic”, in 11th ITC Specialist Seminar Yokohama, pp. 17-24, 1998.
[23]. X. Liu, S. Hu, and W. Wu, “QoS Simulation of AAL2 in CDMA/ATM Based
Mobile Systems”, in Proceedings of the International Conference on
Communication Technology (WCT-ICCT’00), vol. 1, pp. 884-887, 2000.
[24]. G. Eneroth, G. Fodor, G. Leijonhufvud, A. Racz, and I. Szabo, “Applying
ATM/AAL2 as a switching technology in third-generation mobile access
network”, IEEE Communication Magazine, vol. 37, no. 6, pp. 112-122, 1999.
[25]. J. H. Chung, Y. H. Kwon, K. H. Cho, and D. K. Sung, “Performance Evaluation
of an AAL2 Link Transmission Scheme for Voice and Data Packets in BS-BSC
Links”, in 52nd IEEE Vehicular Technology Conference (VTC’00), vol. 4, pp.
1610-1614, 2000.
[26]. S. Nananukul, Y. Guo, M. Holma, and S. Kekki, “Some Issues in Performance
and Design of the ATM/AAL2 Transport in the UTRAN”, in IEEE Wireless
Communications and Networking Conference (WCNC’00), vol. 2, pp. 736-741,
2000.
[27]. L. V. Gonzalez, S. Tsakiridou, L. O. Barbosa, and L. Lamont, “Performance
Analysis of Wireless ATM/AAL2 Over A Burst Error Channel”, in Canadian
Conference on Electrical and Computer Engineering (CCECN’01), vol. 1, pp.
703-708, 2001.
[28]. G. Fodor, G. Leijonhufvud, S. Malomsoky, and A. Racz, “Comparison of Call

REFERENCES
MANAGEMENT OF LOW AND VARIABLE BIT RATE ATM ADAPTATION LAYER TYPE 2 TRAFFIC
121
Admission Control Algorithms in ATM/AAL2 Based 3rd Generation Mobile
Access Networks”, IEEE Wireless Communications and Networking Conference
(WCNC ’99), vol. 3, pp. 1508-1512, 1999.
[29]. W. Brunnbauer and G. Cichon, “Bringing two worlds together: AAL2 over IP
for Radio Access Networks”, IEEE Global Telecommunications Conference
(GlobeCom ’01), vol. 4, pp. 2606-2610, 2001.
[30]. B. Subbiah, and Y. Raivio, “Transport Architecture for UMTS/IMT-2000
Cellular Networks”, in Proceedings of the IEEE International Conference on
Performance, Computing and Communications (IPCCC’00), pp. 208-214, 2000.
[31]. I. Szabo, S. Szekely, and I. Moldovan, “Performance Optimisation of AAL2
Signalling for Supporting Soft Handoffs in UMTS Terrestrial Radio Access
Networks”, in Proceedings of the Fifth IEEE Symposium on Computers and
Communications (ISCC’00), pp. 46-51, 2000.
[32]. O. Isnard, J. M. Calmel, A. L. Beylot, and G. Pujolle, “Handling Traffic Classes
at AAL2/ATM Layer over the Logical Interfaces of the UMTS Terrestrial Radio
Access Network”, in The 11th IEEE International Symposium on Personal,
Indoor and Mobile Radio Communications (PIMRC’00), vol. 2, pp. 1464-1468,
2000.
[33]. S. Jiang, Q. Ding, and M. Jin, “Flexible IP Encapsulation for IP over ATM with
ATM Shortcuts”, in Proceedings of IEEE International Conference on Networks
(ICON’00), pp. 238-242, 2000.
[34]. K. Sriram, and Y. T. Wang, “Voice over ATM Using AAL2 and Bit Dropping:
Performance and Call Admission Control”, IEEE Journal on Selected Areas in
Communication (JSAC), vol. 17, no. 1, pp. 18-28, Jan. 1999.
[35]. J. M. Ahn, and S. W. Seo, “Voice Over AAL2 System Using the Shared-Buffer
Scheme”, in Joint 4th IEEE International Conference on ATM and High Speed

REFERENCES
MANAGEMENT OF LOW AND VARIABLE BIT RATE ATM ADAPTATION LAYER TYPE 2 TRAFFIC
122
Intelligent Internet Symposium 2001 (ICATM’01), pp. 260-264, 2001.
[36]. C. Voo, “Performance of Statistical Multiplexed Voice over ATM using AAL2
and Deterministic Bit Dropping”, Inter-University Postgraduate Electrical
Engineering Symposium (IUPEES’00), pp. 71-74, July 2000.
[37]. C. Voo and J. F. Siliquini, “Performance Comparison of Multiplexing Methods
for Voice over ATM using AAL2”, in Proceedings of the 9th IEEE
International Conference on Telecommunications (ICT’02), vol. 1, pp. 593-597,
June, 2002.
[38]. G. Mercankosk, J. F. Siliquini, and Z. L. Budrikis, “Provision of Real-time
Services over ATM using AAL type 2”, in ACM First International Workshop
on Wireless Mobile Multimedia (WOWMOM’98), Dallas, Texas, Oct. 1998.
[39]. C. Liu, S. Munir, R. Jain, and S. Dixit, “Packing Density of Voice Trunking
Using AAL2”, IEEE Global Telecommunications Conference (GlobeCom ’99),
vol. 1b, pp. 611-615, 1999.
[40]. K. Zhang, “Packet Delay Variation in Voice Trunking Using AAL2”, ATM
Forum, Doc. 98-0630, Oct. 4-9, 1998.
[41]. T. Okutani, H. Watanabe, and T. Nisase, “Performance Evaluation of
Multiplexing AAL2 Voice Traffic and TCP/IP Data at the ATM Cell Level”,
IEEE Proceedings on ATM Workshop, pp. 391-396, 1999.
[42]. S. H. Jeong, D. K. Hsing, T. H. Wu, and J. A. Copeland, “Trunking Performance
Analysis of AAL2 for VBR Voice Transport”, in IEEE International Conference
on Communications (ICC’99), vol. 2, pp. 886-890, 1999.
[43]. H. Saito, “Bandwidth Management for AAL2 Traffic”, IEEE Transactions on
Vehicular Technology, vol. 49, no. 4, pp. 1364-1367, Jul. 2000.

REFERENCES
MANAGEMENT OF LOW AND VARIABLE BIT RATE ATM ADAPTATION LAYER TYPE 2 TRAFFIC
123
[44]. K. Sriram, T. G. Lyons, and Y. T. Wang, “Anomalies Due to Delay and Loss in
AAL2 Packet Voice Systems: Performance Models and Methods of Mitigation”,
in IEEE Journal on Selected Areas in Communication (JSAC), vol. 17, no. 1, pp.
109-123, Jan. 1999.
[45]. J. C. Wu, C. H. Huang, and R. T. Sheu, “Performance Study of AAL2 Protocol
for Low Bit-Rate Multimedia Services”, in Proceedings of the 15th
International Conference on Information Networking (IN’01), pp. 793-798,
2001.
[46]. Y. Kitamura, K. Nagato, S. Yasuda, and T. Toriyama, “Implementation of
AAL2 for Low Bit-Rate Voice over ATM”, in Proceedings of XVI World
Telecom Congress, Belgium, pp. 271-276, Fall 1997.
[47]. B. Subbiah, and S. Dixit, “ATM adaptation layer 2 (AAL2) for low bit rate
speech and data: issues and challenges”, in Proceedings of IEEE ATM
Workshop, pp. 225-233, 1998.
[48]. J. Holler, “Voice and Telephony Networking over ATM”, in Ericsson Review,
no. 1, pp. 40-45, 1998.
[49]. E. Lau, Real-Time Signal Transfer over IP Networks, Undergraduate thesis,
University of Western Australia, 2001.
[50]. K.Sriram and D.M.Lucantoni, “Traffic Smoothing Effects of Bit Dropping in a
Packet Voice Multiplexer”, IEEE Journal on Selected Areas in Communication
(JSAC), vol. 37, no. 7, pp 703-712, Jul. 1989.
[51]. M.Butto, E.Cavallero and A.Tonietti, “Effectiveness of the “Leaky Bucket”
Policing Mechanism in ATM Networks”, IEEE Journal on Selected Areas in
Communication (JSAC), vol. 9, no. 3, pp 335-342, April 1991.
[52]. F.Beritelli, A.Lomberdo, S.Palazzo and G.Schembra, “Performance Analysis of

REFERENCES
MANAGEMENT OF LOW AND VARIABLE BIT RATE ATM ADAPTATION LAYER TYPE 2 TRAFFIC
124
an ATM Multiplexer Loaded with VBR Traffic Generated by Multimode
Speech Coders”, IEEE Journal on Selected Areas in Communication (JSAC),
vol. 17, no. 1, Jan. 1999.
[53]. M.E.Perkins, et al., “Characterizing the subjective performance of the ITU-T 8
kb/s speech coding algorithm – ITU-T G.729”, IEEE Communications
Magazine, vol. 35, pp. 74-81, Sept. 1997.
[54]. H.Lee and C.Un, “A study of an on-off characterization of conversational
approach”, IEEE Transactions on Communications, vol. 34, no. 6, 1986.
[55]. Paul T. Brady, “A model for generating ON-OFF speech patterns in two-way
conversations”, Bell System Technical Journal, vol. 48, pp 2445-2472, Sept.
1969.
[56]. K. Sohraby, “On the Theory of General ON-OFF Sources with Applications in
High-Speed Networks”, INFOCOM Proceedings, Twelfth Annual Joint
Conference of the IEEE Computer and Communications Societies, Networking:
Foundation of the Future, IEEE, vol. 2, pp. 401-410, 1993.
[57]. ITU-T Recommendation G.723.1, “Annex A: Silence compression scheme”,
Nov. 1996.
[58]. ITU-T Recommendation G.109, “Definitions of Categories of Speech
Transmission Quality,” Sept. 1999.
[59]. D. D. Vleeschauwer, J. Janssen, and G. H. Petit, “Delay bounds for low bit rate
voice transport over IP networks”, in Proceedings of the SPIE conference on
Performance and Control of Network Systems III, vol. 3841, pp. 40-48, Boston,
Sept. 1999.
[60]. D. D. Vleeshauwer, J. Janssen, G. H. Petit and F. Poppe, “Quality bounds for
packetized voice transport”, Alcatel Telecommunications Review, 1st Quarter

REFERENCES
MANAGEMENT OF LOW AND VARIABLE BIT RATE ATM ADAPTATION LAYER TYPE 2 TRAFFIC
125
2000.
[61]. N. O. Johannesson, “The ETSI Computation Model: A Tool for Transmission
Planning of Telephone Networks”, IEEE Communications Magazine, Jan. 1997.
[62]. Emodel, [Homepage of ETSI], [Online]. 2001, Oct. 29-last update.
Available:http://www.etsi.org/stq/presentations/emodel.htm
[63]. V.R. Karanam, K. Sriram, and D.O. Bowker, “Performance Evaluation of
Variable-Bit-Rate voice in Packet-Switched Networks”, AT&T Technical
Journal, vol. 67, no. 5, pp. 41-56, Sept.-Oct. 1988.
[64]. A.L. Garcia, “Probability and Random Processes for Electrical Engineering”, 2nd
ed. Reading, Addison-Wesley, May 1994.
[65]. C. Voo, J. F. Siliquini, and G. Mercankosk, “Service differentiation of variable
bit rate voice in AAL2 multiplexers”, in Proceedings of IEEE Region 10
International Conference on Electrical and Electronic Technology
(TENCON’01), vol. 2, pp. 631-635, 2001.
[66]. H. Heffes and D. M. Lucantoni, “A Markov Modulated Characterisation of
Packetized Voice and Data Traffic and Related Statistical Multiplexer
Performance”, IEEE Journal on Selected Areas in Communication, vol. 4, no. 6,
pp 856-867, Sept. 1986.
[67]. ITU-T Recommendation G.723.1, “Dual rate speech coder for multimedia
communications transmitting at 5.3 and 6.3 kbit/s”, Mar. 1996.
[68]. ITU-T Recommendation G.729, “Conjugate structure-algebraic code-excited
linear prediction,” 1996.
[69]. C. Voo, J. F. Siliquini and G. Mercankosk, “Performance of AAL Type 2 Voice
Multiplexers”, Proceedings of the 9th IEEE International Conference on

REFERENCES
MANAGEMENT OF LOW AND VARIABLE BIT RATE ATM ADAPTATION LAYER TYPE 2 TRAFFIC
126
Telecommunications (ICT’02), vol. 1, pp. 1045-1049, June, 2002.
[70]. E. P. Rathgeb, “Modeling and Performance Comparison of Policing
Mechanisms for ATM Networks”, IEEE Journal on Selected Areas in
Communication (JSAC), vol. 9, no. 3, pp. 325-334, April 1991.
[71]. D. W. Petr, G. K. Vaddi, and Y. Q. Lu, “UPC Parameter Estimation Using
Virtual Buffer Measurement with Application to AAL2 Traffic”, in Proceedings
of the IEEE Global Telecommunications Conference (Globecom’99), vol. 2, pp.
1373-1379, 1999.
[72]. W. Jiang, and H. Schulzrinne, “Analysis of On-Off Patterns in VoIP and Their
Effect on Voice Traffic Aggregation”, in Proceedings of the Ninth International
Conference on Computers Communications and Networks (ICCCN’00), pp. 82-
87, 2000.
[73]. D. A. Hughes, G. Anido, H. S. Bradlow, and S. Tan, “On Average Rate
Prediction and Enforcement in B-ISDN”, in A.T.R, vol. 26, no. 2, pp. 11-19,
1992.
[74]. J. F. Siliquini, G. Mercankosk, S. Ivandich, C. Voo, Z. L. Budrikis, and A.
Cantoni, “On Statistical Multiplexing Gain for Variable Bit Rate Voice
Sources”, in Proceedings of the 8th IEEE International Conference on
Telecommunications (ICT’01), vol. 2, pp. 328-333, June, 2001.
[75]. 3GPP TS 26.201, “AMR speech codec, Wideband; Frame structure,” Feb. 2001.
[76]. C. Voo, “A Review of the New Adaptation Layer Type 2”, Inter-University
Postgraduate Electrical Engineering Symposium (IUPEES’99), pp. 17-18, July
1999.

APPENDIX A IMPLEMENATION OF THE DBR AND SBR CELL DISPATCH PROCESSES
MANAGEMENT OF LOW AND VARIABLE BIT RATE ATM ADAPTATION LAYER TYPE 2 TRAFFIC
127
Appendix A
Implementation of the DBR and SBR Cell Dispatch Processes In this appendix, the DBR and the SBR cell dispatch processes as well as the AAL2
buffer management processes are described. The models for the DBR and SBR buffer
management and cell dispatch processes are shown in Figure A.1.
AAL2 Buffer DBR cell dispatch
AAL2 Buffer
SBR cell dispatch
Figure A.1: Model for DBR and SBR ATC incorporating AAL2
The AAL2 buffer in Figure A.1 for both the DBR and the SBR ATC is implemented
using a FCFS ring buffer of size N. The buffer management process is shown in Figure
A.2. In the ring buffer, a start pointer denoted by S and a finish pointer denoted by F
have been assigned to manage the buffer fill. The finish pointer is incremented only
when AAL2 packets are inserted into the buffer and the start pointer is incremented only
when AAL2 packets are taken from the buffer.

APPENDIX A IMPLEMENATION OF THE DBR AND SBR CELL DISPATCH PROCESSES
MANAGEMENT OF LOW AND VARIABLE BIT RATE ATM ADAPTATION LAYER TYPE 2 TRAFFIC
128
start
Set S, F = 0
Wait for packet
Packet payload arrives
Space left = N – ModN(F - S)
Packet size = Payload size + AAL2 header
Packet size > Space left?
Prepend AAL2 header Insert AAL2 packet to buffer
Discard packet payload
Point A
Yes
No
Packet policing task
Point B
F = ModN(F + Packet size)
Updating task
Figure A.2: AAL2 Buffer Management process.
Referring to Figure A.2, initialisation of the buffer pointers S and F are performed at the

APPENDIX A IMPLEMENATION OF THE DBR AND SBR CELL DISPATCH PROCESSES
MANAGEMENT OF LOW AND VARIABLE BIT RATE ATM ADAPTATION LAYER TYPE 2 TRAFFIC
129
start of the operation. This process then waits for an incoming packet to arrive from the
source. When a packet arrives, it determines via the packet policing task if the packet
conforms to its call connection parameters. The functions of the packet policing task are
shown in Figure A.3.
Get current time tb Get TAT[CID]
Get T[CID] Get τ[CID]
No tb < TAT[CID] – τ[CID]?
Point B Discard Packet
Point A
Yes
Figure A.3: Packet policing task.
Referring to Figure A.3, the packet policing task obtains the current time tb, the
theoretical arrival time of a packet TAT[CID], the packet interarrival time T[CID] and
the tolerance τ[CID] of a connection specified by CID. Packets that arrived are policed.
Non-conforming packets are discarded and the packet policing task returns via Point A
to wait for the next packet to arrive. Note that in practice, the time value has a finite
number storage and will overlap. Therefore further tests are required before the packet
can really be discarded. An example of such a test is to compare previous TAT[CID]
with the current time. If previous TAT[CID] is smaller than the current time, then the
current time has overlap.

APPENDIX A IMPLEMENATION OF THE DBR AND SBR CELL DISPATCH PROCESSES
MANAGEMENT OF LOW AND VARIABLE BIT RATE ATM ADAPTATION LAYER TYPE 2 TRAFFIC
130
However for conforming packets, the AAL2 buffer management process then proceeds
to determine the amount of available space in the ring buffer by subtracting the buffer
fill, given by the modulo term i.e. ModN(F – S) from the size of the buffer (i.e. N) and
compares this to the packet size that will be inserted into the buffer. If there is sufficient
buffer space, the packet is first prepended with an AAL2 header before being inserted
and the finish pointer is incremented by an AAL2 packet size. The next theoretical
arrival time to be used in the packet policing task is then updated in the updating task.
The functions of the updating task are shown in Figure A.4.
Get current time tb Get TAT[CID] Get T[CID]
tb > TAT[CID]?
Point A
TAT[CID] = tb + T[CID]
Yes No
TAT[CID] = TAT[CID] + T[CID]
Figure A.4: Updating task.
Referring to Figure A.4, upon completion of the updating task, it returns via Point A to
wait for the next incoming packet. In the case where there is insufficient AAL2 buffer
space, the packet is discarded and the theoretical arrival time is not updated.

APPENDIX A IMPLEMENATION OF THE DBR AND SBR CELL DISPATCH PROCESSES
MANAGEMENT OF LOW AND VARIABLE BIT RATE ATM ADAPTATION LAYER TYPE 2 TRAFFIC
131
DBR Cell Dispatch Process
The DBR cell dispatch process is shown in Figure A.5.
start
Wait for send signal
Send signal arrives
Buffer fill = ModN(F - S)
Buffer fill ≥ 47?
Take buffer fill octets as AAL2 CPS payload Prepend CPS header Send AAL2 CPS cell
Set S = F
Take 47 octets as AAL2 CPS payload
Prepend CPS header Send AAL2 CPS cell
Buffer fill > 0? No
Yes
Yes
No
Set S = ModN(S + 47)
Figure A.5: DBR cell dispatch process.

APPENDIX A IMPLEMENATION OF THE DBR AND SBR CELL DISPATCH PROCESSES
MANAGEMENT OF LOW AND VARIABLE BIT RATE ATM ADAPTATION LAYER TYPE 2 TRAFFIC
132
Referring to Figure A.5, at the start of this process, it waits for the send signal which is
generated at the Peak Cell Rate (1/PCR) of the DBR connection. When the send signal
arrives, the buffer fill is determined. If the buffer is empty, no cells are sent, and the
process then waits for the next send signal to arrive. However, if the buffer is non-
empty, it then determines if a full AAL2 CPS cell payload (i.e. 47 octets) can be
created.
In the case where a full cell payload can be created, 47 octets are taken from the buffer
and prepended with an AAL2 CPS header before being sent. The start pointer is then
incremented by 47 octets. In the case of a partially filled payload, the remaining
available spaces are padded with null values. In this case, the start pointer is
incremented to the finish pointer.
SBR Cell Dispatch Process
For the SBR cell dispatch process, this is shown in Figure A.6. In the SBR cell dispatch
process, an AAL2 CPS PDU cell is created on two conditions; when the fill timer
denoted by FillTimer has expired or when a full CPS PDU cell payload can be created.

APPENDIX A IMPLEMENATION OF THE DBR AND SBR CELL DISPATCH PROCESSES
MANAGEMENT OF LOW AND VARIABLE BIT RATE ATM ADAPTATION LAYER TYPE 2 TRAFFIC
133
start
Wait for send signal
Send signal arrives
Buffer fill = ModN(F - S)
Buffer fill ≥ 47?
Timer taskConformance test
Set SetTime, TATPCR, TATSCR to 0
Set TimeSet to false
Buffer fill > 0?
Yes
Yes
No
No
Get current time ta
Update task
Point A
Figure A.6: SBR cell dispatch process.

APPENDIX A IMPLEMENATION OF THE DBR AND SBR CELL DISPATCH PROCESSES
MANAGEMENT OF LOW AND VARIABLE BIT RATE ATM ADAPTATION LAYER TYPE 2 TRAFFIC
134
Referring to Figure A.6, at the start of the SBR cell dispatch process, the theoretical
arrival times for the peak cell rate denoted by (TATPCR) and the sustainable cell rate
denoted by (TATSCR) as well as the wait time denoted by SetTime is initialised to a value
of 0. The logic TimeSet which is used to indicate if the fill timer has been set is
initialised to false. This process then waits for the send signal which arrives on the cell
service time instants of the line rate. When the send signal arrives, the buffer fill is
determined. If the buffer is empty, no cells are sent, and the process then waits for the
next send signal to arrive. However, if the buffer is non-empty, it gets the current time
denoted by ta and then determines if a full AAL2 CPS cell payload (i.e. 47 octets) can
be created.
For the case where a full AAL2 CPS payload can be created, the conformance test
and/or the update task will be carried out. In the case where there is insufficient data to
fill the AAL2 CPS payload, the timer task is carried out. These tasks are examined next,
beginning with the timer task.
The functions in the timer task are shown in Figure A.7.

APPENDIX A IMPLEMENATION OF THE DBR AND SBR CELL DISPATCH PROCESSES
MANAGEMENT OF LOW AND VARIABLE BIT RATE ATM ADAPTATION LAYER TYPE 2 TRAFFIC
135
YesTimeSet = true ?
No SetTime =
ta +FillTimer SetTime ≤
ta?
Take buffer fill octets as AAL2 CPS payload Prepend CPS header Send AAL2 CPS cell
No
TATPCR = ta + 1/PCR TATSCR = ta + 1/SCR
YesTimeSet = true
Set S = F
TimeSet = false
Point A
Figure A.7: Functionality of SBR Timer Task.
Referring to Figure A.7, the logic TimerSet is examined to check if the fill timer has
already been set. If this has not been set, TimerSet is then set to true and SetTime is set
to expire after a period of time given by ta + FillTimer. However for the case where the
fill timer exists, the timer task then checks to examine if it has expired (i.e. when
SetTime delay is equal to or smaller than the current time ta). In the case where it has
expired, all the contents in the buffer is taken out and used to fill the AAL2 CPS

APPENDIX A IMPLEMENATION OF THE DBR AND SBR CELL DISPATCH PROCESSES
MANAGEMENT OF LOW AND VARIABLE BIT RATE ATM ADAPTATION LAYER TYPE 2 TRAFFIC
136
payload, and the remaining available spaces padded with null values. The theoretical
arrival times of the peak cell rate and the sustainable cell rate (i.e. TATPCR, TATSCR) are
then updated. Also the S pointer is incremented to the F pointer and the logic TimeSet is
set as false. The AAL2 CPS cell is sent and the timer task returns via Point A to wait for
the next send signal to arrive. For the case where the fill delay has not expired, no
operations are performed and the timer task also returns via Point A to await the next
incoming send signal.
The functions for the conformance test are shown in Figure A.8.
No ta < TATPCR
-τCDV?
Yesta < TATSCR
- τIBTSBR?
Take 47 octets as AAL2 CPS payload Prepend CPS header Send AAL2 CPS cell
Set S = ModN(S + 47)
Yes
No Point A
Update task
Figure A.8: Functionality of the SBR Conformance Task.
Referring to Figure A.8, the AAL2 CPS PDU cell is tested for both Peak Cell Rate

APPENDIX A IMPLEMENATION OF THE DBR AND SBR CELL DISPATCH PROCESSES
MANAGEMENT OF LOW AND VARIABLE BIT RATE ATM ADAPTATION LAYER TYPE 2 TRAFFIC
137
(PCR) and Sustainable Cell Rate (SCR) conformance. Note that the peak cell rate in the
conformance test is much smaller than the arrival rate of the send signal. If the cell fails
either condition, it is not sent and the conformance test returns via Point A to wait for
the next send signal to arrive. In the case where the cell passes both conformance tests,
47 octets are taken out of the buffer as AAL2 CPS payload and prepended with an
AAL2 CPS header before being sent. The S pointer is then incremented by 47 octets and
the theoretical arrival times of the peak cell rate and the sustainable cell rate for the next
conformance test are updated in Update Task.
The functions of the Update Task are shown in Figure A.9.

APPENDIX A IMPLEMENATION OF THE DBR AND SBR CELL DISPATCH PROCESSES
MANAGEMENT OF LOW AND VARIABLE BIT RATE ATM ADAPTATION LAYER TYPE 2 TRAFFIC
138
ta > TATPCR
?Yes
ta > TATSCR ?
No
No
Yes
Point A
TATPCR = ta + 1/PCR TATPCR = TATPCR + 1/PCR
TATSCR = ta + 1/SCR TATSCR = TATSCR + 1/SCR
TimeSet = false
Figure A.9: Functionality of the SBR Update Task.
Referring to Figure A.9, future TATs to be used in the conformance task are updated.
The logic TimeSet is set as false and the Update Task returns via Point A to wait for the
next send signal to arrive.

APPENDIX BAN ANALYSIS ESTABLISHING THE EQUIVALENCE BETWEEN DBR AND SBR ATC
MANAGEMENT OF LOW AND VARIABLE BIT RATE ATM ADAPTATION LAYER TYPE 2 TRAFFIC
139
Appendix B
An Analysis Establishing the Equivalence between DBR and SBR ATCs In this appendix, an analysis establishing the equivalence between DBR and SBR ATCs
is presented. This is based on the model shown in Figure B.1. Referring to this figure,
cells are presented to both the spacer and the policer at exactly the same time with an
arbitrary distribution {tk} where tk is defined as the time in which the last bit of the kth
cell is presented to the spacer and the policer.
DBR ATC Peak cell rate, PCRDBR
Spacer
{ξk}
Policer
Incoming Cells {tk}
LT SBR ATC Traffic conforming to PCRSBR, SCRDBR, and τIBT SBR
τIBT SBR
Figure B.1: DBR and SBR ATC model.
In the DBR ATC, when a cell enters the spacer, the maximum time a cell spends
waiting in the spacer is bounded by the buffer size, LT (cells). Note that LT is related to

APPENDIX BAN ANALYSIS ESTABLISHING THE EQUIVALENCE BETWEEN DBR AND SBR ATC
MANAGEMENT OF LOW AND VARIABLE BIT RATE ATM ADAPTATION LAYER TYPE 2 TRAFFIC
140
the value of Dspacer (given by (B.1) described in Section 1.2.3.1.2) shown as
Tspacer
DBR
LDPCR
= (B.1)
where PCRDBR is defined as the Peak Cell Rate of the DBR connection.
The kth cell leaves the spacer at time ξk where ξk is defined as the instant at which the
last bit of the kth cell leaves the spacer. For the arrival of the (k+1)th cell to the spacer, if
the queue is empty, it is immediately served on the next cell slot. However, if the queue
is not empty, then the (k+1)th cell joins the end of the queue and waits until the kth cell is
served before departing from the spacer. Therefore the departure time for the (k+1)th cell
is
1 11max ,k k k
DBR
tPCR
ξ ξ+ +
⎛ ⎞= +⎜ ⎟
⎝ ⎠
(B.2)
When a cell on arrival to the spacer finds the queue full, it is discarded by the spacer. A
busy period is defined as the maximal interval of time during which the spacer is never
idle.
For the SBR ATC, cells that enter the policer are policed according to the Generic Cell
Rate Algorithm (GCRA (PCRSBR, SCRSBR, τIBT SBR)). The GCRA (PCRSBR, SCRSBR, τIBT
SBR) is an algorithm that uses the Theoretical Arrival Time (TAT) and τIBT SBR to
determine if a cell is conforming. Let TATk be the nominal arrival of the kth cell
assuming cells are sent equally spaced at the sustainable cell rate, SCRSBR. For the kth
cell to be conforming, its arrival time must be in the range TATk-τIBT SBR ≤ tk. A non-
conforming kth cell has an arrival time that is smaller than (TATk-τIBT SBR). When the kth
cell is found conforming, TAT is reset to tk and then updated to (tk+1/SCRSBR).
Conforming cells leave the policer immediately upon arrival while non-conforming
cells are discarded by the policer.

APPENDIX BAN ANALYSIS ESTABLISHING THE EQUIVALENCE BETWEEN DBR AND SBR ATC
MANAGEMENT OF LOW AND VARIABLE BIT RATE ATM ADAPTATION LAYER TYPE 2 TRAFFIC
141
The analysis presented here for ATM cells is adapted from Lau’s work in [49] where he
showed the equivalence in performance between DBR and SBR for Internet packets.
Using the model of Figure B.1, let us begin the analysis.
The following variables are defined as follows:
Let tk be the arrival time of the kth cell into either the spacer (DBR) or the policer (SBR).
It also means that k number of cells have arrived into the spacer.
Let ξk be the departure time of the kth cell from the spacer (DBR).
Let J denote the start of a busy period. For the spacer, the start of the Jth busy period
occurs on the arrival of the very first cell of that period, and the end of the Jth busy
period is when the last cell in the spacer departs. For the policer, the start of the Jth busy
period occurs on the arrival of the very first cell of that period, or when a cell arrives
late relative to its TAT and the end of the Jth busy period is when a cell does not arrive
at or before its TAT. It is assumed that the Jth busy period in the spacer and the policer
coincides with the arrival of cell b at time tb.
Let PCRDBR be defined as the peak cell rate at which the spacer outputs cells.
In the analysis, the instant at which a cell is accepted or discarded by the spacer due to
input queue overflow, and the conditions where a cell is found conforming or non-
conforming by the policer are established. It will be shown that under all conditions
when a cell is discarded by the spacer, it is also found non-conforming by the policer.
Similarly, when the spacer accepts a cell, the same cell is also found conforming by the
policer.
For the DBR ATC:
A cell is discarded when the buffer fill LT is reached or exceeded. Let the kth cell be the
first cell to be discarded in the Jth busy period (i.e. in the period (tb, tk)) when upon
arrival it finds the spacer full. This will occur when the number of arrivals in the period

APPENDIX BAN ANALYSIS ESTABLISHING THE EQUIVALENCE BETWEEN DBR AND SBR ATC
MANAGEMENT OF LOW AND VARIABLE BIT RATE ATM ADAPTATION LAYER TYPE 2 TRAFFIC
142
(tb, tk) denoted by A(tb, tk) subtract the number of departures in the same period denoted
by D(tb, tk) exceeds the spacer buffer size by one.
( ) ( ), , 1b k b k TA t t D t t L− = + (B.3)
Using the previous definitions for the time at which cells are presented to the spacer, at
time tk, k number of cells have been presented to the spacer. Similarly at time tb, b
number of cells have arrived at the spacer. Therefore the number of arrivals in the
period (tb,tk) (i.e. A(tb,tk)) is equivalent to
( )b kt , t 1A k b= − + (B.4)
The number of departures is equivalent to the number of cells served by the spacer.
Therefore in the period (tb,tk), the number of departures D(tb,tk) is
( ) ( ),b k k b DBRD t t t t PCR 1= − × +⎢ ⎥⎣ ⎦ (B.5)
Substituting (B.4) and (B.5) into (B.3), the condition for the kth cell being the first cell
discarded in the Jth busy period is
( ) ( ){ } ( ){ }
( )
, , 1
1 1 1
1
b k b k T
k b DBR T
k b DBR T
A t t D t t L
k b t t PCR L
k t t PCR L b
− = +
− + − − × + = +⎢ ⎥⎣ ⎦
= − × + + +⎢ ⎥⎣ ⎦
(B.6)
Using the identity that ⎣yx⎦ + n = ⎣x(y + n/x)⎦, (B.6) can be re-written as
( ) 1TDBR k b
DBR
Lk PCR t t bPCR
⎢ ⎛ ⎞= × + − +⎢ ⎥⎜ ⎟
⎝ ⎠⎣ ⎦
⎥+
(B.7)
Equation (B.7) shows the case where the kth cell is the first cell to be discarded by the
spacer during the Jth busy period in (tb,tk). Similarly, for the case where the kth cell is
accepted into the spacer, the number of arrivals in the period (tb,tk) subtract the number

APPENDIX BAN ANALYSIS ESTABLISHING THE EQUIVALENCE BETWEEN DBR AND SBR ATC
MANAGEMENT OF LOW AND VARIABLE BIT RATE ATM ADAPTATION LAYER TYPE 2 TRAFFIC
143
of departures in the same period must be equal to or smaller than the spacer buffer size.
( ) ( ), ,b k b k TA t t D t t L− ≤ (B.8)
By substituting (B.4) and (B.5) into (B.8), the condition of kth cell being accepted in the
Jth busy period is
( ) ( ){ } ( ){ }
( )
, ,
1 1b k b k T
k b DBR T
k b DBR T
A t t D t t L
k b t t PCR L
k t t PCR L
− ≤
− + − − × + ≤⎢ ⎥⎣ ⎦
b≤ − × + +⎢ ⎥⎣ ⎦
(B.9)
Using the identity that ⎣yx⎦ + n = ⎣x(y + n/x)⎦, (B.9) can be re-written as
( )TDBR k b
DBR
Lk PCR t tPCR
⎢ ⎛ ⎞≤ × + −⎢ ⎥⎜ ⎟
⎝ ⎠⎣ ⎦b
⎥+
(B.10)
Equation (B.10) shows the case where the kth cell is accepted by the spacer during the
Jth busy period. The upper bound of (B.10) gives the condition that the kth cell is the last
packet to be accepted by the spacer is shown as
( )TDBR k b
DBR
Lk PCR t tPCR
⎢ ⎛ ⎞= × + −⎢ ⎥⎜ ⎟
⎝ ⎠⎣ ⎦b
⎥+
(B.11)
For the SBR ATC:
The TATk for the arrival of the kth cell in the Jth busy period that commences at time tb is
( )k b
SBR
k bTAT t
SCR−
= + (B.12)
For the kth cell to be found non-conforming by the policer, its arrival time (i.e. tk) must
be earlier than (TATk-τIBT SBR) shown by the condition

APPENDIX BAN ANALYSIS ESTABLISHING THE EQUIVALENCE BETWEEN DBR AND SBR ATC
MANAGEMENT OF LOW AND VARIABLE BIT RATE ATM ADAPTATION LAYER TYPE 2 TRAFFIC
144
SBR < k k IBTt TAT τ− (B.13)
Substituting (B.12) into (B.13), this is
k b IBT SSBR
k bt tSCR
τ⎛ ⎞−
< + −⎜ ⎟⎝ ⎠
BR (B.14)
The condition where the kth cell is declared non-conforming by the policer is
( ){ }( ){ }
k b IBT SBRSBR
k b IBT SBRSBR
k b IBT SBR SBR
k b IBT SBR SBR
k bt tSCR
k bt tSCR
t t SCR k b
k t t SCR
τ
τ
τ
τ
⎛ ⎞−< + −⎜ ⎟
⎝ ⎠⎛ ⎞−
− + < ⎜ ⎟⎝ ⎠
− + × < −
> − + × + b
(B.15)
Recognising that k is an integer, the condition of (B.15) is re-written as
( ){ } 1SBR IBT SBR k bk SCR t t bτ⎢= × + − +⎣ ⎥ +⎦
SBR
(B.16)
Equation (B.16) shows the case where the kth cell is the first cell in the Jth busy period to
be declared non-conforming. Similarly for the kth cell to be conforming, the arrival time
of the kth cell (i.e. tk) must be greater than or equal to (TATk-τIBT SBR) shown by
k k IBTt TAT τ≥ − (B.17)
Substituting the value of TATk for the kth cell in the Jth busy period given in (B.12) into
(B.17), this is
k b IBT SSBR
k bt tSCR
τ⎛ ⎞−
≥ + −⎜ ⎟⎝ ⎠
BR (B.18)
The condition where kth cell is declared conforming is

APPENDIX BAN ANALYSIS ESTABLISHING THE EQUIVALENCE BETWEEN DBR AND SBR ATC
MANAGEMENT OF LOW AND VARIABLE BIT RATE ATM ADAPTATION LAYER TYPE 2 TRAFFIC
145
( ){ }( ){ }
k b IBT SBRSBR
k b IBT SBRSBR
k b IBT SBR SBR
k b IBT SBR SBR
k bt tSCR
k bt tSCR
t t SCR k b
k t t SCR
τ
τ
τ
τ
⎛ ⎞−≥ + −⎜ ⎟
⎝ ⎠⎛ ⎞−
− + ≥ ⎜ ⎟⎝ ⎠
− + × ≥ −
≤ − + × + b
(B.19)
The upper bound of (B.19) gives the condition that the kth cell is the last packet found
conforming by the policer and is shown as
( ){ } SBR IBT SBR k bk SCR t tτ⎢= × + −⎣ b⎥ +⎦ (B.20)
Equivalence condition between DBR ATC and SBR ATC:
We now compare the conditions between the spacer and the policer in the Jth busy
period for cases where the kth cell is either discarded or accepted. The condition for
which the kth cell is accepted by the spacer in the DBR ATC and also found conforming
by the policer in the SBR ATC (and vice versa) is shown in (B.21) where the SCRSBR is
set equal to the service rate of the PCRDBR.
SBR DBRSCR PCR= (B.21)
For the DBR ATC, when the kth cell is discarded from the spacer due to buffer fill, LT
being reached then all cells that arrived during the busy period before this kth cell will
have been already accepted by the spacer. Note that the spacer performs no other action
when discarding the cell. Therefore on arrival of the next cell, the spacer treats this
recently arrived cell independent of the discarded cell. The conditions for the kth cell
being the first cell discarded or the last cell accepted by the spacer is summarised using
(B.7) and (B.11) respectively as

APPENDIX BAN ANALYSIS ESTABLISHING THE EQUIVALENCE BETWEEN DBR AND SBR ATC
MANAGEMENT OF LOW AND VARIABLE BIT RATE ATM ADAPTATION LAYER TYPE 2 TRAFFIC
146
( )
( )
1 Cell Discarded
Cell Accepted
TDBR k b
DBR
TDBR k b
DBR
Lk PCR t t bPCR
Lk PCR t t bPCR
⎢ ⎥⎛ ⎞= × + − + +⎢ ⎥⎜ ⎟
⎝ ⎠⎣ ⎦⎢ ⎥⎧ ⎫
= × + − +⎨ ⎬⎢ ⎥⎩ ⎭⎣ ⎦
(B.22)
Similarly for the SBR ATC, when the kth cell is found non-conforming by the policer,
then all cells that arrived during the busy period before this kth cell will have already
been found conforming. Note that when a cell is found non-conforming, no actions are
performed by the policer (i.e. the TAT is not updated). Therefore on arrival of the next
cell, the policer treats this recently arrived cell independent of the discarded cell. The
conditions for the kth cell being the first cell found non-conforming or the last cell found
conforming by the policer is summarised using (B.16) and (B.20) respectively as
( ){ }( ){ }
1 Non-Conforming cell
Conforming cell
SBR IBT SBR k b
SBR IBT SBR k b
k SCR t t b
k SCR t t b
τ
τ
⎢ ⎥= × + − + +⎣ ⎦⎢ ⎥= × + − +⎣ ⎦
(B.23)
From (B.22), (B.23) and under the condition outlined in (B.21) where PCRDBR equals
SCRSBR, τIBT SBR is related to LT by
T
IBT SBRDBR
LPCR
τ = (B.24)
Alternatively, LT can be obtained by re-arranging (B.24) as
T IBT SBR DBRL PCRτ= × (B.25)
From (B.25), (B.1) can be written in terms of τIBT SBR as

APPENDIX BAN ANALYSIS ESTABLISHING THE EQUIVALENCE BETWEEN DBR AND SBR ATC
MANAGEMENT OF LOW AND VARIABLE BIT RATE ATM ADAPTATION LAYER TYPE 2 TRAFFIC
147
Tspacer
DBR
IBT SBR DBR
DBR
IBT SBR
LDPCR
PCRPCR
τ
τ
=
×=
=
(B.26)
From (B.26), it is observed that the value of Dspacer in the DBR ATC equals the intrinsic
burst tolerance (τIBT SBR) of the SBR ATC under the condition outlined in (B.21). This
concludes the analysis for the equivalence between the DBR and the SBR ATCs.

APPENDIX C UPC – SOFTWARE IMPLEMENTATION
MANAGEMENT OF LOW AND VARIABLE BIT RATE ATM ADAPTATION LAYER TYPE 2 TRAFFIC
148
Appendix C
UPC – Software Implementation In this appendix, a software implementation of the token bucket policer is described. A
test environment has been set up to collect different voice conversation samples. These
are used as sources to test the implemented system.
Test Environment
Conversation samples are taken between two test subjects; one of which is in the
laboratory room. A microphone connected to the computer is set up in the laboratory
room to record a one way conversation (i.e. only the voice of the test subject in the
laboratory room is recorded). Factors (i.e. outside noises and echoes in the room) that
degrade the conversation are kept to a minimum. The encoding and the processing of
these samples are described in the following section
UPC Software Implementation
The software implementation model is shown in Figure C.1. Pre-recorded voice
conversation samples are encoded, silence suppressed and then policed according to a
set of token bucket parameters (Refer to Section 5.3.1).
Silence
suppression Policed traffic Policing Voice Encoding
Figure C.1: Software implementation of policing.

APPENDIX C UPC – SOFTWARE IMPLEMENTATION
MANAGEMENT OF LOW AND VARIABLE BIT RATE ATM ADAPTATION LAYER TYPE 2 TRAFFIC
149
Voice Encoding
A voice signal is characterised by both positive and negative voltage amplitudes.
Encoding of a voice signal involves three steps. These are:
• Voice sampled at fixed rate.
• Quantisation of each voice sample into different quantised levels (µ-Law).
• Encoding of quantised levels into distinct binary words.
The conversation samples are encoded in Pulse Code Modulation (PCM). In PCM
encoding, a voice signal example shown in Figure C.2 is to be sampled at 8 kHz (i.e. at
fixed intervals of 0.125ms for a sample). Each sample is converted to a quantised value
in the range of 0 to 255 levels (i.e. 28-1). Once these voice samples have been quantised,
they are encoded into binary numbers representing decimal values in the range –127 to
128. Each encoded sample is an octet long. These encoded samples are then stored in a
Wave (WAV) file format defined by Microsoft. The header of the WAV is shown in
Figure C.3.
Voice Signal
Time
Vol
tage
Lower Threshold Level
Figure C.2: Voice signal sampling.

APPENDIX C UPC – SOFTWARE IMPLEMENTATION
MANAGEMENT OF LOW AND VARIABLE BIT RATE ATM ADAPTATION LAYER TYPE 2 TRAFFIC
150
Figure C.3: WAV format header.
Referring to Figure C.3, the WAV header size is around 44 octets. However using the
Microsoft sound tools, an additional 10 octets are included in the header. When
processing the samples, the header fields remain unchanged.
Silence Suppression
Silence suppression requires that silence intervals in the conversation samples be first
detected. From Figure C.2, it is observed that there are multiple zero crossings on the
voltage axis with respect to the time axis. A period is considered silent only when a
minimum number of these samples are within a certain noise threshold (i.e. between
upper and lower noise threshold). Figure C.4 illustrates the process of detecting silence
in a voice conversation. This silence detection process is similar to that in G.723.1 in
[57].
R I F F
RIFF Chunk Length
W A V E
f m t
Format Chunk Length
Format Tag Channels
Sample Rate
Average No. of bytes P/second
Block Align Bits / Sample
d a t a
Data Length
Raw Data

APPENDIX C UPC – SOFTWARE IMPLEMENTATION
MANAGEMENT OF LOW AND VARIABLE BIT RATE ATM ADAPTATION LAYER TYPE 2 TRAFFIC
151
Voice Signal
Silence Period
Time
Vol
tage
Lower Threshold Level
Figure C.4: Silence detection.
Upon identifying the silence periods in the conversations, these are suppressed using the
algorithm shown in Figure C.5.

APPENDIX C UPC – SOFTWARE IMPLEMENTATION
MANAGEMENT OF LOW AND VARIABLE BIT RATE ATM ADAPTATION LAYER TYPE 2 TRAFFIC
152
start
Remove header and set pointer at beginning of file
Is pointer at end of file?
Is sample within noise threshold?
Write sample back to file
Reset counter
Is counter > silence threshold?
Write sample back to file
Yes
Yes
Yes
No
No
No
Read pointer
File is silence suppressed
Get sample Increment pointer
Increment counter
Write sample as nulls back to file
Figure C.5: Silence suppression algorithm.

APPENDIX C UPC – SOFTWARE IMPLEMENTATION
MANAGEMENT OF LOW AND VARIABLE BIT RATE ATM ADAPTATION LAYER TYPE 2 TRAFFIC
153
Referring to Figure C.5, the header is first removed from the sound file and a pointer is
set to the beginning of the file. The pointer increments as each PCM sample are read
from the file. The sound file is “silence suppressed” when all samples have been read.
The content in each sample is compared to a noise threshold (as shown in Figure C.4).
When a number of these samples fall within the noise threshold consecutively, a silence
period is detected. A counter is implemented to keep track of these samples. The
detection of silence periods is different to the silence obtained from small pauses in the
speech. It is a result of the person listening on the phone. This is known as hangover
time. This is a technique to avoid sudden clipping of speeches and to bridge short
speech gaps such as those due to stop consonants. The length of the silence threshold is
set approximately as 200ms [57]. When a silence period is detected, samples that
arrived after are written to an output file as null (i.e. zero) values. A silence period ends
upon the detection of a sample with a value outside the noise threshold. Values of the
samples in the talk periods are preserved when they are written into the output file. The
header for the sound file is maintained. The resultant waveform with silence
suppression is shown in Figure C.6.
Voice Signal
Silence Suppressed
Time
Vol
tage
Upper Threshold
Level
Lower Threshold Level
Figure C.6: Silence suppressed voice signal.

APPENDIX C UPC – SOFTWARE IMPLEMENTATION
MANAGEMENT OF LOW AND VARIABLE BIT RATE ATM ADAPTATION LAYER TYPE 2 TRAFFIC
154
Note that the values of the samples are in the range of 0 to 255 as the data in the file is
read as unsigned character. Given that a voice signal has both positive and negative
voltage amplitudes, positive voltage amplitudes are represented by a value in the range
0 to 128, with 128 representing zero. Any values from 129 to 255 (255 being the
smallest integer) are used to represent the negative voltage amplitudes.
The parameters for the silence detection and suppression algorithm in Figure C.5 are
summarised in Table 17.
Silence suppression parameters Value
Max silence interval 200ms (corresponds to 1600 packets)
Noise threshold 128±5
Table 17: Parameters for silence suppression algorithm.
The next part of the software implementation to be examined is the token bucket
policer. A simple algorithm (similar to the generic leaky bucket algorithm) has been
implemented to police the source traffic originating from pre-recorded samples.
Token Bucket Policing
Source traffic is policed according to the token bucket algorithm shown in Figure C.7.
This is a simplified version of the generic leaky bucket algorithm described in Section
5.3.1. In Figure C.7, only the SPR is policed. The PPR parameter does not need to be
monitored as the packet interarrival time has been fixed at 5ms. This corresponds to 40
PCM samples in a packet where a PCM sample has a length of 0.125ms.

APPENDIX C UPC – SOFTWARE IMPLEMENTATION
MANAGEMENT OF LOW AND VARIABLE BIT RATE ATM ADAPTATION LAYER TYPE 2 TRAFFIC
155
Silence suppressed voice
ta < TATSPR - τIBT voice source ? Non-conforming
Packet
No
Yes
Conforming Packet TATSPR = max(ta, TATSPR) + TSPR
Figure C.7: Implementation of token bucket algorithm.
Referring to Figure C.7, the silence-suppressed voice is fed into the policer and the SPR
condition is monitored. The value of SPR is taken from Section 5.3.2 to be 111
packets/sec, hence the value of TSPR used is 1/111 secs. The intrinsic burst tolerance
τIBT voice source is obtained using the range of MBS values shown in Figure 40. For non-
conforming packets, nulls are written into the output sound file for these packets.
ackets.