
Exh 99.1 3Q2016 8-K...Title: Exh 99.1 3Q2016 8-K Created Date: 1/3/2016 10:40:00 AM

1
EARNINGS
RELEASE
3Q16
EARNINGS
RELEASE
3Q16
Conference Call
November 9, 2016
► 8:00 am US EST
In English (simultaneous translation from Portuguese)
+ 1-516-3001066 US EST
Code: Gafisa
► 11h00 am Brasilia Time
In Portuguese
Telephone:
+55-11-3728-5971 (Brazil)
Code: Gafisa
Replay:
+55-11-3127-4999 (Brazil)
Code: 90403548
+55-11-3127-4999 (US)
Code: 51184247
IR Website: www.gafisa.com.br/ri
IR Contacts
Danilo Cabrera
Mariana Suarez
Phone: +55 11 3025-9242 / 9978
E-mail: [email protected]
IR Website: www.gafisa.com.br/ri
Media Relations
Máquina da Notícia - Comunicação Integrada
Giovanna Bambicini
Phone: +55 11 3147-7414
Fax: +55 11 3147-7900
E-mail: [email protected]
Shares
GFSA3 – Bovespa GFA – NYSE Total shares outstanding: 378,066,162 Average daily trading volume (90 days²): R$17.2 million (1) Including 14,160,533 treasury shares; (2) Until September 30, 2016
FOR IMMEDIATE RELEASE - São Paulo, November 8, 2016 – Gafisa S.A. (Bovespa: GFSA3; NYSE: GFA), one of Brazil’s leading homebuilders, today reported financial results for the third quarter ended September 30, 2016.
GAFISA RELEASES 3Q16 RESULTS
MANAGEMENT COMMENTS AND HIGHLIGHTS
Conditions in the real estate sector remain impacted by Brazil’s recessive environment. The combination of the political crisis experienced since 2015 and economic contraction has had a severe impact on the Brazilian real estate market. Gafisa, due to the diversification of its operations, serving both the upper-middle income segment and the low-income segment, experiences different realities that have allowed us to partially mitigate the negative effects of this period.
Once again, the Gafisa and Tenda segments faced substantially different market environments throughout the quarter. The Gafisa segment, which continues to be impacted by a weak macroeconomic environment, remains committed to improved operational and business performance by searching for the adequate development of new projects. The Tenda segment, conversely, took advantage of the low-income market’s resilience and continued to expand the scale of its business model, despite macroeconomic conditions.
In keeping with more balanced supply and demand dynamics in the 3Q16, the Gafisa segment advanced the development of new projects and launched four projects/phases in the city of São Paulo, accounting for R$411.0 million in PSV, ending the first nine months with R$621.4 million in new projects launched.
We would like to point out the solid commercial performance of these launches, whose speed of sales reached 30.7% in the period, which may signal a slight improvement in consumer confidence.
2
EARNINGS
RELEASE
3Q16
EARNINGS
RELEASE
3Q16
We highlight in particular two new products: MOOV Vila Prudente and MOOV Freguesia do Ó, whose average speed of sales reached 51.6%, well above the industry average in recent years. It is worth mentioning that this trend is also evident in this quarter’s launches. Such evolution in the sales speed of launches attests not only a gradual increase in consumer confidence, but also the Company's success in improving its operating processes in recent years, with improvements in the areas of development, products, sales and construction.
Despite prevailing political and economic headwinds in the 3Q16, the segment achieved its best quarterly operating performance of the year. In addition to a 39.1% q-o-q increase in gross sales to R$364.4 million, another important driver of 3Q results was the reduction in the volume of dissolutions.
As a result of these factors, 3Q16 net pre-sales reached R$258.3 million, up 99,5% from the previous quarter, and accounting for 56.8% of total net pre-sales in 9M16.
Even taking into consideration the solid performance of projects launched in the period, the Gafisa segment’s SoS remains highly impacted by current market’s challenges, reflected in the low volume of net sales of some inventory products. In the 3Q16, Sos reached 11.5%, higher when compared to 2015. SoS in the last twelve months reached 26.1%. The volume of dissolutions in 3Q16, while slightly improved, continues to reflect the weak economic scenario and high volume of deliveries since the end of 2015. In 3Q16, the segment delivered R$935.7 million in PSV, totaling R$1.5 billion in delivered projects in 9M16.
The Gafisa segment ended 3Q16 with 19 projects under construction, all on schedule and within the delivery timeframe, reflecting Gafisa’s commitment to customers. The transfer volume reached R$126.0 million in 3Q16 and R$378.7 million in 9M16, showing an appropriate level of operational control and efficiency. Despite current credit restrictions, Gafisa maintains a strong relationship in partnering with banks for the transfer process.
The Company has maintained a focus on the sale of remaining units. As a result, 43.2% of net sales in 3Q16 and 58.0% in 9M16 were for products launched prior to current year. Considering the higher volume of
dissolutions related to legacy projects, net sales were concentrated in more recent projects, impacting the Gafisa segment’s revenues.
Despite the first signs of stability in the market and the Company’s improved operating performance in the period, this improvement is not yet reflected in our financial results, which are still under pressure from the difficulty of selling some projects in inventory, and also from the effect of the long recession on the pricing of products. Continued recovery in the political and economic scenario over the next quarters, combined with the consequent upturn in the real estate market, should allow for a gradual recovery in the Company’s financial results over the coming periods.
In this regard, we will maintain a conservative approach, balancing the placement of new products on the market and prioritizing those with higher liquidity, so as to achieve an appropriate level of sales and profitability.
The Tenda low-income segment continues to demonstrate resilient performance, benefiting consolidated results in the period. Accordingly, the segment continues to expand the scale of its new business model.
In 3Q16, Tenda further expanded the size of its operations, with launches totaling R$325.4 million. The launches were comprised of 9 projects/phases, in the states of São Paulo, Rio de Janeiro, Rio Grande do Sul, Pernambuco and Bahia. Launches accounted for 70.2% of the Tenda segment’s total sales and 38.4% of the segment’s total in 9M16.
The Tenda segment’s SoS reached 18.8%, lower than previous periods due to a higher volume of dissolutions.
3Q16 gross sales totaled R$318.7 million and dissolutions reached 25.1% of gross sales, resulting in net pre-sales of R$238.7 million. In the period, dissolutions were impacted by seasonality related to projects sold in “Feirão da Caixa” (2Q16), the introduction of in-person interviews in bank branches as an additional step in the process of analyzing and granting credit by financial agents, which led to annulments of already preapproved customers and the review of Tenda’s unilateral dissolution process for sales not transferred after a period exceeding three months as the prior process allowed for some

3
EARNINGS
RELEASE
3Q16
EARNINGS
RELEASE
3Q16
units to remain beyond the deadline deemed appropriate by the Company. We estimate that this last factor should result in a temporary increase in the level of company dissolutions before returning to the average levels that we expect.
Since 2013, when Tenda started its new model operations, the segment has launched 81 projects, representing a total of R$3.0 billion in PSV. Of this total, Tenda has delivered R$1.4 billion, comprised of 42 projects/phases. Notably, all projects related to the first year of new model operations (2013) have been completed and delivered on schedule. In relation to the 2014 projects, only one project/phase of 14 projects launched is still awaiting delivery. In 3Q16, the Tenda segment delivered 10 projects/phases, corresponding to 1,811 units, and representing R$265.1 million in PSV. In 9M16, the Tenda segment delivered 23 projects/phases, comprising 4,170 units and R$602.2 million in PSV.
The Tenda segment remains focused on increasing its scale by growing launches and implementing strategies designed to ensure a strong sales pace. The consistency of recent results from new model projects reaffirms management’s confidence in the 2016 business plan.
On a consolidated basis, Gafisa and Tenda launched R$736.4 million in 3Q16, ending the first nine months with R$1.6 billion in new projects. The Gafisa segment accounted for 56% of 3Q16 launches while Tenda accounted for the remaining 44%. Third quarter 2016 net pre-sales totaled R$497.0 million, an increase of 9.4% q-o-q., reaching R$1.3 billion in the year.
Consolidated adjusted gross profit totaled R$142.0 million with a gross margin of 26.4%, which remained impacted by challenges in the upper-middle income market. In 9M16, adjusted gross profit totaled R$390.5 million, with a gross margin of 27.5%.
The Company remains focused on a stabilized cost and expense structure. Selling, general and
administrative expenses were R$49.5 million in 3Q16, slightly down y-o-y, reflecting the Company’s efforts to more efficiently respond to adjustments and movements of the real estate market. In 9M16, selling, general and administrative expenses dropped by 5.2%.
Gafisa reported a 3Q16 consolidated net loss of R$72.6 million, compared to a loss of R$38.4 million recorded in 2Q16 and net income of R$13.5 million in 3Q15.
As a result of the better environment for the low income segment, Tenda has achieved its best quarterly profit since 2012, as a result of the maintenance of a more efficient operating performance and the scale gains over the last quarters. Gafisa, in turn, remains impacted by the delicate market moment of the upper income segment.
At the end of the period, the Net Debt/ Shareholders’ Equity ratio reached 49.3%, a slight increase compared to 2Q16, although in line with the Company’s business plan. Excluding project finance, the Net Debt/Shareholders’ Equity ratio was negative at 8.1%
Consolidated operating cash generation reached R$97.4 million in the quarter and R$232.9 million in 9M16. Net cash generation totaled R$13.0 million in 3Q16 and R$8.8 million YTD.
We expect to maintain a conservative approach in the last quarter of 2016 as we seek to attain adequate sales and profitability levels. The Gafisa segment, through its improved operational performance, seeks to overcome this period of economic weakness. The Tenda segment, guided by resilience in the low-income segment and backed by positive results from new model projects.
The Company continues to advance guided by capital discipline, its profitability goals, and value creation for all shareholders.
Sandro Gamba Rodrigo Osmo
Chief Executive Officer – Gafisa Chief Executive Officer – Tenda

4
EARNINGS RELEASE
3Q16
EARNINGS RELEASE
3Q16
MAIN CONSOLIDATED FIGURES
Table 1- Operating and Financial Highlights (R$ 000 and % Company)
3Q16 2Q16 Q/Q(%) 3Q15 Y/Y(%) 9M16 9M15 Y/Y(%)
Launches 736,359 545,038 35% 606,819 21% 1,590,043 1,402,352 13%
Launches, Units 3,170 3,166 0% 3,249 -2% 8,197 7,430 10%
Net Pre-sales 497,018 454,511 9% 492,803 1% 1,284,869 1,448,278 -11%
Pre-sales, Units 2,312 2,730 -15% 2,332 -1% 7,180 6,635 8%
Pre-sales of Launches 337,573 165,273 104% 233,976 44% 532,962 468,138 14%
Sales over supply (SoS) 14.2% 13.9% 30 bps 14.8% -60 bps 31.5% 33.8% -230 bps
Delivered projects (PSV) 1,200,766 687,726 75% 197,539 508% 2,054,992 1,937,747 6%
Delivered projects, Units 3,710 3,136 18% 1,304 185% 7,501 7,576 -1%
Net Revenue 538,780 473,371 14% 624,043 -14% 1,417,685 1,735,073 -18%
Adjusted Gross Profit1 141,980 138,276 3% 223,777 -37% 390,493 603,465 -35%
Adjusted Gross Margin1 26.4% 29.2% -280 bps 35.9% -950 bps 27.5% 34.8% -730 bps
Adjusted EBITDA2 14,893 22,397 -34% 92,581 -84% 53,467 261,778 -80%
Adjusted EBITDA Margin2 2.8% 4.7% -190 bps 14.8% -1,200 bps 3.8% 15.1% -1,130 bps
Net Income (Loss) (72,622) (38,439) 89% 13,486 -638% (164,288) 73,623 -323%
Backlog Revenues 663,836 667,368 -1% 808,851 -18% 663,836 808,851 -18%
Backlog Results3 259,193 259,864 0% 324,850 -20% 259,193 324,850 -20%
Backlog Margin3 39.0% 38.9% 10 bps 40.2% -120 bps 39.0% 40.2% -120 bps
Net Debt + Investor Obligations 1,443,256 1,455,766 -1% 1,571,811 -8% 1,443,256 1,571,811 -8%
Cash and cash equivalents 609,898 618,569 -1% 921,828 -34% 609,898 921,828 -34%
Shareholders’ Equity 2,926,451 2,998,075 -2% 3,110,914 -6% 2,926,451 3,110,914 -6%
Shareholders’ Equity + Minority 2,928,749 3,001,290 -2% 3,112,609 -6% 2,928,749 3,112,609 -6%
Total Assets 6,353,318 6,548,124 -3% 7,059,524 -10% 6,353,318 7,059,524 -10%
(Net Debt +Obligations) / (SE + Minority) 49.3% 48.5% 80 bps 50.5% -120 bps 49.3% 50.5% -120 bps
1) Adjusted by capitalized interests. 2) Adjusted by expenses with stock option plans (non-cash), minority. Consolidated EBITDA considers the equity income from Alphaville. 3) Backlog results net of PIS/COFINS taxes (3.65%), and excluding the impact of PVA (Present Value Adjustment) method according to Law 11.638. 4) Cash and cash equivalents, and marketable securities 5) Backlog results comprise the projects restricted by condition precedent.

5
EARNINGS RELEASE
3Q16
EARNINGS RELEASE
3Q16
FINANCIAL RESULTS 3Q16 net revenue recognized by the “PoC” method was R$268.3 million in the Gafisa segment and
R$270.5 million in the Tenda segment. This resulted in 3Q16 consolidated revenue of R$538.8 million, a decrease of 13.7% year-on-year and an increase of 13.8% from the previous quarter. In 9M16, consolidated net revenue was R$1.4 billion, a reduction of 18.3% compared with 9M15.
Adjusted gross profit for 3Q16 was R$142.0 million, higher than R$138.3 million in 2Q16 and lower than R$223.8 million recorded in the past year. Adjusted gross margin reached 26.4%, compared to 29.2% in 2Q16 and 35.9% in 3Q15. The Gafisa segment accounted for an adjusted gross profit of R$47.2 million, with an adjusted gross margin of 17.6%, while the Tenda segment accounted for an adjusted gross profit of R$94.8 million, with a margin of 35.0%. In 9M16, adjusted gross profit was R$390.5 million with adjusted gross margin of 27.5%, compared to R$603.5 million in 9M15.
Consolidated Adjusted EBITDA was R$14.9 million in 3Q16, with an adjusted EBITDA margin of 2.8%. The Gafisa segment reported adjusted EBITDA of R$15.7 million, while the Tenda segment’s adjusted EBITDA was positive with R$39.7 million. In 9M16, consolidated Adjusted EBITDA was R$53.5 million, 79.6% lower than R$261.8 million in 9M15. Please note that consolidated adjusted EBITDA includes Alphaville equity income, while the Gafisa segment’s adjusted EBITDA is net of this effect.
The Company reported a 3Q16 net loss of R$72.6 million compared to a net loss of R$38.4 million in 2Q16, and net profit of R$13.5 million in 3Q15. The Gafisa segment reported a net loss of R$95.7 million, while the Tenda segment reported a net profit of R$23.0 million. Year-to-date, the Company reported a consolidated net loss of R$164.3 million.
Operating cash generation totaled R$97.4 million in 3Q16, finishing the 9M16 with cash generation of R$232.9 million. Net cash generation in the quarter was R$13.0 million, with an accumulated cash generation of R$8.8 million in 9M16.
OPERATING RESULTS Total Company launches were R$736.4 million in 3Q16, comprised of 13 projects in the states of São Paulo, Rio
de Janeiro, Pernambuco, Bahia and Rio Grande do Sul, up from R$606.8 million launched in 3Q15. The Gafisa segment accounted for 56% of the quarter’s launches, while the Tenda segment accounted for the remaining 44%. 9M16 launches totaled R$1.6 billion.
Net pre-sales totaled R$497.0 million in 3Q16, an increase of 9.4% from the R$454.5 million recorded in 2Q16 and stable y-o-y. The Gafisa segment accounted for R$258.3 million and the Tenda segment for R$238.7 million in 9M16. Consolidated sales from launches in the quarter represented 63.2% of the total, while sales from inventory comprised the remaining 36.8%. The Company reached R$1.3 billion in net pre-sales in the first nine months of the year.
Consolidated sales over supply (SoS) reached 14.2% in 3Q16 compared to 13.9% in 2Q16 14.8% in 3Q15. On a trailing 12-month basis, Gafisa’s SoS was 26.1%, while Tenda’s SoS was 50.9%.
Consolidated inventory at market value increased 6.7% related to 2Q16, at R$3.0 billion. Gafisa’s inventory ended the quarter at R$2.0 billion, while Tenda’s inventory totaled R$1.0 billion.
Throughout the third quarter, the Company delivered 17 projects/phases, totaling 3,710 units, accounting for R$1.2 billion in PSV. In regards to the first nine months, the company delivered 36 projects/phases and 7,501 units, accounting for R$2.1 billion in PSV.

6
EARNINGS RELEASE
3Q16
EARNINGS RELEASE
3Q16
ANALYSIS OF RESULTS
Gafisa Segment
Sales Volume, Revenue Level and Profitability Impacted by the Challenging Market Environment
Table 2 – Gafisa Segment – Operating and Financial Highlights (R$ 000 and % Gafisa)
3Q16 2Q16 Q/Q(%) 3Q15 Y/Y(%) 9M16 9M15 Y/Y(%)
Launches 410,966 130,360 215% 288,234 43% 621,429 616,046 1%
Net pre-sales 258,332 129,519 99% 247,608 4% 454,693 669,599 -32%
Net pre-sales of launches 170,130 35,867 374% 71,433 138% 214,183 152,842 40%
Sales over Supply (SoS) 11.5% 6.3% 520 bps 11.0% 50 bps 18.7% 25.0% -630 bps
Delivered projects (Units) 1,899 1,241 53% 0 - 3,331 3,345 0%
Net Revenue 268,271 212,628 26% 402,483 -33% 651,881 1,090,933 -40%
Adjusted Gross Profit1 47,221 65,325 -28% 152,627 -69% 148,522 405,229 -63%
Adjusted Gross Margin1 17.6% 30.7% -1,310 bps 37.9% -2,030 bps 22.8% 37.1% -1,430 bps
Adjusted EBITDA 2 (15,693) 12,491 -226% 66,846 -123% (21,346) 177,535 -
Adjusted EBITDA Margin 2 -5.8% 5.9% -1,170 bps 16.6% -2,240 bps -3.3% 16.3% -1960 bps
Net Income (Loss) (95,667) (47,061) 103% 1,656 - (200,749) 30,312 -
Backlog Revenues 394,475 366,368 8% 557,508 -29% 394,475 557,508 -29%
Backlog Results3 143,324 133,975 7% 215,810 -34% 143,324 215,810 -34%
Backlog Margin³ 36.3% 36.6% -30 bps 38.7% -240 bps 36.3% 38.7% -240 bps
1) Adjusted by capitalized interests. 2) Adjusted by expenses with stock option plans (non-cash), minority. Gafisa’s Consolidated EBITDA does not consider the equity income from Alphaville. 3) Backlog results net of PIS/COFINS taxes (3.65%), and excluding the impact of PVA (Present Value Adjustment) method according to Law 11.638. 4) Backlog results comprise the projects restricted by condition precedent
Despite the strong performance of projects launched in the quarter, ongoing recessive scenario in Brazil keeps negatively impacting Gafisa segment’s financial results in 3Q16, in particular the level of inventory gross sales, volume of dissolutions and prices of the inventory projects. Despite a greater share of projects launched before 2015 in the 3Q16 gross sales mix (48.2% of gross sales), the high volume of dissolutions related to these projects (96.3% of dissolutions in the quarter) ended up concentrating part of the net volume of sales from inventory of more recent projects. Thus, revenues in the quarter were once again impacted by the following items: (i) lower volume of net sales in the period; and (ii) higher concentration of net sales in projects with slower evolution of work in progress.
Reflecting the operational variables mentioned above, the Gafisa segment ended 3Q16 with a gross margin of 0.4% compared to 27.0% in 3Q15 and 12.3% in 2Q16. The result was impacted by the following effects: (i) R$16.3 million non-recurrent loss from the sale of a land parcel with potential development directed to the commercial segment; (ii) R$9.5 million referring to a higher provision for a guarantee due to the increased volume of projects delivered in 3Q16; (iii) pricing adjustments on the sale of remaining units in response to current market prices, and; (iv) accounting effect related to higher appropriation of financial costs of recently launched projects with good sales speed, which suspension clause (of projects that are no longer subject to restriction) occurred in the period. Adjusted gross margin reached 17.6% in the quarter and 22.8% in the last 9 months.

7
EARNINGS RELEASE
3Q16
EARNINGS RELEASE
3Q16
Excluding the non-recurring effect of the sale of the land parcel mentioned above, Gafisa segment’s gross margin would have reached 6.4% in the 3Q16, while adjusted gross margin would be 23.7% in 3Q16 and 25.3% in 9M16.
Net Income
Net loss for the period was R$95.7 million compared to a loss of R$47.1 million in 2Q16 and a profit of R$1.7 million in 3Q15. Excluding the net loss from Alphaville equity income, which totaled R$9.2 million in the quarter, the Gafisa segment reported a 3Q16 net loss of R$86.5 million, compared to a net loss of R$35.1 million in 2Q16 and net profit of R$0.5 million in 3Q15. In 9M16, the Gafisa segment posted a net loss of R$190.5 million.
As previously stated, this was due to the following factors: (i) maintenance of lower level of revenues; (ii) lower gross margin level due to the factors detailed above; and (iii) the negative contribution of AUSA equity income. Alphaville performance is being affected by the Company’s lower operating volumes in 2016 (launches and sales), with direct reflect in the quarter's revenue level, besides the worsened net financial result, impacted by the higher cost of debt, compared to the previous year. In 9M16, Gafisa segment net loss including Alphaville equity income reached R$200.7 million.
Table 3 – Gafisa Segment – Net Income (R$ Million)
3Q16 2Q16 3Q15 9M16 9M15
Adjusted Gross Profit 47.2 65.3 152.6 148.5 405.2
Adjusted Gross Margin 17.6% 30.7% 37.9% 22.8% 37.1%
Net Income (95.7) (47.1) 1.7 (200.7) 30.3
Equity Income from Alphaville (9.2) (12.0) 1.2 (10.2) 23.3
Net Profit Ex-Alphaville (86.5) (35.1) 0.5 (190.5) 7.0

8
EARNINGS RELEASE
3Q16
EARNINGS RELEASE
3Q16
Tenda Segment
Operating and Financial Profitability Supported by Increased Scale and the Improved Performance of the New Model
Table 4 – Tenda Segment – Operating and Financial Highlights (R$ 000 and % Tenda)
3Q16 2Q16 Q/Q(%) 3Q15 Y/Y(%) 9M16 9M15 Y/Y(%)
Launches 325,393 414,678 -22% 318,585 2% 968,614 786,306 23%
Net pre-sales 238,686 324,992 -27% 245,195 -3% 830,176 778,679 7%
Net pre-sales of Launches 167,443 129,406 29% 162,543 3% 318,778 315,296 1%
Sales over Supply ( SoS) 18.8% 26.4% -760 bps 23.0% -420 bps 44.7% 48.7% -400 bps
Delivered projects ( Units) 1,811 1,895 -4% 1,304 39% 4,170 4,231 -1%
Net Revenue 270,509 260,743 4% 221,560 22% 765,804 644,140 19%
Adjusted Gross Profit1 94,759 72,951 30% 71,150 33% 241,971 198,235 22%
Adjusted Gross Margin1 35.0% 28.0% 700 bps 32.1% 290 bps 31.6% 30.8% 80 bps
Adjusted EBITDA2 39,744 21,858 82% 24,567 62% 85,042 60,902 40%
Adjusted EBITDA Margin2 14.7% 8.4% 630 bps 11.1% 360 bps 11.1% 9.5% 160 bps
Net Income ( Loss) 23,045 8,622 167% 11,830 95% 36,461 43,311 -16%
Backlog Revenues 269,361 301,000 -11% 251,343 7% 269,361 251,343 7%
Backlog Results3 115,869 125,889 -8% 109,040 6% 115,869 109,040 6%
Backlog Margin³ 43.0% 41.8% 120 bps 43.4% -40 bps 43.0% 43.4% -40 bps
1) Adjusted by capitalized interests. 2) Adjusted by expenses with stock option plans (non-cash), minority. Tenda does not hold equity interest in Alphaville. 3) Backlog results net of PIS/COFINS taxes (3.65%), and excluding the impact of PVA (Present Value Adjustment) method according to Law 11.638. 4) Backlog results comprise the projects restricted by condition precedent.
During 3Q16, Tenda continued to increase the scale its operations, supported by sales and launch performance, thus enabling a solid level of net revenue.
3Q16 adjusted gross margin was up 35.0%, compared with 28.0% in 2Q16 and 32.1% in 3Q15, due to the accounting reclassification of R$11.1 million in the balance of provision for co-obligation of interest rates on construction works owed by customers transferred and charged by financial institutions during period of works, which is now accounted for under Financial Result. Excluding this impact, the adjusted gross margin would have been 32.2% in 3Q16.
Selling, general and administrative expenses ended the 9M16 at R$127.2 million, 15.4% higher than 9M15, but in line with the expansion of Tenda’s operations; launch volumes increased by 23.2% in the period, compared to 9M15.
Adjusted EBITDA totaled R$39.7 million, with adjusted EBITDA margin of 14.7% in 3Q16. Adjusted EBITDA increased from R$24.6 million in 3Q15 and R$21.9 million in 2Q16. Year-to-date, adjusted EBITDA reached R$85.0 million with an adjusted EBITDA margin of 11.1%.
9
EARNINGS RELEASE
3Q16
EARNINGS RELEASE
3Q16
Net Income
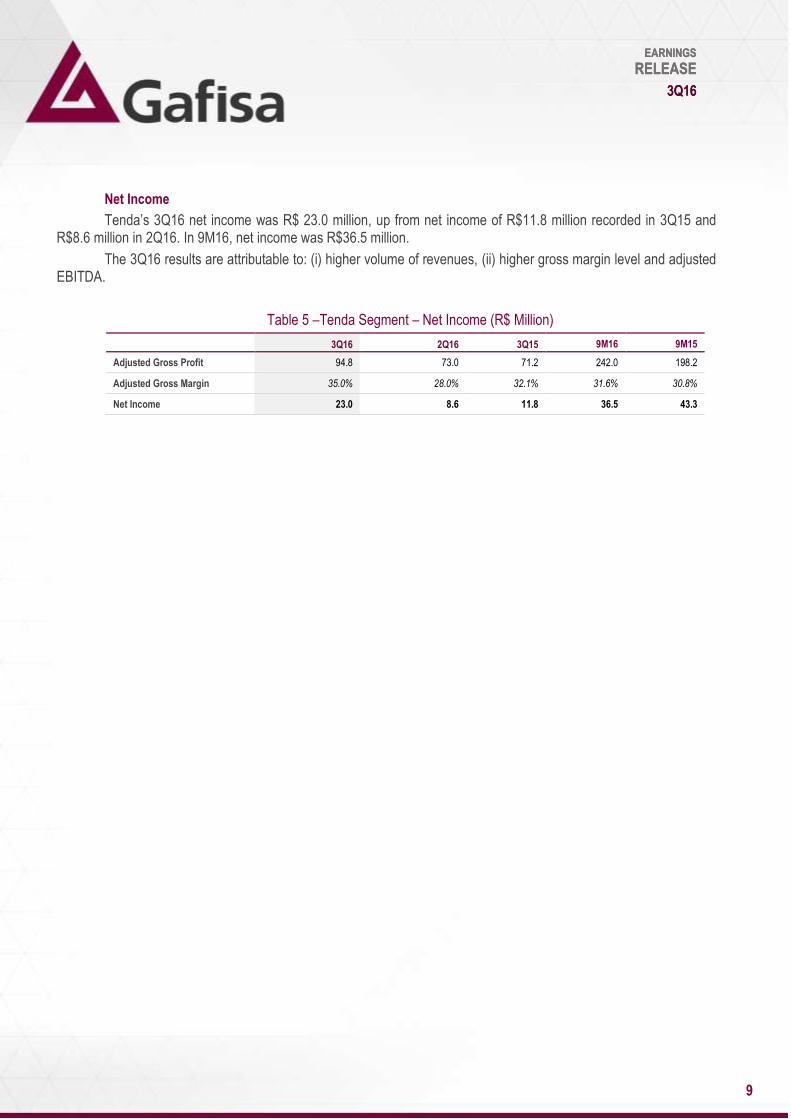
Tenda’s 3Q16 net income was R$ 23.0 million, up from net income of R$11.8 million recorded in 3Q15 and R$8.6 million in 2Q16. In 9M16, net income was R$36.5 million.
The 3Q16 results are attributable to: (i) higher volume of revenues, (ii) higher gross margin level and adjusted EBITDA.
Table 5 –Tenda Segment – Net Income (R$ Million)
3Q16 2Q16 3Q15 9M16 9M15
Adjusted Gross Profit 94.8 73.0 71.2 242.0 198.2
Adjusted Gross Margin 35.0% 28.0% 32.1% 31.6% 30.8%
Net Income 23.0 8.6 11.8 36.5 43.3

10
EARNINGS RELEASE
3Q16
EARNINGS RELEASE
3Q16
RECENT EVENTS
UPDATE ON THE SEPARATION PROCESS OF THE GAFISA AND TENDA UNITS
On October 19, 2016, the Company disclosed a Material Fact informing that the members of Gafisa Board of Directors approved the filing with the CVM of a public offering of secondary distribution of common shares issued by Tenda and owned by Gafisa.
The Offer will be subject to the conditions of the local and international capital markets. The request for registration of the Offer will be analyzed and, therefore, the Offer will commence only after the granting of the proper registration by the CVM.
The Company will keep its shareholders and the market informed about the process and any developments pertaining to the issues of the potencial offer.
TENDA EARNINGS RELEASE – 3Q16 AND 9M16
On October 18, 2016, Construtora Tenda published its interim financial statements for the nine-month period ended September 30, 2016, accompanied by the auditors' review report ( "ITR Tenda").
The ITR Tenda and the Earnings Release are available on the CVM (www.cvm.gov.br) and the Company (www.gafisa.com.br/ir and www.tenda.com/investors) websites.
11
EARNINGS RELEASE
3Q16
EARNINGS RELEASE
3Q16
42.0%
58.0%
Breakdown Net Sales 9M16 (%)
Launches Inventory
188
251 195 177 180
242 248 245
67
130
258
1Q14 2Q14 3Q14 4Q14 1Q15 2Q15 3Q15 4Q15 1Q16 2Q16 3Q16
Net Pre-Sales (R$ milion)
GAFISA SEGMENT
Focuses on residential developments within the upper, upper-middle, and middle-income segments, with average unit prices above R$250,000.00. 00.
Operating Results | Launches and Pre-Sales
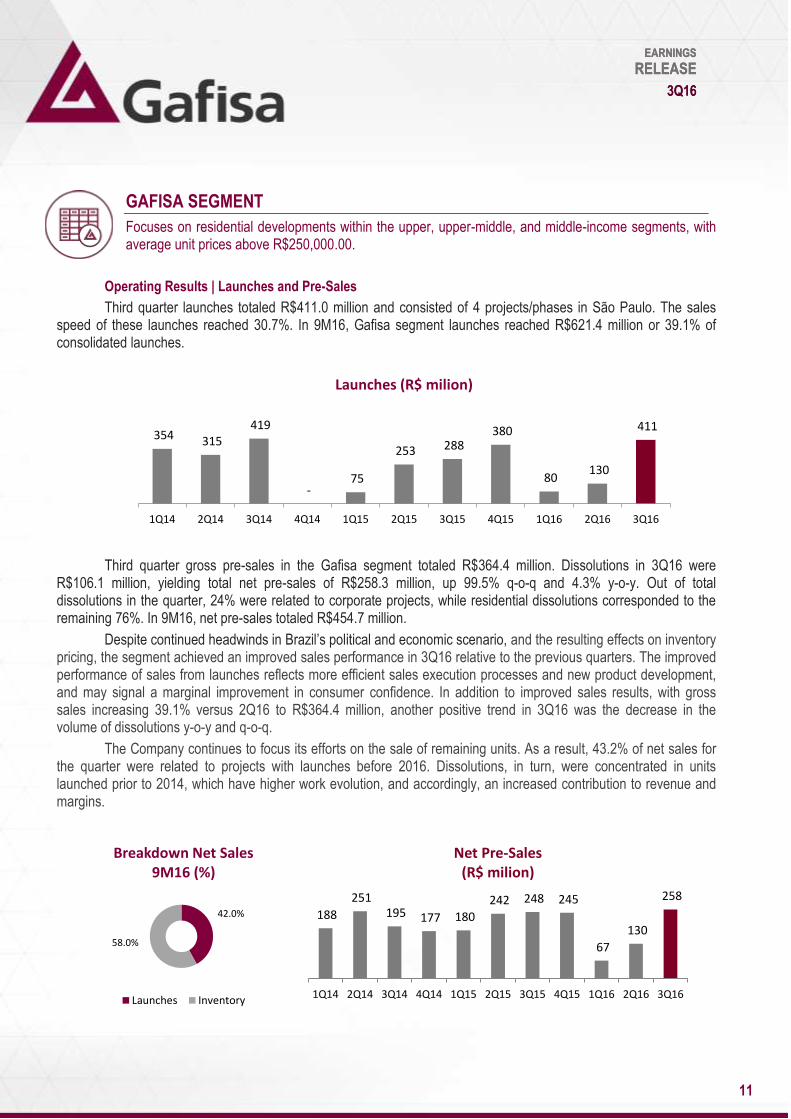
Third quarter launches totaled R$411.0 million and consisted of 4 projects/phases in São Paulo. The sales speed of these launches reached 30.7%. In 9M16, Gafisa segment launches reached R$621.4 million or 39.1% of consolidated launches.
Third quarter gross pre-sales in the Gafisa segment totaled R$364.4 million. Dissolutions in 3Q16 were R$106.1 million, yielding total net pre-sales of R$258.3 million, up 99.5% q-o-q and 4.3% y-o-y. Out of total dissolutions in the quarter, 24% were related to corporate projects, while residential dissolutions corresponded to the remaining 76%. In 9M16, net pre-sales totaled R$454.7 million.
Despite continued headwinds in Brazil’s political and economic scenario, and the resulting effects on inventory pricing, the segment achieved an improved sales performance in 3Q16 relative to the previous quarters. The improved performance of sales from launches reflects more efficient sales execution processes and new product development, and may signal a marginal improvement in consumer confidence. In addition to improved sales results, with gross sales increasing 39.1% versus 2Q16 to R$364.4 million, another positive trend in 3Q16 was the decrease in the volume of dissolutions y-o-y and q-o-q.
The Company continues to focus its efforts on the sale of remaining units. As a result, 43.2% of net sales for the quarter were related to projects with launches before 2016. Dissolutions, in turn, were concentrated in units launched prior to 2014, which have higher work evolution, and accordingly, an increased contribution to revenue and margins.
83 216
107
679
354 315 419
- 75
253 288 380
1T13 2T13 3T13 4T13 1T14 2T14 3T14 4T14 1T15 2T15 3T15 4T15
Launches (R$ million)
354 315 419
- 75
253 288 380
80 130
411
1Q14 2Q14 3Q14 4Q14 1Q15 2Q15 3Q15 4Q15 1Q16 2Q16 3Q16
Launches (R$ milion)

12
EARNINGS RELEASE
3Q16
EARNINGS RELEASE
3Q16
Table 6 – Gafisa Segment – Launches and Pre-sales (R$ 000)
3Q16 2Q16 Q/Q(%) 3Q15 Y/Y(%) 9M16 9M15 Y/Y(%)
Launches 410,966 130,360 215% 288,234 43% 621,429 616,046 1%
Pre- Sales 258,332 129,519 99% 247,608 4% 454,693 669,599 -32%
Sales over Supply (SoS)
The Gafisa segment’s SoS for the last twelve months reached 26.1% compared to 29.6% in the same period last year. In the 3Q16, SoS was 11.5% compared to 6.3% in 2Q16 and 11.0% in 3Q15.
Dissolutions
The macroeconomic uncertainty observed in 2016 and the recession have directly impacted consumer confidence and, accordingly, the level of gross sales and dissolutions. In the context of a challenging operating environment, the level of dissolutions in the Gafisa segment reached R$106.1 million in 3Q16, down sequentially compared to R$132.5 million in 2Q16 and down y-o-y from R$147.2 million in 3Q15. In 9M16, the total volume of dissolutions was R$408.9 million.
Over the last three years, the Company has been working on initiatives to strengthen the credit review component of its sale process. In doing so, the Company intends to reduce the level of dissolutions throughout the construction and delivery cycle. Given the current political and economic uncertainties and corresponding effects on the real estate market, the reduction in dissolutions has been slower than expected.
A comprehensive approach in the credit review process at the time of sale has generated a more efficient process of transferring Gafisa customers to financial institutions, even amid an unfavorable economic environment. As an example of the efficiency achieved in this process, only 9.5% of those who asked for transfers in 9M16 have been rejected by the bank’s credit analysis (i.e. out of the 915 units asking for transfers, only 87 were not accepted).
In recent quarters the Gafisa segment has been able to reduce the level of dissolutions by enabling customers facing financial pressure to swap their units for those that better match their financial position. This exchange process reflects the flexibility of Gafisa’s product portfolio. Year-to-date, R$94.7 million of new sales were made to customers who opted for swaps.
In the quarter, 213 Gafisa units were cancelled and 133 units, representing R$63.6 million, were resold within the period. In 9M16, 713 units were cancelled, with the resale of 392 units in the same period, or R$198.9 million.
32.3% 31.8% 30.4% 26.1% 27.9% 29.7% 29.6% 31.1% 28.9% 26.5% 26.1%
1Q14 2Q14 3Q14 4Q14 1Q15 2Q15 3Q15 4Q15 1Q16 2Q16 3Q16
SoS 12M
80 120
151
85 125 116
147 125
170 132
106
1Q14 2Q14 3Q14 4Q14 1Q15 2Q15 3Q15 4Q15 1Q16 2Q16 3Q16
Dissolutions (R$ Million)

13
EARNINGS RELEASE
3Q16
EARNINGS RELEASE
3Q16
Inventory
Gafisa is maintaining its focus on inventory reduction initiatives. Projects launched prior to 2016 represented 58.0% of net sales in the year. The market value of the Gafisa segment’s inventory increased by 3.5% q-o-q, and decreased 1.5% y-o-y, totaling R$2.0 billion. The reduction reflects the sale of units in the period, and price adjustments on some projects in inventory, as to reflect more efficiently the current market scenario. Finished units outside of core markets accounted for R$45.3 million, or 2.3% of total inventory.
Table 7 – Gafisa Segment – Inventory at Market Value (R$ 000)
Inventories BoP 2Q16 Launches Dissolutions Gross Sales Adjustments¹ Inventories BoP 3Q16 Q/Q (%)
São Paulo 1,386,973 410,966 81,315 (318,224) (42,210) 1,518,820 9.5%
Rio de Janeiro 475,491 - 21,773 (31,114) (49,720) 416,430 -12.4%
Other Markets 51,160 - 3,035 (15,116) 6,179 45,258 -11.5%
Total 1,913,624 410,966 106,123 (364,454) (85,751) 1,980,508 3.5%
¹ The Period Adjustments reflect the updates related to the project scope, launch date and pricing update in the period.
During the same period, finished units represented R$717.0 million, or 36.2% of total inventory. Inventory from projects launched outside core markets, which is comprised exclusively of finished units, represented R$45.3 million, a decrease of 53.2% when compared to R$96.6 million in 3Q15 and down 11.5% from 2Q16. The Company estimates that through the beginning of 2017, it will have monetized a large portion of its inventory in non-core markets, based on the strong sales rate observed in these markets over the past few quarters.
The inventory of concluded commercial projects accounts for approximately 53,5% of Gafisa segment total volume of concluded projects, not only due to the high volume of commercial projects delivered during the last 12 months, but also to the current low liquidity for these projects. Three commercial projects were delivered in 3Q16 with PSV of R$395.5 million. The challenging macroeconomic scenario and, mainly, the high interest rates, has strongly impacted commercial developments, causing higher likelihood of cancellation and lower sales speed. It is worth mentioning that in its current portfolio of projects under construction, the Company only has one commercial project, accounting for R$24.3 million in PSV, with delivery expected in 1H18.
In regards to Gafisa’s inventory, approximately 52% or R$1.0 billion, is concentrated in projects to be delivered after 3Q17 and will not significantly increase the segment’s inventory of finished units in the short term.
Table 8 – Gafisa Segment – Inventory at Market Value- Work Status - POC (R$ 000)
Not Initiated Up to 30% built 30% a 70% built More than 70% built Finished Units Total 3Q16
São Paulo - 17,544 916,215 236,616 348,445 1,518,820
Rio de Janeiro - 4,463 53,827 34,803 323,337 416,430
Other Markets - - - - 45,258 45,258
Total - 22,007 970,042 271,419 717,040 1,980,508
Inventory at market value includes projects in partnership. This index is not comparable to the accounting inventory, due to the implementation of new accounting practices on behalf of CPCs 18, 19 and 36.

14
EARNINGS RELEASE
3Q16
EARNINGS RELEASE
3Q16
Inventory Delivery Schedule
Landbank
The Gafisa segment landbank, with a PSV of R$5.1 billion, is comprised of 30 land parcels, representing 41 potential projects/phases, and corresponding to nearly 11.4 thousand units. 65% of potential projects/phases are located in São Paulo and 35% are located in Rio de Janeiro. The largest portion of land acquired through swap agreements is located in Rio de Janeiro, bringing the total percentage of land acquired through swaps to 61.9%.
Table 9 – Gafisa Segment - Landbank (R$ 000)
PSV (% Gafisa) % Swap
Total % Swap Units % Swap Financial
Potential Units (% Gafisa)
Potential Units (100%)
São Paulo 3,321,410 53.6% 53.6% 0.0% 7,594 8,377
Rio de Janeiro 1,813,527 72.5% 72.5% 0.0% 2,967 3,021
Total 5,134,937 61.9% 61.9% 0.0% 10,561 11,398
¹ The swap percentage is measured compared to historical cost of land acquisition. ² Potential units are net of swaps and refer to the Gafisa’s and/or its partners’ stake in the project.
Table 10 - Gafisa Segment - Changes in the Landbank (2Q16 x 3Q16 - R$ 000)
Initial Landbank Land Acquisition Launches Dissolutions Adjustments Final Landbank
São Paulo 3,838,867 - (410,966) (120,188) 13,697 3,321,410
Rio de Janeiro 1,728,250 73,425 - - 11,852 1,813,527
Total 5,567,117 73,425 (410,966) (120,188) 25,549 5,134,937
In 3Q16, the Company acquired a new land parcel with a potential PSV of R$73.4 million, and an acquisition cost of R$11.4 million. It was financed 22% by cash and 78% by swap agreements, with an initial disbursement of R$1.0 million. The disbursement schedule of the residual value is subject to the launch date.
The quarterly adjustments reflect updates related to project scope, expected launch date and other adjustments to landbank in the period.
36%
11% 25%
28%
Inventory 3Q16
19%
27% 30%
24%
Inventory 3Q15
Concluded
Delivery within 1 year
Delivery within 2 years
Delivery + 2 Years

15
EARNINGS RELEASE
3Q16
EARNINGS RELEASE
3Q16
Gafisa Sales
Gafisa Vendas, the Company’s independent sales unit, with operations in São Paulo and Rio de Janeiro, accounted for 59% of gross sales in 9M16.
Gafisa Vendas currently has a team of 514 highly trained, dedicated consultants, in addition to an online sales force.
Gafisa Segment Delivered Projects
During 3Q16, 7 projects/phases totaling 1,899 units were delivered, accounting for R$935.7 million in PSV. In 9M16, 13 projects/phases totaling 3,331 units were delivered, accounting for R$1.5 billion in PSV. Currently, Gafisa has 19 projects under construction, all of which are on schedule according to the Company’s business plan.
Table 11 – Gafisa Segment – Breakdown of Delivered Projects 9M16
Residential Commercial Total
São Paulo 781,531 395,470 1,177,001
Rio de Janeiro 189,601 86,225 275,826
Total 971,132 481,695 1,452,827
Transfers
Over the past few years, the Company has been taking steps to improve the performance of its receivables/transfer process, in an attempt to achieve higher rates of return on invested capital. Currently, the Company’s strategy is to transfer 90% of eligible units in a 90-day period after the delivery of the project. In accordance with this policy, transfers totaled R$126.0 million in PSV in the third quarter.
Table 12 – Gafisa Segment – Delivered Projects
3Q16 2Q16 Q/Q(%) 3Q15 Y/Y(%) 9M16 9M15 Y/Y(%)
PSV Transferred ¹ 126,013 142,697 -12% 153,646 -18% 378,733 521,489 -27%
Delivered Projects 7 4 75% - - 13 14 -7%
Delivered Units 1,899 1,241 53% - - 3,331 3,345 0%
Delivered PSV² 935,678 412,307 127% - - 1,452,827 1,346,716 8%
1) PSV refers to potential sales value of the units transferred to financial institutions. 2) PSV = Potential sales value of delivered units.

16
EARNINGS RELEASE
3Q16
EARNINGS RELEASE
3Q16
Financial Results Revenue
3Q16 net revenues for the Gafisa segment totaled R$268.3 million, up 26.2% q-o-q and down 33.3% y-o-y. 3Q16 revenues were impacted by higher net sales volumes compared to 2Q16 and the sales mix, with a higher concentration of sales of launches. In 9M16, net revenue reached R$651.9 million.
In the quarter, 99% of Gafisa segment revenues derived from projects located in Rio de Janeiro and São Paulo. The table below provides additional details.
Table 13 – Gafisa Segment – Revenue Recognition (R$ 000)
3Q16 3Q15
Launches Pre-Sales % Sales Revenue % Revenue Pre-Sales % Sales Revenue % Revenue
2016 146,728 57% 57,865 22% - 0% - 0%
2015 38,110 15% 46,046 17% 71,433 29% 43,229 11%
2014 32,649 13% 92,382 34% 68,354 28% 73,763 18%
2013 18,806 7% 41,870 16% 79,054 32% 124,134 31%
≤ 2012 22,039 8% 30,107 11% 28,767 11% 161,357 40%
Total 258,332 100% 268,270 100% 247,608 100% 402,483 100%
SP + RJ 227,963 88% 264,897 99% 240,675 97% 401,549 100%
Other Markets 30,369 12% 3,373 1% 6,933 3% 934 0%
Gross Profit & Margin
3Q16 gross profit for the Gafisa segment was R$1.0 million, down from R$26.1 million in 2Q16, and down from R$108.8 million in the prior year period, resulting from the following effects: (i) a R$16.3 million loss on the sale of a land parcel with potencial development directed to the commercial segment; (ii) a R$9.5 million provision for guarantee due to a higher volume of projects delivered in 3Q16; and (iii) pricing adjustments in the sale of units in response to current market prices. . Excluding the non-recurring effect of the sale of the land parcel mentioned above, Gafisa segment’s gross margin would have reached 6.4% in 3Q16, while adjusted gross margin would be 23.7% in 3Q16 and 25.3% in 9M16.
Besides the issues mentioned above, gross margin in 3Q16 also reflects the accounting effect of increased appropriation of financial cost of recently launched projects with good sales speed, which suspensive clause (of projects that are no longer subject to restriction) has occurred in the period. This reflects accounting conventions which recognize financial costs in line with the percentage sold, and not recognizing revenues according to the PoC method. As a result, 3Q16 gross margin was 0.4%, compared to 12.3% in 2Q16 and 27.0% in 3Q15.
Excluding financial impacts, adjusted gross margin reached 17.6% in 3Q16 compared to 30.7% in 2Q16 and 37.9% in 3Q15.
The table below contains more details on the breakdown of 3Q16 Gafisa’s gross margin.

17
EARNINGS RELEASE
3Q16
EARNINGS RELEASE
3Q16
Table 14 - Gafisa Segment – Gross Margin (R$ 000)
3Q16 2Q16 Q/Q (%) 3Q15 Y/Y(%) 9M16 9M15 Y/Y(%)
Net Revenue 268,271 212,628 26% 402,483 -33% 651,881 1,090,933 -40%
Gross Profit 963 26,084 -96% 108,830 -99% 30,503 297,245 -90%
Gross Margin 0.4% 12.3% -1,190 bps 27.0% -2,660 bps 4.7% 27.2% -2,250 bps
(-) Financial Costs 46,258 39,241 18% 43,797 6% 118,019 107,984 9%
Adjusted Gross Profit 47,221 65,325 -28% 152,627 -69% 148,522 405,229 -63%
Adjusted Gross Margin 17.6% 30.7% -1,310 bps 37.9% -2,030 bps 22.8% 37.1% -1,430 bps
Table 15 – Gafisa Segment – Gross Margin Breakdown (R$ 000)
SP + RJ Other Markets 3Q16
Net Revenue 264,898 3,373 268,271
Adjusted Gross Profit 46,191 1,030 47,221
Adjusted Gross Margin 17.4% 30.5% 17.6%
Selling, General and Administrative Expenses (SG&A)
SG&A expenses totaled R$52.2 million in 3Q16, up 12.0% y-o-y and 31.4% q-o-q. In the 9M16, these expenses totaled R$135.8 million, 3.1% down from R$140.0 million in the past year.
Selling expenses increased 9.6% when compared to 3Q15 and 22.0% sequentially 2Q16, due to an increased level of launch volumes in the period and current market conditions requiring sales and marketing investments to stimulate demand. Year-to-date, selling expenses increased 3.5% compared to 9M15.
The segment’s general and administrative expenses reached R$27.5 million in 3Q16, an increase of 14.4% compared to the previous year and 41.1% compared to 2Q16. Given the absence of a provision for Profit Sharing in the previous quarter, the net effect in the 3Q16 was R$6.2 million. Year-to-date, G&A expenses reached R$74.1 million, compared to R$80.4 million in 9M15, a decrease of 7.9%.
SG&A levels reflect the Company's commitment to improving operational efficiency and achieving a level of costs and expenses that is consistent with the business cycle and current economic outlook.
Table 16 – Gafisa Segment – SG&A Expenses (R$ 000)
3Q16 2Q16 Q/Q (%) 3Q15 Y/Y(%) 9M16 9M15 Y/Y(%)
Selling Expenses (24,701) (20,245) 22% (22,543) 10% (61,692) (59,611) 3%
G&A Expenses (27,544) (19,524) 41% (24,087) 14% (74,070) (80,438) -8%
Total SG&A Expenses (52,245) (39,769) 31% (46,630) 12% (135,762) (140,049) -3%
Launches 410,966 130,360 215% 288,234 43% 621,429 616,046 1%
Net Pre-sales 258,332 129,519 99% 247,608 4% 454,693 669,599 -32%
Net Revenue 268,271 212,628 26% 402,483 -33% 651,881 1,090,933 -40%

18
EARNINGS RELEASE
3Q16
EARNINGS RELEASE
3Q16
Other Operating Revenues/Expenses reached R$14.5 million in 3Q16, a 52.6% decrease compared to 3Q15, and 23.4% compared to 2Q16.
The Company continues to be proactive in mitigating risks associated with potential contingencies.
The table below contains more details on the breakdown of this expense.
Table 17 – Gafisa Segment – Other Operating Revenues/Expenses (R$ 000)
3Q16 2Q16 Q/Q (%) 3Q15 Y/Y(%) 9M16 9M15 Y/Y(%)
Litigation Expenses (13,278) (15,461) -14% (23,519) -44% (44,543) (68,106) -35%
Other (1,243) (3,496) -64% (7,087) -82% (3,511) (12,399) -72%
Total (14,521) (18,957) -23% (30,606) -53% (48,054) (80,505) -40%
A higher volume of deliveries over the past three years, due to the delivery of delayed projects in legacy regions, led to an increase in the level of contingencies. As a result, the Gafisa segment continues to concentrate its operations only in the metropolitan regions of São Paulo and Rio de Janeiro. This strategic geographical positioning, combined with improved internal processes, is expected to result in fewer future legal claims and a subsequent decrease in the amount of expenses related to contingencies in the following years.
Adjusted EBITDA
Adjusted EBITDA for the Gafisa segment was negative R$15.7 million in 3Q16, compared to the positive R$12.5 million result reported in 2Q16 and positive R$66.8 million result reported in 3Q15. Year-to-date adjusted EBITDA was negative R$21.3 million, compared to the positive result of R$177.5 million in 9M15. 3Q16 Adjusted EBITDA was mainly impacted year-over-year by the following factors: (i) lower gross profit in the quarter due to negative result from the sale of a land parcel located outside of the current business plan, (ii) higher volume of provisions for guarantee and effect of current market conditions; and (iii) higher levels of selling, general and administrative expenses compared to 2Q16. As a reminder, adjusted EBITDA for the Gafisa segment does not include equity income from Alphaville.
The adjusted EBITDA margin was negative 5.8%, compared to a positive margin of 16.6% in 3Q15, and a positive margin of 5.9% in 2Q16. The adjusted EBITDA margin YTD was negative 3.3%.
Table 18 – Gafisa Segment - Adjusted EBITDA (R$ 000)
3Q16 2Q16 Q/Q (%) 3Q15 Y/Y(%) 9M16 9M15 Y/Y(%)
Net Profit (Loss) (95,667) (47,061) 103% 1,656 -5877% (200,749) 30,312 -762%
(+) Financial Results 5,292 2,039 160% 17,719 -70% 7,375 30,429 -76%
(+) Income Taxes 1,076 (421) - (5,143) - 6,645 2,485 167%
(+) Depreciation & Amortization 8,180 5,644 45% 8,422 -3% 23,332 24,780 -6%
(+) Capitalized interests 46,258 39,241 18% 43,797 6% 118,019 107,984 9%
(+) Expense w stock Option Plan 2,316 1,300 78% 1,919 21% 5,506 5,859 -6%
(+) Minority Shareholders 7,694 (203) - (356) - 8,296 (975) -
(-) AUSA Income Effect 9,158 11,952 -23% (1,168) - 10,230 (23,339) -
Adjusted EBITDA (15,693) 12,491 - 66,846 - (21,346) 177,535 -
Net Revenue 268,271 212,628 26% 402,483 -33% 651,881 1,090,933 -40%
Adjusted EBITDA Margin -5.8% 5.9% -1,170 bps 16.6% -2,240 bps -3.3% 16.3% -1,960 bps
1) EBITDA is adjusted by expenses associated with stock option plans, as this is a non-cash expense.

19
EARNINGS RELEASE
3Q16
EARNINGS RELEASE
3Q16
Backlog of Revenues and Results
The backlog of results to be recognized under the PoC method increased year-over-year to R$143.3 million in 3Q16. The consolidated margin was 36.3% in the quarter, compared to 38.7% posted in last year’s third quarter.
Table 19 – Gafisa Segment – Backlog Results (REF) (R$ 000)
3Q16 2Q16 Q/Q(%) 3Q15 Y/Y(%)
Backlog Revenues 394,475 366,368 8% 557,508 -29%
Backlog Costs (units sold) (251,151) (232,393) 8% (341,698) -26%
Backlog Results 143,324 133,975 7% 215,810 -34%
Backlog Margin 36.3% 36.6% -30 bps 38.7% -240 bps
¹ Backlog results net of PIS/COFINS taxes (3.65%), and excluding the impact of PVA (Present Value Adjustment) method according to Law 11.638
² Backlog results comprise the projects restricted by condition precedent.

20
EARNINGS RELEASE
3Q16
EARNINGS RELEASE
3Q16
TENDA SEGMENT
Focuses on affordable residential developments, classified within the Range II of Minha Casa Minha Vida Program. 00
Operating Results | Launches and Sales
Third quarter launches totaled R$325.4 million and included 9 projects/phases in the states of São Paulo, Rio de Janeiro, Pernambuco, Bahia and Rio Grande do Sul. In the first nine months of the year, launch volumes reached R$968.6 million.
During 3Q16, gross sales reached R$318.7 million and dissolutions were R$80.0 million, resulting in total net pre-sales of R$238.7 million, down 2.7% y-o-y and 26.6% q-o-q. In the 9M16, the volume of dissolutions was R$184.2 million and net pre-sales totaled R$830.2 million. In nine months, 61.6% of total net sales were related to remaining units.
Table 20 – Tenda Segment – Launches and Pre-sales (R$ 000)
3Q16 2Q16 Q/Q (%) 3Q15 Y/Y(%) 9M16 9M15 Y/Y(%)
Launches 325,393 414,678 -21% 318,585 2% 968,614 786,306 23%
Pre-Sales 238,686 324,992 -27% 245,195 -3% 830,176 778,679 7%
181 99 91
242 238 229 319 303
229
415 325
1Q14 2Q14 3Q14 4Q14 1Q15 2Q15 3Q15 4Q15 1Q16 2Q16 3Q16
Launches (R$ milion)
52
182
36
127
244 290
245 237 266
325
239
1Q14 2Q14 3Q14 4Q14 1Q15 2Q15 3Q15 4Q15 1Q16 2Q16 3Q16
Net Pre-Sales (R$ million)
38.4%
61.6%
Sales Breakdown- 6M16
Launches Inventory

21
EARNINGS RELEASE
3Q16
EARNINGS RELEASE
3Q16
Sales Over Supply (SoS)
In 3Q16, sales velocity (sales over supply) was 18.8%, and on a trailing 12-month basis, Tenda’s SoS was 50.9%.
Below is a breakdown of Tenda’s SoS, which includes both legacy and New Model projects.
Table 21. SoS Gross Revenue (Ex-Dissolutions) Table 22. SoS Net Revenue
3Q15 4Q15 1Q15 2Q16 3Q16
New Model 29.6% 27.4% 29.7% 32.2% 26.5%
Legacy 19.4% 13.3% 20.7% 25.0% 16.0%
Total 26.9% 24.4% 28.0% 31.1% 25.1%
Dissolutions
The level of dissolutions totaled R$80.0 million in 3Q16, an increase of 90.4% compared to 3Q15 and 38.1% compared to 2Q16.
Tenda maintains its policy of immediately transferring a sale and the reduction in the legacy project portfolio. However, the percentage of dissolutions over gross sales reached 25.1% in 3Q16, higher than the average level seen in previous periods due to the following factors: (i) seasonality related to projects sold in “Feirão da Caixa” (2Q16); (ii) introduction of in-person interviews in bank branches as an additional step in the process of analyzing and granting credit by financial agents, which led to annulments of already preapproved customers and; (iii) review of Tenda’s unilateral dissolution process for sales not transferred after a period exceeding three months as the prior process allowed for some units to remain beyond the deadline deemed appropriate by the Company.
We estimate that this last factor should result in a temporary increase in the level of Company dissolutions before returning to the average levels that we expect.
3Q15 4Q15 1Q15 2Q16 3Q16
New Model 27.1% 24.9% 26.9% 28.9% 21.2%
Legacy 11.4% 5.2% 10.7% 11.9% 3.2%
Total 23.0% 20.9% 23.9% 26.4% 18.8%
193
118 146
66 56 54 42 40 46 58 80
1Q14 2Q14 3Q14 4Q14 1Q15 2Q15 3Q15 4Q15 1Q16 2Q16 3Q16
Dissolutions (R$ million)
41.6% 44.2% 37.8% 32.3% 42.2% 48.5% 52.4% 53.0% 55.0% 54.2% 50,9%
1Q14 2Q14 3Q14 4Q14 1Q15 2Q15 3Q15 4Q15 1Q16 2Q16 3Q16
SoS L12M

22
EARNINGS RELEASE
3Q16
EARNINGS RELEASE
3Q16
Table 23. PSV Dissolutions Tenda Segment (R$ 000 and % of total gross sales)
3Q15 % GS 4Q15 % GS 1Q15 % GS 2Q16 % GS 3Q16 % GS
New Model 19,576 6.8% 22,201 8.0% 20,490 6.6% 24,030 6.3% 58,802 18.5%
Legacy 22,447 7.8% 17,686 6.4% 25,736 8.2% 33,904 8.9% 21,194 6.7%
Total 42,023 14.6% 39,887 14.4% 46,226 14.8% 57,934 15.1% 79,995 25.1%
Tenda remained focused on the completion and delivery of legacy projects. In addition, the Company is dissolving contracts with ineligible clients to resell the related units to new, qualified customers.
During the quarter, 562 units were cancelled and returned to inventory, of which 294 units were resold to qualified customers during the same period. The sale and transfer process plays an important role in Tenda’s business model. It is expected that within a 90-day period, the effective sale and transfer process will be completed.
Tenda Segment Transfers
In the 3Q16, 1,632 units were transferred to financial institutions, representing R$208.8 million in net presales. It is worth noting that the banking strike that lasted throughout the month of September detracted from the performance of lending. The volume should normalize over the coming months.
Table 24 – Tenda Segment - PSV Transferred- Tenda (R$ 000)
3Q14 4Q14 1Q15 2Q15 3Q15 4Q15 1Q16 2Q16 3Q16
New Model 59,736 67,621 114,939 199,423 194,719 165,691 236,120 205,410 179,807
Legacy 100,361 74,773 59,110 61,566 53,912 40,050 30,642 56,184 29,020
Total 160,097 142,393 174,049 260,989 248,631 205,741 266,762 261,594 208,827
1) PSV transferred refers to the conclusion of the transfer operation. 2) PSV = Potential sales volume of the units.
Tenda Segment Delivered Projects
During 3Q16, Tenda delivered 10 projects/phases and 1,811 units, accounting for a PSV of R$265.1 million. In 9M16, 23 projects/phases and 4,170 units were delivered, accounting for R$602.2 million in PSV.
Inventory
The market value of Tenda’s inventory was R$1.0 billion at the end of the 3Q16, up 13.5% compared to R$906.3 million at the end of 2Q16. Inventory related to the legacy units totaled R$159.9 million or 15.5% of the total Tenda inventory, down 13.0% versus 2Q16 and 35.2% compared to 3Q15. During the quarter, inventory units within the Minha Casa Minha Vida program totaled R$1.0 billion, or 97.9% of total inventory, while units outside the program totaled R$21.5 million, a decrease of 10.4% q-o-q and of 81.0% y-o-y.

23
EARNINGS RELEASE
3Q16
EARNINGS RELEASE
3Q16
Table 25 –Tenda Segment – Inventory at Market Value (R$ 000) – by Region
Inventory EP 2Q16 Launches Dissolutions Pre- Sales Price
Adjustments + Others
Inventory EP 3Q16
% Q/Q
São Paulo 208,474 34,043 12,805 (78,414) 10,047 186,955 -10%
Rio Grande do Sul 94,250 106,748 13,363 (48,119) 9,077 175,319 86%
Rio de Janeiro 237,802 97,232 24,188 (74,411) 7,882 292,693 23%
Bahia 165,720 53,450 9,410 (49,181) 5,234 184,633 11%
Pernambuco 51,615 33,920 4,514 (31,377) 1,658 60,330 17%
Minas Gerais 119,234 - 8,927 (28,659) 1,760 101,262 -15%
Other 29,228 - 6,788 (8,521) (216) 27,279 -7%
Total Tenda 906,323 325,393 79,995 (318,682) 35,442 1,028,471 13%
MCMV 882,273 325,393 71,715 (308,512) 36,052 1,006,921 14%
Out of MCMV 24,050 - 8,280 (10,170) (610) 21,550 -10%
1) The quarter adjustments reflect updates related to project scope, expected launch date and price adjustments in the period.
Table 26 – Tenda Segment – Inventory at Market Value – Work Status(R$ 000)
Not Initiated Up to 30% built 30% to 70% built More than 70%
built Finished Units¹ Total 3Q16
New Model – MCMV 281,143 234,226 242,117 63,680 47,439 868,605
Legacy – MCMV - - 62,503 - 75,813 138,316
Legacy – Out of MCMV - - - - 21,550 21,550
Total Tenda 281,143 234,226 304,620 63,680 144,802 1,028,471
1) Inventory at market value includes projects in partnership. This index is not comparable to the accounting inventory, due to the implementation of new accounting practices on behalf of CPC’s 18, 19 and 36.
Regarding inventory projects, the Tenda segment is still awaiting legal approval for a suspended project with a total PSV of R$62.5 million to move forward with construction.

24
EARNINGS RELEASE
3Q16
EARNINGS RELEASE
3Q16
Tenda Segment Landbank
The Tenda landbank, with a PSV of approximately R$4.2 billion, is comprised of 127 different projects/phases. Out of these projects/phases, 26% are located in Bahia, 24% in São Paulo, 22% in Rio de Janeiro, 14% in Rio Grande do Sul, 8% in Pernambuco and 6% in Minas Gerais. In total, these projects/phases reflect more than 31,000 units.
Table 27 – Tenda Segment - Landbank (R$ 000)
PSV
(% Tenda) % Swap
Total % Swap
Units % Swap
Financial
Potential Units
(% Tenda)
Potential Units
(100%)
São Paulo 1,029,487 0.0% 0.0% 0.0% 6,688 6,688
Rio Grande do Sul 573,080 21.1% 10.6% 10.5% 4,292 4,340
Rio de Janeiro 920,234 20.1% 20.1% 0.0% 6,782 6,871
Bahia 1,090,939 5.6% 4.8% 0.8% 8,690 8,712
Pernambuco 334,677 26.8% 11.5% 15.3% 2,646 2,672
Minas Gerais 255,649 25.0% 25.0% 0.0% 1,806 1,840
Total 4,204,066 12.5% 9.1% 3.4% 30,904 31,123
¹ Swap percentage over the historical cost of land acquisition. ² Potential Units are net of swaps and refer to Tenda’s and/or its partners’ stake in the projects.
Table 28 –Tenda Segment – Changes in the Landbank (2Q16 x 3Q16 - R$ 000)
Initial Landbank Land Acquisition Launches Adjustments Final Landbank
São Paulo 1,022,885 46,834 (34,043) (6,189) 1,029,487
Rio Grande do Sul 685,382 - (106,748) (5,554) 573,080
Rio de Janeiro 928,336 106,052 (97,232) (16,922) 920,234
Bahia 1,146,693 23,907 (53,450) (26,211) 1,090,939
Pernambuco 458,090 28,184 (33,920) (117,677) 334,677
Minas Gerais 209,149 46,500 - - 255,649
Total 4,450,535 251,477 (325,393) (172,553) 4,204,066
In 3Q16, the Company acquired 8 new land plots with a potential PSV of R$232.0 million. These had an acquisition cost of R$18.2 million, 95% to be paid in cash and 5% to be paid via swap. Moreover, it has reinstated land parcels with potential PSV of approximately R$133.1 million, which were previously for sale; they were added to landbank, due to positive results from new feasibility studies.
New Model Update and Turnaround
Tenda is focused on expanding launch volumes under its New Business Model, which is based on three pillars: operational efficiency, risk management, and capital discipline.
The Company continues to operate in six macro regions: São Paulo, Rio de Janeiro, Belo Horizonte, Porto Alegre, Salvador and Recife. Tenda has a total of 81 projects/phases and a launched PSV of R$3.0 billion since 2013. Below is a brief description of the average performance of these projects, per region.
Notably, Tenda has delivered 42 projects/phases since 2013, totaling 9,853 units and R$1.4 billion in PSV, all of them maintaining the performance and profitability drivers established in the New Model.

25
EARNINGS RELEASE
3Q16
EARNINGS RELEASE
3Q16
Table 29. Tenda – New Model Monitoring 2013 – 2016
SP RJ BA PE MG RS 2013
Number of Projects 4 1 2 - - - 7
Units launched 1,380 300 779 - - - 2,459
Total PSV (R$ 000) 189.7 40.4 83.9 - - - 314
Units Sold 1,379 281 771 - - - 2,431
% Sold 100% 94% 99% - - - 99%
SoS Avg (Month) 11% 5% 6% - - - 9%
Transfers 1,379 270 763 - - - 2,412
% Transferred (Sales) 100% 90% 98% - - - 98%
Work Progress 100% 100% 100% - - - 100%
SP RJ BA PE MG RS 2014
Number of Projects 4 4 4 1 1 - 14
Units launched 720 1,511 1,220 432 432 - 4,315
Total PSV (R$ 000) 117.8 224.8 151.5 58.8 60.4 - 613
Units Sold 706 1,418 1,191 427 387 - 4,129
% Sold 98% 94% 98% 99% 90% - 96%
SoS Avg (Month) 13% 5% 7% 6% 4% - 7%
Transfers 705 1,319 1,171 413 378 - 3,986
% Transferred (Sales) 99% 88% 96% 96% 88% - 92%
Work Progress 100% 100% 99% 100% 100% - 100%
SP RJ BA PE MG RS 2015
Number of Projects 10 7 5 3 2 3 30
Units launched 2,180 1,751 1,584 944 372 880 7,711
Total PSV (R$ 000) 338.2 252.6 198.5 122.3 53.2 123.6 1,088
Units Sold 2,125 1,208 1,309 829 338 814 6,623
% Sold 97% 69% 83% 88% 91% 93% 86%
SoS Avg (Month) 14% 5% 8% 6% 9% 10% 9%
Transfers 2,055 1,010 1,146 662 302 648 5,823
% Transferred (Sales) 95% 58% 74% 71% 81% 73% 76%
Work Progress 92% 83% 82% 92% 79% 87% 87%

26
EARNINGS RELEASE
3Q16
EARNINGS RELEASE
3Q16
SP RJ BA PE MG RS 2016
Number of Projects 5 7 6 2 4 6 30
Units launched 1,057 1,738 1,520 576 780 1,400 7,071
Total PSV (R$ 000) 165.1 246.0 187.3 72.1 107.7 190.3 969
Units Sold 514 486 450 228 258 296 2,232
% Sold 49% 28% 30% 40% 33% 21% 32%
SoS Avg (Month) 11% 10% 8% 9% 7% 8% 9%
Transfers 306 257 311 125 103 124 1,226
% Transferred (Sales) 31% 19% 22% 21% 20% 9% 17%
Work Progress 33% 25% 32% 31% 38% 14% 27%

27
EARNINGS RELEASE
3Q16
EARNINGS RELEASE
3Q16
Financial Result Revenues
Tenda’s 3Q16 net revenues totaled R$270.5 million, an increase of 22.1% y-o-y, reflecting an increased operational volume during the past quarters. As shown in the table below, revenue from new projects, which quarter after quarter has been increasing its contribution to total volume of revenues, represented the majority of total revenues in 3Q16. Tenda’s net revenues totaled R$765.8 million in 9M16, an increase of 18.9% y-o-y, due to the increased level of operations in the period.
Table 30. Tenda - Pre-Sales and Recognized Revenues (R$ 000)
3Q16 3Q15
Launches Pre-Sales % Sales Revenue % Revenue Pre-Sales % Sales Revenue % Revenue
2016 167,443 70% 92,765 34% - 0% - 0%
2015 71,246 30% 178,943 66% 162,543 66% 81,907 37%
2014 (4,648) -2% (7,654) -3% 51,146 21% 98,808 45%
2013 (562) 0% (844) 0% (152) 0% 4,316 2%
≤ 2012 5,207 2% 7,299 3% 31,658 13% 36,529 16%
Total 238,686 100% 270,509 100% 245,195 100% 221,560 100%
New Model 233,478 98% 263,210 97% 213,537 87% 185,031 84%
Legacy 5,208 2% 7,299 3% 31,658 13% 36,529 16%
Gross Profit and Margin
3Q16 gross profit totaled R$90.9 million, up from R$67.4 million in 3Q15 and 2Q16. Gross margin for the quarter reached 33.6%, compared to 30.4% in 3Q15 and 25.9% in 2Q16.The adjusted gross margin was up 35.0% in 3Q16, compared with 28.0% in 2Q16 and 32.1% y-o-y due to the accounting reclassification of R$11.1 millions of the Company’s financial co-obligation balance in relation to transferred clients, required by financial institutions during construction period, which now is accounted for in Financial Results. Excluding this effect, the adjusted gross margin would remain in a healthy level of 32.2% in 3Q16.
The table below shows Tenda’s gross margin breakdown in 3Q16.
Table 31. Tenda – Gross Margin (R$ 000)
3Q16 2Q16 Q/Q (%) 3Q15 Y/Y(%) 9M16 9M15 Y/Y(%)
Net Revenue 270,509 260,743 4% 221,560 22% 765,804 644,140 19%
Gross Profit 90,930 67,407 35% 67,390 35% 227,082 186,718 22%
Gross Margin 33.6% 25.9% 770 bps 30.4% 320 bps 29.7% 29.0% 70 bps
(-) Financial Costs 3,829 5,544 -31% 3,760 2% 14,889 11,517 29%
Adjusted Gross Profit 94,759 72,951 30% 71,150 33% 241,971 198,235 22%
Adjusted Gross Margin 35.0% 28.0% 700 bps 32.1% 290 bps 31.6% 30.8% 80 bps

28
EARNINGS RELEASE
3Q16
EARNINGS RELEASE
3Q16
Selling, General and Administrative Expenses (SG&A)
During 3Q16, selling, general and administrative expenses totaled R$47.5 million, an increase of 10.1% compared to R$43.1 million in 3Q15 and 11.9% compared to R$42.4 million in 2Q16. In 9M16, SG&A increased by 15.4%, totaling R$127.2 million, as a result of a higher volume of operations.
Selling expenses reached R$25.6 million in 3Q16, an increase of 20.1% from 2Q16 and 56.9% from 3Q15, due to a higher launch volume and increased gross sales. In addition, the increase of 20.1% in selling expenses reflects the current scenario of greater restriction of credit to customers, requiring a higher volume of investments related to marketing and sales expenses, so that to allow a higher volume of clients in our stores. In 9M16, selling expenses increased 38.6%, totaling R$65.1 million.
In 3Q16, general and administrative expenses decreased 18.4% compared to 3Q15 and increased 3.5% in the sequential comparison. In 9M16, general and administrative expenses totaled R$62.1 million, 1.8% down from R$63.2 million recorded in 2015 and in line with the current level of operations of the Company.
Since 2013, Tenda has been rebalancing its cost structure and expenses to levels that are adequate for the current stage of its business model. This is a key step in the Company’s ability to improve its operating and financial cycles, in order to achieve better profitability.
Table 32. Tenda – SG&A Expenses (R$ 000)
3Q16 2Q16 Q/Q (%) 3Q15 Y/Y(%) 9M16 9M15 Y/Y(%)
Selling Expenses (25,554) (21,270) 20% (16,283) 57% (65,096) (46,963) 39%
General & Admin Expenses (21,928) (21,177) 4% (26,861) -18% (62,125) (63,248) -2%
Total SG&A Expenses (47,482) (42,447) 12% (43,144) 10% (127,221) (110,211) 15%
Launches 325,393 414,678 -22% 318,585 2% 968,614 786,306 23%
Net Pre-Sales 238,686 324,992 -27% 245,195 -3% 830,176 778,679 7%
Net Revenue 270,509 260,743 4% 221,560 22% 765,804 644,140 19%
The Other Operating Revenues/Expenses totaled an expense of R$10.5 million, an increase of 44.6% compared to 2Q16, due to the higher impact of litigation expenses recorded last quarter.
Below, we present a breakdown of this expense.
Table 33 – Tenda Segment– Other Revenues/Operating Expenses (R$ 000)
3Q16 2Q16 Q/Q (%) 3Q15 Y/Y(%) 9M16 9M15 Y/Y(%)
Litigation Expenses (7,704) (5,597) 38% (7,999) -4% (20,385) (18,900) 8%
Other (2,805) (1,673) 68% (7,502) -63% (12,611) (13,308) -5%
Total (10,509) (7,270) 45% (15,501) -32% (32,996) (32,208) 2%
Adjusted EBITDA
Adjusted EBITDA was R$39.7 million in 3Q16, compared to adjusted EBITDA of R$21.9 million in 2Q16 and R$24.6 million in 3Q15. In 9M16, adjusted EBITDA was R$85.0 million compared to R$60.9 million in the last year. Adjusted EBITDA margin was 14.7% in 3Q16 compared to an adjusted EBITDA margin of 11.1% in 3Q15 and 8.4% in the previous quarter. The y-o-y increase is attributable to: (i) higher volume of revenues in the period; and (ii) better gross margin level, benefited by accounting reclassification previously mentioned. In 9M16, adjusted EBITDA margin reached 11.1%.

29
EARNINGS RELEASE
3Q16
EARNINGS RELEASE
3Q16
Table 34. Tenda – Adjusted EBITDA (R$ 000)
3Q16 2Q16 Q/Q (%) 3Q15 Y/Y(%) 9M16 9M15 Y/Y(%)
Net (Loss) Profit 23,045 8,622 167% 11,830 95% 36,461 43,311 -16%
(+) Financial results 12,173 450 2605% 1,970 518% 14,520 (5,209) -379%
(+) Income taxes 2,885 3,394 -15% 1,993 45% 13,034 771 1591%
(+) Depreciation & Amortization 4,432 3,040 46% 4,186 6% 11,346 11,058 3%
(+) Capitalized interests 3,829 5,544 -31% 3,760 2% 14,889 11,517 29%
(+) Expenses with stock Option Plan 489 27 1711% 545 -10% 1,050 1,606 -35%
(+) Minority Shareholders (7,109) 781 - 283 - (6,257) (2,151) 191%
Adjusted EBITDA 39,744 21,858 82% 24,567 62% 85,042 60,902 40%
Net Revenue 270,509 260,743 4% 221,560 22% 765,804 644,140 19%
Adjusted EBITDA Margin 14.7% 8.4% 630 bps 11.1% 360 bps 11.1% 9.5% 160 bps
1) EBITDA is adjusted by expenses associated with stock option plans, as this is a non-cash expense. 2) Tenda does not hold equity interest in Alphaville. In 4Q13, the result of the divestment n in Alphaville, which was allocated to Tenda, was excluded.
Backlog of Revenues and Results
The backlog of results to be recognized under the PoC method was R$115.9 million in 3Q16. The consolidated margin for the quarter was 43.0%.
Table 35. Tenda – Backlog Results (REF) (R$ 000)
3Q16 2Q16 Q/Q(%) 3Q15 Y/Y(%)
Backlog Revenues 269,361 301,000 -11% 251,343 7%
Backlog Costs (units sold) (153,492) (175,111) -12% (142,303) 8%
Backlog Results 115,869 125,889 -8% 109,040 6%
Backlog Margin 43.0% 41.8% 120 bps 43.4% 40 bps
¹ Backlog results net of PIS/COFINS = 3.65%, taxes and excluding the impact of PVA (Present Value Adjustment) method according to Law 11.638
² Backlog results comprise the projects restricted by condition precedent.

30
EARNINGS RELEASE
3Q16
EARNINGS RELEASE
3Q16
Balance Sheet and Consolidated Financial Results Cash and Cash Equivalents
On September 30, 2016, cash and cash equivalents and marketable securities totaled R$609.9 million, down 1.4% from June 30, 2016.
Accounts Receivable
At the end of 3Q16, total consolidated accounts receivable totaled R$2.3 billion, a decrease of 19.8% y-o-y and a decrease of 3.2% q-o-q.
The Gafisa and Tenda segments have approximately R$614.4. million in accounts receivable from finished units.
Table 36. Total Receivables (R$ 000)
3Q16 2Q16 Q/Q(%) 3Q15 Y/Y(%)
Receivables from developments (off balance sheet) 688,984 692,650 -1% 839,492 -18%
Receivables from PoC- ST (on balance sheet) 1,129,351 1,285,892 -12% 1,488,988 -24%
Receivables from PoC- LT (on balance sheet) 440,056 354,931 24% 487,007 -10%
Total 2,258,391 2,333,473 -3% 2,815,487 -20%
Notes: ST – Short term | LT- Long term | PoC – Percentage of Completion Method. Receivables from developments: accounts receivable not yet recognized according to PoC and BRGAAP. Receivables from PoC: accounts receivable already recognized according to PoC and BRGAAP.
Cash Generation
The Company’s operating cash generation reached R$97.4 million in 3Q16. The Gafisa segment contributed cash generation of R$89.7 million, with volume of transferred/received units sold to financing agents reaching R$126.0 million. It is worth noting that the impact on cash generation of the sale of land in the quarter was limited to R$5.0 million, since the remaining balance will only be received in 4Q16. The Tenda segment generated R$7.7 million in cash, with R$208.8 million transferred in 3Q16. In 9M16, the Company reported operating cash generation of R$232.9 million.
While consolidated operating cash generation reached R$97.4 million, the Company ended 3Q16 with net cash generation of R$13.0 million, totaling R$8.8 million in 9M16. This result does not include the disbursement related to the share buyback program carried out in the period.
Table 37. Cash Generation (R$ 000)
4Q151 1Q16 2Q16 3Q16
Availabilities2 712,311 792,076 618,569 609,898
Change in Availabilities2 (1) 79,766 (173,507) (8,671)
Total Debt + Investor Obligations 2,155,688 2,207,114 2,074,335 2,053,154
Change in Total Debt + Investor Obligations (2) 51,425 (132,779) (21,181)
Other Investments 210,761 210,761 218,956 219,454
Change in Other Investments (3) - 8,195 498
Cash Generation in the period (1) - (2) + (3) 28,340 (32,534) 13,009
Cash Generation Final 28,340 (4,193) 8,815 1 The 4Q15 data refer only to the final balance of the period in order to assist in the reconciliation of the balance changes in 2016.
2 Cash and cash equivalents, and marketable securities

31
EARNINGS RELEASE
3Q16
EARNINGS RELEASE
3Q16
Liquidity
At the end of September 2016, the Company’s Net Debt/Equity ratio reached 49.3% compared to 48.5% in the previous quarter. Excluding project finance, the Net Debt/Equity ratio was negative 8.1%.
The Company's consolidated gross debt reached R$2.1 billion at the end of 3Q16, stable q-o-q, and down 17.7% y-o-y. In the 3Q16, the Company amortized R$253.4 million in debt, of which R$222.9 million was project finance and R$30.6 million corporate debt. A total of R$226.6 million was disbursed, allowing for a net amortization of R$26.9 million. Considering the 9M16, 74.6% of total gross debt maturing in 2016 was amortized. New releases of R$584.2 million took place in the year, of which R$487.5 million related to project debt and R$96.7 million related to corporate debt, thus allowing a net amortization in the first nine months of R$210.7 million.
Table 38. Debt and Investor Obligations
3Q16 2Q16 Q/Q(%) 3Q15 Y/Y(%)
Debentures - FGTS (A) 492,498 551,968 -11% 808,532 -39%
Debentures – Working Capital (B) 167,448 186,075 -10% 364,900 -54%
Project Financing SFH – (C) 1,188,494 1,196,948 -1% 1,173,382 1%
Working Capital (D) 201,571 136,969 47% 137,891 46%
Total (A)+(B)+(C)+(D) = (E) 2,050,011 2,071,960 -1% 2,484,705 -17%
Investor Obligations (F) 3,143 2,375 32% 8,934 -65%
Total Debt (E)+(F) = (G) 2,053,154 2,074,335 -1% 2,493,639 -18%
Cash and Availabilities (H) 609,898 618,569 -1% 921,828 -34%
Net Debt (G)-(H) = (I) 1,443,256 1,455,766 -1% 1,571,811 -8%
Equity + Minority Shareholders (J) 2,928,749 3,001,290 -2% 3,112,609 -6%
(Net Debt) / (Equity) (I)/(J) = (K) 49.3% 48.5% 80 bps 50.5% -120 bps
(Net Debt – Proj Fin) / Equity (I)-((A)+(C))/(J) = (L) -8.1% -9.8% 170 bps -13.2% 510 bps
*Cash and cash equivalents and marketable securities
The Company ended 9M16 with R$1.0 billion in total debt maturing in the short term. It should be noted, however, that 89.9% of this volume relates to debt linked to the Company's projects. Currently, the average cost of consolidated debt is 14.71% p.y., or 104.14% of the CDI.
Table 39. Debt Maturity
(R$ 000) Average Cost (p.y.) Total Until Sep/17 Until Sep/18 Until Sep/19 Until Sep/20 After Sep/20
Debentures - FGTS (A) TR + 9.00% - 10.38%
492,498 342,609 149,889 - - -
Debentures – Working Capital (B) CDI + 1.90% / IPCA + 7.96% - 8.22%
167,448 30,840 94,044 21,279 21,285 -
Project Financing SFH (C) TR + 8.33% - 11.82% / 120.0% - 129.0% CDI
1,188,494 581,128 455,721 111,669 28,930 11,046
Working Capital (D) CDI + 3.00% / CDI + 3.95% / CDI + 4.25% / 125.0% CDI / INCC
201,571 69,845 78,535 53,191 - -
Total (A)+(B)+(C)+(D) = (E) 2,050,011 1,024,422 778,189 186,139 50,215 11,046
Investor Obligations (F) CDI + 0.59% 3,143 3,143 - - - -
Total Debt (E)+(F) = (G) 2,053,154 1,027,565 778,189 186,139 50,215 11,046
% of Total Maturity per period 50.0% 37.9% 9.1% 2.4%
Project debt maturing as % of total debt ((A)+ (C))/(G) 89.9% 77.8% 60.0% 57.6%
Corporate debt maturing as % of total debt ((B)+(D)+(F))/(G) 10.1% 22.2% 40.0% 42.4%
Ratio Corporate Debt / Mortgage 18.1%/81.9%%

32
EARNINGS RELEASE
3Q16
EARNINGS RELEASE
3Q16
Consolidated Financial Result Revenue
On a consolidated basis, 3Q16 net revenue totaled R$538.8 million, up 13.8% compared to 2Q16 and down 13.7% from 3Q15. In the quarter, the Gafisa segment represented 49.8% of consolidated revenues, while Tenda accounted for the remaining 50.2%. In 9M16, net consolidated revenue reached R$1.4 billion.
Gross Profit & Margin
Gross profit in 3Q16 was R$91.9 million, compared to R$93.5 million in 2Q16, and R$176.2 million in the prior year period. Gross margin for the quarter reached 17.1% compared to 19.8% in 2Q16 and 28.2% in 3Q15. Year-to-date gross profit was R$257.6 million, with a gross margin of 18.2%.
Adjusted gross profit totaled R$142.0 million, with a margin of 26.4 %, compared to 29.2% in the 2Q16 and 35.9% in the prior year period. In 9M16, adjusted gross profit totaled R$390.5 million with an adjusted gross margin of 27.5%.
Table 40. Gafisa Group– Gross Margin (R$ 000)
3Q16 2Q16 Q/Q (%) 3Q15 Y/Y(%) 9M16 9M15 Y/Y(%)
Net Revenue 538,780 473,371 14% 624,043 -14% 1,417,685 1,735,073 -18%
Gross Profit 91,893 93,491 -2% 176,220 -48% 257,585 483,963 -47%
Gross Margin 17.1% 19.8% -270 bps 28.2% -1,110 bps 18.2% 27.9% -970 bps
( - ) Financial Costs 50,087 44,785 12% 47,557 5% 132,908 119,502 11%
Adjusted Gross Profit 141,980 138,276 3% 223,777 -37% 390,493 603,465 -35%
Adjusted Gross Margin 26.4% 29.2% -280 bps 35.9% -950 bps 27.5% 34.8% -730 bps
Selling, General and Administrative Expenses (SG&A)
SG&A expenses totaled R$99.7 million in 3Q16, up 11.1% compared to 3Q15 and 21.3% q-o-q. Year-to-date, SG&A totaled R$263.0 million, up 5.1% from 9M15.
Table 41.Gafisa Group – SG&A Expenses (R$ 000)
3Q16 2Q16 Q/Q (%) 3Q15 Y/Y(%) 9M16 9M15 Y/Y(%)
Selling Expenses (50,255) (41,515) 21% (38,826) 29% (126,788) (106,574) 19%
G&A Expenses (49,472) (40,701) 22% (50,948) -3% (136,195) (143,686) -5%
Total SG&A Expenses (99,727) (82,216) 21% (89,774) 11% (262,983) (250,260) 5%
Launches 736,359 545,038 35% 606,819 21% 1,590,043 1,402,352 13%
Net Pre- Sales 497,018 454,511 9% 492,803 1% 1,284,869 1,448,278 -11%
Net Revenue 538,780 473,371 14% 624,043 -14% 1,417,685 1,735,073 -18%
Other Operating Revenues/Expenses were an expense of R$25.0 million, a decrease of 4.6% from 2Q16 and down 45.7% y-o-y. Year-to-date, other Operating Revenues/Expenses were an expense of R$81.0 million, down 28.1% from 9M15.
The table below has more details on the breakdown of this expense.

33
EARNINGS RELEASE
3Q16
EARNINGS RELEASE
3Q16
Table 42 –Gafisa Group – Other Operating Revenues/Expenses (R$ 000)
3Q16 2Q16 Q/Q (%) 3Q15 Y/Y(%) 9M16 9M15 Y/Y(%)
Litigation expenses (20,982) (21,058) 0% (31,518) -33% (64,928) (87,006) -25%
Other (4,048) (5,169) -22% (14,589) -72% (16,122) (25,707) -37%
Total (25,030) (26,227) -5% (46,107) -46% (81,050) (112,713) -28%
Consolidated Adjusted EBITDA
Consolidated adjusted EBITDA, including Alphaville equity income, totaled R$14.9 million in 3Q16, down from R$22.4 million in the previous quarter and R$92.6 million in 3Q15. Consolidated adjusted EBITDA in 3Q16 was impacted by the following factors: (i) lower gross profit in the Gafisa segment; and (ii) higher selling, general and administrative expenses. Consolidated adjusted EBITDA margin was 2.8%, compared with 4.7% margin reported in 2Q16 and 14.8% in 3Q15. In 9M16, consolidated EBITDA reached R$53.5 million, with a margin of R$3.8%.
Table 43. Gafisa Group – Consolidated Adjusted EBITDA (R$ 000)
3Q16 2Q16 Q/Q (%) 3Q15 Y/Y(%) 9M16 9M15 Y/Y(%)
Net Profit (Loss) (72,622) (38,439) 89% 13,486 -638% (164,288) 73,623 -323%
(+) Financial results 17,465 2,489 602% 19,689 -11% 21,895 25,220 -13%
(+) Income taxes 3,961 2,973 33% (3,150) -226% 19,679 3,256 504%
(+) Depreciation & Amortization 12,612 8,684 45% 12,608 0% 34,678 35,838 -3%
(+) Capitalized interests 50,087 44,785 12% 47,557 5% 132,908 119,502 11%
(+) Expenses with stock Option Plan
2,805 1,327 111% 2,464 14% 6,556 7,465 -12%
(+) Minority Shareholders 585 578 1% (73) -901% 2,039 (3,126) -165%
Adjusted EBITDA 14,893 22,397 -34% 92,581 -84% 53,467 261,778 -80%
Net Revenue 538,780 473,371 14% 624,043 -14% 1,417,685 1,735,073 -18%
Adjusted EBITDA Margin 2.8% 4.7% -190 bps 14.8% -1,200 bps 3.8% 15.1% -1,130 bps
1) We adjust our EBITDA for expenses associated with stock options plans, as it is a non-cash expense; 2) Consolidated EBITDA includes the effect of Alphaville equity income.
Depreciation and Amortization
Depreciation and amortization in 3Q16 reached R$11.1 million, up 27.5% compared to 2Q16 and down 11.0% compared to R$12.4 million in 3Q15. The level of D&A is consistent with the size of the Company’s operations.
Financial Results
3Q16 net financial result was negative R$17.5 million, compared to negative R$2.5 million in 2Q16 and R$19.7 million in 3Q15. Financial revenues were down 39.7% y-o-y, totaling R$13.9 million, due to the lower balance of funds available in the period. Financial expenses reached R$31.4 million, compared to R$42.8 million in 3Q15, due to lower gross debt and a higher share of project-related versus corporate debt, with lower funding costs. Year-to-date, the net financial result was negative R$21.9 million, compared to negative R$25.2 million in 3Q15. It is worth mentioning that in 9M16, there was a positive impact from the mark-to-market of hedging operations against IPCA and CDI-indexed debts.

34
EARNINGS RELEASE
3Q16
EARNINGS RELEASE
3Q16
Taxes
Income taxes, social contribution and deferred taxes for 3Q16 amounted to an expense of R$4.0 million, consistent with the size of the Company’s operations. In the year, the IR & CSLL expense totaled R$19.7 million.
Net Income
The Company ended the 3Q16 with a net loss of R$72.6 million. Excluding equity income from AUSA, the Company recorded a net loss of R$63.5 million, compared to a net loss of R$26.5 million in 2Q16 and net income of R$12.3 million in the same period last year. The Company ended the 9M16 with a net loss of R$164.3 million, including equity income from Alphaville, compared to net income of R$73.6 million in the same period last year.
Table 44 - Consolidated - Net Income - (R$ 000)
3Q16 2Q16 Q/Q (%) 3Q15 Y/Y(%) 9M16 9M15 Y/Y(%)
Net Revenue 538,780 473,371 14% 624,043 -14% 1,417,685 1,735,073 -18%
Gross Profit 91,893 93,491 -2% 176,220 -48% 257,585 483,963 -47%
Gross Margin 17.1% 19.8% -270 bps 28.2% -1,110 bps 18.2% 27.9% -970 bps
Adjusted Gross Profit1 141,980 138,276 3% 223,777 -37% 390,493 603,465 -35%
Adjusted Gross Margin1 26.4% 29.2% -280 bps 35.9% -950 bps 27.5% 34.8% -730 bps
Adjusted EBITDA2 14,893 22,397 -34% 92,581 -84% 53,467 261,778 -80%
Adjusted EBITDA Margin 2.8% 4.7% -190 bps 14.8% -1,200 bps 3.8% 15.1% -1,130 bps
Net Income (72,622) (38,439) 89% 13,486 - (164,288) 73,623 -
( - ) Alphaville Equity Income (9,158) (11,952) -23% 1,168 - (10,230) 23,339 -
Net income ( ex-Alphaville equity income) (63,464) (26,487) 140% 12,318 - (154,058) 50,284 -
.1) Adjusted by capitalized interests. 2) EBITDA adjusted by expenses associated with stock option plans, as this is a non-cash expense. 3) Consolidated EBITDA includes the impact of Alphaville equity income.
Backlog of Revenues and Results
The backlog of results to be recognized under the PoC method reached R$259.2 million in 3Q16. The consolidated margin for the quarter was 39.0%.
Table 45.Gafisa Group – Backlog Results (REF) (R$ 000)
3Q16 2Q16 Q/Q %) 3Q15 Y/Y(%)
Backlog Revenues 663,836 667,368 -1% 808,851 -18%
Backlog Costs (units sold) (404,643) (407,504) -1% (484,001) -16%
Backlog Results 259,193 259,864 0% 324,850 -20%
Backlog Margin 39.0% 38.9% 10 bps 40.2% -120 bps
¹ Backlog results net of PIS/COFINS taxes (3.65%), and excluding the impact of PVA (Present Value Adjustment) method according to Law 11.638
² Backlog results comprise the projects restricted by condition precedent.

35
EARNINGS RELEASE
3Q16
EARNINGS RELEASE
3Q16
São Paulo, November 8th, 2016
Alphaville Urbanismo SA releases its 9M results of 2016.
Financial Results
In 9M16, net revenues totaled R$ 555 million, 27% below the previous year, and net profit
was –R$ 34 million.
9M16 9M15
R$ ∆
Net revenue 555 762 -27%
Net profit - 34 58 N/A
Net margin -6% 8%
For further information, please contact our Investor Relations team at [email protected] or +55 11 3038-7164.

36
EARNINGS RELEASE
3Q16
EARNINGS RELEASE
3Q16
Financial Statements Gafisa Segment
3Q16 2Q16 Q/Q (%) 3Q15 Y/Y(%) 9M16 9M15 Y/Y(%)
Net Revenue 268,271 212,628 26% 402,483 -33% 651,881 1,090,933 -40%
Operating Costs (267,308) (186,544) 43% (293,653) -9% (621,378) (793,688) -22%
Gross Profit 963 26,084 -96% 108,830 -99% 30,503 297,245 -90%
Gross Margin 0.4% 12.3% -1,190 bps 27.0% -2,660 bps 4.7% 27.2% -2,250 bps
Operating Expenses (82,568) (71,730) 15% (94,954) -13% (208,936) (234,994) -11%
Selling Expenses (24,701) (20,245) 22% (22,543) 10% (61,692) (59,611) 3%
General and Administrative Expenses
(27,544) (19,524) 41% (24,087) 14% (74,070) (80,438) -8%
Other Operating Revenue/Expenses
(14,521) (18,957) -23% (30,606) -53% (48,054) (80,505) -40%
Depreciation and Amortization (8,180) (5,644) 45% (8,422) -3% (23,332) (24,780) -6%
Equity Income (7,622) (7,360) 4% (9,296) -18% (1,788) 10,340 -117%
Operational Result (81,605) (45,646) 79% 13,876 - (178,433) 62,251 -
Financial Income 7,479 14,208 -47% 20,975 -64% 48,493 60,230 -19%
Financial Expenses (12,771) (16,247) -21% (38,694) -67% (55,868) (90,659) -38%
Net Income Before taxes on Income
(86,897) (47,685) 82% (3,843) 2161% (185,808) 31,822 -
Deferred Taxes - (1) -100% 9,134 -100% 963 6,094 -84%
Income Tax and Social Contribution
(1,076) 422 - (3,991) -73% (7,608) (8,579) -11%
Net Income After Taxes on Income
(87,973) (47,264) 86% 1,300 - (192,453) 29,337 -
Minority Shareholders 7,694 (203) - (356) - 8,296 (975) -
Net Income (95,667) (47,061) 103% 1,656 -5877% (200,749) 30,312 -

37
EARNINGS RELEASE
3Q16
EARNINGS RELEASE
3Q16
Financial Statements Tenda Segment
3Q16 2Q16 Q/Q (%) 3Q15 Y/Y(%) 9M16 9M15 Y/Y(%)
Net Revenue 270,509 260,743 4% 221,560 22% 765,804 644,140 19%
Operating Costs (179,579) (193,336) -7% (154,170) 16% (538,722) (457,422) 18%
Gross Profit 90,930 67,407 35% 67,390 35% 227,082 186,718 22%
Gross Margin 33.6% 25.9% 770 bps 30.4% 320 bps 29.7% 29.0% 70 bps
Operating Expenses (59,936) (54,160) 11% (51,314) 17% (169,324) (149,996) 13%
Selling Expenses (25,554) (21,270) 20% (16,283) 57% (65,096) (46,963) 39%
General and Administrative Expenses
(21,928) (21,177) 4% (26,861) -18% (62,125) (63,248) -2%
Other Operating Revenue/Expenses
(10,509) (7,270) 45% (15,501) -32% (32,996) (32,208) 2%
Depreciation and Amortization (2,889) (3,040) -5% (4,022) -28% (9,119) (10,894) -16%
Equity Income 944 (1,403) - 11,353 -92% 12 3,317 -100%
Operational Result 30,994 13,247 134% 16,076 93% 57,758 36,722 57%
Financial Income 6,471 8,586 -25% 2,147 201% 23,866 39,774 -40%
Financial Expenses (18,644) (9,036) 106% (4,117) 353% (38,386) (34,565) 11%
Net Income Before taxes on Income 18,821 12,797 47% 14,106 33% 43,238 41,931 3%
Deferred Taxes (1,863) (169) 1002% 1,768 - (5,528) 5,634 -
Income Tax and Social Contribution
(1,022) (3,225) -68% (3,761) -73% (7,506) (6,405) 17%
Net Income After Taxes on Income 15,936 9,403 69% 12,113 32% 30,204 41,160 -27%
Minority Shareholders (7,109) 781 - 283 - (6,257) (2,151) 191%
Net Income 23,045 8,622 167% 11,830 95% 36,461 43,311 -16%

38
EARNINGS RELEASE
3Q16
EARNINGS RELEASE
3Q16
Consolidated Financial Statements
3Q16 2Q16 Q/Q (%) 3Q15 Y/Y(%) 9M16 9M15 Y/Y(%)
Net Revenue 538,780 473,371 14% 624,043 -14% 1,417,685 1,735,073 -18%
Operating Costs (446,887) (379,880) 18% (447,823) 0% (1,160,100) (1,251,110) -7%
Gross Profit 91,893 93,491 -2% 176,220 -48% 257,585 483,963 -47%
Gross Margin 17.1% 19.8% -270 bps 28.2% -1,110 bps 18.2% 27.9% -970 bps
Operating Expenses (142,504) (125,890) 13% (146,268) -3% (378,260) (384,990) -2%
Selling Expenses (50,255) (41,515) 21% (38,826) 29% (126,788) (106,574) 19%
General and Administrative Expenses
(49,472) (40,701) 22% (50,948) -3% (136,195) (143,686) -5%
Other Operating Revenue/Expenses
(25,030) (26,227) -5% (46,107) -46% (81,050) (112,713) -28%
Depreciation and Amortization (11,069) (8,684) 27% (12,444) -11% (32,451) (35,674) -9%
Equity Income (6,678) (8,763) -24% 2,057 - (1,776) 13,657 -
Operational Result (50,611) (32,399) 56% 29,952 - (120,675) 98,973 -
Financial Income 13,950 22,794 -39% 23,122 -40% 72,359 100,004 -28%
Financial Expenses (31,415) (25,283) 24% (42,811) -27% (94,254) (125,224) -25%
Net Income Before taxes on Income
(68,076) (34,888) 95% 10,263 - (142,570) 73,753 -
Deferred Taxes (1,863) (170) 996% 10,902 - (4,565) 11,728 -
Income Tax and Social Contribution
(2,098) (2,803) -25% (7,752) -73% (15,114) (14,984) 1%
Net Income After Taxes on Income
(72,037) (37,861) 90% 13,413 - (162,249) 70,497 -
Minority Shareholders 585 578 1% (73) - 2,039 (3,126) -
Net Income (72,622) (38,439) 89% 13,486 - (164,288) 73,623 -

39
EARNINGS RELEASE
3Q16
EARNINGS RELEASE
3Q16
Balance Sheet Gafisa Segment 3Q16 2Q16 Q/Q %) 3Q15 Y/Y(%)
Current Assets
Cash and cash equivalents 100,563 41,190 144% 40,510 148%
Securities 254,826 263,161 -3% 556,079 -54%
Receivables from clients 780,968 873,183 -11% 1,024,269 -24%
Properties for sale 1,579,115 1,560,318 1% 1,312,099 20%
Other accounts receivable 99,165 106,207 -7% 162,934 -39%
Deferred selling expenses 2,321 1,489 56% 2,637 -12%
Land for sale 3,443 3,443 0% 6,075 -43%
2,820,401 2,848,991 -1% 3,104,603 -9%
Long-term Assets
Receivables from clients 313,802 287,401 9% 440,826 -29%
Properties for sale 324,336 412,917 -21% 539,175 -40%
Other 100,054 143,984 -31% 156,427 -36%
738,192 844,302 -13% 1,136,428 -35%
Intangible. Property and Equipment 55,757 55,238 1% 62,211 -10%
Investments 1,996,279 1,986,262 1% 1,975,988 1%
Total Assets 5,610,629 5,734,793 -2% 6,279,230 -11%
Current Liabilities
Loans and financing 631,675 622,546 1% 598,530 6%
Debentures 270,656 255,771 6% 306,680 -12%
Obligations for Purchase of Land and advances from customers
230,667 221,710 4% 253,741 -9%
Material and service suppliers 39,040 42,903 -9% 55,790 -30%
Taxes and Contribution 13,520 23,370 -42% 59,703 -77%
Investor Obligations 3,143 2,375 32% 6,654 -53%
Other 349,343 383,128 -9% 402,894 -13%
1,538,044 1,551,803 -1% 1,683,992 -9%
Long-term liabilities
Loans and financings 661,785 619,501 7% 684,593 -3%
Debentures 286,497 307,797 -7% 550,378 -48%
Obligations for Purchase of Land and advances from customers
45,307 87,646 -48% 88,183 -49%
Deferred taxes 10,085 10,226 -1% 19,454 -48%
Provision for contingencies 87,258 107,443 -19% 79,342 10%
Investor Obligations - - 0% 2,280 -100%
Other 51,572 47,750 8% 56,823 -9%
1,142,504 1,180,363 -3% 1,481,053 -23%
Shareholders’ Equity
Shareholders’ Equity 2,926,449 2,998,074 -2% 3,110,912 -6%
Minority Shareholders 3,632 4,553 -20% 3,273 11%
2,930,081 3,002,627 -2% 3,114,185 -6%
Total Liabilities and Shareholders’ Equity 5,610,629 5,734,793 -2% 6,279,230 -11%

40
EARNINGS RELEASE
3Q16
EARNINGS RELEASE
3Q16
Balance Sheet Tenda Segment
3Q16 2Q16 Q/Q %) 3Q15 Y/Y(%)
Current Assets
Cash and cash equivalents 60,777 116,547 -48% 27,372 122%
Securities 193,732 197,671 -2% 297,867 -35%
Receivables from clients 348,383 412,709 -16% 464,720 -25%
Properties for sale 539,537 503,352 7% 459,852 17%
Other accounts receivable 104,856 104,090 1% 94,677 11%
Land for sale 71,310 84,060 -15% 127,242 -44%
1,318,595 1,418,429 -7% 1,471,730 -10%
Long-term Assets
Receivables from clients 126,254 67,530 87% 46,181 173%
Properties for sale 199,559 216,894 -8% 176,261 13%
Other 58,091 48,649 19% 63,286 -8%
383,904 333,073 15% 285,728 34%
Intangible, Property and Equipment 46,294 44,516 4% 38,810 19%
Investments 153,298 160,295 -4% 168,137 -9%
Total Assets 1,902,091 1,956,313 -3% 1,964,405 -3%
Current Liabilities
Loans and financing 19,298 11,236 72% 5,390 258%
Debentures 102,793 174,475 -41% 216,374 -52%
Obligations for Purchase of Land and Advances from customers
138,362 138,672 0% 129,169 7%
Material and service suppliers 26,978 34,818 -23% 23,006 17%
Taxes and Contributions 68,157 65,564 4% 86,645 -21%
Other 70,814 65,201 9% 70,412 1%
426,402 489,966 -13% 530,996 -20%
Long-term liabilities
Loans and financings 77,307 80,634 -4% 22,760 240%
Debentures - - 0% 100,000 -100%
Obligations for Purchase of Land and Advances from customers
85,842 97,870 -12% 71,044 21%
Deferred taxes 12,088 10,224 18% 2,725 344%
Provision for contingencies 51,768 52,760 -2% 56,528 -8%
Other 90,617 83,217 9% 42,610 113%
317,622 324,705 -2% 295,667 7%
Shareholders’ Equity
Shareholders’ Equity 1,128,446 1,104,912 2% 1,103,393 2%
Minority Shareholders 29,621 36,730 -19% 34,349 -14%
1,158,067 1,141,642 1% 1,137,742 2%
Total liabilities and Shareholders’ Equity 1,902,091 1,956,313 -3% 1,964,405 -3%

41
EARNINGS RELEASE
3Q16
EARNINGS RELEASE
3Q16
Consolidated Balance Sheets
3Q16 2Q16 Q/Q %) 3Q15 Y/Y(%)
Current Assets
Cash and cash Equivalents 161,340 157,737 2% 67,882 138%
Securities 448,558 460,832 -3% 853,946 -47%
Receivables from clients 1,129,351 1,285,892 -12% 1,488,988 -24%
Proprieties for Sale 2,118,652 2,063,670 3% 1,771,950 20%
Other accounts receivable 200,529 206,532 -3% 226,417 -11%
Prepaid expenses and others 5,811 5,255 11% 7,876 -26%
Land for Sale 74,753 87,503 -15% 133,317 -44%
4,138,994 4,267,421 -3% 4,550,376 -9%
Long-term Assets
Receivable from clients 440,056 354,931 24% 487,007 -10%
Properties for sale 523,895 629,811 -17% 715,436 -27%
Other 158,146 192,631 -18% 204,748 -23%
1,122,097 1,177,373 -5% 1,407,191 -20%
Intangible and Property and Equipment 127,527 125,230 2% 126,498 1%
Investments 964,700 978,100 -1% 975,459 -1%
Total Assets 6,353,318 6,548,124 -3% 7,059,524 -10%
Current Liabilities
Loans and Financing 650,973 633,782 3% 603,920 8%
Debentures 373,449 430,246 -13% 523,054 -29%
Obligations for purchase of land and Advances from customers
369,029 360,382 2% 382,910 -4%
Materials and service suppliers 66,018 77,721 -15% 78,796 -16%
Taxes and contributions 81,677 88,934 -8% 114,613 -29%
Other 423,298 450,702 -6% 485,738 -13%
1,964,444 2,041,767 -4% 2,189,031 -10%
Long-term Liabilities
Loans and Financing 739,092 700,135 6% 707,353 4%
Debentures 286,497 307,797 -7% 650,378 -56%
Obligations for purchase of land and Advances from customers
131,149 185,516 -29% 159,228 -18%
Deferred taxes 22,173 20,450 8% 22,179 0%
Provision for contingencies 139,026 160,203 -13% 139,879 -1%
Other 142,188 130,966 9% 78,867 80%
1,460,125 1,505,067 -3% 1,757,884 -17%
Shareholders’ Equity
Shareholders’ Equity 2,926,451 2,998,075 -2% 3,110,914 -6%
Minority Shareholders 2,298 3,215 -29% 1,695 36%
2,928,749 3,001,290 -2% 3,112,609 -6%
Total liabilities and Shareholders’ Equity 6,353,318 6,548,124 -3% 7,059,524 -10%
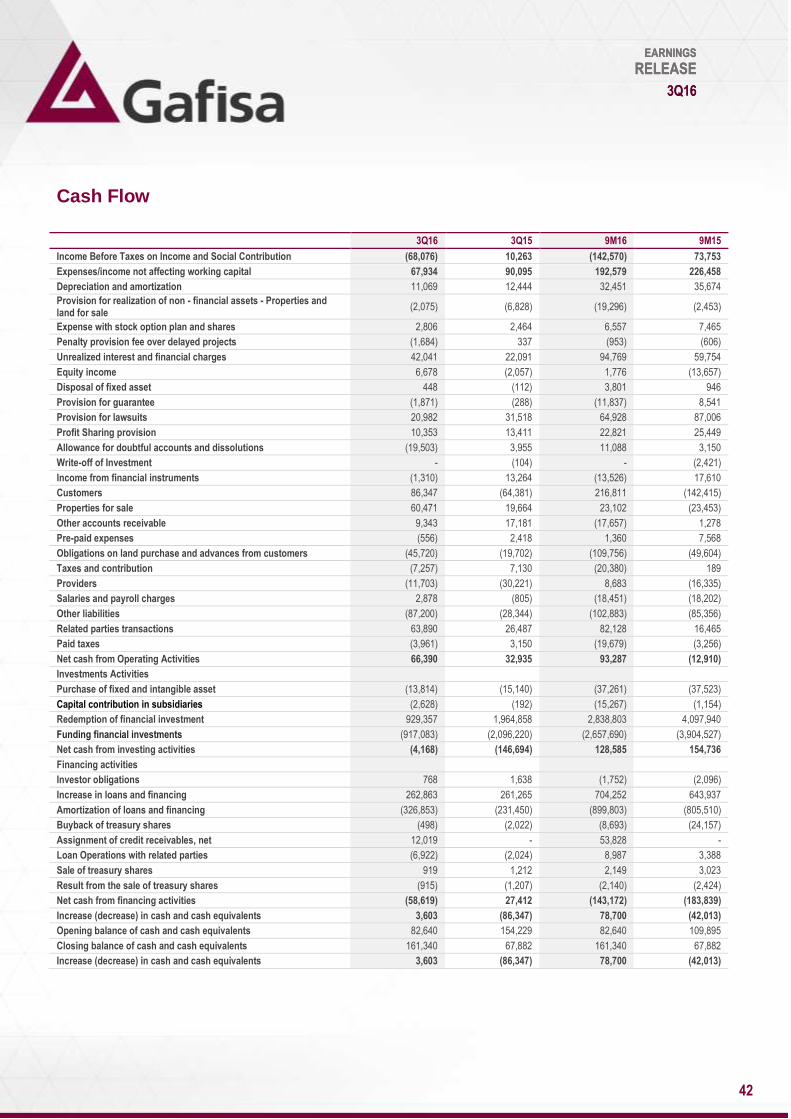
42
EARNINGS RELEASE
3Q16
EARNINGS RELEASE
3Q16
Cash Flow
3Q16 3Q15 9M16 9M15
Income Before Taxes on Income and Social Contribution (68,076) 10,263 (142,570) 73,753
Expenses/income not affecting working capital 67,934 90,095 192,579 226,458
Depreciation and amortization 11,069 12,444 32,451 35,674
Provision for realization of non - financial assets - Properties and land for sale
(2,075) (6,828) (19,296) (2,453)
Expense with stock option plan and shares 2,806 2,464 6,557 7,465
Penalty provision fee over delayed projects (1,684) 337 (953) (606)
Unrealized interest and financial charges 42,041 22,091 94,769 59,754
Equity income 6,678 (2,057) 1,776 (13,657)
Disposal of fixed asset 448 (112) 3,801 946
Provision for guarantee (1,871) (288) (11,837) 8,541
Provision for lawsuits 20,982 31,518 64,928 87,006
Profit Sharing provision 10,353 13,411 22,821 25,449
Allowance for doubtful accounts and dissolutions (19,503) 3,955 11,088 3,150
Write-off of Investment - (104) - (2,421)
Income from financial instruments (1,310) 13,264 (13,526) 17,610
Customers 86,347 (64,381) 216,811 (142,415)
Properties for sale 60,471 19,664 23,102 (23,453)
Other accounts receivable 9,343 17,181 (17,657) 1,278
Pre-paid expenses (556) 2,418 1,360 7,568
Obligations on land purchase and advances from customers (45,720) (19,702) (109,756) (49,604)
Taxes and contribution (7,257) 7,130 (20,380) 189
Providers (11,703) (30,221) 8,683 (16,335)
Salaries and payroll charges 2,878 (805) (18,451) (18,202)
Other liabilities (87,200) (28,344) (102,883) (85,356)
Related parties transactions 63,890 26,487 82,128 16,465
Paid taxes (3,961) 3,150 (19,679) (3,256)
Net cash from Operating Activities 66,390 32,935 93,287 (12,910)
Investments Activities
Purchase of fixed and intangible asset (13,814) (15,140) (37,261) (37,523)
Capital contribution in subsidiaries (2,628) (192) (15,267) (1,154)
Redemption of financial investment 929,357 1,964,858 2,838,803 4,097,940
Funding financial investments (917,083) (2,096,220) (2,657,690) (3,904,527)
Net cash from investing activities (4,168) (146,694) 128,585 154,736
Financing activities
Investor obligations 768 1,638 (1,752) (2,096)
Increase in loans and financing 262,863 261,265 704,252 643,937
Amortization of loans and financing (326,853) (231,450) (899,803) (805,510)
Buyback of treasury shares (498) (2,022) (8,693) (24,157)
Assignment of credit receivables, net 12,019 - 53,828 -
Loan Operations with related parties (6,922) (2,024) 8,987 3,388
Sale of treasury shares 919 1,212 2,149 3,023
Result from the sale of treasury shares (915) (1,207) (2,140) (2,424)
Net cash from financing activities (58,619) 27,412 (143,172) (183,839)
Increase (decrease) in cash and cash equivalents 3,603 (86,347) 78,700 (42,013)
Opening balance of cash and cash equivalents 82,640 154,229 82,640 109,895
Closing balance of cash and cash equivalents 161,340 67,882 161,340 67,882
Increase (decrease) in cash and cash equivalents 3,603 (86,347) 78,700 (42,013)

43
EARNINGS RELEASE
3Q16
EARNINGS RELEASE
3Q16
About Gafisa
Gafisa is one Brazil’s leading residential and commercial properties development and construction companies. Founded over 60 years ago, the Company is dedicated to growth and innovation oriented to enhancing the well-being, comfort and safety of an increasing number of households. More than 15 million square meters have been built, and approximately 1,100 projects delivered under the Gafisa brand - more than any other company in Brazil. Recognized as one of the foremost professionally managed homebuilders, Gafisa’s brand is also one of the most respected, signifying both quality and consistency. In addition to serving the upper-middle and upper class segments through the Gafisa brand, the Company also focuses on low income developments through its Tenda brand. And, it participates through its 30% interest in Alphaville, a leading urban developer, in the national development and sale of residential lots. Gafisa S.A. is a Corporation traded on the Novo Mercado of the BM&FBOVESPA (BOVESPA:GFSA3) and is the only Brazilian homebuilder listed on the New York Stock Exchange (NYSE:GFA) with an ADR Level III, which ensures best practices in terms of transparency and corporate governance.
This release contains forward-looking statements about the business prospects, estimates for operating and financial results and Gafisa’s growth prospects. These are merely projections and, as such, are based exclusively on the expectations of management concerning the future of the business and its continued access to capital to fund the Company’s business plan. Such forward-looking statements depend, substantially, on changes in market conditions, government regulations, competitive pressures, the performance of the Brazilian economy and the industry, among other factors; therefore, they are subject to change without prior notice.


