Management and Organizational Influences on the Compliance ...
103
Kennesaw State University DigitalCommons@Kennesaw State University Doctor of Business Administration Dissertations Coles College of Business Summer 7-7-2016 Management and Organizational Influences on the Compliance Behavior of Employees to Reduce Non-malicious IT Misuse Intention Randy G. Colvin Kennesaw State University Follow this and additional works at: hp://digitalcommons.kennesaw.edu/dba_etd Part of the Management Information Systems Commons is Dissertation is brought to you for free and open access by the Coles College of Business at DigitalCommons@Kennesaw State University. It has been accepted for inclusion in Doctor of Business Administration Dissertations by an authorized administrator of DigitalCommons@Kennesaw State University. For more information, please contact [email protected]. Recommended Citation Colvin, Randy G., "Management and Organizational Influences on the Compliance Behavior of Employees to Reduce Non-malicious IT Misuse Intention" (2016). Doctor of Business Administration Dissertations. Paper 21.
Transcript of Management and Organizational Influences on the Compliance ...
Kennesaw State UniversityDigitalCommons@Kennesaw State University
Doctor of Business Administration Dissertations Coles College of Business
Summer 7-7-2016
Management and Organizational Influences on theCompliance Behavior of Employees to ReduceNon-malicious IT Misuse IntentionRandy G. ColvinKennesaw State University
Follow this and additional works at: http://digitalcommons.kennesaw.edu/dba_etd
Part of the Management Information Systems Commons
This Dissertation is brought to you for free and open access by the Coles College of Business at DigitalCommons@Kennesaw State University. It hasbeen accepted for inclusion in Doctor of Business Administration Dissertations by an authorized administrator of DigitalCommons@Kennesaw StateUniversity. For more information, please contact [email protected].
Recommended CitationColvin, Randy G., "Management and Organizational Influences on the Compliance Behavior of Employees to Reduce Non-maliciousIT Misuse Intention" (2016). Doctor of Business Administration Dissertations. Paper 21.
MANAGEMENT AND ORGANIZATIONAL INFLUENCES ON THE
COMPLIANCE BEHAVIOR OF EMPLOYEES TO REDUCE
NON-MALICIOUS IT MISUSE INTENTION
by
Randy G. Colvin
A Dissertation
Presented in Partial Fulfillment of Requirements for the
Degree of
Doctor of Business Administration
In the
Coles College of Business
Kennesaw State University
Kennesaw, GA
2016
Copyright by
Randy G. Colvin
2016

iii
[Signature Page]

iv
ACKNOWLEDGEMENTS
I am very grateful for the opportunity at Kennesaw State University to pursue and
fulfil my lifelong dream of obtaining my doctorate. While pursuing my doctorate, many
asked questions centered on “how do you meet the demands of the program”. My answer
is grounded in trust in a Lord who equips with the gifts, relationships, experiences, and
spiritual support to sustain through great challenges. Accordingly, my church family,
Antioch-Lithonia Missionary Baptist Church, showed much support and understanding.
Across this educational opportunity to pursue a doctorate, my experience at Kennesaw
State has been a blessing.
In addition, early milestone moments contributed to my foundation. My
undergraduate Alabama A&M University professor, Rufus Gilmore, inspired me to
continuously move forward and seek out additional knowledge that would strengthen me
in my field. During undergraduate summer studies at Carnegie Mellon University my
mentor, George Duncan, was very significant as he introduced the concepts, approaches,
and benefits of rigorous research. These milestone moments provided anchor points that
remained with me throughout my academic and professional career.
At Kennesaw State, invaluable members and colleagues were committed to
success. I can truly say that our IS discipline coordinator, Adriane Randolph, and IS
professor Pamila Dembla, were excellent instructing me toward scholarly thinking and
development of the research topic reflected in this dissertation. I cannot express how
blessed I feel to have studied multivariate data analysis (statistics) from the premier
v
global scholar, Joe Hair. I am also very appreciative of the research and publishing
knowledge instilled by scholar, Brian Rutherford. Likewise, I extend great thanks to
scholar and academic director, Torsten Piper, for instilling an understanding and
appreciation for the full breadth of rigorous research methodologies. Along with great
professors, fellow students of Cohort 5 and particularly IS colleagues Charles Flack,
James Smith, and JD Rusk were instrumental in their support. We had very effective IS
team projects and IS discipline discussions. Most importantly, I appreciate the shared
genuine concern and support, as we all worked through outside challenges to our
academic effort.
My dissertation committee was exceptional. Solomon Negash, a well-established
leader in his field and my chair, provided extraordinary guidance enabling me to develop
a focused research effort and rationale. He was selfless in his commitment to my success
and I am very grateful. Anne Smith, a University of Tennessee global scholar and my
second committee member, provided immeasurable insight in establishing my research
methodology. In addition, her in-depth knowledge of organizations provided a basis for
clear and effective guidance. Traci Carte, a leading scholar and researcher in the IS
discipline, provided exceptional feedback as committee member and reader. In addition,
her previous experience as an editor of a top-tier journal was greatly appreciated. I am
truly thankful for the effort my committee put into my success.
On a personal note, I appreciate professional colleagues and friends who listened
to my research interest and assisted with the early stages of establishing face validity.
Maxine Powell, a compliance manager at a Fortune 500 company, was very helpful
providing an understanding of my research interest. Charlotte Harris, an IT security

vi
consultant, and Gwen Pinder, an experienced internal auditor, also provided noteworthy
feedback for setting face validity. Likewise, Travis Brooks, a life-long collegiate friend
and professional accountant, provided significant support.
The encouragement of family members was foundational to my success. My
daughter Jennifer, who was pursuing her masters, recognized the rigors of my effort and
with joy could see my research taking shape. Son Nicholas, involved in undergraduate
studies, would call at the right time to see how I was progressing and to offer
encouraging words. Daughter Christine and son-in-law Kyle LeCount drew on their
professional experience to see the validity of my research and to provide valuable insight
in understanding my conceptual model. Son Jamaal also encouraged my effort to pursue
my doctorate and likewise, shared his professional development initiatives. Also, my son
Randy II drew on his professional knowledge to provide insight about managing the
physical rigors of extended research.
Finally, I am very thankful for my supportive and understanding wife, Marie.
From the initial discussions and plans to embark on the rigorous Doctor of Business
Administration, until this concluding point, she has been with me every step of the way.
Also, most importantly, with the directed mental focus required of me in the program, my
wife’s prayers and emotional commitment provided well-being for our entire family. Her
actions extended to my wonderful mother, Claudette, who likewise supported me in this
academic journey. I am truly grateful for all the support.

vii
ABSTRACT
MANAGEMENT AND ORGANIZATIONAL INFLUENCES ON THE
COMPLIANCE BEHAVIOR OF EMPLOYEES TO REDUCE
NON-MALICIOUS IT MISUSE INTENTION
by
Randy G. Colvin
The widespread use of information technology and information systems (IT) throughout
corporations, too often includes employees who choose not to follow the stated policies
and procedures in performing their job tasks. In many cases, this encompasses employees
who mean no harm, but choose not to comply with IT policies and procedures. The
present study frames such compliance behavior as non-malicious IT misuse. Non-
malicious IT misuse by an employee occurs when the employee improvises, takes short
cuts, or works around IT procedures and guidelines in order to perform their assigned
tasks. As expressed, they do not intend to cause internal control or compliance problems
but may simply want to meet their assigned task objectives with the use of IT
applications. Studies usually address this phenomenon with deterrence and
punishment/reward theories, but literature suggests additional theoretical approaches to
further understand non-malicious IT misuse. This study proposes management driven
policy approaches, along with organizational factors to reduce intention of non-malicious
IT misuse.
viii
TABLE OF CONTENTS
Title Page ....................................................................................................................... i
Copyright Page.............................................................................................................. ii
Signature Page ............................................................................................................. iii
Acknowledgements ...................................................................................................... iv
Abstract ....................................................................................................................... vii
Table of Contents ....................................................................................................... viii
List of Tables ............................................................................................................... ix
List of Figures ................................................................................................................x
Chapter I – Introduction .................................................................................................1
Chapter 2 – Literature Review .....................................................................................11
Chapter 3 – Methods ....................................................................................................36
Chapter 4 – Analysis ....................................................................................................49
Chapter 5 – Discussion and Conclusion ......................................................................68
References ....................................................................................................................73
Appendices ...................................................................................................................83

ix
LIST OF TABLES
Table
1 Summary of IT Misuse Dependent Variable in Prior Studies .........................12
2 Individual Level Independent Variables Summary .........................................15
3 Organizational Level Independent Variables Summary ..................................16
4 Social Learning Theory Aspects ......................................................................18
5 Initial Standardized Regression Weights .........................................................51
6 Final Standardized Regression Weights ..........................................................52
7 Final Regression Weights with Significance ...................................................52
8 CFA Evaluation Criteria Summary ..................................................................53
9 Metric Conjoint Analysis Part-Worth Utilities (coefficients) ..........................56
10 Attribute Importances ......................................................................................56
11 Correlations for Cluster Analysis.....................................................................60
12 Descriptives of Key Cluster Measures .............................................................62
13 Significance of Key Cluster Measures .............................................................63
14 Descriptives of Cluster-1 and Cluster-2 Part-worths .......................................62
15 Significance of Cluster-1 and Cluster-2 Part-worths .......................................64
16 Significance of Cluster-1 and Cluster-2 Attribute Importances ......................66
17 Summary Results of Hypothesized Relationships ...........................................67
Appendix A: Profile Descriptions of Company ...........................................................85
Appendix B: Calculation of Hit Rate Example............................................................86
Appendix C: Act and Rule Survey Utilitarian Scale ...................................................87
Appendix D: Respondent Profile .................................................................................88
Appendix E: Confirmatory Factor Analysis Tables .....................................................90
Appendix E1: Standardized Residual Covariances......................................................90
Appendix E2: CMIN ....................................................................................................90
Appendix E3: Goodness-of-Fit Index (GFI) ................................................................90
Appendix E4: Comparative Fit Index ..........................................................................90
Appendix E5: Convergent Validity .............................................................................91
Appendix E6: Discriminant Validity ...........................................................................91
Appendix F: Extract of Agglomeration Schedule ........................................................92

x
LIST OF FIGURES
Figure
1 Theoretical Model ............................................................................................26
2 Confirmatory Factor Analysis Model ..............................................................52

1
CHAPTER 1
INTRODUCTION
Over the past three decades, information technology and information systems (IT)
have experienced wide adoption across corporations at various employee levels
(Ayyagari, Grover, & Purvis, 2011; Wang, 2010). However, with this increased use, IT
compliance issues have become common (Bulgurcu, Cavusoglu, & Benbasat, 2010;
CERT, 2014; Greitzer et al., 2014; Klamm & Watson, 2009; Siponen, Adam Mahmood,
& Pahnila, 2014). Concerns often involve employees who do not adhere fully or
consistently with established policies and procedures when performing job functions that
include IT (D’Arcy & Devaraj, 2012; Siponen et al., 2014). In many cases, this
phenomenon encompasses employees who mean no harm, but choose not to comply with
IT policies and procedures (D’Arcy, Herath, & Shoss, 2014; Willison & Warkentin,
2013). The present study frames the resulting compliance behavior around non-malicious
IT misuse.
Non-malicious IT misuse by an employee can occur when the employee
improvises, takes short cuts, or works around IT procedures and guidelines in order to
perform their job responsibilities, without malicious intent. Specifically, employees might
seek ways to continue use of obsolete or unauthorized software due to familiarity, or to
save time, they may ignore alerts and warnings that request an action by the employee
(D’Arcy & Devaraj, 2012). However, literature and studies indicate that a number of
major breaches/failures or cyber-attacks are due to the above type non-malicious IT

2
misuses by employees (CERT, 2014; Ponemon Institute, 2012; Verizon Business
Systems, 2011). Put another way, employee non-malicious IT misuses contribute to the
window/opportunity for malicious activity by employees or outsiders to breach the
system, or harm the company.
In a recent survey of information security practitioners, respondents reported that
60% of their losses were due to non-malicious intentions (Richard, 2010). Similarly, in
2011 with their seventh annual study of U.S. company data breaches, Ponemon Institute
found that 39% of occurrences were due to negligence of an insider (Ponemon Institute,
2012). In addition, a 2011 data breach study by Verizon reported 69% of security
incidents were related to insiders, most non-malicious (Verizon Business Systems, 2011).
This information drawn from industry highlights the prevalence of non-malicious IT
misuse by employees.
Moreover, from a review of U.S. Securities and Exchange Commission (SEC)
filings in Audit Analytics, several examples can be found where corporations were
negatively impacted by non-malicious IT activities. In 2006, a corporation (Central Index
Key 0001005414) with $11.275 billion in revenue reported problems due to IT that
supported complex processes (Audit Analytics, n.d.). The complex processes generated
significant staff workload and during that period, employees executed improper tax,
property, and reporting activities (Audit Analytics, n.d.). Also in 2006, a company (CIK
0000770944) with revenue of $1.059 billion reported material weaknesses in their IT
control compliance, which was in part due to not employing enough personnel to execute
processes properly (Audit Analytics, n.d.). Lastly, in 2007 a corporation (CIK
0000840256) with $194 million in revenue reported compliance weaknesses around

3
complex IT related transactions that led to a breach of IT by senior officers (Audit
Analytics, n.d.).
In the examples presented above, the SEC reports did not cite malicious behaviors
such as collusion, fraud, falsification, or misrepresentation by employees at the “initial”
transaction level that lead to the breakdowns. Consequently, lack of malicious behaviors
indicates non-malicious activities. Hence, both industry journals and oversight regulatory
filings indicate the need to address non-malicious IT misuse by employees.
Non-malicious IT misuse by employees is also part of the overall concern with
insider threats addressed by leading organizations. CERT Insider Threat Center, located
in the Software Engineering Institute of Carnegie Mellon University, is one entity
committed to this area. It is recognized as an authoritative national organization, that uses
theoretical and empirical insights to support government, private industry, academia, and
law enforcement (CERT, 2014). Studies by CERT reveal that an employee’s
noncompliance with policies and procedures could involve organizational, departmental,
functional, personal, or even IT complexity issues (CERT, 2014). These areas suggest
needed research to understand management, policy, and system related factors that
impact non-malicious IT misuse by employees.
The previous discussions of employee non-malicious IT misuse highlight the
negative impact on organizations. However, studies commonly evaluate employee
“malicious” activities to assess damage from IT misuse in companies (D’Arcy &
Devaraj, 2012; Roy Sarkar, 2010; Vance, Lowry, & Eggett, 2013; Willison & Warkentin,
2013; Zafar & Clark, 2009). Malicious activities involve employees who do not accept or
regard policies and procedures, and commit activities with an intent of harm to the
4
organization or others (Willison & Warkentin, 2013). Researchers also have noted
employee malicious activities such as destroying data, stealing cash and investments,
stealing customer records, and committing other fraudulent activities (Willison &
Warkentin, 2013; Zafar & Clark, 2009). Although the motivation for the actions can
differ, with malicious misuses set on causing harm and non-malicious misuses not intent
on causing harm, the pervasive use of IT across corporations can result in both misuses
causing significant damage.
CERT identified some common characteristics of insiders who commit malicious
activities (Silowash et al., 2012). One characteristic is that malicious insiders often
collaborate with nefarious or criminal outsiders (Silowash et al., 2012). Another is a
heightened drive for selfish gain (Silowash et al., 2012). Lastly, there is usually a sense of
revenge (Silowash et al., 2012). The current research recognizes that malicious misuse
driven by these aspects should be properly deterred, controlled, and disciplined. In
addition, from the common characteristics behind malicious activities, one can view
employee malicious IT misuses as being grounded in personal or internal motivations
versus broader organizational reasons. Conversely, as discussed earlier, some established
reasons employees commit non-malicious IT misuses include organizational issues such
as working around complex systems, compensating for heavy workloads, and lacking
training awareness of behavioral impact (CERT, 2014). Based on the role of
organizational factors and employee engagement in non-malicious IT misuse, the current
research views this relationship as key for increasing understanding of employee non-
malicious IT misuse intentions. Moreover, since these employees would not be intent on
causing harm to the organization, they should be good resources, and receptive to policies
5
and procedures, management leadership, and other organizational initiatives that support
proper use of IT while facilitating job performance.
To set the compliance context for employee behavior, drawing on over 20 years
of significant IT experience, the researcher recognizes that certain IT policies and
procedures within an organization are mandatory, non-elective types (Osborn, Sandhu, &
Munawer, 2000; Sandhu & Samarati, 1996; C. N. Zhang & Yang, 2003). These policies
and procedures meet safeguard requirements. Examples include system-mandated change
of passwords every 90 days, systematic backups, and formal setup and tracking of user-
names (Osborn et al., 2000; Sandhu & Samarati, 1996). The current study identifies and
defines these mandatory policies and procedures as Level-2 policies and procedures.
Other type policies and procedures, perhaps due to cost-benefit or efficiency, are
configured with a self-compliance format, hence compliance behavior (Guo, Yuan,
Archer, & Connelly, 2011). The present research identifies and defines these as Level-1;
they are “initial” compliance controls and play a key role. Employees are expected to
follow these mandatory or required IT policies and procedures using their initiative.
Although the self-compliance type policies are also mandatory, the main difference in
Level-1 and Level-2 is that enforcement is usually not controlled by systematic more
costly programming at Level-1 (Guo et al., 2011). At Level-1, behavior normally receives
periodic review and oversight monitoring. Depending on the organization, this
monitoring may be weekly, monthly, quarterly, semi-annually, or annually if at all. In
some cases, public corporations may default to their annual external audits for review of
compliance behaviors (Colvin, 1984). In either case, the period before effective
monitoring and correction is a risk period for corporations in terms of Level-1 self-

6
compliance controls. Thus at Level-1, for this study employee behavior is of utmost
importance and is viewed as the first line of defense against IT attacks and data breaches.
The goal is to reduce employee intentions of non-malicious IT misuse so they would be
better positioned to support efforts to safeguard IT data and systems. This study’s design
takes into account Level-1 and Level-2 type policies and procedures in order to make a
clearer assessment of management and organizational influences on employee non-
malicious IT misuse intentions.
The present research notes that the Level-1 and Level-2 controls, framed and
introduced in the previous discussions, are built on three aspects. The first is that policies
and procedures on both levels are considered established authorizing procedures, not
provided with a choice to comply or not comply (Guo et al., 2011). Hence, although
Level-1 controls tend to be self-compliance types, failure to comply is still considered a
violation of policy (Guo et al., 2011). The designation as levels does not convey a
varying sense of compliance intent. Next, as used in the current research, level implies a
grouping of similar concepts and content items (Merriam-Webster’s collegiate dictionary,
2012), which would be self-compliance type policies and procedures at Level-1 and more
costly systematic type controls at Level-2. In information technology, the view of similar
concept or content levels is akin to the use of difficulty or skill levels used in the
technology gaming industry (De Liu, Xun Li, & Santhanam, 2013). Finally, assigning the
numerical Level-1 and Level-2 designation connotes a chronological order (American
Psychological Association, 2010), as in employees being part of the first line of defense,
Level-1. The above aspects provide the basis for framing and understanding Level-
1/Level2 controls in subsequent discussions.

7
In defining the scope for non-malicious IT misuse intentions, extant literature
mainly reports on IT compliance involving all-inclusive non-malicious “insiders”
(Greitzer et al., 2014; Roy Sarkar, 2010; Steele & Wargo, 2007; Williams, 2008).
Insiders include employees, contractors, vendors, and consultants (Steele & Wargo,
2007). This study narrows the scope of non-malicious IT misuse intentions to employees
only. By excluding contractors, vendors, and consultants, research data should isolate the
influence of organizational policies and procedures on employees. Accordingly, clearer
insight of the impact on employees is significant since this study considers employee
behavior a first line safeguard for IT systems and data.
At the time of the current research, a review of top journals only referenced two
scholarly works that address non-malicious IT use by employees (Guo et al., 2011;
Willison & Warkentin, 2013). Willison and Warkentin (2013) discussed non-malicious
IT behavior as part of an overall framework, but their focus was factors leading to
malicious abuse and deterrence. However, Guo et al. (2011) targeted non-malicious
intentions of employees which contributes to the present research. Most importantly, Guo
et al. (2011) put forth a non-malicious security violation model (NMSV) that was not
based principally on deterrence, but which demonstrated support for influencing NMSV
intentions. The NMSV model was grounded in utilitarian, normative, and self-identity
outcomes, in addition to attitude (Guo et al., 2011).
Although both Guo et al. (2011) and Willison and Warkentin (2013) contributed
to the understanding of non-malicious IT misuse by employees, their work was based
primarily on individual level antecedents. The use of organizational level factors in the
present study is expected to provide additional understanding of non-malicious employee

8
behavior. These antecedents can be modified and controlled centrally at the
organizational level with the resulting effects monitored. In addition, for the current
research, organizational level encompasses both organizational and departmental levels
since leaders of both are charged with management oversite and control. The results
uncovered in this study are intended to provide insights to managers and leaders about
important organizational features that could be controlled to influence a reduction in IT
threats and breaches.
As previously indicated, a significant number of empirical studies blend non-
malicious IT misuse by employees along with other insiders. This phenomenon is then
often evaluated with punishment/reward or deterrence type theories; remedies also
commonly applied to malicious actions (Bulgurcu et al., 2010; D’Arcy & Devaraj, 2012;
Herath & Wijayanayake, 2009; Chen, Ramamurthy, & Wen, 2012; D’Arcy, Hovav, &
Galletta, 2009; Straub, 1990; Kankanhalli, Teo, Tan, & Wei, 2003). In particular,
deterrence theory holds that as the severity and certainty of punishment and sanctions
increase, the level of prohibited behavior should decrease (Akers, Krohn, Lanza-Kaduce,
& Radosevich, 1979). The current study does recognize deterrence and
punishment/reward theories as being appropriate for malicious actions, but open to
additional theories for non-malicious activities. Moreover, while these studies evaluate
influences on employees who are embedded within a group of insiders, the present
research examines employee behavior uniquely from other insiders such as contractors
and vendors. Thus, as previously discussed, by examining employees only, results of this
study should provide more robustness for organizational and management decisions.
9
After reviewing punishment/reward and deterrence based studies against reasons
employees perform non-malicious IT activities, assessment of other influences appear
suitable. Punishment/reward and deterrence theories have demonstrated results with
antecedents such as certainty of sanctions, condemnation, and perceived severity of
sanctions (D’Arcy & Devaraj, 2012; D’Arcy et al., 2009; Siponen & Vance, 2010).
However, as referenced earlier, some established reasons employees commit non-
malicious IT misuses include working around complex systems, compensating for heavy
workloads, and lacking training awareness of behavior impact (CERT, 2014). These
reasons seem to have a connection with management leadership and quality of
organizational resources. For example, some studies have found employees to be driven
to complete job responsibilities successfully within the organization, but with the aid of
non-malicious IT misuses (Guo et al., 2011; Siponen & Vance, 2010). Furthermore, the
current study reasons that these employees were seeking to meet expectations and
possibly did not view non-malicious IT misuses as damaging or subject to severe
sanctions. Consistent with prior discussions, since motivations for malicious intentions
differ from that of non-malicious intentions (Silowash et al., 2012), and employees
influenced toward non-malicious intentions tend to be internally performance driven Guo
et al. (2011), the current research focuses on employees. Accordingly, the present study
expands the research scope and examines management driven organizational level
factors, to understand compliance issues involving non-malicious IT misuse intentions by
employees. The resulting research question is:
RQ: What management and organizational factors reduce employee intentions of
non-malicious IT misuse while performing job duties?
10
In seeking to understand the phenomenon surrounding this question, this study also
recognizes the need to extend and establish a new theoretical framework.
This paper contains four subsequent chapters. Chapter 2, Literature Review,
introduces and presents a discussion of related research on employee non-malicious IT
misuse. The analysis identifies the opportunity for new insights, approach to construct
development, theoretical basis, and the resulting research model with supporting
hypotheses. Chapter 3, Methods, discusses the basis and use of metric conjoint analysis
as the multivariate data analysis tool in the research design. Chapter 4 presents an
analysis of the results. The paper concludes with a discussion of the findings,
contributions, and future research opportunities in Chapter 5.
11
CHAPTER 2
LITERATURE REVIEW
Introduction and Scope
To begin the literature review for this study, the scope and nature of non-
malicious IT misuse are first explored. Overall, as the subject of focus, non-malicious IT
misuse is categorized as a compliance behavior (Guo et al., 2011). Previous studies have
framed IT compliance behavior using slightly different scopes. These scopes are
represented by IS misuse intention (D’Arcy et al., 2009), non-malicious security violation
(Guo et al., 2011), intention to comply (Bulgurcu et al., 2010), and policy compliance
intention (Hu, Dinev, Hart, & Cooke, 2012). Employee non-malicious IT misuse as
defined in the current research extends from these factors.
The four studies cited for framing IT misuse are summarized in Table 1. Two
main themes are drawn from these studies in reference to IT misuse. They are (a) IT
security policies and procedures were in place, and (b) other social factors such as
workgroup, training, understanding, and skill had significant influence (Bulgurcu et al.,
2010; D’Arcy et al., 2009; Guo et al., 2011; Hu et al., 2012). Most importantly, these
studies present support for factors that influence IT misuse. However, the present
research extends these findings by defining and assessing employee non-malicious IT
misuse using parsimonious organizational level factors with employees being viewed as
instrumental in protecting against IT breaches and attacks.

12
Table 1
Summary of IT Misuse Dependent Variable in Prior Studies
Author and Theory Purpose of Study
Dependent Variable - Definition of
IT Misuse
Dependent Variable- Measurement Items
D’Arcy et al.(2009)
General deterrence
theory
Whether employee’s awareness
of IT security measures influence
perception of certainty and
severity of sanctions, and thereby
reduces misuse.
IS misuse intention – Employee’s
intention to perform a behavior
that the organization states is IT
misuse.
Sending an inappropriate e-mail.
Use of unlicensed software.
Unauthorized access to data.
Unauthorized modification of data.
Guo et al. (2011)
Theory of reasoned
action; Theory of
planned behavior
Examine factors that influence
end users to violate IT policies
and procedures.
Non-malicious security violation –
End user activity known to violate
organizational IT policies but done
without malicious intent to cause
damage.
Writing down the password.
Using unauthorized portable devices for storing and carrying
organizational data.
Installing and using unauthorized software.
Using an insecure public wireless network for business purposes.
Bulgurcu et al.
(2010)
Theory of planned
behavior
Evaluate how factors based on
rational decision-making, drive
employees to comply with IT
policies to protect organizational
resources and information.
Intention to comply – Employee’s
intention to safeguard company’s
IT systems and information from
potential breaches.
I intend to comply with the requirements of the Information
Security Policy (ISP) of my organization in the future.
I intend to protect information and technology resources according
to the requirements of the ISP of my organization in the future.
I intend to carry out my responsibilities prescribed in the ISP of my
organization when I use information and technology in the future.
Hu et al. (2012)
Theory of planned
behavior
Understand the influence of
organizational culture and top
management on employees’
intention to comply with IT
policies.
Policy compliance intention –
Employee’s intention to comply
with IT policies of organization.
I intend to follow the information security policies and practices at
work.
I intend to use the information security technologies at work.
I intend to use common sense on good information security
practices at work.
13
Study of compliance behaviors by CERT also recognizes three main themes that
underlie employees taking part in non-malicious IT misuses (CERT, 2014). The first is
that they simply have a lack of knowledge. Next, they have a propensity to ignore or
underestimate the seriousness of non-malicious IT misuse. Lastly, these employees
perceive that using the system in compliance with the policies and procedures interferes
with or hinders job tasks (CERT, 2014). These three themes are also common in
individual empirical studies (Bulgurcu et al., 2010; Guo et al., 2011; Parasuraman &
Alutto, 1984).
Drawing from CERT (2014), examples of employee non-malicious IT misuses
are:
Ignoring system warnings, alerts, or notices while performing job duties.
Leaving records, transactions, or processes incomplete (i.e., pass deadlines).
Using software that is not authorized or supported by company.
CERT’s definition for employees and insiders who commit these compliance behaviors
is:
An unintentional insider threat is (1) a current or former employee,
contractor, or business partner (2) who has or had authorized access to an
organization’s network, system, or data and who, (3) through action or
inaction without malicious intent, (4) unwittingly causes harm or
substantially increases the probability of future serious harm to the
confidentiality, integrity, or availability of the organization’s resources or
assets, including information, information systems, or financial systems.
(CERT, 2014)
The definition of employee non-malicious IT misuse intentions in the present
research is developed from CERT guidelines and definitions from the four studies
presented in Table 1. However, the definition from Guo et al. (2011) is a principal source.
The scope of application for the definition in the current study is directed at subjects of
14
publicly traded corporations, registrants of the U.S. Securities and Exchange Commission
(SEC). In prior studies, the dependent variable for studying IT misuse (see Table 1) has
been named and defined in several overlapping ways. Based on criteria drawn from the
above sources, in a similar manner, the present research defines employee non-malicious
IT misuse intention as, employee’s intention not to follow policies and procedures while
using IT to perform job duties, but done without intention of harm to the organization.
Drivers of Non-malicious IT Misuse
In the previous literature review of employee IT misuse as a dependent variable,
key relationships and predictor variables were also noted (Bulgurcu et al., 2010; CERT,
2014; D’Arcy et al., 2009; Guo et al., 2011; Hu et al., 2012). Significant independent
variables from the review are summarized in Table 2 and Table 3. To support analysis for
the current study, the tables are categorized by research level of the variables (i.e.,
individual, organizational). In addition, variables were selected which had standardized
coefficients that produced at least a small-moderate influence, or greater (Hair, Celsi,
Money, Samouel, & Page, 2011), relative to its research model. Overall, this review
provides empirical support for the independent variables developed subsequently in the
research model for the current study.
A detailed assessment and summarization of variables from Table 2 and Table 3
advances seven concepts. Under organizational levels the concepts are: (1) authoritative
application of IT policies and procedures, (2) advancement of IT policies and procedures
that are not burdensome, (3) provision of knowledge and skill to perform IT policies and
procedures, (4) encouragement and support by managers/supervisors, and (5) recognition
and reward for compliance. Main themes for individual levels are: (1) recognizing and

15
understanding employee role, and (2) gaining and maintaining knowledge and skill, to
perform IT policies and procedures. Consistent with these concepts, extant research by
Table 2
Individual Level Independent Variables Summary
Variable Name Variable Definition Author and
Theory
Information
Security
Awareness
Employee’s general knowledge about IT security and
IT policy within organization.
Bulgurcu et al.
(2010)
Theory of
planned behavior
Intrinsic Benefit Employee’s positive feelings about compliance with
IT policy.
Safety of
Resources
Employee’s perception that IT resources are
safeguarded as a result of their compliance with IT
policy.
Vulnerability of
Resources
Employee’s perception that information and
technology resources are exposed to risks and threats
as a consequence of their noncompliance with IT
policies.
Self-Efficacy to
Comply
Employee’s judgement of personal skills, knowledge,
or competency to meet requirements of IP policy.
Perceived
Behavior Control
Employee’s perceived ease or difficulty of performing
a behavior, and personal feeling of whether they have
the skill and control over doing it.
Hu et al. (2012)
Theory of
planned behavior
CERT (2014) notes management behavior, policy and procedures, work environment
stress, training, and IT applications as key organizational factors impacting non-malicious
IT misuse or compliance behavior of employees (CERT, 2014).
Lastly, two studies presented and controlled for ethical considerations (D’Arcy et
al., 2009; Hu et al., 2012). D’Arcy et al. (2009) included moral commitment and found
that it influenced perception of IT sanctions. Likewise, Hu et al. (2012) controlled for
dutifulness, framed as conscientiousness to comply with rules. Hu et al. (2012) found that
dutifulness had a significant impact on intention to comply with IT policies and
procedures. Both studies expressed that although the ethical type factors enhanced
16
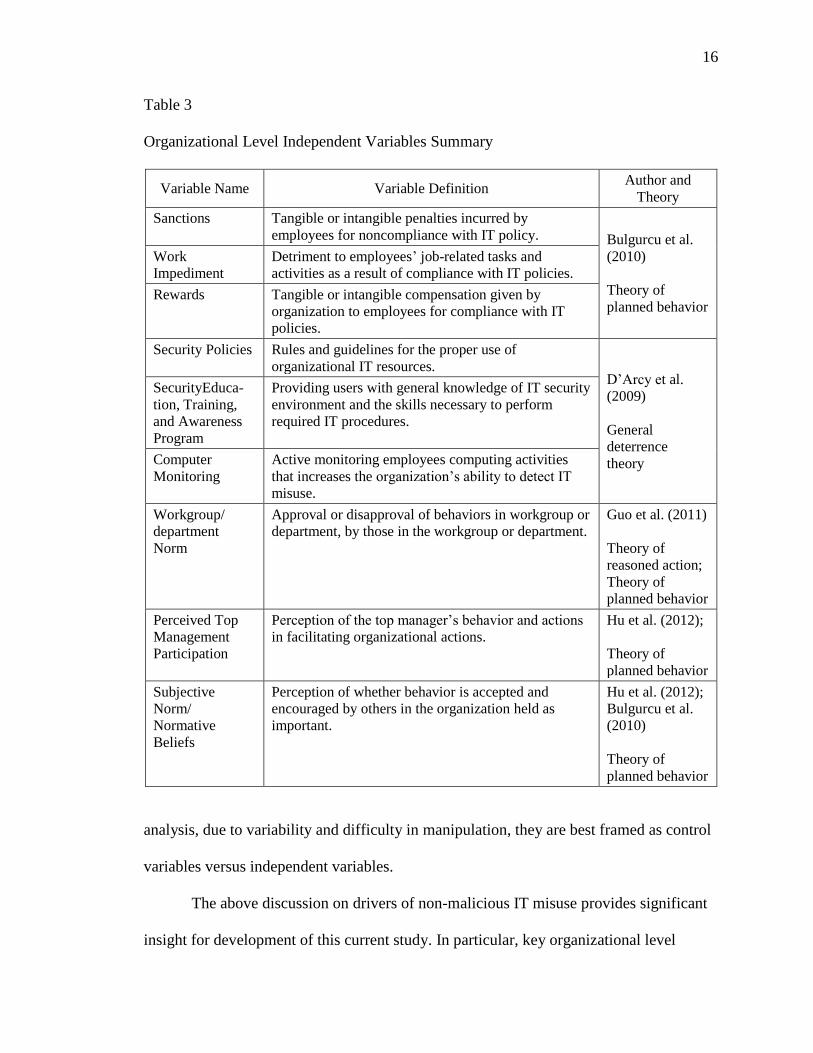
Table 3
Organizational Level Independent Variables Summary
Variable Name Variable Definition Author and
Theory
Sanctions Tangible or intangible penalties incurred by
employees for noncompliance with IT policy. Bulgurcu et al.
(2010)
Theory of
planned behavior
Work
Impediment
Detriment to employees’ job-related tasks and
activities as a result of compliance with IT policies.
Rewards Tangible or intangible compensation given by
organization to employees for compliance with IT
policies.
Security Policies Rules and guidelines for the proper use of
organizational IT resources. D’Arcy et al.
(2009)
General
deterrence
theory
SecurityEduca-
tion, Training,
and Awareness
Program
Providing users with general knowledge of IT security
environment and the skills necessary to perform
required IT procedures.
Computer
Monitoring
Active monitoring employees computing activities
that increases the organization’s ability to detect IT
misuse.
Workgroup/
department
Norm
Approval or disapproval of behaviors in workgroup or
department, by those in the workgroup or department.
Guo et al. (2011)
Theory of
reasoned action;
Theory of
planned behavior
Perceived Top
Management
Participation
Perception of the top manager’s behavior and actions
in facilitating organizational actions.
Hu et al. (2012);
Theory of
planned behavior
Subjective
Norm/
Normative
Beliefs
Perception of whether behavior is accepted and
encouraged by others in the organization held as
important.
Hu et al. (2012);
Bulgurcu et al.
(2010)
Theory of
planned behavior
analysis, due to variability and difficulty in manipulation, they are best framed as control
variables versus independent variables.
The above discussion on drivers of non-malicious IT misuse provides significant
insight for development of this current study. In particular, key organizational level
17
variables align with this study’s focus on management and organizational level factors to
influence employee intentions. Additionally, CERT (2014) clearly categorizes these
factors from an organizational perspective. Although positioned differently, the
individual level concepts also emphasize the value of developing employees with
organizational resources, and utilizing employees to counter IT threats and attacks. The
next section advances the theoretical framework in light of the above discussion.
Theoretical Framework
The review of literature identified key organizational concepts and variables.
These areas included management, knowledge and skill, IT applications, policies and
procedures, ethical considerations, and burdensome/cumbersome activities (Bulgurcu et
al., 2010; CERT, 2014; D’Arcy et al., 2009; Guo et al., 2011; Hu et al., 2012).
Recognition/reward for complying with IT policies was also studied (Bulgurcu et al.,
2010). However, in the current research, employee consideration is reflected in efforts by
the organization to address job stress. To support the framing of the theoretical
relationships for the organizational factors identified in this current study, the theoretical
approach is drawn primarily from social learning theory (Bandura, 1971). To provide
comprehensive understanding from social learning theory as used in the present research,
coping theory (Lazarus & Folkman, 1984) is applied to effects of organizational stress
and utilitarian theory (Beauchamp & Bowie, 1997) is applied to the influence of ethics.
Social Learning Theory
Social learning theory is based on the relationships of three overall aspects,
environmental, cognitive, and behavioral (see Table 4), and their influence on respondent
behavior (Bandura, 1971). There is an interactive nature between these factors but for this
study, the focus is the flow through constructs to the targeted employee behavior.

18
Table 4
Social Learning Theory Aspects
Environmental Cognitive Behavior
Influence Insight Skill
Modeling Interpretation Guidance
Observation Anticipation Practice
Self-efficacy
Note: Adapted from “Social Learning Theory”, by A. Bandura, 1971,
Morristown, N. J., General Learning Press, 1971.
Bandura (1971) found that environmental elements such as words, actions, and
experiences of others, provide a basis for those exposed to these elements to learn the
behavior, and have that behavior conditioned as a response. Bandura (1971) went on to
explain that these environmental elements have a stronger effect when the observer or
recipient has a dependent or relevant relationship with the individual being observed.
This is akin to management-employee relationships in the current study, where the
employee is accountable to management. Accordingly, in formulating a view of the IT
compliance environment, employees would look to management, which frames
management compliance modeling as an environmental factor. By observing and being
exposed to management, employees would learn management’s expressed position and
be conditioned to that expected behavior (Bandura, 1971).
To expound, learning by observation allows individuals to comprehend and gain
from wider perspectives (Bandura, 1971), thereby increasing their ability to perform the
compliance activities. Consequently, experiences acquired by observation play a crucial
role for individuals in comprehending and meeting compliance objectives. Experiences
achieved by observation or by individuals performing tasks themselves, provide a basis

19
for the individual to reason through challenges to complying with policies and
procedures, in order to reach a resolution and avoid noncompliant behavior (Bandura,
1971). However, during this process of reasoning, if employees had previously observed
or recognized management responses that were not in agreement with compliance
objectives, unfortunately, employees would symbolically incorporate that behavior as an
acceptable resolution (Bandura, 1971). In the present research, noncompliant behavior
framed as non-malicious IT misuse intention, is expected to be significantly influenced
by an employee’s observation of management.
Cognitive elements are thoughts and perceptions about what behaviors are
expected (Bandura, 1971). Perceptions are formed when impacted by direct stimuli or
influences, like goals, objectives, and job responsibilities (Bandura, 1971). Respondents
draw on perceptions when they attempt to relate their individual actions to expected
behavior outcomes (Bandura, 1971). However, a significant point is that individuals
adjust their insight of expected behavior, to what they actually experience (Bandura,
1971). In reference to the current study, although policies may direct one form of
compliance behavior, employees could experience seemingly high organizational job
demands or stress, that could lead them to adjust perceptions of what is required in order
to meet expectations. Accordingly, the present research considers the influence of
perceptions or insight when assessing compliance behavior of employees in reference to
non-malicious IT misuses.
Behavioral elements for performing compliance activities encompass training
awareness, skill, use of actual items (IT), and most importantly self-efficacy (Bandura,
1971). Self-efficacy is an individual’s confidence that they can successfully perform the
20
expected behavior (Bandura, 1977). Bandura (1977) established that self-efficacy plays a
significant role in performance behavior of individuals. Self-efficacy indicates (1)
whether an activity would be undertaken, (2) the level of effort that would be applied,
and (3) the consistency of performing the activity in light of difficulties and challenges.
In the scope of this study, usability of IT applications, understandability and doability of
policies and procedures, and training awareness represent behavior factors that interact
with the self-efficacy of employees. Although self-efficacy is not captured as a unique
construct in the present study, the collective influence of IT applications, policies and
procedures, and training awareness also serves as a proxy for the element of self-efficacy.
In summary, these behavior factors stand to influence employee compliance ability in
order to decrease non-malicious IT misuse intentions.
As presented, in order for respondents to model or perform the desired behavior,
they must have the skill to execute the expected tasks (Bandura, 1971). In reference to IT
policies and procedures, respondents should be trained to comprehend and execute the
policies and procedures. Likewise, IT applications must have a configuration that is
learnable, and which can be operationalized efficiently and effectively. If not, employees
will have difficulty performing compliance activities, which Bandura (1971) found, leads
to individuals increasing consideration for noncompliant activities. This explains that
employees would increase consideration for non-malicious IT misuses in order to
accomplish job outcomes, when they lack skill and comprehension to execute policies
and procedures, and use IT applications properly.
Bandura’s social learning theory provides a very suitable basis for understanding
employee behavior regarding non-malicious IT misuses. Highly cited scholars in IT have

21
also utilized social learning theory to generate good explanatory and predictive analysis
of IT behavior (Agarwal & Karahanna, 2000; Chiu, Hsu, & Wang, 2006; Compeau &
Higgins, 1995; Marakas, Yi, & Johnson, 1998). Development of the research model in
the next section will capture empirically supported variables that align with
environmental, cognitive, and behavioral relationships (see Table 4) from social learning
theory (Bandura, 1971), to predict employee non-malicious IT misuse intentions.
Social learning theory combined with the previous discussions expresses how
employees are affected by five key organizational areas --- management modeling
behavior, policies and procedures, IT applications, job demand stress, and training
awareness. Bandura’s (1971) social learning theory, through environmental aspects
(influence, modeling, observation), cognitive (insight, interpretation), and behavior
aspects (skill, self-efficacy) explains the relationships for framing these five factors in the
present study. Thus, it is expected that employees would be provided with a reduced need
for pondering non-malicious IT misuse intentions if these areas are addressed. Following
are further theoretical discussions of job demand stress as an antecedent, and employee
ethics, which is not an organizational level construct for this study, but will be accounted
for.as a control variable.
Organizational Job Demand Stress and Coping Theory
In corporate environments targeted in the current study, IT is inescapable for job
performance. However, along with this pervasive use, employees can still experience
organizational and management driven job demand stresses (Parasuraman & Alutto,
1984; Ragu-Nathan, Tarafdar, Ragu-Nathan, & Qiang Tu, 2008). It is not uncommon for
employees to experience increased workloads, complexities, and heightened time

22
pressures for related IT business processes (Ayyagari et al., 2011; Parasuraman & Alutto,
1981, 1984). In the face of job demand stresses, employees could seek means they view
as necessary to successfully complete job duties, although they may not be in accordance
with policies and procedures.
In the present study, coping theory is used to understand employee behavior when
challenged with organizational job demand stress. Lazarus and Folkman (1984) are
credited with principally establishing and advancing coping theory (Beaudry &
Pinsonneault, 2005). Coping theory explains how an individual recognizes his or her
limitations when faced with demanding or challenging circumstances, but continues to
think, analyze, and act to manage the situation (Folkman & Moskowitz, 2004; Lazarus &
Folkman, 1984).
Moreover, research shows that although varying by subject and situation,
individuals focus on two main elements in these stressful situations, the problem and their
emotion (Folkman & Lazarus, 1980). In the current study, employees may operate under
stressful situations but still be challenged to consistently use IT properly --- in the face of
management actions, policies/procedures, and system applications. Problem-focused
coping efforts can include grasping the impact of the problem, developing skills and
alternatives/workarounds, plus influencing the working environment (Lazarus &
Folkman, 1984). Emotion-focused coping efforts strive to develop a frame of mind to
function, given the stress (Lazarus, 1999). Most importantly, it does not mean that the
individual mentally alters the facts surrounding the event, but instead they may choose
not to dwell on it, or they may reassess it for any positive outcomes (Lazarus, 1999). In
23
the end, employees must cope with the problems and emotions of stress, yet utilize
systems properly with reduced intentions of non-malicious IT misuse.
Employee Ethical Decision-Making, a Utilitarian Theory Focus
The current research recognizes that in a corporate environment with stressful job
demands, employees are also challenged with ethical considerations as they make coping
decisions related to non-malicious IT misuse intentions. These considerations could
involve how the employee views the outcome of the tasks they perform, the nature of
policies and procedures, and the propriety of how IT applications are configured. Studies
have shown that ethical positions that form the bases for these considerations are inherent
parts of the employee (Alder, Schminke, & Noel, 2007; Schminke, Ambrose, & Noel,
1997). Within the scope of the present research, with inherent aspects, these ethical
positions would be akin to traits like educational level, job title, and years on job.
Consequently, in the current research the influence of ethical positions is evaluated as a
control variable. This approach is consistent with other studies (D’Arcy et al., 2009; Hu
et al., 2012), and the present study’s focus on organizational and management level
independent constructs. However, given the strength of the personal nature of ethical
positions, the theoretical basis for their formation is further evaluated.
The approach to evaluating ethical theories in business falls into three categories:
(1) descriptive, which is based on historical business behaviors, (2) conceptual, which
looks at importance of meanings, and (3) normative, which frames what behaviors should
be followed (Beauchamp & Bowie, 1997). The process that individuals or employees use
to decide on a behavior includes: (a) perception of an ethical dilemma, (b) analysis of
rules and objectives, (c) alignment of situation with ethical basis, (d) decision, (e)
24
behavior action, and (f) learning from outcome (Donaldson, Werhane, & Cording, 2002).
The evaluation of employee non-malicious IT misuse intention in the current study aligns
with normative ethical theories.
Within business organizations, a primary normative ethical theory applicable to
employee behavior is categorized as consequentialism (Donaldson et al., 2002).
Consequentialism focuses on the overall greatest good or best consequence resulting
from a decision (Beauchamp & Bowie, 1997). Following is a discussion of
consequentialism as a normative framework for ethical behavior in reference to employee
non-malicious IT misuse intentions.
Development of the consequentialism view is mainly ascribed to John Stuart
Mills (1806 – 1873) where he grounded ethical theory in utility or the greatest good
(Beauchamp & Bowie, 1997; Mill, 1879/2010). Mills’ view went forward and became
known as utilitarianism (Beauchamp & Bowie, 1997). Utilitarianism is commonly used
in evaluating ethics of business conduct (Shapeero, Chye Koh, & Killough, 2003).
Utilitarianism is primarily applied in two forms, act utilitarianism and rule
utilitarianism (Beauchamp & Bowie, 1997). Act utilitarianism applies the act or ethical
decision that leads to the maximum benefit or greatest good without significant concern
over limiting or restricting rules (Beauchamp & Bowie, 1997). Within the framework of
the current study, act utilitarianism could apply to employees who make the decision to
take short cuts, work around policies and procedures, and improvise to meet IT related
outcomes. Under rule utilitarianism, the act or ethical decision that leads to the maximum
benefit or greatest good must be in accordance with policies and procedures, since they
are held to be firm and overarching (Beauchamp & Bowie, 1997; Hooker, 2000/2013;
25
Schminke, Ambrose, & Noel, 1997). In the present research, employees could recognize
the difficulty of utilizing IT applications in the face of cumbersome policies and
procedures, but accept stressful challenges to their job performance as long as they are
compliant with guidelines. The nature of these two ethical behaviors, act utilitarianism
and rule utilitarianism, shows the need to control for these variables when evaluating
non-malicious IT misuse intentions by employees. The following section utilizes the
discussed theories to frame the variable relationships and develop the theoretical model.
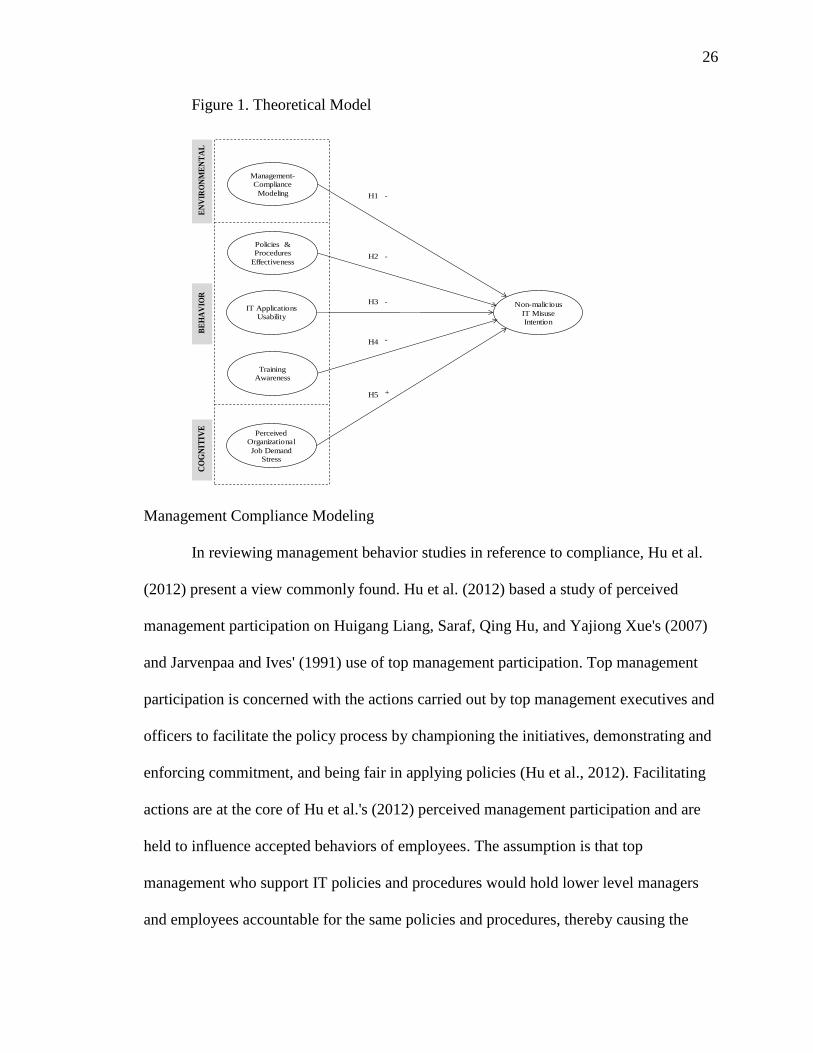
Theoretical Model and Hypotheses
The research model for the current study is presented at Figure 1. It is based
primarily on Bandura’s (1971) social learning theory, along with coping theory (Lazarus
& Folkman, 1984) and utilitarianism theory (Beauchamp & Bowie, 1997). This study
addresses organizational level constructs that are theorized to impact non-malicious IT
misuse intentions within a corporation. The constructs are drawn from literature and are
developed in the following sections. The three concepts of social learning theory ---
environmental, cognitive, and behavioral --- provide a foundation for framing the
relationships of organizational factors that influence non-malicious IT misuse intention
(see Figure 1).
26
Figure 1. Theoretical Model
Management Compliance Modeling
In reviewing management behavior studies in reference to compliance, Hu et al.
(2012) present a view commonly found. Hu et al. (2012) based a study of perceived
management participation on Huigang Liang, Saraf, Qing Hu, and Yajiong Xue's (2007)
and Jarvenpaa and Ives' (1991) use of top management participation. Top management
participation is concerned with the actions carried out by top management executives and
officers to facilitate the policy process by championing the initiatives, demonstrating and
enforcing commitment, and being fair in applying policies (Hu et al., 2012). Facilitating
actions are at the core of Hu et al.'s (2012) perceived management participation and are
held to influence accepted behaviors of employees. The assumption is that top
management who support IT policies and procedures would hold lower level managers
and employees accountable for the same policies and procedures, thereby causing the
-
-
-
-
+
BE
HA
VIO
RC
OG
NIT
IVE
H1
H2
H3
H4
H5
EN
VIR
ON
ME
NT
AL
Non-malicious
IT Misuse Intention
Policies & Procedures
Effectiveness
Management-Compliance
Modeling
IT Applications Usability
Training Awareness
Perceived Organizational
Job Demand Stress
27
views of top management to cascade throughout the organization (Hu et al., 2012). In the
current research, management’s role extends beyond facilitation efforts of top
management, as in Hu et al. (2012). The current study extends management’s role to
include the actual compliance behavior exhibited at middle and lower management levels
that are closer to transaction levels.
Zaccaro and Klimoski (2001) identified and recognized the operating
environments and roles of (a) top management, (b) middle management that report to top
officers, and (c) lower level management in organizations. Organizational strategies and
policies are supported when management at each level displays consistent understanding
of strategies and policies, and communicate the relative impact within their span of
influence (Zaccaro & Klimoski, 2001). For top management the span is across
departments and the organization; for middle and lower level management the influence
could be a department, unit, or employee (Zaccaro & Klimoski, 2001). Most importantly,
the influence of management behavior tends to be more direct at the lower and middle
level, whereas top management behavior tends to be more indirect (Zaccaro & Klimoski,
2001). The communication of middle and lower level management combined with the
more direct behavior influence of middle and lower management, support extending the
focus beyond the top management level (Zaccaro & Klimoski, 2001) as done in the
present study.
The role and influence of all management levels were further reported in a 25 year
(1985 -2009) review of 1,159 empirical studies from top journals (DeChurch, Hiller,
Murase, Doty, & Salas, 2010). Consistent with Zaccaro and Klimoski (2001), the
outcome of middle and lower level management indicated nearly all of their focus was on
28
the individual, team, or unit. Likewise, employee behavior was the management
emphasis. On the other hand, top management’s focus went beyond organizational and
departmental levels, with nearly all the management emphasis focused strategically and
externally (DeChurch et al., 2010). This profile of middle and lower level management
again advances the rationale for extending the management focus from the top level
down to lower levels of management, which would capture more of the influence at
employee, team, unit, and department transaction levels.
To better represent the role and influence of all three levels of management in the
current study of non-malicious IT misuse, the management construct is drawn from
Staples, Hulland, and Higgins (2006). Staples et al. (2006) applied self-efficacy theory to
the study of effective management of employees. “Modeling best practices by manager”
was the environmental construct based on self-efficacy theory. Modeling is a key aspect
for how users learn from behavior they observe in others under self-efficacy theory, and
the related social learning and social cognitive theories (Bandura, 1971, 1977, 1988).
Results produced strong support and significance for the influence of “modeling best
practices by manager” on the behavior of employees (Staples et al., 2006).
Based on the preceding discussions, the current study will frame the
environmental modeling construct as “management compliance modeling”. It captures
management behavior which is consistent with the policies and procedures that in effect,
are the policies and procedures approved by management. In addition, it reflects
management behavior that aligns, supports, and promotes organizational awareness of the
policies and procedures. It could encompass all three divisions of management, top,
middle, and lower levels. However, due to the transactional nature of uses subject to
29
Level-1 compliance controls, the particular focus of the present research is influence of
middle and lower levels of management. The measurement of management compliance
modeling will be based on how much respondents value management following and
demonstrating compliance, with company IT policies and procedures. Thus,
H1: As management’s modeling of compliance behavior increases, employees
decrease non-malicious IT misuse intention.
Policies and Procedures Effectiveness
In the current study, policies and procedures that advance IT compliance behavior
and control must be understandable and doable by employees to be effective (Hu et al.,
2012). Specifically, effectiveness implies that policies and procedures are clearly defined
and written, in addition to being relevant and practiced (Hu et al., 2012). With
effectiveness, employees should not be influenced to work around or not fully comply
when performing job duties. Effective policies and procedures in turn provide increased
perception for organizational awareness of policy and procedure goals (Straub & Welke,
1998). Policies and procedures play a central organizational role in supporting employee
compliance behavior and should reflect attributes that facilitate their use (Hu et al., 2012).
Effective policies and procedures also express the position of management in
terms of IT compliance since the policies and procedures are approved by management
(Hu et al., 2012). In addition, the present study recognizes that managers are also
positioned to help employees understand policies and procedures, and know how to
execute them; this influence should limit employee improvisations and misapplications
(X. Zhang & Bartol, 2010).
30
Prior studies have tested the effectiveness of policies and procedures by
measuring how clearly they are defined, how they support business transactions, and how
well they fit with IT applications (Hu et al., 2012; Spears & Barki, 2010). Likewise,
policies and procedures effectiveness in the current study will be assessed by how much
importance respondents place on their clarity, efficiency, and fit with business processes.
Lastly, the influence of policies and procedures on employee conduct, supports its
recognition as being relevant for this study and its classification as a behavior factor
under social learning theory (Bandura, 1971). Thus,
H2: As the effectiveness of policies and procedures increases, employees decrease
non-malicious IT misuse intention.
IT Applications Usability
IT applications in the present research are framed around their usability for
employees. Two sub-areas that address usability for employees are the capabilities of the
IT applications and easiness to use (CERT, 2014; Galletta & Hufnagel, 1992; Petter &
McLean, 2009; Vance et al., 2013). Capabilities encompass systems that (1) contain
security functionality which supports good procedures, (2) process procedures efficiently,
and (3) provide substantive compliance reporting (Vance et al., 2013). In addition,
Galletta and Hufnagel (1992) found that in supporting or working through policies and
procedures, IT applications must do so with formal guidelines and with consistency
across organizational applications.
When employees are using IT applications to complete job assignments and in
doing so are working within policies and procedures, it is reasonable to expect that they
do not want IT applications that are difficult to use and understand. Above all, employees
31
would not want IT applications that will take effort away from completing their job
assignments. It is possible for these desired characteristics of IT applications to impact
employee compliance behavior. Accordingly, CERT (2014) reported that employees are
influenced to work around systems and related policies and procedures when they are
difficult to use and understand. In addition, research demonstrates a strong direct
influence between system quality (including easiness of use) and employee behavior
(Petter & McLean, 2009). Moreover, inability to work around difficult IT also leads to
employee frustration, performance issues, and weakened work group dynamics (Lazar,
2006; Xiaojun Zhang, Venkatesh, & Brown, 2011). In the current study, employee
behavior demonstrates non-malicious IT misuse when working around difficult IT
applications.
Easiness of use encompasses efficient system response and reporting times, menu
flows that are logical, fields that are clearly defined, and processes that can be completed
with proficiency (Petter & McLean, 2009). The current study considers that employees
are expected to meet the performance requirements reflected in the policies and
procedures for using IT applications; system capabilities and easiness to use provide
usability and support employees in this effort. Accordingly, IT applications are
positioned for relevant behavior influence under Bandura's (1971) social learning theory.
Similar to measures of other studies (Moore & Benbasat, 1991; Petter & McLean, 2009;
Wixom & Todd, 2005), IT applications usability will be assessed based on the
consideration respondents assign to the usefulness, easiness of use, and efficiency of the
applications.
32
Thus,
H3: As the usability of IT applications increases, employees decrease non-
malicious IT misuse intention.
Training Awareness
In the present study, training awareness involves two aspects. One purpose
directed to the organization, is training to address the transfer of content to employees to
develop skill and functional ability for using IT properly (Cronan & Douglas, 1990;
Montoya, Massey, & Khatri, 2010; Puhakainen & Siponen, 2010; Stanton, Stam,
Mastrangelo, & Jolton, 2005). Employees who develop IT proficiency will be less
tempted to rely on improper short cuts and processes to complete job responsibilities
when challenged by heavy workloads and time pressures. The other purpose is to instruct
employees about the policies and procedures authorized by management for the proper
use of IT applications (Puhakainen & Siponen, 2010). Specifically, training awareness on
policies and procedures, and IT applications combine to influence the behaviors
employees execute (Bandura, 1977). Examples of actions that reflect the organization’s
commitment to training awareness include general announcements, postings, expressions
of organizational security positions, and statements repeated across management (Knapp,
2005). As a result, having the knowledge of how to best utilize IT applications and what
is allowed according to policies and procedures, influences employees to reduce their
intentions of non-malicious IT misuses (Bandura, 1977).
SolarWinds, an industry leader in providing IT management and security software
to corporations and the federal government, also noted the value of training awareness. In
their 2014 survey of the federal government, respondents saw untrained insiders as a
33
significant threat (SolarWinds, 2014). Moreover, Morris (2011) found limitations in
training, and policies and procedures to be significant factors contributing to internal
control weaknesses. Non-malicious IT misuses would be an element of internal control
weaknesses, subject to the influence of training.
Hu et al. (2012) explained that as employees feel a sense of control from their
ability to easily use acquired skill, and understand policies and procedures, they are more
likely to comply with related compliance guidelines. Hu et al. (2012) went on to express
that effective training is the most significant resource for developing skills and
understanding of policies and procedures. Hence, training awareness is positioned to
influence employee behavior of non-malicious IT misuse intentions under Bandura's
(1971) social learning theory. Training awareness based on earlier studies (Cronan &
Douglas, 1990; Puhakainen & Siponen, 2010), will be measured by the importance
respondents assign to IT training that is available and useful for performing job duties.
Thus,
H4: As training awareness increases, employees decrease non-malicious IT
misuse intention.
Perceived Organizational Job Demand Stress
In light of developing IT, Dull and Tegarden (1999) noted increasing volumes and
complexities of accounting information, and the compounding impact of information
surrounding ERP type applications. This finding describes some drivers of job demand
stress as generated from the organizational level. As previously discussed, organizational
job demand stress can be derived from heavier workloads, information overload, and time
pressures (Ayyagari et al., 2011; D’Arcy et al., 2014; Parasuraman & Alutto, 1981; Ragu-
34
Nathan et al., 2008). Studies still seek to understand effects of organizational job demand
stress in IT environments (Ayyagari et al., 2011; D’Arcy et al., 2014; Liang & Xue, 2009;
Ortiz de Guinea & Webster, 2013). In particular, D’Arcy et al. (2014) evaluated and
supported the influence of stress from complex information security requirements, and
employees coping by intentionally violating security policies. Although their study
utilized coping theory, it was more narrowly defined, centering on emotion-focused
coping techniques and individual level constructs (D’Arcy et al., 2014). Organizational
level constructs as designed in the current research is expected to expand the
understanding of job demand stress.
Most importantly, the manner in which employees cope with organizational job
demand stress can be strongly influenced by their unique situation (Lazarus, 1999). For
the current research, this uniqueness supports the use of “perceived” organizational job
demand stress. When stress is perceived, an employee’s skill, understanding, experience,
and physiological response to the perceived stress can influence whether the employee
relies more on problem-focused or emotion-focused coping strategies (Lazarus &
Folkman, 1984). The current study centers on problem-focused coping processes used by
employees, since problem-focused techniques reflect modifications in behavior and
resulting actions (Lazarus & Folkman, 1984). Employees’ thoughtful evaluation and
interpretation of factors for stress falls in line with cognitive aspects of Bandura’s (1971)
social learning theory. In the present research, perceived organizational job demand stress
is positioned to assess its influence on the employee behavior, non-malicious IT misuse
intention. Drawing from previous research (Ayyagari et al., 2011; D’Arcy et al., 2014),
perceived organizational job demand stress will be measured by how respondents feel
35
employees modify behavior of non-malicious IT misuse intention, in response to job
responsibilities with varying levels of perceived stress. Thus,
H5: As perception of job demand stress decreases, employees decrease non-
malicious IT misuse intention.

36
CHAPTER 3
METHODS
This study used the multivariate technique, conjoint analysis, to collect and
analyze the data (Hair, Black, Babin, & Anderson, 2009). The approach for using
conjoint analysis is similar to the methodology followed by Tiwana and Bush (2007) in
their study of management IT outsourcing decisions. Moreover, IS research finds
conjoint analysis advantageous since it allows experimental manipulation of attributes
through scenarios, while using external surveys to collect the data (Lohrke, olloway, &
oolley, 2010; Tiwana & Bush, 2007). In addition, by using scenarios, conjoint analysis is
very effective for testing sensitive behavior like non-malicious IT misuse intention in the
present study (Hanisch & Rau, 2014).
Another advantage for conjoint analysis is found in the nature of the hypotheses
being tested. In the hypotheses, behavior intention was evaluated based on influences of
certain conditions and factors. To be analyzed, respondents could have been assessed
using their retrospective collection of past actions and behaviors in response to certain
factors. However, in retrospective assessments, respondents might have difficulty
recalling past specifics and their resulting actions (Hanisch & Rau, 2014). Conversely,
conjoint analysis allows respondents to formalize decisions in a present and prospective
tense based on the profiles before them (Hanisch & Rau, 2014). Conjoint analysis would
thus allow theory to be tested at the time respondents are reasoning through attributes and
making decisions (Lohrke et al., 2010). Accordingly, in the present study of behavior

37
intention, conjoint analysis was expected to provide robustness over methods that would
utilize decisions based on post hoc assessment (Hanisch & Rau, 2014).
Analysis of variance (ANOVA) was selected as the primary statistical technique
for evaluating results of the conjoint analysis (Lohrke et al., 2010; Shepherd, 1999;
Zacharakis & Shepherd, 2001) using cluster analysis to group respondents (Green &
Krieger, 1996; Il-Horn Hann, Kai-Lung Hui, Sang-Yong Tom Lee, & Png, 2007; Priem,
1992). Many studies utilize hierarchical linear modeling (HLM) to assess measurements
due principally to their test of multi-level interaction effects of attributes (Choi &
Shepherd, 2005; Hanisch & Rau, 2014; Wood & Williams, 2014). The current study
utilized a main effects model without attribute interactions, which made cluster analysis
and ANOVA more suitable for evaluating the influence of main effects and related
respondent group differences (Green & Krieger, 1996; Il-Horn Hann et al., 2007; Priem,
1992).
Following are discussions on how conjoint analysis was applied and designed to
measure hypothesized influences of the five independent variables (attributes). In
addition, as discussed above, cluster analysis and ANOVA was designed to assess
potential group differences in the conjoint analysis measurements. The particular focus,
although not hypothesized, was potential group differences based on respondents’ act or
rule utilitarian ethical positions.
Application of Conjoint Analysis
Conjoint analysis can be metric or nonmetric based (Priem, 1992). Nonmetric
conjoint analysis uses a ranking of attributes by respondents to measure main effects
only, whereas metric conjoint analysis rates attributes to measure main effects and

38
interactions if necessary (Hanisch & Rau, 2014; Priem, 1992). The current research used
a metric conjoint analysis approach similar to other empirical studies that assessed
decision-making and intentions of individuals (Hanisch & Rau, 2014; Priem, 1992;
Tiwana & Bush, 2007; Wood & Williams, 2014). Most importantly, metric conjoint
analysis can use rating scales like Likert (Hair et al., 2011), to measure respondents as
they evaluate influence of profiles (Hanisch & Rau, 2014).
In metric conjoint analysis, the relationships between the attributes (independent
variables) that respondents evaluate are predefined based on sound theory (Hanisch &
Rau, 2014; Priem, 1992). In the current study, along with theory, the development and
definition of attributes are supported by their use in validated instruments of prior
scholarly research. These studies assessed management behavior (Staples et al., 2006),
policies and procedures (Hu et al., 2012) , IT applications (Osei-Bryson, Dong, &
Ngwenyama, 2008; Vance et al., 2013), organizational job demand stress (Ayyagari et
al., 2011; Ragu-Nathan et al., 2008), and training (Hu et al., 2012; Staples et al., 2006).
The dependent is framed for conjoint analysis methods (Schwarz, Jayatilaka, Hirschheim,
& Goles, 2009; Tiwana & Bush, 2007; Xin (robert) Luo, Warkentin, & Han Li, 2013).
Utilizing metric conjoint analysis methodology, the current research assessed
results across four areas (a) attributes, (b) conjoint profiles (scenarios), (c) part-worth
utility, and (d) overall utility (Tiwana & Bush, 2007; Xin (robert) Luo et al., 2013).
Attributes reflect the independent variables, valued at two levels, high or low (Hair et al.,
2009). Conjoint profiles are grouping of the attributes for evaluation of affects (Hair et
al., 2009). The current study used a full-profile method where all attributes were included
(Hair et al., 2009). Part-worth utility captures the value of the contribution made by each
39
level of the attribute (Hair et al., 2009). Overall utility, from the summated part-worths,
measures the strength of influence, the combination of all attribute levels for a given
profile make on the dependent being evaluated (Hair et al., 2009). Part-worth utilities also
produce the relative percentage importance out of 100% for each attribute (Hair et al.,
2009). In summary, respondents were provided profiles containing high or low values for
each of the independent attributes, and asked to rate the influence value of that
combination of attributes on the dependent.
Following evaluation of the attributes, respondents used a nine-point Likert scale
to measure the impact on the dependent, 1 equal very unlikely, 9 equal very likely (see
Appendix A). In metric conjoint analysis, comparing ratings from other respondents
provides the ability to determine the strength of influence exhibited by the attributes
(Lohrke et al., 2010; Schwarz et al., 2009). The metric conjoint analysis approach in the
current study is referred to as a traditional additive model, where the part-worths are
added to determine the overall influence (Hair et al., 2009).
Metric Conjoint Analysis Design
The methodology and efficiency for measuring metric conjoint analysis results are
based on the number of attributes, number of levels per attribute, and number of
dependent factors (Hanisch & Rau, 2014). The theoretical model in the present study
utilized five attributes, with two levels each. The initial factorial experimental design
produced 32 (25) profiles. However, to create a survey aimed at reducing respondent
fatigue, an orthogonal fractional factorial design was used, that minimized the number of
profiles needed (Hanisch & Rau, 2014; Holland & Shepherd, 2013; Hair et al., 2009).
Using XLSTAT conjoint analysis software (Becker, Rai, Ringle, & Völckner, 2013;
40
Carter, Wright, Thatcher, & Klein, 2014; Ye Chen, Kilgour, & Hipel, 2009; Prat, Comyn-
Wattiau, & Akoka, 2015), an orthogonal fractional factorial design produced a subset of
profiles to estimate main effects (Hair et al., 2009). It is significant that due to the nature
and robustness of metric conjoint analysis, respondents are not required to evaluate all 32
profiles (Hair et al., 2009). However, for statistical productivity and reliability, each
respondent must evaluate a minimum number of profiles (Hair et al., 2009).
For the current research, 16 was set as the minimum for fractional factorial design
(Hanisch & Rau, 2014). Sixteen profiles are normally used for empirical conjoint studies
(Hanisch & Rau, 2014). In addition, for five attributes, 16 profiles allows testing of all
main effects, without main effects being confounded by other interactions (Tobias &
Trutna, 2012). XLSTAT utilizes ordinary least squares to estimate measurement values
of effects. Ordinary least squares, which is also foundational for PLS (partial least
squares), is commonly viewed as being reliable and not too sensitive to sample sizes
(Gefen, Rigdon, & Straub, 2011). Thus, based on the initial factorial calculation of 32,
and the selection to produce a smaller number of 16 design profiles for testing using an
orthogonal fractional factorial method, the theoretical model supported efficient testing
using metric conjoint analysis.
In metric conjoint analysis, validation profiles (sometimes referred to as holdout
profiles) are used to assess the quality and validity of survey responses to the design
profiles in the study (Hair et al., 2009). The validation profiles are included within the
mix of design profiles to be evaluated by respondents at the same time (Hair et al., 2009).
For each respondent, the 16 profiles included in the design are the only profiles used for
determining overall estimates of the high/low part-worths or coefficients for each of the

41
five attributes’ two levels (Hair et al., 2009). The estimates are then applied to the
high/low levels of the attributes in each of the validation profiles, to calculate an
estimated rating for that validation profile (Hair et al., 2009). The calculated estimated
rating is compared to the actual rating assigned by the respondent to assess quality and
validity of the survey responses (Hair et al., 2009).
In the current study and pilot, four validation profiles were included to assess the
reliability of responses to the 16 design profiles (Hair et al., 2009). Based on other
empirical studies, valid surveys are expected to have estimated scores or a hit rate within
at least 70 to 85% of the actual scores recorded by respondents (Mulye, 1998; Schlereth,
Skiera, & Wolk, 2011). In order for profiles to qualify for inclusion in conjoint
calculations, the present study set 80% as the target hit rate (85% for pilot). The target
was calculated based on the mean absolute difference in the actual score percent of the
design profiles and the estimated score percent for the validation profiles, based on the
scale range (see Appendix B).
Control Variables
Control variables were led by two ethical factors which assessed characteristics of
act and rule utilitarianism in respondents (Beauchamp & Bowie, 1997; Shapeero et al.,
2003). Act and rule utilitarian scales were adapted from previously validated instruments
(Casali, 2011; Fan, Ho, & Ng, 2001; Perry & Nixon, 2005) (see Appendix C). Items were
measured on a 7-point Likert scale apart from the conjoint profiles.
Descriptive variables also included: (1) age, (2) sex, (3) education, (4) industry,
(5) company’s number of employees, (6) years with company, (7) department, and (8)
years in current position. In addition, data were obtained for level of IT use on job,
42
management experience, number people managed, and management level (Alder et al.,
2007; Bulgurcu et al., 2010; D’Arcy & Devaraj, 2012). Select control variables were
assessed using Pearson correlation, factor analysis, cluster analysis, and ANOVA (Hair et
al., 2009, 2011).
Survey Development and Testing
Target Population
Survey criteria targeted respondents who use IT in their normal job duties, but
who are not responsible for authorizing or setting IT policy and procedures. In addition,
experienced users were captured. Targeted entities were publicly traded U.S. companies,
regulated by the SEC (Securities and Exchange Commission).
Framing and Pretesting Survey
The initial draft of the profile design for the high/low attributes, the act/rule
utilitarian scale items, and the demographic questions was reviewed with two industry
experts for face validity. The experts agreed with the selected attributes, and also
emphasized the impact of efficient policies/procedures and stress to get work done. From
the initial review, labels/categories were reworded to improve clarity of demographic
questions. In addition, some items were reordered to enhance flow. Wording was also
clarified in the act/rule utilitarian scale items for better adaptation in the current study.
The initial review provided a basis for further development.
Four academic scholars then reviewed the survey for quality, validity, and
theoretical agreement with the research model. As a result, prequalification questions
were modified to screen out respondents responsible for setting or establishing IT policies
and procedures. Demographic questions were further modified or added to expand

43
descriptives around IT experience, management experience, and job level. To improve
alignment with the research model and conjoint analysis design, the high/low attribute
levels were reworded for simplicity and clarity. Following this stage, pretests were
conducted.
Six subjects participated in the pretest. The pretest demonstrated support for the
metric conjoint analysis approach, the survey logic, and completion effort. In addition,
participant comments expressed agreement or understanding for the five attributes
selected for testing. With indicated support from the pretest, the pilot was conducted.
Survey Pilot
Qualtrics LLC administered the survey and supplied 18 respondents for pilot
testing. Instructions in the survey established the setting for evaluating the profiles.
Instructions explained that the employee action being evaluated took place in a publicly
traded U.S. corporation, regulated by the Securities and Exchange Commission (SEC).
The company would also maintain standard Level 2 systematic controls such as adequate
backups, system-mandated change of passwords every 90 days, and formal setup and
tracking of user-names. The profile attributes were to be evaluated against employees
who use IT in their normal job duties. Responses from the 18 pilot surveys were kept
separate and not included with the full study. However, the 18 pilot surveys were subject
to the face validity and validation testing used in the full study. One respondent did not
pass face validity due to straight lining. Five respondents did not pass testing of
validation profiles, for a result of 12 pilot samples. Twelve final pilot samples or 67% is
reasonable based on other conjoint analysis studies where up to 11% of respondents fail

44
face validity checks (Hanisch & Rau, 2014; Tiwana & Bush, 2007) and up to 30% is an
acceptable miss rate for validation profiles (Mulye, 1998; Schlereth et al., 2011).
Although a small pilot sample was used, exploratory factor analysis was
performed on the four act utilitarian and three rule utilitarian control variables to detect,
potentially poor measurements in the full study. Four of seven items loaded cleanly, scale
items 3 and 7 for act utilitarianism and, 4 and 6 for rule utilitarianism (see Appendix C).
However, all seven items were kept and reassessed with the full data. The four items
were over .70, loading strongly on their utilitarian component (Hair et al., 2009). It was
very favorable to have strong loadings since only two items loaded on each component.
However, the use of one and two item scales to assess individual ethics in empirical
studies is established (Casali, 2011; Fan et al., 2001; Kujala, 2001; Perry & Nixon, 2005).
The overall review of factor results indicated a reasonable basis for utilizing the
act and rule utilitarian variables. In the summary measure of intercorrelations, the Kaiser-
Meyer-Olkin (KMO) measure of sampling adequacy (MSA) was below the accepted
guideline of .50 (Hair et al., 2009). The KMO MSA assesses how well variables
intercorrelate and predict each other (Hair et al., 2009). Never the less, as sample size
increases, MSA should improve, thus the full sample was expected to move MSA beyond
the .50 target and produce more meaningful results (Hair et al., 2009). Also, to assess the
overall representation of the derived factors, the percentage of variance criterion was
used. For this research, factors are considered to be satisfactorily developed if they
capture at least 60% of the variance to be explained (Hair et al., 2009). The factor
solution accounted for 82.1% of the variance in this limited sample and is satisfactory.
45
The descriptive statistics of the items in the factor solution indicated their
influence. Act utilitarian items, 3 and 7, had a mean average of 3.500, while rule
utilitarian items, 4 and 6, had a mean average of 5.583. The size of the variability in the
mean averages for the two utilitarian bases indicated the need for reviewing final conjoint
analysis results against these characteristics.
The generated part-worths indicated that the profiles used in the metric conjoint
analysis design were able to capture the effects necessary to perform a full study. Most
importantly, the direction of influence was captured in accordance with the research
model. Stress was positively related to the dependent and showed that low stress,
likewise, produced a -0.342, decrease in the dependent, non-malicious IT misuse
intention. The other four attributes were negatively related to the dependent, and their
high level produced a drop in the dependent. Pilot results supported advancing to the full
study.
To address common method bias (Podsakoff, MacKenzie, & Podsakoff, 2012),
and support validity and reliability, the following techniques were used:
The order of the profiles (scenarios) and attributes varied by survey (Hanisch
& Rau, 2014).
Each survey included a practice profile to evaluate and rate before officially
beginning (Hanisch & Rau, 2014).
Four validation profiles were included in the survey (Hair et al., 2009).
In separate questioning, at two intervals within the evaluation of the 16
profiles, subjects were asked to correctly enter a designated word to continue.
46
The above four procedures to address common method bias positioned the survey to
gather valid and reliable data for metric conjoint analysis. The basis for relying on these
four steps is in part derived from the significant difference in the 9-point experiment type
responses required for the conjoint analysis profiles, and the more traditional 7-point
Likert scale responses to the act and rule utilitarian survey items (Podsakoff et al., 2012).
Most scholars hold that method biases can be reduced when data collection uses wording,
item structure, and measures that vary and limit development of tendencies by
respondents (Podsakoff et al., 2012). Thus, the mix of conjoint analysis profiles and
traditional scale items reduce the opportunity for the development of response tendencies
along with the four procedural steps.
Following the above procedural efforts to control common method bias, the
statistical Harman one-factor test was performed on survey results to assess the presence
of problematic levels of common method bias (Babin, Griffin, & Hair Jr., 2016; Lanivich,
2015; Steinbart, Raschke, Gal, & Dilla, 2013). The test calculates one factor from all the
variables in the measurement model to determine if the one factor captures and explains
more than 50% of the variance for all the variables; the criteria is more than 50%
indicates the existence of problematic common method bias (Lanivich, 2015; Steinbart et
al., 2013). The items in the current research extracted a Harman one-factor variance
percentage of 19.430. The single factor explained a variance amount significantly below
the 50% threshold and thus does not indicate the presence of problematic common
method bias.
Moreover, processes to advance the methodology established a sound basis for the
full study. This included the selection of a well-matched multivariate technique, metric

47
conjoint analysis, with the research subject, non-malicious IT misuse intention (Hanisch
& Rau, 2014). In addition, cluster analysis and ANOVA are very suitable statistical
techniques for measuring effects in the measure model (Lohrke et al., 2010; Shepherd,
1999; Zacharakis & Shepherd, 2001). It was noted that full-profile presentations, as used
in the present study, require sufficiently engaged participants (Hair et al., 2009). Hence,
significant effort was made to check validity and reliability of respondents. The pilot
confirmed the methodology and review of respondent quality in support of the full study.
Full Study Data
Qualtrics LLC was used to administer the survey to their panel of participants
controlled by this study’s selection criteria for respondents. Qualtrics was selected based
on their recognition for representative panels and strong functionality for user design,
monitoring, and control of survey quality (Brandon, Long, Loraas, Mueller-Phillips, &
Vansant, 2014; Smith, Roster, Golden, & Albaum, 2015). Likewise, multiple studies
reported success using Qualtrics’ functionality to control for quality of surveys from
panel participants (Carneiro & Faria, n.d.; Jiménez & Mendoza, 2013; Leonhardt, Catlin,
& Pirouz, 2015).
Initially, Qualtrics provided 150 respondents. Data were reviewed for quality and
validity. The review identified outliers in three groups. Six surveys were straight-lined;
eight surveys were completed using repeating response patterns; and nine respondents
were identified as speeders, compared to the survey’s design, pretests, and pilot (Smith et
al., 2015). These responses were removed to result in 127 surveys to be evaluated based
on their validation profiles.
48
A net of 97 respondents met the 80% target hit rate and passed validation
screening. A sample size of 97 is considered strong for metric conjoint analysis where
many empirical studies use 50 - 75 respondents (Hanisch & Rau, 2014; Wood &
Williams, 2014). Robustness is generated with conjoint analysis since respondents
provide multiple data points to generate reliability for assessing influence of
attributes/variables (Hanisch & Rau, 2014; Wood & Williams, 2014). The 97 respondents
for this study provided 1,552 (97 x 16) data points to support analysis.
49
CHAPTER 4
ANALYSIS AND FINDINGS
The path for analyzing results included a rigorous review of data validity and
reliability, confirmatory factor analysis (CFA), cluster object identification, cluster
analysis, and ANOVA metrics. Multiple steps were necessary due to the nature of the
effects between the independent variables (attributes) and the dependent variable. The
hypotheses required respondents to evaluate high/low qualities of the attributes contained
within profile sets. Afterwards, respondents evaluated the collective impact of the
attributes on a corporate employee’s intention to non-maliciously, misuse IT applications
while performing job duties. These activities required meaningful evaluation of profiles
by engaged respondents. Steps were taken to clean the data of outliers and test validation
profiles which promoted the inclusion of engaged participants (Hair et al., 2009). In
addition, survey results needed a valid and reliable basis for grouping participants to
assess mean differences in profile responses and control variables (Hair et al., 2009).
Act/rule utilitarian ethical views made a primary contribution to the basis for grouping
respondents (Beauchamp & Bowie, 1997). Due to the need for engaged participants and
properly grouped respondents, considerable steps were taken to establish validity and
reliability of the responses.
In the previous section, the full study data were rigorously reviewed for outliers
and validity. In the following analyses, confirmatory factor analysis (CFA) is applied to
properly confirm act/rule utilitarian variables to support valid grouping of respondents.
50
With sound bases for identifying groups, the application of cluster analysis is then
presented. The above phases provided the foundation for subsequent discussions of the
primary analysis using ANOVA techniques.
Descriptive Statistics
Demographics of respondents indicated that a representative sample of 97 was
captured. Respondents consisted of 53% females and 47% males. Based on participants’
ages and years working, experienced employees were reflected in the sample, as designed
in the survey (see Appendix D). In addition, more than 90% of respondents indicated that
at least half of their workday involved IT use (Appendix D). The sample reflected the
desired profile of individuals experienced with IT.
A review of management/non-management demographics provided good insight
given the nature of this research and the focus on employee influences at the staff level
through middle management. One subject did not respond. In remaining respondents,
77% indicated management experience and 22% had not managed people (Appendix D).
The majority of management experience was acquired at department or unit levels, where
66% of respondents had managed 30 or fewer employees (Appendix D). No participants
indicated executive level management. This is the profile desired for this study because,
as discussed previously, first line supervisors and middle managers are very relevant
since they conduct and manage transactional IT level activities (Zaccaro & Klimoski,
2001). Thus, management/non-management descriptives aligned with the purpose of the
current study. Other educational, industry, departmental, and company size demographics
likewise reflected a representative sample as provided in Appendix D.

51
Confirmatory Factor Analysis
Using SPSS AMOS, confirmatory factor analysis was performed on the four act
utilitarian scale items, and three rule utilitarian items. The purpose was to test and
confirm the theoretical defined grouping of scale items based on results from the actual
survey data (Hair et al., 2009). By maintaining their relationships, the scale items would
properly measure and assess act and rule variable influence to confirm the theory. The
resulting act and rule utilitarian factors were then used in the cluster analysis and
evaluation of conjoint analysis results.
First, the seven scale items were reviewed for their overall CFA model fit. The
size of indicator loadings were reviewed based on a criteria of .707; qualitative criteria
was also considered to maintain a representative number of indicators (Hair et al., 2009).
In the initial Table 5, items 1, 2, and 5 were removed due to their low loading and to
improve model fit. The CFA was recalculated and the resulting regression weights
supported the CFA model (Figure 2) which consisted of items 3, 4, 6, and 7 (see Table 6).
However, item 6 was below the .707 criteria but was maintained due to the qualitative
criteria to keep at least two items. Both variables were significant in their formation (see
Table 7).
Table 5
Initial Standardized Regression Weights (N = 97)
Item Unobserved variable Estimate
Q7_7 Act_Utilitarianism 2.427
Q7_5 Act_Utilitarianism .063
Q7_3 Act_Utilitarianism .282
Q7_1 Act_Utilitarianism .070
Q7_6 Rule_Utilitarianism .623
Q7_4 Rule_Utilitarianism .612
Q7_2 Rule_Utilitarianism .177

52
Table 6 Table 7
Final Standardized Regression Final Regression Weights with Significance
Weights
Figure 2. Confirmatory Factor Analysis Model
Assessment of Model Fit and Validity
Next, several indices and scores were assessed to confirm the model for fit,
reliability, and significance (see Table 8). The evaluation of CFA utilizes a composite of
measurement criteria to confirm its theoretical foundation (Hair et al., 2009). For
example, fit is evaluated across three measures – absolute, incremental, and parsimony fit
measures (Hair et al., 2009). As discussed previously, qualitative elements were also
considered in the assessment of the CFA. Parsimony fit indices, adjusted goodness-of-fit
and parsimony normed fit, had low values for the two variables modeled in the CFA. The
unacceptable levels were most likely due to modeled items that were already in a simple
design without complexity (Hair et al., 2009).
Item Unobserved variable Estimate Item Unobserved variable Estimate S.E. C.R. P
Q7_7 Act_Utilitarianism 0.899 Q7_7 Act_Utilitarianism 1
Q7_3 Act_Utilitarianism 0.796 Q7_3 Act_Utilitarianism 0.898 0.214 4.193 ***
Q7_6 Rule_Utilitarianism 0.500 Q7_6 Rule_Utilitarianism 1
Q7_4 Rule_Utilitarianism 0.734 Q7_4 Rule_Utilitarianism 1.434 0.623 2.301 0.021

53
Table 8
CFA Evaluation Criteria Summary
Statistics Element Criteria
Chi-square Expect > .05 based on observed and estimated covariances, but produced
.043, did not indicate best model fit. (However, see standardized residual
covariances.) (Hair et al., 2009).
Standardized
residual covariances
Standardized residual covariances did not reflect any large residuals >=
4.0, which indicated some degree of fit (Table E1) (Hair et al., 2009).
CMIN Chi-square difference between the covariances, the minimum
discrepancy of the values (CMIN/DF), was 4.112, within acceptable
range between 2 and 5. (Table E2) (Hair et al., 2009).
GFI
Absolute fit measure in the goodness-of-fit index (GFI) was at .979, a
sizable value above the .90 recommended minimum, indicated the
variables’ ability to explain the covariances. (Table E3) (Hair et al.,
2009).
CFI Incremental fit measure comparative fit index had a strong value of .967,
significantly above the .90 minimum criteria.(Table E4) (Hair et al.,
2009).
Construct convergent and discriminant validity were then assessed to determine
how well the scale items represented the theorized act and rule utilitarian variables.
Average variance extracted (AVE) of .7209 (see Table E5) for act utilitarianism was well
above the .50 acceptable criteria, to indicate adequate convergent validity (Hair et al.,
2009). Likewise, the construct reliability for act utilitarianism had an acceptable value of
.837, above the .70 minimum criteria (Hair et al., 2009). However, rule utilitarianism had
an unacceptable AVE of .3944 (see Table E6) and a lower construct reliability of .557
(Hair et al., 2009). A strong significance score for rule utilitarianism (see Table 7)
mitigated these weaker values. In addition, favorable covariances, CMIN/DF, GFI, and
CFI fit indices for the overall model, and a sufficient discriminant validity assessment for
rule utilitarianism (see Table E6) also offset the weak convergent validity values for rule
utilitarianism. Discriminant validity had items that were more aligned with the act and

54
rule utilitarian variables they were measuring since the AVE was greater than the squared
interconstruct correlation (SIC) (Hair et al., 2009).
Lastly, the act and rule interconstruct correlation was -.50 at a .029 significance
level. Overall, the -.50 correlation is in line with the previously tested EFA during the
pilot, and the theory based different focus of act utilitarians compared to rule utilitarians
(Beauchamp & Bowie, 1997). Assessments consistently supported the theory based CFA
model and identified act/rule utilitarian items for use in subsequent cluster analysis.
Cluster Analysis
As previously discussed, ANOVA was selected as the principle statistical
technique for evaluating the conjoint analysis results (Lohrke et al., 2010; Shepherd,
1999; Zacharakis & Shepherd, 2001). Moreover, ANOVA is very useful for measuring
group means of main effects as designed in the model of this current study (Green &
Krieger, 1996; Il-Horn Hann et al., 2007; Priem, 1992). Hence, a primary goal of the
present research was to assess group mean differences for influences of the five
hypothesized relationships. To provide better explanatory power of the influences,
act/rule utilitarian theory was also applied to the groups (Beauchamp & Bowie, 1997).
Cluster analysis is established as a suitable basis for identifying and forming the groups
for ANOVA techniques (Green & Krieger, 1996; Il-Horn Hann et al., 2007; Priem,
1992). In conjunction, the CFA components formed in the previous discussions of this
current study provided a premium basis for the objects necessary, and to be used in
cluster analysis.

55
Basis in Summary Conjoint Analysis Results
The overall results of the metric conjoint analysis produced utilities that aligned
with the new theoretical framework of this study and hypothesized relationships (see
Table 9). The impact on the dependent---non-malicious IT misuse intention---is reflected
in the mean scores. A negative mean indicates a reduction in the dependent; a positive
mean denotes and increase in the dependent. In summary, Table 9 conjoint analysis
results support the hypothesized effects and the following attributes and levels were
predicted to reduce non-malicious IT misuse intention:
1. Management compliance modeling – High, generated a -0.589 effect.
2. Policies and procedures effectiveness – High, had a -0.479 influence.
3. IT applications effectiveness – High, produced a -0.327 effect.
4. Training awareness – High, had a -0.384 influence.
5. Perceived organizational job demand stress – Low, generated a -0.258 effect.
In addition, Table 10 depicts the overall mean percentage value of the calculated
importances of the attributes/independent variables. For each respondent, conjoint
analysis uses the participant’s evaluation of profiles to calculate the percentage of
importance for each attribute, based on its weighted importance out of 100%. All the
weights were sizeable, ranging from 17.0 to 23.9%, and thus, supported the basis for
testing their influence and including them in the new theoretical framework of the current
study. Moreover, in the context of the current research focus on management and
organizational influences, the strongest weighted attribute is management compliance
modeling. It is followed by policies and procedures which represent the directives and
intent of management.
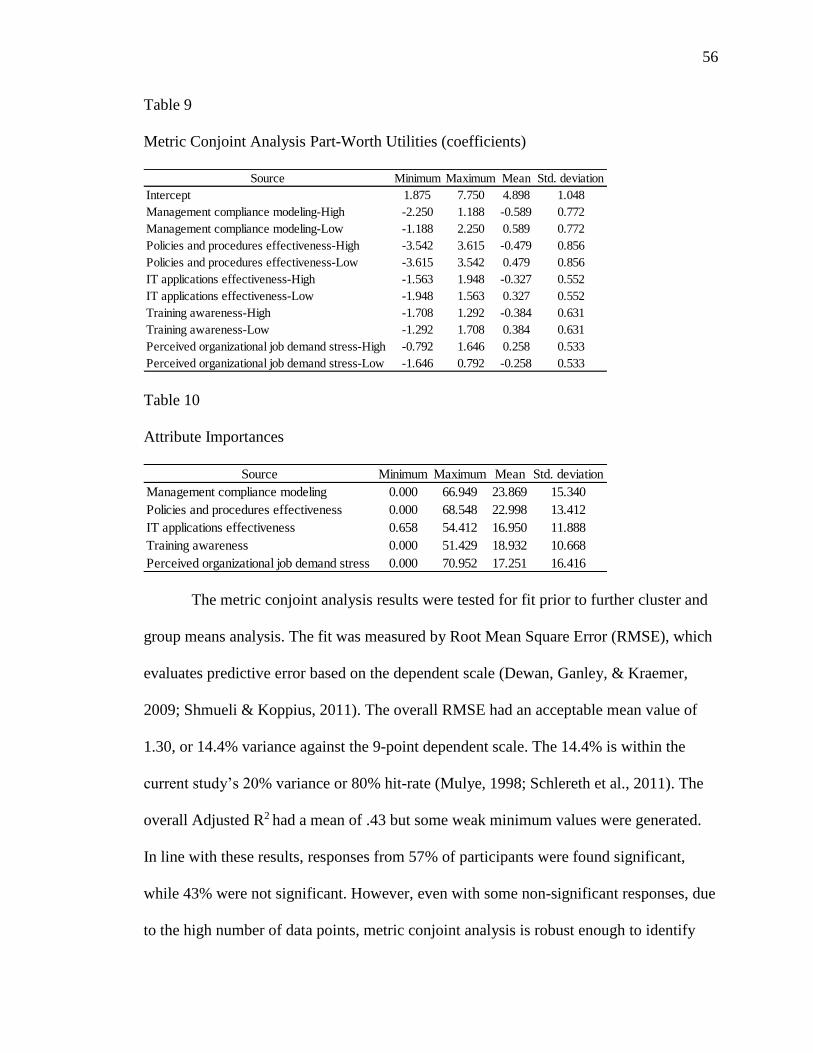
56
Table 9
Metric Conjoint Analysis Part-Worth Utilities (coefficients)
Table 10
Attribute Importances
The metric conjoint analysis results were tested for fit prior to further cluster and
group means analysis. The fit was measured by Root Mean Square Error (RMSE), which
evaluates predictive error based on the dependent scale (Dewan, Ganley, & Kraemer,
2009; Shmueli & Koppius, 2011). The overall RMSE had an acceptable mean value of
1.30, or 14.4% variance against the 9-point dependent scale. The 14.4% is within the
current study’s 20% variance or 80% hit-rate (Mulye, 1998; Schlereth et al., 2011). The
overall Adjusted R2 had a mean of .43 but some weak minimum values were generated.
In line with these results, responses from 57% of participants were found significant,
while 43% were not significant. However, even with some non-significant responses, due
to the high number of data points, metric conjoint analysis is robust enough to identify
Source Minimum Maximum Mean Std. deviation
Intercept 1.875 7.750 4.898 1.048
Management compliance modeling-High -2.250 1.188 -0.589 0.772
Management compliance modeling-Low -1.188 2.250 0.589 0.772
Policies and procedures effectiveness-High -3.542 3.615 -0.479 0.856
Policies and procedures effectiveness-Low -3.615 3.542 0.479 0.856
IT applications effectiveness-High -1.563 1.948 -0.327 0.552
IT applications effectiveness-Low -1.948 1.563 0.327 0.552
Training awareness-High -1.708 1.292 -0.384 0.631
Training awareness-Low -1.292 1.708 0.384 0.631
Perceived organizational job demand stress-High -0.792 1.646 0.258 0.533
Perceived organizational job demand stress-Low -1.646 0.792 -0.258 0.533
Source Minimum Maximum Mean Std. deviation
Management compliance modeling 0.000 66.949 23.869 15.340
Policies and procedures effectiveness 0.000 68.548 22.998 13.412
IT applications effectiveness 0.658 54.412 16.950 11.888
Training awareness 0.000 51.429 18.932 10.668
Perceived organizational job demand stress 0.000 70.952 17.251 16.416
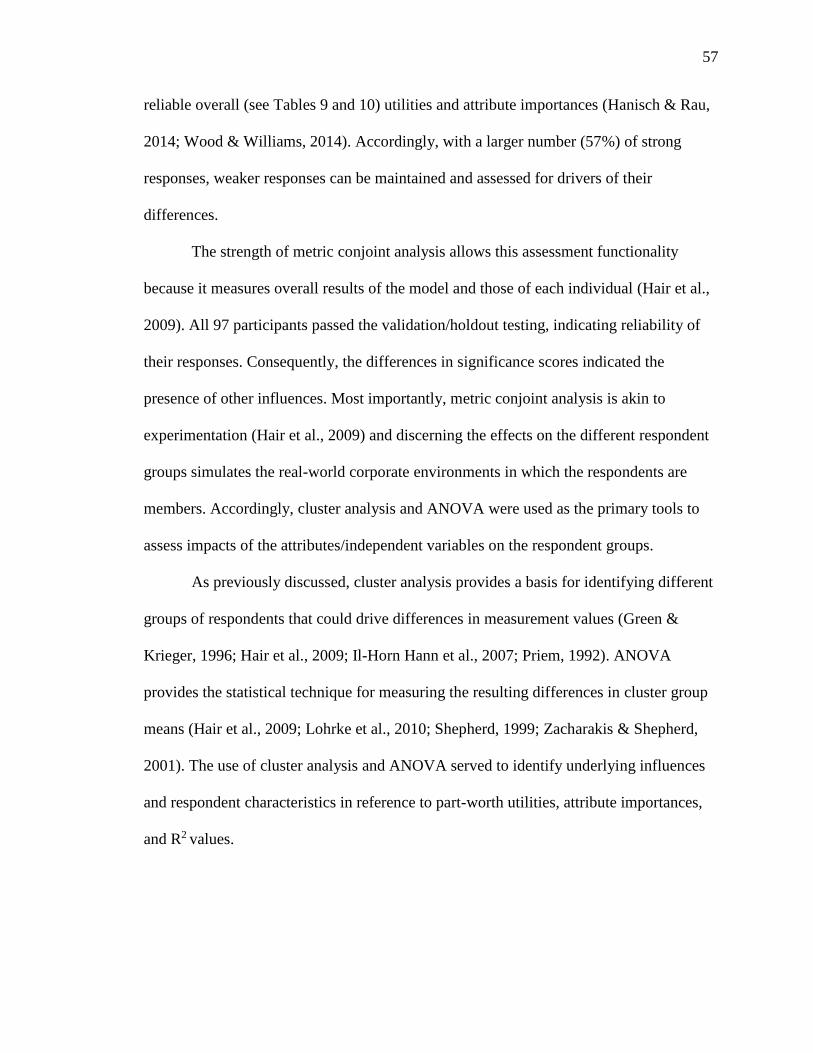
57
reliable overall (see Tables 9 and 10) utilities and attribute importances (Hanisch & Rau,
2014; Wood & Williams, 2014). Accordingly, with a larger number (57%) of strong
responses, weaker responses can be maintained and assessed for drivers of their
differences.
The strength of metric conjoint analysis allows this assessment functionality
because it measures overall results of the model and those of each individual (Hair et al.,
2009). All 97 participants passed the validation/holdout testing, indicating reliability of
their responses. Consequently, the differences in significance scores indicated the
presence of other influences. Most importantly, metric conjoint analysis is akin to
experimentation (Hair et al., 2009) and discerning the effects on the different respondent
groups simulates the real-world corporate environments in which the respondents are
members. Accordingly, cluster analysis and ANOVA were used as the primary tools to
assess impacts of the attributes/independent variables on the respondent groups.
As previously discussed, cluster analysis provides a basis for identifying different
groups of respondents that could drive differences in measurement values (Green &
Krieger, 1996; Hair et al., 2009; Il-Horn Hann et al., 2007; Priem, 1992). ANOVA
provides the statistical technique for measuring the resulting differences in cluster group
means (Hair et al., 2009; Lohrke et al., 2010; Shepherd, 1999; Zacharakis & Shepherd,
2001). The use of cluster analysis and ANOVA served to identify underlying influences
and respondent characteristics in reference to part-worth utilities, attribute importances,
and R2 values.
58
Cluster Objects
In developing cluster objects, the analysis utilized the act and rule utilitarian
components created from the final CFA solution (see Table 6), and which were converted
to summated scales. In addition to act and rule utilitarian components, the R2 and
significance measurements (p-values) of the individual respondents were reviewed to
develop the clusters. The evaluation of these four objects for cluster formation was
significant since R2 and p-value provide a direct connection for assessing characteristics
of model influence and performance.
Correlations were accordingly evaluated for relationships across all four items
(see Table 11). Rule utilitarianism and p-value were the only items with significant
correlations between each of the other items. In addition, three important pattern types
were noted from the review of the correlations and they remained key aspects throughout
cluster and ANOVA analysis.
First, rule utilitarianism was negatively and significantly correlated with act
utilitarianism. This relationship provides meaningful insight for understanding act/rule
utilitarianism theory, where act utilitarianism focuses on the task or act to be completed,
over the directives of abiding by rules (Beauchamp & Bowie, 1997). On the other hand,
rule utilitarianism strives to complete initiatives, but only if they can be performed in
accordance with rules/policies (Beauchamp & Bowie, 1997). This relationship provided a
basis for evaluating the influence of the management and organizational attributes in the
current research and act/rule utilitarianism based respondent group compliance behavior
intention.
59
Next, rule utilitarianism and R2 had a positive and significant correlation. This
relationship indicated that respondents who reflected more rule utilitarian traits found the
attributes in the present study to be more relevant to the desired compliance behavior.
Conversely, act utilitarianism and R2 were negative correlated at the .085 level of
significance. Overall, participants that indicated more act utilitarian based characteristics
had a weaker relationship with the intended influence of the attributes in the present
study. Rule utilitarianism again depicted differences in respondent groups.
Finally, participants who demonstrated more rule utilitarian characteristics
produced a significant and negative correlation with p-value, to thereby, drive the
influence of the research model toward significance for influencing non-malicious IT
misuse intention. However, respondents who expressed more act utilitarian traits
produced a significant and positive correlation with p-value to drive influence of the
research model toward being insignificant. These relationships between act/rule
utilitarianism and p-value provide instrumental insight for understanding respondent
groups and results of the research model. This understanding is most important since a
research goal of the current study is to understanding how to strengthen employees as key
members of Level-1 controls in the protection against cyber-attacks. Based on the
consistent correlation results of rule utilitarianism and p-value across the other items, rule
utilitarianism and p-value were selected as cluster objects.
Identification of Clusters
Hierarchical cluster analysis with the Ward’s method was used because it tends to
produce same sized homogeneous clusters (Hair et al., 2009). In addition, hierarchical
cluster analysis using Ward’s method is efficient and clear in presenting solutions for
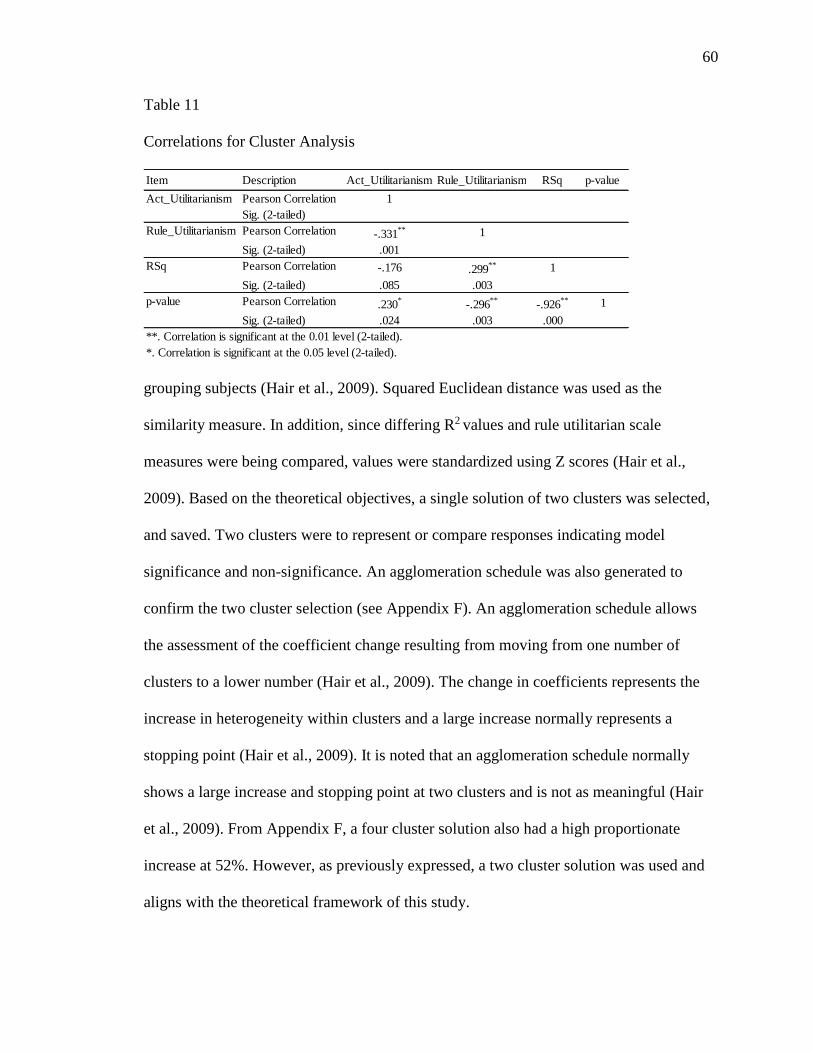
60
Table 11
Correlations for Cluster Analysis
grouping subjects (Hair et al., 2009). Squared Euclidean distance was used as the
similarity measure. In addition, since differing R2 values and rule utilitarian scale
measures were being compared, values were standardized using Z scores (Hair et al.,
2009). Based on the theoretical objectives, a single solution of two clusters was selected,
and saved. Two clusters were to represent or compare responses indicating model
significance and non-significance. An agglomeration schedule was also generated to
confirm the two cluster selection (see Appendix F). An agglomeration schedule allows
the assessment of the coefficient change resulting from moving from one number of
clusters to a lower number (Hair et al., 2009). The change in coefficients represents the
increase in heterogeneity within clusters and a large increase normally represents a
stopping point (Hair et al., 2009). It is noted that an agglomeration schedule normally
shows a large increase and stopping point at two clusters and is not as meaningful (Hair
et al., 2009). From Appendix F, a four cluster solution also had a high proportionate
increase at 52%. However, as previously expressed, a two cluster solution was used and
aligns with the theoretical framework of this study.
Item Description Act_Utilitarianism Rule_Utilitarianism RSq p-value
Act_Utilitarianism Pearson Correlation 1
Sig. (2-tailed)
Rule_Utilitarianism Pearson Correlation -.331** 1
Sig. (2-tailed) .001
RSq Pearson Correlation -.176 .299** 1
Sig. (2-tailed) .085 .003
p-value Pearson Correlation .230*
-.296**
-.926** 1
Sig. (2-tailed) .024 .003 .000
**. Correlation is significant at the 0.01 level (2-tailed).
*. Correlation is significant at the 0.05 level (2-tailed).
61
Cluster Profiles
The two clusters were evaluated to identify distinguishing characteristics and
confirm their grouping using ANOVA (Hair et al., 2009). The cluster ID for the two
cluster solution was used as the independent factor, and rule utilitarianism and p-value
were assigned as dependent items. From the descriptives, rule utilitarianism and p-value
had distinct differences in mean values for the two clusters (see Table 12). For rule
utilitarianism, Cluster-2 had a mean value 24% higher than Cluster-1; for p-value, the
mean value was much lower and significant for Cluster-2 at .027. In addition, the
variances between the two cluster groups were statistical different and supported the basis
in rule utilitarian and p-value as cluster objects (see Table 13).
Cluster Based Analysis of Conjoint Analysis Results
The clusters were also used to assess characteristics of act utilitarianism, RMSE,
and R2 results (see Table 12). In the assessment, clusters retained significant statistical
differences across all elements (see Table 13). Most notably, Cluster-2 revealed
exceedingly strong support for all five hypothesized relationships, and identified a key
relationship between rule and act utilitarianism. In Cluster-2, the rule utilitarianism mean
was 96% above the lower act utilitarianism mean; in Cluster-1, the rule utilitarianism
mean was only 28% stronger than its act utilitarianism mean, which value was larger than
in Cluster-2. This connection aligned with the negative correlation of rule utilitarianism
and act utilitarianism found in Table 11. In terms of evaluating the hypotheses, this
relationship indicates that outside of the five attributes/independent variables, the act/rule
utilitarian ethical position of the employee also plays a role in their non-malicious IT

62
misuse intention. The selected clusters were very successful identifying key mean
differences and characteristics of respondent groups.
Most importantly, with the lower measure for act utilitarianism, Cluster-2
produced a much higher 64% R2 mean, versus the low 15% R2 mean for Cluster-1. In
addition, Cluster-2 represented a better fit with a 1.182 RMSE mean. The 1.182 RMSE
Table 12
Descriptives of Key Cluster Measures
generated a 13% variance based on the current study’s 9-point dependent variable scale.
The 13% is a strong percent for conjoint study fit and estimates (Mulye, 1998; Schlereth
et al., 2011). However, the RMSE for Cluster-1 also calculated a reasonable fit at 16%.
The RMSE fit for both Cluster-1 and Cluster-2 indicates that the model adequately
captures the weaker effect for Cluster-1respondents and strong influence for Cluster-2
respondents. As a consequence, (a) with a model fit for Cluster-1 and Cluster -2, all
hypotheses were supported under the full set of 97 respondents and, (b) the presence of
stronger rule utilitarian characteristics contributed to Cluster-2’s better, more significant
influence over the dependent.
Item Cluster
Lower
Bound
Upper
Bound
1 42 4.048 1.545 0.238 3.566 4.529 1.000 6.500
2 55 3.282 1.747 0.236 2.809 3.754 1.000 7.000
Total 97 3.613 1.698 0.172 3.271 3.956 1.000 7.000
1 42 5.190 0.987 0.152 4.883 5.498 2.500 7.000
2 55 6.427 0.504 0.068 6.291 6.563 5.500 7.000
Total 97 5.892 0.969 0.098 5.696 6.087 2.500 7.000
1 42 0.148 0.322 0.050 0.048 0.248 -0.395 0.755
2 55 0.641 0.187 0.025 0.591 0.692 0.175 0.938
Total 97 0.428 0.352 0.036 0.357 0.499 -0.395 0.938
1 42 0.369 0.298 0.046 0.276 0.462 0.001 0.975
2 55 0.027 0.054 0.007 0.012 0.041 0.000 0.237
Total 97 0.175 0.262 0.027 0.122 0.227 0.000 0.975
1 42 1.442 0.550 0.085 1.271 1.614 0.465 2.918
2 55 1.182 0.429 0.058 1.066 1.298 0.465 2.230
Total 97 1.295 0.500 0.051 1.194 1.396 0.465 2.918
N Mean
Std.
Deviation Std. Error
95% Confidence
Minimum Maximum
Act_Utilitarianism
Rule_Utilitarianism
RSq
p-value
RMSE
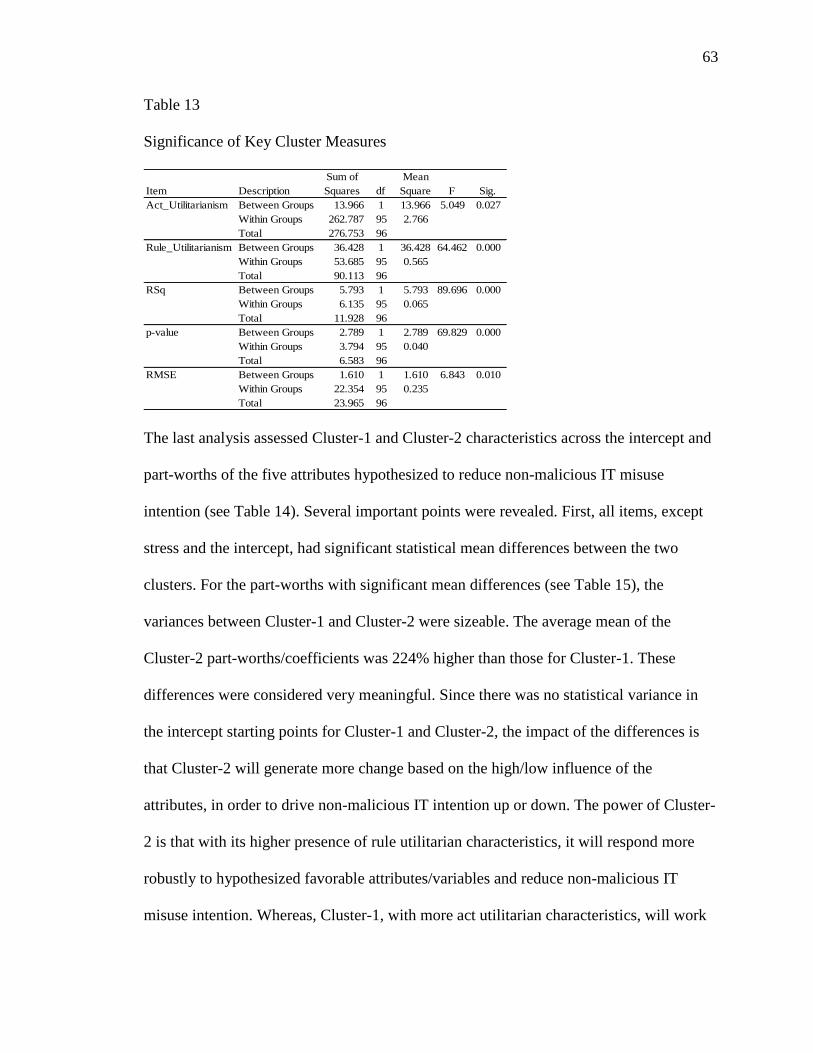
63
Table 13
Significance of Key Cluster Measures
The last analysis assessed Cluster-1 and Cluster-2 characteristics across the intercept and
part-worths of the five attributes hypothesized to reduce non-malicious IT misuse
intention (see Table 14). Several important points were revealed. First, all items, except
stress and the intercept, had significant statistical mean differences between the two
clusters. For the part-worths with significant mean differences (see Table 15), the
variances between Cluster-1 and Cluster-2 were sizeable. The average mean of the
Cluster-2 part-worths/coefficients was 224% higher than those for Cluster-1. These
differences were considered very meaningful. Since there was no statistical variance in
the intercept starting points for Cluster-1 and Cluster-2, the impact of the differences is
that Cluster-2 will generate more change based on the high/low influence of the
attributes, in order to drive non-malicious IT intention up or down. The power of Cluster-
2 is that with its higher presence of rule utilitarian characteristics, it will respond more
robustly to hypothesized favorable attributes/variables and reduce non-malicious IT
misuse intention. Whereas, Cluster-1, with more act utilitarian characteristics, will work
Item Description
Sum of
Squares df
Mean
Square F Sig.
Between Groups 13.966 1 13.966 5.049 0.027
Within Groups 262.787 95 2.766
Total 276.753 96
Between Groups 36.428 1 36.428 64.462 0.000
Within Groups 53.685 95 0.565
Total 90.113 96
Between Groups 5.793 1 5.793 89.696 0.000
Within Groups 6.135 95 0.065
Total 11.928 96
Between Groups 2.789 1 2.789 69.829 0.000
Within Groups 3.794 95 0.040
Total 6.583 96
Between Groups 1.610 1 1.610 6.843 0.010
Within Groups 22.354 95 0.235
Total 23.965 96
Act_Utilitarianism
Rule_Utilitarianism
RSq
p-value
RMSE

64
Table 14
Descriptives of Cluster-1 and Cluster-2 Part-worths
Table 15
Significance of Cluster-1 and Cluster-2 Part-worths
Item Cluster
Lower
Bound
Upper
Bound
1 42 4.770 1.277 0.197 4.372 5.168 1.875 7.750
2 55 4.997 0.830 0.112 4.772 5.221 2.188 7.438
Total 97 4.899 1.047 0.106 4.687 5.110 1.875 7.750
1 42 -0.281 0.618 0.095 -0.473 -0.088 -2.031 1.042
2 55 -0.825 0.799 0.108 -1.041 -0.609 -2.250 1.188
Total 97 -0.589 0.772 0.078 -0.745 -0.434 -2.250 1.188
1 42 -0.215 0.564 0.087 -0.391 -0.039 -1.552 1.073
2 55 -0.680 0.982 0.132 -0.946 -0.414 -3.542 3.615
Total 97 -0.479 0.856 0.087 -0.651 -0.306 -3.542 3.615
1 42 -0.147 0.559 0.086 -0.321 0.028 -1.563 1.948
2 55 -0.464 0.510 0.069 -0.602 -0.326 -1.521 0.740
Total 97 -0.327 0.552 0.056 -0.438 -0.215 -1.563 1.948
1 42 -0.245 0.407 0.063 -0.372 -0.118 -1.250 0.583
2 55 -0.269 0.616 0.083 -0.435 -0.102 -1.646 0.792
Total 97 -0.258 0.533 0.054 -0.366 -0.151 -1.646 0.792
1 42 -0.152 0.502 0.078 -0.308 0.005 -1.125 0.917
2 55 -0.561 0.665 0.090 -0.740 -0.381 -1.708 1.292
Total 97 -0.384 0.631 0.064 -0.511 -0.256 -1.708 1.292
Stress_Low
Training_High
Intercept
Management_High
Policies_High
IT_High
N Mean
Std.
Deviation
Std.
Error
95% Confidence
Minimum Maximum
Item Description
Sum of
Squares df
Mean
Square F Sig.
Between Groups 1.229 1 1.229 1.122 0.292
Within Groups 104.106 95 1.096
Total 105.335 96
Between Groups 7.070 1 7.070 13.404 0.000
Within Groups 50.111 95 0.527
Total 57.181 96
Between Groups 5.147 1 5.147 7.502 0.007
Within Groups 65.171 95 0.686
Total 70.317 96
Between Groups 2.399 1 2.399 8.495 0.004
Within Groups 26.835 95 0.282
Total 29.234 96
Between Groups 0.013 1 0.013 0.047 0.829
Within Groups 27.257 95 0.287
Total 27.271 96
Between Groups 3.981 1 3.981 11.058 0.001
Within Groups 34.196 95 0.360
Total 38.176 96
IT_High
Stress_Low
Training_High
Intercept
Management_High
Policies_High

65
to mitigate the influence of the hypothesized attributes/ variables in order to complete
targeted tasks/acts even with the intention of committing more non-malicious IT misuse
to do so.
Next, as previously noted, the influence of stress was statistically the same for
Cluster-1 and Cluster-2. There was non-significance in the differences measured at .829
(see Table 15). Moreover, a visual inspection of Table 14 clearly displayed similarity in
the stress part-worth coefficients. In metric conjoint analysis, this indicated that as
subjects evaluated profiles, the levels for organizational stress were statistical provided
the same power of influence by Cluster-1 and Cluster-2 respondents. In a like manner,
stress negatively affects Cluster-1 respondents when they are set on accomplishing
tasks/acts, and negatively affects Cluster-2 subjects when they are committed to
completing work tasks in accordance with policies and procedures.
Finally, from Table 16 there was no statistical difference in the importances
assigned to attributes by Cluster-1 and Cluster-2 respondents. This indicated that overall
attribute importances from Table10 can be applied to both cluster groups. Most
importantly, it explains that Cluster-1 does recognize the importance of the attributes, but
still works to reduce the impact or effectiveness of the attributes, based on its low part-
worth coefficients The two most important attributes influencing employee non-
malicious IT misuse intention were management compliance modeling at 23.9%,
followed by policies and procedures effectiveness at 23.0%. These two top ranked
attributes align with the focus of the new theoretical framework in the current research,
which is based on management and organizational driven factors. Out of the five tested
attributes, IT applications effectiveness had the lowest importance, even though it was

66
Table 16
Significance of Cluster-1 and Cluster-2 Attribute Importances
still sizable at 17.0%. This lower ranking could indicate that respondents view IT
applications more as a given in a technologically changing environment. For example,
management or the organization could be considered as having less control over industry
developed IT applications/ functionality.
Cluster and ANOVA analysis were effective in identifying characteristics to
better examine and interpret the metric conjoint analysis results in this study. A basis was
established to place reliance on the differences in the part-worth utilities, attribute
importances, R2 results, and significance results. The metric conjoint analysis results
demonstrated robustness for utilizing overall scores to assess the research model.
Therefore, results from Table 9 were relied upon for summarizing the hypothesized
results in Table 17 below.
Item Description
Sum of
Squares df
Mean
Square F Sig.
Between Groups 574.710 1 574.710 2.480 0.119
Within Groups 22016.310 95 231.751
Total 22591.020 96
Between Groups 80.325 1 80.325 0.444 0.507
Within Groups 17188.126 95 180.928
Total 17268.451 96
Between Groups 346.363 1 346.363 2.489 0.118
Within Groups 13220.539 95 139.164
Total 13566.903 96
Between Groups 154.514 1 154.514 0.571 0.452
Within Groups 25716.952 95 270.705
Total 25871.466 96
Between Groups 3.590 1 3.590 0.031 0.860
Within Groups 10922.474 95 114.973
Total 10926.064 96
Stress_Importance
Mgt_Importance
Policy_Importance
IT_Importance
Training_Importance
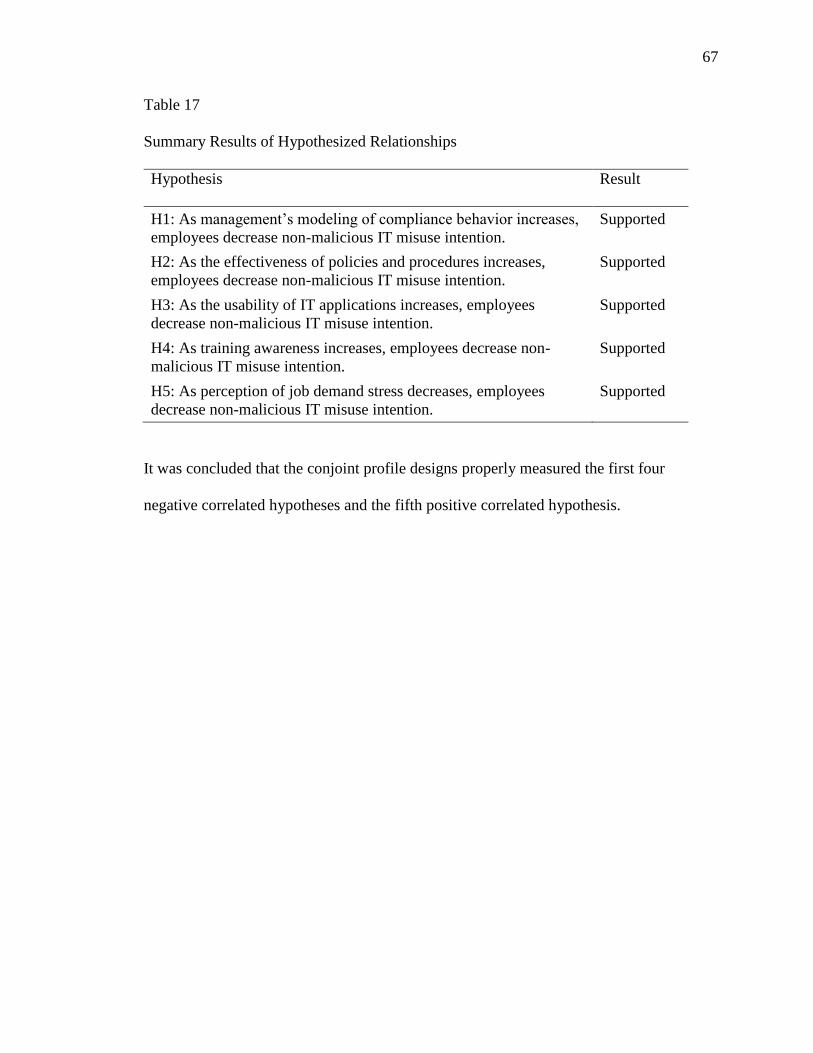
67
Table 17
Summary Results of Hypothesized Relationships
Hypothesis Result
H1: As management’s modeling of compliance behavior increases,
employees decrease non-malicious IT misuse intention.
Supported
H2: As the effectiveness of policies and procedures increases,
employees decrease non-malicious IT misuse intention.
Supported
H3: As the usability of IT applications increases, employees
decrease non-malicious IT misuse intention.
Supported
H4: As training awareness increases, employees decrease non-
malicious IT misuse intention.
Supported
H5: As perception of job demand stress decreases, employees
decrease non-malicious IT misuse intention.
Supported
It was concluded that the conjoint profile designs properly measured the first four
negative correlated hypotheses and the fifth positive correlated hypothesis.
68
CHAPTER 5
DISCUSSION AND CONCLUSION
The current research sought answers to what management and organizational
factors reduce employee non-malicious IT misuse intention while performing their job
duties. This study considered employees to be instrumental resources for safeguarding IT
resources and data since they are part of Level-1 controls. The importance of Level-1is
derived from its initial security activities that tend to be self-compliance types, where
employees are expected to comply with IT policies and procedures. Improving employee
Level-1 behavior intentions should reduce threats reaching more costly Level-2
systematic, programmed, and non-elective type controls. Consequently, this research was
undertaken in light of the often noted occurrences of employee non-malicious IT misuse,
in a corporate climate of widespread IT adoption (Ayyagari et al., 2011; Greitzer et al.,
2014; Siponen et al., 2014).
To understand this phenomenon of employee behavior, many successful studies
utilized punishment/reward and deterrence based theories that focused on individual level
antecedents (Bulgurcu et al., 2010; Yan Chen et al., 2012; D’Arcy & Devaraj, 2012). The
present study did recognize that malicious IT misuse should be deterred, punished, and
corrected. However, other studies demonstrated that unlike malicious IT misuse,
employee non-malicious IT misuse tended to be driven by more internal factors with
performance also being relevant (Guo et al., 2011; Siponen & Vance, 2010). The current
research confirmed this understanding of employee non-malicious IT misuse intentions.
69
The present study was not focused on the influence of senior level executives, but
it did theorize and find that a most important influence was how supervisor and middle
level managers demonstrated and exhibited compliance with IT policy and procedures.
Furthermore, all the management and organizational level constructs were found to have
a high level of importance and significance in the influence of employee non-malicious
IT misuse intention.
The current research holds that unlike many other studies, this study focused on
the sub-set of employees only, versus the broader population of total insiders (Steele &
Wargo, 2007). This narrower focus allowed a more valid and reliable assessment of
management and organizational influences on employee non-malicious IT misuse
intention. Based on the study’s experimental type metric conjoint analysis design, the
present study put forth the underlying act/rule utilitarian characteristic of an employee as
being very significant for non-malicious IT misuse intention.
Many past and even recent studies have reported ongoing non-malicious
violations of organizational IT policies and procedures by employees (D’Arcy & Devaraj,
2012; D’Arcy et al., 2014; Siponen et al., 2014; Willison & Warkentin, 2013). Although
results of the current study demonstrated the significant influence of management and
organizational factors, the present research suggests that a possible underlying source of
the ongoing violations found in other studies could be the unaddressed act utilitarian
ethical positions of employees. Employees with rule utilitarian characteristics; however,
reflected significantly lower non-malicious IT misuse intention. This study demonstrated
that even in the face of solid IT policies/procedures and other influential factors,
employees who reflect act utilitarian characteristics will demonstrate an intention for
70
non-malicious IT misuse. Using an overall communication and influence style, in the face
of wanting tasks accomplished, management must establish the criteria and boundary for
completing tasks in accordance with established IT policies and procedures. Otherwise,
as developed in the theoretical framework, employees with act utilitarian characteristics
will tend to supplant IT policy and procedures to meet task directives of management.
Also, it was not surprising to find that organizational stress influenced employee
non-malicious IT misuse intention. However, it was revealing to find that out of the five
management and organizational factors in the study, organizational stress was the only
factor to similarly influence the non-malicious IT misuse intention of employees with
either utilitarian characteristic type. This finding highlights the pervasive impact of
organizational stress and the need to address it.
Contributions
The current research successfully blended IT and psychological concepts to gain a
better understanding of employee non-malicious IT compliance behavior intention. In an
age when employee non-malicious IT compliance behavior too often creates
opportunities for cyber-attacks and data breaches, this study provided more insight into
how these might emerge in an organization. In addition to punishment/reward and
deterrence approaches, theoretical modeling from this study should also be applied. The
new theoretical framework would be very suitable since it robustly captured and
explained employee non-malicious IT intention. In effect, the new theoretical framework
in the present study was developed to identify key interdisciplinary influences on the
compliance behavior of employees to reduce non-malicious IT misuse intention.
71
Corporations benefit from this research by gaining insights into how
organizational factors and employee ethical positions may affect employee non-malicious
IT compliance intention. Corporations will find compliance with IT policies and
procedures encompasses factors beyond traditional solutions based solely on meaningful
rules, traditional training, and deterrence. For example, training for managers and
supervisors should not be so summarized, that it misses the significant compliance role
that managers and supervisors play at the transaction level.
In the related area of cyber security, corporations can realize value by improving
factors that affect employees’ non-malicious IT misuse intention, and thereby, improve
overall Level-1 compliance type controls. Strengthening employee Level-1 compliance
type controls reduces potential IT threats, and consequently frees more Level-2 resources
for harder to defend cyber threats. Thus, this study restates the strategic approach for
utilizing employees as key Level-1 resources, in order to support Level-2 controls in
defending against data breaches and cyber-attacks.
Limitations and Future Research Opportunities
This metric conjoint analysis study incorporates similar limitations found in
experiment like studies based on hypotheticals, such as employees based decisions on
hypotheticals in which they might or might not have experience (Lohrke et al., 2010). In
a related limitation, respondents were assessed for likely intentions, not past behavior that
they had actually committed. To counteract these limitations, profile designs were based
on information from prior representative empirical studies (Bulgurcu et al., 2010; Guo et
al., 2011; Hu et al., 2012). Another limitation was also created by the cross-sectional
nature of this study (Wood & Williams, 2014). IT experience of employees change over
72
time. However, this factor was mitigated by using a three-year minimum experience
requirement in the survey screening questions. Finally, a third limitation existed because
not all variables that a respondent might consider could be included. This type of
limitation was addressed by designing a conjoint study grounded in theory and empirical
studies, along with extensive pre-testing and piloting.
In this study, supervisors and middle managers were included in the sample. A
full study could be conducted to assess effects on supervisors and middle managers, apart
from effects on non-management employees. The current type of study also lends itself to
collection of longitudinal data to assess effects of changes in organizations and employee
evaluations. Lastly, findings from this study can be adapted to quantitative path analysis
studies and qualitative studies in researching employee compliance behavior. Moreover,
path analysis could also assess the effects of moderators and mediators.
Concluding Remarks
With the frequently announced occurrences of cyber-attacks and data breaches
against corporations, the findings and recommendations in this study are intended to
contribute to better understanding of employee non-malicious IT compliance intention. It
is recognized that related employee non-malicious IT behavior contributes to the
opportunities for breaches of IT security. Improving management and organizational
factors that influence employee IT compliance intention should in turn provide a tangible
benefit for countering cyber-attacks and data breaches against organizations.

73
REFERENCES
Agarwal, R., & Karahanna, E. (2000). Time Flies When You’re Having Fun: Cognitive
Absorption and Beliefs About Information Technology Usage. MIS Quarterly,
24(4), 665–694.
Akers, R. L., Krohn, M. D., Lanza-Kaduce, L., & Radosevich, M. (1979). Social learning
and deviant behavior: A specific test of a general theory. American Sociological
Review, 636–655.
Alder, G., Schminke, M., & Noel, T. (2007). The Impact of Individual Ethics on
Reactions to Potentially Invasive HR Practices (No. 1674544) (pp. 201–214).
Springer Science & Business Media B.V. Retrieved from
http://search.ebscohost.com/login.aspx?direct=true&db=bth&AN=26553488&site
=ehost-live
American Psychological Association. (2010). Publication manual of the American
Psychological Association / APA manual.
Audit Analytics. (n.d.). Internal Controls. Retrieved from
http://www.auditanalytics.com/0002/text-search-ic.php
Ayyagari, R., Grover, V., & Purvis, R. (2011). Technostress: technological antecedents
and implications. MIS Quarterly, 35(4), 831–858.
Babin, B. J., Griffin, M., & Hair Jr., J. F. (2016). Heresies and sacred cows in scholarly
marketing publications. Journal of Business Research, 69(8), 3133–3138.
http://doi.org/10.1016/j.jbusres.2015.12.001
Bandura, A. (1971). Social learning theory. Morristown, N. J., General Learning Press,
1971.
Bandura, A. (1977). Self-efficacy: toward a unifying theory of behavioral change.
Psychological Review, 84(2), 191–215.
Bandura, A. (1988). Organisational Applications of Social Cognitive Theory. Australian
Journal of Management (University of New South Wales), 13(2), 275.
Beauchamp, T. L., & Bowie, N. E. (1997). Ethical theory and business (5th ed.). Upper
Saddle River, NJ: Prentice Hall.
74
Beaudry, A., & Pinsonneault, A. (2005). Understanding User Responses to Information
Technology: A Coping Model of User Adaptation. MIS Quarterly, 29(3), 493–
524.
Becker, J.-M., Rai, A., Ringle, C. M., & Völckner, F. (2013). Discovering Unobserved
Heterogeneity in Structural Equation Models to Avert Validity Threats. MIS
Quarterly, 37(3), 665-A21.
Brandon, D. M., Long, J. H., Loraas, T. M., Mueller-Phillips, J., & Vansant, B. (2014).
Online Instrument Delivery and Participant Recruitment Services: Emerging
Opportunities for Behavioral Accounting Research. Behavioral Research in
Accounting, 26(1), 1–23. http://doi.org/10.2308/bria-50651
Bulgurcu, B., Cavusoglu, H., & Benbasat, I. (2010). Information Security Policy
Compliance: An Empirical Study of Rationality-Based Beliefs and Information
Security Awareness. MIS Quarterly, 34(3), 523-A7.
Carneiro, J., & Faria, F. (n.d.). Quest for purposefully designed conceptualization of the
country-of-origin image construct. Journal of Business Research.
http://doi.org/10.1016/j.jbusres.2015.12.075
Carter, M., Wright, R., Thatcher, J. B., & Klein, R. (2014). Understanding online
customers’ ties to merchants: the moderating influence of trust on the relationship
between switching costs and e-loyalty. European Journal of Information Systems,
23(2), 185–204.
http://doi.org/http://dx.doi.org.proxy.kennesaw.edu/10.1057/ejis.2012.55
Casali, G. (2011). Developing a Multidimensional Scale for Ethical Decision Making.
Journal of Business Ethics, 104(4), 485.
CERT. (2014). Unintentional Insider Threats: Social Engineering (No. CMU/SEI-2013-
TN-024). Software Engineering Institute, Carnegie Mellon University. Retrieved
from http://resources.sei.cmu.edu/library/asset-view.cfm?AssetID=77455
Chen, Y., Kilgour, D. M., & Hipel, K. W. (2009). Using a Benchmark in Case-Based
Multiple-Criteria Ranking. IEEE Transactions on Systems, Man and Cybernetics,
Part A: Systems and Humans, 39(2), 358–368.
http://doi.org/10.1109/TSMCA.2008.2010135
Chen, Y., Ramamurthy, K., & Wen, K.-W. (2012). Organizations’ Information Security
Policy Compliance: Stick or Carrot Approach? Journal of Management
Information Systems, 29(3), 157–188.
Chiu, C.-M., Hsu, M.-H., & Wang, E. T. G. (2006). Understanding knowledge sharing in
virtual communities: An integration of social capital and social cognitive theories.
Decision Support Systems, 42(3), 1872–1888.
http://doi.org/10.1016/j.dss.2006.04.001

75
Choi, Y. R., & Shepherd, D. A. (2005). Stakeholder Perceptions of Age and Other
Dimensions of Newness. Journal of Management, 31(4), 573–596.
http://doi.org/10.1177/0149206304272294
Colvin, R. G. (1984). The EDP Auditing Challenge: The Accounting Discipline’s
Response. Business Pub. Division, College of Business Administration, Georgia
State University.
Compeau, D. R., & Higgins, C. A. (1995). Computer Self-Efficacy: Development of a
Measure and Initial Test. MIS Quarterly, 19(2), 189–211.
Cronan, T. P., & Douglas, D. E. (1990). End-user Training and Computing Effectiveness
in Public Agencies: An Empirical Study. Journal of Management Information
Systems, 6(4), 21–39.
D’Arcy, J., & Devaraj, S. (2012). Employee Misuse of Information Technology
Resources: Testing a Contemporary Deterrence Model. Decision Sciences, 43(6),
1091–1124. http://doi.org/10.1111/j.1540-5915.2012.00383.x
D’Arcy, J., Herath, T., & Shoss, M. K. (2014). Understanding Employee Responses to
Stressful Information Security Requirements: A Coping Perspective. Journal of
Management Information Systems, 31(2), 285–318.
http://doi.org/10.2753/MIS0742-1222310210
D’Arcy, J., Hovav, A., & Galletta, D. (2009). User Awareness of Security
Countermeasures and Its Impact on Information Systems Misuse: A Deterrence
Approach. Information Systems Research, 20(1), 79–98.
De Liu, Xun Li, & Santhanam, R. (2013). Digital games and beyond: what happens when
players compete. MIS Quarterly, 37(1), 111–124.
DeChurch, L. A., Hiller, N. J., Murase, T., Doty, D., & Salas, E. (2010). Leadership
across levels: Levels of leaders and their levels of impact. The Leadership
Quarterly, 21(6), 1069–1085. http://doi.org/10.1016/j.leaqua.2010.10.009
Dewan, S., Ganley, D., & Kraemer, K. L. (2009). Complementarities in the Diffusion of
Personal Computers and the Internet: Implications for the Global Digital Divide.
Information Systems Research, 21(4), 925–940.
http://doi.org/10.1287/isre.1080.0219
Donaldson, T., Werhane, P. H., & Cording, M. (2002). Ethical issues in business : a
philosophical approach (7th ed.). Upper Saddle River, NJ: Prentice Hall.
Fan, L., Ho, C., & Ng, V. (2001). A study of quantity surveyors’ ethical behaviour.
Construction Management & Economics, 19(1), 19–36.
http://doi.org/10.1080/014461901452058
76
Folkman, S., & Lazarus, R. S. (1980). An Analysis of Coping in a Middle-Aged
Community Sample. Journal of Health & Social Behavior, 21(3), 219–239.
Folkman, S., & Moskowitz, J. T. (2004). COPING: Pitfalls and Promise. Annual Review
of Psychology, 55(1), 745–774.
http://doi.org/10.1146/annurev.psych.55.090902.141456
Galletta, D. F., & Hufnagel, E. M. (1992). A model of end-user computing policy:
Context, process, content and compliance. Information & Management, 22(1), 1–
18. http://doi.org/10.1016/0378-7206(92)90002-W
Gefen, D., Rigdon, E. E., & Straub, D. (2011). An update and extension to SEM
guidelines for administrative and social science research. MIS Quarterly, 35(2),
iii-A7.
Green, P. E., & Krieger, A. M. (1996). Individualized Hybrid Models for Conjoint
Analysis. Management Science, 42(6), 850–867.
Greitzer, F. L., Strozer, J., Cohen, S., Bergey, J., Cowley, J., Moore, A., & Mundie, D.
(2014). Unintentional Insider Threat: Contributing Factors, Observables, and
Mitigation Strategies (pp. 2025–2034). IEEE.
http://doi.org/10.1109/HICSS.2014.256
Guo, K. H., Yuan, Y., Archer, N. P., & Connelly, C. E. (2011). Understanding
Nonmalicious Security Violations in the Workplace: A Composite Behavior
Model. Journal of Management Information Systems, 28(2), 203–236.
Hair, J., Black, W. C., Babin, B. J., & Anderson, R. E. (2009). Multivariate Data
Analysis (Vol. 7). Prentice Hall. Retrieved from
http://www.amazon.com/dp/0138132631
Hair, J., Celsi, M. W., Money, A. H., Samouel, P., & Page, M. J. (2011). Essentials of
Business Research Methods (Vol. 2). M.E.Sharpe. Retrieved from
http://www.amazon.com/dp/0765626314
H. M. P. S. Herath, & Wijayanayake, W. M. J. I. (2009). Computer misuse in the
workplace. Journal of Business Continuity & Emergency Planning, 3(3), 259–
270.
Hanisch, D. N., & Rau, S. B. (2014). Application of metric conjoint analysis in family
business research. Journal of Family Business Strategy, 5(1), 72–84.
http://doi.org/10.1016/j.jfbs.2014.01.003
Holland, D. V., & Shepherd, D. A. (2013). Deciding to persist: adversity, values, and
entrepreneurs’ decision policies. Entrepreneurship: Theory and Practice, (2), 331.
77
Hooker, B. (2013). Rule-consequentialism. In R. Shafer-Landau (Ed.), Ethical theory: an
anthology (2nd ed., pp. 428-440). Wiley-Blackwell. Retrieved from
https://books.google.com/books (Original work published 2000)
Hu, Q., Dinev, T., Hart, P., & Cooke, D. (2012). Managing Employee Compliance with
Information Security Policies: The Critical Role of Top Management and
Organizational Culture*. Decision Sciences, 43(4), 615–660.
http://doi.org/10.1111/j.1540-5915.2012.00361.x
Huigang Liang, Saraf, N., Qing Hu, & Yajiong Xue. (2007). Assimilation of Enterprise
Systems: The Effect of Institutional Pressures and the Mediating Role of Top
Management. MIS Quarterly, 31(1), 59–87.
Il-Horn Hann, Kai-Lung Hui, Sang-Yong Tom Lee, & Png, I. P. L. (2007). Overcoming
Online Information Privacy Concerns: An Information-Processing Theory
Approach. Journal of Management Information Systems, 24(2), 13–42.
Jarvenpaa, S. L., & Ives, B. (1991). Executive Involvement and Participation in the
Management of Information Technology. MIS Quarterly, (2), 205.
Jiménez, F. R., & Mendoza, N. A. (2013). Too Popular to Ignore: The Influence of
Online Reviews on Purchase Intentions of Search and Experience Products.
Journal of Interactive Marketing, 27(3), 226–235.
http://doi.org/10.1016/j.intmar.2013.04.004
Kankanhalli, A., Teo, H.-H., Tan, B. C. Y., & Wei, K.-K. (2003). An integrative study of
information systems security effectiveness. International Journal of Information
Management, 23(2), 139–154. http://doi.org/10.1016/S0268-4012(02)00105-6
Klamm, B. K., & Watson, M. W. (2009). SOX 404 Reported Internal Control
Weaknesses: A Test of COSO Framework Components and Information
Technology. Journal of Information Systems, 23(2), 1–23.
Knapp, K. J. (2005). A Model of Managerial Effectiveness in Information Security: From
Grounded Theory to Empirical Test.
Kujala, J. (2001). A Multidimensional Approach to Finnish Managers’ Moral Decision-
Making. Journal of Business Ethics, 34(3/4), 231–254.
Lanivich, S. E. (2015). The RICH Entrepreneur: Using Conservation of Resources
Theory in Contexts of Uncertainty. Entrepreneurship: Theory & Practice, 39(4),
863–894. http://doi.org/10.1111/etap.12082
Lazar, J., AdamShneiderman, Ben. (2006). Workplace user frustration with computers:
an exploratory investigation of the causes and severity. Behaviour & Information
Technology, 25(3), 239–251. http://doi.org/10.1080/01449290500196963
Lazarus, R. S. (1999). Stress and emotion: a new synthesis. New York, N.Y: Springer.

78
Lazarus, R. S., & Folkman, S. (1984). Stress, appraisal, and coping. New York:
Springer.
Leonhardt, J. M., Catlin, J. R., & Pirouz, D. M. (2015). Is Your Product Facing the Ad’s
Center? Facing Direction Affects Processing Fluency and Ad Evaluation. Journal
of Advertising, 44(4), 315–325. http://doi.org/10.1080/00913367.2015.1048911
Liang, H., & Xue, Y. (2009). Avoidance of information technology threats: a theoretical
perspective. MIS Quarterly, 33(1), 71–90.
Lohrke, F. T., olloway, B. B., & oolley, T. W. (2010). Conjoint Analysis in
Entrepreneurship Research. Organizational Research Methods, 13(1), 16–30.
Marakas, G. M., Yi, M. Y., & Johnson, R. D. (1998). The Multilevel and Multifaceted
Character of Computer Self-Efficacy: Toward Clarification of the Construct and
an Integrative Framework for Research. Information Systems Research, 9(2),
126–163.
Merriam-Webster’s collegiate dictionary. (2012). Springfield, Mass. : Merriam-Webster,
Inc., c2012.
Mill, J. S. (2010). Utilitarianism. Pennsylvania State University, Electronic Classics
Series. Retrieved from https://books.google.com/books (Original work published
1879)
Montoya, M. M., Massey, A. P., & Khatri, V. (2010). Connecting IT Services Operations
to Services Marketing Practices. Journal of Management Information Systems,
26(4), 65–85.
Moore, G. C., & Benbasat, I. (1991). Development of an Instrument to Measure the
Perceptions of Adopting an Information Technology Innovation. Information
Systems Research, 2(3), 192–222.
Morris, J. J. (2011). The Impact of Enterprise Resource Planning (ERP) Systems on the
Effectiveness of Internal Controls over Financial Reporting. Journal of
Information Systems, 25(1), 129–157. http://doi.org/10.2308/jis.2011.25.1.129
Mulye, R. (1998). An Empirical Comparison of Three Variants of the AHP and Two
Variants of Conjoint Analysis. Journal of Behavioral Decision Making, 11(4),
263–280.
Ortiz de Guinea, A., & Webster, J. (2013). An Investigation of Information Systems Use
Patterns: Technological Events as Triggers, the Effect of Time, and Consequences
for Performance. MIS Quarterly, 37(4), 1165-A6.
Osborn, S., Sandhu, R., & Munawer, Q. (2000). Configuring role-based access control to
enforce mandatory and discretionary access control policies. ACM Transactions
on Information and System Security (TISSEC), 3(2), 85–106.
79
Osei-Bryson, K.-M., Dong, L., & Ngwenyama, O. (2008). Exploring managerial factors
affecting ERP implementation: an investigation of the Klein-Sorra model using
regression splines. Information Systems Journal, 18(5), 499–527.
http://doi.org/10.1111/j.1365-2575.2008.00309.x
Parasuraman, S., & Alutto, J. A. (1981). An Examination of the Organizational
Antecedents of Stressors at Work. Academy of Management Journal, 24(1), 48–
67. http://doi.org/10.2307/255823
Parasuraman, S., & Alutto, J. A. (1984). Sources and Outcomes of Stress in
Organizational Settings: Toward the Development of a Structural Model.
Academy of Management Journal, 27(2), 330–350. http://doi.org/10.2307/255928
Perry, G. M., & Nixon, C. J. (2005). The Influence of Role Models on Negotiation Ethics
of College Students. Journal of Business Ethics, 62(1), 25–40.
http://doi.org/10.1007/s10551-005-8177-z
Petter, S., & McLean, E. R. (2009). A meta-analytic assessment of the DeLone and
McLean IS success model: An examination of IS success at the individual level.
Information & Management, 46(3), 159–166.
http://doi.org/10.1016/j.im.2008.12.006
Podsakoff, P. M., MacKenzie, S. B., & Podsakoff, N. P. (2012). Sources of Method Bias
in Social Science Research and Recommendations on How to Control It. Annual
Review of Psychology, 63(1), 539–569. http://doi.org/10.1146/annurev-psych-
120710-100452
Ponemon Institute. (2012). 2011 Cost of Data Breach Study: United States. Traverse, MI:
Ponemon Institute LLC. Retrieved from
https://www.symantec.com/content/en/us/about/media/pdfs/b-ponemon-2011-
cost-of-data-breach-us.en-us.pdf
Prat, N., Comyn-Wattiau, I., & Akoka, J. (2015). A Taxonomy of Evaluation Methods for
Information Systems Artifacts. Journal of Management Information Systems,
32(3), 229–267. http://doi.org/10.1080/07421222.2015.1099390
Priem, R. L. (1992). An Application of Metric Conjoint Analysis for the Evaluation of
Top Managers’ Individual Strategic Decision Making Processes: A Research
Note. Strategic Management Journal, 143.
Puhakainen, P., & Siponen, M. (2010). Improving Employees’ Compliance Through
Information Systems Security Training: An Action Research Study. MIS
Quarterly, 34(4), 767-A4.
Ragu-Nathan, T. S., Tarafdar, M., Ragu-Nathan, B. S., & Qiang Tu. (2008). The
Consequences of Technostress for End Users in Organizations: Conceptual
Development and Empirical Validation. Information Systems Research, 19(4),
417–433.
80
Richard, R. (2010). CSI Computer Crime and Security Survey. Computer Security
Institute, New York.
Roy Sarkar, K. (2010). Assessing insider threats to information security using technical,
behavioural and organisational measures. Information Security Technical Report,
15(3), 112–133. http://doi.org/10.1016/j.istr.2010.11.002
Sandhu, R., & Samarati, P. (1996). Authentication, Access Control, and Audit. ACM
Computing Surveys, 28(1), 241–243.
Schlereth, C., Skiera, B., & Wolk, A. (2011). Measuring Consumers’ Preferences for
Metered Pricing of Services. Journal of Service Research, 14(4), 443.
Schminke, M., Ambrose, M. L., & Noel, T. W. (1997). The Effect of Ethical Frameworks
on Perceptions of Organizational Justice. Academy of Management Journal,
40(5), 1190–1207. http://doi.org/10.2307/256932
Schwarz, A., Jayatilaka, B., Hirschheim, R., & Goles, T. (2009). A conjoint approach to
understanding IT application services outsourcing. Journal of the Association for
Information Systems, 10(10), 748–781.
Shapeero, M., Chye Koh, H., & Killough, L. N. (2003). Underreporting and premature
sign-off in public accounting. Managerial Auditing Journal, 18(6/7), 478–489.
Shepherd, D. A. (1999). Venture Capitalists’ Assessment of New Venture Survival.
Management Science, 45(5), 621.
Shmueli, G., & Koppius, O. R. (2011). Predictive analytics in information systems
research. MIS Quarterly, 35(3), 553–572.
Silowash, G., Cappelli, D., Moore, A., Trzeciak, R., Shimeall, T. J., & Flynn, L. (2012).
Common Sense Guide to Mitigating Insider Threats 4th Edition (No. CMU/SEI-
2012-TR-012). Software Engineering Institute, Carnegie Mellon University.
Retrieved from http://resources.sei.cmu.edu/library/asset-
view.cfm?AssetID=34017
Siponen, M., Adam Mahmood, M., & Pahnila, S. (2014). Employees’ Adherence to
Information Security Policies: An Exploratory Field Study. Information &
Management, 51(2), 217–224. http://doi.org/10.1016/j.im.2013.08.006
Siponen, M., & Vance, A. (2010). Neutralization: New Insights into the Problem of
Employee Information Systems Security Policy Violations. MIS Quarterly, 34(3),
487-A12.
Smith, S. M., Roster, C. A., Golden, L. L., & Albaum, G. S. (2015). A multi-group
analysis of online survey respondent data quality: Comparing a regular USA
consumer panel to MTurk samples. Journal of Business Research.
http://doi.org/10.1016/j.jbusres.2015.12.002
81
SolarWinds. (2014). Internal Federal Cybersecurity Threats Nearly as Prevalent as
External, SolarWinds Survey Reveals. SolarWinds. Retrieved from
http://www.solarwinds.com/company/newsroom/press_releases/years/2014/29205
7778751.aspx
Spears, J. L., & Barki, H. (2010). User participation in information systems security risk
management. MIS Quarterly, 34(3), 503–522.
Stanton, J. M., Stam, K. R., Mastrangelo, P., & Jolton, J. (2005). Analysis of end user
security behaviors. Computers & Security, 24(2), 124–133.
http://doi.org/10.1016/j.cose.2004.07.001
Staples, D. S., Hulland, J. S., & Higgins, C. A. (2006). A Self-Efficacy Theory
Explanation for the Management of Remote Workers in Virtual Organizations.
Journal of Computer-Mediated Communication, 3(4), 0–0.
http://doi.org/10.1111/j.1083-6101.1998.tb00085.x
Steele, S., & Wargo, C. (2007). An Introduction to Insider Threat Management.
Information Systems Security, 16(1), 23–33.
Steinbart, P. J., Raschke, R. L., Gal, G., & Dilla, W. N. (2013). Information Security
Professionals’ Perceptions about the Relationship between the Information
Security and Internal Audit Functions. Journal of Information Systems, 27(2), 65.
Straub, D. W., Jr. (1990). Effective IS Security: An Empirical Study. Information
Systems Research, 1(3), 255–276.
Straub, D. W., & Welke, R. J. (1998). Coping with Systems Risk: Security Planning
Models for Management Decision Making. MIS Quarterly, (4), 441.
Tiwana, A., & Bush, A. A. (2007). A Comparison of Transaction Cost, Agency, and
Knowledge-Based Predictors of IT Outsourcing Decisions: A U.S.-Japan Cross-
Cultural Field Study. Journal of Management Information Systems, 24(1), 259–
300.
Tobias, P., & Trutna, L. (Eds.). (2012). Process Improvement. In e-Handbook of
Statistical Methods. NIST/SEMATECH. Retrieved from
http://www.itl.nist.gov/div898/handbook/pri/section3/pri3347.htm
Vance, A., Lowry, P. B., & Eggett, D. (2013). Using Accountability to Reduce Access
Policy Violations in Information Systems. Journal of Management Information
Systems, 29(4), 263–290. http://doi.org/10.2753/MIS0742-1222290410
Verizon Business Systems. (2011). 2011 Data Breach Investigations Report. Verizon
RISK Team Research Report. New York, NY: Verizon Communications.
Wang, P. (2010). Chasing the hottest it: effects of information technology fashion on
organizations. MIS Quarterly, 34(1), 63–85.
82
Williams, P. A. H. (2008). In a “trusting” environment, everyone is responsible for
information security. Information Security Technical Report, 13(4), 207–215.
http://doi.org/10.1016/j.istr.2008.10.009
Willison, R., & Warkentin, M. (2013). Beyond Deterrence: An Expanded View of
Employee Computer Abuse. MIS Quarterly, 37(1), 1–20.
Wixom, B. H., & Todd, P. A. (2005). A Theoretical Integration of User Satisfaction and
Technology Acceptance. Information Systems Research, 16(1), 85–102.
http://doi.org/10.1287/isre.1050.0042
Wood, M. S., & Williams, D. W. (2014). Opportunity Evaluation as Rule-Based Decision
Making. Journal of Management Studies, (4), 573.
http://doi.org/10.1111/joms.12018/abstract
Xiaojun Zhang, Venkatesh, V., & Brown, S. A. (2011). Designing collaborative systems
to enhance team performance. Journal of the Association for Information Systems,
12(8), 556–584.
Xin (robert) Luo, Warkentin, M., & Han Li. (2013). Understanding Technology Adoption
Trade-Offs: A Conjoint Analysis Approach. Journal of Computer Information
Systems, 53(3), 65.
Zaccaro, S. J., & Klimoski, R. J. (2001). The Nature of Organizational Leadership :
Understanding the Performance Imperatives Confronting Today’s Leaders. San
Francisco: Jossey-Bass.
Zacharakis, A. L., & Shepherd, D. A. (2001). The nature of information and
overconfidence on venture capitalists’ decision making. Journal of Business
Venturing, 16(4), 311–332. http://doi.org/10.1016/S0883-9026(99)00052-X
Zafar, H., & Clark, J. G. (2009). Current State of Information Security Research in IS.
Communications of the Association for Information Systems, 24, 571–596.
Zhang, C. N., & Yang, C. (2003). Integration Object Oriented Role-Based Access
Control Model with Mandatory Access Control Principles. Journal of Computer
Information Systems, 43(3), 40.
Zhang, X., & Bartol, K. M. (2010). Linking Empowering Leadership and Employee
Creativity: The Influence of Psychological Empowerment, Intrinsic Motivation,
and Creative Process Engagement. Academy of Management Journal, 53(1), 107–
128. http://doi.org/10.5465/AMJ.2010.48037118

83
APPENDICES
84
Appendix A. Metric Conjoint Survey Profile
The purpose of this study is to understand how management and organizational factors
influence employees to reduce non-malicious IT misuse intentions while performing their
job. Non-malicious IT misuse intention is when an employee would not mean any harm
to the company by their IT misuse to perform job duties.
This survey refers to a U.S. corporate setting where the company is publicly traded,
regulated by the Securities and Exchange Commission (SEC). The company would also
maintain standard systematic controls such as adequate backups, system-mandated
change of passwords every 90 days, and formal setup and tracking of user-names.
INSTRUCTIONS: The profiles below refer to descriptions of a company where five of
its management and organizational factors are categorized as HIGH or LOW. You are
asked to view and apply these factors to employees who use IT in their normal job duties.
Based on your view of the combined impact of the five factors, please answer the
question following each profile.

85
DEFINITION OF FIVE MANAGEMENT & ORGANIZATIONAL ATTRIBUTES:
Management compliance:
High- Management consistently follows policies/procedures and sets a good example.
Low- Management does not consistently follow policies/procedures and sets a weak
example.
Perceived job stress:
High - Employee feels job responsibilities contain significant/high levels of stress.
Low – Employee feels job responsibilities contain little stress.
Policies and procedures effectiveness:
High- IT policies and procedures are clear, useful, and easy to follow.
Low - IT policies and procedures are confusing, burdensome, and difficult to follow.
IT/IS applications effectiveness:
High - IT applications are fast, easy to execute, and provide helpful information.
Low - IT applications are slow, difficult to use, and provide limited information.
Training awareness:
High- IT training is available and useful.
Low - IT training is limited and not very useful.
_______________________________________________________________________
PROFILE DESCRIPTIONS OF COMPANY:
Management and organizational attributes are described as follows:
Management compliance - management consistently follows
policies/procedures and sets a good example. High
Perceived job stress – employee feels job responsibilities contain
little stress. Low
Policies and procedures effectiveness - IT policies and procedures
are confusing, burdensome, and difficult to follow. Low
IT applications effectiveness - IT applications are fast, easy to
execute, and provide helpful information. High
Training awareness - IT training is limited and not very useful. Low
Based on the attributes described above, how likely is an employee to:
Violate policies and procedures when using IT to perform job duties?
Very unlikely 1 2 3 4 5 6 7 8 9 Very likely

86
Appendix B. Calculation of Hit Rate Example
Profiles Actual
Rating
Estimated
Rating
Actual Rating
/ 9
Estimated Rating
/ 9
Absolute
Difference
Validation 1 8 6 .89 .67 .22
Validation 2 6 5 .67 .56 .11
Validation 3 4 4 .44 .44 .000
Validation 4 5 6 .56 .67 .11
1.00 - Mean Absolute Difference
= .89 Hit Rate

87
Appendix C. Act and Rule Survey Utilitarian Scale
When employees face IT policies and procedures, how much importance should they
place on the below considerations:
Very
Low 1
2 3 4 5 6 Very
High 7
1. (Act) By their actions,
create the greatest overall
benefit for their
department. (Casali, 2011)
2. (Rule) Do not cause
problems for other
employees. (Casali, 2011)
3. (Act) Actions are okay
as long as the
consequences affect the
majority of stakeholders in
a positive way. (Fan et al.,
2001)
4. (Rule) Respect
organizational IT policies
and procedures. (Casali,
2011)
5. (Act) By their actions,
create the greatest overall
benefit for the
organization. (Casali,
2011)
6. (Rule) Guide actions by
a set of principles accepted
as right within the
organization and stand by
those principles regardless
of the consequences. (Perry
& Nixon, 2005)
7. (Act) Sacrifices of IT
policies and procedures are
sometimes needed to
ensure the greatest benefit
for the most number of
stakeholders. (Fan et al.,
2001)
88
Appendix D. Respondent Profile
(continued on next page)
Category Frequency
(n = 97)
Percent Cumulative
Percent
Sex
Male 46 47.4% -
Female 51 52.6% -
Ages
Less than 24 5 5.2% 5.2%
25 - 34 39 40.2% 45.4%
35 - 44 30 30.9% 76.3%
45 - 54 17 17.5% 93.8%
55 and over 6 6.2% 100.0%
Education Level
High school degree 23 23.7% 23.7%
Community college degree 13 13.4% 37.1%
Undergraduate degree 34 35.1% 72.2%
Masters level degree 15 15.5% 87.6%
Doctorate level degree 3 3.1% 90.7%
Other 7 7.2% 97.9%
Prefer not to respond 2 2.1% 100.0%
Industry Classification
Construction - Building, General, Heavy 1 1.0% 1.0%
Manufacturing 10 10.3% 11.3%
Regulated - Transportation, Communications,
Electric, Gas, Sanitation 8 8.2% 19.6%
Wholesale Trade (including wholesale IT) 3 3.1% 22.7%
Retail Trade - Materials, Merchandise, Food,
Automotive, Gasoline, Retail IT, Miscellaneous 25 25.8% 48.5%
Finance, Insurance, Real Estate 14 14.4% 62.9%
Health Care 10 10.3% 73.2%
Hospitality and Travel 4 4.1% 77.3%
Other 20 20.6% 97.9%
Prefer not to respond 2 2.1% 100.0%
Company size, number employees
Less than 499 11 11.3% 11.3%
500 - 999 11 11.3% 22.7%
1,000 - 2,499 12 12.4% 35.1%
2,500 - 9,999 26 26.8% 61.9%
More than 9,999 34 35.1% 96.9%
Prefer not to respond 3 3.1% 100.0%
Years working with current company
Less than 5 23 23.7% 23.7%
5 - 9 37 38.1% 61.9%
10 - 19 28 28.9% 90.7%
20 - 29 5 5.2% 95.9%
30 - 39 4 4.1% 100.0%
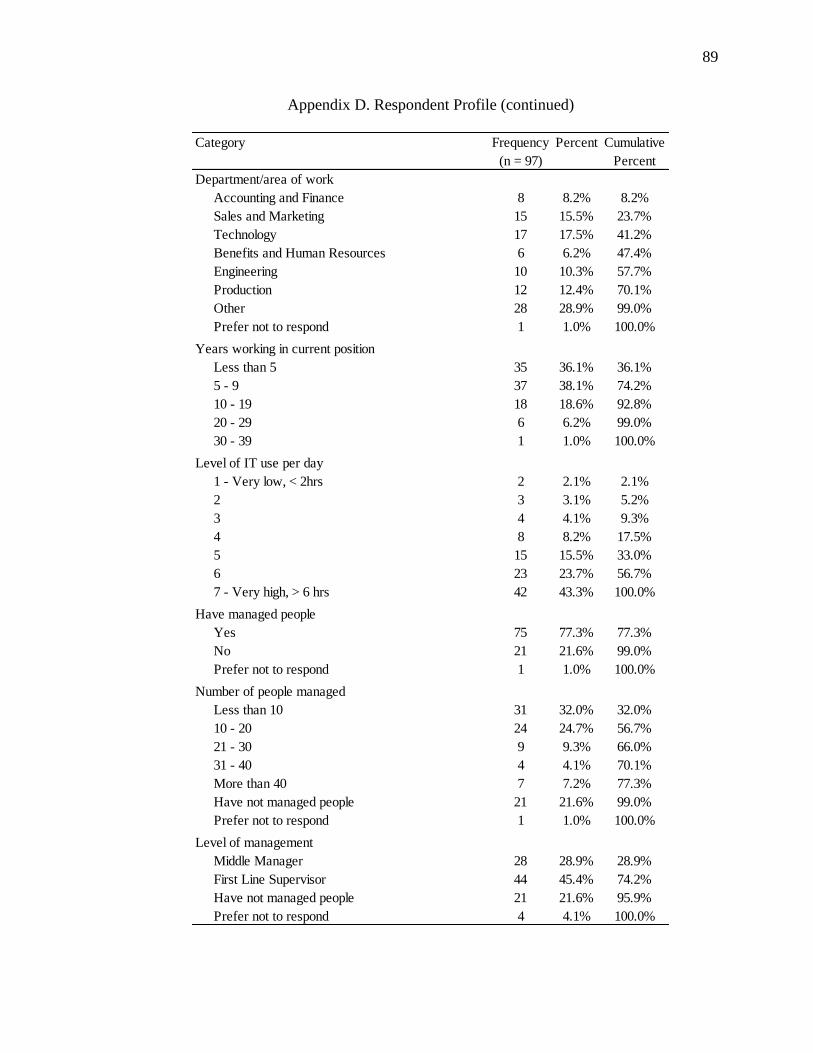
89
Appendix D. Respondent Profile (continued)
Category Frequency
(n = 97)
Percent Cumulative
Percent
Department/area of work
Accounting and Finance 8 8.2% 8.2%
Sales and Marketing 15 15.5% 23.7%
Technology 17 17.5% 41.2%
Benefits and Human Resources 6 6.2% 47.4%
Engineering 10 10.3% 57.7%
Production 12 12.4% 70.1%
Other 28 28.9% 99.0%
Prefer not to respond 1 1.0% 100.0%
Years working in current position
Less than 5 35 36.1% 36.1%
5 - 9 37 38.1% 74.2%
10 - 19 18 18.6% 92.8%
20 - 29 6 6.2% 99.0%
30 - 39 1 1.0% 100.0%
Level of IT use per day
1 - Very low, < 2hrs 2 2.1% 2.1%
2 3 3.1% 5.2%
3 4 4.1% 9.3%
4 8 8.2% 17.5%
5 15 15.5% 33.0%
6 23 23.7% 56.7%
7 - Very high, > 6 hrs 42 43.3% 100.0%
Have managed people
Yes 75 77.3% 77.3%
No 21 21.6% 99.0%
Prefer not to respond 1 1.0% 100.0%
Number of people managed
Less than 10 31 32.0% 32.0%
10 - 20 24 24.7% 56.7%
21 - 30 9 9.3% 66.0%
31 - 40 4 4.1% 70.1%
More than 40 7 7.2% 77.3%
Have not managed people 21 21.6% 99.0%
Prefer not to respond 1 1.0% 100.0%
Level of management
Middle Manager 28 28.9% 28.9%
First Line Supervisor 44 45.4% 74.2%
Have not managed people 21 21.6% 95.9%
Prefer not to respond 4 4.1% 100.0%

90
Appendix E. Confirmatory Factor Analysis Tables
Table E1. Standardized Residual Covariances
Q7_4 Q7_6 Q7_3 Q7_7
Q7_4 .000
Q7_6 .000 .000
Q7_3 -.314 .766 .000
Q7_7 .144 -.354 .000 .000
Table E2. CMIN
Model NPAR CMIN DF P CMIN/DF
Default model 9 4.112 1 .043 4.112
Saturated model 10 .000 0
Independence
model 4 99.996 6 .000 16.666
Table E3. Goodness-of-Fit Index (GFI)
Model RMR GFI AGFI PGFI
Default model .065 .979 .795 .098
Saturated model .000 1.000
Independence model .848 .682 .470 .409
Table E4. Comparative Fit Index
Model NFI
Delta1
RFI
rho1
IFI
Delta2
TLI
rho2 CFI
Default model .959 .753 .969 .801 .967
Saturated model 1.000
1.000
1.000
Independence model .000 .000 .000 .000 .000
(continued on next page)
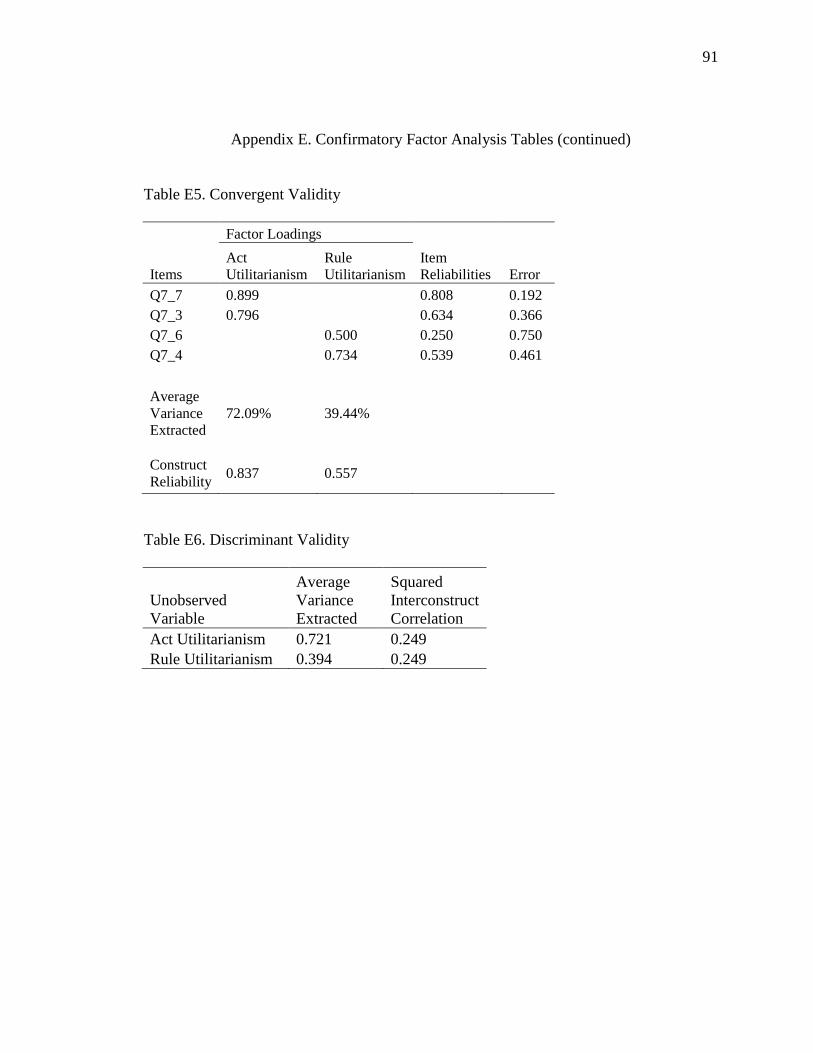
91
Appendix E. Confirmatory Factor Analysis Tables (continued)
Table E5. Convergent Validity
Factor Loadings
Items
Act
Utilitarianism
Rule
Utilitarianism
Item
Reliabilities Error
Q7_7 0.899
0.808 0.192
Q7_3 0.796
0.634 0.366
Q7_6
0.500 0.250 0.750
Q7_4
0.734 0.539 0.461
Average
Variance
Extracted
72.09% 39.44%
Construct
Reliability 0.837 0.557
Table E6. Discriminant Validity
Unobserved
Variable
Average
Variance
Extracted
Squared
Interconstruct
Correlation
Act Utilitarianism 0.721 0.249
Rule Utilitarianism 0.394 0.249
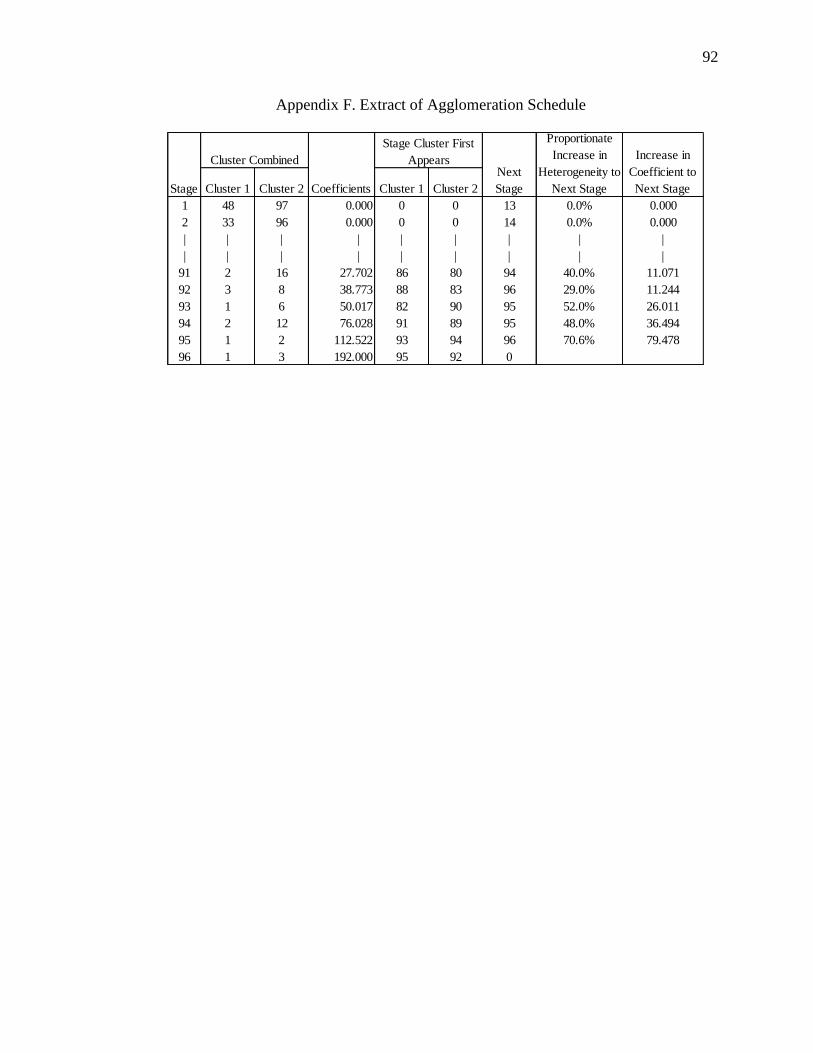
92
Appendix F. Extract of Agglomeration Schedule
Cluster 1 Cluster 2 Cluster 1 Cluster 2
1 48 97 0.000 0 0 13 0.0% 0.000
2 33 96 0.000 0 0 14 0.0% 0.000
| | | | | | | | |
| | | | | | | | |
91 2 16 27.702 86 80 94 40.0% 11.071
92 3 8 38.773 88 83 96 29.0% 11.244
93 1 6 50.017 82 90 95 52.0% 26.011
94 2 12 76.028 91 89 95 48.0% 36.494
95 1 2 112.522 93 94 96 70.6% 79.478
96 1 3 192.000 95 92 0
Proportionate
Increase in
Heterogeneity to
Next Stage
Increase in
Coefficient to
Next StageStage
Cluster Combined
Coefficients
Stage Cluster First
AppearsNext
Stage