Man versus Beast: Pharmacokinetic Scaling in...
13
Man versus Beast: Pharmacokinetic Scaling in Mammals Joyce Mordenti Received May 19, 1986, from the School of Pharmacy, University of California, San Francisco, CA 94143-0446. September 23, 1986. Accepted for publication 3000-kg elephant. Despite this 10* range in weight, most land mammals have similar anatomy, physiology, biochemistry, and cellular structure. This similarity has allowed interspecies scaling of physiologic properties such as heart rate, blood flow, blood volume, organ size, and longevity. The equation that is the basis for scaling physiologic properties among mammals is the power equation Y = aW, where Y is the physiologic variable of interest, W is body weight, and log a is the y-intercept and b is the slope obtained from the plot of log Y versus log W. Animals commonly used in preclinical drug studies (i.e., mice, rats, rabbits, mnnkpws anri Hnnsl rin not eliminate druas at the same rate that with physiologic properties that are well described among species, it seems reasonable to surmise that drug elimination can be scaled among mammals. Analysis of drug pharmacokinetics in numerous species demonstrates that drug elimination among species is predict able and, in general, obeys the power equation Y = aWb. Early papers on interspecies pharmacokinetic scaling normalized the x- and y-axes to illustrate the superimposability of pharmacokinetic curves from different species. More recently, the x- and y-axes have been left in the common units of concentration and time, and individual pharmacokinetic varia bles have been adjusted to predict pharmacokinetic profiles in an untested species, usually humans. Two approaches to interspecies phannacokinetic scaling have emerged, an allometric approach and a physiologic approach. In the allometric approach, pharmacokinetic pro files in several animal species are described by a pharmaco- lrinotip mnrlol frntnnflrtmpntfll nr nnncnmnartrnental). and the pharmacokinetic parameters of the model are scaled by fV>rt nnmnr Qnnotinn V — nW" An ootimoto fnr onrh nhflrrtlfl. cokinetic parameter in humans is obtained by solving each nnwpr pmmrinn fnr 7fl ko- Tn this annrnarh. each soecies is viewed as a whole entity; no attempt is made to give when organ size and organ function are studied as a function of species body weight. Huxley1 demonstrated that plots of organ size (Y) versus body weight (W) produce straight lines, on log-log paper. The equation for this straight line is log Yi = 6 log W + log a, where 6 is the slope and log a is'the y-, intercept. The antilog of this equation is the power equation Y = aW6, and it has come to be known as the allometric equation. Adolph2 compiled 33 equations which related quantitative quantity (i.e., body weight) are related to one another, h proposed that mathematical interrelationships could be d« veloped that equate one physiologic property to another a follows: Y-. = a-W61 (1) Y2 = azW62 (5 log W = (log Y-. - log aj/b! = (log Y2 - log a2)/62 (' log Yi = log ai + 61/62 dog Y2 - log ag) Y-. = a-.(Y2/a2)6l/62 Suppose one needs to calculate urine output is a functio 01 water mtaKe. using tne aata in muxe 1 iui-^iiuc uui (U) and water intake (I), one calculates IK= C-.46I0-93,' constant for the output of urine to the exponential ra co: means that the rate of urine production is less "than the ra iffiff-infgjraifii-1^ is established by reducing the pharmacokinetics of a drug in g iled data on the weight of principal organs 6 one animal species to physiologically, anatomically, and , , , , j'. , other mammals (Fig. 1). All primate data fell on a straig.a eliminating organs; tissue and fluid volumes; blood-to-plas- ,. .* . , ., r„ . . , :, «f-J*a»i«J:lii>i-f:lulQjl(lf-4-:-JiJ»):M*l.,/M'*W'KB:itl^^^:j#i<^*a^ Jl*a**>*a1[IKW"J|VA'i physiologic parameter in humans is then substituted into the ics of the drug in humans is thus obtained. mmimmmmmmimmmm tion among species, to predict drug disposition in an untested species, to define pharmacokinetic equivalence in various species, and to design dosage regimens for experimental animal models. Physiologic Basis for Pharmacokinetic Scaling Despite obvious differences in outward appearance, most land mammals have similar anatomy, physiology, biochemis- Physical similarity, in the engineering sense, is dv criteria of similarity which are obtained by forming qi renal blood flow/cardiac output x 100 = 43.06Wo:77/166W0'79 x 100 = 25.9% where the units of renal blood flow and cardiac output milliliters per minute and that of weight is kilograms. T relationship reveals that renal blood flow is approxims one-quarter of cardiac output regardless of mammali 1028 /Journal of Pharmaceutical Sciences Vol. 75, No. 11, November 1986 0022-3549/86/1100-1028^1.0C © 1986, American Pharmace'uticarAssocieth
Transcript of Man versus Beast: Pharmacokinetic Scaling in...

Man versus Beast: Pharmacokinetic Scaling in Mammals
Joyce MordentiReceived May 19, 1986, from the School of Pharmacy, University of California, San Francisco, CA 94143-0446.September 23, 1986.
Accepted for publication
3000-kg elephant. Despite this 10* range in weight, most land mammalshave similar anatomy, physiology, biochemistry, and cellular structure.This similarity has allowed interspecies scaling of physiologic propertiessuch as heart rate, blood flow, blood volume, organ size, and longevity.The equation that is the basis for scaling physiologic properties amongmammals is the power equation Y = aW, where Y is the physiologicvariable of interest, W is body weight, and log a is the y-intercept and b isthe slope obtained from the plot of log Y versus log W. Animalscommonly used in preclinical drug studies (i.e., mice, rats, rabbits,mnnkpws anri Hnnsl rin not eliminate druas at the same rate that
with physiologic properties that are well described among species, itseems reasonable to surmise that drug elimination can be scaledamong mammals. Analysis of drug pharmacokinetics in numerousspecies demonstrates that drug elimination among species is predictable and, in general, obeys the power equation Y = aWb. Early paperson interspecies pharmacokinetic scaling normalized the x- and y-axes toillustrate the superimposability of pharmacokinetic curves from differentspecies. More recently, the x- and y-axes have been left in the commonunits of concentration and time, and individual pharmacokinetic variables have been adjusted to predict pharmacokinetic profiles in anuntested species, usually humans.
Two approaches to interspecies phannacokinetic scalinghave emerged, an allometric approach and a physiologicapproach. In the allometric approach, pharmacokinetic profiles in several animal species are described by a pharmaco-l r i n o t i p m n r l o l f r n t n n fl r t m p n t fl l n r n n n c n m n a r t r n e n t a l ) . a n dthe pharmacokinetic parameters of the model are scaled byfV>rt nnmnr Qnnotinn V — nW" An ootimoto fnr onrh nhflrrt l f l .
cokinetic parameter in humans is obtained by solving eachnnwpr pmmrinn fnr 7fl ko- Tn this annrnarh. each soecies isviewed as a whole entity; no attempt is made to give
when organ size and organ function are studied as a functionof species body weight. Huxley1 demonstrated that plots oforgan size (Y) versus body weight (W) produce straight lines,on log-log paper. The equation for this straight line is log Yi= 6 log W + log a, where 6 is the slope and log a is'the y-,intercept. The antilog of this equation is the power equationY = aW6, and it has come to be known as the allometricequation.
Adolph2 compiled 33 equations which related quantitative
quantity (i.e., body weight) are related to one another, hproposed that mathematical interrelationships could be d«veloped that equate one physiologic property to another afollows:
Y - . = a - W 6 1 ( 1 )
Y 2 = a z W 6 2 ( 5
log W = (log Y-. - log aj/b!= ( l og Y2 - l og a2 ) / 62 ( '
log Yi = log ai + 61/62 dog Y2 - log ag)
Y-. = a-.(Y2/a2)6l/62
Suppose one needs to calculate urine output is a functio01 water mtaKe. using tne aata in muxe 1 iui-^iiuc uui(U) and water intake (I), one calculates IK= C-.46I0-93,'
constant for the output of urine to the exponential raco:means that the rate of urine production is less "than the ra
iffiff-infgjraifii-1^
is established by reducing the pharmacokinetics of a drug in g iled data on the weight of principal organs 6one animal species to physiologically, anatomically, and
, , , , j'. , other mammals (Fig. 1). All primate data fell on a straig.ae l i m i n a t i n g o r g a n s ; t i s s u e a n d f l u i d v o l u m e s ; b l o o d - t o - p l a s - , . . * . , . , r „ . . , : ,«f-J*a»i«J:lii>i-f:lulQjl(lf-4-:-JiJ»):M*l.,/M'*W'KB:itl^^^:j#i<^*a^
Jl*a**>*a1[IKW"J|VA'i
physiologic parameter in humans is then substituted into the
ics of the drug in humans is thus obtained.
mmimmmmmmimmmmtion among species, to predict drug disposition in an untestedspecies, to define pharmacokinetic equivalence in variousspecies, and to design dosage regimens for experimentalanimal models.
Physiologic Basis for Pharmacokinetic ScalingDespite obvious differences in outward appearance, most
land mammals have similar anatomy, physiology, biochemis-
Physical similarity, in the engineering sense, is dv
criteria of similarity which are obtained by forming qi
renal blood flow/cardiac output x 100= 43.06Wo:77/166W0'79 x 100 = 25.9%
where the units of renal blood flow and cardiac outputmilliliters per minute and that of weight is kilograms. Trelationship reveals that renal blood flow is approximsone-quarter of cardiac output regardless of mammali
1028 /Journal of Pharmaceutical SciencesVol. 75, No. 11, November 1986 0022-3549/86/1100-1028^1.0C
© 1986, American Pharmace'uticarAssocieth

.aq; (3) pus .j9;bm Apoq jb;o; o; [Bnb9 uoi;nqu;sipia b SuiumssB Aq p9;BjnojBO aq pjnoo 9oubjb9jo9;9uiBJBd pa^iodoa Ajuo aq; sbm ojij-jjBq qoiqM joj
■Buiusaqnd tunuaid 0861 iq6uAdoQ -g jaj uiojj uois
uoipunj e se sieuiuieui ut mou pooiq opedaq pue }q6iaM JdAn—Z 3JnBy
(*» . ) 1H0I3M A0080 0 0 1 O O S 0 0 2 O O I O S 0 2 0 1 S 2 I S 2 I s o 2 0 1 0
■ooueps p luaui-ooubapv am jo/ uoiiejoossy ueouauiy qq61 iq6uAdoo £iaj uioif uois-siuuad ifljM patuuday ■aiqeqsinBuiisipw ///eo/'s/je's aie sauij aieuiudpue ueneuiuieLu aq± 'fy 001 o; 6 ot- luoji iq6idM ut 6ui6ueJ saimuudIZZ uo paseq auij pauu ///eo/'s/'e-s e st aui) pausep aq± -(zg f&i)bBuw ia6ie\ jo jaajs 0} asnoui aqi ui sieuiujeui joj uoyenba uogojpejdoutauione aq) s,uasajdaj aun ptjos aq± -pauieu ateuiud ;o puiy qoeajoj sazjs Apoq io aBuej a/qejapisuoo e apn/out pue 'sieuiiue fo spuy ;ou'efep{0 sjoqine A}i)uapt siuiod aq± •sajeuiud ut S)q6taM ueaH—I a'n6|-j
!&».) SSVW X008
1 0 1 0 0
(lt-61)•»u||'M PUO P<ouu»x . o
Of6l)'*J''"'0 Pub »1'"D •(S26I) o io i |p<H t
( t96 l ) l0 iauupuJ ' i»w - '(S96I) 3.k»»ux o
(5961) 10 |* «joui|Ow
. / O I I . J O Q , . a W I S j ■( * > » « - • -
/(St-61- ' o>g)»|oujujoi«(:»in|OH
atoH 6*SJ 'I6) W
si poojq aq; ui uoi;objj punoqun oq; (p) ioouBJBap dibojo uoi;Buiuuo;ap 9;bjuoob ;iujj9d o; sb os o&ibj 'K\-ujns si 9oubjb9jo oi;Bd9q puB mou poojq opBdoq U99aouaaajjip aq; (o) :sasop jsnsn ui soi;9ui3j j9pjo-;sju-ipui b;bp 8{qBTi;BAB ijb (?) IsaiqBUBA Suipunojuoo aonp
Suimojjoj aq; aoj uoi;b3i;s8aui siq; joj 9uuAdi;uB pi-as an s93UB;sqns p9J9;smiuipB AjsnouoSoxg j9;jb o; .oq; jo A;ijiqB oq; jo 9jnsB9in b sb 9AJ9S pjnoo ;sq; punoc'b pgpgjgs umBqugxog 'uoipunj joaij ajBduioo oj, *;qJaaAH J° x-S-l-t-Uiui.q gx~ sbm saioads jib ui moji j?oi;Bdaq 'AjjBuoi^ppv B;Bp asaq; Suiquosap ioj uoi;.aaMod aq; jo ssaua;BudojddB aq; 2ui;Bj;suouiap ?(g ■sauii ;qSr.Bj;s paonpojd ;qSiaM Apoq snsjaA mou poojq iqa;q3iaM aaAij jo s;ojd Soj-Soq -Moy poojq oi;Bdeq pire ;qJJ8AIJ ui suoi;buba sapadsja;ui paipn;s granBquax(
uoi;Bnba aq; uiojj pa;Buiuiija si puB A;iun uiojj ;uajAj;uBogiu§is ;ou si '6roAV/iroA\ 'ssbui jBnpisaj auj^ >
M 'IM6|9M Apog0 z i^i ujoj
lE iMs-OL x 6 '€66o msloo
*.80Mt._Ol x I8ooMe-0l. x j ."8
ego M 009 Z10J./IA c-OL x 2*g
6 'iq6!a/v\ uiqo|Bp6 'mDi9A\ uiqoiBou.6 'jqfyaM aujojqoo*
ujo 'epsndjoo |euaj jajsuj_jequjnu Bjgd
-]uj-"euiniOA (BsnoauBH?
es o M SSOOw o M Z W O
woM -a-01. x SLze -oMe-OL x l ' los oM „-0l x 2"2
ioo M Z80"066'OMWIO'O
86-oMe-Ol x 9"9i0 M 1-800
ssoM ZIZO'O
pasauiisajui. pue qoBuii
AjejinS|BU9.J
f S P ' ° a• s6i
JJB
6 'ii ;6i9M jueujueci
wo M 9-01 x U' l k|/6 'jnjins jo jn
6-0*9-01 X 60' rzroMs-OI- x S't>q e / o M s - 0 1 x V I
jndjno ue6oj}!u euiuijBS(jndjno snou96opue) uaBoj
(indmo |bjoi) ue6ojy/6 'ueBoJi-iu p m
ie 'oMs-01 x e"6B2-oMs-Ol x z>, 2 o M 5 - o l x e n
uojiBjnp jseq uuotjBjnp qjB€
UOjlBjnp JB9Q1JB. q 'spoued ojBopj
os o M i7 S680 M WZ69 0 M Z'V
zz-o M t-Z-12/ o M 6S- L
ejBjndcJSBJDC
euiui jeeu!lee
q/lUJ '90UBJ
zzo MECvzi-o M 88
S90!|S jaIBS
M/dlS I*--* 'uoijdiunsuc
wo M 021-28 o M WOOO
ss-o M lO'O
eiBJ uo!JB|i]Up d j n o e t j
j e j B M p a j - B
,uoijBnb3 ou}9ujo||v
qquj !S9}BJ OlSopi
jgjeiLre jed oiBopisAyd
»s|biuiubw Buouie s:qApog quM saiVJddoJd 0|Bo|0|sAqd 6ui)eptl suotisnb;

function of body weight on log-log coordinates, the data forall species except humans fell on a straight line (Fig. 3).Boxenbaum concluded that the 7-fold difference betweenexpected antipyrine clearance and reported antipyrine clearance for humans made them unique in that they "lacked thequantitative capacities of other mammalian species," a statement which has not been widely accepted.6 When the datawere replotted as unbound antipyrine intrinsic clearance permaximum lifespan potential (L/MLP) versus body weight onlog-log coordinates (Fig. 4), superposition ofthe pharmacokinetic data from the different species was achieved.7 Yatesand Kugler8 have presented an alternate hypothesis toexplain why data for humans sometimes appear as outlyingdata points on simple allometric plots, specifically, the phenomena of neoteny. The effects of neoteny are manifest inboth brain mass and lifespan. As a result of scaling antipyrine intrinsic clearance of unbound drug across species, usingmaximum lifespan potential7 or brain weight,9 the antipyrine data for humans were brought more closely in line withthat of the other mammals.
For more information on the use of allometry in thebiological sciences, the reader is referred to texts on interspecies scaling.610-12
Similarities in PharmacokineticsSmall mammals can be regarded as true physical models of
large mammals (in the engineering sense ofthe term), and aformal scheme to describe drug concentration might besuitable for either. Dedrick et al.13 demonstrated that drugconcentrations in several laboratory animals could be correlated as a function of dose and body weight. They plottedmethotrexate plasma (or serum) concentrations from mice,rats, monkeys, dogs, and humans on one semilogarithmicplot (Fig. 5a). The pharmacokinetic profiles for the different
P i g - /
2 0
10r = 0.989
p < 0.01
G o o t / f * M o n
/ S h e e pD o g /
s M o n k e y /
2 2— i
sRabbit %X
■/
- . 2s
d .1 /•c= 0 5 - / • G u i n e a P i g « i n *
f C L u m , = ( 0 . 3 3 1 x J O ) B
« 0 2 h /R a t ( l i t e r s p e r M L P )
01 Mouja1/
.005 / .002 ■ ... / - '■'■
- «- ■ ■ J- ^, 1 . 2 . 5 1 2 5 1 0 2 0 5 0 1 0 0 2 0 0
B o d y W e i g h t , B ( k g ) Y > * - » . „
Figure 4—Allometric relationship between intrinsic clearance of rbound antipyrine per maximum lifespan potential (MLP) and beweight. Reprinted with permission from ref 7. Copyright 1982 Plenut.Publishing Corp.
CL .. * 00483 B + 000335
CL ..■ 008I6 B
C L • 0 0 8 I 6
0 0 0 1 I 1 ' 1 L I I I I I I I I ' l l0 1 0 2 0 5 I 2 5 1 2 5 1 0 2 0 5 0 1 0 0 2 0 0 5 0 0 1 0 0 0
BOOY WEIGHT (kg)
Figure 3—Antipyrine intrinsic clearance in mammals as a function ofbody weight. Dashed line is the least-squares fit of nonlogarithmicallytransformed data weighted by the factor 1/y2. The solid line is from theequation fitted using the method of least squares on unweighted,logarithmically transformed data. Reprinted with permission from ref 5.Copyright 1980 Plenum Publishing Corp.
gation ofthe underlying relationships in methotrexate pmacokinetics, the half-life of methotrexate in each sp*was plotted as a function of body weight on log-log ecunates (Fig. 6). The slope of the graph was 0.2 (i.e.,exponent of W), which is in reasonable agreement with ivalue of 0.25 chosen empirically.
These authors were the first to recommend the use"equivalent time" in the analysis of pharmacokinetic diobtained from different species. They suggested that cbelimination could be correlated between species if one uian intrinsic biological property (creatinine clearance, blicirculation velocity, or mean residence time of blood comnents in the vascular system) as anv equivalent time-scalifactor. This approach is advisable for dynamic systemscause similarity in these systems does not occur as 1comparison of simultaneous events. Instead, two dynansystems are similar at corresponding (but different) instantof time.15 In other words, two species obeying the saidynamics of drug elimination are in a similar temporal staat equal instances of intrinsic (biologic) time even though/ievents appear to transpire at unequal rates when measurwith an extrinsic (chronological) time scale.
Boxenbaum7 used data from the same sources as Dedriet al.13 to calculate the methotrexate plasma .clears(CLmtx) and volume of distribution (Vdj in five spedWhen these pharmacokinetic parameters were plotted aafunction of species body weight on log-log coordinates, bowere linearly related to body weight. Boxenbaum dstrated the use of engineering dimensional analysis by f<ing a quotient between the allometric equation for methc
1030 /Journal of Pharmaceutical SciencesVol. 75, No. 11, November 1986

\ v \ ^ " \ * -
< . v f t N V \ ^ " * -
x \ xX V \£ 2 0.081
1 0 0 1 5 0 2 0 0 2 5 0 3 0 0 3 5 0 4 0 0 4 5 0TIME AFTER INJECTION, min
DIMENSIONLESS TIME (equivalent to minutes in Mon )2 0 0 4 0 0 6 0 0 8 0 0 1 0 0 0H , 1 1 H '
0 1 0 2 0 3 0 4 0TIME/ (body weight)''**, min/g,/«
Figure 5—-Plasma (or serum) concentrations of methotrexate in the mouse ( ), rat ( ), monkey ( ), dog ( ), and human ( )after rv or ip injection (the symbols refer to dil °rent dose levels and routes of administration): (a) semilogarithmic plots of methotrexate concentrationversus time and (b) semilogarithmic plot ob ined after normalization of the axes. From ref 13.
trexate clearance (CLMtx) and the allometric equation forcreatinine clearance (CLCr) as follows: Vd/TBW = 0.859W°-918/0.703W0-963
= 1 . 2 2 W - 0 0 4 5 = 1 . 2 2 ( 8 )QWCLc, = 10.9W-/8.2W- = 1.33 (7) where yd ^ TBW „ .„ ^ ^ w., h ^^ ^
'here clearance is in milliliters per minute and W is in analysis suggests that methotrexate Vd is 1.22 times larger_ ilograms.Thus, CZ-mtx is 1.33CLC„ and this relationship is than tota.1 bo(?v water in all species. The residual massindependent of species and species size. In a sense, all species exponent in this calculation (-0.045) is small and essentiallyare alike, excreting methotrexate from their bodies at a rate zero' indicating that body weight has little or no effect on this
rwhich correlates with their physiology. Similar analysis was ratio-[performed for methotrexate volume of distribution (Vd) andtotal body water (TBW) as follows. Kallynochrons, Apolysichrons, Dienetichrons,
Syndesichrons, and the Concept of, 0 0 0 r P h a r m a c o k i n e t i c T i m e
Smaller, short-lived animals generally clear drugs from* t h e . i r b o d i e s m o r e r a p i d l y ( c h r o n o l o g i c a l t i m e ) p e r u n i t b o d yI w e i g h t t h a n l a r g e r , l o n g - l i v e d a n i m a l s . W h e n d r u g r e m o v a l? I 0 0 - ^ — — — * ~ 1 S m e a s u r e d a c c o r d i n g t o e a c h s p e c i e s ' o w n i n t e r n a l ( b i o l o g i -| ^ c a l ) c l o c k , a n i m a l s t e n d t o c l e a r d r u g s a t a s i m i l a r p a c e . 7I ^ ■ E a c h s p e c i e s i s e n d o w e d w i t h a d i s t i n c t i v e p h a r m a c o k i n e t i c
J ^ — — - . c l o c k i n a c c o r d w i t h i t s o w n p a r t i c u l a r i d e a l s p a c e - t i m econtinuum. Since pharmacokinetic and physiologic eventsI a r e c o r r e l a t e d w i t h b o d y w e i g h t , i t i s p o s s i b l e t o u s e b o d y[ , 0 " w e i e h t a s p a r t o f a c o o r d i n a t e s y s t e m o n w h i c h t o b a s e a t i m e? f u n c t i o n .
Consider antipyrine elimination in the human and the dog(Fig. 7a) The dog clears antipyrine 9 times faster than thehuman. The allometric equation for antipyrine clearance in
> * - ' -■ ^ j t h l s e x a m p l e i s C L = 7 7 . 1 W - 0 1 5 . B o x e n b a u m a n d R o n f e l d "1000
BOOY WEIGHT , g
SSiSSSSSSSSSSSISSS- 2—SHSirJournal of Pharmaceutical Sciences /1031

Human Dose =10 mg/kg
076« i , , , ,—-0009581c = 9 . 8 i e " ' " " + 1 6 . i e
"v.n- 723 min
10 C L = S 9 m / m i n / l c o ^ —*— l — . j t mi / min / i. cj
.4
Vi =.386 l/kg Vp =.616 l/kg Vss=.612 l/kg
.3
.2•^ a > . D o g D o s e = 0 . 1 m g / k g
.1 ■ V,. c = .06i5e "9* + .\s7e00t7i'07
05 ^ ^ * ! ^ f y , p = 7 9 . 2 m i n.0403 \ ^ S ^ > * 1 _ C L = 5 . 5 m l / m i n / k g.02 V , = . 4 5 8 l / k g ^ S V .
.01 V B = . 6 2 9 l / k g ^ \ ^007 V s s = . 6 2 0 l / k g ^ s .005004
• ***
D0ia = 0 1 mU/kgV, =0 4581/1.9
Vp = 0 629 l/kgV „ = 0 6 2 0 l / k g
Dot* = 10 mg/kgV, =0386l/kg
Vg= 0.616 l/kgVss = 0 612 l/kg
Cl= 5 5ml/min/kg Cl = 0 59 ml/.
n) l/j(= 79.2 min (dog)
Time (min)
Figure 7—Antipyrine disposition in dogs and humans after rapid iv injection: (a) biexponential antipyrine concentration-time curves and (b)elementary Dedrick plot of antipyrine data illustrated in Fig. 7a. "Kallynochron": The first element of this neologism is taken from the word "Kallyno,"a transliteration of the classical Greek word meaning "to beautify, to look becoming, to make clean." The suffix "-chron" comes from "Cronus".("Kronos"), a word for the Greek God of time. As such, this neologism refers to the time required to clear drug from the body. Reprinted yrithp e r m i s s i o n f r o m r e f 1 6 . C o p y r i g h t 1 9 8 3 T h e A m e r i c a n P h y s i o l o g i c a l S o c i e t y . (
duced by normalizing the antipyrine data as follows: Theplasma concentrations were normalized by dividing eachconcentration by dose per unit body weight. And chronological time was transformed to pharmacokinetic time (kallynochrons) by dividing it by W115. Boxenbaum called thistransformation an elementary Dedrick plot in honor of Robert Dedrick's pioneering work in interspecies scaling. Whenviewed in this fashion, the antipyrine data were superimpos-able (Fig. 7b).
Similar transformation of chlordiazepoxide pharmacokinetic data obtained for a dog and a human did not producesuperimposable profiles, indicating that these data are ill-conditioned for such a plot (Fig. 8a). Further analysis revealed that the dog has a greater relative volume of distribu
tion than the human. To account for this difference, theallometric equation for volume of distribution (W058) neededto be included in the transformation of each- axis. Theinclusion of W068 in the transformation of the y-axis isstraightforward (i.e., plasma concentration/dose per W^58),For the transformation of the x-axis, Boxenbaum and Ron-feld16 introduced another unit of pharmacokinetic time, theapolysichron, which they defined as iVW6' " 6, in which b' and6 are the allometric exponents relating volume of distribution and clearance to body weight, respectively. In one apolysichron, species have eliminated the same fraction of drugfrom their bodies and have cleared the same volume ofplasma per kilogram b' of body weight. Obviously, the kallynochron and the apolysichron are equivalent when b' = 1 or
Dog - 10 5 kg
Dow =10 mg/kg
Hu non - 89 4 kg
Do *=0299 mg/kgV, =0 497 l/kg Vi 01851/kgV0 =0 762 l/kg Vo = 0330l/kg
Vss-0 714 l/kg V4V = 0 321 l/kg
Cl = 6S 5B°"° Cl - 6 5 5 B ° " °Cl = 43 9ml/min Cl 30 5ml/minCl = 4 IB ml/mm/kg Cl 0 34lml/m,n/k»
£ j? 7 ■
C0
□F
Is4
3
o "
0a0
ca\010 1a
07
OS
!■/, p = 1 Mesochron = 24.5 Apolysichrons
Cl = 65.5B-0"
V, =1.48B05<
Vp. =191B0<"VSS=1.72B063
O 1 0 J O 3 0 * 0 5 . 0 6 0 7 0
Apolysichrons (Tim«/B07S)
Dog Jim. (m,n)Dog lime (minj
4 0 0 l o o
Human Time (min)
^ ! ^ ^ ^ e ^ ^ ^ x S & 5 ? ^ ^ * £ * f f o f c h t o r d i a t e p o x i d e p l a s m *n e o l o g i s m i s f r o m t h e w o r d " a p o l y s i s / a t r a n s l i t e r a L o A / h ^ S ^ T h e f t r s t e l e m e n t o f t h irelease or deliverance from (a thing).". The suffi
1032 /Journal of Pharmaceutical SciencesVol. 75, No. 11, November 1986
tion is directly proportional tof weight. This double transformation, or complex Dedrick
ot, produced pharmacokinetic profiles that were superim->sable (Fig. 8b).Boxenbaum has defined two additional pharmacokineticlace-time continua: dienetichrons17 and syndesichrons.18lese units of pharmacokinetic space—time are similar to▶olysichrons except that maximum life potential (MLP,g. 9) and brain: weight (BW; Fig. 10) are incorporated ine scaling paradigms.
Interspecies Pharmacokinetic ScalingThe collapse of pharmacokinetic profiles from different
animal species into a unique species-independent profiledemonstrates the similarity of pharmacokinetics among species, introduces the concept of biologic (or equivalent) time ininterspecies pharmacokinetic comparisons, and provides thefoundation for interspecies pharmacokinetic scaling. Twoapproaches to interspecies pharmacokinetic scaling have
Eaerged, an allometric approach (based on the formulation oflometric equations which represent individual pharmaco-*iAtir nnrarno+orcA ariA O TiVi\-air«lnrrif» (nr »-a»liinfi«-i--.i'o4-\ o.-.
, rach (based on the scale-up of physiologic flow models).Allometric Approach
j The allometric approach to interspecies scaling is a black
the pharmacokinetic parameters. Frequently, there is noed to know the details of drug distribution in many tissues.
t is sufficient to know and be able to control the concentra-
002 • Human './,= 723 min B = 70kg
V *•■ Ral 1.4= 70 min B = 0.25 kg
.001 **"" ^ V ^ ^ ° S h e e p t ' / , = 1 5 6 m i n B = 5 0 k g
0007
0005
0002
0001
■^ " ^ > - ^ \
-y = 0 . 9 6 3 ^ " " " " " " ^ " " S ^ - a
X = 1 . 0 3 9 - - ^ ^ ^
— i i i i i i i1 0 2 0 3 0 4 0 m * n
Dienetichrons
Human Time (min)
Sheep Time (min)
Ral Time (min)
Figure 9—Semilogarithmic dienetichron plot for antipyrine disposition int*Ji:liNil^/iTitJiBBWIIiumiie^m:it-niun)m^miil,
neologism is from the word "dienec," a transliteration of the classicalGreek word meaning "continuous, unbroken." The suffix "-chron"comes from "Cronus" ("Kronos"), a word for the Greek God of time. Theprefix comes from the view that space experience and temporals e a u e n c e f o r m a n i n t p . n r a t p i i n n n t i n i i u m A r m r H i n n i n t h i e \ i i a i u t h oentire organism is merely a section of a certain magnitude from birth to_ , . . _ . , „ „ . . , „ i . n n m i i n a i i r n v f / u i v - u i i u i l ^ u - l i i y v i I C I n j . j I i c u i l l l l
permission from ref 17. Copyright 1983 Marcel Dekker, Inc.
& . 0 0 3_ •» r*
\ j » 0 0 2 -5 ft
I ^ L >— O O I
« 0005 . i
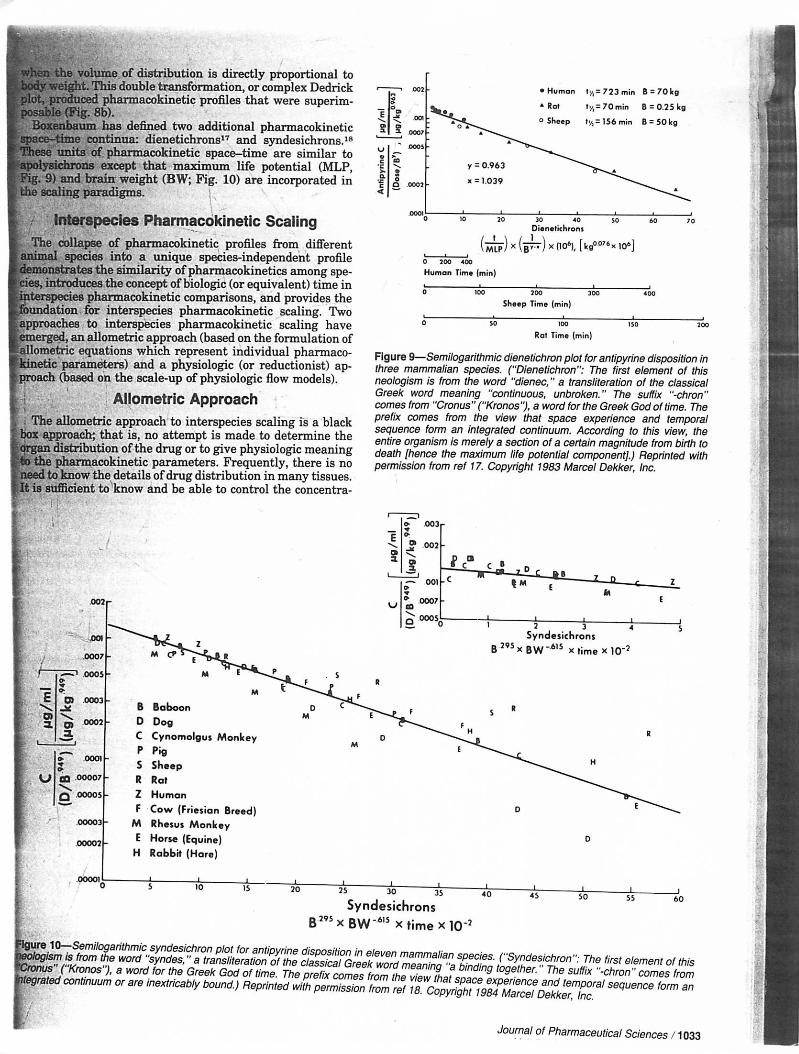
SyndesichronsB295xBW-6'5 x t ime xlO"2
. 0 ) 0 0 0 3*-*•*>
° » ' ^ 0 0 0 2
{J\ CQ .000071
Q .00005
B BaboonD D o gC Cynomolgus MonkeyP PigS SheepR RatZ H u m a nF Cow (Friesian Breed)
M Rhesus MonkeyE Horse (Equine)
H Rabbit (Hare)
c , . , - * J U 5 * . 6 0S y n d e s i c h r o n sB 2 9 5 x B W - 6 , s x t i m e x l O 2
BP /"fc-r^n^o-i Si 'ZS' J transllter3tion of the classical Greek word mea,
Journal of Pharmaceutical Sciences /1033

tion of drug in the plasma. In these instances, the allometricapproach is the method of choice and can be applied to thedata, provided that the pharmacokinetics are first order ineach species, the percentage of protein binding is similar andlinear over the concentration range of interest, the elimination processes are physical (i.e., renal or biliary), and enoughdata are available for satisfactory linear regressions.
Numerous examples in the literature demonstrate thesuitability of the allometric equation for predicting pharmacokinetic parameters in humans. Sawada et al.19 predictedtotal body clearance, renal clearance, hepatic clearance,volume of distribution, intrinsic clearance of unbound drug,volume of distribution of unbound drug, and eliminationhalf-life for six /3-lactam antibiotics in humans. Data frommice, rats, rabbits, dogs, and monkeys were used in theextrapolations. Discrepancies between the observed and predicted values for volume of distribution and hepatic clearance were attributed to differences in the plasma-free fraction in each species and uncertain hepatic clearance (theobserved hepatic clearance was calculated as the differencebetween plasma clearance and renal clearance, and it mayhave included some extrahepatic metabolism).
Sawada et al.20 investigated the effect of species differencesin the extent of protein binding of 10 basic drugs on theapparent volume of distribution (after distribution equilibrium) and the ratio of distributive tissue volume to unboundfraction in the tissue (VT/fuT). Small differences in tissuedistribution of the drugs between animals and humans weredetected, suggesting that uptake by the tissues and bindingto tissue components did not display significant interspeciesvariation. Despite this similarity in the tissues, it was notpossible to predict volume of distribution in humans from theanimal data unless the plasma-free fraction was included inthe analysis. Interspecies differences in binding to plasmaproteins were variable and appeared to coincide with thevariable distribution of binding constituents in plasma (i.e.,albumin, ax-acid glycoprotein, and ^-lipoprotein).
The postdistribution half-lives (ty2) of 10 cephalosporinand 2 monobactam antibiotics in humans were predictedfrom data obtained from mice, rats, rabbits, monkeys, anddogs.21 This forecasting was accomplished with the allometric equation tyz = aWb (Fig. 11). Only one antibiotic,
Observed( t r o n g e ) -
cefotetan, did not scale well among the smaller animalshumans. The disparity between the predicted and observhalf-life values for cefotetan may be the result of tlantibiotic's existence in tautomeric forms.
The allometric equation was used to establish an empiricrelationship between the pharmacokinetic parameters 'macrolide antibiotics (erythromycin, oleandomycin, and tylsin) and body weight.22 Despite agreement between t"observed and predicted human pharmacokinetic values fi.erythromycin and oleandomycin, the allometric model dinot discriminate between the pharmacokinetics of these twantibiotics in humans. For some compounds, the usefulneaof the allometric relationship may reside in predictin,whether large interspecies differences in animal pharmacckinetics will translate to meaningful differences in humans
Another area in which the allometric equation may proij|valuable is the prediction of toxicologic endpoints. Althouglimited data are available, log-log plots of minimally^ toxidose (lethal dose in 10% of small animals and maximuitolerated dose in large animals) versus weight for mananticancer agents are linear, meaning that these data aiwell described by the allometric equation23 (Fig. 12). Igeneral, small animals require larger doses to approximatthe lethal dose in humans. If toxicity is due to a metabolitithe converse may be true24; however, without some inform'tion about the bioactivation and degradation process in eacspecies, it is more difficult to extrapolate toxicity data f(compounds that undergo metabo l ism. |
The allometric approach can be used to predict entiipharmacokinetic profiles for humans from animal datiThese predictions are obtained as follows:
1. Determine discrete pharmacokinetic parameters fcthe drug in young adult animals of four or mcaspecies (compartmental or noncompartmental metlods can be used).
2. Perform linear regression analysis on the relatioiship log pharmacokinetic parameter versus log, we;gito obtain allometric equations for each parameter .(.necessary, longevity, brain weight, or other signifcant physiologic parameters can be incorporated intthe regression).
3. Solve each allometric equation for the average younadult human, that is, substitute 70 kg for weight ipredict average pharmacokinetic parameters. ■'-
4. Use the predicted pharmacokinetic parameters twrite pharmacokinetic equations for drug dispositioin humans.
5. Check the prediction by administering the drug tyoung adult humans or obtain experimental datfrom the literature.
Swabb and Bonner25 used a one-compartment model an
MAXIMUM TOLERATED DOSE
BODY WEIGHT (kg)
Figure 11—Log-log plot of half-life versus body weight for ceftizoxime.The solid circles represent the values reported in the literature for eachspecies. The solid line is the least-squares linear regression line for theanimals, excluding humans. The prediction for antibiotic half-life in
bars represent the range of values from the literature. Numbers in
from ref 21. Copyright 1985 American Society for Microbiology.
f o>c oj 1oE
Swiss mouse
Weight (kg)
ttlUlmtha / lM3a8//7K- Wff»aaT>'«ra*a*f«Jl
l l f f r ' f f . ' f " !
) LD10; (■) maximum tolerated dose. Reprinted with permission froVlti'JltillimKI.l^±Ttit:lit»KliM2ikUtik7s!:iViilttWLlAJJ^uT\TWFl>.
from ref 53.
1034 /Journal of Pharmaceutical SciencesVol. 75, No. 11, November 1986

Dose Pred ic led ObservedCEFTIZOXIME, 4 GRAM I.V. INFUSION
1000 hundf Infuaio
Time, hr
| centrations for aztreonam given as 500- and 1000-mg iv infusions over 3mm io neanny mate suujttuis. vettuos aiv means iui mu yiuuLia uiI subjects. Reprinted with permission from ref 25. Copyright 1983 Plenum■ Publishing Corp.
data from four species to predict aztreonam pharmacokinetics-in humans (Fig. 13). These predictions were helpful inchoosing doses and serum sampling times for the first kineticstudy in healthy male volunteers and agreed well withsubsequently measured concentrations in humans.
Mordenti26 used three methods of pharmacokinetic scalingand data from mice, rats, monkeys, and dogs to predictbiexponential disposition profiles for ceftizoxime in humans.Method I scaled the coefficients (A,B) and exponents (a,/3) ofthe biexponential equation from each species; Method IIscaled the microconstants (ki2, k2\, k\$) and volume of distribution (Vdi) from the two-compartment model; and MethodHI scaled' volume of distribution (Vd*., Vdss, Vdarea) andclearance. Irrespective of the method chosen to produce thebiexponential equations, there was close agreement between
CHRONOLOGICAL CLOCK
TIME (hours)
Figure 14—Comparison between predicted and observed serum concentrations for ceftizoxime given as a 4-g, 30-min iv infusion to healthymale subjects. Key: ( ) Method I; ( ) Method II; ( ) Method
from ref 26. Copyright 1985 American Pharmaceutical Assoc.
the predicted concentrations of ceftizoxime in human serumand the concentrations in serum reported in the literature(Fig. 14). This finding is important because it means that thepharmaceutical scientist is at liberty to choose any method ofpharmacokinetic m< :eling and still obtain reasonable estimates in humans w.th che allometric approach.
Dimensionless criteria of similarity are obtained from theceftizoxime data by allometric cancellation as follows:
ceftizoxime half-life/time for heartbeat= 30.1Wa248/4.15 x 10"3W0'25 = 7253 (!
where ceftizoxime half-life and time for heartbeat are measured in minutes. In other words, 50% of a dose of ceftizoximeis eliminated in -7,300 heartbeats, regardless of animal
BIOLOGICAL CLOCK
human'dog
monkeyra t
humandog
monkey
CeftizoximeHalf-Life(Minutes)
CeftizoximeHalf-Life
(Heartbeats)
Society for Microbiology.
Journal of Pharmaceutical Sciences /1035\ / r s l 7 / - M r s 11 M r s s e c s r r s h r s r 1 0 Q £

species. This quantity, -7300 heartbeats, represents a unitof interspecies equivalent time. To forecast each half-life ofceftizoxime in other animal species, multiply the time for oneheartbeat (in minutes) by 7300. The similarity in ceftizoximehalf-life in different animal species is not apparent when thereference time is extrinsic, chronological time (minutes; Fig.15a); however, the similarity is apparent when the referencetime is intrinsic, biologic time (heartbeats; Fig. 15b).
Physiologic ApproachThe physiologic approach is based on physiologic flow
• i i w u > ~ i o " i i i v . i i a i c o u a i u i u i t i u i v , c " - * V o i \ J l \ l g l \ . a i i y , C U 1 U U i U -
chemically correct.27-29 One must consider blood flow to
binding; and enzyme kinetics. The models are drawn as a
connected via the circulatory system as in the body (Fig. 16).
-x Blood flow
The complexity of the scheme depends on the pattern of ddistribution, available data, and the insight ofthe investigator. The mathematical pharmacokinetic model is obtained bywriting mass balance equations for the sum of the processesoccurring in each compartment, and the resultant differential equations are solved simultaneously. Once the pharmacokinetics of the drug are defined in one animal species,predictions for humans are obtained by replacing the valuesfor the physiological, anatomical, and biochemical parame--ters of the test species with the values for correspondingparameters of humans. These values can be obtained from4 . 1 l ' A J - J - J * J C * _ _ ' _ •■_ _ _ _ / ' • •estim
The physiologic approach is the method of choice when the
Figure 16—Schematic of a physiologic flow model.
Table II—Physiologic Parameters"
P a r a m e t e r M o u s e Hamster
netic data can be obtained from only one animal species.In formulation of a physiologic flow model for species fo:
which few physiologic data are known, allometric relationships can be used to provide reasonable estimates of thesedata. In an illustration of this concept, physiologic parameters for seven animal species, representing a IO3 range ofweights, were taken from the literature27 (Table II). Allometric equations were fitted to the physiologic data by using t hemethod of least squares on unweighted, logarithmicallytransformed data (Table III). In all cases, statistically significant associations were obtained. Predictions of theae physio*logic parameters in an unlisted species can be obtained bysubstituting the weight of the unlisted species into theallometric equation. Allometric equations for tissue volumeBand flow rates can be incorporated directly into the flowmodel.
Physiologic flow models are developed in laboratory animals, then scaled up (in the engineering sense) to makea priori predictions of drug disposition in humans. Theanticancer agent methotrexate has been the most extensively studied drug, and details of the development of the physiologic model for methotrexate can be found in major reviewarticles.27-29 The physiologic model for methotrexate is mul-ticompartmental and includes linear protein binding, strong,saturable protein binding, and enterohepatic circulation.;
Monkey HumanBody weight, g 22 150 500 2330Compartment volumes, mL
Plasma 1.0 6.48 19.6 70Muscle 10 245 1350Kidney 0.34 1.36 3.65 15Liver 1.3 6.89 19.55 100Gut 1.5 12.23 11.25 120Gut lumen 1.5 8.8Heart 0.095 0.63
0.740.54
1.152.11.3
Lungs 0.126
•4 T
Spleen 0.1171Marrow 0.6 47
Plasma flow rate, mL/minPlasmaMuscleKidney
4.380.50.8
40.34
5.27
84.622.412.8
520155flflLiver
GutHeartLungsSpleenMarrow
1.10.90.284.380.050.17
6.55.30.14
28.40.25
4.714.61.62.250.95
17711116
5209.0■i ■«
a Data from ref 27.
500- 3000!5530 .-35000'K l ! a l 280480 1350480 2100-■ — 2100120 300120 —36 160
120 1400
512 3670138 42090 70060 80081.5 70060 150-
512 —13.5 24020 120
1036 / Journal of Pharmaceutical SciencesVol. 75, No. 11, November 1986

t o «c ? S | l_ CD co a
METHOTREXATE, --g/g
i m i m t m
I 8 I' 8 | 3 ;2L B- i
5 i t * j ' - » ' t ' ;{Dp EJ. Q- ▶*--*™~* i-*• i**"I ifa »-- ,
3 C D
1"1
•
;:■
1 -o £ro°J 5=
Ol CO CO KJ-4 co en -*•
1 .-* *«• o N
r o u r o m p o i u r j i pU Q - ^ ' - - b b ( * l ( D C O( O ^ U C O U K D O O U-r^ en co co co ro co ro
•-*. -»•-' -» ro en co j».o j c o p c o p ^ c o p - v j c omcoco-->jJ».co----^--g--go c D c o c o c n c n r o c o c n o )
S, o' 3 aq
METHOTREXATE, u,g/ml
3r;cD o s-cd- * j 3 - ^ < » C o - a .CO S. cB CU S-. -^!*3 2 co =■ ,3 I] _ ^ C D ^ C Q |
METHOTREXATE. Mg/g
O O ' o »
alffiSa-», - • r- _ O CD
Q. ?\ tu OJ
o» -»*■ ?i i OO CO 'O ~°>o
I ooati- t> 1' /
O CD co 3*3 -^ CD CD

equivalent time between species by viewing the methotrexate plasma concentrations for mice and stingrays in twoways. When the time scale (x-axis) was an extrinsic timescale (minutes), the concentration profiles appeared dissimilar (Fig. 18a). When the time scale was made proportional tothe blood circulation velocity for each species, the concentration profiles were superimposable (Fig. 18b). These figuresemphasize the importance of using intrinsic clocks for measuring pharmacokinetic events.
For drugs that are metabolized, physiologic models can becombined with in vitro estimates of intrinsic clearance33 or invitro estimates of enzyme activity (Vmax and Km) to obtainreasonable estimates of drug disposition in different species.The anticancer drug cytarabine hydrochloride (Ara-C) isconverted to uracil arabinoside (Ara-U) by pyrimidine nucleoside deaminase. This enzyme is distributed differently ineach species, and it is highly variable in kinetic characteristics (Vmax and Km). A physiologic model for Ara-C dispositionwas developed for humans by using in vitro values forenzyme activity and Michaelis constants.34 The model predicted the plasma concentrations of Ara-C and Ara-U inhumans after a single intravenous dose of the parent compound (Fig. 19). Using enzyme kinetics determined in vitro,this model was extended to mice, monkeys, and dogs toproduce accurate pharmacokinetic profiles for each species.35The model was then expanded for the mouse to include theintracellular metabolism ofthe drug to the active metabolite,arabinoside cytosine triphosphate.36 The variable distributionand kinetic activities of the deaminase enzymes make directscale-up of Ara-C among species difficult unless in vitro dataare available for each tissue.
The anticancer agent ds-dichlorodiammineplatinum (cis-platin) binds irreversibly to low molecular weight nucleo-philes and macromolecules to form mobile and fixed metabolites at rates which are tissue specific. Biochemically, cis-
O 2 0 4 0 6 0 8 0 1 0 0 1 2 0 1 4 0TIME (minules)
Figure 19—Prediction of cytarabine (Ara-C) and uracil arabinoside(Ara-U) plasma concentrations in humans, using a physiologic modelthat included in vitro values for enzyme activity and Michaelis-Menten
dichlorodiammineplatinum is an unusual di*ug becauserates of its biotransformation do not appear to be enzymacally mediated. A physiologic flow model for the dispositioof cis-dichlorodiammineplatinum and its biotransformationproducts was developed for female rats bearing Walker 256carcinoma.37 The model was scaled up to rabbits, dogs, andhumans by using an interesting set of assumptions, approximations, in vitro estimations, and allometric extrapolationsto provide the necessary biochemical and physiologic parameters.38 Accurate predictions ofthe plasma concentrations, ofcis-dichlorodiammineplatinum, the total filterable platinum,and the total platinum in humans were obtained (Fig. 20).
Ethoxybenzamide is oxidized to salicylamide primarily byliver microsomal enzymes. A good correlation between invitro and in vivo drug metabolism rates has been demonstrated . for the rat.39 The physiologic flow model forethoxybenzamide in the rat was successfully scaled up for therabbit40 by incorporating the in vitro Michaelis-Mentenconstants for ethoxybenzamide de-ethylation into the model(Fig. 21).
The metabolism of diazepam in various rat tissues wasdetermined in vitro using microsomal fractions from eachtissue.41 The resultant values were incorporated into a physiologic flow model and used to predict diazepam pharmacokinetics in a 10-compartment physiologic rat model. When themodel was scaled up to humans by using literature values forthe metabolism of diazepam in humans, an accurate assessment of diazepam plasma disposition was obtained.-4.2
Other examples ofthe successful scale-up of animal physiologic models to humans include digoxin (rat to dog to human),43 doxorubicin (rabbit to human),44-45 lidocaine (monkey to human),46 mercaptopurine (rat to human),*7 pentazocine (rabbit to human),48 and hexobarbital, phenytoin,phenobarbital, and quinidine (rat to human).49 Scale-up of
u 0 . 8o
TIME HOURS
Figure 20— Prediction of cisplatin (DDP), total filterable platinum (totalfilterable Pt), and total platinum (total Pt) in humans fnllnwihn sn iv/*«■«■
[}fflMM!\Wtmmlffiiwith permis Was Wmmmmmmm i. Reprinted with.
1038 / Journal of Pharmaceutical SciencesVol. 75, No. 11, November 1986

100.0ATD=4.33 B-°A12
*U I(r=0.985)
monkeyrabbit
w . 3 0 6 0 9 0 1 2 0TIME,min
Figure 21—Prediction of ethoxybenzamide plasma concentrations inrabbits based on scale-up of a rat physiologic model. The symbolsmnmsnnt ohsfin/fid snnim concentrations fnllnwino iv doses of 10mg/kg (O), 20 mg/kg (■), and 80 mg/kg (•). Reprinted with permissionfrom ref 40. Copyright 1982 Plenum Publishing Corp.
pam was not successful (rat to human).49i
Oral Drug Administrationi Although the prediction of intravenous pharmacokineticshas been successful, predicting the plasma concentrationcurves for humans after oral dosing is more difficult. Oneapplication of interspecies scaling that may prove useful fororally administered drugs is the estimation of the apparentthreshold dose, that is, the dose of a high extraction ratiodrug necessary to saturate elimination pathways, allowingdrug to reach the systemic circulation. This application isillustrated by nipradilol, an antihypertensive and antianginal agent. Nipradilol is metabolized by different mechanisms and to different extents in the rat, rabbit, monkey, anddog.60 In spite of complete absorption of orally administereddoses, first-pass metabolism leads to low bioavailability, andthfi svstftmic* availahilitv fnr all snppips inrrsasoe wif-V» rlnooMarked species difference is seen in the apparent thresholddose, with the larger animals requiring smaller doses tosaturate presystemic drug metabolizing enzymes (Fig. 22).The apparent threshold dose (ATD) of nipradilol relates tospecies body weight (B) as follows: ATD (mg/kg) =4.33B-0472.
Protein BindingAlthough binding to plasma proteins seems unpredictable
across species, interspecies scaling ofthe extent of camptoth-
cally determined plasma protein fraction concentrations asindependent variables.51 Data from 24 species were used toproduce the equation that describes the percent of camptoth-ecin which is unbound in plasma [fu(%)]. This equation iswritten as follows:
log fu (%) = 2.12 + 0.0628 log (a{) + 0.895 log (a2)- 3.30 log (albumin) - 0.651 log (albumin) log (ax)- 1.93 log (albumin) log (a2) (1())
where albumin, a-, and a2 refer to albumin, a--globulin, anda2-globulin protein fraction concentrations (g/100 mL), re-
Body weight, B (kg)Figure 22—Apparent threshold dose (ATD) of nipradilol in mammals as
Copyright 1985 Pharmaceutical Society of Japan.
spectively. The B- and y-globulin concentration terms did notaigim-uani-iy uu'imuuLt: lu explaining tne variance Ol tnedependent variable and were not included in the equation.Equations such as this one may prove helpful when proteinbinding has a significant impact on interspecies pharmacokinetic scaling.
ConclusionsAnimal data may be used to predict pharmacokinetic and
toxicologic endpoints in humans. Two approaches are presented in this paper: the allometric approach and the physiologic approach. The approach that one selects to scale upanimal data to humans depends on the nature of the compound and the desired mathematical output. The allometricapproach is empirical, but easy, and best suited for renallyexcreted compounds or linear pharmacokinetic data. Thephysiologic approach is detailed, but difficult, and best suited■ui lucbctuuiiz-eu (jump-juiius ur numinear pnarcnacoKineucdata. Both approaches allow us to extrapolate outside therange of data with some confidence if the dominant mechanisms of transport are sufficiently well understood. A prioripredictions are possible for many drugs, based on limitedavailable data.
Animals live in different pharmacokinetic space-time con-tinua. Use of an internal, or biological, clock in pharmacokinetic data analyses removes the superficial differences imposed by an external, or chronological, clock.
In general, small animals require more drug, administered
scaling can guide us in selecting equivalent dosage regimens.
References and Notes1. Huxley, J. S. "Problems of Relative Growth"; Methuen: London,
1932.2. Adolph, E. F. Science 1949, 109, 579-585.3. Stahl, W. R. Science 1965, 150, 1039-1041.4. Edwards, N. A. Comp. Biochem. Physiol. A 1975, 52, 63-66.5. Boxenbaum, Harold J. Pharmacokinet. Biopharm. 1980, 8, 165-
175.6. Calabrese E. J. "Principles of Animal Extrapolation"; John
Wiley and Sons: New York, 1983; p 518.7. Boxenbaum, Harold J. Pharmacokinet. Biopharm. 1982, 10,
Journal of Pharmaceutical Sciences /1039Vol. 75, No. 11, November 1986

8' YnajtQS'1n97Eugene; Ku^ler' Peter N- J- Pharm. Sci. 1986, 75,
9. Boxenbaum, Harold; Fertig, Joanne B. Eur. J. Drue MetabPharmacokinet. 1984, 9, 177-183.
10. Calder William A., Ill "Size, Function, and Life History";Harvard University Press: Cambridge, MA, 1984.
11. McMahon, Thomas A.; Bonner, John Tyler "On Size and Life"-Scientific American Books: New York, 1983.
12. Schmidt-Nielsen, Knut "Scaling. Why is animal size so important? ; Cambridge University Press: New York, 1984
l . - l n o H r f o t R T ■ T H c . ~ U r . t F V T J . - 7 - 1 i _ _ t - » r . s ~ , „ ' .
Rep., Part 1 1970, 54, 95-101.14. Stahl, W. R. Science 1962, 137, 205-212.15. Richardson, I. W.; Rosen, Robert J. Theor. Biol. 1979, 79, 415-
"VatuOi
R768-R774.
21. Mordenti, Joyce Antimicrob. Agents Chemother. 1985, 27, 887-891.
22. Duthu, Gwen S. J. Pharm. Sci. 1985, 74, 943-94623. Mordenti, Joyce J. Pharm. Sci. 1986, 75, 852-85724. Ramsey, J. C; Gehring, P. J. Fed. Proc, Fed. Am. Soc. Exp. Biol.
1980, 39, 60—65.25. Swabb, Edward A.; Bonner, Daniel P. J. Pharmacokinet. Bio
pharm. 1983, 11, 215-223.26. Mordenti, Joyce J. Pharm. Sci. 1985, 74, 1097-1099.27. Gerlowski, Leonard E.; Jain, Rakesh K. J. Pharm. Sci. 1983 72
1 1 0 3 - 1 1 2 7 . ' '28. Chen, H.-S. G.; Gross, J. F. Cancer Chemother. Pharmacol. 1979,
2, 85-94.29. Himmelstein, K. J.; Lutz, R. J. J. Pharmacokinet. Biopharm
1979, 7, 127-145.30. Bischoff, K. B.; Dedrick, R. L.; Zaharko, D. S. J. Pharm. Sci
1970, 59, 149-154.31. Bischoff, K. B.; Dedrick, R. L.: Zaharko, D. S.; Longstreth, J A
J. Pharm. Sci. 1971, 60, 1129-1133.32. Zaharko, D. S.; Dedrick, R. L.; Oliverio, V. T. Comp. Biochem.
Physiol. A 1972, 42, 183-194.33. Rane, A.; Wilkinson, G. R.; Shand, D. G. J. Pharmacol. Exp.
Ther. 1977, 200, 420-424.34. Dedrick R L.; Forrester, D. D.; Ho, D. H. W. Biochem. Pharma
col. 1972, 21, 1-16.35. Dedrick, R. L.; Forrester, D. D.; Cannon, J. N.; El Dareer, S. M.-
Muellett, L. B. Biochem. Pharmacol. 1973, 22, 2405-241736. Morrison P F.; Lincoln, T. L.: Aroesty, J. Cancer Chemother.
Rep. 1975, 59, 861-76.37. Farris, F. F.; King, F. G.; Dedrick, R. L.; Litterst, C. L. J. Phar
macokinet. Biopharm. 1985, 13, 13-40.38. King F. G; Dedrick, R. L.; Farris, F. F. J. Pharmacokinet.
Biopharm. 1986, 14, 131-156.39. Lin, J.H.; Hayashi, M.; Awazu, S.; Hanano, M. J. Pharmaco
kinet. Biopharm. 1978, 6, 327-337.
kinet. Biopharm. 1982,10, 649-661.
J. Pharm. Sci. 1984, 73, 826-828ari. Y • Slicrivnma V • Qomo,
J. Pharmacokinet. Biopharm. 1983,11, 577-593.
-•*. xicuntj, r. a.; uross, «J. r. ui59, 819-825.
45. Chan, K. K.; Cohen, J. L.; Gross, J. F.; Himmelstein, K.J.;Bateman J. R; Tsu-Lee, Y; Marlis, A. S. Cancer Chemother.Rep. 1978, f32, 1161.
46. Benowitz. N.: Forsvth. R. P ■ Mplmnn K ■ Rn™Jo--,-j m r>;,-„
47' HXP-iS?. L>; 0rtega. E-: Solomon, R.; Day, j. L. J. Pharm. Sci.1977, 6t>, 1454—1557.
48. Ichimura, F.; Yokogawa, K.; Yamana, T.; Tsuji, A.; Yama-moto, K.; Murakami, S.; Mizukami, Y. Int. J. Pharm. 1984,19,75—88.
49. Sawada, Y.; Harashima, H.; Hanano, M.; Sugiyama, Y.: lea; TJ. Pharmacobio-Dyn. 1985, 8, 757-766.
50. Yoshimura, M.; Kojima, J.; Ito, T.; Suzuki, J. J. Pharmacobio-Dyn. 198o, 8, 738-750.
5L ?«?of nl?aum> Harold; Fertig, Joanne B. Biopharm. Drug Dispos.1984, 5, 405—408.
52. Brody, S. "Bioenergetics and Growth"; Reinhold: New York1945.
53. Freireich, E. J.; Gehan, E. A.; Rail, D. P.; Schmidt, L. H.: Skipper, H. E. Cancer Chemother. Rep. 1966, 50, 219---244.
1040 /Journal of Pharmaceutical SciencesVol. 75, No. 11, November 1986


![Physiologically-Based Pharmacokinetic (PBPK) Modeling of ...Graph Digitizer version 2.26.0.20 (S. Fedorov) according to best practices [30]. Allometric scaling was performed in NONMEMfi](https://static.fdocuments.us/doc/165x107/60bd77187218d5030c0ab9f5/physiologically-based-pharmacokinetic-pbpk-modeling-of-graph-digitizer-version.jpg)