· Man Funds VI plc Fund and Class of Shares ISIN: Man GLG European Alpha Alternative Class DN EUR...
308
Man Funds VI plc (formerly GLG Investments VI plc) (An Investment Company with Variable Capital) Report and Financial Statements for the year ended 31 December 2016
Transcript of · Man Funds VI plc Fund and Class of Shares ISIN: Man GLG European Alpha Alternative Class DN EUR...

Man Funds VI plc (formerly GLG Investments VI plc)
(An Investment Company with Variable Capital) Report and Financial Statements for the year ended 31 December 2016

Man Funds VI plc
Fund and Class of Shares ISIN:
Man GLG European Alpha Alternative Class DN EUR IE00B4YLN521
Man GLG European Alpha Alternative Class DN H GBP IE00B4YLN745
Man GLG European Alpha Alternative Class DN H USD IE00B4YLMY47
Man GLG European Alpha Alternative Class IN EUR IE00B3VHWQ03
Man GLG European Alpha Alternative Class IN H GBP IE00B3VHX450
Man GLG European Alpha Alternative Class IN H USD IE00B3VHWN71
Man GLG Alpha Select Alternative Class DN GBP IE00B60K3800
Man GLG Alpha Select Alternative Class DN H EUR IE00B5ZNKR51
Man GLG Alpha Select Alternative Class DN H USD IE00B6116G19
Man GLG Alpha Select Alternative Class IN GBP IE00B60S2G54
Man GLG Alpha Select Alternative Class IN H EUR IE00B3LJVG97
Man GLG Alpha Select Alternative Class IN H USD IE00B5ZN3H63
Man GLG European Equity Alternative Class DN EUR IE00B5591813
Man GLG European Equity Alternative Class DN H CHF IE00B3N8Z959
Man GLG European Equity Alternative Class DN H GBP IE00B50LJD33
Man GLG European Equity Alternative Class DN H NOK IE00B5BGS293
Man GLG European Equity Alternative Class DN H SEK IE00B664J889
Man GLG European Equity Alternative Class DN H SGD IE00B6ZDJX16
Man GLG European Equity Alternative Class DN H USD IE00B55G5T10
Man GLG European Equity Alternative Class IN EUR IE00B5429P46
Man GLG European Equity Alternative Class IN H GBP IE00B501WY55
Man GLG European Equity Alternative Class IN H SEK IE00B5MLB684
Man GLG European Equity Alternative Class IN H USD IE00B54VK141
Man GLG Global Equity Alternative Class DN EUR IE00BD616N28
Man GLG Global Equity Alternative Class DN H CHF IE00BD616L04
Man GLG Global Equity Alternative Class DN H USD IE00BD616K96
Man GLG Global Equity Alternative Class IN EUR IE00BD616X26
Man GLG Global Equity Alternative Class IN H USD IE00BD616T89
Man Funds VI plc Contents
Page
Directory 1
Investment Manager's report 2
Directors’ report 16
Report from the Depositary to the Shareholders 23
Statement of financial position 24
Statement of changes in net assets 32
Statement of comprehensive income 36
Statement of cash flows 44
Notes to the financial statements 52
Independent Auditors’ report 180
Supplementary information 294 Unaudited reporting requirement in respect of the Securities Financing Transactions Regulation 295
Schedule of investments:
Man GLG European Alpha Alternative 182 Man GLG Alpha Select Alternative 186 Man GLG European Equity Alternative 190 Man GLG Global Equity Alternative 203 Man GLG Cred-Eq Alternative 216 Man AHL Multi Strategy Alternative 220 Man AHL TargetRisk 252 Man AHL Volatility Alternative 256 Man GLG European Mid-Cap Equity Alternative 262 Man Numeric Market Neutral Alternative 266 Man GLG Unconstrained Emerging Equity 270 Man GLG Global Emerging Markets Debt Total Return 274 Statements of Significant Purchases and Sales (Unaudited): Man GLG European Alpha Alternative 278 Man GLG Alpha Select Alternative 279 Man GLG European Equity Alternative 280 Man GLG Total Return 281 Man GLG Global Equity Alternative 282 Man GLG Asian Equity Alternative 283 Man GLG European Alpha Alternative Enhanced 284 Man GLG Cred-Eq Alternative 285 Man AHL Multi Strategy Alternative 286 Man AHL Directional Equities Alternative 287 Man AHL TargetRisk 288 Man AHL Volatility Alternative 289 Man GLG European Mid-Cap Equity Alternative 290 Man Numeric Market Neutral Alternative 291 Man GLG Unconstrained Emerging Equity 292 Man GLG Global Emerging Markets Debt Total Return 293
Man Funds VI plc
Directory
1
Board of Directors: Ronan Daly (British citizen, Irish resident) (appointed on 21 April 2016) Eric Fortier (Canadian) Michael Jackson (Irish) (resigned on 21 April 2016) John Morton (British) Victoria Parry (British citizen, Irish resident) (resigned on 21 April 2016) Bronwyn Wright (Irish) (appointed on 21 April 2016)
Secretary and Registered Office: Matsack Trust Limited, 70 Sir John Rogerson’s Quay, Dublin 2, Ireland. Investment Manager and Distributor in relation to the Man GLG Portfolios: GLG Partners LP, One Curzon Street, London W1J 5HB, England.
Manager: Man Asset Management (Ireland) Limited*** 70 Sir John Rogerson’s Quay, Dublin 2, Ireland.
Custodian/Depositary*: BNY Mellon Trust Company (Ireland) Limited, Guild House, Guild Street, IFSC, Dublin 1, Ireland.
Investment Manager in relation to the Man AHL Portfolios: AHL Partners LLP, Riverbank House, 2 Swan Lane, London EC4R 3AD, England.
Legal Advisers as to matters of Irish law: Matheson, 70 Sir John Rogerson’s Quay, Dublin 2, Ireland. Independent Auditor: Ernst & Young, Chartered Accountants, Ernst & Young Building, Harcourt Centre, Harcourt Street, Dublin 2, Ireland.
Investment Manager in relation to the Man Numeric Portfolios: Numeric Investors LLC, 470 Atlantic Avenue, 6th Floor, Boston, MA 02210, USA.
Distributor in relation to the Man AHL Portfolios: Man Investments AG, Huobstrasse 3, 8808 Pfäffikon SZ, Switzerland.
Sponsoring Irish Stockbroker: (Until 21 April 2016) Davy Stockbrokers, 49 Dawson Street, Dublin 2, Ireland.
Distributor in relation to the Man Numeric Portfolios: Man Investments AG, Huobstrasse 3, 8808 Pfäffikon SZ, Switzerland.
(Effective 21 April 2016) Matheson, 70 Sir John Rogerson’s Quay, Dublin 2, Ireland.
Administrator: BNY Mellon Fund Services (Ireland) DAC** Guild House, Guild Street, IFSC, Dublin 1, Ireland.
Swiss Representative: Man Investments AG, Huobstrasse 3, 8808 Pfäffikon SZ, Switzerland.
Swiss Paying Agent: Credit Suisse AG, Paradeplatz 8, CH-8001 Zürich, Switzerland.
*Effective 24 March 2016, BNY Mellon Trust Company (Ireland) Limited acts as Depositary to the Fund. **Effective 27 January 2016, BNY Mellon Fund Services (Ireland) Limited was renamed BNY Mellon Fund Services (Ireland) DAC. ***Effective 6 October 2016, GLG Partners Asset Management (Ireland) Limited was renamed Man Asset Management (Ireland) Limited. A detailed list of investments purchased and sold during the year is available upon request from the registered office of the Fund free of charge.

Man Funds VI plc
Investment Manager’s Report
2
Man GLG European Alpha Alternative – Annual Report Commentary
Man GLG European Alpha Alternative (the “Fund”) was down 1.87% in 2016. Stock selection was positive while sector attribution, hedge selection and market attribution were negative. The Fund’s management team were changed in December, with Philippe Isvy and Pierre Valade making way for Jean-Robin Peters. Whilst the strategy of the new management team differs, the objectives of the fund remain identical – namely low volatility returns with limited net exposure. Market and Fund Outlook 2016 saw a mixed equity performance across regions with the S&P/US +9.5%, SXXP/Europe -1.2%, Nikkei/Japan +0.4%, MSCI Asia Pacific excl. Japan +3.7% and MSCI Emerging Markets +8.6%. Within Europe, sector performance was very diverse as can be seen in the table below:
The year was littered with political events, together with changing interest rate expectations. The election of Donald Trump as President of the United States proved a catalyst for “recovery style” stocks, and thus a sharp rally in value stocks at the expense of high quality stocks in the last quarter of the year; as expressed by the chart below: High vs. Low Quality stocks ’12m Fwd P/E
Source: Bank of America Merrill Lynch – 12th January 2017
Fund Positioning While the new management team’s strategy slightly differs from that of Philippe and Pierre’s, stock selection remains the key expected driver of returns for the new team in FY17. The team’s key focus is on discovering companies with inflecting or accelerating/decelerating earnings growth profiles. Whilst political risks remain with both French and German elections upcoming, together with the unknown that is the UK’s exit path away from the European Union, the process in place ought to be well calibrated to exploit the opportunities that we see ahead.
Sector Ticker AbsoluteBasic Resources SXPP 61.9%Oil & Gas SXEP 22.9%Construction & Materials SXOP 9.2%Industrial Goods & Services SXNP 8.5%Chemicals SX4P 3.9%Technology SX8P 3.4%Personal & Household Goods SXQP 2.0%Automobiles & Parts SXAP -3.9%Food & Beverage SX3P -5.4%Insurance SXIP -5.6%Retail SXRP -6.7%Banks SX7P -6.8%Financial Services SXFP -7.4%Media SXMP -7.6%Real Estate SX86P -8.0%Utilities SX6P -8.9%Health Care SXDP -10.2%Travel & Leisure SXTP -11.1%Telecommunications SXKP -15.8%

Man Funds VI plc
Investment Manager’s Report (continued)
3
Man GLG Alpha Select Alternative – Annual Report Commentary
The Fund recorded a -1.1% net return in a year that was filled with surprises, many of which have led to deep ramifications across global markets.
The year began with an overall reduction in risk appetite due to concerns about China weakening their currency, a potential US recession and oil prices falling to $28 per barrel. Sterling suffered a persistent slide against the dollar in the run up to the UK referendum which prompted the Bank of England to become more cautious about the potential Brexit scenario. The uncertainty surrounding the vote prompted many central banks to continue with, and in some cases increase, their accommodative policies. Markets regained some composure and steadied after the first quarter despite the revised view of lower global growth (attributable to unstable commodity prices), weaker growth in developed markets and concerns over stability in emerging markets.
The summer brought the first major surprise of the year as the UK voted to leave the EU, consequently sending shockwaves through markets and leading to political uncertainty in the UK following the resignation of Prime Minister, David Cameron. The Leave vote impacted Fund performance negatively and it suffered a large loss, with domestic stocks and financials being the main detractors.
Heading into the vote, the team saw an opportunity in the market as the valuation gap between domestic UK and multi-nationals had reached historically extreme levels. On top of this, the FX market was indicating the likelihood of a ‘Remain’ result as Sterling strengthened during the week of the referendum and this opinion was also backed by the bookmakers (who usually seem to get it right). However, what many commentators missed was the large proportion of respondents in the polls who remained ‘undecided’. It was the team’s firm opinion that those 10-15% of undecided voters would vote for the status quo on the day. For this reason, the team were willing to make the bet that the Remain side would win the vote and positioned the portfolio to take advantage of opportunities that would arise from such a scenario.
Unfortunately, the team were wrong about the outcome of the vote, which cost the Fund on both the long and short side of the book. Whilst the team were not surprised by the magnitude of the falls in a number their UK domestic facing longs, it was the performance of some of the names on the short side of the book that was a surprised, and therefore increased the magnitude of losses over the vote.
In the second half of the year, Donald Trump’s unforeseen victory in the US election again caught markets off guard. However, the initial volatility was brief as markets responded positively to his fiscal stimulus plans. Trump’s victory led to increased risk appetite on account of increased growth expectations, which saw equities finish the year strongly while bond yields pushed higher. In Europe, the Italian PM Renzi reigned from his post in the wake of a devastating defeat in the referendum on constitutional reform. Furthermore, the ECB expanded their QE programme although the Euro inadvertently appreciated in spite of the central bank’s actions. In the commodity complex, oil prices rose following an agreement by the OPEC oil cartel in union with non-members, to curb output.
While the Fund was negatively impacted by the Brexit vote and a lack of exposure to commodities during H1, the second half of the year saw the Fund recoup the majority of its losses. Whilst it is frustrating that the Fund did not make further progress, there are some positives to be taken from 2016. Firstly, the Fund has historically bounced back from losses and that was again the case this year meaning that drawdowns have been limited in both scale and duration. Secondly, in a year so driven by unexpected macro and geopolitical events, the Fund has protected capital. Thirdly, bar the situation around the Brexit vote, the short book has contributed significantly to the Fund this year both as a source of returns and as a way to limit volatility. Challenging years always offer plenty of insight into developing and improving the team’s process and the main conclusion this year is to focus more on the individual shorts within the portfolio.
Furthermore, the nature of the Fund’s strategy means that returns are rarely driven by the overall level of equity markets. The speed and scale of change at the stock and industry level means that the team continue to believe that a unit of risk is best used in backing their analysis of those changes rather than at the market level. This is especially the case as volatility looks likely to continue into 2017 with several European elections, most notably in Germany and France, as well as the ongoing process of implementing Brexit. Interest rates and inflation also remain at levels that do not necessarily mean that equity markets need to de-rate from their current multiples. However, in a cycle that has been so driven by historically low interest rates inflating valuations of many asset classes, the team believe the outlook for equity market performance going forward is quite balanced.
Finally, the volatility of the macroeconomic and political backdrop means that (generally) the team find better risk-reward opportunities at the stock level than they do thematically. As a result, entering 2017, the portfolio is reasonably balanced thematically and it is expected that the majority of performance will be driven by the team’s bottom-up stock analysis. The outlook for improving growth and somewhat higher bond yields means that there are a number of ‘value’ opportunities, mainly in financials. However, given demographic headwinds and a high starting level of indebtedness, it is not clear that bond yields will move significantly higher in the medium-term. As a result, the team continue to hold a number of higher rated and higher quality stocks in the portfolio as they believe that the starting valuations of these positions are not unacceptably high and thus they should be capable of absorbing some further increase in bond yields.
Man GLG European Equity Alternative – Annual Report Commentary Overview 2016 proved to be a challenging year for Man GLG European Equity Alternative (the ‘Fund’). The first half of the year was plagued by difficult conditions for equity market neutral long short strategies, particularly the first two months of the year when macro themes dominated and investors experienced significant sector rotation and factor volatility. Although conditions improved during the second quarter, this was brought to an abrupt halt by the Brexit vote. Then, from Brexit vote onwards, investors faced a number of binary events throughout the second half of 2016 that arguably left investors more focused on capital preservation than delivering alpha. Overall, we did a reasonably good job navigating our way through the difficult first two months of the year but did less well over Brexit, drawing down more than we would have liked in the two days after the referendum. Our Brexit drawdown required us to speed up some changes that were already in motion, not least improving the fund's risk management process, improving portfolio construction and focusing a greater portion of our risk on alpha (further details on these changes are provided below). The post-Brexit period was one of recovery, executing on the improvements we wanted to make to the strategy and navigating our way through the remaining binary events, most notably the US Election, the Italian Referendum and pivotal central bank policy decisions in December. We think we did a better job managing through these latter events, making sure we kept our book level portfolio construction tight, complemented by prudent use of overlays at the fund level.

Man Funds VI plc
Investment Manager’s Report (continued)
4
Man GLG European Equity Alternative – Annual Report Commentary (continued) Performance Given these challenging conditions, the Fund ended the year down -2.18% net of fees1 in 2016. Looking at book returns, we saw strong contributions from Speciality Consumer (+1.19%), Europe Midcap (+1.05%) and once again from our Event strategy (+1.05%). Returns from specific risk dominated the contributions from all three managers. We also saw solid contributions from our Industrials (+0.62%) and Consumer Trading (+0.44%) managers over the year. However, on the negative side, our Pharma (-1.16%), Financials (-0.88%) and Healthcare (-0.47%) managers found conditions tough. Clearly, conditions in the US healthcare sector have been challenging for a while and both of our managers that focused on the sector struggled to adapt to the increased regulatory focus and concerns over political intervention. As we discuss later, a number of our underperforming managers have since left the platform. Our UK focused teams also had a difficult year with UK Core (-.66bp) having a rare negative year, suffering the bulk of their losses in the two days after the Brexit referendum. However, it has been pleasing to see how the book has recovered since Brexit, particularly with improved portfolio construction resulting in a greater focus on stock selection alpha. Despite a difficult year for our UK Core book, the manager remains one of our top performing strategies over recent years. Turning to factor attribution, our returns from Specific risk were modestly positive over the year in what has been a difficult year for alpha generation in our strategy. However, our losses on factors, particularly Style risk factors, were unusually high in the first half of the year. There was, however, a material change in conditions and performance during the second half of the year. If the first half was characterised by a tough alpha creation environment and losses in predominantly volatile Style factors, the second half saw our alpha generation improve significantly, augmented by a helpful contribution from our modest Industry risk and by far tighter management of Style risk factors. Pleasingly, we have carried this positive momentum into the first few weeks of 2017. A focus on specific risk The losses the fund sustained over Brexit required us to execute with greater urgency and precision changes that had been in motion for the last twelve months. It highlighted to us the difficulty in predicting how factors might behave, particularly in response to shocks such as Brexit, and the dangers of having too much exposure to them. Analysis of historic performance showed that our returns from stock specific (or idiosyncratic) risk have been overwhelmingly superior to our returns on factors. As such, by increasing the portion of our risk in specific as opposed to factors, we hope to both improve returns and reduce the severity and length of drawdowns. This measure has been formally implemented in the final quarter of 2016: The fund seeks to operate with at least three quarters of its risk in specific (up from around 40-50% in prior years) and is attentively managed to this level through a combination, as necessary, of fund level hedges or book level intervention. Furthermore, a number of measures have been implemented to ensure that the limited factor exposure we take is sufficiently well diversified. Consequently, a large move in any one factor or factor group is unlikely to unduly harm returns. We have also applied the same diversification concept to our specific risk, making sure it is sufficiently broadly distributed across a number of different companies so that we can more effectively monetise our stock selection skill. Team changes One result of increasing the emphasis on fundamental stock selection alpha, and reducing our exposure to factors, was that we made more changes to our portfolio manager roster than normal. In the final quarter of 2016, we de-allocated from ten developed strategies. For some managers this was for performance reasons, in others it was due to them having an investment process and/or portfolio construction that was inconsistent with our greater orientation towards specific risk and in some cases it was both. Many of our investors may view this as an unusually aggressive restructuring of the portfolio management team when compared to recent history. However, as noted above, we felt it was in our investor’s best interest to be both thoughtful and decisive in our actions, which we are confident we have been. We would like to make it clear though that this does not herald any change to the philosophy of the fund; our emphasis on collaboration underpins not just the Fund team, but the whole of Man GLG, and we remain strongly committed to our skills based approach to fund management and will continue to nurture and develop our portfolio management talent. Despite the reduction in the number of developed strategies within the Fund, we remain strongly committed to investing in the Fund’s platform. We continue to invest in our risk modelling, risk management, execution and quantitative research capabilities. Furthermore, we have added considerable analyst resources to our portfolio management teams. This represents a subtle change in approach from the past. We feel that adding analyst resources to our best stock pickers will allow them to expand their universe of stocks and provide us with a greater opportunity to leverage their stock picking skills. We believe this to be a more effective strategy than simply adding individual portfolio managers to the roster with no analyst support. Furthermore, as some of the analysts make the inevitable transition to portfolio manager in the years ahead, we will have the confidence that they have been well trained by our best stock pickers and will have accumulated a huge amount of information on their ability to pick winners and losers. A number of analysts have already been added to the team in Q4 2016 and more will be added in Q1 2017 and beyond. This increased investment in analyst resources does not preclude adding fresh portfolio management talent for the platform in 2017 from external sources. We see a number of areas where we can improve our sector coverage that have significant alpha potential. We will continue to work closely with the firm’s dedicated business development specialist to identify and selectively recruit leading portfolio management talent. Our platform continues to have significant appeal to the best portfolio management talent in the market due to our focus on collaboration, our investment in developing best-of-class portfolio construction and risk management tools for the team as well as our multi asset expertise across the broader GLG and Man platform. We believe that all of these factors combined make us a highly compelling destination for discerning and thoughtful portfolio management talent.

Man Funds VI plc
Investment Manager’s Report (continued)
5
Man GLG European Equity Alternative – Annual Report Commentary (continued) Management changes Finally, there were also changes in the management team of the overall strategy during the year. Simon Savage moved on to Man Solutions to build out the Group's Alternative Beta offering. Pierre Lagrange, one of the co-founders of GLG, was appointed Senior Advisor to Man Group and Man GLG. It is great to have both of them still available to us so we can benefit from their tremendous insight. Fabian Blohm joined the firm from Citadel to become Co-Head of the Strategy, alongside Neil Mason who has been part of the Fund’s management team since 2014. Juan Parra joined the firm to manage our Centre Book, a key initiative for the strategy, initially developed in partnership with our Man colleagues at Man Numeric and Man AHL. It is initiatives like this that demonstrate both the power of our collaborative approach and the benefits of being part of Man Group. Looking ahead As we start 2017, we are highly optimistic about the prospects for the strategy. The changes implemented post-Brexit has helped to deliver respectable performance in the second half of 2016 and that momentum has continued into the first few weeks of 2017. With the fund's risk focused on the team's demonstrable strength in fundamental stock selection and our improved risk management framework now fully operational, we think we are excellently positioned to capitalise on equity dispersion going forward. 1 Past performance is not indicative of future results. Returns may increase or decrease as a result of currency fluctuations. The net returns are calculated net of management fees of 2% per annum and, as applicable, performance fees of 20% of the amount by which the Fund exceeds its relevant hurdle. Please note that some share classes may charge higher management fees. Man GLG Global Equity Alternative – Annual Report Commentary Overview 2016 proved to be a challenging year for the Man GLG Global Equity Alternative Fund. The first half of the year was plagued by difficult conditions for equity market neutral long short strategies, particularly the first two months of the year when macro themes dominated and investors experienced significant sector rotation and factor volatility. Although conditions improved during the second quarter, this was brought to an abrupt halt by Brexit. Then, from Brexit onwards, investors faced a number of binary events throughout the second half of 2016 that arguably left investors more focused on capital preservation than delivering alpha. Overall, we did a reasonably good job navigating our way through the difficult first two months of the year but did less well over Brexit, drawing down more than we should have in the two days after the referendum. Our Brexit drawdown required us to speed up some changes that were already in motion, not least improving the fund's risk management process, improving portfolio construction and focusing a greater portion of our risk on alpha (further details on these changes are provided below). The post-Brexit period was one of recovery, executing on the improvements we wanted to make to the strategy and navigating our way through the remaining binary events, most notably the US Election, the Italian Referendum and pivotal central bank policy decisions in December. We think we did a better job managing through these latter events, making sure we kept our book level portfolio construction tight, complemented by prudent use of overlays at the fund level. Performance Given these challenging conditions, the Man GLG Global Equity Alternative Fund (the ‘Fund’) ended the year down -1.96% in 2016. Looking at book returns, we saw strong contributions from Speciality Consumer (+119bp), Europe Midcap (+105bp) and once again from our Event strategy (+105bp). Returns from specific risk dominated the contributions from all three managers. We also saw solid contributions from our Industrials (+62bp) and Consumer Trading (+44bp) managers over the year. However, on the negative side, our Pharma (-116bp), Financials (-88bp) and Healthcare (-47bp) managers found conditions tough. Clearly, conditions in the US healthcare sector have been challenging for a while and both of our managers that focused on the sector struggled to adapt to the increased regulatory focus and concerns over political intervention. As we discuss later, a number of our underperforming managers have since left the platform. Our UK focused teams also had a difficult year with UK Core (-66bp) having a rare negative year, suffering the bulk of their losses in the two days after the Brexit referendum. However, it has been pleasing to see how the book has recovered since Brexit, particularly with improved portfolio construction resulting in a greater focus on stock selection alpha. Despite a difficult year for our UK Core book, the manager remains one of our top performing strategies over recent years. Turning to factor attribution, our returns from Specific risk were modestly positive over the year in what has been a difficult year for alpha generation in our strategy. However, our losses on factors, particularly Style risk factors, were unacceptably high in the first half of the year. There was, however, a material change in conditions and performance during the second half of the year. If the first half was characterised by a tough alpha creation environment and losses in predominantly volatile Style factors, the second half saw our alpha generation improve significantly, augmented by a helpful contribution from our modest Industry risk and by far tighter management of Style risk factors. Pleasingly, we have carried this positive momentum into the first few weeks of 2017. A focus on specific risk The losses the fund sustained over Brexit required us to execute with greater urgency and precision changes that had been in motion for the last twelve months. It highlighted to us the difficulty in predicting how factors might behave, particularly in response to shocks such as Brexit, and the dangers of having too much exposure to them. Analysis of historic performance showed that our returns from stock specific (or idiosyncratic) risk are overwhelmingly superior to our returns on factors. As such, by increasing the portion of our risk in specific as opposed to factors, we should both improve returns and reduce the severity and length of drawdowns. This measure has been formally implemented in the final quarter of 2016: the fund seeks to operate with at least three quarters of its risk in specific (up from around 40-50% in prior years) and is attentively managed to this level through a combination, as necessary, of fund level hedges or book level intervention.
Man Funds VI plc
Investment Manager’s Report (continued)
6
Man GLG Global Equity Alternative – Annual Report Commentary (continued) Furthermore, a number of measures have been implemented to ensure that the limited factor exposure we take is sufficiently well diversified. Consequently, a large move in any one factor or factor group is unlikely to unduly harm returns. We have also applied the same diversification concept to our specific risk, making sure it is sufficiently broadly distributed across a number of different companies so that we can more effectively monetise our stock selection skill. Team changes One result of increasing the emphasis on fundamental stock selection alpha, and reducing our exposure to factors, was that we made more changes to our portfolio manager roster than normal. In the final quarter of 2016, we de-allocated from ten developed strategies. For some managers this was for performance reasons, in others it was due to them having an investment process and/or portfolio construction that was inconsistent with our greater orientation towards specific risk and in some cases it was both. Many of our investors may view this as an unusually aggressive restructuring of the portfolio management team which it was when compared to recent history. However, as noted above, we felt it was in our investors' best interest to be both thoughtful and decisive in our actions, which we are confident we have been. We would like to make it clear though that this does not herald any change to the philosophy of the fund; our emphasis on collaboration underpins not just the Fund’s team, but the whole of Man GLG, and we remain strongly committed to our skills based approach to fund management and will continue to nurture and develop our portfolio management talent. Despite the reduction in the number of developed strategies within the Fund, we remain strongly committed to investing in the Fund’s platform. We continue to invest in our risk modelling, risk management, execution and quantitative research capabilities. Furthermore, we have added considerable analyst resources to our portfolio management teams. This represents a subtle change in approach from the past. We feel that adding analyst resources to our best stock pickers will allow them to expand their universe of stocks and provide us with a greater opportunity to leverage their stock picking skills. We believe this to be a more effective strategy than simply adding individual portfolio managers to the roster with no analyst support. Furthermore, as some of the analysts make the inevitable transition to portfolio manager in the years ahead, we will have the confidence that they have been well trained by our best stock pickers and will have accumulated a huge amount of information on their ability to pick winners and losers. A number of analysts have already been added to the team in Q4 2016 and more will be added in Q1 2017 and beyond. This increased investment in analyst resources does not preclude adding fresh portfolio management talent for the platform in 2017 from external sources. We see a number of areas where we can improve our sector coverage that have significant alpha potential. We will continue to work closely with the firm’s dedicated business development specialist to identify and selectively recruit leading portfolio management talent. Our platform continues to have significant appeal to the best portfolio management talent in the market due to our focus on collaboration, our investment in developing best-of-class portfolio construction and risk management tools for the team as well as our multi asset expertise across the broader GLG and Man platform. All of these factors combined make us a highly compelling destination for discerning and thoughtful portfolio management talent. Management changes Finally, there were also changes in the management team of the overall strategy during the year. Simon Savage moved on to Man Solutions to build out the Group's Alternative Beta offering. Pierre Lagrange, one of the co-founders of GLG, was appointed Senior Advisor to Man Group and Man GLG. It is great to have both of them still available to us so we can benefit from their tremendous insight. Fabian Blohm joined the firm from Citadel to become Co-Head of the Strategy, alongside Neil Mason who has been part of the Fund’s management team since 2014. Juan Parra joined the firm to manage our Centre Book, a key initiative for the strategy, initially developed in partnership with our Man colleagues at Numeric and AHL. It is initiatives like this that demonstrate both the power of our collaborative approach and the benefits of being part of Man Group. Looking ahead As we start 2017, we are highly optimistic about the prospects for the strategy. The changes implemented post-Brexit has helped to deliver respectable performance in the second half of 2016 and that momentum has continued into the first few weeks of 2017. With the fund's risk focused on the team's demonstrable strength in fundamental stock selection and our improved risk management framework now fully operational, we think we are excellently positioned to capitalise on equity dispersion going forward. Man GLG European Alpha Alternative Enhanced – Annual Report Commentary Man GLG European Alpha Alternative Enhanced (the “Fund”) was down 2.71% in 2016. Stock selection was positive while sector attribution, hedge selection and market attribution were negative. The Fund’s management team were changed in December, with Philippe Isvy and Pierre Valade making way for Jean-Robin Peters. Whilst the strategy of the new management team differs, the objectives of the Fund remain identical – namely low volatility returns with limited net exposure. Market and Fund Outlook 2016 saw a mixed equity performance across regions with the S&P/US +9.5%, SXXP/Europe -1.2%, Nikkei/Japan +0.4%, MSCI Asia Pacific excl. Japan +3.7% and MSCI Emerging Markets +8.6%.
Man Funds VI plc
Investment Manager’s Report (continued)
7
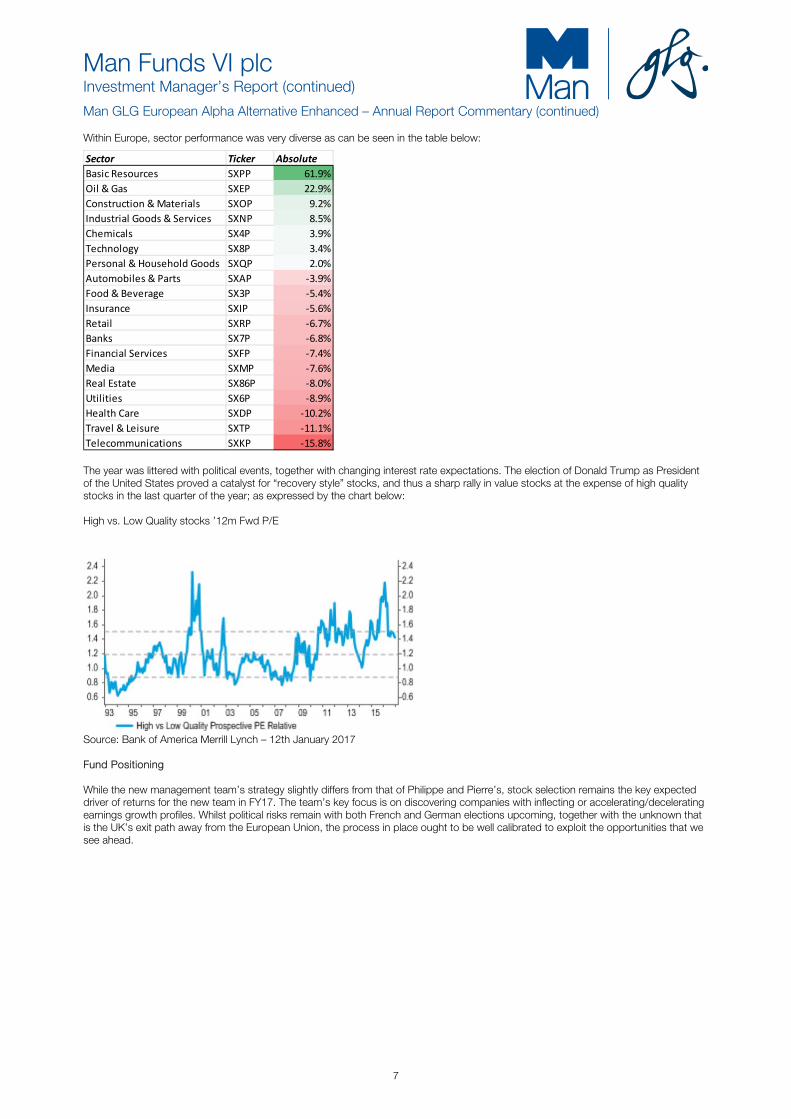
Man GLG European Alpha Alternative Enhanced – Annual Report Commentary (continued) Within Europe, sector performance was very diverse as can be seen in the table below:
The year was littered with political events, together with changing interest rate expectations. The election of Donald Trump as President of the United States proved a catalyst for “recovery style” stocks, and thus a sharp rally in value stocks at the expense of high quality stocks in the last quarter of the year; as expressed by the chart below: High vs. Low Quality stocks ’12m Fwd P/E
Source: Bank of America Merrill Lynch – 12th January 2017 Fund Positioning While the new management team’s strategy slightly differs from that of Philippe and Pierre’s, stock selection remains the key expected driver of returns for the new team in FY17. The team’s key focus is on discovering companies with inflecting or accelerating/decelerating earnings growth profiles. Whilst political risks remain with both French and German elections upcoming, together with the unknown that is the UK’s exit path away from the European Union, the process in place ought to be well calibrated to exploit the opportunities that we see ahead.
Sector Ticker AbsoluteBasic Resources SXPP 61.9%Oil & Gas SXEP 22.9%Construction & Materials SXOP 9.2%Industrial Goods & Services SXNP 8.5%Chemicals SX4P 3.9%Technology SX8P 3.4%Personal & Household Goods SXQP 2.0%Automobiles & Parts SXAP -3.9%Food & Beverage SX3P -5.4%Insurance SXIP -5.6%Retail SXRP -6.7%Banks SX7P -6.8%Financial Services SXFP -7.4%Media SXMP -7.6%Real Estate SX86P -8.0%Utilities SX6P -8.9%Health Care SXDP -10.2%Travel & Leisure SXTP -11.1%Telecommunications SXKP -15.8%

Man Funds VI plc
Investment Manager’s Report (continued)
8
Man GLG Cred-Eq Alternative – Annual Report Commentary Performance Summary Man GLG Cred-Eq Alternative, “the Fund”, posted a net return of negative 2.62% in 2016 after management fees. Market Review Markets in 2016 were driven by central banks and political developments. Notable events included the U.S election and Brexit which both caused significant uncertainty and volatility. There was also a Fed rate hike and an eventual OPEC output cut for markets to digest. Markets started 2016 very much on the back foot as risk assets tumbled from day one with sentiment impacted by the continuing oil price slide, China worries and broader global growth concerns. In Europe the ECB expanded their asset purchase program to include corporate bonds – their first foray into the private unsecured market. The macroeconomic backdrop towards the end of the year was defined by the U.S election and the surprise result ignited a number of global market moves. The Fed also implemented a widely expected 25bps rate hike in December, marking its first increase in 12 months. A more hawkish than anticipated tone emerged from the meeting as policymakers now forecast 3 rate hikes in 2017, up from 2 previously, on continued improvements in the labour market and the U.S economy overall. In terms of overall asset returns for 2016, a standout performer was oil (WTI) which staged a strong recovery after falling to multi-year lows in February and finished the year up 45%. In the rates space returns were fairly unexciting though UK Gilts were the clear underperformed and fell 7% in USD terms. However, given the 16% post-Brexit depreciation of GBP versus USD, Gilts actually returned 11% in local currency terms. European financials (SX7E Index) and Italy (FTSEMIB Index) were the weakest performers in the equity space, finishing down 8% and 10%, respectively, after being down as much as 30% and 20%, respectively, at the end of 1H. In credit, US HY (BUHY Index) was the big winner and gained 17.5%, helped in particular by the large move higher in energy prices which boosted credits in that sector. Higher beta credits also outperformed their IG-rated peers in Europe. Fund Performance Despite posting ten months of consecutive positive performance, the fund unfortunately ended 2016 in negative territory after suffering heavy losses in the first month of the year. January was a difficult month for a lot of investors as markets remained weak following the soft end to 2015, driven by growing fears of a slowdown in China and an ongoing slide in oil prices. Positive contributors to fund performance included a hedged position in NetSuite convertible bonds, active trading in a basket of European financial equities, and a long position in Maurel et Prom convertibles. Conversely, negative performance was driven by a long position in Aabar convertible bonds, a long position in Telecom Italia equities, and a long position in RBS equity. All three of the biggest losers were due to performance in the months of January and February. The NetSuite position made money after the company was acquired by Oracle and the embedded change of control provision kicked in to increase the final conversion ratio. The fund enhanced its returns from this position by dynamically trading the equity delta as expectations over the likelihood the deal would close continued to change. The fund made money in European financials after twice buying the stocks on a sell-off ahead of a broader rally in the sector from mid-year onwards. Lastly, Maurel bonds made money after a key shareholder made an offer to acquire the whole company and simultaneously offered to repurchase the bonds at par. When the deal was first announced in July the bonds jumped almost 40% in one day. On the other hand, as mentioned previously, the biggest losses came in January and February. Aabar bonds, exchangeable into shares of Italian bank Unicredit, fell steeply as Italian banks fell anywhere between 30-50% in January on concerns over the level of non-performing loans (NPLs) and the potential for bail-ins. Although Italy later reached a deal with the EU on a new government guarantee scheme to manage the NPLs, there were some concerns that the planned programme might be too small. The bonds also cheapened as non-vanilla and non-IG names were hit hardest in the month. The Telecom Italia position lost money as the shares fell 13% in January and underperformed the broader market after management played down speculation surrounding the possible merger between their Brazilian arm and Oi in Brazil, and a deal with Orange in Europe. Finally, to compound the weakness in European financials at the start of the year, RBS issued a surprise profit warning on pension, RMBS litigation and conduct charges. This impacted the fund’s long position in RBS equity and there was also some read-across to Lloyds equity, also held by the fund, which fell on concerns over the viability of dividends in the near-term. In the primary convertible bond market 2016 saw 87 new deals (Source: “Prospect News, Convertibles Daily”) in the US worth a combined $35bn and 48 deals in Europe totalling $27bn. This compares with last year’s figures of 93 deals worth $40bn, and 44 deals worth a combined $25bn, in the US and Europe, respectively. 2017 Outlook Looking ahead to 2017 we expect that asset returns will continue to be dominated by political developments and monetary policy changes. Trump’s election win in the US adds to the uncertainty given the sheer number of policy changes he has talked about making. While this of course presents challenges, we are optimistic that it also means there will be plenty of opportunities to make strong returns in 2017. As far as the convertible bond asset class is concerned, despite 2016 volumes being down slightly on 2015 levels, we are constructive on the outlook for primary issuance volumes in 2017 given the supportive environment of rising US rates, ongoing M&A activity, and recent strength in equity markets. The value of an investment and any income derived from it can go down as well as up and investors may not get back their original amount invested. Alternative investments can involve significant additional risks. Past performance is not indicative of future results. Returns may increase or decrease as a result of currency fluctuations. Man GLG European Mid-Cap Equity Alternative – Annual Report Commentary The political and economic backdrop was challenging for Hedge Funds in 2016. Although the year was ultimately defined by the surprise Brexit vote in the UK and the shock election win by President Donald Trump in the US there were many other potential political roadbumps along the way including the Italian election. During the year we also witnessed two major phases of significant hedge fund de-leveraging (February and June) where stock prices were predominately driven by liquidity as opposed to fundamental factors. It was also a year where consensus investor positioning was exposed and significant sector and style rotation caught out many managers who found themselves overexposed to quality stocks and defensive bond proxies and underexposed to low quality value stocks, energy related companies and Financials. This was particularly relevant during the post Trump election rally in the fourth quarter of the year. One consensual trade continued to work as the Dollar also continued to rally against most developed currencies.
Man Funds VI plc
Investment Manager’s Report (continued)
9
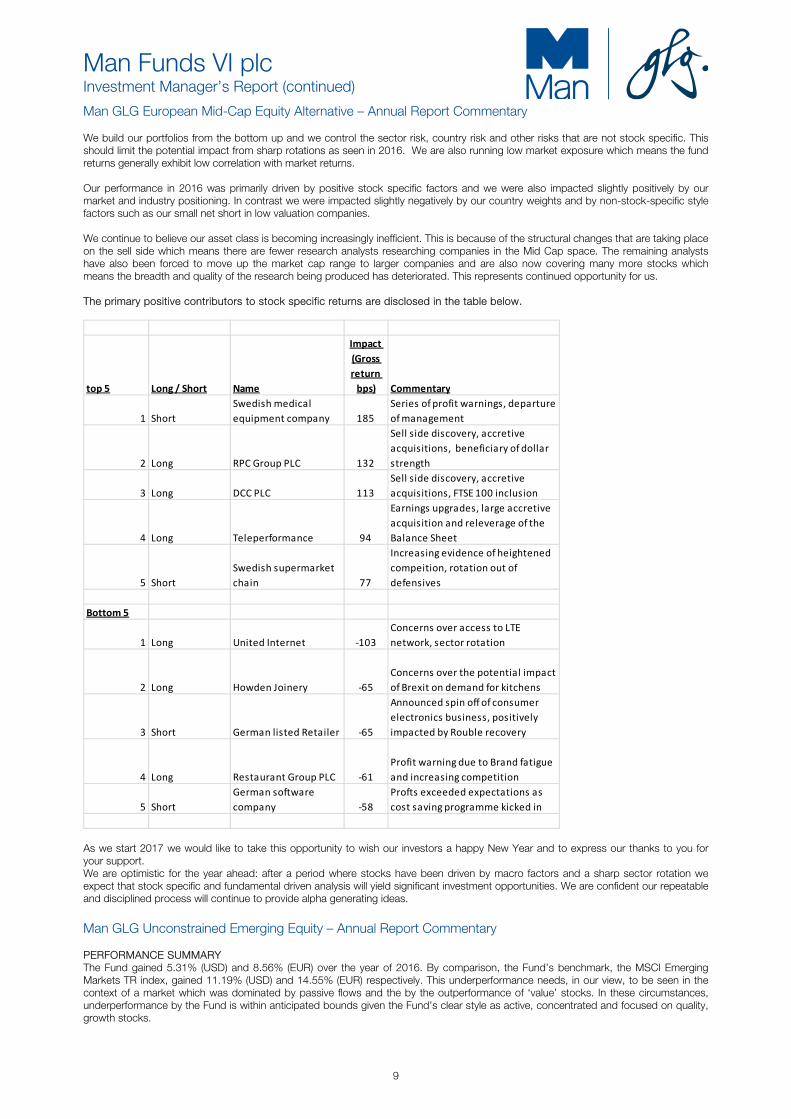
Man GLG European Mid-Cap Equity Alternative – Annual Report Commentary We build our portfolios from the bottom up and we control the sector risk, country risk and other risks that are not stock specific. This should limit the potential impact from sharp rotations as seen in 2016. We are also running low market exposure which means the fund returns generally exhibit low correlation with market returns. Our performance in 2016 was primarily driven by positive stock specific factors and we were also impacted slightly positively by our market and industry positioning. In contrast we were impacted slightly negatively by our country weights and by non-stock-specific style factors such as our small net short in low valuation companies. We continue to believe our asset class is becoming increasingly inefficient. This is because of the structural changes that are taking place on the sell side which means there are fewer research analysts researching companies in the Mid Cap space. The remaining analysts have also been forced to move up the market cap range to larger companies and are also now covering many more stocks which means the breadth and quality of the research being produced has deteriorated. This represents continued opportunity for us. The primary positive contributors to stock specific returns are disclosed in the table below.
top 5 Long / Short Name
Impact (Gross return
bps) Commentary
1 ShortSwedish medical equipment company 185
Series of profit warnings, departure of management
2 Long RPC Group PLC 132
Sell side discovery, accretive acquisitions, beneficiary of dollar strength
3 Long DCC PLC 113Sell side discovery, accretive acquisitions, FTSE 100 inclusion
4 Long Teleperformance 94
Earnings upgrades, large accretive acquisition and releverage of the Balance Sheet
5 ShortSwedish supermarket chain 77
Increasing evidence of heightened compeition, rotation out of defensives
Bottom 5
1 Long United Internet -103Concerns over access to LTE network, sector rotation
2 Long Howden Joinery -65Concerns over the potential impact of Brexit on demand for kitchens
3 Short German listed Retailer -65
Announced spin off of consumer electronics business, positively impacted by Rouble recovery
4 Long Restaurant Group PLC -61Profit warning due to Brand fatigue and increasing competition
5 ShortGerman software company -58
Profts exceeded expectations as cost saving programme kicked in
As we start 2017 we would like to take this opportunity to wish our investors a happy New Year and to express our thanks to you for your support. We are optimistic for the year ahead: after a period where stocks have been driven by macro factors and a sharp sector rotation we expect that stock specific and fundamental driven analysis will yield significant investment opportunities. We are confident our repeatable and disciplined process will continue to provide alpha generating ideas. Man GLG Unconstrained Emerging Equity – Annual Report Commentary PERFORMANCE SUMMARY The Fund gained 5.31% (USD) and 8.56% (EUR) over the year of 2016. By comparison, the Fund’s benchmark, the MSCI Emerging Markets TR index, gained 11.19% (USD) and 14.55% (EUR) respectively. This underperformance needs, in our view, to be seen in the context of a market which was dominated by passive flows and the by the outperformance of ‘value’ stocks. In these circumstances, underperformance by the Fund is within anticipated bounds given the Fund’s clear style as active, concentrated and focused on quality, growth stocks.
Man Funds VI plc
Investment Manager’s Report (continued)
10
Man GLG Unconstrained Emerging Equity – Annual Report Commentary
MARKET SUMMARY 2016 was the sixth year in succession that Emerging Markets (‘EM’) underperformed Developed Markets (‘DM’), however for the first year in four EM rose in absolute terms. Indeed, until the US election result in November sparked off significant outperformance by US markets in particular, EM had outperformed DM by almost 10%. This improved performance in EM is, we believe, the result of the factors below:
Despite a resumption of US dollar strength post the US elections, highly volatile asset classes such as commodities and high-yield bonds had a very good year. EM has historically been correlated with these asset classes.
The Chinese economy was more resilient in 2016 than expected, with credit growth, the housing market and infrastructure development proving supportive. Capital flight out of China also appeared to have been brought under control by the authorities. In these circumstances, the concerns over China that had proved a hurdle to performance in EM in 2015 largely dissipated.
In certain other major EM’s, political developments were more favourable than in 2015. This was notably the case in Brazil, where a new government took power after the impeachment of President Rousseff, and signalled its commitment to reform. In India, the government took drastic structural measures to attempt to improve the formalisation of the economy and improve its tax base.
KEY POSITIONS The Fund’s investment style can be characterised as ‘quality growth at a reasonable price’, meaning that the Managers seek out investment opportunities in businesses which they perceive to have good growth prospects and the ability to finance that growth through internal cash flow and solid balance sheets, but whose shares have upside potential on valuation grounds. Thus the average weighted return on invested capital of the Fund’s was significantly higher than that of the benchmark, but the Fund had lower debt to equity and a lower free cash-flow based valuation, on average. These investments are made across a concentrated portfolio that comprised 45 companies at the end of the period, with the five largest positions being ITC Limited (consumer goods, India), Check Point Software (security software, Israel), FEMSA (consumer goods, Mexico), Korea Zinc (metals processing, Korea) and Tencent Holdings (internet, China). The largest country allocation was to India (19.9% of the Fund), followed by China (18.9% of the Fund, of which 7.8% to domestic shares).
MARKET / FUND OUTLOOK The managers do not anticipate that the bias towards value and benchmarking so prevalent in 2016 will remain so extreme in the future. The managers have seen such periods before and their experience is that such periods of intense style concentration can create contrarian opportunities to reinforce positions in existing position which are ‘out of favour’. Furthermore, the managers continue to believe that China’s long-term growth will inexorably decline and that this will provide a ceiling to the performance of commodities and cyclical assets. Nevertheless, the managers remain positive on the opportunities of investment in a variety of EM markets. Sentiment towards emerging markets still remains depressed compared to that towards the US. The Managers believe that valuations in EM appear to be particularly attractive when adjusted for the cyclically low level of earnings in emerging markets. Thus, we remain fundamentally optimistic that investment in good emerging market companies at today’s depressed prices will prove rewarding to the long-term investor. Past performance is not indicative of future results. Returns may increase or decrease as a result of currency fluctuations. Performance data is shown net of fees with income reinvested, and does not take into account sales and redemption charges where such costs are applicable.
Man GLG Global Emerging Markets Debt Total Return – Annual Report Commentary
Market Review
Emerging Market (EM) Hard Currency (H.C.) and EM local currency segment (L.C.), as measured by JP Morgan Emerging Market Bond Index Global (JPM EMBIG) and JP Morgan Government Bond Index Emerging Market Global Diversified (JPM GBI-EM GD) were up by an impressive 10.19% and 9.94% in 2016. Improved EM economic fundamentals, after five years of an economic slowdown, EM currency depreciation and policy adjustment, allowed the EM markets to ripe the benefits of the environment of global search for yield, amid the still expansionary G-3 monetary policy regimes.
The performance, was more muted since the Man GLG Global Emerging Markets Debt EMD total return fund (the Fund) was launched in 3 May 2016, with the JPM EMBIG and JPM GBI-EM GD returning -3.45% and +2.76%, respectively. Even so, the market showed a remarkable level of resilience in the face of various potential disruptive events, coming from the European Union (the Brexit vote, the recapitalisation of Italian banks, the Italian constitutional referendum, and the Hungarian referendum about EU refugee quotas), the U.S. presidential election in November and the subsequent surge in U.S. yields.
Performance in 2016, was also unabated by the political noise coming from some of EM countries such as, the 1MDB corruption scandal in Malaysia, the corruption scandal and impeachment of Dilma Rousseff in Brazil, the military coup attempt in Turkey, the political fighting between Jacob Zuma and Pravin Gordhan in South Africa, or the devaluation of the Nigerian naira.
PERFORMANCE The fund in the 8 months since inception to year end, returned net of fees +5.76%1 , in a period that the blend of the index for the EM Hard currency and Local Currency2 returned -0.34%, and with volatility of returns that was about half of that of the blend (4.5% versus 8.4%). About 78% of this return was originated by the active management of its EM currency positions3, with the biggest contributors to performance being the long exposure to the ZAR, BRL and COP, and the short position to the TRY. The long to the MXN was the major detractor in the L. C. segment. In the H.C. the largest contributors to performance were the long exposures to Mexico, Colombia, Argentina, Brazil, while the largest detractors were the short exposure to Russia, Kazakhstan and Lebanon.

Man Funds VI plc
Investment Manager’s Report (continued)
11
Man GLG Global Emerging Markets Debt Total Return – Annual Report Commentary (continued) PERFORMANCE Interesting to note, that when the blend of the EM Hard Currency and Local Currency indexes moved up, between June and November, the Fund captured 75% of that upside. However, it avoided, to a great extent, the drawdowns of the months of May and November, where the blend was down by -1.3% and -5.9% respectively, and the Fund dropped by just -0.1% and -0.5%, respectively. This is synchrony with the aim of the strategy of maximizing upside capture while minimizing the downsize capture in the blend of external and local debt benchmarks, thus seeking to deliver positive absolute returns while reducing volatility normally associated with emerging markets. Fund Activity: During most of 2016, the Fund ran a conservative position in the H.C space, as we saw very limited upside to returns coming from further yield compression and believed that the deteriorating credit quality of some of its components was not fully reflected in the level of EM spreads4. As a result, the Fund in this segment was skewed towards the short end 5, where the movement of pull-to-par offered protection from a potential upward move in USD interest rates and volatility in EM spreads. Duration weighted exposure (DWE) was low, ranging throughout the year from -0.25 years to 1.1 years, while credit spread duration (Spread DWE) 6 exposure ranged from -0.7 years to 1.3 years. In December we increased the DWE of the fund from 1.1 years to 1.9 years, while we kept the Spread DWE stable at 0.7 years. This reflected our view that US Treasury yields, having increased about 0.80% in the last quarter of 2016, had some ground to stabilise in the short term, while, in contrast, EM spreads, that in the same period only moved 0.05% wider, were more vulnerable to a correction. Throughout last year, we remained more constructive on L.C. and fairly positive on some important segments in this space. From a fundamental perspective, the flexible exchange rate regimes allowed these countries, through currency depreciation, to substantially improve their current accounts and, by extension, their balance of payments. On valuations, the JPM GBI EM GD weighted bilateral real exchange rate closed 2016 trading below the levels seen during the 2008 Great Financial crisis. Lastly, market positioning remained much cleaner in this segment of the asset class with market risk concentration by professional managers significantly underinvested or outright short. 1 USD Institutional share class, ISIN: IE00BD3B6F79. Returns are net calculated and are up to December 30th 2016. Please note that past performance is no indicator of future performance. 2 Measured as 50% JPM EMBIG and 50% JPM GBI-EM GD. 3 At end of December 2016, the fund had a 50% net long exposure in local markets. Average since inception has been 37% net long invested position. 4 Measured as the difference between the yield of JPM EMBIG and the yield of U.S. Treasuries. 5 External debt portion at the end of 2016 was 52%. Average since inception was 33% net long invested position. 6 Spread duration is a measure of a bond's price sensitivity to spread changes (estimate of how much the price of a specific bond will move when the spread of that specific bond changes). In this event, the Fund was underweight in Spread duration as the spread duration of its portfolio was lower than that of its benchmark. While most currencies in JPM GBI EM currency seemed to be on the cheap side versus the USD, the MXN stood out as the cheapest, with the real effective exchange rate at a level similar to the prevailing just after the Tequila crisis, back in 1995, when the country’s fundamentals were considerably worse. In addition to the MXN, our other key long FX positions at the end of 2016 were ZAR, COP and the BRL. Outlook: We expect EM market conditions to remain volatile in 2017, given the increased political uncertainty globally on the back of Trump’s victory and upcoming European elections, shifting monetary policy in U.S., and rising U.S. Treasury yields. However, we are constructive on the segment overall as EM real GDP growth is expected to rise in 2017 and 2018, outlook for oil and other commodities is more stable (versus same time last year) and valuations may become more attractive as volatility unfolds. We view local currency instruments as one of the few areas within the EM debt universe that are attractively valued, supported by fundamentals, relatively underinvested, offers an attractive yield, and gives the potential for capital gains if our assumptions prove to be correct. We believe that EM currencies are mispriced because the majority of investors who historically took exposure to them did so during the period when valuations were at their peak. When these currencies depreciated to allow EM economies to adjust to the reality of a slower Chinese and Global economy, these investors experienced extremely painful losses which subsequently led to outflows and unusually clean market positioning. We also believe that the case for hard currency debt has improved, although the path will be bumpier than what investors have been used in the past. EM external debt yields, having risen over 0.90% since their minimum in September 2016, are becoming more attractive. Given our expectation that U.S. yields should continue to gradually normalise, we believe the short-end of hard currency curve of countries with strong balance sheet and floating currency regime may offer attractive risk adjusted carry. EM spreads, on the other hand, remain at historical tight levels and may be more vulnerable to a correction. We think that one of the key drivers behind a potential rise in EM spreads could be losses coming from credit stress events in countries with fragile fundamentals (commodity dependent countries, with apparently strong balance sheets but heavily managed currency regimes) which we believe will happen with increasing regularity. Market positioning in H.C. seems cleaner, despite the strong showing in EM hard currency new issuance in 2016 that is showing no signs of abating as we started 2017. Particularly, the Beta to benchmark of the largest H.C. mutual funds that peaked in mid-2016 at a level around 2, coming down to 1 as we approached year end. Likewise, year-to-date EM H.C. fund flows that peaked at around USD 43.2 billion at the time of U.S. elections, closed the year at a still strong, but more modest, USD33.6bn. In this environment, an investment approach combining flexibility, selectivity and focus on downside protection, such as the one of this Fund, is crucial.
Man Funds VI plc
Investment Manager’s Report (continued)
12
Man GLG Global Fundamental Equity – Annual Report Commentary (continued) Performance and Market: the Equity Hedge fund index (HFRXEH Index) 1 returned +0.18% in Dec-2016. The fund only commenced operation on 29-Dec-2016 and there were only cashflows coming in with no equity positions at the end of 2016. Therefore the fund performance and contribution breakdown are not available for Dec-2016. The Fund started investing in equities in mid-January 2017. Fund Performance: N/A Contribution Breakdown: N/A Outlook: Currently we are focused on 4th quarter of 2016 earnings season and aiming to take advantage of situations where market expectations appear to be missing core micro fundamental changes. We have been selectively using options when appropriate to further isolate the event to strive to be more capitally efficient in seeking Alpha during earnings season when our theses are often tested. Retail Outlook We think the sentiment around France election is too negative. We expect French retailers to benefits from food inflation in second half year of 2017 which should be a positive for French Food Retailers gross margin and free cash flow. Chemicals Outlook We expect significant earnings upgrades for midstream and upstream players. We are less excited by downstream players where we see elevated valuation and gross margin pressure due to sharp oil price recovery and other inputs pressure such as TiO2. However, we still like selected consumer downstream producers such as some paint companies or Fragrance and Flavours companies. Fertilizers Outlook We believe Urea and Potash will continue to generate limited cash due to incremental capacities being ramped up in North America. We are getting more constructive on end-demand but we see better entry points in second half year of 2017 or first half year of 2018. Automotive Outlook We are getting less constructive on OEM’s due to (1) demand normalization in China and North America; and (2) raw materials headwind (1 ton of steel and 2 oil barrels per vehicle). We think earnings and cash growth should be very limited in 2017. We recently turned net negative on the automotive sector. Steels/Construction We are constructive on European and Asian steel makers which we believe should improve their cash generation from 2nd quarter of 2017 onwards driven by 200euro/ton increase year-on-year. Transports We like cheap European long haul carriers exposed to Asian routes which we believe should benefit from yields improvement driven by better traffic. We are less constructive on European budget long and short hauls. The value of an investment and any income derived from it can go down as well as up and investors may not get back their original amount invested. Alternative investments can involve significant additional risks. 1 Please note that the Equity Hedge fund index is not a formal benchmark and does not form part of the Fund’s investment objectives or investment policy. Man GLG Innovation Equity Alternative – Annual Report Commentary (continued) Performance and Market: the Equity Hedge fund index (HFRXEH Index) 1 returned +0.18% in Dec-2016. The Fund only commenced operation on 29 December 2016 and there was only cashflows coming in with no equity positions at the end of 2016. Therefore the Fund performance and contribution breakdown are not available for Dec-2016. The Fund started investing in equities in early January 2017. Fund Performance: N/A Contribution Breakdown: N/A Outlook: Currently we are focused on 4th quarter of 2016 earnings season and aiming to take advantage of situations where market expectations appear to be missing core micro fundamental changes. We look to selectively using options when appropriate to further isolate the event to strive to be more capitally efficient in seeking Alpha during earnings season when our theses are often tested.
Looking forward, we see lots of change/disruption of various durations some driven by technology, consumer behaviour but also others driven by potential changes in policies arising from regime change. Our process is designed to look for situations where change is mispriced and we look forward to opportunities to monetise these disconnects especially as earnings season approaches in January. The value of an investment and any income derived from it can go down as well as up and investors may not get back their original amount invested. Alternative investments can involve significant additional risks. 1Please note that the HFRXEH Index is not a formal benchmark and does not form part of the Fund’s investment objectives or investment policy. For all the sub-funds past performance is not indicative of future results. Returns may increase or decrease as a result of currency fluctuations. Performance is net of all fees. The value of an investment and any income derived from it can go down as well as up and investors may not get back their original amount invested. Alternative investments can involve significant additional risks. GLG Partners LP, One Curzon Street, London W1J 5HB, England.
February 2017* * The above Investment Manager’s reports are commentaries for the reporting year 1 January 2016 to 31 December 2016 (Man GLG Global Emerging Markets Debt Total Return started operation from 3 May 2016. Man GLG Innovation Equity Alternative and Man GLG Global Fundamental Equity Alternative started operation from 29 December 2016). They do not include or take account of any movements, returns or market information for subsequent periods.

Man Funds VI plc
Investment Manager’s Report (continued)
13
Man AHL Multi Strategy Alternative – Annual Report Commentary The AHL Multi Strategy Programme (‘AMS’) made a small positive return for 2016, performing broadly in line with the HFRX Global Hedge Fund Index and out-performing the Barclay BTOP50 Index. The year was, in general, a challenging one for hedge funds and a good year for equities, which recovered well after a difficult start. Many of the models that were added into AMS most recently, especially new machine learning models, performed well which gives us confidence for the future given our substantial investment in this area. Market summary In 2016 the twin shocks of Brexit and the US election heralded the rise of a new ‘populism’, as discontented voters railed against the status quo. Arguably, the long term geopolitical impact could be deeper, longer and more uncertain than the immediate effect on markets would suggest. Major equity indices, in particular, shrugged off both events to have a solid year once they had recovered from their rocky start. Currencies were a little more reflective of events as Sterling became the major casualty of the Brexit vote and the Dollar the primary beneficiary of the US election. Performance review by style Of the five styles comprising AMS, Fundamental trading was the best performing style with Systematic Equity and Volatility both making solid positive contributions. Momentum recorded a small loss for the year and technical trading faced more challenging conditions to incur a larger loss. The fundamental component of the programme consists of a wide variety of fundamental and economic models trading futures and forwards across a broad range of stock index, fixed income and currency markets. At the start of the year, declining yields provided a profitable environment for carry-based fixed income models, whilst the relative value stock index trading model had a great run in the latter half of the year. In volatility trading, models mostly found opportunity on the short side this year, although we note that long volatility positions in, for example, Nikkei in April were profitable. Despite the effect of two sizeable shocks, volatility trading remained solidly up for the year as profit accrued in the run-up to both events proved a sufficient cushion. The equity component consists of an equity market neutral model across four global regions and an alpha capture model generating trading signals from broker recommendations. Equity market neutral had a mixed year but ended slightly up, largely thanks to a late surge by the US model. The alpha capture models had a good year, despite being hit by widespread reversals following the US election. Momentum trading within the programme comprises both traditional futures and forwards trend-following and more recent innovations such as trading individual cash equity sectors. Momentum trading had a somewhat frustrating year in which many markets lacked consistent direction. Fixed income provided some fertile ground with rallying bonds early in the year and the sell-off at the end of the year. In currencies, choppy price action early in the year gave way to a strong Dollar rally following the US election which provided a welcome boost towards the end of the year. The technical trading component comprises a diverse set of signals, often with relatively short holding periods, trading on the most liquid futures and forwards. Technical trading was by far the most challenging area in 2016. In particular, short term breakout signals struggled around events in which potential breakout events failed to follow through in subsequent price action. On the bright side, the newer machine learning predictors performed very well. OUTLOOK FOR 2017 The outlook for global markets remains highly uncertain, with significant political upheaval possible across the US, Europe, and beyond, with potentially significant ramifications for global markets. We believe the diverse alpha streams within the AHL Multi Strategy Programme should serve to insulate investors from this uncertainty whilst continuous improvement across all investment styles is designed to give us the best possible chance of performing in an uncertain world. Man AHL TargetRisk – Annual Report Commentary All sectors and nearly all markets added value this year, but importantly not all at the same time. We saw good diversification when some sectors were not working others help deliver strong performance. The end result was strong positive performance for 2016. The top sector was fixed income which started off the year strong during the sell off and Brexit referendum but suffered in the last quarter after the US elections in particular. The world bond index ended up 2.1% for the year. The top markets in the sector were both UK notional and inflation protected bonds that did especially well after the referendum. US Treasuries gave back nearly all of their performance after the election and ended up being some of the most challenging markets by the end of the year. Despite some performance give back in the last quarter the sector still managed to attribute 4.4%. Despite the selloff in Q1, equities stormed back and ended the year strongly notably the US and UK equity markets. The world index ended up 7.5%, but made nearly all of its gains in the second half of the year. In TargetRisk, equities ended up attributing 4.0% for the year. Commodities had a strong recovery in Q2 as oil recovered from two strong years of sell offs. OPEC agreed on production cuts over the year plus expectation of growth caused the commodity and most energy markets to raise over the course of the year. As a result commodities netted the fund 1.8%. Credit markets following a similar behaviour as equities also ended the year strongly. US High Yield was helped by the recovery in the oil markets as many of the names are tied to the energy sector. As a whole the sector was up 1.8% for the year.

Man Funds VI plc
Investment Manager’s Report (continued)
14
Man AHL Volatility Alternative– Annual Report Commentary While the first half of 2016 was characterised by market fluctuations and several quickly-reverting jumps in implied volatilities, the second half enjoyed long periods of range-bound markets and relatively stable implied volatilities. Realised volatilities returned to medium-run lows after the Brexit referendum, especially in US and European equity markets, where the term structure of implied volatility steepened substantially. The VIX index fell to just above 11 points in August and December, and the 3-month basis of the VIX futures rose from just under 1 vol point at the beginning of the year to over 4 at the beginning of July. Later events, such as the negative result of the Italian constitutional referendum and the surprise result of the US election, had surprisingly little long-term impact on the level of equity markets or perceived market risks. The largest move in the second half of the year came from the rise in US treasury yields as traders priced in an expectation of fiscal stimulus from the Trump administration. As a result, while the fund lost 1.5% in the first half of the year, the second half of the year was highly profitable, as it realised just over 4.5%, for an annual return of 3%. Both the gamma and vega strategies contributed positive P&L over the course of the year, with the vega strategy profitable in both halves of the year while the gamma strategy underperformed in the first half, but erased the losses and outperformed the vega strategy in the second half. The source of the vega strategy’s performance was likewise divided between halves of the year, with the fall in overall volatility levels providing the positive returns in the first half while it primarily profited from the steepness of the term structure in the second half. Within the gamma strategy, the equities sector stood out as the best performer, with the S&P leading over the entire year, followed by the DAX and FTSE, which also performed well in the second half of the year. The few exceptions to the strong performance in the equities sector were in Asia, where the gamma strategy was profitable during the second half of the year but only partially recovered from underperformance in that region during the month of January. The fixed income sector also ended the year with positive performance, despite taking some losses in the sharp rise in bond yields after the election of Trump. The only sector with negative performance in the gamma strategy was FX, which ended the year slightly negative, primarily due to losses in “safe haven” currency crosses during Brexit. For all the sub-funds past performance is not indicative of future results. Returns may increase or decrease as a result of currency fluctuations. Performance is net of all fees. The value of an investment and any income derived from it can go down as well as up and investors may not get back their original amount invested. Alternative investments can involve significant additional risks. AHL Partners LLP, Riverbank House, 2 Swan Lane, London EC4R 3AD, England February 2017* * The above Investment Manager’s reports are commentaries for the reporting year 1 January 2016 to 31 December 2016. They do not include or take account of any movements, returns or market information for subsequent periods.

Man Funds VI plc
Investment Manager’s Report (continued)
15
Man Numeric Market Neutral Alternative – Annual Report Commentary Market Overview After a tumultuous first quarter, in which equity markets fell sharply then subsequently rebounded, global equity markets stabilized in the second quarter. That is until the results of the June 23rd UK referendum (aka Brexit) were known. Central Banks were also active early in the year, as the Bank of Japan instituted negative interest rates and the European Central Bank implemented another round of quantitative easing. During the third quarter, US equity market gains were broad-based, with seven of ten economic sectors within the S&P 500 Index generating positive returns. Emerging equity markets, which have led the global stock markets higher all year, were strong during the third quarter as well and retained their pole position for the full year period. President Trump’s surprise election in early November initially brought about a sharp sell-off in global equities, but quickly turned into a market rally, particularly in the US. There was a broad divergence of outcomes across geographies and asset classes. US interest rates moved sharply higher, as investors started to question the “lower for longer” mantra of the last several years, believing that Trump’s economic policies will be bullish for growth and inflation. The USD Index strengthened to its highest level since 2002 by the end of the year, as investors anticipate the end of quantitative easing. Performance Commentary For the twelve month period ending December 31, 2016, the Man Numeric Market Neutral Alternative IN USD (the “Fund”) return was 3.70% net of fees. The fund is comprised of three complementary components; Diversified Market Neutral (“DMN”), Fundamental Statistical Arbitrage (“FSA”) and the Innovation Portfolio (“IP”). During this reporting period, all three components contributed to performance. The DMN component was the main driver of the positive performance, as six of eight of our portfolios within DMN had positive returns. The IP component was up primarily due to favorable performance from the Retail, Dislocation, Skew, and REITs sleeves. The FSA component also contributed slightly to performance for the period, with Japan and the US contributing the most to performance. Past performance is not indicative of future results. Returns may increase or decrease as a result of currency fluctuations. For all the sub-funds past performance is not indicative of future results. Returns may increase or decrease as a result of currency fluctuations. Performance is net of all fees. The value of an investment and any income derived from it can go down as well as up and investors may not get back their original amount invested. Alternative investments can involve significant additional risks. Numeric Investors LLC, 470 Atlantic Avenue, 6th Floor, Boston, MA 02210, USA February 2017* * The above Investment Manager’s reports are commentaries for the reporting year 1 January 2016 to 31 December 2016. They do not include or take account of any movements, returns or market information for subsequent periods.
Man Funds VI plc Directors’ report For the year ended 31 December 2016
16
The Directors of Man Funds VI plc (formerly GLG Investments VI Plc) (the “Fund”) herewith submit their annual report together with the financial statements for the year ended 31 December 2016.
Principal activities and review of the development of the business
The Fund was incorporated as an investment company with variable capital and with segregated liability between sub-funds capital under the laws of Ireland as a public limited company on 28 November 2007 under registration number 449860. The Fund has been authorised by the Central Bank of Ireland (the “Central Bank”) as an Undertaking for Collective Investment in Transferable Securities (“UCITS”), pursuant to the European Communities (Undertakings for Collective Investment in Transferable Securities) Regulations, 2011 (as amended) (the “Regulations”). The Fund is structured as an umbrella fund with segregated liability between sub-funds (each a “Portfolio”) and as at 31 December 2016 the Fund was comprised of twenty Portfolios: Man GLG European Alpha Alternative, GLG EM Equity Alternative, Man GLG Alpha Select Alternative, Man GLG Atlas Macro Alternative, Man GLG European Equity Alternative, Man GLG Financials Alternative, Man GLG Total Return, Man GLG Global Equity Alternative, Man GLG Asian Equity Alternative, Man GLG European Alpha Alternative Enhanced, Man GLG Cred-Eq Alternative, Man GLG European Mid-Cap Equity Alternative, Man GLG Unconstrained Emerging Equity, Man GLG Global Emerging Markets Debt Total Return, Man GLG Innovation Equity Alternative, Man GLG Global Fundamental Equity, Man AHL Multi Strategy Alternative, Man AHL Directional Equities Alternative, Man AHL Target Risk, Man AHL Volatility Alternative, Man NewSmith UK Equity Alternative and Man Numeric Market Neutral Alternative. As at 31 December 2015 there were fourteen Portfolios in operation: Man GLG European Alpha Alternative, Man GLG Alpha Select Alternative, Man GLG European Equity Alternative, Man GLG Global Equity Alternative, Man GLG Cred-Eq Alternative, Man AHL Multi Strategy Alternative, Man AHL Target Risk, Man AHL Volatility Alternative, Man GLG European Mid-Cap Equity Alternative, Man Numeric Market Neutral Alternative, Man GLG Unconstrained Emerging Equity Man GLG Global Emerging Markets Debt Total Return, Man GLG Innovation Equity Alternative and Man GLG Global Fundamental Equity.
Results for the year and state of affairs at 31 December 2016
For a detailed commentary on the results for the year and the state of affairs of the Fund at 31 December 2016 see the Investment Manager’s Report, the statements of financial position, the statements of comprehensive income and the portfolio statements.
At the year end the Fund’s Net Assets Attributable to Redeemable Participating Shareholders (the “Shareholders”) amounted to €145,165,048 for Man GLG European Alpha Alternative (31 December 2015: €450,153,595), £114,010,555 for Man GLG Alpha Select Alternative (31 December 2015: £53,241,031), €678,530,845 for Man GLG European Equity Alternative (31 December 2015: €830,639,138), £Nil for Man GLG Total Return (31 December 2015: £3,190,829), €189,198,271 for Man GLG Global Equity Alternative (31 December 2015: €320,245,498), US$Nil for Man GLG Asian Equity Alternative (31 December 2015: US$84,037,368), €Nil for Man GLG European Alpha Alternative Enhanced (31 December 2015: €28,053,572), €45,932,955 for Man GLG Cred-Eq Alternative (31 December 2015: €77,106,169), US$128,034,213 for Man AHL Multi Strategy Alternative (31 December 2015: US$144,035,894), US$Nil for Man AHL Directional Equities Alternative (31 December 2015: US$40,460,404), US$28,296,977 for Man AHL TargetRisk (31 December 2015: US$26,656,597), US$16,887,489 for Man AHL Volatility Alternative (31 December 2015: US$47,983,251), €332,177,844 for Man GLG European Mid-Cap Equity Alternative (31 December 2015: €126,781,408), US$169,455,192 for Man Numeric Market Neutral Alternative (31 December 2015: US$63,037,234), US$67,477,483 for Man GLG Unconstrained Emerging Equity (31 December 2015: US$42,886,600), US$522,262,855 for Man GLG Global Emerging Markets Debt Total Return (31 December 2015: n/a), US$20,003,899 for Man GLG Innovation Equity Alternative (31 December 2015: n/a) and US$18,078,008 for Man GLG Global Fundamental Equity (31 December 2015: n/a). All Classes of Redeemable Participating Shares are together known as the “Redeemable Participating Shares” or “Shares”.
The returns of the classes of each sub-fund for the year end are disclosed in the tables below:
Funds and Classes 31 December 2016 31 December 2015Man GLG European Alpha AlternativeClass DN EUR (2.62%) (1.21%)Class DN H GBP (2.12%) (0.67%)Class DN H USD (1.47%) (0.80%)Class IN EUR (1.87%) (0.47%)Class IN H GBP (1.38%) (0.02%)Class IN H USD (0.79%) (0.18%)
Man GLG Alpha Select AlternativeClass DN GBP (1.85%) 4.35%Class DN H EUR (2.34%) 3.72%Class DN H SEK (1.84%) n/aClass DN H USD (1.19%) 4.07%Class IN GBP (1.11%) 4.97%Class IN H EUR (1.69%) 4.29%Class IN H JPY^ (4.16%) n/aClass IN H SEK (1.12%) n/aClass IN H USD (0.46%) 4.68%Class IN U GBP (0.79%) n/a
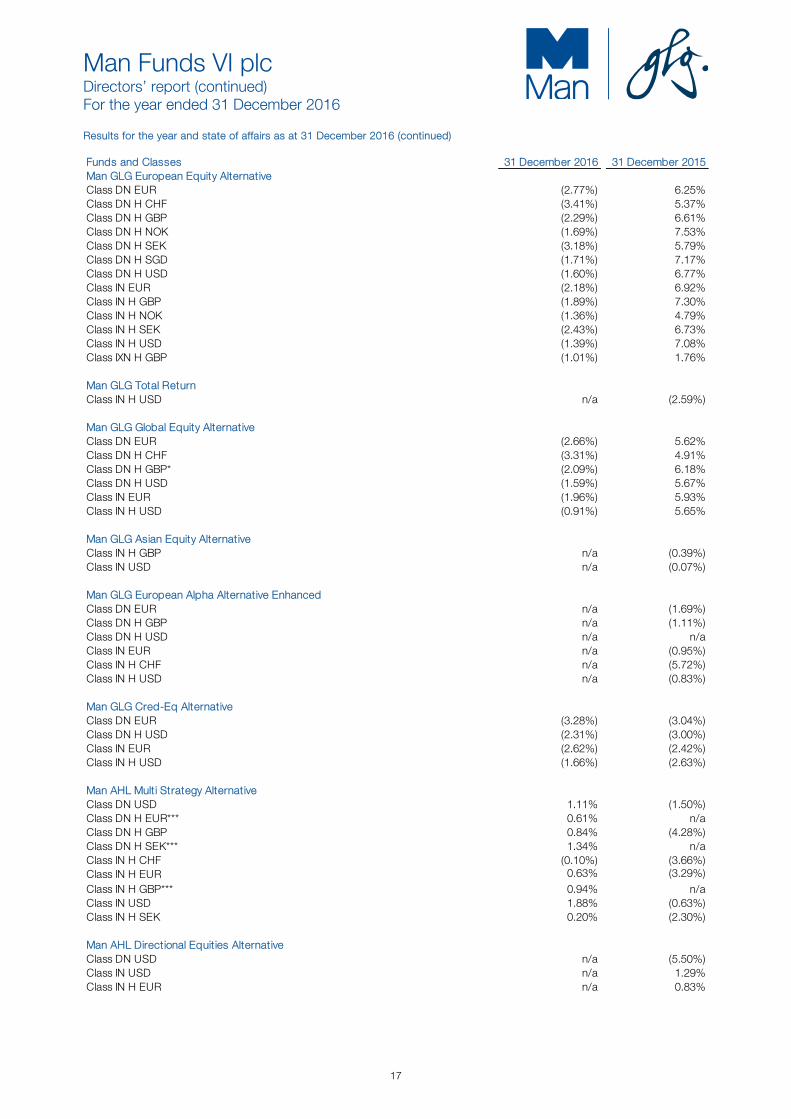
Man Funds VI plc Directors’ report (continued) For the year ended 31 December 2016
17
Results for the year and state of affairs as at 31 December 2016 (continued) Funds and Classes 31 December 2016 31 December 2015Man GLG European Equity AlternativeClass DN EUR (2.77%) 6.25%Class DN H CHF (3.41%) 5.37%Class DN H GBP (2.29%) 6.61%Class DN H NOK (1.69%) 7.53%Class DN H SEK (3.18%) 5.79%Class DN H SGD (1.71%) 7.17%Class DN H USD (1.60%) 6.77%Class IN EUR (2.18%) 6.92%Class IN H GBP (1.89%) 7.30%Class IN H NOK (1.36%) 4.79%Class IN H SEK (2.43%) 6.73%Class IN H USD (1.39%) 7.08%Class IXN H GBP (1.01%) 1.76%
Man GLG Total ReturnClass IN H USD n/a (2.59%)
Man GLG Global Equity AlternativeClass DN EUR (2.66%) 5.62%Class DN H CHF (3.31%) 4.91%Class DN H GBP* (2.09%) 6.18%Class DN H USD (1.59%) 5.67%Class IN EUR (1.96%) 5.93%Class IN H USD (0.91%) 5.65%
Man GLG Asian Equity AlternativeClass IN H GBP n/a (0.39%)Class IN USD n/a (0.07%)
Man GLG European Alpha Alternative EnhancedClass DN EUR n/a (1.69%)Class DN H GBP n/a (1.11%)Class DN H USD n/a n/aClass IN EUR n/a (0.95%)Class IN H CHF n/a (5.72%)Class IN H USD n/a (0.83%)
Man GLG Cred-Eq AlternativeClass DN EUR (3.28%) (3.04%)Class DN H USD (2.31%) (3.00%)Class IN EUR (2.62%) (2.42%)Class IN H USD (1.66%) (2.63%)
Man AHL Multi Strategy AlternativeClass DN USD 1.11% (1.50%)Class DN H EUR*** 0.61% n/aClass DN H GBP 0.84% (4.28%)Class DN H SEK*** 1.34% n/aClass IN H CHF (0.10%) (3.66%)Class IN H EUR 0.63% (3.29%)Class IN H GBP*** 0.94% n/aClass IN USD 1.88% (0.63%)Class IN H SEK 0.20% (2.30%)
Man AHL Directional Equities AlternativeClass DN USD n/a (5.50%)Class IN USD n/a 1.29%Class IN H EUR n/a 0.83%

Man Funds VI plc Directors’ report (continued) For the year ended 31 December 2016
18
Results for the year and state of affairs as at 31 December 2016 (continued) Funds and Classes 31 December 2016 31 December 2015Man AHL TargetRiskClass D H EUR*** (3.33%) n/aClass D H SEK*** (2.63%) n/aClass D USD*** (3.12%) n/aClass I H EUR*** 0.49% n/aClass I H GBP*** (2.27%) n/aClass I H SEK*** (3.08%) n/aClass I USD 11.55% (0.66%)
Man AHL Volatility Alternative
Class DN USD*** 0.86% n/aClass IN USD 2.99% (2.47%)Class IN H EUR 1.68% (2.98%)
Man GLG European Mid-Cap Equity AlternativeClass DN EUR*** 3.03% n/aClass DN H SEK*** 1.36% n/aClass DN H USD 3.90% 6.55%Class DNY EUR*** 1.77% n/aClass IN EUR*** 4.90% 2.64%Class IN F EUR 4.27% 3.63%Class IN H CHF 0.29% n/aClass IN H GBP 4.32% 7.16%Class IN H SEK*** 0.92% n/aClass IN H USD 4.77% 7.02%Class INF H CHF 3.71% 0.45%Class INF H GBP 4.72% 1.64%Class INF H USD 5.43% 3.00%
Man Numeric Market Neutral AlternativeClass DN H EUR*** 4.84% n/aClass DN H NOK*** 5.53% n/aClass DN H SEK*** 5.89% n/aClass DN USD 2.99% 0.62%Class IN H CHF*** (1.23%) n/aClass IN H EUR 2.43% 0.66%Class IN H NOK*** 5.68% n/aClass IN H SEK*** 6.49% n/aClass IN USD 3.70% 1.22%Class INU H EUR*** 0.06% n/aClass INU H GBP Dist*** (0.14%) n/aClass INU USD*** 0.13% n/a
Man GLG Unconstrained Emerging EquityClass D C SEK*** 10.99% n/aClass D C USD*** (4.23%) n/aClass DF C NOK*** 0.56% n/aClass DF C SEK*** (0.47%) n/aClass DF C USD*** (4.53%) n/aClass I C SEK*** 11.75% n/aClass I C USD 5.09% (1.68%)Class IF C EUR 8.56% 3.94%Class IF C GBP 25.61% 4.74%Class IF C NOK*** (1.96%) n/aClass IF C SEK*** (0.34%) n/aClass IF C USD 5.31% 1.94%

Man Funds VI plc Directors’ report (continued) For the year ended 31 December 2016
19
Results for the year and state of affairs as at 31 December 2016 (continued)
Funds and Classes 31 December 2016 31 December 2015Man GLG Global Emerging Markets Debt Total Return***Class D H EUR 4.34% n/aClass D H GBP 5.05% n/aClass D H NOK 1.88% n/aClass D H SEK 4.06% n/aClass D USD 5.37% n/aClass DL H EUR 3.03% n/aClass DMF USD 1.18% n/aClass DY USD 1.73% n/aClass I H CHF 0.83% n/aClass I H EUR 4.79% n/aClass I H EUR Dist 3.27% n/aClass I H GBP 5.38% n/aClass I H NOK 1.81% n/aClass I H SEK 4.55% n/aClass I USD 5.76% n/aClass IL H EUR 4.39% n/aClass IL USD 5.26% n/aClass IMF H EUR 1.69% n/aClass IMF H EUR Dist 4.96% n/aClass IMF H GBP Dist 1.44% n/aClass IMF USD 5.50% n/a
Man GLG Innovation Equity Alternative***Class IN H CHF - n/aClass IN H EUR - n/aClass IN H GBP - n/aClass IN H NOK - n/aClass IN H SEK - n/aClass IN USD - n/a
Man GLG Global Fundamental Equity***IN EUR - n/aINH GBP - n/aIN H CHF - n/aIN H NOK - n/aIN H SEK - n/aIN H USD - n/a
^Class IN H JPY in Man GLG Alpha Select Alternative ceased trading on 13 October 2016, the return shown above is for the period from 1 January 2016 to 13 October 2016.
* Class DN H GBP in Man GLG Global Equity Alternative ceased trading on 20 December 2016, the return shown above is for the period from 1 January 2016 to 20 December 2016.
***The return shown above for the share classes of respective portfolios is for the period from launch date to 31 December 2016. For details of new share classes launched during the year please refer to note 20.
Dividends
The Directors do not propose the payment of a dividend at this time (2015: US$Nil).
Future developments
The Fund will continue to pursue the Portfolios’ investment objectives as outlined in note 1.
Significant events during the year
Prospectus A new Prospectus was issued on 6 May 2016 to reflect the authorisation by the Central Bank of a new sub-fund, Man GLG Emerging Markets Debt Total Return. The Prospectus also included amendments in order to address disclosure requirements pursuant to recent regulatory requirements, including Directive 2014/91/EU of the European Parliament and of the Council of 23 July 2014 (the “UCITS V Directive”) and the Central Bank (Supervision and Enforcement Act) 2013 (Section 48(1)) (Undertakings for Collective Investment in Transferable Securities Regulations) 2015, (the “Central Bank UCITS Regulations”)”. The Prospectus also reflected the revocation of authorisation by the Central Bank of the following sub-funds since the date of the most recent prior Prospectus (GLG EM Currency & Fixed Income Alternative, GLG EM Diversified Alternative, Man Commodities Fund, GLG Global Emerging Markets Macro Alternative and Man NewSmith European Equity Alternative). It also reflected the change in dealings procedure where each business day is now both a dealing day and a valuation day.
Addendum dated 9 December 2016 was issued to reflect the authorisation by the Central Bank of two new sub-funds, Man GLG Innovation Equity Alternative and Man GLG Global Fundamental Equity.

Man Funds VI plc Directors’ report (continued) For the year ended 31 December 2016
20
Significant events during the year (continued)
Portfolios Man GLG Global Emerging Markets Debt Total Return commenced operations on 3 May 2016. Man GLG Innovation Equity Alternative and Man GLG Global Fundamental Equity commenced operations on 29 December 2016.
Man GLG Total Return, Man GLG Asian Equity Alternative, Man GLG Directional Equities alternative and Man GLG European Alpha Alternative Enhanced ceased operations on 8 February 2016, 20 April 2016, 30 September and 23 December 2016 respectively.
De-listing of Share Classes Share classes D H USD and I H USD of Man GLG Total Return were delisted from Irish Stock Exchange on 7 December 2016.
Share class IN H NOK of Man GLG Global Equity Alternative was delisted from Irish Stock Exchange on 7 December 2016.
For detailed information on new share classes launched during the year please refer Note 20.
Effective 6 October 2016, GLG Investments VI plc was renamed Man Funds VI plc.
In response to the CBI publishing the Central Bank (Supervision and Enforcement) Act 2013 (Section 48(1)) Investor Money Regulations 2015 for Fund Service Providers (the “Investor Money Regulations” or “IMR”) in March 2015 (effective from 1 July 2016), the Manager undertook, together with BNY Mellon Fund Services (Ireland) Designated Activity Company, a review of the way in which subscription, distribution and redemption monies are routed to and from the Fund or the relevant sub-fund. As a result of this review, subscription and redemption monies will (effective from 1 July 2016), be routed through a sub-fund cash collection account in the name of the sub-fund. Pending issue of the units and / or payment of subscription proceeds to an account in the name of the sub-funds, and pending payment of redemption proceeds or distributions, the relevant investor will be an unsecured creditor of the sub-fund in respect of amounts paid by or due to it.
Michael Jackson and Victoria Parry resigned as directors of the Fund with effect from 21 April 2016 and Bronwyn Wright and Ronan Daly were appointed as directors of the Fund on 21 April 2016.
Effective 27 January 2016, BNY Mellon Fund Services (Ireland) Limited was renamed BNY Mellon Fund Services (Ireland) DAC.
Effective 14 April 2016, BNY Mellon Trust Company (Ireland) Limited acts as Depositary.
Effective 21 April 2016 Matheson replaced J&E Davy as listing sponsor to the Fund.
Effective 6 October 2016 GLG Partners Asset Management Limited was renamed to Man Asset Management (Ireland) Limited.
There were no other significant events during the year ended 31 December 2016.
Significant events since the year end
Effective 26 January 2017, GLG Asian Equity Alternative Fund has been removed from the Official List and from trading on the Main Securities Market of the Irish Stock Exchange.
Investment objectives
The investment objectives of each sub-fund are as stated in note 1. Investment in the Fund carries with it a degree of risk including but not limited to the risks referred to in note 6 of these Financial Statements. For a more detailed description of risks associated with investment in the Fund, please refer to the Prospectus.
Directors and Secretary
The Directors and secretary during the year and up to 21 April 2017 are listed on page 1. Unless indicated, they served for the entire year.
Directors’ and secretary’s interests
Neither the Directors, nor their families, nor the secretary (Matsack Trust Limited) nor the Investment Managers had any interests in the Shares of the Fund at 31 December 2016, with the exception of one Subscriber Shares held by Man Asset Management (Ireland) Limited in a nominee capacity.
The Fund has adopted the corporate governance code for collective investment schemes and management companies issued by the Irish Funds (the “IF Code”). The Directors are satisfied that they act independently and in the interests of the Fund as a whole and have determined that Eric Fortier and Ronan Daly are independent directors as that term is defined in the IF Code.
Directors’ responsibilities
The Directors are responsible for preparing the Directors’ Report and the financial statements in accordance with Irish law and regulations.
Irish company law requires the Directors to prepare financial statements giving a true and fair view of the state of affairs of the Fund and the profit or loss of the Fund for each financial year. Under that law the Directors have elected to prepare the financial statements in accordance with International Financial Reporting Standards (“IFRS”). Under company law, the directors must not approve the financial statements unless they are satisfied that they give a true and fair view of the assets, liabilities and financial position of the Fund as at the financial year end date and of the profit or loss of the Fund for the financial year and otherwise comply with the Companies Act 2014.
In preparing these financial statements, the Directors are required to:
• select suitable accounting policies and then apply them consistently; • make judgements and accounting estimates that are reasonable and prudent; • state whether the financial statements have been prepared in accordance with applicable accounting standards and identify the
standards in question and note the effects and the reasons for any material departure from those standards; and • prepare the financial statements on the going concern basis unless it is inappropriate to presume that the Fund will continue in
business.
Man Funds VI plc Directors’ report (continued) For the year ended 31 December 2016
21
Directors’ responsibilities (continued)
The Directors are responsible for ensuring that the company keeps or causes to be kept adequate accounting records which correctly explain and record the transactions of the company, enable at any time the assets, liabilities, financial position and profit or loss of the company to be determined with the reasonable accuracy, enable them to ensure that the financial statements and directors’ report comply with the Companies Act 2014 and enable these financial statements to be audited. They are also responsible for safeguarding the assets of the Fund and hence for taking reasonable steps for the prevention and detection of fraud and other irregularities.
Legislation in Ireland governing the preparation and dissemination of financial statements may differ from legislation in other jurisdictions.
Accounting records
The Directors are responsible for ensuring that proper accounting records as outlined in Section 281 to 285 of the Companies Act 2014 (“Act”) are kept by the Fund. To achieve this, the Directors have appointed an experienced third party fund administrator to ensure that the requirements of Section 281 to 285 of the Companies Act 2014 are complied with. The books and accounting records are maintained at the Administrator’s office at Guild House, Guild Street, IFSC, Dublin 1, Ireland.
Independent auditors
The Independent auditors, Ernst & Young, Chartered Accountants, will continue in office in accordance with Section 383 (2) of the Companies Act 2014.
Corporate governance
The European Communities (Directive 2006/46/EC) Regulations (S.I. 450 of 2009 and S.I. 83 of 2010) (the “Regulations”) requires the inclusion of a corporate governance statement in the Directors’ Report.
Although there is no specific statutory corporate governance code applicable to Irish collective investment schemes whose shares are admitted to trading on the Irish Stock Exchange, the Fund is subject to corporate governance practices imposed by:
i) The Irish Companies Acts 2014 which is available for inspection at the registered office of the Fund;ii) The Articles of Association of the Fund which are available for inspection at the registered office of the Fund;iii) The Central Bank in their UCITS Notices and Guidance Notes which can be obtained from the Central Bank website at:
http://www.centralbank.ie/regulation/marketsupdate/Documents/170103_AIF%20RULEBOOK_January%202017.pdf and are available for inspection at the registered office of the Fund; and
iv) The Irish Stock Exchange (“ISE”) through the ISE Code of Listing Requirements and Procedures which can be obtained from theISE’s website at:- http://www.ise.ie
The Irish Funds (“IF”) has published the IF Code that may be adopted on a voluntary basis by Irish authorised collective investment schemes. It should be noted that the IF Code reflects existing corporate governance practices imposed on Irish authorized collective investment schemes, as noted above. If the IF Code is adopted on a voluntary basis, it can be referred to in the disclosures made in the Directors Report in compliance with the provisions of the European Communities (Directive 2006/46/EC) Regulations (i.e. S.I. 450 of 2009 and S.I. 83 of 2010).
The Board of Directors is responsible for establishing and maintaining adequate internal control and risk management systems of the Fund in relation to the financial reporting process. Such systems are designed to manage rather than eliminate the risk of error or fraud in achieving the Fund’s financial reporting objectives and can only provide reasonable and not absolute assurance against material misstatement or loss.
The Board of Directors has procedures in place to ensure all relevant books of account are properly maintained and are readily available, including production of annual financial statements. The annual financial statements of the Fund are required to be approved by the Board of Directors of the Fund and the annual financial statements of the Fund are required to be filed with the Central Bank and the Irish Stock Exchange. The statutory financial statements are required to be audited by independent auditors who report annually to the board on their findings.
The board evaluates and discusses significant accounting and reporting issues as the need arises.
The convening and conduct of shareholders’ meetings are governed by the Articles of Association of the Fund and the Companies Acts. Although the Directors may convene an extraordinary general meeting of the Fund at any time, the Directors are required to convene an annual general meeting of the Fund within twelve months of the date of the previous annual general meeting. Shareholders representing not less than ninety-five per cent of the paid up share capital of the Fund may also request the directors to convene a shareholders’ meeting. Not less than twenty one days’ notice of every annual general meeting and any meeting convened for the passing of a special resolution must be given to shareholders and fourteen days’ notice must be given in the case of any other general meeting unless the auditors of the Fund and all the shareholders of the Fund entitled to attend and vote agree to shorter notice.
Two members present either in person or by proxy constitute a quorum at a general meeting.
The Fund may from time to time by ordinary resolution increase the share capital by such amount and/or number as the resolution may prescribe.
The Fund may also by ordinary resolution: 1) consolidate all or any of its share capital into Shares of larger amount;2) subject to the provision of the Companies Acts subdivide its Shares, or any of them, into Shares of smaller amount or value and
provide for any of such Shares resulting from such sub-division to have, as compared with the others, any such preferred, deferredor other rights or be subject to any such restrictions as the Fund has power to attach to unissued or new Shares;
3) cancel any Shares which, at the date of the passing of the resolution, have not been taken or agreed to be taken by any person andreduce the amount of its authorised share capital by the amount of the Shares so cancelled; or
4) re-denominate the currency of any class of Shares.

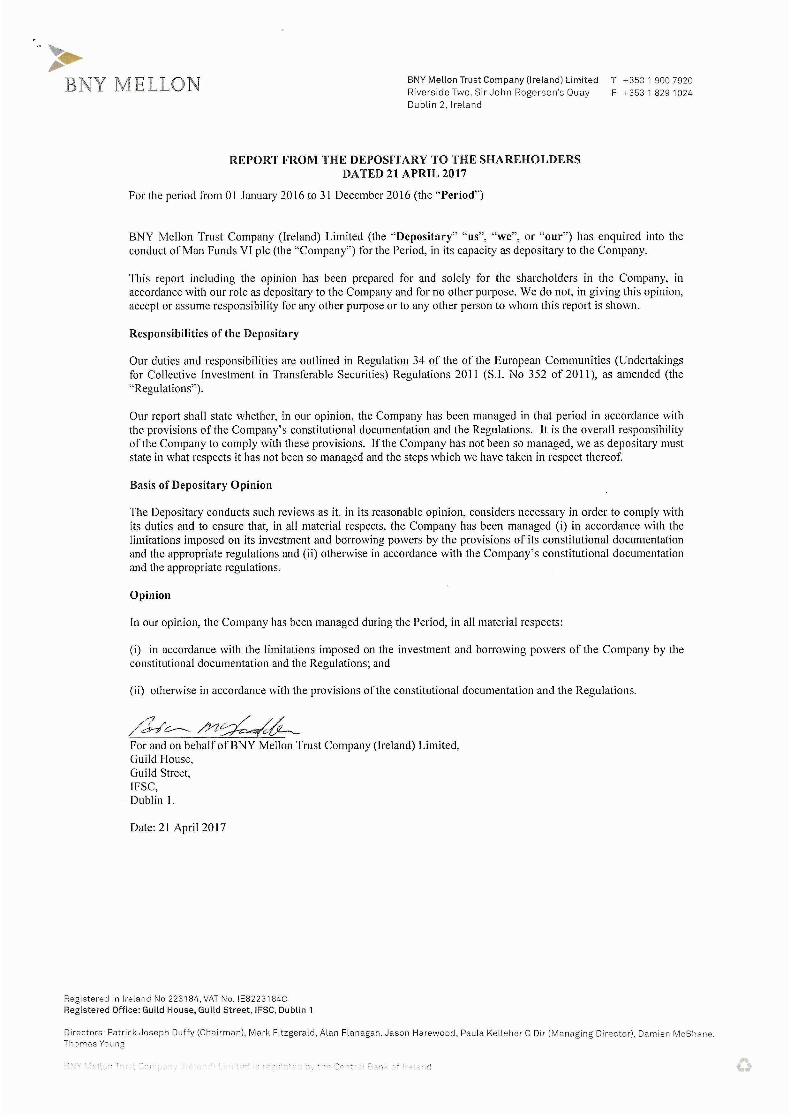

Man Funds VI plc Statement of financial position As at 31 December 2016
The accompanying notes form an integral part of the financial statements
24
Combined Company
Man GLG European
Alpha Alternative
Man GLG Alpha Select
Alternative
Man GLG European
Equity Alternative
Notes US$ € £ €AssetsCash and cash equivalents 3 306,462,764 60,409,704 27,388,735 52,358,838 Balances with brokers 3 372,786,950 18,520,665 20,942,328 122,001,178 Due from brokers 59,294,602 627 211,001 31,579,628 Financial assets at fair value through profit and loss: Equities and managed funds 4 1,361,174,599 101,636,238 2,281,741 530,904,161 Interest bearing securities 4 628,392,598 - 62,029,420 - Derivatives 4 150,310,166 285,583 6,194,183 53,735,875 Subscriptions receivable 20 19,447,998 16,720 - 7,074 Interest receivable 6,397,442 - - - Dividend receivable 1,646,164 26,944 46,567 758,537 Other assets 2,342,799 29,118 87,481 273,308 Total Assets 2,908,256,082 180,925,599 119,181,456 791,618,599
Liabilit iesBalances due to brokers 3 87,749,322 10,866,254 68,353 32,632,212 Due to brokers 76,539,130 20,786,024 89,449 14,865,890 Financial liabilities at fair value through profit and loss: Derivatives 4 150,480,428 3,466,996 4,537,222 61,120,005 Redemptions payable 20 215,691 18,206 - 176,235 Due to shareholders 20 11,397 - - - Performance fees payable 8,9 4,582,368 9,227 11,560 1,251,518 Management fees payable 8,9 3,103,437 273,888 110,986 1,179,921 Interest payable 336,695 794 3,416 117,789 Dividend payable 1,981,121 37,995 226,067 991,810 Accrued expenses and other liabilities 8,9 3,654,825 301,167 123,848 752,374
Total Liabilit ies (excluding Net Assets Attributable to Redeemable Participating Shareholders) 328,654,414 35,760,551 5,170,901 113,087,754
Net Assets Attributable to Redeemable Participating Shareholders 2,579,601,668 145,165,048 114,010,555 678,530,845
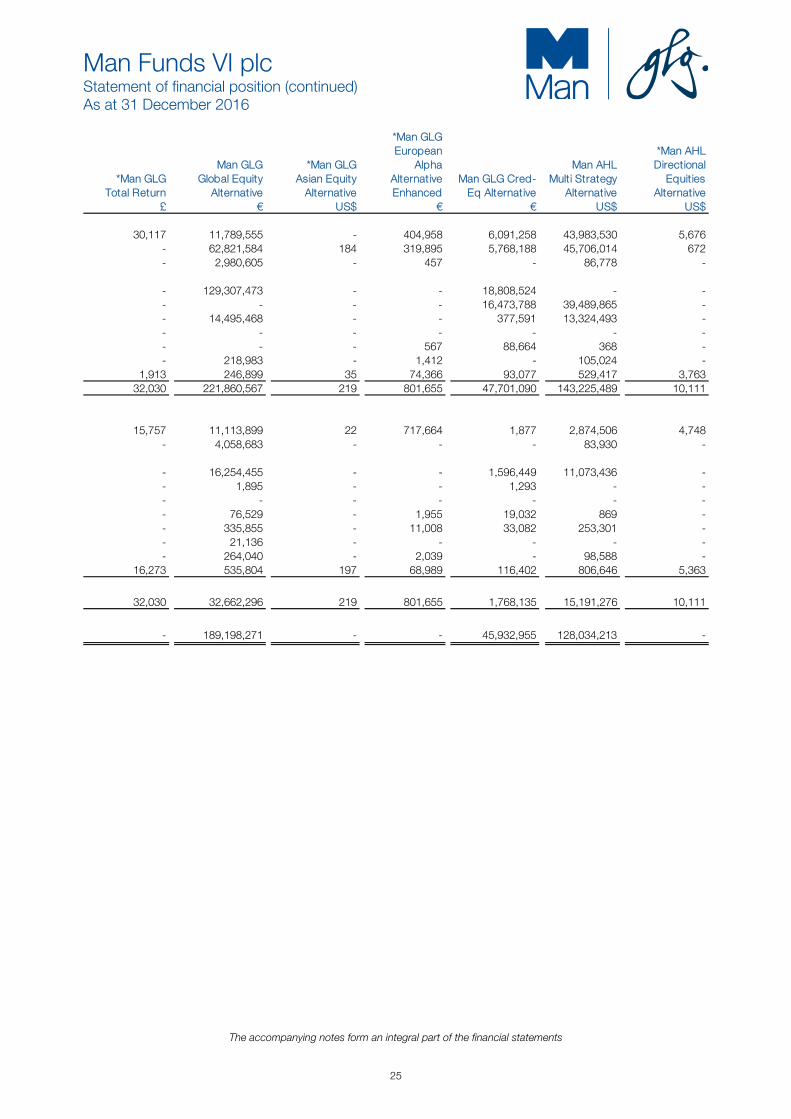
Man Funds VI plc Statement of financial position (continued) As at 31 December 2016
The accompanying notes form an integral part of the financial statements
25
*Man GLG Total Return
Man GLG Global Equity
Alternative
*Man GLG Asian Equity
Alternative
*Man GLG European
Alpha Alternative Enhanced
Man GLG Cred-Eq Alternative
Man AHL Multi Strategy
Alternative
*Man AHL Directional
Equities Alternative
£ € US$ € € US$ US$
30,117 11,789,555 - 404,958 6,091,258 43,983,530 5,676 - 62,821,584 184 319,895 5,768,188 45,706,014 672 - 2,980,605 - 457 - 86,778 -
- 129,307,473 - - 18,808,524 - - - - - - 16,473,788 39,489,865 - - 14,495,468 - - 377,591 13,324,493 - - - - - - - - - - - 567 88,664 368 - - 218,983 - 1,412 - 105,024 -
1,913 246,899 35 74,366 93,077 529,417 3,763 32,030 221,860,567 219 801,655 47,701,090 143,225,489 10,111
15,757 11,113,899 22 717,664 1,877 2,874,506 4,748 - 4,058,683 - - - 83,930 -
- 16,254,455 - - 1,596,449 11,073,436 - - 1,895 - - 1,293 - - - - - - - - - - 76,529 - 1,955 19,032 869 - - 335,855 - 11,008 33,082 253,301 - - 21,136 - - - - - - 264,040 - 2,039 - 98,588 -
16,273 535,804 197 68,989 116,402 806,646 5,363
32,030 32,662,296 219 801,655 1,768,135 15,191,276 10,111
- 189,198,271 - - 45,932,955 128,034,213 -

Man Funds VI plc Statement of financial position (continued) As at 31 December 2016
The accompanying notes form an integral part of the financial statements
26
Man AHL TargetRisk
Man AHL Volatility
Alternative
Man GLG European Mid-Cap
Equity Alternative
Man Numeric Market Neutral
AlternativeNotes US$ US$ € US$
AssetsCash and cash equivalents 3 2,996,243 9,336,447 12,063,959 21,087,866 Balances with brokers 3 4,631,979 3,828,363 26,715,409 1,046 Due from brokers - - - 21,142,418 Financial assets at fair value through profit and loss: Equities and managed funds 4 - - 305,120,717 161,753,561 Interest bearing securities 4 20,923,557 4,298,482 - - Derivatives 4 1,115,391 132,899 22,651,398 5,264,227 Subscriptions receivable 20 - - 8,168 191,867 Interest receivable 25,899 100 - 52,928 Dividend receivable - - 106,117 - Other assets 171,973 39,727 61,142 23,373 Total Assets 29,865,042 17,636,018 366,726,910 209,517,286
Liabilit iesBalances due to brokers 3 1,360,446 185,534 11,573,590 1,528,532 Due to brokers - - - 32,582,718 Financial liabilities at fair value through profit and loss: Derivatives 4 157,200 437,756 20,614,640 4,794,032 Redemptions payable 20 - - 4,878 - Due to shareholders 20 - - - - Securities sold under agreement to repurchase - - - - Performance fees payable 8,9 - 23,569 1,504,878 875,644 Management fees payable 8,9 17,128 20,856 289,261 157,736 Interest payable - - 110,963 34,756 Dividend payable - - 224,008 - Accrued expenses and other liabilities 8,9 33,291 80,814 226,848 88,676 Total Liabilit ies (excluding Net Assets Attributable to Redeemable Participating Shareholders) 1,568,065 748,529 34,549,066 40,062,094
Net Assets Attributable to Redeemable Participating Shareholders 28,296,977 16,887,489 332,177,844 169,455,192

27

Man Funds VI plc Statement of financial position As at 31 December 2015
The accompanying notes form an integral part of the financial statements
28
Combined Company
Man GLG European
Alpha Alternative
Man GLG Alpha Select
Alternative
*Man GLGAtlas Macro
AlternativeNotes US$ € £ US$
AssetsCash and cash equivalents 3 357,622,164 60,068,287 26,872,750 28,792 Balances with brokers 3 594,999,391 30,830,814 10,490,560 - Due from brokers 14,538,185 3,565,437 10,482 - Financial assets at fair value through profit and loss: Equities and managed funds 4 1,502,691,026 373,385,229 5,342,060 - Interest bearing securities 4 186,719,454 - 13,010,400 - Derivatives 4 130,952,223 12,042,241 2,867,268 - Interest receivable 481,715 - 115,266 - Dividend receivable 1,703,499 156,104 33,040 - Other assets 246,977 - 25,311 - Total Assets 2,789,954,634 480,048,112 58,767,137 28,792
Liabilit iesBalances due to brokers 3 118,390,487 5,479,395 119,068 - Due to brokers 21,480,597 - 3,189,723 - Financial liabilities at fair value through profit and loss: Equities and managed funds 4 44,957 - - - Derivatives 4 114,683,298 23,392,318 1,502,214 - Performance fees payable 8,9 4,074,073 4,030 448,335 - Management fees payable 8,9 3,983,838 529,147 92,386 - Interest payable 322,595 9,732 8,789 - Dividend payable 963,275 80,555 47,149 - Accrued expenses and other liabilities 8,9 2,573,749 399,340 118,442 28,792 Total Liabilit ies (excluding Net Assets Attributable to Redeemable Participating Shareholders) 266,516,869 29,894,517 5,526,106 28,792
Net Assets Attributable to Redeemable Participating Shareholders 2,523,437,765 450,153,595 53,241,031 -

Man Funds VI plc Statement of financial position (continued) As at 31 December 2015
The accompanying notes form an integral part of the financial statements
29
*Man GLG North American
Equity Alternative
Man GLG European Equity
Alternative
*Man GLG Financials Alternative
Man GLGTotal Return
Man GLG Global Equity
Alternative
Man GLG Asian Equity
Alternative
Man GLG European
Alpha Alternative Enhanced
US$ € € £ € US$ €
22,302 55,255,466 22,803 2,721,958 42,054,440 12,072,478 8,741,205 - 220,019,827 - 594,995 135,557,440 22,038,914 3,435,923 - 6,476,325 - 168,676 2,504,276 - 433,973
- 576,790,854 - - 174,585,874 49,937,092 21,897,438 - - - 14,091 - - - - 57,352,566 - 35,411 21,339,023 5,982,530 1,091,772 - - - 14 - 206 - - 767,651 - - 335,589 63,872 21,741 - - - 8,109 - 3,748 159
22,302 916,662,689 22,803 3,543,254 376,376,642 90,098,840 35,622,211
- 36,476,900 - 300,847 35,771,224 2,594,978 5,718,629 - 10,780,967 - - 3,819,264 - 7,902
- 41,385 - - - - - - 34,256,044 - 6,518 14,470,750 3,102,671 1,714,673 - 1,814,502 - - 838,163 30,372 - - 1,512,905 - - 579,267 144,815 52,835 - 193,365 - - 59,413 - 657 - 455,092 - - 216,174 - 10,322
22,302 492,391 22,803 45,061 376,889 188,636 63,621
22,302 86,023,551 22,803 352,426 56,131,144 6,061,472 7,568,639
- 830,639,138 - 3,190,828 320,245,498 84,037,368 28,053,572

Man Funds VI plc Statement of financial position (continued) As at 31 December 2015
The accompanying notes form an integral part of the financial statements
30
Man GLG Cred-Eq Alternative
Man AHL Multi Strategy
Alternative
Man AHL Directional
Equities Alternative
Man AHL TargetRisk
Notes € US$ US$ US$AssetsCash and cash equivalents 3 8,964,265 33,699,769 11,929,857 5,150,965 Balances with brokers 3 15,677,590 50,571,360 8,477,910 5,313,636 Due from brokers - 55,699 74,476 - Financial assets at fair value through profit and loss: Equities and managed funds 4 8,928,102 - - - Interest bearing securities 4 50,758,916 60,994,675 19,498,445 15,791,836 Derivatives 4 1,579,377 9,516,390 2,193,105 522,848 Interest receivable 248,644 170 56 16,339 Dividend receivable - 31,349 24,621 - Other assets 3,015 4,353 6,561 61,971 Total Assets 86,159,909 154,873,765 42,205,031 26,857,595
Liabilit iesBalances due to brokers 3 1,616,265 929,316 179,328 51,293 Due to brokers - 90,245 62,786 - Financial liabilities at fair value through profit and loss: Equities and managed funds 4 - - - - Derivatives 4 7,182,837 9,410,692 1,354,113 104,879 Performance fees payable 8,9 2,686 - - - Management fees payable 8,9 149,326 274,603 40,495 17,009 Interest payable - - 4,201 - Dividend payable - 11,964 35,925 - Accrued expenses and other liabilities 8,9 102,626 121,051 67,779 27,817 Total Liabilit ies (excluding Net Assets Attributable to Redeemable Participating Shareholders) 9,053,740 10,837,871 1,744,627 200,998
Net Assets Attributable to Redeemable Participating Shareholders 77,106,169 144,035,894 40,460,404 26,656,597

Man Funds VI plc Statement of financial position (continued) As at 31 December 2015
The accompanying notes form an integral part of the financial statements
31
Man AHL Volatility
Alternative
#Man GLG European Mid-
Cap Equity Alternative
#Man Numeric Market Neutral
Alternative
#Man GLG Unconstrained
Emerging Equity
US$ € US$ US$
16,795,409 27,970,926 1,828,639 11,871,342 16,497,359 13,866,337 1,158,002 19,022,101 637 39,700 - -
- 94,365,501 62,974,592 24,081,738 16,098,290 - - - 1,003,515 4,756,495 20,421 802,346 83 - 20,598 4,250 - 79,557 - 56,894
64,286 - 12,771 40,581 50,459,579 141,078,516 66,015,023 55,879,252
8 8,004,140 831,755 12,086,700 - 697,246 - -
- - - - 2,380,870 4,927,093 1,942,327 803,368 244 454,543 - - 38,912 133,300 92,483 27,403 - - 12,352 7,210 - 16,549 - -
56,294 64,237 98,872 67,971
2,476,328 14,297,108 2,977,789 12,992,652
47,983,251 126,781,408 63,037,234 42,886,600
# Man Numeric Market Neutral Alternative, Man GLG European Mid-Cap Equity Alternative and Man GLG Unconstrained Emerging Equity commenced operations on 3 March 2015, 1 April 2015 and 1 September 2015 respectively.
*Man GLG Atlas Macro Alternative Fund, Man GLG North American Equity Alternative Fund and Man GLG Financials Alternative ceased operations on 2 March 2015, 2 February 2015 and 1 July 2015 respectively.
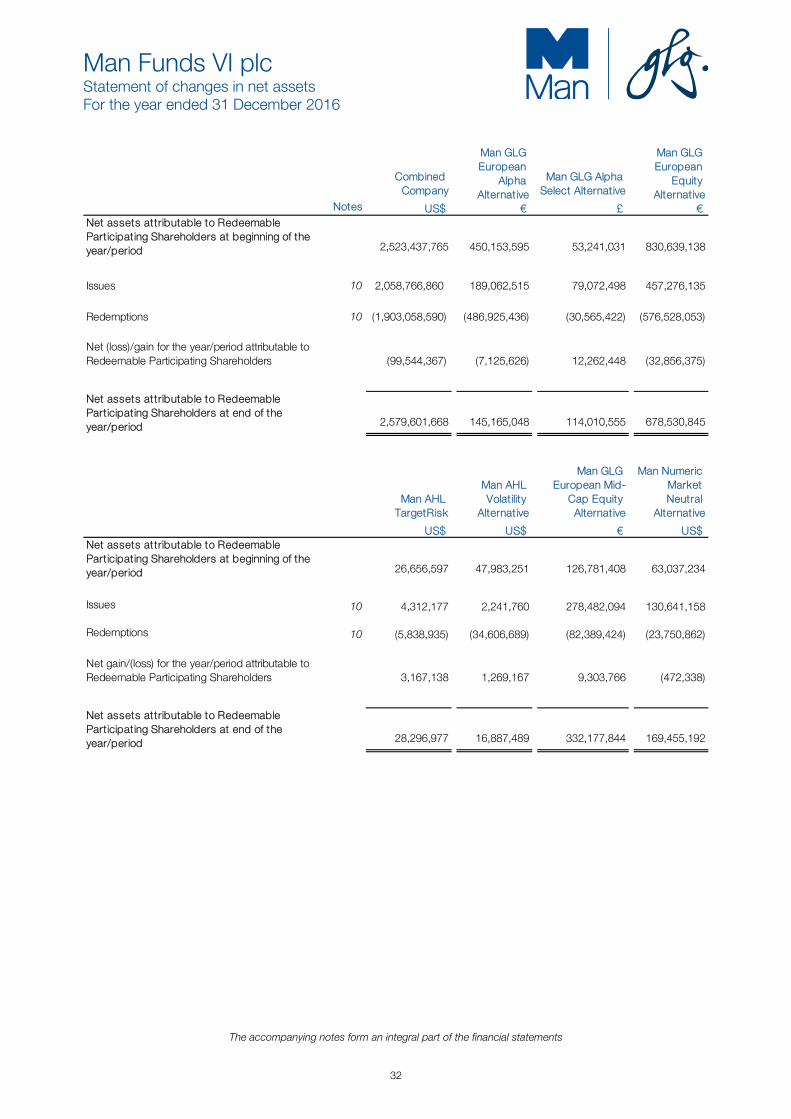
Man Funds VI plc Statement of changes in net assets For the year ended 31 December 2016
The accompanying notes form an integral part of the financial statements
32
Combined Company
Man GLG European
Alpha Alternative
Man GLG Alpha Select Alternative
Man GLG European
Equity Alternative
Notes US$ € £ €Net assets attributable to Redeemable Participating Shareholders at beginning of the year/period 2,523,437,765 450,153,595 53,241,031 830,639,138
Issues 10 2,058,766,860 189,062,515 79,072,498 457,276,135
Redemptions 10 (1,903,058,590) (486,925,436) (30,565,422) (576,528,053)
Net (loss)/gain for the year/period attributable to Redeemable Participating Shareholders (99,544,367) (7,125,626) 12,262,448 (32,856,375)
Net assets attributable to Redeemable Participating Shareholders at end of the year/period 2,579,601,668 145,165,048 114,010,555 678,530,845
Man AHL TargetRisk
Man AHL Volatility
Alternative
Man GLG European Mid-
Cap Equity Alternative
Man Numeric Market Neutral
Alternative
US$ US$ € US$Net assets attributable to Redeemable Participating Shareholders at beginning of the year/period 26,656,597 47,983,251 126,781,408 63,037,234
Issues 10 4,312,177 2,241,760 278,482,094 130,641,158
Redemptions 10 (5,838,935) (34,606,689) (82,389,424) (23,750,862)
Net gain/(loss) for the year/period attributable to Redeemable Participating Shareholders 3,167,138 1,269,167 9,303,766 (472,338)
Net assets attributable to Redeemable Participating Shareholders at end of the year/period 28,296,977 16,887,489 332,177,844 169,455,192

Man Funds VI plc Statement of changes in net assets (continued) For the year ended 31 December 2016
The accompanying notes form an integral part of the financial statements
33
*Man GLG Total Return
Man GLG Global Equity
Alternative
*Man GLG Asian Equity
Alternative
*Man GLG European Alpha
Alternative Enhanced
Man GLG Cred-Eq
Alternative
Man AHL Multi Strategy
Alternative
*Man AHL Directional
Equities Alternative
£ € US$ € € US$ US$
3,190,828 320,245,498 84,037,368 28,053,572 77,106,169 144,035,894 40,460,404
- 96,037,155 30,878 6,137,382 11,448,940 27,901,231 4,287,459
(3,483,235) (219,935,206) (77,384,480) (33,183,720) (38,567,905) (42,029,578) (40,856,723)
292,407 (7,149,176) (6,683,766) (1,007,234) (4,054,249) (1,873,334) (3,891,140)
- 189,198,271 - - 45,932,955 128,034,213 -
Man GLG Unconstrained
Emerging Equity
#Man GLG Global
Emerging Markets Debt
Total Return
#Man GLG Innovation
Equity Alternative
#Man GLG Global Fundamental
Equity
US$ US$ US$ €
42,886,600 - - -
23,668,972 569,474,626 20,004,626 18,078,008
(628,308) (41,113,681) - -
1,550,219 (6,098,090) (727) -
67,477,483 522,262,855 20,003,899 18,078,008
# Man GLG Global Emerging Markets Debt Total Return commenced operations on 3 May 2016. Man GLG Innovation Equity Alternative and Man GLG Global Fundamental Equity commenced operations on 29 December 2016. * Man GLG Asian Equity Alternative, Man GLG Total Return, Man AHL Directional Equities Alternative and Man GLG European Alpha Alternative Enhanced ceased operations on 20 April 2016, 8 February 2016, 30 September 2016 and 23 December 2016 respectively.

Man Funds VI plc Statement of changes in net assets For the year ended 31 December 2015
The accompanying notes form an integral part of the financial statements
34
Combined Company
Man GLG European
Alpha Alternative
Man GLG Alpha Select Alternative
*Man GLG Atlas Macro
Alternative
US$ € £ US$ Net assets attributable to Redeemable Participating Shareholders at beginning of the year/period 2,512,931,892 539,387,417 98,508,992 79,700,852
Issues 10 1,423,030,237 234,347,829 7,881,330 1,071,248
Redemptions 10 (1,294,188,561) (329,742,032) (58,757,353) (68,495,319)
Net (loss)/gain for the year/period attributable to Redeemable Participating Shareholders (118,335,803) 6,160,381 5,608,062 (12,276,781)
Net assets attributable to Redeemable Participating Shareholders at end of the year/period 2,523,437,765 450,153,595 53,241,031 -
Man GLG Cred-Eq Alternative
Man AHL Multi
Strategy Alternative
Man AHL Directional
Equities Alternative
Man AHL TargetRisk
€ US$ US$ US$Net assets attributable to Redeemable Participating Shareholders at beginning of the year/period 51,687,462 53,081,287 25,846,081 20,489,397
Issues 10 36,437,074 139,969,377 17,770,110 16,800,776
Redemptions 10 (8,973,481) (42,762,668) (2,928,119) (10,000,000)
Net (loss)/gain for the year/period attributable to Redeemable Participating Shareholders (2,044,886) (6,252,102) (227,668) (633,576)
Net assets attributable to Redeemable Participating Shareholders at end of the year/period 77,106,169 144,035,894 40,460,404 26,656,597
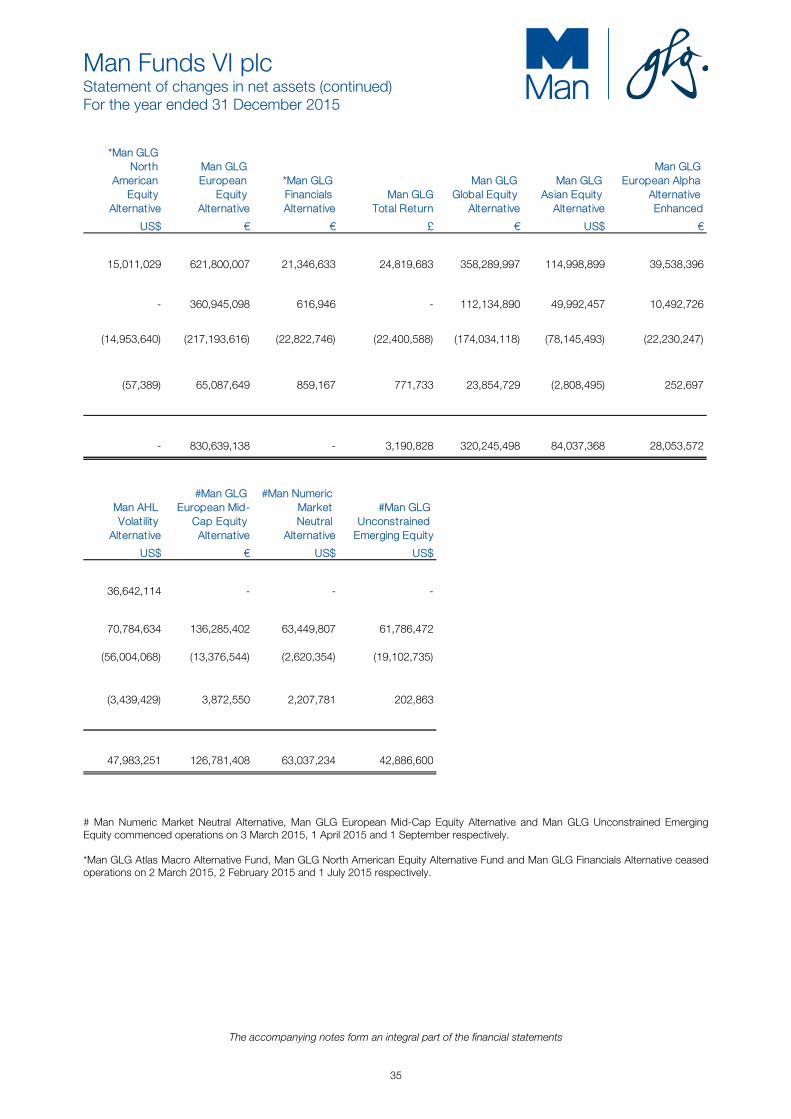
Man Funds VI plc Statement of changes in net assets (continued) For the year ended 31 December 2015
The accompanying notes form an integral part of the financial statements
35
*Man GLG
North American
Equity Alternative
Man GLG European
Equity Alternative
*Man GLG Financials Alternative
Man GLGTotal Return
Man GLG Global Equity
Alternative
Man GLG Asian Equity
Alternative
Man GLG European Alpha
Alternative Enhanced
US$ € € £ € US$ €
15,011,029 621,800,007 21,346,633 24,819,683 358,289,997 114,998,899 39,538,396
- 360,945,098 616,946 - 112,134,890 49,992,457 10,492,726
(14,953,640) (217,193,616) (22,822,746) (22,400,588) (174,034,118) (78,145,493) (22,230,247)
(57,389) 65,087,649 859,167 771,733 23,854,729 (2,808,495) 252,697
- 830,639,138 - 3,190,828 320,245,498 84,037,368 28,053,572
Man AHL Volatility
Alternative
#Man GLG European Mid-
Cap Equity Alternative
#Man Numeric Market Neutral
Alternative
#Man GLG Unconstrained
Emerging Equity
US$ € US$ US$
36,642,114 - - -
70,784,634 136,285,402 63,449,807 61,786,472
(56,004,068) (13,376,544) (2,620,354) (19,102,735)
(3,439,429) 3,872,550 2,207,781 202,863
47,983,251 126,781,408 63,037,234 42,886,600
# Man Numeric Market Neutral Alternative, Man GLG European Mid-Cap Equity Alternative and Man GLG Unconstrained Emerging Equity commenced operations on 3 March 2015, 1 April 2015 and 1 September respectively. *Man GLG Atlas Macro Alternative Fund, Man GLG North American Equity Alternative Fund and Man GLG Financials Alternative ceased operations on 2 March 2015, 2 February 2015 and 1 July 2015 respectively.
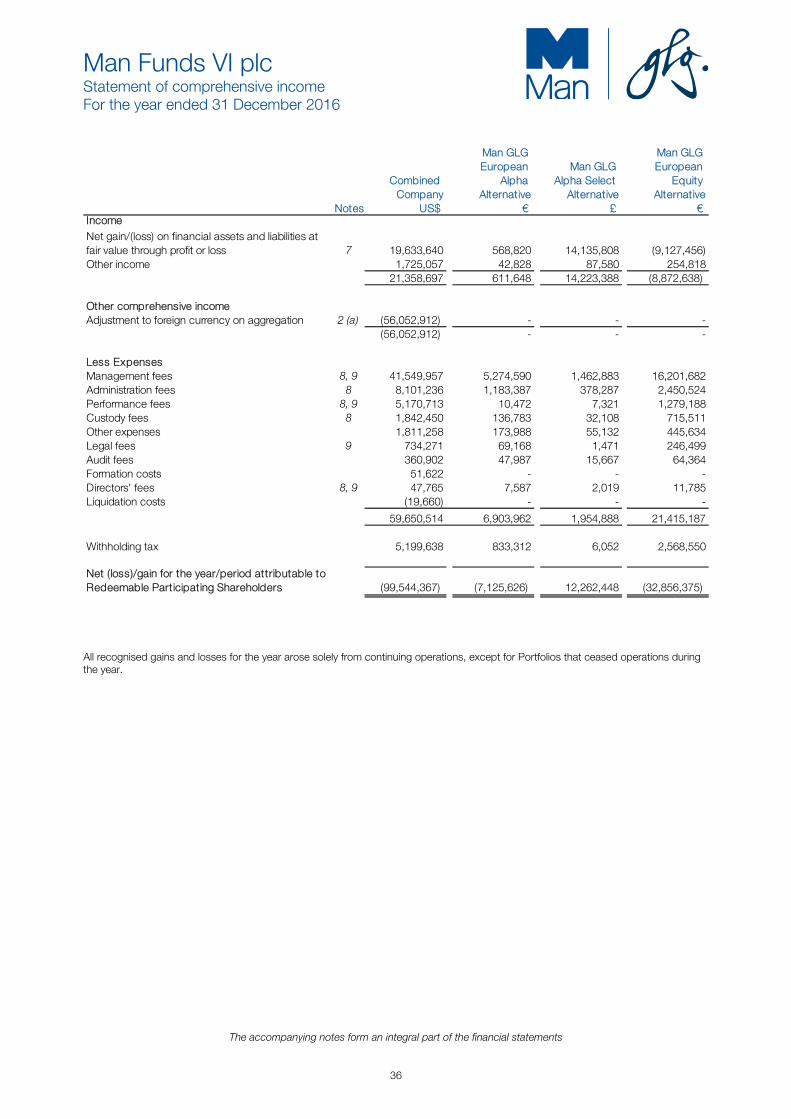
Man Funds VI plc Statement of comprehensive income For the year ended 31 December 2016
The accompanying notes form an integral part of the financial statements
36
Combined Company
Man GLG European
Alpha Alternative
Man GLG Alpha Select
Alternative
Man GLG European
Equity Alternative
Notes US$ € £ €IncomeNet gain/(loss) on financial assets and liabilities at fair value through profit or loss 7 19,633,640 568,820 14,135,808 (9,127,456)Other income 1,725,057 42,828 87,580 254,818
21,358,697 611,648 14,223,388 (8,872,638)
Other comprehensive incomeAdjustment to foreign currency on aggregation 2 (a) (56,052,912) - - -
(56,052,912) - - -
Less ExpensesManagement fees 8, 9 41,549,957 5,274,590 1,462,883 16,201,682 Administration fees 8 8,101,236 1,183,387 378,287 2,450,524 Performance fees 8, 9 5,170,713 10,472 7,321 1,279,188 Custody fees 8 1,842,450 136,783 32,108 715,511 Other expenses 1,811,258 173,988 55,132 445,634 Legal fees 9 734,271 69,168 1,471 246,499 Audit fees 360,902 47,987 15,667 64,364 Formation costs 51,622 - - - Directors' fees 8, 9 47,765 7,587 2,019 11,785 Liquidation costs (19,660) - - -
59,650,514 6,903,962 1,954,888 21,415,187
Withholding tax 5,199,638 833,312 6,052 2,568,550
Net (loss)/gain for the year/period attributable to Redeemable Participating Shareholders (99,544,367) (7,125,626) 12,262,448 (32,856,375)
All recognised gains and losses for the year arose solely from continuing operations, except for Portfolios that ceased operations during the year.

Man Funds VI plc Statement of comprehensive income (continued) For the year ended 31 December 2016
The accompanying notes form an integral part of the financial statements
37
*Man GLG Total Return
Man GLG Global Equity
Alternative
*Man GLG Asian Equity
Alternative
*Man GLG European Alpha
Alternative Enhanced
Man GLG Cred-Eq
Alternative
Man AHL Multi Strategy
Alternative
*Man AHL Directional
Equities Alternative
£ € US$ € € US$ US$
279,255 352,391 (6,257,380) (419,483) (3,120,934) 747,529 (3,329,762) - 319,150 1,850 75,757 - - 3,764
279,255 671,541 (6,255,530) (343,726) (3,120,934) 747,529 (3,325,998)
- - - - - - - - - - - - - -
- 5,532,145 368,215 395,285 609,029 1,691,703 312,917 967 808,056 56,578 49,006 162,808 407,912 80,734 - 88,815 (176) 1,890 26,969 853 (26) (2,763) 391,897 (21,763) 34,699 56,612 51,548 13,361 2,967 206,253 25,850 65,834 (6,931) 206,659 44,909 (2,174) 119,484 4,733 9,856 35,683 36,562 7,840 8,104 23,019 4,576 11,800 26,267 14,834 6,979 - - (35,187) 156 3,561 - 750 - 5,604 34 1,880 (2,331) 2,809 1,425 (20,253) - - 2,500 - - 5,000
(13,152) 7,175,273 402,860 572,906 911,667 2,412,880 473,889
- 645,444 25,376 90,602 21,648 207,983 91,253
292,407 (7,149,176) (6,683,766) (1,007,234) (4,054,249) (1,873,334) (3,891,140)
All recognised gains and losses for the year arose solely from continuing operations, except for Portfolios that ceased operations during the year.

Man Funds VI plc Statement of comprehensive income (continued) For the year ended 31 December 2016
The accompanying notes form an integral part of the financial statements
38
Man AHL TargetRisk
Man AHL Volatility
Alternative
Man GLG European Mid-
Cap Equity Alternative
Man Numeric Market Neutral
AlternativeNotes US$ US$ € US$
IncomeNet gain/(loss) on financial assets and liabilities at fair value through profit or loss 7 3,407,638 2,093,693 14,595,027 2,032,190 Other income 73,846 - 183,561 23,373
3,481,484 2,093,693 14,778,588 2,055,563
Other comprehensive incomeAdjustment to foreign currency on aggregation 2 (a) - - - -
- - - -
Less ExpensesManagement fees 8, 9 214,173 532,499 2,559,538 1,219,706 Administration fees 8 87,129 106,499 694,562 246,767 Performance fees 8, 9 - 39,516 1,800,654 887,697 Custody fees 8 21,505 22,074 87,400 57,470 Other expenses (29,481) 84,062 127,166 57,675 Legal fees 9 11,023 12,603 48,247 24,360 Audit fees 8,646 13,291 31,701 12,957 Formation costs - 13,184 16,830 16,666 Directors' fees 8, 9 1,351 798 4,558 2,117 Liquidation costs - - - -
314,346 824,526 5,370,656 2,525,415
Withholding tax - - 104,166 2,486
Net gain/(loss) for the year/period attributable to Redeemable Participating Shareholders 3,167,138 1,269,167 9,303,766 (472,338)
All recognised gains and losses for the year arose solely from continuing operations, except for Portfolios that ceased operations during the year.
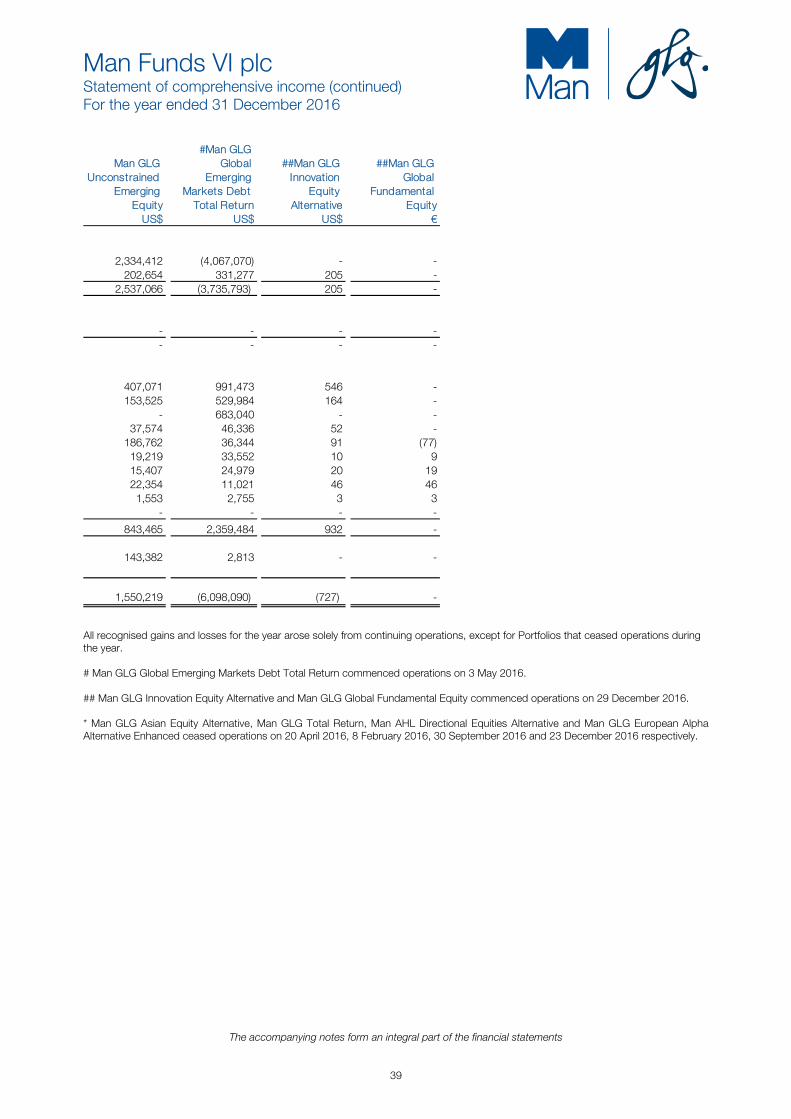
Man Funds VI plc Statement of comprehensive income (continued) For the year ended 31 December 2016
The accompanying notes form an integral part of the financial statements
39
Man GLG Unconstrained
Emerging Equity
#Man GLG Global
Emerging Markets Debt
Total Return
##Man GLG Innovation
Equity Alternative
##Man GLG Global
Fundamental Equity
US$ US$ US$ €
2,334,412 (4,067,070) - - 202,654 331,277 205 -
2,537,066 (3,735,793) 205 -
- - - - - - - -
407,071 991,473 546 - 153,525 529,984 164 - - 683,040 - - 37,574 46,336 52 - 186,762 36,344 91 (77) 19,219 33,552 10 9 15,407 24,979 20 19 22,354 11,021 46 46 1,553 2,755 3 3 - - - -
843,465 2,359,484 932 -
143,382 2,813 - -
1,550,219 (6,098,090) (727) -
All recognised gains and losses for the year arose solely from continuing operations, except for Portfolios that ceased operations during the year. # Man GLG Global Emerging Markets Debt Total Return commenced operations on 3 May 2016. ## Man GLG Innovation Equity Alternative and Man GLG Global Fundamental Equity commenced operations on 29 December 2016. * Man GLG Asian Equity Alternative, Man GLG Total Return, Man AHL Directional Equities Alternative and Man GLG European Alpha Alternative Enhanced ceased operations on 20 April 2016, 8 February 2016, 30 September 2016 and 23 December 2016 respectively.

Man Funds VI plc Statement of comprehensive income (continued) For the year ended 31 December 2015
The accompanying notes form an integral part of the financial statements
40
Combined Company
Man GLG European
Alpha Alternative
Man GLG Alpha Select
Alternative
*Man GLG Atlas Macro
Alternative Notes US$ € £ US$
IncomeNet gain/(loss) on financial assets and liabilities at fair value through profit or loss 7 163,577,619 16,369,365 8,422,547 (12,203,880)Other income 918,496 69,194 - - Total income 164,496,115 16,438,559 8,422,547 (12,203,880)
Other comprehensive incomeAdjustment to foreign currency on aggregation 2 (a) (213,634,541) - - -
(213,634,541) - - -
Less ExpensesManagement fees 8,9 44,611,780 6,765,485 1,610,884 116,334 Performance fees 8,9 8,286,314 116,205 782,198 - Administration fees 8 7,634,271 1,667,327 227,856 (36,592)Custody fees 8 1,617,253 200,573 35,507 24,251 Other expenses 790,151 151,804 63,904 (31,532)Legal fees 9 768,213 242,090 35,561 1,426 Audit fees 276,181 81,922 11,077 (986)Set up costs 199,053 - - - Liquidation costs 39,541 - - - Directors' fees 8, 9 33,821 5,683 2,062 -
Total expenses 64,256,578 9,231,089 2,769,049 72,901
Withholding tax 4,940,799 1,047,089 45,436 -
Net (loss)/gain for the year/period attributable to Redeemable Participating Shareholders (118,335,803) 6,160,381 5,608,062 (12,276,781)
All recognised gains and losses for the year arose solely from continuing operations, except for Portfolios that ceased operations during the year.
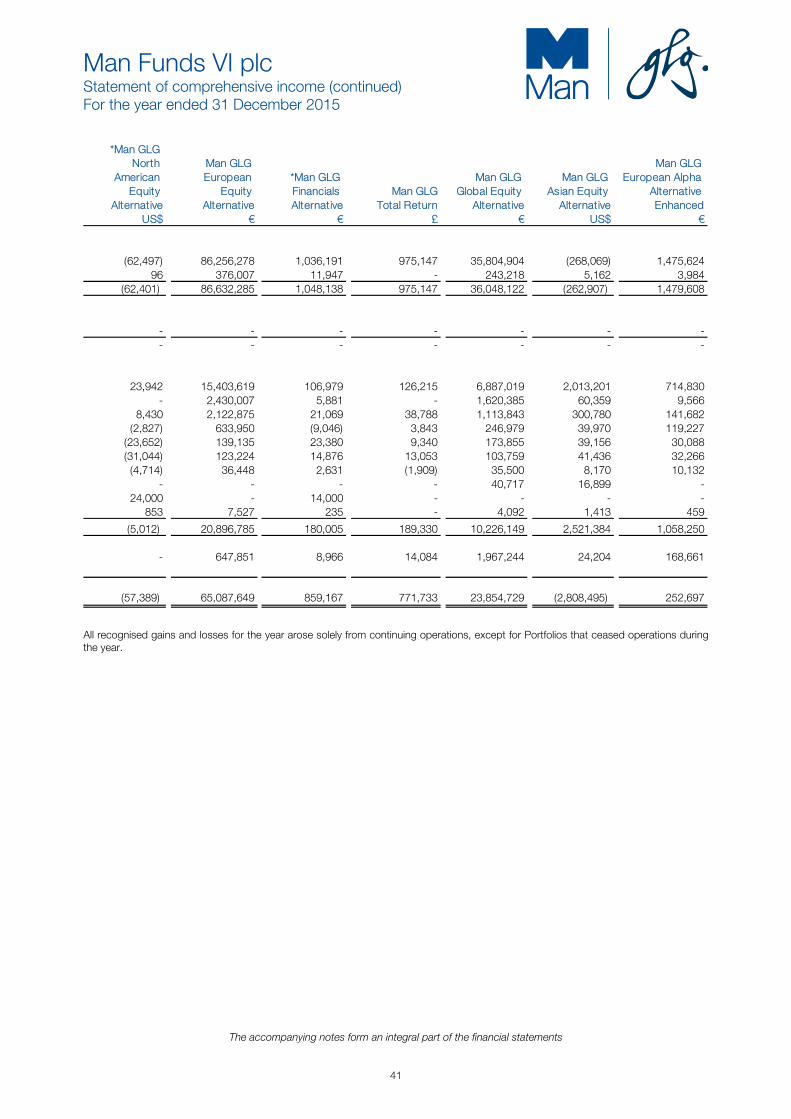
Man Funds VI plc Statement of comprehensive income (continued) For the year ended 31 December 2015
The accompanying notes form an integral part of the financial statements
41
*Man GLG
North American
Equity Alternative
Man GLG European
Equity Alternative
*Man GLG Financials Alternative
Man GLGTotal Return
Man GLG Global Equity
Alternative
Man GLG Asian Equity
Alternative
Man GLG European Alpha
Alternative Enhanced
US$ € € £ € US$ €
(62,497) 86,256,278 1,036,191 975,147 35,804,904 (268,069) 1,475,624 96 376,007 11,947 - 243,218 5,162 3,984
(62,401) 86,632,285 1,048,138 975,147 36,048,122 (262,907) 1,479,608
- - - - - - - - - - - - - -
23,942 15,403,619 106,979 126,215 6,887,019 2,013,201 714,830 - 2,430,007 5,881 - 1,620,385 60,359 9,566 8,430 2,122,875 21,069 38,788 1,113,843 300,780 141,682 (2,827) 633,950 (9,046) 3,843 246,979 39,970 119,227 (23,652) 139,135 23,380 9,340 173,855 39,156 30,088 (31,044) 123,224 14,876 13,053 103,759 41,436 32,266 (4,714) 36,448 2,631 (1,909) 35,500 8,170 10,132 - - - - 40,717 16,899 - 24,000 - 14,000 - - - - 853 7,527 235 - 4,092 1,413 459
(5,012) 20,896,785 180,005 189,330 10,226,149 2,521,384 1,058,250
- 647,851 8,966 14,084 1,967,244 24,204 168,661
(57,389) 65,087,649 859,167 771,733 23,854,729 (2,808,495) 252,697
All recognised gains and losses for the year arose solely from continuing operations, except for Portfolios that ceased operations during the year.

Man Funds VI plc Statement of comprehensive income (continued) For the year ended 31 December 2015
The accompanying notes form an integral part of the financial statements
42
Man GLG Cred-Eq
Alternative
Man AHL Multi Strategy
Alternative
Man AHL Directional
Equities Alternative
Man AHL TargetRisk
Notes € US$ US$ US$IncomeNet gain/(loss) on financial assets and liabilities at fair value through profit or loss 7 711,677 (4,034,905) 681,083 (351,911)Other income 112 171 - 86,638
711,789 (4,034,734) 681,083 (265,273)
Other comprehensive incomeAdjustment to foreign currency on aggregation 2 (a) - - - -
- - - -
Less ExpensesManagement fees 8, 9 1,662,416 1,322,670 374,025 193,958 Performance fees 8, 9 764,501 298,714 177,219 - Administration fees 221,317 329,524 100,203 90,718 Custody fees 8 24,704 42,574 15,989 22,301 Other expenses 17,227 (91,727) 30,884 14,681 Legal fees 9 20,181 25,482 8,810 20,848 Audit fees 6,029 15,487 9,137 8,824 Set up costs 15,981 16,979 20,193 16,733 Liquidation costs - - - - Directors' fees 8, 9 5,526 918 326 240
2,737,882 1,960,621 736,786 368,303
Withholding tax 18,793 256,747 171,965 -
Net (loss)/gain for the year/period attributable to Redeemable Participating Shareholders (2,044,886) (6,252,102) (227,668) (633,576)
All recognised gains and losses for the year arose solely from continuing operations, except for Portfolios that ceased operations during the year.

Man Funds VI plc Statement of comprehensive income (continued) For the year ended 31 December 2015
The accompanying notes form an integral part of the financial statements
43
Man AHL Volatility
Alternative
#Man GLG European Mid-
Cap Equity Alternative
#Man Numeric Market Neutral
Alternative
#Man GLG Unconstrained
Emerging Equity US$ € US$ US$
(1,752,285) 5,444,077 3,516,963 402,170 - - 3,843 40,584
(1,752,285) 5,444,077 3,520,806 442,754
- - - - - - - -
1,204,028 657,176 860,945 106,502 130,795 674,046 184,607 - 240,806 113,157 154,030 43,094 14,923 6,535 28,522 13,886 62,603 21,490 33,931 25,588 6,756 7,524 13,106 3,311 6,821 9,354 9,188 8,193 20,145 11,671 25,944 6,266 - - - - 267 - 542 -
1,687,144 1,500,953 1,310,815 206,840
- 70,574 2,210 33,051
(3,439,429) 3,872,550 2,207,781 202,863
All recognised gains and losses for the year arose solely from continuing operations, except for Portfolios that ceased operations during the year. # Man Numeric Market Neutral Alternative, Man GLG European Mid-Cap Equity Alternative and Man GLG Unconstrained Emerging Equity commenced operations on 3 March 2015, 1 April 2015 and 1 September respectively. *Man GLG Atlas Macro Alternative Fund, Man GLG North American Equity Alternative Fund and Man GLG Financials Alternative ceased operations on 2 March 2015, 2 February 2015 and 1 July 2015.

Man Funds VI plc Statement of cash flows For the year ended 31 December 2016
The accompanying notes form an integral part of the financial statements
44
Combined Company
Man GLG European
Alpha Alternative
Man GLG Alpha Select
Alternative
Man GLG European
Equity Alternative
US$ € £ € Cash flows from operating activities:
Net (loss)/gain for the year/period attributable to Redeemable Participating Shareholders (99,544,367) (7,125,626) 12,262,448 (32,856,375)
Adjustments to reconcile net (loss)/gain for the year/period attributable to redeemable participating shareholders to net cash (used in)/provided by operating activities:(Increase)/decrease in due from brokers (44,756,417) 3,564,810 (200,519) (25,103,303)(Increase)/decrease in financial assets and liabilities at fair value through profit or loss: Equities and managed funds 141,471,470 271,748,991 3,060,319 45,845,308 Interest bearing securities (441,673,144) - (49,019,020) - Derivatives 16,439,187 (8,168,664) (291,907) 30,480,652 (Increase)/decrease in interest receivable (5,915,727) - 115,266 - Decrease/(increase) in dividend receivable 57,335 129,160 (13,527) 9,114 (Increase)/decrease in other assets (2,095,822) (29,118) (62,170) (273,308)Increase/(decrease) in due to brokers 55,058,533 20,786,024 (3,100,274) 4,084,923 Increase in due to shareholders 11,397 - - - Increase/(decrease) in performance fees payable 508,295 5,197 (436,775) (562,984)(Decrease)/increase in management fees payable (875,557) (255,259) 18,600 (332,984)Increase/(decrease) in interest payable 14,100 (8,938) (5,373) (75,576)Increase/(decrease) in dividend payable 1,017,846 (42,560) 178,918 536,718 Increase/(decrease) in accrued expenses and other liabilities 1,076,232 (98,173) 5,406 259,983 Net cash (used in)/provided by operating activities (379,206,639) 280,505,844 (37,488,608) 22,012,168
Cash flows from financing activities:Issue of Redeemable Participating Shares 2,039,318,862 188,979,716 77,845,667 377,246,160 Redemption of Redeemable Participating Shares (1,902,842,899) (486,841,151) (29,338,591) (496,328,917)Net cash provided by/(used in) financing activities 136,475,963 (297,861,435) 48,507,076 (119,082,757)
Net (decrease)/increase in cash and cash equivalents (242,730,676) (17,355,591) 11,018,468 (97,070,589)
Cash and cash equivalents at beginning of year/period 834,231,068 85,419,706 37,244,242 238,798,393
Cash and cash equivalents at end of year/period 591,500,392 68,064,115 48,262,710 141,727,804
Cash and cash equivalents at end of year/period consists of:Cash and cash equivalents 306,462,764 60,409,704 27,388,735 52,358,838 Balances with brokers 372,786,950 18,520,665 20,942,328 122,001,178 Balances due to brokers (87,749,322) (10,866,254) (68,353) (32,632,212)Cash and cash equivalents at end of year/period 591,500,392 68,064,115 48,262,710 141,727,804
Supplemental disclosure of cash flow informationDividend received (net of withholding tax) 62,504,853 5,549,893 2,041,505 29,401,301 Dividend paid on short securities (60,838,141) (4,336,827) (1,805,691) (30,917,693)Interest received 3,697,845 47,734 387,791 110,335 Interest paid (20,690,061) (1,251,987) (575,033) (9,165,353)

Man Funds VI plc Statement of cash flows (continued) For the year ended 31 December 2016
The accompanying notes form an integral part of the financial statements
45
*Man GLG Total Return
Man GLG Global Equity
Alternative
*Man GLG Asian Equity
Alternative
*Man GLG European
Alpha Alternative Enhanced
Man GLG Cred-Eq
Alternative
Man AHL Multi Strategy
Alternative
*Man AHL Directional
Equities Alternative
£ € US$ € € US$ US$
292,407 (7,149,176) (6,683,766) (1,007,234) (4,054,249) (1,873,334) (3,891,140)
168,676 (476,329) - 433,516 - (31,079) 74,476
- 45,278,401 49,937,092 21,897,438 (9,880,422) - - 14,091 - - - 34,285,128 21,504,810 19,498,445 28,893 8,627,260 2,879,859 (622,901) (4,384,602) (2,145,359) 838,992 14 - 206 (567) 159,980 (198) 56 - 116,606 63,872 20,329 - (73,675) 24,621
6,196 (246,899) 3,713 (74,207) (90,062) (525,064) 2,798 - 239,419 - (7,902) - (6,315) (62,786) - - - - - - - - (761,634) (30,372) 1,955 16,346 869 -
3,920 (243,412) (144,815) (41,827) (116,244) (21,302) (40,495) - (38,277) - (657) - - (4,201) - 47,866 - (8,283) - 86,624 (35,925)
(32,708) 158,915 (188,439) 5,368 13,776 685,595 (62,416) 481,489 45,552,740 45,837,350 20,595,028 15,949,651 17,601,572 16,342,425
- 96,037,155 30,878 6,137,382 11,448,940 27,901,231 4,287,459 (3,483,235) (219,933,311) (77,384,480) (33,183,720) (38,566,612) (42,029,578) (40,856,723) (3,483,235) (123,896,156) (77,353,602) (27,046,338) (27,117,672) (14,128,347) (36,569,264)
(3,001,746) (78,343,416) (31,516,252) (6,451,310) (11,168,021) 3,473,225 (20,226,839)
3,016,106 141,840,656 31,516,414 6,458,499 23,025,590 83,341,813 20,228,439
14,360 63,497,240 162 7,189 11,857,569 86,815,038 1,600
30,117 11,789,555 - 404,958 6,091,258 43,983,530 5,676 - 62,821,584 184 319,895 5,768,188 45,706,014 672
(15,757) (11,113,899) (22) (717,664) (1,877) (2,874,506) (4,748) 14,360 63,497,240 162 7,189 11,857,569 86,815,038 1,600
- 10,761,424 198,627 574,037 44,895 2,348,371 676,162 - (11,603,161) (82,062) (445,556) (122,746) (745,070) (433,806)
4,061 501,607 75,660 4,168 404,873 250,863 1,366 (9,136) (3,531,359) (135,677) (102,312) 83,595 (558,889) (155,522)
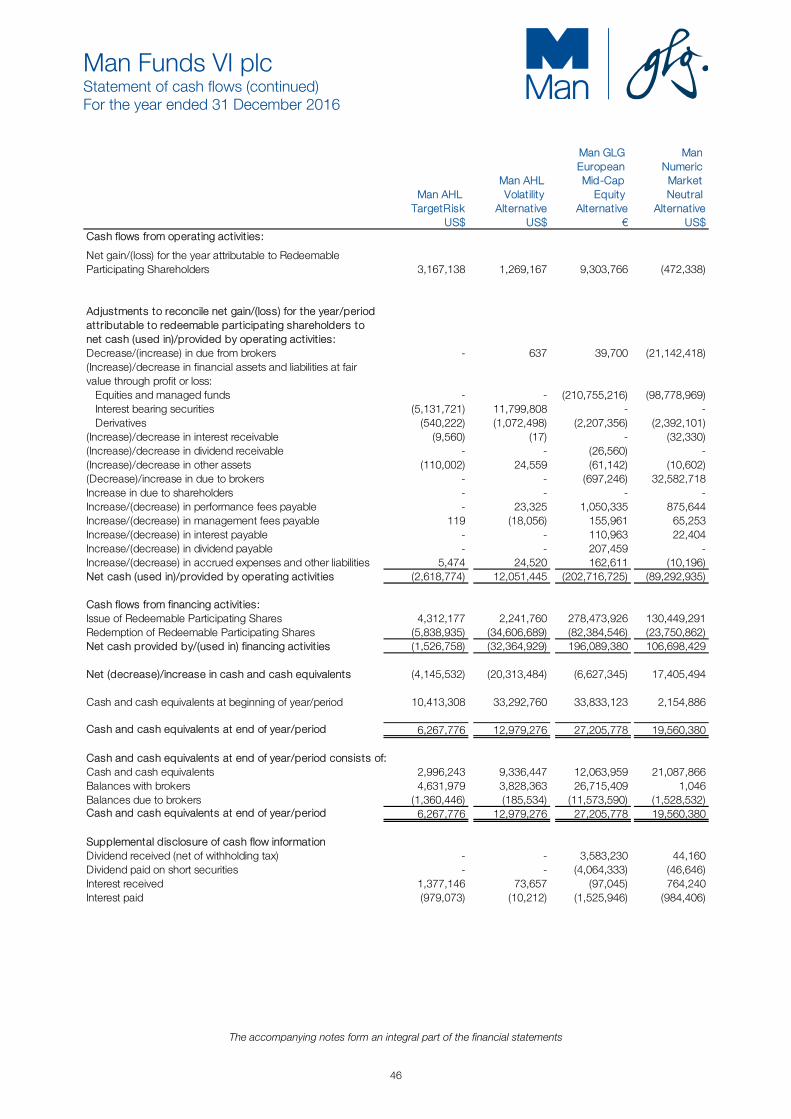
Man Funds VI plc Statement of cash flows (continued) For the year ended 31 December 2016
The accompanying notes form an integral part of the financial statements
46
Man AHL TargetRisk
Man AHL Volatility
Alternative
Man GLG European Mid-Cap
Equity Alternative
Man Numeric Market Neutral
Alternative US$ US$ € US$
Cash flows from operating activities:
Net gain/(loss) for the year attributable to Redeemable Participating Shareholders 3,167,138 1,269,167 9,303,766 (472,338)
Adjustments to reconcile net gain/(loss) for the year/period attributable to redeemable participating shareholders to net cash (used in)/provided by operating activities:Decrease/(increase) in due from brokers - 637 39,700 (21,142,418)(Increase)/decrease in financial assets and liabilities at fair value through profit or loss: Equities and managed funds - - (210,755,216) (98,778,969) Interest bearing securities (5,131,721) 11,799,808 - - Derivatives (540,222) (1,072,498) (2,207,356) (2,392,101)(Increase)/decrease in interest receivable (9,560) (17) - (32,330)(Increase)/decrease in dividend receivable - - (26,560) - (Increase)/decrease in other assets (110,002) 24,559 (61,142) (10,602)(Decrease)/increase in due to brokers - - (697,246) 32,582,718 Increase in due to shareholders - - - - Increase/(decrease) in performance fees payable - 23,325 1,050,335 875,644 Increase/(decrease) in management fees payable 119 (18,056) 155,961 65,253 Increase/(decrease) in interest payable - - 110,963 22,404 Increase/(decrease) in dividend payable - - 207,459 - Increase/(decrease) in accrued expenses and other liabilities 5,474 24,520 162,611 (10,196)Net cash (used in)/provided by operating activities (2,618,774) 12,051,445 (202,716,725) (89,292,935)
Cash flows from financing activities:Issue of Redeemable Participating Shares 4,312,177 2,241,760 278,473,926 130,449,291 Redemption of Redeemable Participating Shares (5,838,935) (34,606,689) (82,384,546) (23,750,862)Net cash provided by/(used in) financing activities (1,526,758) (32,364,929) 196,089,380 106,698,429
Net (decrease)/increase in cash and cash equivalents (4,145,532) (20,313,484) (6,627,345) 17,405,494
Cash and cash equivalents at beginning of year/period 10,413,308 33,292,760 33,833,123 2,154,886
Cash and cash equivalents at end of year/period 6,267,776 12,979,276 27,205,778 19,560,380
Cash and cash equivalents at end of year/period consists of:Cash and cash equivalents 2,996,243 9,336,447 12,063,959 21,087,866 Balances with brokers 4,631,979 3,828,363 26,715,409 1,046 Balances due to brokers (1,360,446) (185,534) (11,573,590) (1,528,532)Cash and cash equivalents at end of year/period 6,267,776 12,979,276 27,205,778 19,560,380
Supplemental disclosure of cash flow informationDividend received (net of withholding tax) - - 3,583,230 44,160 Dividend paid on short securities - - (4,064,333) (46,646)Interest received 1,377,146 73,657 (97,045) 764,240 Interest paid (979,073) (10,212) (1,525,946) (984,406)
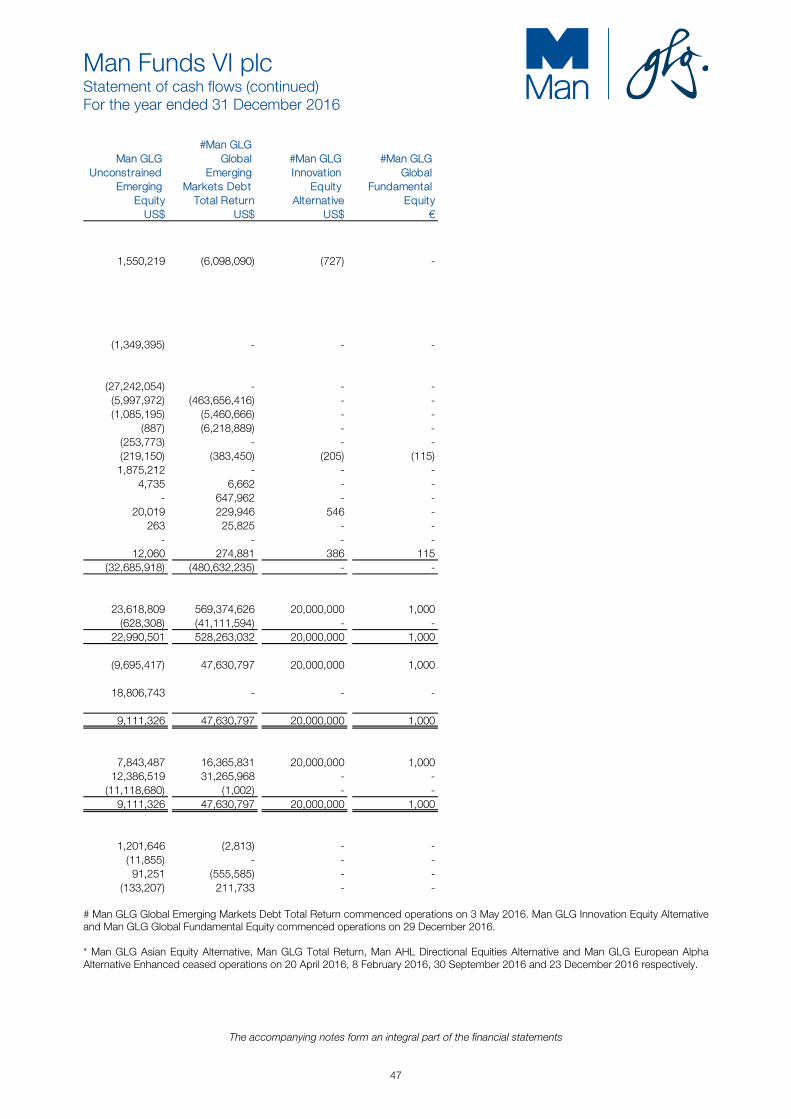
Man Funds VI plc Statement of cash flows (continued) For the year ended 31 December 2016
The accompanying notes form an integral part of the financial statements
47
Man GLG Unconstrained
Emerging Equity
#Man GLG Global
Emerging Markets Debt
Total Return
#Man GLG Innovation
Equity Alternative
#Man GLG Global
Fundamental Equity
US$ US$ US$ €
1,550,219 (6,098,090) (727) -
(1,349,395) - - -
(27,242,054) - - - (5,997,972) (463,656,416) - - (1,085,195) (5,460,666) - - (887) (6,218,889) - - (253,773) - - - (219,150) (383,450) (205) (115) 1,875,212 - - - 4,735 6,662 - - - 647,962 - -
20,019 229,946 546 - 263 25,825 - - - - - -
12,060 274,881 386 115 (32,685,918) (480,632,235) - -
23,618,809 569,374,626 20,000,000 1,000 (628,308) (41,111,594) - - 22,990,501 528,263,032 20,000,000 1,000
(9,695,417) 47,630,797 20,000,000 1,000
18,806,743 - - -
9,111,326 47,630,797 20,000,000 1,000
7,843,487 16,365,831 20,000,000 1,000 12,386,519 31,265,968 - - (11,118,680) (1,002) - - 9,111,326 47,630,797 20,000,000 1,000
1,201,646 (2,813) - - (11,855) - - - 91,251 (555,585) - - (133,207) 211,733 - -
# Man GLG Global Emerging Markets Debt Total Return commenced operations on 3 May 2016. Man GLG Innovation Equity Alternative and Man GLG Global Fundamental Equity commenced operations on 29 December 2016. * Man GLG Asian Equity Alternative, Man GLG Total Return, Man AHL Directional Equities Alternative and Man GLG European Alpha Alternative Enhanced ceased operations on 20 April 2016, 8 February 2016, 30 September 2016 and 23 December 2016 respectively.
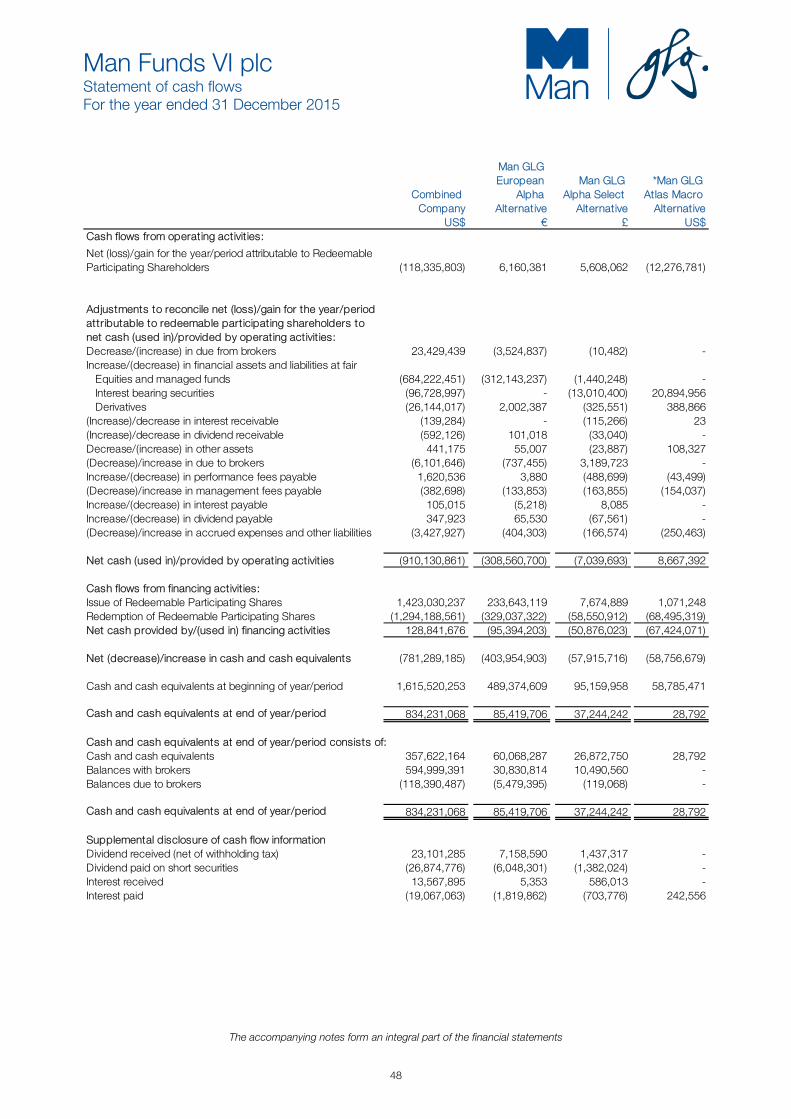
Man Funds VI plc Statement of cash flows For the year ended 31 December 2015
The accompanying notes form an integral part of the financial statements
48
Combined Company
Man GLG European
Alpha Alternative
Man GLG Alpha Select
Alternative
*Man GLG Atlas Macro
Alternative US$ € £ US$
Cash flows from operating activities:
Net (loss)/gain for the year/period attributable to Redeemable Participating Shareholders (118,335,803) 6,160,381 5,608,062 (12,276,781)
Adjustments to reconcile net (loss)/gain for the year/period attributable to redeemable participating shareholders to net cash (used in)/provided by operating activities:Decrease/(increase) in due from brokers 23,429,439 (3,524,837) (10,482) - Increase/(decrease) in financial assets and liabilities at fair Equities and managed funds (684,222,451) (312,143,237) (1,440,248) - Interest bearing securities (96,728,997) - (13,010,400) 20,894,956 Derivatives (26,144,017) 2,002,387 (325,551) 388,866 (Increase)/decrease in interest receivable (139,284) - (115,266) 23 (Increase)/decrease in dividend receivable (592,126) 101,018 (33,040) - Decrease/(increase) in other assets 441,175 55,007 (23,887) 108,327 (Decrease)/increase in due to brokers (6,101,646) (737,455) 3,189,723 - Increase/(decrease) in performance fees payable 1,620,536 3,880 (488,699) (43,499)(Decrease)/increase in management fees payable (382,698) (133,853) (163,855) (154,037)Increase/(decrease) in interest payable 105,015 (5,218) 8,085 - Increase/(decrease) in dividend payable 347,923 65,530 (67,561) - (Decrease)/increase in accrued expenses and other liabilities (3,427,927) (404,303) (166,574) (250,463)
Net cash (used in)/provided by operating activities (910,130,861) (308,560,700) (7,039,693) 8,667,392
Cash flows from financing activities:Issue of Redeemable Participating Shares 1,423,030,237 233,643,119 7,674,889 1,071,248 Redemption of Redeemable Participating Shares (1,294,188,561) (329,037,322) (58,550,912) (68,495,319)Net cash provided by/(used in) financing activities 128,841,676 (95,394,203) (50,876,023) (67,424,071)
Net (decrease)/increase in cash and cash equivalents (781,289,185) (403,954,903) (57,915,716) (58,756,679)
Cash and cash equivalents at beginning of year/period 1,615,520,253 489,374,609 95,159,958 58,785,471
Cash and cash equivalents at end of year/period 834,231,068 85,419,706 37,244,242 28,792
Cash and cash equivalents at end of year/period consists of:Cash and cash equivalents 357,622,164 60,068,287 26,872,750 28,792 Balances with brokers 594,999,391 30,830,814 10,490,560 - Balances due to brokers (118,390,487) (5,479,395) (119,068) -
Cash and cash equivalents at end of year/period 834,231,068 85,419,706 37,244,242 28,792
Supplemental disclosure of cash flow informationDividend received (net of withholding tax) 23,101,285 7,158,590 1,437,317 - Dividend paid on short securities (26,874,776) (6,048,301) (1,382,024) - Interest received 13,567,895 5,353 586,013 - Interest paid (19,067,063) (1,819,862) (703,776) 242,556

Man Funds VI plc Statement of cash flows (continued) For the year ended 31 December 2015
The accompanying notes form an integral part of the financial statements
49
*Man GLG
North American
Equity Alternative
Man GLG European
Equity Alternative
Man GLG Financials Alternative
Man GLGTotal Return
Man GLG Global Equity
Alternative
Man GLG Asian Equity
Alternative
Man GLG European
Alpha Alternative Enhanced
US$ € € £ € US$ €
(57,389) 65,087,649 859,167 771,733 23,854,729 (2,808,495) 252,697
2,170 13,190,023 - (168,676) 7,527,225 107,235 (427,868)
411,832 (202,799,706) 6,437,193 3,759,574 36,674,696 (46,762,192) (13,025,595) - 1,187,668 - 7,040,282 154,094 - -
(2,014,221) (23,361,243) 1,755,801 392,196 (9,160,903) 608,745 (731,849) 9 - - 81,103 - (206) 468 (604,920) 31,900 - 67,252 (63,872) 28,435 9,109 54,729 88,194 7,777 62,202 56 1,503 (1,340) (5,906,964) - - (1,407,271) (2,363) (98,892) (9) 1,793,362 (14,587) - 767,365 (293,746) - (30,444) 296,928 (38,007) (19,141) (55,220) (53,946) (37,944) (12,266) 147,942 (42) (7,825) (28,075) (2,534) (1,841) (2,933) 455,092 (28,270) (54,604) (45,123) 8,145 (154,421) (985,204) (140,290) (53,207) (470,329) (63,709) (77,102)
(1,849,435) (151,444,644) 8,951,059 11,803,816 57,931,161 (49,380,150) (14,110,311)
- 348,620,651 616,946 - 112,082,514 18,000,000 10,492,726 (14,953,640) (204,869,169) (22,822,746) (22,400,588) (173,981,742) (46,153,036) (22,230,247) (14,953,640) 143,751,482 (22,205,800) (22,400,588) (61,899,228) (28,153,036) (11,737,521)
(16,803,075) (7,693,162) (13,254,741) (10,596,772) (3,968,067) (77,533,186) (25,847,832)
16,825,377 246,491,555 13,277,544 13,612,878 145,808,723 109,049,600 32,306,331
22,302 238,798,393 22,803 3,016,106 141,840,656 31,516,414 6,458,499
22,302 55,255,466 22,803 2,721,958 42,054,440 12,072,478 8,741,205 - 220,019,827 - 594,995 135,557,440 22,038,914 3,435,923 - (36,476,900) - (300,847) (35,771,224) (2,594,978) (5,718,629)
22,302 238,798,393 22,803 3,016,106 141,840,656 31,516,414 6,458,499
4,428 (3,793,100) 58,061 71,989 11,092,554 450,223 1,144,516 (5,360) (2,363,370) (100,748) (2,198) (11,218,898) (453,107) (1,048,411) 5,077 6,886,077 4,237 602,788 339,724 88,523 7,646 (386) (6,201,975) (5,189) (867,904) (3,699,852) (624,813) (246,116)

Man Funds VI plc Statement of cash flows (continued) For the year ended 31 December 2015
The accompanying notes form an integral part of the financial statements
50
Man GLG Cred-Eq Alternative
Man AHL Multi Strategy
Alternative
Man AHL Directional
Equities Alternative
Man AHL TargetRisk
€ US$ US$ US$Cash flows from operating activities:
Net (loss)/gain for the year attributable to Redeemable Participating Shareholders (2,044,886) (6,252,102) (227,668) (633,576)
Adjustments to reconcile net (loss)/gain for the year attributable to redeemable participating shareholders to net cash (used in)/provided by operating activities:(Increase)/decrease in due from brokers 1,489,122 (39,585) (37,182) - Increase/(decrease) in financial assets and liabilities at fair Equities and managed funds (7,170,708) - - - Interest bearing securities (14,101,071) (60,994,675) (19,498,445) (3,677,291) Derivatives 5,175,752 150,021 (96,704) 420,798 Decrease/(increase) in interest receivable (70,207) (86) (11) (16,339)(Increase)/decrease in dividend receivable - (11,125) 14,982 15,912 (Increase)/decrease in other assets (3,015) 96,179 (6,561) (61,971)Increase/(decrease) in due to brokers - 79,166 36,259 - Increase/(decrease) in performance fees payable (8,374) (268,000) (210,000) - Increase/(decrease) in management fees payable 54,687 193,493 1,951 17,009 Increase/(decrease) in interest payable - - (3,287) (8,309)Increase/(decrease) in dividend payable - 10,282 31,851 - Increase/(decrease) in accrued expenses and other liabilities (21,325) 15,871 44,736 21,188 Net cash (used in)/provided by operating activities (16,700,025) (67,020,561) (19,950,079) (3,922,579)
Cash flows from financing activities:Issue of Redeemable Participating Shares 36,437,074 139,969,377 17,770,110 16,800,776 Redemption of Redeemable Participating Shares (8,973,481) (42,762,668) (2,928,119) (10,000,000)Net cash (used in)/provided by financing activities 27,463,593 97,206,709 14,841,991 6,800,776
Net (decrease)/increase in cash and cash equivalents 10,763,568 30,186,148 (5,108,088) 2,878,197
Cash and cash equivalents at beginning of year/period 12,262,022 53,155,665 25,336,527 7,535,111
Cash and cash equivalents at end of year/period 23,025,590 83,341,813 20,228,439 10,413,308
Cash and cash equivalents at end of year/period consists of:Cash and cash equivalents 8,964,265 33,699,769 11,929,857 5,150,965 Balances with brokers 15,677,590 50,571,360 8,477,910 5,313,636 Balances due to brokers (1,616,265) (929,316) (179,328) (51,293)
Cash and cash equivalents at end of year/period 23,025,590 83,341,813 20,228,439 10,413,308
Supplemental disclosure of cash flow informationDividend received (net of withholding tax) 21,097 1,279,542 944,735 15,912 Dividend paid on short securities (147,092) (181,443) (392,376) - Interest received 1,199,106 83,347 20,787 1,744,105 Interest paid (395,986) (302,787) (137,032) (1,331,449)

Man Funds VI plc Statement of cash flows (continued) For the year ended 31 December 2015
The accompanying notes form an integral part of the financial statements
51
Man AHL Volatility
Alternative
#Man GLG European Mid-
Cap Equity Alternative
#Man Numeric Market Neutral
Alternative
Man GLG Unconstrained
Emerging Equity US$ € US$ US$
(3,439,429) 3,872,550 2,207,781 202,863
9,864 (39,700) - -
- (94,365,501) (62,974,592) (24,081,738) (16,098,290) - - - (37,236) 170,598 1,921,906 1,022 (83) - (20,598) (4,250) 47 (79,557) - (56,894) (20,369) - (12,771) (40,581) (1,751) 697,246 - - 244 454,543 - - 34,199 133,300 92,483 27,403 (47,272) - 12,352 7,210
- 16,549 - - (850) 64,237 98,872 67,971 (19,600,926) (89,075,735) (58,674,567) (23,876,994)
70,784,634 131,420,935 63,449,807 61,631,212 (56,004,068) (8,512,077) (2,620,354) (18,947,475) 14,780,566 122,908,858 60,829,453 42,683,737
(4,820,360) 33,833,123 2,154,886 18,806,743
38,113,120 - - -
33,292,760 33,833,123 2,154,886 18,806,743
16,795,409 27,970,926 1,828,639 11,871,342 16,497,359 13,866,337 1,158,002 19,022,101 (8) (8,004,140) (831,755) (12,086,700)
33,292,760 33,833,123 2,154,886 18,806,743
47 455,732 7,957 178,190 - (439,628) (8,841) -
65,070 4,040 359,454 8,928 (75,155) (158,461) (490,814) (38,974)
# Man Numeric Market Neutral Alternative, Man GLG European Mid-Cap Equity Alternative and Man GLG Unconstrained Emerging Equity commenced operations on 3 March 2015, 1 April 2015 and 1 September 2015 respectively. *Man GLG Atlas Macro Alternative Fund, Man GLG North American Equity Alternative Fund and Man GLG Financials Alternative ceased operations on 2 March 2015, 2 February 2015 and 1 July 2015.

Man Funds VI plc Notes to the Financial Statements For the year ended 31 December 2016
52
1. General
Man Funds VI plc (formerly GLG Investments VI Plc) (the “Fund”) was incorporated as an investment company with variable capital and segregated liability between sub-funds under the laws of Ireland as a public limited company on 28 November 2007 under registration number 449860. The Fund has been authorised by the Central Bank of Ireland (the “Central Bank”) as an Undertaking for Collective Investment in Transferable Securities (“UCITS”), pursuant to the European Communities (Undertaking for Collective Investment in Transferable Securities) Regulations 2011 (as amended) (the “Regulations”). The Fund’s investment manager is GLG Partners LP for Man GLG Portfolios, AHL Partners LLP for Man AHL Portfolios and Numeric Investors LLC for Numeric Portfolios (the “Investment Managers”). The Fund’s registered office is at 70 Sir John Rogerson’s Quay, Dublin, Ireland. The Fund has no employees.
The Fund is structured as an umbrella fund with segregated liability between sub-funds (each a “Portfolio”) which means that different Portfolios may be created from time to time by the Directors with the approval of the Central Bank. Each Portfolio will be represented by a different series of Redeemable Participating Shares (the “Shares”) and will be invested in accordance with the investment objectives and policies applicable to such Portfolio. As at 31 December 2016 the Fund was comprised of fourteen Portfolios.
Man GLG Portfolios Man GLG Asian Equity Alternative (ceased operations on 20 April 2016), Man GLG Total Return (ceased operations on 8 February 2016) Man GLG European Alpha Alternative Enhanced (ceased operations 23 December 2016), Man GLG European Alpha Alternative, Man GLG European Equity Alternative, Man GLG Alpha Select Alternative, Man GLG Global Equity Alternative, Man GLG Cred-Eq Alternative, Man GLG European Mid-Cap Equity Alternative, Man GLG Unconstrained Emerging Equity, Man GLG Global Emerging Markets Debt Total Return (commenced operations on 3 May 2016), Man GLG Innovation Equity Alternative and Man GLG Global Fundamental Equity (commenced operations on 29 December 2016).
Man AHL Portfolios Man AHL Multi Strategy Alternative, Man AHL Directional Equities Alternative (ceased operations on 30 September 2016), Man AHL TargetRisk and Man AHL Volatility Alternative.
Numeric Portfolio Man Numeric Market Neutral Alternative.
All Classes of Redeemable Participating Shares are together referred to as the ‘‘Redeemable Participating Shares’’ or ‘‘Shares’’.
As at 31 December 2016 the following Portfolios were registered with Swiss Financial Market Supervisory Authority FINMA: GLG Alpha Select Alternative, GLG European Alpha Alternative, GLG European Equity Alternative, GLG Global Equity Alternative, GLG Asian Equity Alternative, GLG Cred-Eq Alternative, Man AHL Multi Strategy Alternative, Man AHL TargetRisk, Man AHL Volatility Alternative, Man Numeric Market Neutral Alternative, Man GLG Mid-Cap Equity Alternative, Man GLG Unconstrained Emerging Equity and Man GLG Global Emerging Markets Debt Total Return.
The investment objectives and policies of each active Portfolio are detailed below. Man GLG European Alpha Alternative Man GLG European Alpha Alternative’s investment objective is to provide a positive absolute return for investors while maintaining a low volatility, regardless of market conditions, through stock selection and the utilising of long/short strategies. The Portfolio invests primarily in securities of issuers in Europe or of issuers which derive a substantial part of their revenues from activities in Europe. The Portfolio invests predominantly in common stocks and other equity and equity linked instruments of such issuers, including, without limitation, equity derivatives. As at 31 December 2016, Class DN EUR, Class DN H GBP, Class DN H USD, Class IN EUR, Class IN H GBP and Class IN H USD were in operation and were listed on the official list of the Irish Stock Exchange (“ISE”). Man GLG Alpha Select Alternative Man GLG Alpha Select Alternative’s investment objective is to provide investors with positive returns through investments primarily in the United Kingdom securities markets. The Portfolio invests primarily in common stock and other equity and equity-linked securities (which may include but are not limited to such instruments as options and swaps) of issuers in the United Kingdom or of issuers which derive a substantial part of their revenues from activities in the United Kingdom and may invest the remainder in equity and equity linked securities of issuers and on markets located outside the United Kingdom. Although it is not intended to provide for any geographic or sectorial specialisation other than the above, it is anticipated that the Portfolio’s investments will primarily be in mid and large capitalisation companies including companies in the FTSE 100 Index. As at 31 December 2016, Class DN GBP, Class DN H EUR, Class DN H USD, Class IN GBP, Class IN H EUR and Class IN H USD were in operation and were listed on the official list of the ISE.

Man Funds VI plc Notes to the Financial Statements (continued) For the year ended 31 December 2016
53
1. General (continued)
Man GLG European Equity Alternative Man GLG European Equity Alternative’s investment objective is to provide investors with positive returns primarily through investments in issuers in Europe and of issuers which derive a substantial part of their revenues from activities in Europe.
The Portfolio’s policy is to achieve those returns through investments in short, medium and, to a lesser extent, long-term investment opportunities. This policy will be pursued through a strategy of active trading with the Portfolio primarily investing in listed equities including, without limitation, common stock and other equity and equity-linked securities (which may include, but are not limited to, such instruments as options and swaps), of issuers in Europe and of issuers which derive a substantial part of their revenues from activities in Europe.
As at 31 December 2016, Class DN EUR, Class DN H CHF, Class DN H GBP, Class DN H NOK, Class DN H SEK, Class DN H SGD, Class DN H USD, Class IN EUR, Class IN H GBP, Class IN H SEK and Class IN H USD were in operation and were listed on the official list of the ISE. As at 31 December 2016, Class IN H NOK and Class IXN H GBP were in operation but delisted on the official list of the ISE.
Man GLG Total Return Man GLG Total Return’s investment objective was to provide investors with wealth preservation and growth over a rolling three-year time period in all market conditions through investment in a risk constrained low volatility strategy with a broadly diversified range of underlying investments.
The Portfolio ceased operations on 8 February 2016.
Man GLG Global Equity Alternative Man GLG Global Equity Alternative’s investment objective is to provide investors with positive returns through investments in a global range of issuers with a diversified regional allocation.
The Portfolio’s policy is to achieve those returns through investments in short, medium and, to a lesser extent, long-term investment opportunities globally. This policy is pursued through a strategy of active trading with the Portfolio primarily investing in listed equities globally including, without limitation, common stock and other equity and equity-linked securities (which may include, but are not limited to, such instruments as options and swaps). The Portfolio seeks to apply a long/short investment strategy and the Investment Manager may utilise synthetic short positions where it deems it appropriate in its sole discretion based on the opportunities in the market and the extent to which the Investment Manager believes that there are overvalued issuers or issuers which may fall in value. The Portfolio will not have a set long/short ratio.
As at 31 December 2016, Class DN EUR, Class DN H CHF, Class DN H USD, Class IN EUR and IN H USD were in operation and were listed on the official list of the ISE.
Man GLG Asian Equity Alternative Man GLG Asian Equity Alternative’s investment objective was to seek to provide investors with a positive return of income primarily through long and short investments in issuers that are either domiciled in the Asia Pacific region (including Australia), or that derive a substantial part of their revenues from within the Asia Pacific region (including Australia), or whose securities are traded in a market in the Asia Pacific region (including Australia).
The Portfolio ceased operations on 20 April 2016.
Man GLG European Alpha Alternative Enhanced Man GLG European Alpha Alternative Enhanced’s investment objective was to provide a positive absolute return for investors while maintaining a moderate volatility, regardless of market conditions, through stock selection and the use of typically market-neutral long/short strategies. The focus of the Portfolio will be stock selection, with no particular sector exposure targets.
The Portfolio ceased operations on 23 December 2016.
Man GLG Cred-Eq Alternative Man GLG Cred-Eq Alternative’s investment objective is to provide investors with absolute returns over the medium term by taking both long and short positions in an actively managed portfolio of convertible, credit and equity asset classes.
The Portfolio seeks to select the best possible investments from a wide range of opportunities globally, adopting a fundamentally driven investment approach across convertibles, credit and equities.
As at 31 December 2016, Class DN EUR, Class DN H USD, Class IN EUR and Class IN H USD were in operation.
Man AHL Multi Strategy Alternative Man AHL Multi Strategy Alternative aims to achieve medium-term capital growth in all market conditions by being broadly diversified along system styles, asset classes, regions, and time horizons.
The Portfolio will seek to achieve its objective by allocating all or substantially all of its assets in accordance with the AHL Multi-Strategy Programme (as described in further detail in the Prospectus).
As at 31 December 2016, Class DN H EUR, Class DN H GBP, Class DN H SEK, Class DN USD, Class IN H CHF, Class IN H EUR, Class IN H SEK, IN H USD and Class IN USD were in operation.
Man AHL Directional Equities Alternative The Portfolios’ aim was to provide investors with absolute returns over the medium term primarily by using financial derivative instruments to take both long and short positions in a quantitatively managed portfolio of equities.
The Portfolio ceased operations on 30 September 2016.

Man Funds VI plc Notes to the Financial Statements (continued) For the year ended 31 December 2016
54
1. General (continued)
Man AHL TargetRisk The Man AHL TargetRisk Portfolio aims to generate capital growth over the medium to long term by providing dynamic long only exposure to a range of assets and to provide an excess return stream with a stable level of volatility regardless of market conditions.
The Portfolio seeks to achieve its objective by allocating all or substantially all of its assets in accordance with a proprietary quantitative model, the ‘Man TargetRisk’ strategy, to provide an excess return stream with a stable level of volatility regardless of market conditions.
As at 31 December 2016, Class D H EUR, Class D H SEK, Class D USD, Class I H EUR, Class I H GBP, Class I H SEK and Class I USD were in operation.
Man AHL Volatility Alternative Man AHL Volatility Alternative Portfolio seeks to provide investors with absolute returns over the medium term by taking long and short positions in an actively managed portfolio trading volatility instruments.
The Portfolio seeks to achieve its objective by allocating all or substantially all of its assets in accordance with AHL’s proprietary quantitative model to systematically identify opportunities in volatility markets around the world.
As at 31 December 2016, Class DN USD, Class IN H EUR and Class IN USD were in operation.
Man GLG European Mid-Cap Equity Alternative The Portfolio’s investment objective is to seek to provide an attractive risk-adjusted total return, through appreciation and income. The Portfolio will seek to achieve these returns primarily through long and synthetically short investments in equity securities or equity derivatives. The Portfolio may invest up to 20% of its Net Asset Value in emerging markets or in currencies of OECD countries and/or derivatives.
As at 31 December 2016, Class DN EUR, Class DN H SEK, Class DN H USD, DNY EUR, Class IN EUR, Class IN H CHF, Class IN H GBP, Class IN H SEK, Class IN H USD, Class IN F EUR, Class INF H CHF, Class INF H GBP and Class INF H USD were in operation.
Man Numeric Market Neutral Alternative Man Numeric Market Neutral Alternative’s investment objective is to earn an average return on investment, after fees, which is appreciably higher than the total return (assuming reinvestment of dividends) in USD of the Merrill Lynch 91-day Treasury Bills Index.
The Portfolio will seek to apply a long/short investment strategy and intends to invest in derivatives providing long and “synthetic short” positions.
As at 31 December 2016, Class DN H EUR, Class DN H SEK, Class DN H NOK, Class DN USD, Class IN H CHF, Class IN H EUR, Class IN H NOK, Class IN H SEK, Class IN USD, Class INU H EUR, Class INU H GBP Dist and INU USD were in operation.
Man GLG Unconstrained Emerging Equity Man GLG Unconstrained Emerging Equity’s investment objective is to achieve capital gains in the medium to long-term, through investment in emerging market equities.
The Portfolio will seek to achieve the above objective primarily through investment in emerging market equities. Such equities will generally be listed or traded on Recognised Markets in emerging markets worldwide and the Portfolio will not have a particular sectoral, industry or market capitalisation focus.
As at 31 December 2016, Class D C SEK, Class D C USD, Class DF C USD, Class DF C NOK, Class DF SEK, Class I C SEK, Class I C USD, Class IF C EUR, Class IF C GBP, Class IF C NOK, Class IF C SEK and Class IF C USD were in operation.
Man GLG Global Emerging Markets Debt Total Return Man GLG Global Emerging Markets Debt Total Return’s investment objective is to achieve a return in all market conditions over the long term primarily through investment in a portfolio of fixed income securities denominated in local currency.
As at 31 December 2016, Class D H EUR, Class D H GBP, Class D H NOK, Class D H SEK, Class D USD, Class DL H EUR, Class DMF USD, Class DY USD, Class I H CHF, Class I H EUR, Class I H EUR Dist, Class I H GBP, Class I H NOK, Class I H SEK, Class I USD, Class IL H EUR, Class IL USD, Class IMF H EUR, Class IMF H EUR Dist, Class IMF H GBP Dist and IMF USD were in operation.
Man GLG Innovation Equity Alternative Man GLG Innovation Equity Alternative’s investment objective is to provide investors with absolute returns by taking both long and short positions in equities issued by companies globally.
The Portfolio will seek to apply a long/short investment strategy and intends to take full advantage of the ability to invest in derivatives providing long and “synthetic short” positions. As at 31 December 2016, Class IN USD, Class IN H CHF, Class IN H EUR, Class IN H GBP, Class IN H NOK and Class IN H SEK were in operation. As at 31 December 2016, the Portfolio does not have any exposure to indices.
Man GLG Global Fundamental Equity Man GLG Global Fundamental Equity’s investment objective is to provide investors with absolute returns by taking both long and short positions in equities issued by companies globally.
The Portfolio will seek to apply a long/short investment strategy and intends to take full advantage of the ability to invest in derivatives providing long and “synthetic short” positions.
As at 31 December 2016, Class IN USD, Class IN H CHF, Class IN H EUR, Class IN H GBP, Class IN H NOK and Class IN H SEK were in operation. As at 31 December 2016, the Portfolio does not have any exposure to indices.

Man Funds VI plc Notes to the Financial Statements (continued) For the year ended 31 December 2016
55
2. Summary of significant accounting policies
Accounting convention (a)The financial statements are prepared in accordance with International Financial Reporting Standards (‘‘IFRS’’) as adopted by the EU. The financial statements have been prepared using the historical cost basis except for financial assets and liabilities held at fair value through profit or loss which have been measured at fair value. The combined company balances are expressed in US$, being the presentation currency of the Fund as a whole. For combined company balances in statement of financial position, the non US$ Portfolios are translated using the exchange rate at the date of statement of financial position. For combined company balances in statement of comprehensive income, the non US$ Portfolios are translated at the average exchange rate prevailing during the year. The combined subscriptions and redemptions in the statement of changes in net assets are also translated at the average rate prevailing during the current year. The translation loss resulting from the preparation of the combined company balances in the financial statements amounting to US$56,052,912 (31 December 2015: loss of US$213,634,541) has been shown in the combined company column of statement of comprehensive income. The gain/(loss) does not have any effect on the individual Portfolios.
Changes in accounting policy and disclosure (b)The accounting policies adopted in the preparation of the audited financial statements are consistent with those followed in the preparation of the Fund’s audited financial statements for the year ended 31 December 2015, except for the adoption of new standards and interpretations effective on the dates described below. Standards issued but not yet effective: IFRS 9- Financial Instruments In July 2014, the IASB issued the final version of IFRS 9 Financial Instruments which reflects all phases of the financial instruments project and replaces IAS 39 Financial Instruments: Recognition and Measurement and all previous versions of IFRS 9. The standard introduces new requirements for classification and measurement, impairment, and hedge accounting. IFRS 9 is effective for annual periods beginning on or after 1 January 2018, with early application permitted. Retrospective application is required but comparative information is not compulsory. Early application of previous versions of IFRS 9 (2009, 2010 and 2013) is permitted if the date of initial application is before 1 February 2015. Management is currently assessing the impact of this standard on the Fund. At present, management believes the adoption of IFRS 9 is unlikely to have a material effect on the classification and measurement of the Fund’s financial assets or financial liabilities. IFRS 15 - Revenue from Contracts with Customers IFRS 15 was issued in May 2014 and establishes a new five-step model that will apply to revenue arising from contracts with customers. Under IFRS 15 revenue is recognised at an amount that reflects the consideration to which an entity expects to be entitled in exchange for transferring goods or services to a customer. The principles in IFRS 15 provide a more structured approach to measuring and recognising revenue. The new revenue standard is applicable to all entities and will supersede all current revenue recognition requirements under IFRS. Either a full or modified retrospective application is required for annual periods beginning on or after 1 January 2018 with early adoption permitted. Management is currently assessing the impact of IFRS 15 and plans to adopt the new standard on the required effective date. At the date of authorisation of the financial statements there were a number of other Standards and Interpretations which were in issue but not yet effective. Management anticipates that the adoption of these Standards and Interpretations in future periods will have no material impact on the financial statements of the Fund.
Use of accounting judgements and estimates (c)The preparation of financial statements in accordance with IFRS requires management to make judgements, estimates and assumptions that affect the amounts reported and disclosures made in these financial statements and accompanying notes, including certain valuation assumptions. Uncertainty about these assumptions and estimates could result in outcomes that require a material adjustment to the carrying amount of assets or liabilities in the future.
Going concern (d)Management has made an assessment of the Fund’s ability to continue as a going concern and are satisfied that the Fund has resources to continue in business for the foreseeable future. Furthermore, the management is not aware of any material uncertainties that may cast significant doubt upon the Fund’s ability to continue as a going concern, therefore, the financial statements are prepared on a going concern basis.
Revenue recognition (e)Interest income and dividend income are recorded on an accrual basis and ex-dividend basis respectively, gross of withholding tax.

Man Funds VI plc Notes to the Financial Statements (continued) For the year ended 31 December 2016
56
2. Summary of significant accounting policies (continued)
Financial assets and liabilities (f)For Net Asset Value (NAV) purposes, the valuation of investments is performed in accordance with the Prospectus. For financial statements purposes, investments have been valued in accordance with IFRS using the policies outlined below. At 31 December 2016 and 31 December 2015, there are no material differences between these valuation methodologies. This category has two sub-categories: (i) financial assets and liabilities held for trading: Financial assets or liabilities held for trading are acquired or incurred principally for the purpose of selling or repurchasing in the short term. Derivatives are also categorised as held for trading as the Fund does not designate any derivatives as hedges in a hedging relationship. (ii) those designated by management at fair value through profit or loss at initial recognition: These include equity securities and debt instruments that are not held for trading. These financial assets and liabilities (‘‘financial instruments’’) are designated upon initial recognition on the basis that they are part of a group of financial instruments which are managed and have their performance evaluated on a fair value basis, in accordance with risk management and investment strategies of the Fund. The financial information about these financial instruments is provided internally on that basis to the Investment Managers. As at 31 December 2016 and 2015, the Fund did not hold any financial assets and liabilities designated by management at fair value through profit or loss at initial recognition. The Fund recognises a financial asset or a financial liability when, and only when, it becomes a party to the contractual provisions of the instrument. Regular-way purchases and sales of investments are recognised on the trade date, which is the date on which the Fund commits to purchase or sell the asset. Financial assets and liabilities at fair value through profit or loss are initially recognised at fair value. All transaction costs for such instruments are recognised directly in statement of comprehensive income. After initial measurement, the Fund measures financial instruments, which are classified as at fair value through profit or loss, at their fair values. The fair value of financial instruments traded in active markets (such as publicly traded derivatives and trading securities) is based on quoted market prices as on the statement of financial position date. In circumstances where the last traded price is not within the bid-ask spread, management will determine the point within the bid-ask spread that is most representative of fair value. The Fund may from time to time invest in financial instruments that are not traded in an active market (for example over-the-counter derivatives and private placements of both equities and fixed income securities). These financial instruments are valued at their fair value in the manner described in the subsequent accounting policies. The Directors have appointed an Independent Pricing Committee ("IPC") to undertake certain services concerning the valuation policies and procedures relating to the Fund. The IPC is an independent body set up to: (1) establish a pricing matrix (a table which lays out a pricing source for certain assets and liabilities) which the Directors have adopted for the Fund and which is used by the Administrator to calculate the value of the assets and liabilities held by the Fund; and (2) to establish the prices of any positions held in the Fund that do not have an independently ascertainable value as per the pricing matrix. In addition, the IPC provides general governance and oversight of the valuation process. Any exchange traded derivative instruments (including, but not limited to, options and futures) dealt in on a market are valued at the settlement price on the relevant Valuation Day for such instruments on such a market. If the settlement price is not available, their probable realisation value shall be determined with care and in good faith by the Directors. Investments are derecognised when the rights to receive cash flows have expired or the Fund has transferred substantially all of the risks and rewards of ownership.
Securities sold short (g)The Fund may sell securities short. A short sale is a transaction in which the Fund sells a security it does not own. The proceeds received for short sales are recorded as liabilities and the Fund records an unrealised gain or loss to the extent of the difference between the proceeds received and the value of the open short position. The Fund records a realised gain or loss when the short position is closed. By entering into short sales, the Fund bears the market risk of an unfavourable change in the price of the security sold short in excess of the proceeds received. Short sales expose the Fund to potentially unlimited liability.
Offsetting financial instruments (h)Financial assets and liabilities are offset and the net amount reported in the statement of financial position when there is a legally enforceable right to offset the recognised amounts and there is an intention to settle on a net basis or realise the assets and settle the liabilities simultaneously. As at 31 December 2016 and 31 December 2015, no financial assets and liabilities are offset in the statement of financial position. Please refer to Note 5.
Derivatives (i)The Fund may trade in derivative financial instruments whose values are based upon an underlying asset, index, currency or interest rate. The net unrealised gains or losses, rather than contracts or notional amounts, represents the approximate future cash flows from trading. The Fund engaged in asset swapped convertible option transactions (‘‘ASCOTs’’), contracts for difference, forward currency contracts, futures contracts, option contracts, swap contracts, credit default swaps and total return swaps.

Man Funds VI plc Notes to the Financial Statements (continued) For the year ended 31 December 2016
57
2. Summary of significant accounting policies (continued)
Derivatives (continued) (i)
- Contracts for difference (‘‘CFD’’) An unfunded contract for difference (‘‘CFD’’) is an agreement between the Fund and a third party which allows the Fund to acquire an exposure to the price movement of specific securities without actually purchasing the securities. Upon entering into an unfunded CFD, the Fund is required to deposit with a broker an initial cash margin equal to a certain percentage of the contract amount. Variation margin payments are made or received by the Fund depending upon the fluctuation in the value of the underlying securities. The changes in contract values are recorded as unrealised gains or losses and the Fund recognises a realised gain or loss when the contract is closed. CFDs are similar to total return swaps, but are more standardised and primarily used in the UK and Ireland.
- Forward contracts Forward contracts are recorded on the trade date and are valued at the applicable foreign exchange rates on the last business day of the year. The difference between the fair value of the original contract amount and the fair value of the open forward currency contract position is reflected as unrealised appreciation or depreciation on open forward currency contracts in the statement of financial position and as a net change in unrealised appreciation or depreciation on open forward currency contracts in the statement of comprehensive income. Realised gains or losses are recognised on the maturity or trade date of the contract and are included in net realised gains/(losses) in the statement of comprehensive income.
- Futures contracts Futures contracts are recorded on the trade date and are valued at the last traded price on the last business day of the year. The difference between the original contract amount and the fair value of the open futures position is reflected as financial assets or financial liabilities at fair value through profit or loss in the statement of financial position and as net gain/(loss) on financial assets and liabilities at fair value through profit or loss in the statement of comprehensive income. Realised gains or losses are recognised on the closing or trade date of the contract and are included in net gain/(loss) on financial assets and liabilities at fair value through profit or loss in the statement of comprehensive income.
- Option contracts The Fund may invest in option contracts. An option contract gives the owner the right, but not the obligation, to buy (‘‘call option’’) or to sell (‘‘put option’’) a specified item at a fixed price during a specified year for a non-refundable fee (‘‘premium’’). The maximum loss to a buyer of an option is the loss of the premium. The writer of a call option has to bear the risk of an unfavourable change in the value underlying the option and, unless an offsetting long position is owned, the theoretical loss is unlimited. The loss to the writer of a put option is limited to the exercise price of the option, versus the premium collected on its sale. Option contracts are held at fair value with reference to quoted market prices, when available, or based on pricing models that consider the time value of money, volatility and the current market and contractual prices of the underlying financial instruments.
- Swap contracts Swaps are contractual agreements between two parties to exchange streams of payments over time based on specified notional amounts. The swaps are valued at an amount equal to the gain or loss that would be realised if the position was closed out on the valuation date. The Fund’s main swap contracts consist of credit default swaps and total return swaps. Swaps are marked-to-market daily and changes in value are recorded as unrealised appreciation/(depreciation). When the swap is terminated, the Fund will record a realised gain/(loss) equal to the difference between the proceeds from (or cost of) the closing transaction and the Fund’s basis in the contract, if any. Swap transactions involve, to varying degrees, elements of credit and market risk in excess of the amounts recognised in the statement of financial position. Such risks involve the possibility that there will be no liquid market for these agreements, that the counterparty to the agreements may default on its obligation to perform or disagree as to the meaning of the contractual terms in the agreements, and that there may be unfavourable changes in interest rates and/or market values associated with these transactions.
- Credit default swaps The Fund may enter into credit default swaps to manage its exposure to certain sectors of the market or to reduce credit risk or for speculative purposes. The Fund may enter into credit default swap agreements to provide a measure of protection against the default of an issuer (as buyer of protection) and/or gain credit exposure to an issuer to which it is not otherwise exposed (as seller of protection). Credit default swaps are agreements in which one party pays fixed periodic payments to counterparty in consideration for a guarantee from the counterparty to make a specific payment should a negative credit event take place (e.g. default, bankruptcy or debt restructuring). The Fund may either buy or sell (write) credit default swaps. As a buyer, the Fund will either receive from the seller an amount equal to the notional amount of the swap and deliver the referenced security or underlying securities comprising of an index or receive a net settlement of cash equal to the notional amount of the swap less the recovery value of the security or underlying securities comprising of an index. As a seller (writer), the Fund will either pay the buyer an amount equal to the notional amount of the swap and take delivery of the referenced security or underlying securities comprising of an index or pay a net settlement of cash equal to the notional amount of the swap less the recovery value of the security or underlying securities comprising of an index. In the event of default by the counterparty, the Fund may recover amounts paid under the agreement either partially or in total by offsetting any payables and/or receivables with collateral held or pledged.
These periodic payments received or made by the Fund are included in net realised gain/(loss) on investment at fair value through profit or loss in the statement of comprehensive income.
- Interest rate swaps Interest rate swaps relate to contracts taken out by the Fund with major brokers in which the Fund either receives or pays a floating rate of interest in return for paying or receiving, respectively, a fixed rate of interest. The payment flows are usually netted against each other, with the difference being paid by one party to the other. Changes in the value of the interest rate swap agreements and amounts received or paid in connection with them are recognised as net gain/(loss) on financial assets and liabilities at fair value through profit or loss in the statement of comprehensive income.

Man Funds VI plc Notes to the Financial Statements (continued) For the year ended 31 December 2016
58
2. Summary of significant accounting policies (continued)
Derivatives (continued) (i)
- Total return swaps The Fund may also hold investment positions through total return swaps. Total return swaps are contracts in which the Fund pays or receives a series of cash flows based upon the total return of a specified asset in return for paying or receiving, respectively, a fixed or floating rate of interest based upon that same specified asset.
- Equity swaps Equity swaps are valued based on the differences between the notional long/(short) position of the underlying equity security calculated from a reference price on the date of entering the contract and the fair value at the date of closing the trade, or the reporting date if prior to termination of the contract. For unsettled positions, the fair value on open equity swaps is included in the statement of financial position / condition. The change in fair value is included in the statement of comprehensive income as net gain/(loss) on financial assets and liabilities at fair value through profit or loss.
- Swaptions A swaption represents a derivative contract granting its owner the right but not the obligation to enter into an underlying interest rate swap contract by some specified date in the future. Swaptions are recorded at fair value which is determined using valuation models that consider the terms of the swaption contract and volatility of the underlying forward interest rates. The fair value of the open position is reflected in financial assets or liabilities at fair value through profit or loss in the statement of financial position, which includes the premium paid/received, if any. The change in fair value is included in the statement of comprehensive income as net gain/(loss) on financial assets and liabilities at fair value through profit or loss.
- Warrants The Fund invests in warrants through listed exchanges and OTC markets. The listed warrants are traded on recognised exchanges and valued at the last traded price. OTC traded warrants are valued by reference to quoted prices. Change in realised and unrealised gains and losses are recorded in the statement of comprehensive income.
Realised and unrealised gains and losses (j)All realised and unrealised gains and losses on securities and derivatives are recognised as net gain/(loss) on financial assets and liabilities at fair value through profit or loss in the statement of comprehensive income. Unrealised gains and losses comprise changes in the fair value of financial instruments for the year and from reversal of prior year’s unrealised gains and losses for financial instruments which were realised in the reporting year. Realised gains and losses represent the difference between an instrument’s initial carrying amount and disposal amount, or cash payments or receipts made on derivative contracts (excluding payments or receipts on collateral margin accounts for such instruments). The cost of securities is accounted for on a specific identification basis.
Transaction costs (k)Transaction costs are incremental costs, which are separately identifiable and directly attributable to the acquisition, issue or disposal of a financial asset or financial liability. Transaction costs incurred by the Fund during the year are recognised in the statement of comprehensive income.
Functional and presentation currency (l)The Fund seeks to generate returns in United States dollars, its capital-raising currency. The liquidity of the Fund is managed on a day-to-day basis in United States dollars in order to handle the issue and redemption of the Fund’s Redeemable Participating Shares. The Fund’s performance is also evaluated in United States dollars. Therefore, the United States dollar is considered as the currency that most faithfully represents the economic effects of the underlying transactions, events and conditions. The Fund’s functional and presentational currency is the United States dollar.
Securities sold under agreements to repurchase and securities purchased under agreements to resell (m)Securities sold under agreement to repurchase at a specified future date are not derecognised from the statement of financial position as the Fund retains substantially all the risks and rewards of ownership. The corresponding cash received is recognised in the statement of financial position with a corresponding obligation to repay it, reflecting its economic substance as a loan to the Fund. The difference between the sale and repurchase prices is treated as interest expense and is accrued over the life of the agreement and is included in the statement of comprehensive income. Where the counterparty has the right to sell or pledge the securities sold to it then the assets are separately disclosed as securities purchased under agreement to resell.
Securities purchased under agreements to resell at a specified future date (‘‘Reverse Repurchase Agreements’’) are not recognised in the statement of financial position unless they are subsequently sold to third parties (‘rehypothecation’), in which case, the obligation to return the securities is recorded as a short sale within trading liabilities and measured at fair value with any gains or losses included in the statement of comprehensive income. The corresponding cash paid is derecognised and a corresponding receivable is recorded in the statement of financial position reflecting the Fund’s right to receive it back. The difference between the purchase and resale prices is treated as interest income, accrued over the life of the agreement and included in the statement of comprehensive income.
Foreign currency (n)Transactions during the year denominated in foreign currencies have been translated at the rates of exchange ruling at the dates of transactions. Assets and liabilities denominated in foreign currencies are translated at the rates of exchange in effect at the date of the statement of financial position. For investment transactions and investments held as at year end denominated in foreign currency, resulting gains or losses are included in the net gain/(loss) on financial assets and liabilities at fair value through profit or loss in the statement of comprehensive income. All other foreign currency gains and losses are included in the net gain/(loss) on foreign currency in the statement of comprehensive income.

Man Funds VI plc Notes to the Financial Statements (continued) For the year ended 31 December 2016
59
2. Summary of significant accounting policies (continued)
Other expenses (o)Other expenses are recognised in the statement of comprehensive income on an accruals basis.
Redeemable participating shares (p)Redeemable shares are classified as equity instruments when: The redeemable shares entitle the holder to a pro rata share of the Fund’s net assets in the event of the Fund’s liquidation The redeemable shares are in the class of instruments that is subordinate to all other classes of instruments All redeemable shares in the class of instruments that is subordinate to all other classes of instruments have identical features The redeemable shares do not include any contractual obligation to deliver cash or another financial asset other than the holder’s
rights to a pro rata share of the Fund’s net assets The total expected cash flows attributable to the redeemable shares over the life of the instrument are based substantially on the
profit or loss, the change in the recognised net assets or the change in the fair value of the recognised and unrecognised net assets of the Fund over the life of the instrument
In addition to the redeemable shares having all of the above features, the Fund must have no other financial instrument or contract that has: Total cash flows based substantially on the profit or loss, the change in the recognised net assets or the change in the fair value of
the recognised and unrecognised net assets of the Fund The effect of substantially restricting or fixing the residual return to the redeemable shareholders The Fund continuously assesses the classification of the redeemable shares. If the redeemable shares cease to have all the features, or meet all the conditions set out, to be classified as equity, the Fund will reclassify them as financial liabilities and measure them at fair value at the date of reclassification, with any differences from the previous carrying amount recognised in equity. If the redeemable shares subsequently have all the features and meet the conditions to be classified as equity, the Fund will reclassify them as equity instruments and measure them at the carrying amount of the liabilities at the date of the reclassification.
Cash and cash equivalents, balances with brokers and balances due from/to brokers (q)Cash and cash equivalents in the statement of financial position may consist of cash at bank, demand deposits, short-term deposits in financial institutions and short-term highly liquid investments that are readily convertible to known amounts of cash and which are subject to an insignificant risk of changes in value, with original maturities of three months or less, net of outstanding bank overdrafts when applicable. Short-term investments that are not held for the purpose of meeting short-term cash commitments and restricted margin accounts are not considered cash and cash equivalents. For the purpose of the statement of cash flows, cash and cash equivalents consist of cash and cash equivalents as defined above, net of outstanding bank overdrafts when applicable. Due from brokers include receivables for securities sold (in a regular way transaction) that have been contracted for but not yet delivered on the statement of financial position date. These are carried at amortised cost using the effective interest method less any allowance for impairment. Due to brokers are payables for securities purchased (in a regular way transaction) that have been contracted for but not yet delivered on the statement of financial position date. These are measured at amortised cost using the effective interest method. Balances with brokers and balances due to brokers represent the margin account balances held at the Fund’s brokers and balances payable to the Fund’s brokers at the period/year end, and can include amounts transferred as collateral (and therefore subject to a security interest) against open derivative contracts.
Distributions to shareholders (r)In accordance with the Fund’s’ constitution, the Fund may fully distribute its distributable income to shareholders. Distributable income includes capital gains arising from the disposal of investments. Unrealised gains and losses are included in the net assets attributable to shareholders and are not distributable until realised. Capital losses are not distributed to shareholders, but are retained to be offset against any future realised capital gains. Distributions to shareholders are recognized in statement of comprehensive income as finance costs.
3. Cash and cash equivalents, balances with brokers / balances due from/to brokers At the year end, amounts disclosed as cash and cash equivalents, balances with brokers and balances due to brokers were held at the Bank of New York Mellon (Brussels), Bank of America Merrill Lynch, Barclays Plc, BNP Paribas, Citibank N.A., Credit Suisse Securities (Europe) Limited, Deutsche Bank AG, Goldman Sachs International, HSBC Bank Plc, JP Morgan Securities Plc, Macquarie Bank, Morgan Stanley & Co. International Plc, Royal Bank of Scotland, Societe Generale, Standard Chartered Plc and UBS AG. These include amounts transferred as collateral against open derivatives, deposits held at call with banks and, other short term highly liquid investments with original maturities of three months or less.

Man Funds VI plc Notes to the Financial Statements (continued) For the year ended 31 December 2016
60
3. Cash and cash equivalents, balances with brokers / balances due from/to brokers (continued)
The portions of balances with brokers represented by collateral as at 31 December 2016 and as at 31 December 2015 were:
31 December 2016 31 December 2015Man GLG European Alpha Alternative €13,813,862 €22,179,454Man GLG Alpha Select Alternative £121,941 £81,558Man GLG European Equity Alternative €57,001,211 €43,389,845Man GLG Total Return - £23Man GLG Global Equity Alternative €25,185,406 €42,403,050Man GLG Asian Equity Alternative - US$14,011,143 Man GLG European Alpha Alternative Enhanced - €2,435,967Man GLG Cred-Eq Alternative €4,539,103 €11,259,112Man AHL Multi Strategy Alternative US$9,296,535 US$12,790,482 Man AHL Directional Equities Alternative - US$1,197,456 Man AHL TargetRisk US$1,694,020 US$582,527 Man AHL Volatility Alternative US$422,366 US$1,076,746 Man GLG European Mid-Cap Equity Alternative €26,251,352 €4,200,411Man Numeric Market Neutral Alternative US$1,300,000 - Man GLG Unconstrained Emerging Equity US$11,380,157 US$1,895,364 Man GLG Global Emerging Markets Debt Total Return US$40,923,011 n/aMan GLG Innovation Equity Alternative - n/aMan GLG Global Fundamental Equity - n/a
4. Financial assets and liabilities at fair value through profit or loss Forward contracts As part of its portfolio management techniques, the Fund may use forward contracts to economically hedge any non-functional currency exposure (although formal hedge accounting is not used). Forward contracts may also be used for trading purposes. Forward contracts entered into by the Fund represent a firm commitment to buy or sell an underlying asset, or currency at a specified value and point in time based upon an agreed or contracted quantity. Forward contracts may expose the Fund to the risks associated with the absence of an exchange market on which to close out an open position. The investment manager closely monitors the Fund’s exposure under forward contracts as part of the overall management of the Fund’s market risk. Fair value of financial instruments The Fund classifies fair value measurements using a fair value hierarchy that reflects the significance of the inputs used in determining the measurements in line with IFRS 13.
The fair value hierarchy has the following levels:
Level 1 - Quoted market price in an active market for an identical instrument. Level 2 - Valuation techniques based on observable inputs. This category includes instruments valued using: quoted market
prices in active markets for similar instruments; quoted prices for similar instruments in markets that are considered less than active; or other valuation techniques where all significant inputs are directly or indirectly observable from market data.
Level 3 - Valuation techniques using significant unobservable inputs. This category includes all instruments where the valuation technique includes inputs not based on observable data and the unobservable inputs could have a significant impact on the instrument’s valuation. This category includes instruments that are valued based on quoted prices for similar instruments where significant unobservable adjustments or assumptions are required to reflect differences between the instruments.
Valuation techniques
Listed or publicly traded investment in equity and debt securities, managed funds and derivatives When fair values of listed or publicly traded equity and debt securities, equities and managed funds and derivatives are based on quoted market prices, or binding dealer price quotations, in an active market for identical assets without any adjustments, the instruments are included within Level 1 of the hierarchy.
Unlisted debt securities and treasury bills The Fund invests in debt securities, corporate and government bonds and treasury securities. In the absence of a quoted price in an active market, they are valued using observable inputs such as recently executed transaction prices in securities of the issuer or comparable issuers and yield curves. Adjustments are made to the valuations when necessary to recognise differences in the instruments terms. To the extent that the significant inputs are observable, the Fund categorises these investments as Level 2.

Man Funds VI plc Notes to the Financial Statements (continued) For the year ended 31 December 2016
61
4. Financial assets and liabilities at fair value through profit or loss (continued) Fair value of financial instruments (continued)
Valuation techniques (continued)
Over-the-counter derivatives The Fund uses widely recognised valuation models for determining fair values of over-the-counter interest rate swaps, currency swaps and forward foreign exchange contracts. The most frequently applied valuation techniques include forward pricing and swap models, using present value calculations. The models incorporate various inputs including both credit and debit valuation adjustments for counterparty and own credit risk, foreign exchange spot and forward rates and interest rate curves. For these financial instruments, significant inputs into models are market observable and are included within Level 2. Unlisted equity investments The Fund invests in private equity companies which are not quoted in an active market. Transactions in such investments do not occur on a regular basis. The Fund uses a market based valuation technique for these positions. The Fund’s Investment Manager determines comparable public companies (peers) based on industry, size, leverage and strategy, and calculates an appropriate trading multiple for each comparable company identified. The multiple is calculated by dividing the enterprise value of the comparable company by an earnings measure. The trading multiple is then discounted for considerations such as illiquidity and size differences between the comparable companies based on company-specific facts and circumstances. The discounted multiple is applied to the corresponding earnings measure of the investee company to measure the fair value. The Fund classifies the fair value of these investments as Level 3. For all other financial instruments, fair value is determined using valuation techniques. Valuation techniques include net present value techniques, comparison to similar instruments for which market observable prices exist, options pricing models and other relevant valuation models. The following tables summarise the financial instruments at fair value through profit or loss as at 31 December 2016 and 31 December 2015 and the financial instruments measured at fair value in the statement of financial position grouped into the fair value hierarchy: Man GLG European Alpha Alternative31 December 2016 Level 1 Level 2 Level 3 Total Fair Value
€ € € € Financial assets at fair value through profit or lossHeld for TradingEquities and managed funds Equities 101,636,238 - - 101,636,238 Total equities and managed funds 101,636,238 - - 101,636,238
Derivatives Contracts for difference - unfunded - 281,243 - 281,243 Forward currency contracts - 4,240 - 4,240 Future contract 100 - - 100 Total return swap - - - - Total derivatives 100 285,483 - 285,583
Total financial assets at fair value through profit or loss 101,636,338 285,483 - 101,921,821
Financial liabilit ies at fair value through profit or lossHeld for TradingDerivatives Contracts for difference - unfunded - (2,971,425) - (2,971,425) Forward currency contracts - (492,765) - (492,765) Total return swap - (2,806) - (2,806)Total derivatives - (3,466,996) - (3,466,996)
Total financial liabilit ies at fair value through profit or loss - (3,466,996) - (3,466,996)

Man Funds VI plc Notes to the Financial Statements (continued) For the year ended 31 December 2016
62
4. Financial assets and liabilities at fair value through profit or loss (continued) Fair value of financial instruments (continued)
Man GLG European Alpha Alternative (continued) 31 December 2015 Level 1 Level 2 Level 3 Total Fair Value
€ € € € Financial assets at fair value through profit or lossHeld for TradingEquities and managed funds Equities 373,385,229 - - 373,385,229 Total equities and managed funds 373,385,229 - - 373,385,229
Derivatives Contracts for difference - unfunded - 7,675,292 - 7,675,292 Total return swaps - 3,946,232 - 3,946,232 Forward currency contracts - 324,857 - 324,857 Future contract 95,860 - - 95,860 Total derivatives 95,860 11,946,381 - 12,042,241
Total financial assets at fair value through profit or loss 373,481,089 11,946,381 - 385,427,470
Financial liabilit ies at fair value through profit or lossHeld for TradingDerivatives Contracts for difference - unfunded - (13,013,653) - (13,013,653) Total return swaps - (9,886,496) - (9,886,496) Future contract (320,501) - - (320,501) Forward currency contracts - (171,668) - (171,668)Total derivatives (320,501) (23,071,817) - (23,392,318)
Total financial liabilit ies at fair value through profit or loss (320,501) (23,071,817) - (23,392,318)
Man GLG Alpha Select Alternative31 December 2016
£ £ £ £ Financial assets at fair value through profit or lossHeld for TradingEquities and managed funds Equities 2,281,741 - - 2,281,741 Total equities and managed funds 2,281,741 - - 2,281,741
Interest bearing securities Government bonds 62,029,420 - - 62,029,420 Total interest bearing securities 62,029,420 - - 62,029,420
Derivatives Contracts for difference - unfunded - 5,533,923 - 5,533,923 Forward currency contracts - 660,260 - 660,260 Total derivatives - 6,194,183 - 6,194,183
Total financial assets at fair value through profit or loss 64,311,161 6,194,183 - 70,505,344
Financial liabilit ies at fair value through profit or lossHeld for TradingDerivatives Contracts for difference - unfunded - (4,426,894) - (4,426,894) Future contract (109,880) - - (109,880) Forward currency contracts - (448) - (448)Total derivatives (109,880) (4,427,342) - (4,537,222)
Total financial liabilit ies at fair value through profit or loss (109,880) (4,427,342) - (4,537,222)
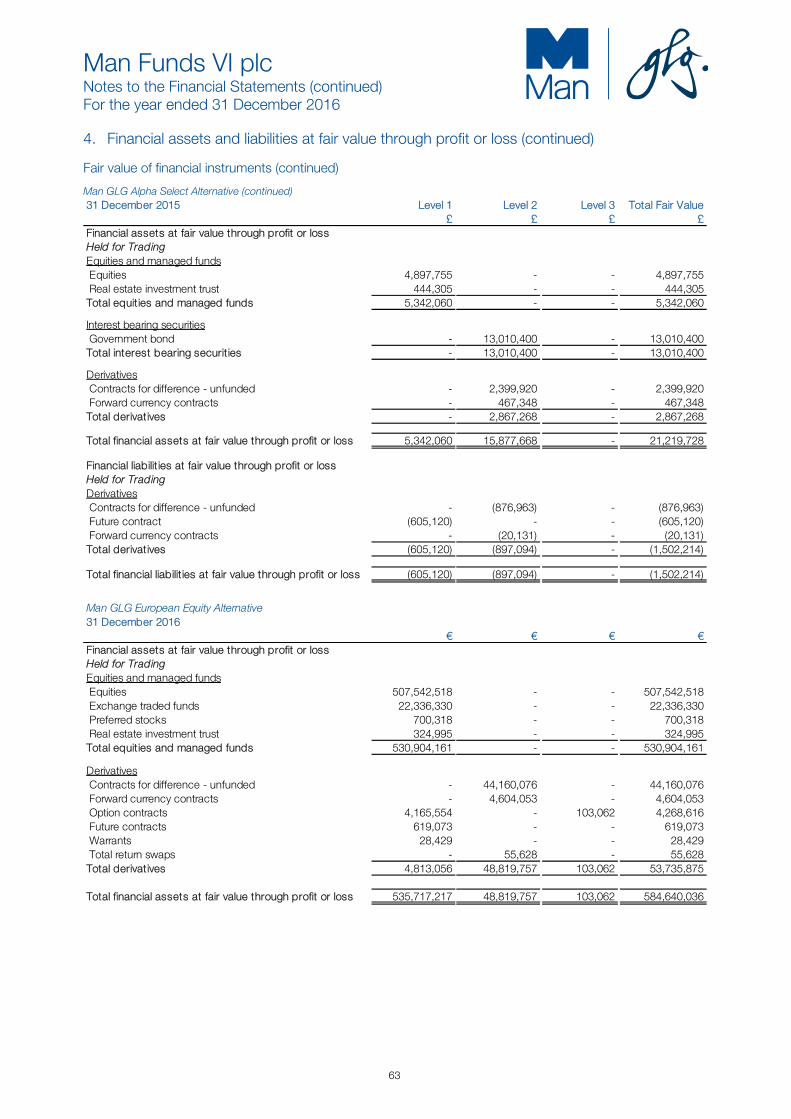
Man Funds VI plc Notes to the Financial Statements (continued) For the year ended 31 December 2016
63
4. Financial assets and liabilities at fair value through profit or loss (continued) Fair value of financial instruments (continued)
Man GLG Alpha Select Alternative (continued) 31 December 2015 Level 1 Level 2 Level 3 Total Fair Value
£ £ £ £ Financial assets at fair value through profit or lossHeld for TradingEquities and managed funds Equities 4,897,755 - - 4,897,755 Real estate investment trust 444,305 - - 444,305 Total equities and managed funds 5,342,060 - - 5,342,060
Interest bearing securities Government bond - 13,010,400 - 13,010,400 Total interest bearing securities - 13,010,400 - 13,010,400
Derivatives Contracts for difference - unfunded - 2,399,920 - 2,399,920 Forward currency contracts - 467,348 - 467,348 Total derivatives - 2,867,268 - 2,867,268
Total financial assets at fair value through profit or loss 5,342,060 15,877,668 - 21,219,728
Financial liabilit ies at fair value through profit or lossHeld for TradingDerivatives Contracts for difference - unfunded - (876,963) - (876,963) Future contract (605,120) - - (605,120) Forward currency contracts - (20,131) - (20,131)Total derivatives (605,120) (897,094) - (1,502,214)
Total financial liabilit ies at fair value through profit or loss (605,120) (897,094) - (1,502,214)
Man GLG European Equity Alternative31 December 2016
€ € € € Financial assets at fair value through profit or lossHeld for TradingEquities and managed funds Equities 507,542,518 - - 507,542,518 Exchange traded funds 22,336,330 - - 22,336,330 Preferred stocks 700,318 - - 700,318 Real estate investment trust 324,995 - - 324,995 Total equities and managed funds 530,904,161 - - 530,904,161
Derivatives Contracts for difference - unfunded - 44,160,076 - 44,160,076 Forward currency contracts - 4,604,053 - 4,604,053 Option contracts 4,165,554 - 103,062 4,268,616 Future contracts 619,073 - - 619,073 Warrants 28,429 - - 28,429 Total return swaps - 55,628 - 55,628 Total derivatives 4,813,056 48,819,757 103,062 53,735,875
Total financial assets at fair value through profit or loss 535,717,217 48,819,757 103,062 584,640,036
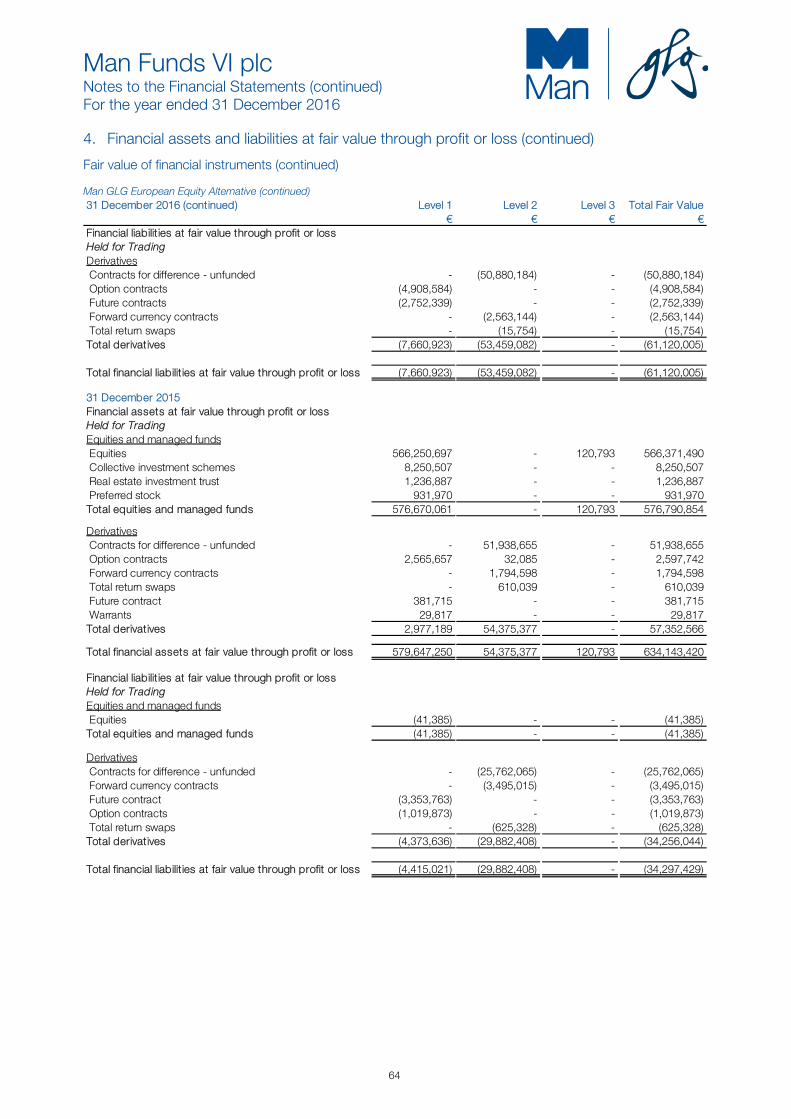
Man Funds VI plc Notes to the Financial Statements (continued) For the year ended 31 December 2016
64
4. Financial assets and liabilities at fair value through profit or loss (continued)
Fair value of financial instruments (continued) Man GLG European Equity Alternative (continued) 31 December 2016 (continued) Level 1 Level 2 Level 3 Total Fair Value
€ € € € Financial liabilit ies at fair value through profit or lossHeld for TradingDerivatives Contracts for difference - unfunded - (50,880,184) - (50,880,184) Option contracts (4,908,584) - - (4,908,584) Future contracts (2,752,339) - - (2,752,339) Forward currency contracts - (2,563,144) - (2,563,144) Total return swaps - (15,754) - (15,754)Total derivatives (7,660,923) (53,459,082) - (61,120,005)
Total financial liabilit ies at fair value through profit or loss (7,660,923) (53,459,082) - (61,120,005)
31 December 2015Financial assets at fair value through profit or lossHeld for TradingEquities and managed funds Equities 566,250,697 - 120,793 566,371,490 Collective investment schemes 8,250,507 - - 8,250,507 Real estate investment trust 1,236,887 - - 1,236,887 Preferred stock 931,970 - - 931,970 Total equities and managed funds 576,670,061 - 120,793 576,790,854
Derivatives Contracts for difference - unfunded - 51,938,655 - 51,938,655 Option contracts 2,565,657 32,085 - 2,597,742 Forward currency contracts - 1,794,598 - 1,794,598 Total return swaps - 610,039 - 610,039 Future contract 381,715 - - 381,715 Warrants 29,817 - - 29,817 Total derivatives 2,977,189 54,375,377 - 57,352,566
Total financial assets at fair value through profit or loss 579,647,250 54,375,377 120,793 634,143,420
Financial liabilit ies at fair value through profit or lossHeld for TradingEquities and managed funds Equities (41,385) - - (41,385)Total equities and managed funds (41,385) - - (41,385)
Derivatives Contracts for difference - unfunded - (25,762,065) - (25,762,065) Forward currency contracts - (3,495,015) - (3,495,015) Future contract (3,353,763) - - (3,353,763) Option contracts (1,019,873) - - (1,019,873) Total return swaps - (625,328) - (625,328)Total derivatives (4,373,636) (29,882,408) - (34,256,044)
Total financial liabilit ies at fair value through profit or loss (4,415,021) (29,882,408) - (34,297,429)
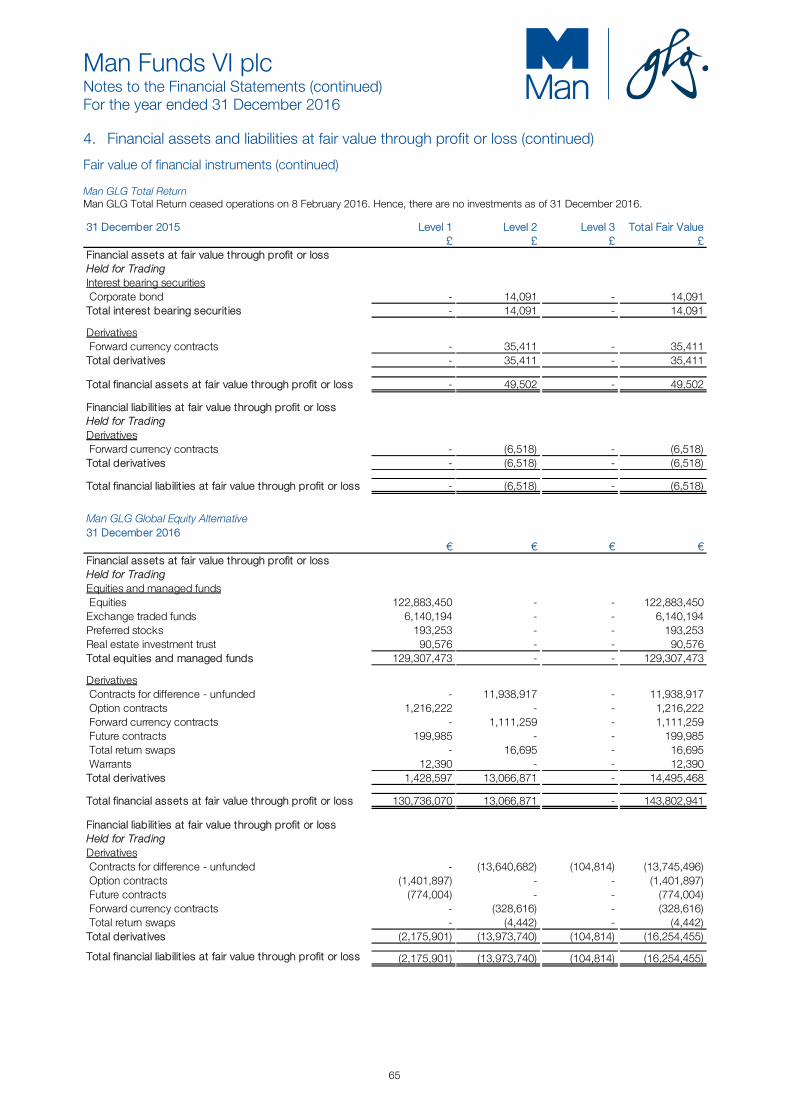
Man Funds VI plc Notes to the Financial Statements (continued) For the year ended 31 December 2016
65
4. Financial assets and liabilities at fair value through profit or loss (continued)
Fair value of financial instruments (continued) Man GLG Total Return Man GLG Total Return ceased operations on 8 February 2016. Hence, there are no investments as of 31 December 2016.
31 December 2015 Level 1 Level 2 Level 3 Total Fair Value £ £ £ £
Financial assets at fair value through profit or lossHeld for TradingInterest bearing securities Corporate bond - 14,091 - 14,091 Total interest bearing securities - 14,091 - 14,091
Derivatives Forward currency contracts - 35,411 - 35,411 Total derivatives - 35,411 - 35,411
Total financial assets at fair value through profit or loss - 49,502 - 49,502
Financial liabilit ies at fair value through profit or lossHeld for TradingDerivatives Forward currency contracts - (6,518) - (6,518)Total derivatives - (6,518) - (6,518)
Total financial liabilit ies at fair value through profit or loss - (6,518) - (6,518)
Man GLG Global Equity Alternative31 December 2016
€ € € € Financial assets at fair value through profit or lossHeld for TradingEquities and managed funds Equities 122,883,450 - - 122,883,450 Exchange traded funds 6,140,194 - - 6,140,194 Preferred stocks 193,253 - - 193,253 Real estate investment trust 90,576 - - 90,576 Total equities and managed funds 129,307,473 - - 129,307,473
Derivatives Contracts for difference - unfunded - 11,938,917 - 11,938,917 Option contracts 1,216,222 - - 1,216,222 Forward currency contracts - 1,111,259 - 1,111,259 Future contracts 199,985 - - 199,985 Total return swaps - 16,695 - 16,695 Warrants 12,390 - - 12,390 Total derivatives 1,428,597 13,066,871 - 14,495,468
Total financial assets at fair value through profit or loss 130,736,070 13,066,871 - 143,802,941
Financial liabilit ies at fair value through profit or lossHeld for TradingDerivatives Contracts for difference - unfunded - (13,640,682) (104,814) (13,745,496) Option contracts (1,401,897) - - (1,401,897) Future contracts (774,004) - - (774,004) Forward currency contracts - (328,616) - (328,616) Total return swaps - (4,442) - (4,442)Total derivatives (2,175,901) (13,973,740) (104,814) (16,254,455)
Total financial liabilit ies at fair value through profit or loss (2,175,901) (13,973,740) (104,814) (16,254,455)
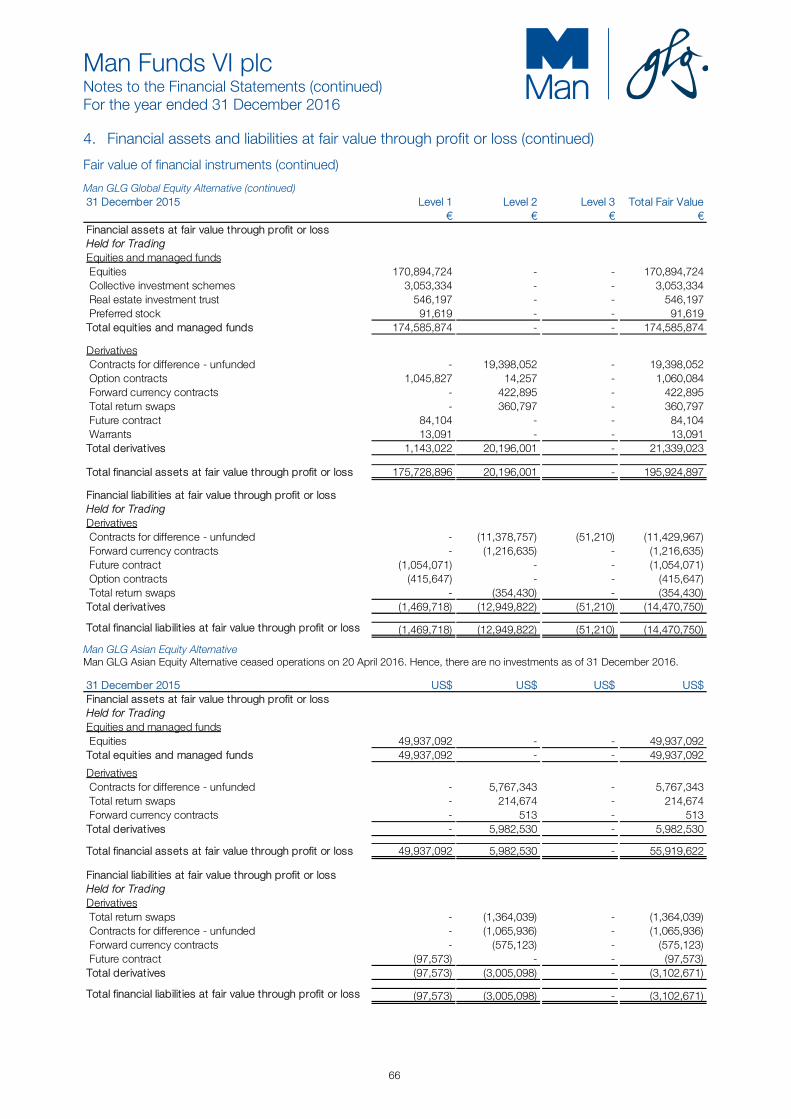
Man Funds VI plc Notes to the Financial Statements (continued) For the year ended 31 December 2016
66
4. Financial assets and liabilities at fair value through profit or loss (continued)
Fair value of financial instruments (continued)
Man GLG Global Equity Alternative (continued) 31 December 2015 Level 1 Level 2 Level 3 Total Fair Value
€ € € € Financial assets at fair value through profit or lossHeld for TradingEquities and managed funds Equities 170,894,724 - - 170,894,724 Collective investment schemes 3,053,334 - - 3,053,334 Real estate investment trust 546,197 - - 546,197 Preferred stock 91,619 - - 91,619 Total equities and managed funds 174,585,874 - - 174,585,874
Derivatives Contracts for difference - unfunded - 19,398,052 - 19,398,052 Option contracts 1,045,827 14,257 - 1,060,084 Forward currency contracts - 422,895 - 422,895 Total return swaps - 360,797 - 360,797 Future contract 84,104 - - 84,104 Warrants 13,091 - - 13,091 Total derivatives 1,143,022 20,196,001 - 21,339,023
Total financial assets at fair value through profit or loss 175,728,896 20,196,001 - 195,924,897
Financial liabilit ies at fair value through profit or lossHeld for TradingDerivatives Contracts for difference - unfunded - (11,378,757) (51,210) (11,429,967) Forward currency contracts - (1,216,635) - (1,216,635) Future contract (1,054,071) - - (1,054,071) Option contracts (415,647) - - (415,647) Total return swaps - (354,430) - (354,430)Total derivatives (1,469,718) (12,949,822) (51,210) (14,470,750)
Total financial liabilit ies at fair value through profit or loss (1,469,718) (12,949,822) (51,210) (14,470,750)
Man GLG Asian Equity Alternative Man GLG Asian Equity Alternative ceased operations on 20 April 2016. Hence, there are no investments as of 31 December 2016.
31 December 2015 US$ US$ US$ US$ Financial assets at fair value through profit or lossHeld for TradingEquities and managed funds Equities 49,937,092 - - 49,937,092 Total equities and managed funds 49,937,092 - - 49,937,092
Derivatives Contracts for difference - unfunded - 5,767,343 - 5,767,343 Total return swaps - 214,674 - 214,674 Forward currency contracts - 513 - 513 Total derivatives - 5,982,530 - 5,982,530
Total financial assets at fair value through profit or loss 49,937,092 5,982,530 - 55,919,622
Financial liabilit ies at fair value through profit or lossHeld for TradingDerivatives Total return swaps - (1,364,039) - (1,364,039) Contracts for difference - unfunded - (1,065,936) - (1,065,936) Forward currency contracts - (575,123) - (575,123) Future contract (97,573) - - (97,573)Total derivatives (97,573) (3,005,098) - (3,102,671)
Total financial liabilit ies at fair value through profit or loss (97,573) (3,005,098) - (3,102,671)
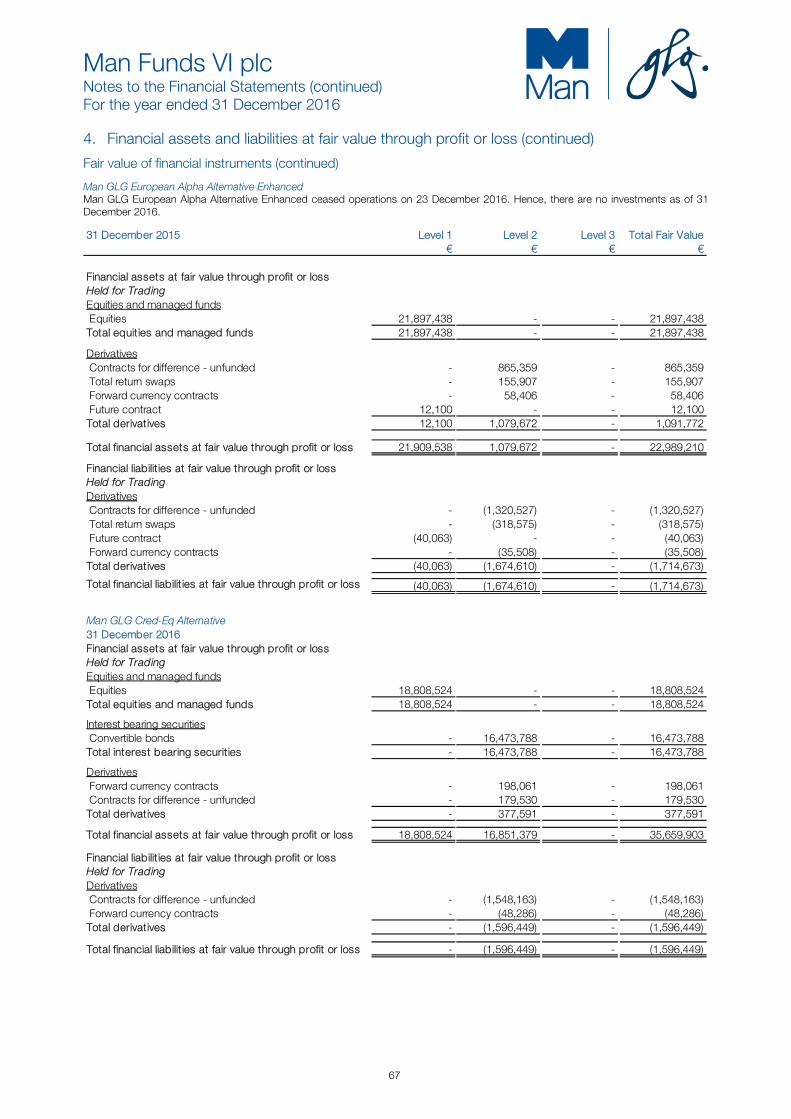
Man Funds VI plc Notes to the Financial Statements (continued) For the year ended 31 December 2016
67
4. Financial assets and liabilities at fair value through profit or loss (continued)
Fair value of financial instruments (continued)
Man GLG European Alpha Alternative Enhanced Man GLG European Alpha Alternative Enhanced ceased operations on 23 December 2016. Hence, there are no investments as of 31 December 2016.
31 December 2015 Level 1 Level 2 Level 3 Total Fair Value € € € €
Financial assets at fair value through profit or lossHeld for TradingEquities and managed funds Equities 21,897,438 - - 21,897,438 Total equities and managed funds 21,897,438 - - 21,897,438
Derivatives Contracts for difference - unfunded - 865,359 - 865,359 Total return swaps - 155,907 - 155,907 Forward currency contracts - 58,406 - 58,406 Future contract 12,100 - - 12,100 Total derivatives 12,100 1,079,672 - 1,091,772
Total financial assets at fair value through profit or loss 21,909,538 1,079,672 - 22,989,210
Financial liabilit ies at fair value through profit or lossHeld for TradingDerivatives Contracts for difference - unfunded - (1,320,527) - (1,320,527) Total return swaps - (318,575) - (318,575) Future contract (40,063) - - (40,063) Forward currency contracts - (35,508) - (35,508)Total derivatives (40,063) (1,674,610) - (1,714,673)
Total financial liabilit ies at fair value through profit or loss (40,063) (1,674,610) - (1,714,673)
Man GLG Cred-Eq Alternative31 December 2016Financial assets at fair value through profit or lossHeld for TradingEquities and managed funds Equities 18,808,524 - - 18,808,524 Total equities and managed funds 18,808,524 - - 18,808,524
Interest bearing securities Convertible bonds - 16,473,788 - 16,473,788 Total interest bearing securities - 16,473,788 - 16,473,788
Derivatives Forward currency contracts - 198,061 - 198,061 Contracts for difference - unfunded - 179,530 - 179,530 Total derivatives - 377,591 - 377,591
Total financial assets at fair value through profit or loss 18,808,524 16,851,379 - 35,659,903
Financial liabilit ies at fair value through profit or lossHeld for TradingDerivatives Contracts for difference - unfunded - (1,548,163) - (1,548,163) Forward currency contracts - (48,286) - (48,286)Total derivatives - (1,596,449) - (1,596,449)
Total financial liabilit ies at fair value through profit or loss - (1,596,449) - (1,596,449)

Man Funds VI plc Notes to the Financial Statements (continued) For the year ended 31 December 2016
68
4. Financial assets and liabilities at fair value through profit or loss (continued)
Fair value of financial instruments (continued)
Man GLG Cred-Eq Alternative (continued) 31 December 2015 Level 1 Level 2 Level 3 Total Fair Value
€ € € € Financial assets at fair value through profit or lossHeld for TradingEquities and managed funds Equities 8,928,102 - - 8,928,102 Total equities and managed funds 8,928,102 - - 8,928,102
Interest bearing securities Convertible bonds - 50,002,496 - 50,002,496 Corporate bonds - 756,420 - 756,420 Total interest bearing securities - 50,758,916 - 50,758,916
Derivatives Contracts for difference - unfunded - 1,425,552 - 1,425,552 Forward currency contracts - 153,825 - 153,825 Total derivatives - 1,579,377 - 1,579,377
Total financial assets at fair value through profit or loss 8,928,102 52,338,293 - 61,266,395
Financial liabilit ies at fair value through profit or lossHeld for TradingDerivatives Contracts for difference - unfunded - (6,615,157) - (6,615,157) Total return swaps - (375,932) - (375,932) Forward currency contracts - (191,748) - (191,748)Total derivatives - (7,182,837) - (7,182,837)
Total financial liabilit ies at fair value through profit or loss - (7,182,837) - (7,182,837)
Man AHL Multi Strategy Alternative31 December 2016
US$ US$ US$ US$ Financial assets at fair value through profit or lossHeld for TradingInterest bearing securities Government bonds 39,489,865 - - 39,489,865 Total interest bearing securities 39,489,865 - - 39,489,865
Derivatives Forward currency contracts - 3,348,671 - 3,348,671 Contracts for difference - unfunded - 7,486,778 - 7,486,778 Future contracts 2,440,656 - - 2,440,656 Option contracts 12,331 36,057 - 48,388 Total derivatives 2,452,987 10,871,506 - 13,324,493
Total financial assets at fair value through profit or loss 41,942,852 10,871,506 - 52,814,358
Financial liabilit ies at fair value through profit or lossHeld for TradingDerivatives Forward currency contracts - (2,993,522) - (2,993,522) Contracts for difference - unfunded - (6,236,295) - (6,236,295) Option contracts (718,080) (257,669) - (975,749) Future contracts (867,870) - - (867,870)Total derivatives (1,585,950) (9,487,486) - (11,073,436)
Total financial liabilit ies at fair value through profit or loss (1,585,950) (9,487,486) - (11,073,436)
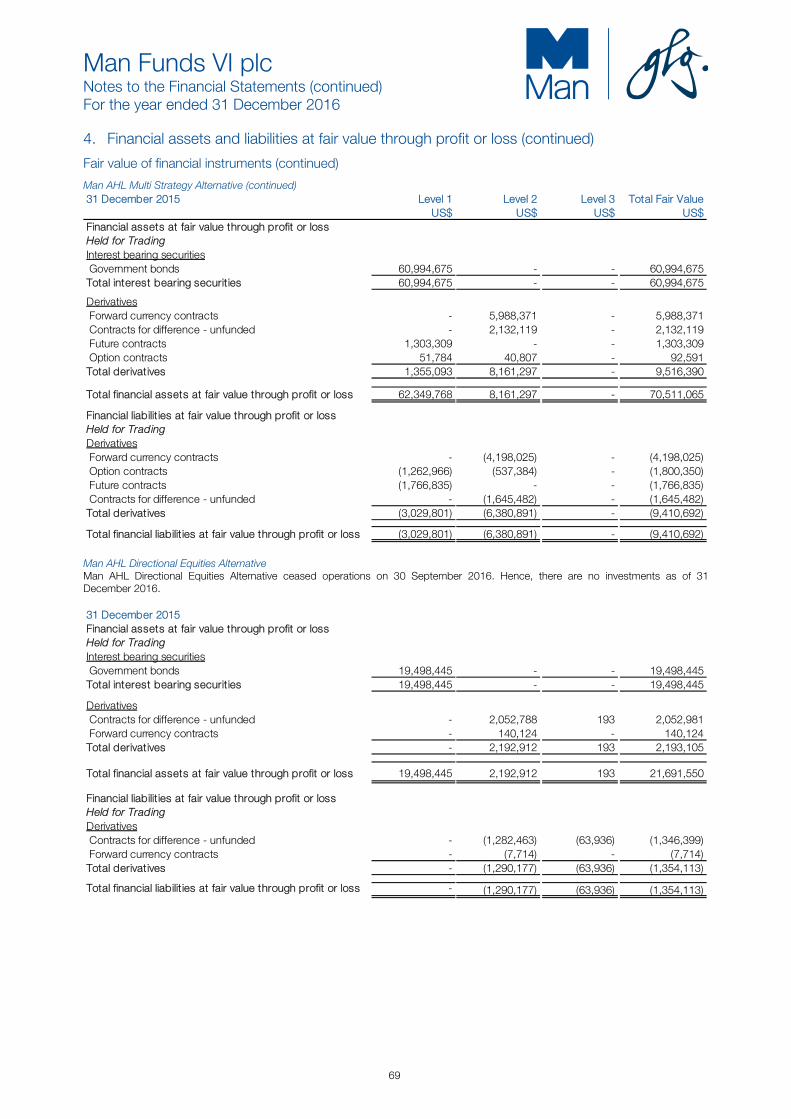
Man Funds VI plc Notes to the Financial Statements (continued) For the year ended 31 December 2016
69
4. Financial assets and liabilities at fair value through profit or loss (continued)
Fair value of financial instruments (continued)
Man AHL Multi Strategy Alternative (continued) 31 December 2015 Level 1 Level 2 Level 3 Total Fair Value
US$ US$ US$ US$ Financial assets at fair value through profit or lossHeld for TradingInterest bearing securities Government bonds 60,994,675 - - 60,994,675 Total interest bearing securities 60,994,675 - - 60,994,675
Derivatives Forward currency contracts - 5,988,371 - 5,988,371 Contracts for difference - unfunded - 2,132,119 - 2,132,119 Future contracts 1,303,309 - - 1,303,309 Option contracts 51,784 40,807 - 92,591 Total derivatives 1,355,093 8,161,297 - 9,516,390
Total financial assets at fair value through profit or loss 62,349,768 8,161,297 - 70,511,065
Financial liabilit ies at fair value through profit or lossHeld for TradingDerivatives Forward currency contracts - (4,198,025) - (4,198,025) Option contracts (1,262,966) (537,384) - (1,800,350) Future contracts (1,766,835) - - (1,766,835) Contracts for difference - unfunded - (1,645,482) - (1,645,482)Total derivatives (3,029,801) (6,380,891) - (9,410,692)
Total financial liabilit ies at fair value through profit or loss (3,029,801) (6,380,891) - (9,410,692)
Man AHL Directional Equities Alternative Man AHL Directional Equities Alternative ceased operations on 30 September 2016. Hence, there are no investments as of 31 December 2016. 31 December 2015Financial assets at fair value through profit or lossHeld for TradingInterest bearing securities Government bonds 19,498,445 - - 19,498,445 Total interest bearing securities 19,498,445 - - 19,498,445
Derivatives Contracts for difference - unfunded - 2,052,788 193 2,052,981 Forward currency contracts - 140,124 - 140,124 Total derivatives - 2,192,912 193 2,193,105
Total financial assets at fair value through profit or loss 19,498,445 2,192,912 193 21,691,550
Financial liabilit ies at fair value through profit or lossHeld for TradingDerivatives Contracts for difference - unfunded - (1,282,463) (63,936) (1,346,399) Forward currency contracts - (7,714) - (7,714)Total derivatives - (1,290,177) (63,936) (1,354,113)
Total financial liabilit ies at fair value through profit or loss - (1,290,177) (63,936) (1,354,113)

Man Funds VI plc Notes to the Financial Statements (continued) For the year ended 31 December 2016
70
4. Financial assets and liabilities at fair value through profit or loss (continued)
Fair value of financial instruments (continued)
Man AHL TargetRisk31 December 2016 Level 1 Level 2 Level 3 Total Fair Value
US$ US$ US$ US$ Financial assets at fair value through profit or lossHeld for TradingInterest bearing securities Government bonds 899,729 20,023,828 - 20,923,557 Total interest bearing securities 899,729 20,023,828 - 20,923,557
Derivatives Credit default swaps - 743,042 - 743,042 Future contracts 349,241 - - 349,241 Forward currency contracts - 12,115 - 12,115 Total return swap - 10,993 - 10,993 Total derivatives 349,241 766,150 - 1,115,391
Total financial assets at fair value through profit or loss 1,248,970 20,789,978 - 22,038,948
Financial liabilit ies at fair value through profit or lossHeld for TradingDerivatives Forward currency contracts - (95,904) - (95,904) Future contracts (61,296) - - (61,296)Total derivatives (61,296) (95,904) - (157,200)
Total financial liabilit ies at fair value through profit or loss (61,296) (95,904) - (157,200)
31 December 2015Financial assets at fair value through profit or lossHeld for TradingInterest bearing securities Government bonds 15,791,836 - - 15,791,836 Total interest bearing securities 15,791,836 - - 15,791,836
Derivatives Credit default swaps - 239,789 - 239,789 Future contract 156,996 - - 156,996 Forward currency contracts - 126,063 - 126,063 Total derivatives 156,996 365,852 - 522,848
Total financial assets at fair value through profit or loss 15,948,832 365,852 - 16,314,684
Financial liabilit ies at fair value through profit or lossHeld for TradingDerivatives Future contract (72,862) - - (72,862) Total return swaps - (25,809) - (25,809) Forward currency contracts - (6,208) - (6,208)Total derivatives (72,862) (32,017) - (104,879)
Total financial liabilit ies at fair value through profit or loss (72,862) (32,017) - (104,879)

Man Funds VI plc Notes to the Financial Statements (continued) For the year ended 31 December 2016
71
4. Financial assets and liabilities at fair value through profit or loss (continued)
Fair value of financial instruments (continued)
Man AHL Volatility Alternative31 December 2016 Level 1 Level 2 Level 3 Total Fair Value
US$ US$ US$ US$ Financial assets at fair value through profit or lossHeld for TradingInterest bearing securities Government bonds 4,298,482 - - 4,298,482 Total interest bearing securities 4,298,482 - - 4,298,482
Derivatives Future contracts 76,951 - - 76,951 Forward currency contracts - 42,332 - 42,332 Option contracts 915 12,701 - 13,616 Total derivatives 77,866 55,033 - 132,899
Total financial assets at fair value through profit or loss 4,376,348 55,033 - 4,431,381
Financial liabilit ies at fair value through profit or lossHeld for TradingDerivatives Option contracts (259,106) (103,491) - (362,597) Forward currency contracts - (50,355) - (50,355) Future contracts (24,804) - - (24,804)Total derivatives (283,910) (153,846) - (437,756)
Total financial liabilit ies at fair value through profit or loss (283,910) (153,846) - (437,756)
31 December 2015Financial assets at fair value through profit or lossHeld for TradingInterest bearing securities Government bonds 16,098,290 - - 16,098,290 Total interest bearing securities 16,098,290 - - 16,098,290
Derivatives Forward currency contracts - 739,833 - 739,833 Option contracts 69,833 72,474 - 142,307 Future contract 121,375 - - 121,375 Total derivatives 191,208 812,307 - 1,003,515
Total financial assets at fair value through profit or loss 16,289,498 812,307 - 17,101,805
Financial liabilit ies at fair value through profit or lossHeld for TradingDerivatives Option contracts (1,527,620) (661,087) - (2,188,707) Future contract (133,096) - - (133,096) Forward currency contracts - (59,067) - (59,067)Total derivatives (1,660,716) (720,154) - (2,380,870)
Total financial liabilit ies at fair value through profit or loss (1,660,716) (720,154) - (2,380,870)
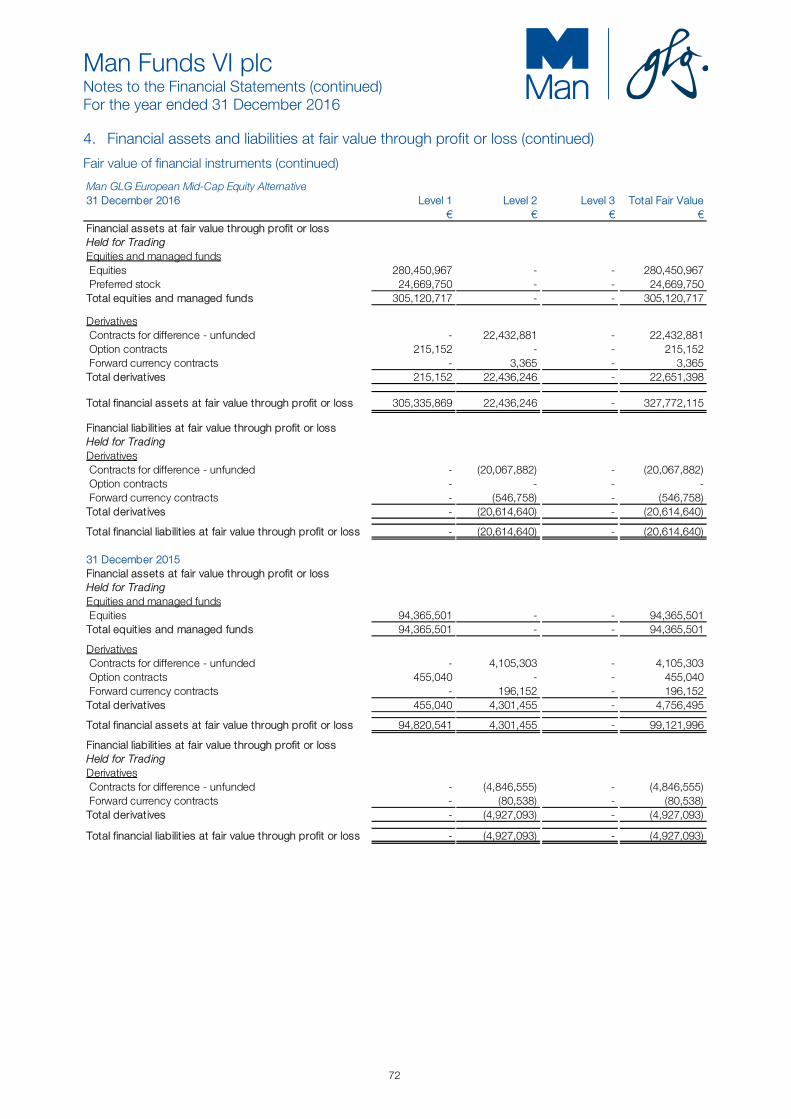
Man Funds VI plc Notes to the Financial Statements (continued) For the year ended 31 December 2016
72
4. Financial assets and liabilities at fair value through profit or loss (continued)
Fair value of financial instruments (continued)
Man GLG European Mid-Cap Equity Alternative31 December 2016 Level 1 Level 2 Level 3 Total Fair Value
€ € € € Financial assets at fair value through profit or lossHeld for TradingEquities and managed funds Equities 280,450,967 - - 280,450,967 Preferred stock 24,669,750 - - 24,669,750 Total equities and managed funds 305,120,717 - - 305,120,717
Derivatives Contracts for difference - unfunded - 22,432,881 - 22,432,881 Option contracts 215,152 - - 215,152 Forward currency contracts - 3,365 - 3,365 Total derivatives 215,152 22,436,246 - 22,651,398
Total financial assets at fair value through profit or loss 305,335,869 22,436,246 - 327,772,115
Financial liabilit ies at fair value through profit or lossHeld for TradingDerivatives Contracts for difference - unfunded - (20,067,882) - (20,067,882) Option contracts - - - - Forward currency contracts - (546,758) - (546,758)Total derivatives - (20,614,640) - (20,614,640)
Total financial liabilit ies at fair value through profit or loss - (20,614,640) - (20,614,640)
31 December 2015Financial assets at fair value through profit or lossHeld for TradingEquities and managed funds Equities 94,365,501 - - 94,365,501 Total equities and managed funds 94,365,501 - - 94,365,501
Derivatives Contracts for difference - unfunded - 4,105,303 - 4,105,303 Option contracts 455,040 - - 455,040 Forward currency contracts - 196,152 - 196,152 Total derivatives 455,040 4,301,455 - 4,756,495
Total financial assets at fair value through profit or loss 94,820,541 4,301,455 - 99,121,996
Financial liabilit ies at fair value through profit or lossHeld for TradingDerivatives Contracts for difference - unfunded - (4,846,555) - (4,846,555) Forward currency contracts - (80,538) - (80,538)Total derivatives - (4,927,093) - (4,927,093)
Total financial liabilit ies at fair value through profit or loss - (4,927,093) - (4,927,093)
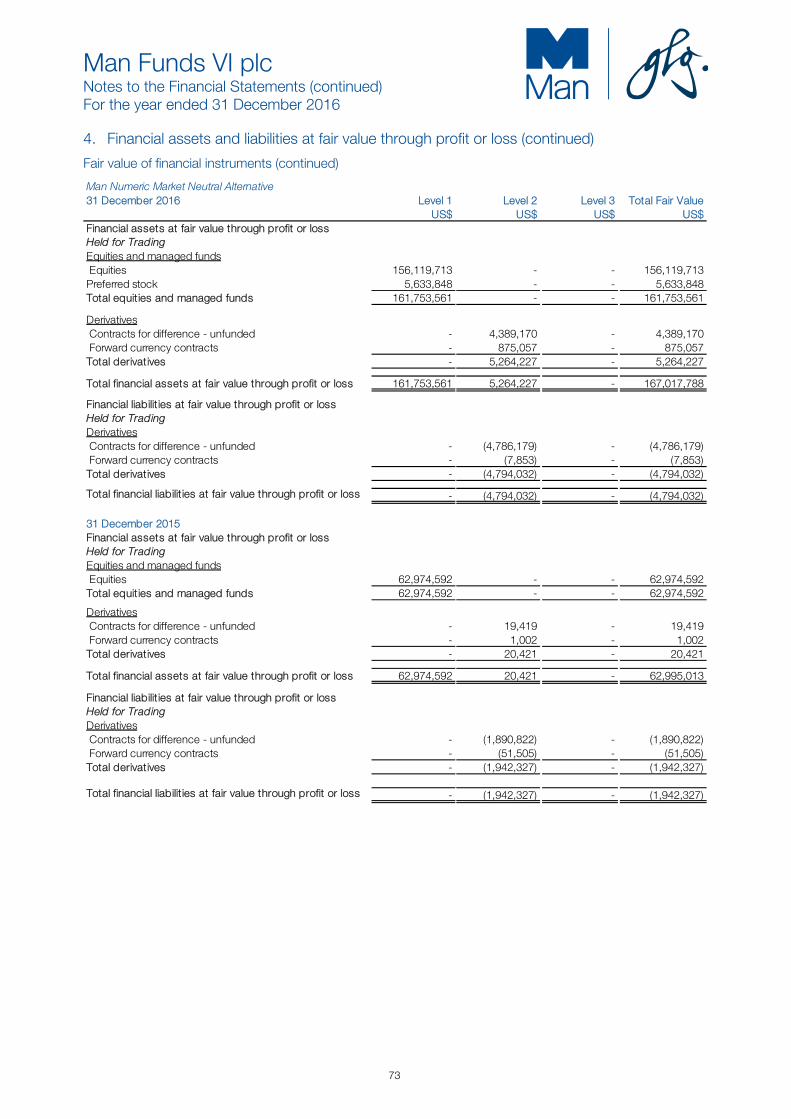
Man Funds VI plc Notes to the Financial Statements (continued) For the year ended 31 December 2016
73
4. Financial assets and liabilities at fair value through profit or loss (continued)
Fair value of financial instruments (continued)
Man Numeric Market Neutral Alternative31 December 2016 Level 1 Level 2 Level 3 Total Fair Value
US$ US$ US$ US$ Financial assets at fair value through profit or lossHeld for TradingEquities and managed funds Equities 156,119,713 - - 156,119,713 Preferred stock 5,633,848 - - 5,633,848 Total equities and managed funds 161,753,561 - - 161,753,561
Derivatives Contracts for difference - unfunded - 4,389,170 - 4,389,170 Forward currency contracts - 875,057 - 875,057 Total derivatives - 5,264,227 - 5,264,227
Total financial assets at fair value through profit or loss 161,753,561 5,264,227 - 167,017,788
Financial liabilit ies at fair value through profit or lossHeld for TradingDerivatives Contracts for difference - unfunded - (4,786,179) - (4,786,179) Forward currency contracts - (7,853) - (7,853)Total derivatives - (4,794,032) - (4,794,032)
Total financial liabilit ies at fair value through profit or loss - (4,794,032) - (4,794,032)
31 December 2015Financial assets at fair value through profit or lossHeld for TradingEquities and managed funds Equities 62,974,592 - - 62,974,592 Total equities and managed funds 62,974,592 - - 62,974,592
Derivatives Contracts for difference - unfunded - 19,419 - 19,419 Forward currency contracts - 1,002 - 1,002 Total derivatives - 20,421 - 20,421
Total financial assets at fair value through profit or loss 62,974,592 20,421 - 62,995,013
Financial liabilit ies at fair value through profit or lossHeld for TradingDerivatives Contracts for difference - unfunded - (1,890,822) - (1,890,822) Forward currency contracts - (51,505) - (51,505)Total derivatives - (1,942,327) - (1,942,327)
Total financial liabilit ies at fair value through profit or loss - (1,942,327) - (1,942,327)

Man Funds VI plc Notes to the Financial Statements (continued) For the year ended 31 December 2016
74
4. Financial assets and liabilities at fair value through profit or loss (continued)
Fair value of financial instruments (continued)
Man GLG Unconstrained Emerging Equity31 December 2016 Level 1 Level 2 Level 3 Total Fair Value
US$ US$ US$ US$ Financial assets at fair value through profit or lossHeld for TradingEquities and managed funds Equities 38,452,196 - - 38,452,196 Promissory notes 12,871,596 - - 12,871,596 Total equities and managed funds 51,323,792 - - 51,323,792
Interest bearing securities Government bonds 5,997,972 - - 5,997,972 Total interest bearing securities 5,997,972 - - 5,997,972
Derivatives Contracts for difference - unfunded - 1,152,200 - 1,152,200 Forward currency contracts - 459,197 - 459,197 Warrants 227,113 - - 227,113 Total derivatives 227,113 1,611,397 - 1,838,510
Total financial assets at fair value through profit or loss 57,548,877 1,611,397 - 59,160,274
Financial liabilit ies at fair value through profit or lossHeld for TradingDerivatives Forward currency contracts - (484,863) - (484,863) Contracts for difference - unfunded - (269,474) - (269,474)Total derivatives - (754,337) - (754,337)
Total financial liabilit ies at fair value through profit or loss - (754,337) - (754,337)
31 December 2015Financial assets at fair value through profit or lossHeld for TradingEquities and managed funds Equities 17,984,828 - - 17,984,828 Promissory notes 5,773,277 - - 5,773,277 Preferred stock 323,633 - - 323,633 Total equities and managed funds 24,081,738 - - 24,081,738
Derivatives Contracts for difference - unfunded - 711,658 4,423 716,081 Forward currency contracts - 79,040 - 79,040 Future contract 7,225 - - 7,225 Total derivatives 7,225 790,698 4,423 802,346
Total financial assets at fair value through profit or loss 24,088,963 790,698 4,423 24,884,084
Financial liabilit ies at fair value through profit or lossHeld for TradingDerivatives Contracts for difference - unfunded - (803,332) - (803,332) Forward currency contracts - (36) - (36)Total derivatives - (803,368) - (803,368)
Total financial liabilit ies at fair value through profit or loss - (803,368) - (803,368)

Man Funds VI plc Notes to the Financial Statements (continued) For the year ended 31 December 2016
75
4. Financial assets and liabilities at fair value through profit or loss (continued)
Fair value of financial instruments (continued) Man GLG Global Emerging Markets Debt Total Return31 December 2016 Level 1 Level 2 Level 3 Total Fair Value
US$ US$ US$ US$ Financial assets at fair value through profit or lossHeld for TradingInterest bearing securities Government bonds 27,893,435 333,793,330 - 361,686,765 Corporate bonds - 101,969,651 - 101,969,651 Total interest bearing securities 27,893,435 435,762,981 - 463,656,416
Derivatives Forward currency contracts - 19,976,344 - 19,976,344 Credit default swaps - 4,441,519 - 4,441,519 Total derivatives - 24,417,863 - 24,417,863
Total financial assets at fair value through profit or loss 27,893,435 460,180,844 - 488,074,279
Financial liabilit ies at fair value through profit or lossHeld for Trading
Derivatives Forward currency contracts - (15,086,164) - (15,086,164) Credit default swaps - (3,871,033) - (3,871,033)Total derivatives - (18,957,197) - (18,957,197)
Total financial liabilit ies at fair value through profit or loss - (18,957,197) - (18,957,197)
Short term balances are excluded from the tables as their carrying value at the year ended 31 December 2016 approximates to their fair value.
Investments are reviewed at each financial reporting point to ensure that they are correctly classified between Level 1, 2 and 3 in accordance with the fair value hierarchy outlined above. Where an investment’s characteristics change during the year and investments no longer meet the criteria of a given level, they are transferred into a more appropriate level at the end of relevant financial reporting year. For the year ended 31 December 2016 and 31 December 2015, there were no transfers between Level 1 and Level 2. A reconciliation of the movements in level 3 assets/liabilities for the year ended 31 December 2016 and 31 December 2015 is set out below: Man GLG European Equity Alternative31 December 2016 Equities and Interest bearing Derivative
managed funds securities instruments Total Fair Value€ € € €
Financial assets and liabilities at fair value through profit or loss:Opening balance 120,793 - - 120,793 Total gains and losses- realised - - 7,099 7,099 - unrealised (120,793) - 95,963 (24,830)Purchases - - 7,099 7,099 Sales - - (7,099) (7,099)Transfers into Level 3 - - - - Transfers out of Level 3 - - - - Closing Balance - - 103,062 103,062
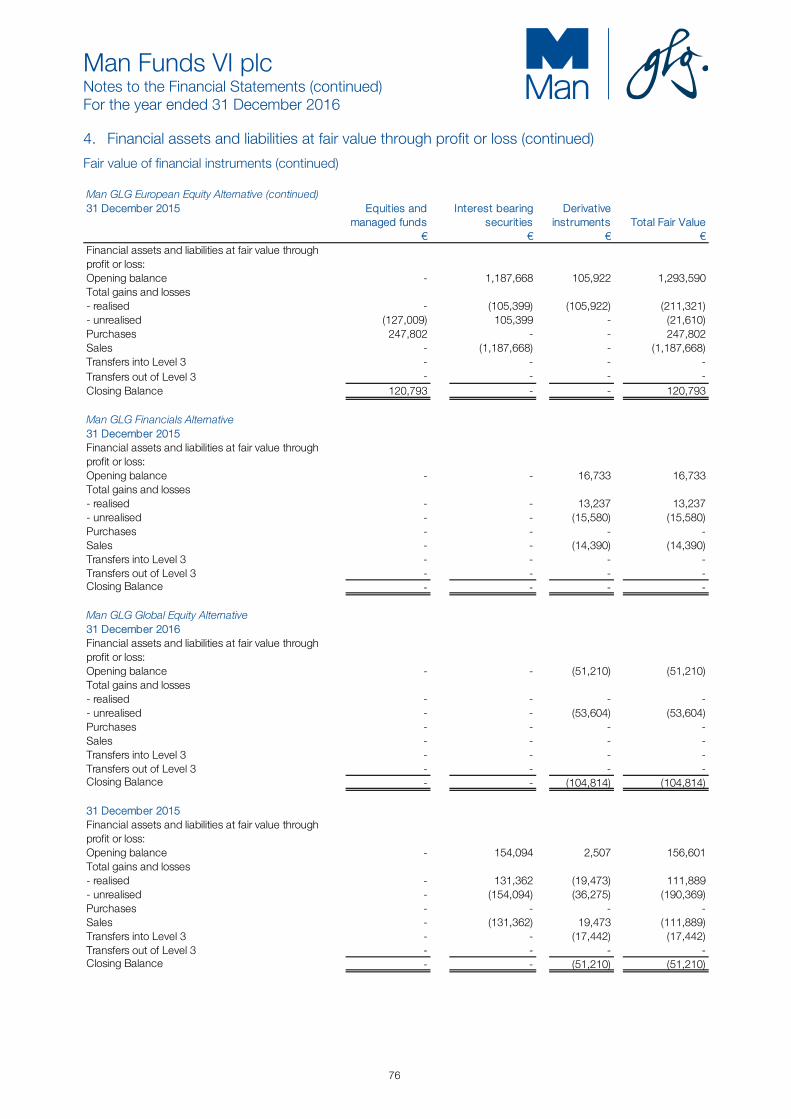
Man Funds VI plc Notes to the Financial Statements (continued) For the year ended 31 December 2016
76
4. Financial assets and liabilities at fair value through profit or loss (continued)
Fair value of financial instruments (continued)
Man GLG European Equity Alternative (continued)31 December 2015 Equities and Interest bearing Derivative
managed funds securities instruments Total Fair Value€ € € €
Financial assets and liabilities at fair value through profit or loss:Opening balance - 1,187,668 105,922 1,293,590 Total gains and losses- realised - (105,399) (105,922) (211,321)- unrealised (127,009) 105,399 - (21,610)Purchases 247,802 - - 247,802 Sales - (1,187,668) - (1,187,668)Transfers into Level 3 - - - - Transfers out of Level 3 - - - - Closing Balance 120,793 - - 120,793
Man GLG Financials Alternative31 December 2015Financial assets and liabilities at fair value through profit or loss:Opening balance - - 16,733 16,733 Total gains and losses- realised - - 13,237 13,237 - unrealised - - (15,580) (15,580)Purchases - - - - Sales - - (14,390) (14,390)Transfers into Level 3 - - - - Transfers out of Level 3 - - - - Closing Balance - - - -
Man GLG Global Equity Alternative31 December 2016Financial assets and liabilities at fair value through profit or loss:Opening balance - - (51,210) (51,210)Total gains and losses- realised - - - - - unrealised - - (53,604) (53,604)Purchases - - - - Sales - - - - Transfers into Level 3 - - - - Transfers out of Level 3 - - - - Closing Balance - - (104,814) (104,814)
31 December 2015Financial assets and liabilities at fair value through profit or loss:Opening balance - 154,094 2,507 156,601 Total gains and losses- realised - 131,362 (19,473) 111,889 - unrealised - (154,094) (36,275) (190,369)Purchases - - - - Sales - (131,362) 19,473 (111,889)Transfers into Level 3 - - (17,442) (17,442)Transfers out of Level 3 - - - - Closing Balance - - (51,210) (51,210)
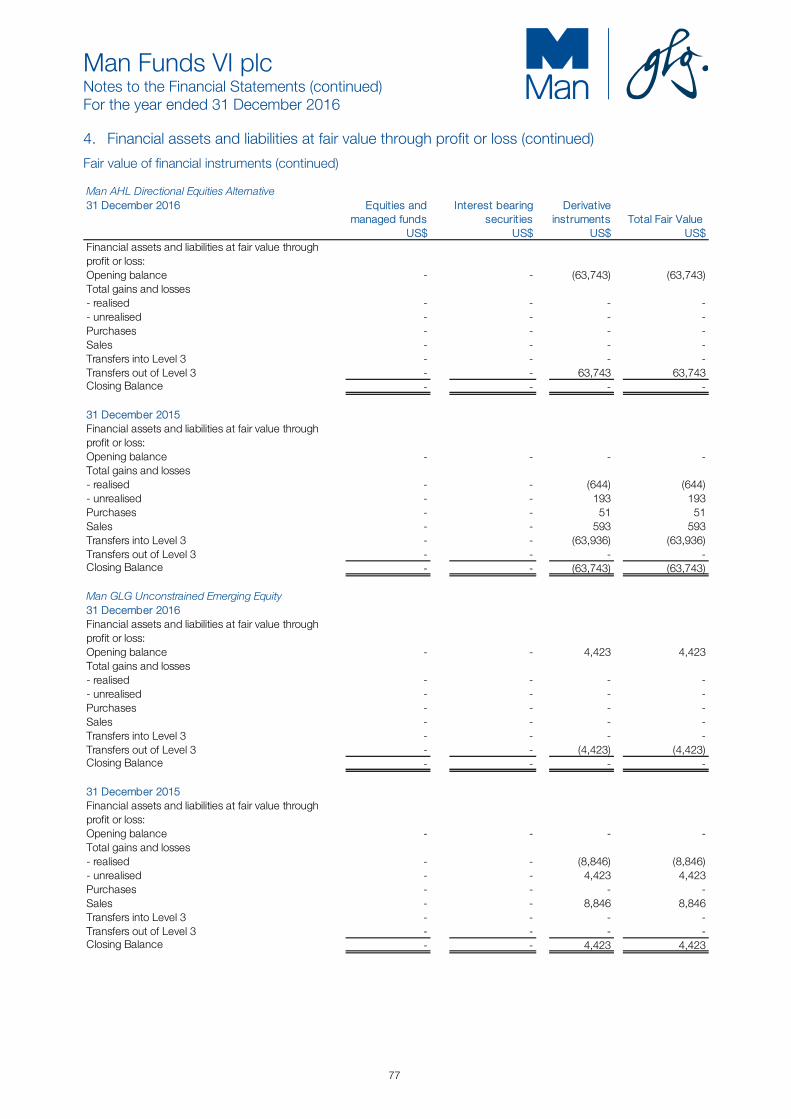
Man Funds VI plc Notes to the Financial Statements (continued) For the year ended 31 December 2016
77
4. Financial assets and liabilities at fair value through profit or loss (continued)
Fair value of financial instruments (continued)
Man AHL Directional Equities Alternative31 December 2016 Equities and Interest bearing Derivative
managed funds securities instruments Total Fair ValueUS$ US$ US$ US$
Financial assets and liabilities at fair value through profit or loss:Opening balance - - (63,743) (63,743)Total gains and losses- realised - - - - - unrealised - - - - Purchases - - - - Sales - - - - Transfers into Level 3 - - - - Transfers out of Level 3 - - 63,743 63,743 Closing Balance - - - -
31 December 2015Financial assets and liabilities at fair value through profit or loss:Opening balance - - - - Total gains and losses- realised - - (644) (644)- unrealised - - 193 193 Purchases - - 51 51 Sales - - 593 593 Transfers into Level 3 - - (63,936) (63,936)Transfers out of Level 3 - - - - Closing Balance - - (63,743) (63,743)
Man GLG Unconstrained Emerging Equity31 December 2016Financial assets and liabilities at fair value through profit or loss:Opening balance - - 4,423 4,423 Total gains and losses- realised - - - - - unrealised - - - - Purchases - - - - Sales - - - - Transfers into Level 3 - - - - Transfers out of Level 3 - - (4,423) (4,423)Closing Balance - - - -
31 December 2015Financial assets and liabilities at fair value through profit or loss:Opening balance - - - - Total gains and losses- realised - - (8,846) (8,846)- unrealised - - 4,423 4,423 Purchases - - - - Sales - - 8,846 8,846 Transfers into Level 3 - - - - Transfers out of Level 3 - - - - Closing Balance - - 4,423 4,423
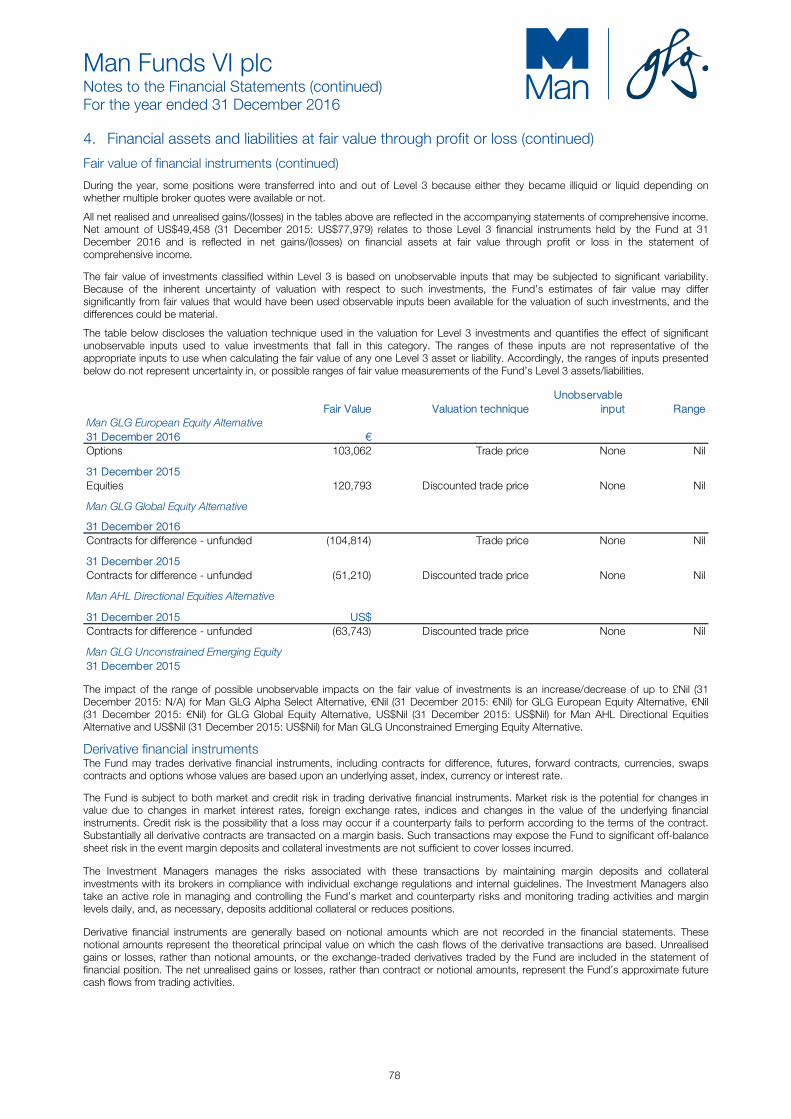
Man Funds VI plc Notes to the Financial Statements (continued) For the year ended 31 December 2016
78
4. Financial assets and liabilities at fair value through profit or loss (continued)
Fair value of financial instruments (continued)
During the year, some positions were transferred into and out of Level 3 because either they became illiquid or liquid depending on whether multiple broker quotes were available or not.
All net realised and unrealised gains/(losses) in the tables above are reflected in the accompanying statements of comprehensive income. Net amount of US$49,458 (31 December 2015: US$77,979) relates to those Level 3 financial instruments held by the Fund at 31 December 2016 and is reflected in net gains/(losses) on financial assets at fair value through profit or loss in the statement of comprehensive income.
The fair value of investments classified within Level 3 is based on unobservable inputs that may be subjected to significant variability. Because of the inherent uncertainty of valuation with respect to such investments, the Fund’s estimates of fair value may differ significantly from fair values that would have been used observable inputs been available for the valuation of such investments, and the differences could be material.
The table below discloses the valuation technique used in the valuation for Level 3 investments and quantifies the effect of significant unobservable inputs used to value investments that fall in this category. The ranges of these inputs are not representative of the appropriate inputs to use when calculating the fair value of any one Level 3 asset or liability. Accordingly, the ranges of inputs presented below do not represent uncertainty in, or possible ranges of fair value measurements of the Fund’s Level 3 assets/liabilities.
Fair Value Valuation techniqueUnobservable
input RangeMan GLG European Equity Alternative31 December 2016 €Options 103,062 Trade price None Nil
31 December 2015Equities 120,793 Discounted trade price None Nil
Man GLG Global Equity Alternative
31 December 2016Contracts for difference - unfunded (104,814) Trade price None Nil
31 December 2015Contracts for difference - unfunded (51,210) Discounted trade price None Nil
Man AHL Directional Equities Alternative
31 December 2015 US$Contracts for difference - unfunded (63,743) Discounted trade price None Nil
Man GLG Unconstrained Emerging Equity31 December 2015
The impact of the range of possible unobservable impacts on the fair value of investments is an increase/decrease of up to £Nil (31 December 2015: N/A) for Man GLG Alpha Select Alternative, €Nil (31 December 2015: €Nil) for GLG European Equity Alternative, €Nil (31 December 2015: €Nil) for GLG Global Equity Alternative, US$Nil (31 December 2015: US$Nil) for Man AHL Directional Equities Alternative and US$Nil (31 December 2015: US$Nil) for Man GLG Unconstrained Emerging Equity Alternative.
Derivative financial instruments The Fund may trades derivative financial instruments, including contracts for difference, futures, forward contracts, currencies, swaps contracts and options whose values are based upon an underlying asset, index, currency or interest rate.
The Fund is subject to both market and credit risk in trading derivative financial instruments. Market risk is the potential for changes in value due to changes in market interest rates, foreign exchange rates, indices and changes in the value of the underlying financial instruments. Credit risk is the possibility that a loss may occur if a counterparty fails to perform according to the terms of the contract. Substantially all derivative contracts are transacted on a margin basis. Such transactions may expose the Fund to significant off-balance sheet risk in the event margin deposits and collateral investments are not sufficient to cover losses incurred.
The Investment Managers manages the risks associated with these transactions by maintaining margin deposits and collateral investments with its brokers in compliance with individual exchange regulations and internal guidelines. The Investment Managers also take an active role in managing and controlling the Fund’s market and counterparty risks and monitoring trading activities and margin levels daily, and, as necessary, deposits additional collateral or reduces positions.
Derivative financial instruments are generally based on notional amounts which are not recorded in the financial statements. These notional amounts represent the theoretical principal value on which the cash flows of the derivative transactions are based. Unrealised gains or losses, rather than notional amounts, or the exchange-traded derivatives traded by the Fund are included in the statement of financial position. The net unrealised gains or losses, rather than contract or notional amounts, represent the Fund’s approximate future cash flows from trading activities.
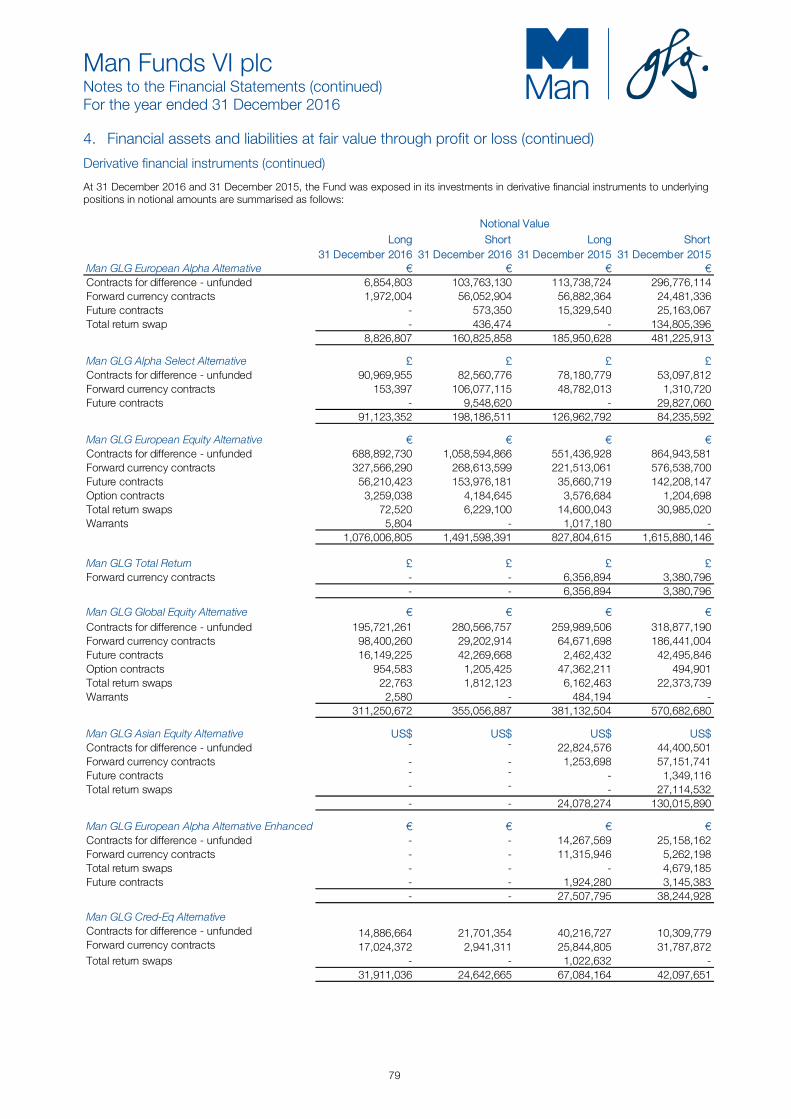
Man Funds VI plc Notes to the Financial Statements (continued) For the year ended 31 December 2016
79
4. Financial assets and liabilities at fair value through profit or loss (continued)
Derivative financial instruments (continued)
At 31 December 2016 and 31 December 2015, the Fund was exposed in its investments in derivative financial instruments to underlying positions in notional amounts are summarised as follows:
Long Short Long Short31 December 2016 31 December 2016 31 December 2015 31 December 2015
Man GLG European Alpha Alternative € € € €Contracts for difference - unfunded 6,854,803 103,763,130 113,738,724 296,776,114 Forward currency contracts 1,972,004 56,052,904 56,882,364 24,481,336 Future contracts - 573,350 15,329,540 25,163,067 Total return swap - 436,474 - 134,805,396
8,826,807 160,825,858 185,950,628 481,225,913
Man GLG Alpha Select Alternative £ £ £ £Contracts for difference - unfunded 90,969,955 82,560,776 78,180,779 53,097,812 Forward currency contracts 153,397 106,077,115 48,782,013 1,310,720 Future contracts - 9,548,620 - 29,827,060
91,123,352 198,186,511 126,962,792 84,235,592
Man GLG European Equity Alternative € € € €Contracts for difference - unfunded 688,892,730 1,058,594,866 551,436,928 864,943,581 Forward currency contracts 327,566,290 268,613,599 221,513,061 576,538,700 Future contracts 56,210,423 153,976,181 35,660,719 142,208,147 Option contracts 3,259,038 4,184,645 3,576,684 1,204,698 Total return swaps 72,520 6,229,100 14,600,043 30,985,020 Warrants 5,804 - 1,017,180 -
1,076,006,805 1,491,598,391 827,804,615 1,615,880,146
Man GLG Total Return £ £ £ £Forward currency contracts - - 6,356,894 3,380,796
- - 6,356,894 3,380,796
Man GLG Global Equity Alternative € € € €Contracts for difference - unfunded 195,721,261 280,566,757 259,989,506 318,877,190 Forward currency contracts 98,400,260 29,202,914 64,671,698 186,441,004 Future contracts 16,149,225 42,269,668 2,462,432 42,495,846 Option contracts 954,583 1,205,425 47,362,211 494,901 Total return swaps 22,763 1,812,123 6,162,463 22,373,739 Warrants 2,580 - 484,194 -
311,250,672 355,056,887 381,132,504 570,682,680
Man GLG Asian Equity Alternative US$ US$ US$ US$Contracts for difference - unfunded - - 22,824,576 44,400,501 Forward currency contracts - - 1,253,698 57,151,741 Future contracts - - - 1,349,116 Total return swaps - - - 27,114,532
- - 24,078,274 130,015,890
Man GLG European Alpha Alternative Enhanced € € € €Contracts for difference - unfunded - - 14,267,569 25,158,162 Forward currency contracts - - 11,315,946 5,262,198 Total return swaps - - - 4,679,185 Future contracts - - 1,924,280 3,145,383
- - 27,507,795 38,244,928
Man GLG Cred-Eq AlternativeContracts for difference - unfunded 14,886,664 21,701,354 40,216,727 10,309,779 Forward currency contracts 17,024,372 2,941,311 25,844,805 31,787,872 Total return swaps - - 1,022,632 -
31,911,036 24,642,665 67,084,164 42,097,651
Notional Value

Man Funds VI plc Notes to the Financial Statements (continued) For the year ended 31 December 2016
80
4. Financial assets and liabilities at fair value through profit or loss (continued)
Derivative financial instruments (continued)
Long Short Long Short31 December 2016 31 December 2016 31 December 2015 31 December 2015
Man AHL Multi Strategy Alternative US$ US$ US$ US$Contracts for difference - unfunded 96,892,670 89,324,605 68,383,520 20,008,094 Forward currency contracts 311,860,643 339,257,258 449,759,887 347,444,289 Future contracts 626,944,119 163,041,982 15,936,670 49,454,406 Option contracts 75,513 1,149,429 128,082 2,372,041
1,035,772,945 592,773,274 534,208,158 419,278,830
Man AHL Directional Equities AlternativeContracts for difference - unfunded - - 33,643,974 26,833,510 Forward currency contracts - - 7,130,652 1,119,234
- - 40,774,626 27,952,744
Man AHL TargetRiskCredit default swaps - 26,657,000 - 19,517,800 Forward currency contracts 14,062,788 1,877,836 8,215,136 518,942 Future contracts 36,949,917 - 9,011,477 - Total return swap 3,394,545 - 1,140,580 -
54,407,250 28,534,836 18,367,193 20,036,742
Man AHL Volatility AlternativeForward currency contracts 6,249,438 5,516,065 82,342,840 35,148,067 Future contracts 6,347,117 2,235,241 1,004,880 5,491,753 Option contracts 22,912 423,338 185,530 2,862,064
12,619,467 8,174,644 83,533,250 43,501,884
Man GLG European Mid-Cap Equity Alternative € € € €Contracts for difference - unfunded 163,443,947 416,486,111 70,019,021 130,725,480 Forward currency contracts 10,878,853 45,264,384 38,689,720 15,732,045 Option contracts 308,309 - 339,750 -
174,631,109 461,750,495 109,048,491 146,457,525
Man Numeric Market Neutral Alternative US$ US$ US$ US$Contracts for difference - unfunded - 157,668,313 63,803,848 61,910,429 Forward currency contracts 526,890 81,141,569 116,682 10,938,439
526,890 238,809,882 63,920,530 72,848,868
Man GLG Unconstrained Emerging EquityContracts for difference - unfunded 12,505,462 - 14,016,832 - Forward currency contracts 11,958,063 9,434,047 4,788,000 687,000 Future contracts - - 3,182,150 -
24,695,623 9,434,047 21,986,982 687,000
Man GLG Global Emerging Markets Debt Total ReturnCredit default swaps 97,925,000 97,050,000 - - Forward currency contracts 386,563,416 975,186,675 - -
484,488,416 1,072,236,675 - -
Notional Value

Man Funds VI plc Notes to the Financial Statements (continued) For the year ended 31 December 2016
81
5. Offsetting financial assets and financial liabilities As at 31 December 2016 and 31 December 2015, no financial instruments of the Fund are being presented net within the statement of financial position of the Fund. The following tables provide information on the financial impact of netting for instruments subject to an enforceable master netting arrangement or similar agreement in the event of default as defined under such agreements.
Man GLG European Alpha AlternativeThe following table summarises the net financial assets per counterparty as at 31 December 2016:
(i) (iii)=(ii)+(i)
Gross amounts of assets in the statement of financial position
Cash collateral received
Financial instruments Net amount
Counterparty € € € €BNP Paribas 2,994,926 - - 2,994,926 Credit Suisse Securities Europe Limited 12,639,071 - (13,770,078) (1,131,007)Goldman Sachs International 2,961,119 - (59,881) 2,901,238 Morgan Stanley & Co. International Plc 207,418 - (912) 206,506 Total 18,802,534 - (13,830,871) 4,971,663
The following table summarises the net financial liabilities per counterparty as at 31 December 2016:
(i) (iii)=(ii)+(i)
Gross amounts of liabilit ies in the statement of financial position
Cash collateral pledged
Financial instruments Net amount
Counterparty € € € €Citibank N.A. (2,806) - - (2,806)Credit Suisse Securities Europe Limited (13,770,078) 10,557,515 3,212,563 - Goldman Sachs International (59,881) 59,881 - - Morgan Stanley & Co. International Plc (912) 912 - - Total (13,833,677) 10,618,308 3,212,563 (2,806)
Offsetting of Financial Assets, Derivative Assets and Collateral received by counterparty(ii)
Gross Assets not offset in the statement of financial position
Offsetting of Financial Liabilit ies, Derivative Liabilit ies and Collateral pledged by counterparty(ii)
Gross Liabilit ies not offset in the statement of financial position
The following table summarises the net financial assets per counterparty as at 31 December 2015:
(i) (iii)=(ii)+(i)
Gross amounts of assets in the statement of financial position
Cash collateral received
Financial instruments Net amount
Counterparty € € € €Credit Suisse Securities Europe Limited 34,220,483 - (28,125,547) 6,094,936 Morgan Stanley & Co. International Plc 3,484,946 - (124) 3,484,822 Total 37,705,429 - (28,125,671) 9,579,758
Offsetting of Financial Assets, Derivative Assets and Collateral received by counterparty(ii)
Gross Assets not offset in the statement of financial position
The following table summarises the net financial liabilities per counterparty as at 31 December 2015:
(i) (iii)=(ii)+(i)
Gross amounts of liabilit ies in the statement of financial position
Cash collateral pledged
Financial instruments Net amount
Counterparty € € € €Credit Suisse Securities Europe Limited (28,125,547) 20,172,021 7,953,526 - Morgan Stanley & Co. International Plc (124) 124 - - Total (28,125,671) 20,172,145 7,953,526 -
Offsetting of Financial Liabilit ies, Derivative Liabilit ies and Collateral pledged by counterparty(ii)
Gross Liabilit ies not offset in the statement of financial position

Man Funds VI plc Notes to the Financial Statements (continued) For the year ended 31 December 2016
82
5. Offsetting financial assets and financial liabilities (continued)
Man GLG Alpha Select AlternativeThe following table summarises the net financial assets per counterparty as at 31 December 2016:
(i) (iii)=(ii)+(i)
Gross amounts of assets in the statement of financial position
Cash collateral received
Financial instruments Net amount
Counterparty £ £ £ £Bank of America Merrill Lynch 6,133 - - 6,133 BNP Paribas 18,565,106 - - 18,565,106 Credit Suisse Securities Europe Limited 7,525,516 - (4,543,885) 2,981,631 Goldman Sachs International 471,139 - (109,880) 361,259 Morgan Stanley & Co. International Plc 119,358 - (8) 119,350 Total 26,687,252 - (4,653,773) 22,033,479
The following table summarises the net financial liabilities per counterparty as at 31 December 2016:
(i) (iii)=(ii)+(i)
Gross amounts of liabilit ies in the statement of financial position
Cash collateral pledged
Financial instruments Net amount
Counterparty £ £ £ £Credit Suisse Securities Europe Limited (4,543,885) - 4,543,885 - Goldman Sachs International (109,880) - 109,880 - Morgan Stanley & Co. International Plc (8) 8 - - Total (4,653,773) 8 4,653,765 -
Offsetting of Financial Liabilit ies, Derivative Liabilit ies and Collateral pledged by counterparty(ii)
Gross Liabilit ies not offset in the statement of financial position
Offsetting of Financial Assets, Derivative Assets and Collateral received by counterparty(ii)
Gross Assets not offset in the statement of financial position
The following table summarises the net financial assets per counterparty as at 31 December 2015:
(i) (iii)=(ii)+(i)
Gross amounts of assets in the statement of financial position
Cash collateral received
Financial instruments Net amount
Counterparty £ £ £ £BNP Paribas 9,311,425 - - 9,311,425 Credit Suisse Securities Europe Limited 2,588,240 - (877,206) 1,711,034 Goldman Sachs International 968,635 - (634,947) 333,688 Morgan Stanley & Co. International Plc 22,180 (14,205) (7,975) - Total 12,890,480 (14,205) (1,520,128) 11,356,147
The following table summarises the net financial liabilities per counterparty as at 31 December 2015:
(i) (iii)=(ii)+(i)
Gross amounts of liabilit ies in the statement of financial position
Cash collateral pledged
Financial instruments Net amount
Counterparty £ £ £ £Credit Suisse Securities Europe Limited (877,206) 62,623 814,583 - Goldman Sachs International (634,947) 33,140 601,807 - Morgan Stanley & Co. International Plc (14,327) - 7,975 (6,352)Total (1,526,480) 95,763 1,424,365 (6,352)
Offsetting of Financial Assets, Derivative Assets and Collateral received by counterparty(ii)
Gross Assets not offset in the statement of financial position
Offsetting of Financial Liabilit ies, Derivative Liabilit ies and Collateral pledged by counterparty(ii)
Gross Liabilit ies not offset in the statement of financial position

Man Funds VI plc Notes to the Financial Statements (continued) For the year ended 31 December 2016
83
5. Offsetting financial assets and financial liabilities (continued)
Man GLG European Equity AlternativeThe following table summarises the net financial assets per counterparty as at 31 December 2016:
(i) (iii)=(ii)+(i)
Gross amounts of assets in the statement of financial position
Cash collateral received
Financial instruments Net amount
Counterparty € € € €Bank of America Merrill Lynch 7,449,718 - (1,620,478) 5,829,240 Citibank N.A. 3,394,197 - (592,827) 2,801,370 Credit Suisse Securities Europe Limited 34,947,557 - (29,137,067) 5,810,490 Goldman Sachs International 35,081,565 - (11,378,198) 23,703,367 HSBC Bank Plc 11,362,477 - (937,657) 10,424,820 JP Morgan Securities Plc 10,375,569 - (1,189,490) 9,186,079 Macquarie Group 36,059 - (23,983) 12,076 Morgan Stanley & Co. International Plc 67,995,187 - (44,517,523) 23,477,664 Societe Generale 493,005 - (384) 492,621 UBS AG 2,298,049 - (419,796) 1,878,253 Total 173,433,383 - (89,817,403) 83,615,980
Offsetting of Financial Assets, Derivative Assets and Collateral received by counterparty(ii)
Gross Assets not offset in the statement of financial position
The following table summarises the net financial liabilities per counterparty as at 31 December 2016:
(i) (iii)=(ii)+(i)
Gross amounts of liabilit ies in the statement of financial position
Cash collateral pledged
Financial instruments Net amount
Counterparty € € € €Bank of America Merrill Lynch (1,620,478) 188,984 1,431,494 - Citibank N.A. (592,827) 592,827 - - Credit Suisse Securities Europe Limited (29,137,067) 7,911,811 21,225,256 - Goldman Sachs International (11,378,198) 11,378,198 - - HSBC Bank Plc (937,657) 937,657 - - JP Morgan Securities Plc (1,189,490) 1,189,490 - - Macquarie Group (23,983) 23,983 - - Morgan Stanley & Co. International Plc (44,517,523) - 44,517,523 - Societe Generale (384) 384 - - UBS AG (419,796) 352,774 67,022 - Total (89,817,403) 22,576,108 67,241,295 -
Offsetting of Financial Liabilit ies, Derivative Liabilit ies and Collateral pledged by counterparty(ii)
Gross Liabilit ies not offset in the statement of financial position

Man Funds VI plc Notes to the Financial Statements (continued) For the year ended 31 December 2016
84
5. Offsetting financial assets and financial liabilities (continued) Man GLG European Equity Alternative (continued) The following table summarises the net financial assets per counterparty as at 31 December 2015:
(i) (iii)=(ii)+(i)
Gross amounts of assets in the statement of financial position
Cash collateral received
Financial instruments Net amount
Counterparty € € € €Bank of America Merrill Lynch 7,602,162 - (457,649) 7,144,513 Barclays Plc 90,293 - (19) 90,274 Citibank N.A. 4,560,479 - (642,056) 3,918,423 Credit Suisse Securities Europe Limited 29,966,397 (584) (16,010,130) 13,955,683 Deutsche Bank AG, London 30,000 - (3,515) 26,485 Goldman Sachs International 24,982,142 - (6,148,927) 18,833,215 HSBC Bank Plc 13,137,753 - (5,133,872) 8,003,881 JP Morgan Securities Plc 7,702,903 - (471,688) 7,231,215 Macquarie Group 1,110,776 - (40,074) 1,070,702 Morgan Stanley & Co. International Plc 83,608,216 - (38,626,666) 44,981,550 Total 172,791,121 (584) (67,534,596) 105,255,941
Offsetting of Financial Assets, Derivative Assets and Collateral received by counterparty(ii)
Gross Assets not offset in the statement of financial position
The following table summarises the net financial liabilities per counterparty as at 31 December 2015:
(i) (iii)=(ii)+(i)
Gross amounts of liabilit ies in the statement of financial position
Cash collateral pledged
Financial instruments Net amount
Counterparty € € € €Bank of America Merrill Lynch (457,649) 457,649 - - Barclays Plc (19) 19 - - Citibank N.A. (642,056) 642,056 - - Credit Suisse Securities Europe Limited (16,010,130) - 16,010,130 - Deutsche Bank AG, London (3,515) 3,515 - - Goldman Sachs International (6,148,927) 4,105,835 2,043,092 - HSBC Bank Plc (5,133,872) 5,133,872 - - JP Morgan Securities Plc (471,688) 471,688 - - Macquarie Group (40,074) 40,074 - - Morgan Stanley & Co. International Plc (38,626,666) 11,116,019 27,510,647 - Total (67,534,596) 21,970,727 45,563,869 -
Offsetting of Financial Liabilit ies, Derivative Liabilit ies and Collateral pledged by counterparty(ii)
Gross Liabilit ies not offset in the statement of financial position
Man GLG Total ReturnMan GLG Total Return ceased operations on 8 February 2016. Hence, there are no investments as of 31 December 2016.
The following table summarises the net financial assets per counterparty as at 31 December 2015:
(i) (iii)=(ii)+(i)
Gross amounts of assets in the statement of financial position
Cash collateral received
Financial instruments Net amount
Counterparty £ £ £ £Credit Suisse Securities Europe Limited 32 - (12) 20 Goldman Sachs International 5 - (5) - UBS AG 594,958 - (122) 594,836 Total 594,995 - (139) 594,856
Offsetting of Financial Assets, Derivative Assets and Collateral received by counterparty(ii)
Gross Assets not offset in the statement of financial position
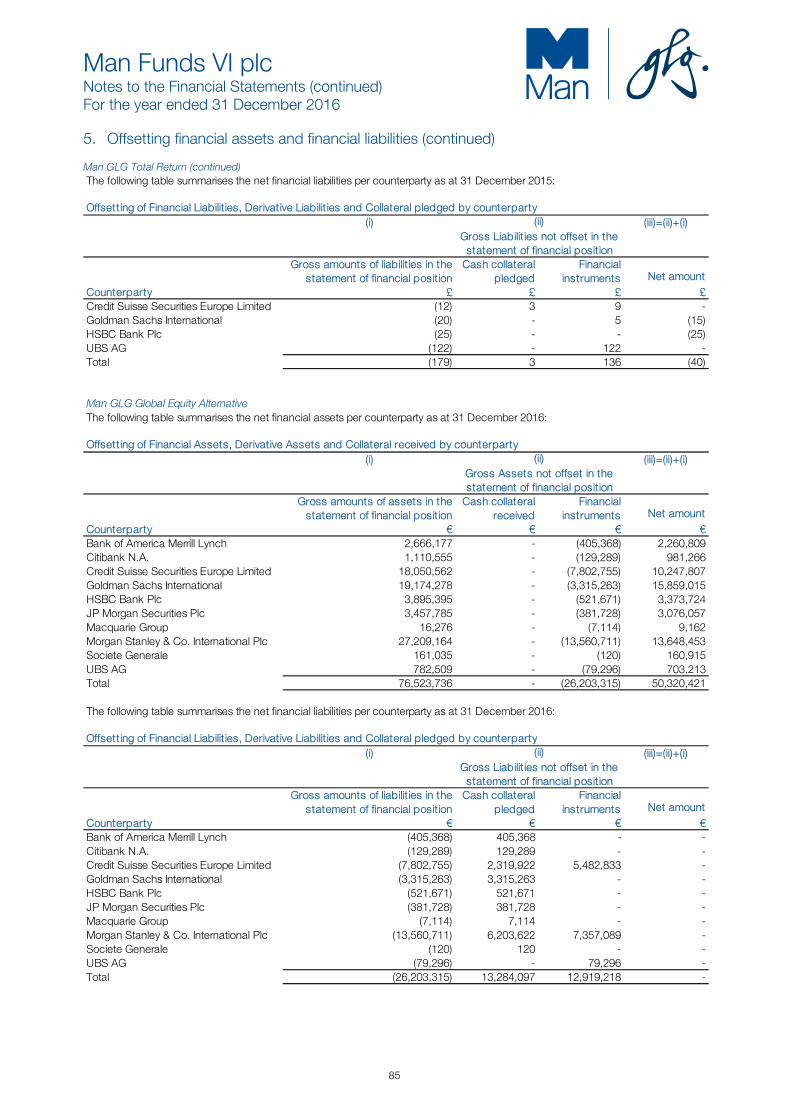
Man Funds VI plc Notes to the Financial Statements (continued) For the year ended 31 December 2016
85
5. Offsetting financial assets and financial liabilities (continued)
Man GLG Total Return (continued) The following table summarises the net financial liabilities per counterparty as at 31 December 2015:
(i) (iii)=(ii)+(i)
Gross amounts of liabilit ies in the statement of financial position
Cash collateral pledged
Financial instruments Net amount
Counterparty £ £ £ £Credit Suisse Securities Europe Limited (12) 3 9 - Goldman Sachs International (20) - 5 (15)HSBC Bank Plc (25) - - (25)UBS AG (122) - 122 - Total (179) 3 136 (40)
Offsetting of Financial Liabilit ies, Derivative Liabilit ies and Collateral pledged by counterparty(ii)
Gross Liabilit ies not offset in the statement of financial position
Man GLG Global Equity AlternativeThe following table summarises the net financial assets per counterparty as at 31 December 2016:
(i) (iii)=(ii)+(i)
Gross amounts of assets in the statement of financial position
Cash collateral received
Financial instruments Net amount
Counterparty € € € €Bank of America Merrill Lynch 2,666,177 - (405,368) 2,260,809 Citibank N.A. 1,110,555 - (129,289) 981,266 Credit Suisse Securities Europe Limited 18,050,562 - (7,802,755) 10,247,807 Goldman Sachs International 19,174,278 - (3,315,263) 15,859,015 HSBC Bank Plc 3,895,395 - (521,671) 3,373,724 JP Morgan Securities Plc 3,457,785 - (381,728) 3,076,057 Macquarie Group 16,276 - (7,114) 9,162 Morgan Stanley & Co. International Plc 27,209,164 - (13,560,711) 13,648,453 Societe Generale 161,035 - (120) 160,915 UBS AG 782,509 - (79,296) 703,213 Total 76,523,736 - (26,203,315) 50,320,421
The following table summarises the net financial liabilities per counterparty as at 31 December 2016:
(i) (iii)=(ii)+(i)
Gross amounts of liabilit ies in the statement of financial position
Cash collateral pledged
Financial instruments Net amount
Counterparty € € € €Bank of America Merrill Lynch (405,368) 405,368 - - Citibank N.A. (129,289) 129,289 - - Credit Suisse Securities Europe Limited (7,802,755) 2,319,922 5,482,833 - Goldman Sachs International (3,315,263) 3,315,263 - - HSBC Bank Plc (521,671) 521,671 - - JP Morgan Securities Plc (381,728) 381,728 - - Macquarie Group (7,114) 7,114 - - Morgan Stanley & Co. International Plc (13,560,711) 6,203,622 7,357,089 - Societe Generale (120) 120 - - UBS AG (79,296) - 79,296 - Total (26,203,315) 13,284,097 12,919,218 -
Offsetting of Financial Assets, Derivative Assets and Collateral received by counterparty(ii)
Gross Assets not offset in the statement of financial position
Offsetting of Financial Liabilit ies, Derivative Liabilit ies and Collateral pledged by counterparty(ii)
Gross Liabilit ies not offset in the statement of financial position

Man Funds VI plc Notes to the Financial Statements (continued) For the year ended 31 December 2016
86
5. Offsetting financial assets and financial liabilities (continued) Man GLG Global Equity Alternative (continued) The following table summarises the net financial assets per counterparty as at 31 December 2015:
(i) (iii)=(ii)+(i)
Gross amounts of assets in the statement of financial position
Cash collateral received
Financial instruments Net amount
Counterparty € € € €Bank of America Merrill Lynch 4,930,292 - (300,435) 4,629,857 Citibank N.A. 2,487,212 - (424,969) 2,062,243 Credit Suisse Securities Europe Limited 22,914,355 - (4,525,278) 18,389,077 Deutsche Bank AG, London 30,000 - (2,784) 27,216 Goldman Sachs International 22,054,367 (1) (2,745,756) 19,308,610 HSBC Bank Plc 8,628,970 - (2,888,177) 5,740,793 JP Morgan Securities Plc 3,795,889 - (238,385) 3,557,504 Macquarie Group 1,096,842 - (27,168) 1,069,674 Morgan Stanley & Co. International Plc 32,852,894 - (12,296,910) 20,555,984 Total 98,790,821 (1) (23,449,862) 75,340,958
The following table summarises the net financial liabilities per counterparty as at 31 December 2015:
(i) (iii)=(ii)+(i)
Gross amounts of liabilit ies in the statement of financial position
Cash collateral pledged
Financial instruments Net amount
Counterparty € € € €Bank of America Merrill Lynch (300,435) 300,435 - - Citibank N.A. (424,969) 424,969 - - Credit Suisse Securities Europe Limited (4,525,278) 127 4,525,151 - Deutsche Bank AG, London (2,784) 2,784 - - Goldman Sachs International (2,745,756) 2,745,756 - - HSBC Bank Plc (2,888,177) 2,888,177 - - JP Morgan Securities Plc (238,385) 238,385 - - Macquarie Group (27,168) 27,168 - - Morgan Stanley & Co. International Plc (12,296,910) 5,491,135 6,805,775 - Total (23,449,862) 12,118,936 11,330,926 -
Offsetting of Financial Assets, Derivative Assets and Collateral received by counterparty(ii)
Gross Assets not offset in the statement of financial position
Offsetting of Financial Liabilit ies, Derivative Liabilit ies and Collateral pledged by counterparty(ii)
Gross Liabilit ies not offset in the statement of financial position
Man GLG Asian Equity Alternative Man GLG Asian Equity Alternative ceased operations on 20 April 2016. Hence, there are no investments as of 31 December 2016.
(i) (iii)=(ii)+(i)
Gross amounts of assets in the statement of financial position
Cash collateral received
Financial instruments Net amount
Counterparty US$ US$ US$ US$Citibank N.A. 18 - - 18 Macquarie Group 72 - - 72 Morgan Stanley & Co. International Plc 3 - - 3 UBS AG 91 - - 91 Total 184 - - 184
Offsetting of Financial Assets, Derivative Assets and Collateral received by counterparty(ii)
Gross Assets not offset in the statement of financial position
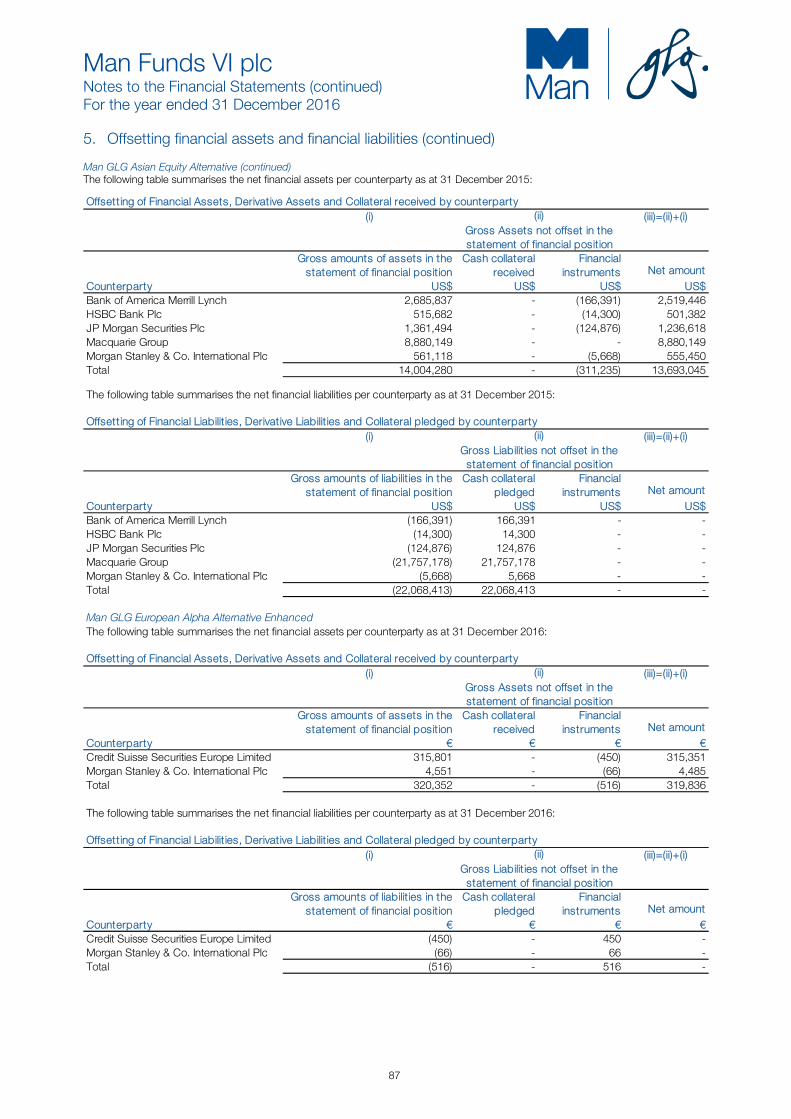
Man Funds VI plc Notes to the Financial Statements (continued) For the year ended 31 December 2016
87
5. Offsetting financial assets and financial liabilities (continued)
Man GLG Asian Equity Alternative (continued) The following table summarises the net financial assets per counterparty as at 31 December 2015:
(i) (iii)=(ii)+(i)
Gross amounts of assets in the statement of financial position
Cash collateral received
Financial instruments Net amount
Counterparty US$ US$ US$ US$Bank of America Merrill Lynch 2,685,837 - (166,391) 2,519,446 HSBC Bank Plc 515,682 - (14,300) 501,382 JP Morgan Securities Plc 1,361,494 - (124,876) 1,236,618 Macquarie Group 8,880,149 - - 8,880,149 Morgan Stanley & Co. International Plc 561,118 - (5,668) 555,450 Total 14,004,280 - (311,235) 13,693,045
Offsetting of Financial Assets, Derivative Assets and Collateral received by counterparty(ii)
Gross Assets not offset in the statement of financial position
The following table summarises the net financial liabilities per counterparty as at 31 December 2015:
(i) (iii)=(ii)+(i)
Gross amounts of liabilit ies in the statement of financial position
Cash collateral pledged
Financial instruments Net amount
Counterparty US$ US$ US$ US$Bank of America Merrill Lynch (166,391) 166,391 - - HSBC Bank Plc (14,300) 14,300 - - JP Morgan Securities Plc (124,876) 124,876 - - Macquarie Group (21,757,178) 21,757,178 - - Morgan Stanley & Co. International Plc (5,668) 5,668 - - Total (22,068,413) 22,068,413 - -
Offsetting of Financial Liabilit ies, Derivative Liabilit ies and Collateral pledged by counterparty(ii)
Gross Liabilit ies not offset in the statement of financial position
Man GLG European Alpha Alternative EnhancedThe following table summarises the net financial assets per counterparty as at 31 December 2016:
(i) (iii)=(ii)+(i)
Gross amounts of assets in the statement of financial position
Cash collateral received
Financial instruments Net amount
Counterparty € € € €Credit Suisse Securities Europe Limited 315,801 - (450) 315,351 Morgan Stanley & Co. International Plc 4,551 - (66) 4,485 Total 320,352 - (516) 319,836
The following table summarises the net financial liabilities per counterparty as at 31 December 2016:
(i) (iii)=(ii)+(i)
Gross amounts of liabilit ies in the statement of financial position
Cash collateral pledged
Financial instruments Net amount
Counterparty € € € €Credit Suisse Securities Europe Limited (450) - 450 - Morgan Stanley & Co. International Plc (66) - 66 - Total (516) - 516 -
Offsetting of Financial Assets, Derivative Assets and Collateral received by counterparty(ii)
Gross Assets not offset in the statement of financial position
Offsetting of Financial Liabilit ies, Derivative Liabilit ies and Collateral pledged by counterparty(ii)
Gross Liabilit ies not offset in the statement of financial position
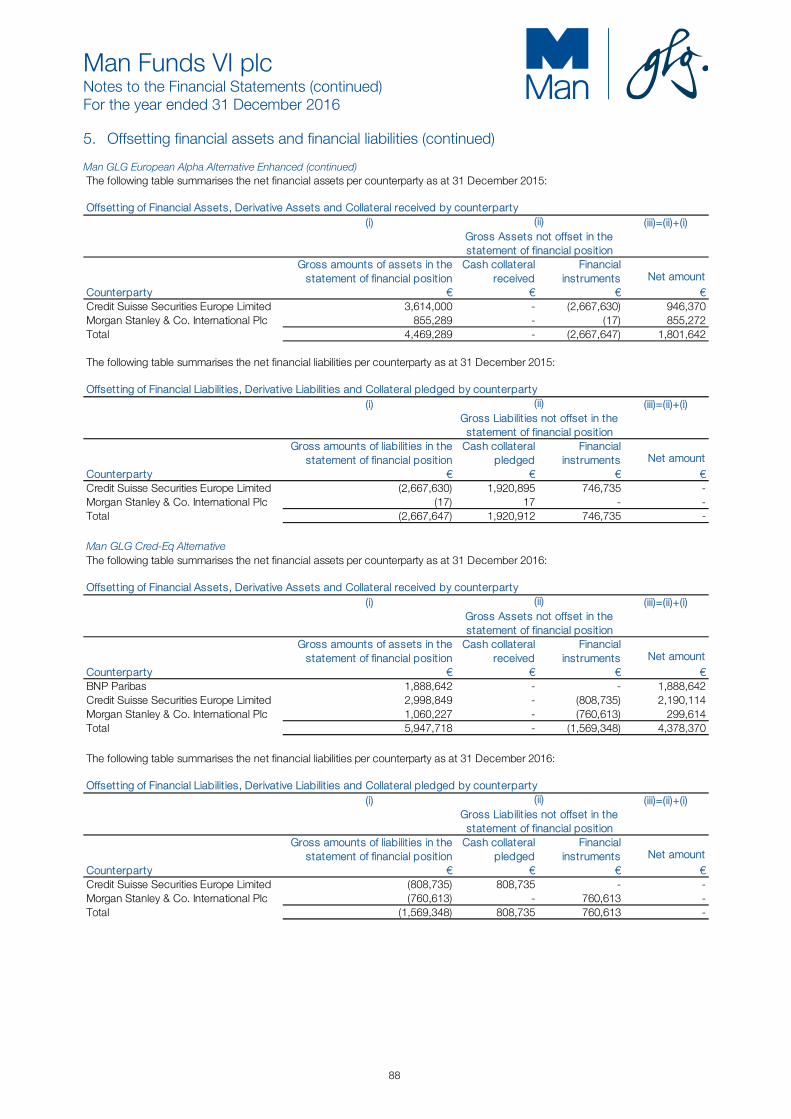
Man Funds VI plc Notes to the Financial Statements (continued) For the year ended 31 December 2016
88
5. Offsetting financial assets and financial liabilities (continued)
Man GLG European Alpha Alternative Enhanced (continued) The following table summarises the net financial assets per counterparty as at 31 December 2015:
(i) (iii)=(ii)+(i)
Gross amounts of assets in the statement of financial position
Cash collateral received
Financial instruments Net amount
Counterparty € € € €Credit Suisse Securities Europe Limited 3,614,000 - (2,667,630) 946,370 Morgan Stanley & Co. International Plc 855,289 - (17) 855,272 Total 4,469,289 - (2,667,647) 1,801,642
The following table summarises the net financial liabilities per counterparty as at 31 December 2015:
(i) (iii)=(ii)+(i)
Gross amounts of liabilit ies in the statement of financial position
Cash collateral pledged
Financial instruments Net amount
Counterparty € € € €Credit Suisse Securities Europe Limited (2,667,630) 1,920,895 746,735 - Morgan Stanley & Co. International Plc (17) 17 - - Total (2,667,647) 1,920,912 746,735 -
Offsetting of Financial Assets, Derivative Assets and Collateral received by counterparty(ii)
Gross Assets not offset in the statement of financial position
Offsetting of Financial Liabilit ies, Derivative Liabilit ies and Collateral pledged by counterparty(ii)
Gross Liabilit ies not offset in the statement of financial position
Man GLG Cred-Eq AlternativeThe following table summarises the net financial assets per counterparty as at 31 December 2016:
(i) (iii)=(ii)+(i)
Gross amounts of assets in the statement of financial position
Cash collateral received
Financial instruments Net amount
Counterparty € € € €BNP Paribas 1,888,642 - - 1,888,642 Credit Suisse Securities Europe Limited 2,998,849 - (808,735) 2,190,114 Morgan Stanley & Co. International Plc 1,060,227 - (760,613) 299,614 Total 5,947,718 - (1,569,348) 4,378,370
Offsetting of Financial Assets, Derivative Assets and Collateral received by counterparty(ii)
Gross Assets not offset in the statement of financial position
The following table summarises the net financial liabilities per counterparty as at 31 December 2016:
(i) (iii)=(ii)+(i)
Gross amounts of liabilit ies in the statement of financial position
Cash collateral pledged
Financial instruments Net amount
Counterparty € € € €Credit Suisse Securities Europe Limited (808,735) 808,735 - - Morgan Stanley & Co. International Plc (760,613) - 760,613 - Total (1,569,348) 808,735 760,613 -
Offsetting of Financial Liabilit ies, Derivative Liabilit ies and Collateral pledged by counterparty(ii)
Gross Liabilit ies not offset in the statement of financial position

Man Funds VI plc Notes to the Financial Statements (continued) For the year ended 31 December 2016
89
5. Offsetting financial assets and financial liabilities (continued)
Man GLG Cred-Eq Alternative (continued) The following table summarises the net financial assets per counterparty as at 31 December 2015:
(i) (iii)=(ii)+(i)
Gross amounts of assets in the statement of financial position
Cash collateral received
Financial instruments Net amount
Counterparty € € € €Credit Suisse Securities Europe Limited 3,237,226 - (995,215) 2,242,011 Morgan Stanley & Co. International Plc 10,365,916 - (1,142,390) 9,223,526 Total 13,603,142 - (2,137,605) 11,465,537
The following table summarises the net financial liabilities per counterparty as at 31 December 2015:
(i) (iii)=(ii)+(i)
Gross amounts of liabilit ies in the statement of financial position
Cash collateral pledged
Financial instruments Net amount
Counterparty € € € €Credit Suisse Securities Europe Limited (995,215) 995,215 - - Morgan Stanley & Co. International Plc (1,142,390) 1,142,390 - - Total (2,137,605) 2,137,605 - -
Offsetting of Financial Assets, Derivative Assets and Collateral received by counterparty(ii)
Gross Assets not offset in the statement of financial position
Offsetting of Financial Liabilit ies, Derivative Liabilit ies and Collateral pledged by counterparty(ii)
Gross Liabilit ies not offset in the statement of financial position
Man AHL Multi Strategy AlternativeThe following table summarises the net financial assets per counterparty as at 31 December 2016:
(i) (iii)=(ii)+(i)
Gross amounts of assets in the statement of financial position
Cash collateral received
Financial instruments Net amount
Counterparty US$ US$ US$ US$Bank of America Merrill Lynch 3,328,674 - (2,136,381) 1,192,293 BNP Paribas 22,115,507 - - 22,115,507 Credit Suisse Securities Europe Limited 12,366,624 - (4,727,803) 7,638,821 Deutsche Bank AG, London 1,254,923 - (498,293) 756,630 HSBC Bank Plc 2,773,116 - (1,166,493) 1,606,623 JP Morgan Securities Plc 6,657,564 - (748,201) 5,909,363 Morgan Stanley & Co. International Plc 8,185,427 - (3,164,006) 5,021,421 Royal Bank of Scotland 2,281,849 - (1,084,909) 1,196,940 Total 58,963,684 - (13,526,086) 45,437,598
Offsetting of Financial Assets, Derivative Assets and Collateral received by counterparty(ii)
Gross Assets not offset in the statement of financial position

Man Funds VI plc Notes to the Financial Statements (continued) For the year ended 31 December 2016
90
5. Offsetting financial assets and financial liabilities (continued)
Man AHL Multi Strategy Alternative (continued)
The following table summarises the net financial liabilities per counterparty as at 31 December 2016:
(i) (iii)=(ii)+(i)
Gross amounts of liabilit ies in the statement of financial position
Cash collateral pledged
Financial instruments Net amount
Counterparty US$ US$ US$ US$Bank of America Merrill Lynch (2,136,381) - 2,136,381 - Credit Suisse Securities Europe Limited (4,727,803) 148 4,727,655 - Deutsche Bank AG, London (498,293) 498,293 - - HSBC Bank Plc (1,166,493) 1,127,816 38,677 - JP Morgan Securities Plc (748,201) - 748,201 - Morgan Stanley & Co. International Plc (3,164,006) 3,164,006 - - Royal Bank of Scotland (1,084,909) 1,084,909 - - Total (13,526,086) 5,875,172 7,650,914 -
The following table summarises the net financial assets per counterparty as at 31 December 2015:
(i) (iii)=(ii)+(i)
Gross amounts of assets in the statement of financial position
Cash collateral received
Financial instruments Net amount
Counterparty US$ US$ US$ US$Bank of America Merrill Lynch 3,133,299 - (422,170) 2,711,129 Credit Suisse Securities Europe Limited 7,976,056 - (2,620,730) 5,355,326 Deutsche Bank AG, London 2,331,593 - (292,238) 2,039,355 JP Morgan Securities Plc 5,896,860 - (959,973) 4,936,887 Morgan Stanley & Co. International Plc 10,933,820 - (1,689,030) 9,244,790 Royal Bank of Scotland 945,612 - (245,146) 700,466 Total 31,217,240 - (6,229,287) 24,987,953
The following table summarises the net financial liabilities per counterparty as at 31 December 2015:
(i) (iii)=(ii)+(i)
Gross amounts of liabilit ies in the statement of financial position
Cash collateral pledged
Financial instruments Net amount
Counterparty US$ US$ US$ US$Bank of America Merrill Lynch (422,170) - 422,170 - Credit Suisse Securities Europe Limited (2,620,730) 270,061 2,350,669 - Deutsche Bank AG, London (292,238) 292,238 - - JP Morgan Securities Plc (959,973) - 959,973 - Morgan Stanley & Co. International Plc (1,689,030) 1,689,030 - - Royal Bank of Scotland (245,146) 245,146 - - Total (6,229,287) 2,496,475 3,732,812 -
Offsetting of Financial Assets, Derivative Assets and Collateral received by counterparty(ii)
Gross Assets not offset in the statement of financial position
Offsetting of Financial Liabilit ies, Derivative Liabilit ies and Collateral pledged by counterparty(ii)
Gross Liabilit ies not offset in the statement of financial position
Offsetting of Financial Liabilit ies, Derivative Liabilit ies and Collateral pledged by counterparty(ii)
Gross Liabilit ies not offset in the statement of financial position

Man Funds VI plc Notes to the Financial Statements (continued) For the year ended 31 December 2016
91
5. Offsetting financial assets and financial liabilities (continued)
Man AHL Directional Equities AlternativeThe following table summarises the net financial assets per counterparty as at 31 December 2016:
(i) (iii)=(ii)+(i)
Gross amounts of assets in the statement of financial position
Cash collateral received
Financial instruments Net amount
Counterparty US$ US$ US$ US$BNP Paribas 110 - - 110 Credit Suisse Securities Europe Limited 559 - - 559 Royal Bank of Scotland 3 - - 3 Total 672 - - 672
Offsetting of Financial Assets, Derivative Assets and Collateral received by counterparty(ii)
Gross Assets not offset in the statement of financial position
The following table summarises the net financial assets per counterparty as at 31 December 2015:
(i) (iii)=(ii)+(i)
Gross amounts of assets in the statement of financial position
Cash collateral received
Financial instruments Net amount
Counterparty US$ US$ US$ US$Credit Suisse Securities Europe Limited 1,401,457 - (1,077,402) 324,055 Morgan Stanley & Co. International Plc 2,444,990 - (511,135) 1,933,855 Royal Bank of Scotland 69,408 - (4,543) 64,865 Total 3,915,855 - (1,593,080) 2,322,775
The following table summarises the net financial liabilities per counterparty as at 31 December 2015:
(i) (iii)=(ii)+(i)
Gross amounts of liabilit ies in the statement of financial position
Cash collateral pledged
Financial instruments Net amount
Counterparty US$ US$ US$ US$Credit Suisse Securities Europe Limited (1,077,402) 14 1,077,388 - Morgan Stanley & Co. International Plc (511,135) 511,135 - - Royal Bank of Scotland (4,543) 4,543 - - Total (1,593,080) 515,692 1,077,388 -
Offsetting of Financial Assets, Derivative Assets and Collateral received by counterparty(ii)
Gross Assets not offset in the statement of financial position
Offsetting of Financial Liabilit ies, Derivative Liabilit ies and Collateral pledged by counterparty(ii)
Gross Liabilit ies not offset in the statement of financial position
Man AHL TargetRiskThe following table summarises the net financial assets per counterparty as at 31 December 2016:
(i) (iii)=(ii)+(i)
Gross amounts of assets in the statement of financial position
Cash collateral received
Financial instruments Net amount
Counterparty US$ US$ US$ US$Bank of America Merrill Lynch 207,073 - (38,454) 168,619 BNP Paribas 812,792 - - 812,792 Credit Suisse Securities Europe Limited 1,121,571 - (60,095) 1,061,476 Deutsche Bank AG, London 16,024 - (144) 15,880 JP Morgan Securities Plc 3,471,993 - (1,322,844) 2,149,149 Royal Bank of Scotland 108,512 - (9,157) 99,355 Total 5,737,965 - (1,430,694) 4,307,271
Offsetting of Financial Assets, Derivative Assets and Collateral received by counterparty(ii)
Gross Assets not offset in the statement of financial position

Man Funds VI plc Notes to the Financial Statements (continued) For the year ended 31 December 2016
92
5. Offsetting financial assets and financial liabilities (continued)
Man AHL TargetRisk (continued) The following table summarises the net financial liabilities per counterparty as at 31 December 2016:
(i) (iii)=(ii)+(i)
Gross amounts of liabilit ies in the statement of financial position
Cash collateral pledged
Financial instruments Net amount
Counterparty US$ US$ US$ US$Bank of America Merrill Lynch (38,454) - 38,454 - Credit Suisse Securities Europe Limited (60,095) 60,095 - - Deutsche Bank AG, London (144) 144 - - JP Morgan Securities Plc (1,322,844) 1,252,108 70,736 - Royal Bank of Scotland (9,157) 9,157 - - Total (1,430,694) 1,321,504 109,190 -
The following table summarises the net financial assets per counterparty as at 31 December 2015:
(i) (iii)=(ii)+(i)
Gross amounts of assets in the statement of financial position
Cash collateral received
Financial instruments Net amount
Counterparty US$ US$ US$ US$Bank of America Merrill Lynch 199,461 - (36,816) 162,645 Credit Suisse Securities Europe Limited 535,425 (174,430) (8,272) 352,723 Deutsche Bank AG, London 17,164 - - 17,164 JP Morgan Securities Plc 955,574 (229,846) (64,561) 661,167 Total 1,707,624 (404,276) (109,649) 1,193,699
Offsetting of Financial Assets, Derivative Assets and Collateral received by counterparty(ii)
Gross Assets not offset in the statement of financial position
Offsetting of Financial Liabilit ies, Derivative Liabilit ies and Collateral pledged by counterparty(ii)
Gross Liabilit ies not offset in the statement of financial position
The following table summarises the net financial liabilities per counterparty as at 31 December 2015:
(i) (iii)=(ii)+(i)
Gross amounts of liabilit ies in the statement of financial position
Cash collateral pledged
Financial instruments Net amount
Counterparty US$ US$ US$ US$Bank of America Merrill Lynch (36,816) - 36,816 - Credit Suisse Securities Europe Limited (8,272) - 8,272 - JP Morgan Securities Plc (64,561) 64,561 - - Royal Bank of Scotland (40,261) - 40,261 - Total (149,910) 64,561 85,349 -
Offsetting of Financial Liabilit ies, Derivative Liabilit ies and Collateral pledged by counterparty(ii)
Gross Liabilit ies not offset in the statement of financial position
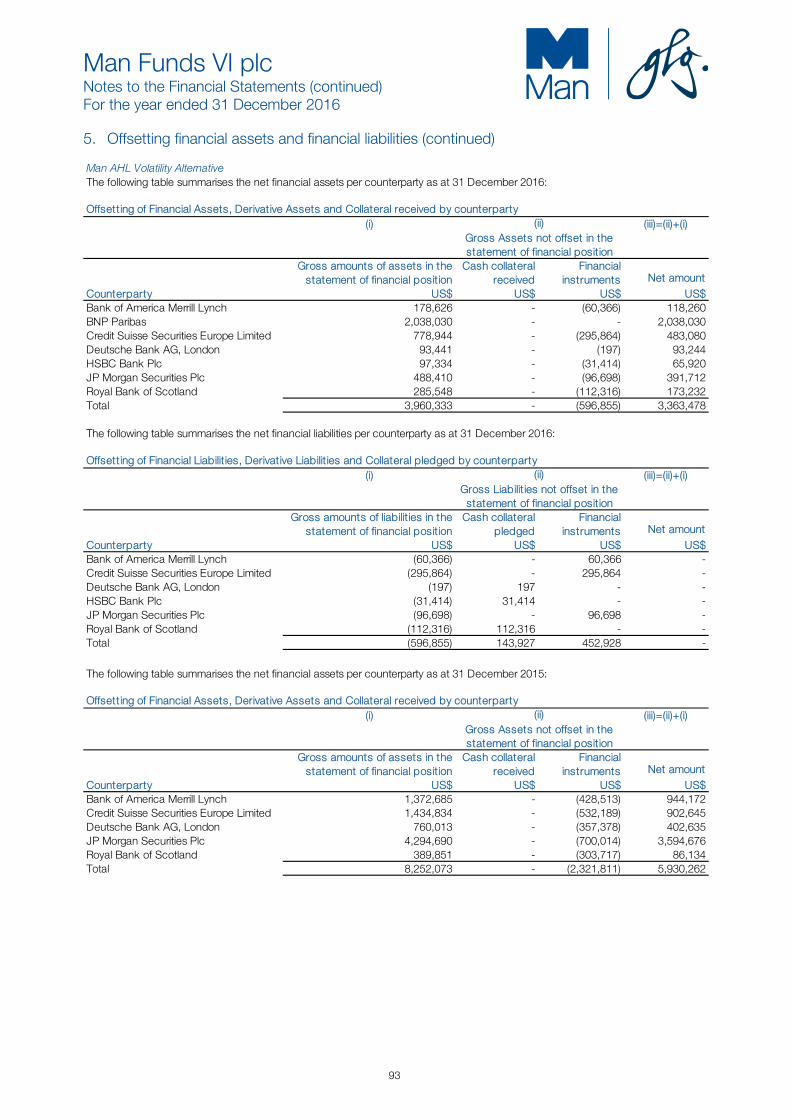
Man Funds VI plc Notes to the Financial Statements (continued) For the year ended 31 December 2016
93
5. Offsetting financial assets and financial liabilities (continued)
Man AHL Volatility AlternativeThe following table summarises the net financial assets per counterparty as at 31 December 2016:
(i) (iii)=(ii)+(i)
Gross amounts of assets in the statement of financial position
Cash collateral received
Financial instruments Net amount
Counterparty US$ US$ US$ US$Bank of America Merrill Lynch 178,626 - (60,366) 118,260 BNP Paribas 2,038,030 - - 2,038,030 Credit Suisse Securities Europe Limited 778,944 - (295,864) 483,080 Deutsche Bank AG, London 93,441 - (197) 93,244 HSBC Bank Plc 97,334 - (31,414) 65,920 JP Morgan Securities Plc 488,410 - (96,698) 391,712 Royal Bank of Scotland 285,548 - (112,316) 173,232 Total 3,960,333 - (596,855) 3,363,478
The following table summarises the net financial liabilities per counterparty as at 31 December 2016:
(i) (iii)=(ii)+(i)
Gross amounts of liabilit ies in the statement of financial position
Cash collateral pledged
Financial instruments Net amount
Counterparty US$ US$ US$ US$Bank of America Merrill Lynch (60,366) - 60,366 - Credit Suisse Securities Europe Limited (295,864) - 295,864 - Deutsche Bank AG, London (197) 197 - - HSBC Bank Plc (31,414) 31,414 - - JP Morgan Securities Plc (96,698) - 96,698 - Royal Bank of Scotland (112,316) 112,316 - - Total (596,855) 143,927 452,928 -
Offsetting of Financial Assets, Derivative Assets and Collateral received by counterparty(ii)
Gross Assets not offset in the statement of financial position
Offsetting of Financial Liabilit ies, Derivative Liabilit ies and Collateral pledged by counterparty(ii)
Gross Liabilit ies not offset in the statement of financial position
The following table summarises the net financial assets per counterparty as at 31 December 2015:
(i) (iii)=(ii)+(i)
Gross amounts of assets in the statement of financial position
Cash collateral received
Financial instruments Net amount
Counterparty US$ US$ US$ US$Bank of America Merrill Lynch 1,372,685 - (428,513) 944,172 Credit Suisse Securities Europe Limited 1,434,834 - (532,189) 902,645 Deutsche Bank AG, London 760,013 - (357,378) 402,635 JP Morgan Securities Plc 4,294,690 - (700,014) 3,594,676 Royal Bank of Scotland 389,851 - (303,717) 86,134 Total 8,252,073 - (2,321,811) 5,930,262
Offsetting of Financial Assets, Derivative Assets and Collateral received by counterparty(ii)
Gross Assets not offset in the statement of financial position

Man Funds VI plc Notes to the Financial Statements (continued) For the year ended 31 December 2016
94
5. Offsetting financial assets and financial liabilities (continued)
Man AHL Volatility Alternative (continued) The following table summarises the net financial liabilities per counterparty as at 31 December 2015:
(i) (iii)=(ii)+(i)
Gross amounts of liabilit ies in the statement of financial position
Cash collateral pledged
Financial instruments Net amount
Counterparty US$ US$ US$ US$Bank of America Merrill Lynch (428,513) - 428,513 - Credit Suisse Securities Europe Limited (532,189) - 532,189 - Deutsche Bank AG, London (357,378) 357,378 - - JP Morgan Securities Plc (700,014) - 700,014 - Royal Bank of Scotland (303,717) 303,717 - - Total (2,321,811) 661,095 1,660,716 -
Man GLG European Mid-Cap Equity AlternativeThe following table summarises the net financial assets per counterparty as at 31 December 2016:
(i) (iii)=(ii)+(i)
Gross amounts of assets in the statement of financial position
Cash collateral received
Financial instruments Net amount
Counterparty € € € €Credit Suisse Securities Europe Limited 25,718,847 - (16,271,939) 9,446,908 Goldman Sachs International 20,507,841 - (14,042,134) 6,465,707 HSBC Bank Plc 1,665,000 - (17) 1,664,983 Morgan Stanley & Co. International Plc 355,717 (274,862) (80,855) - Total 48,247,405 (274,862) (30,394,945) 17,577,598
Offsetting of Financial Assets, Derivative Assets and Collateral received by counterparty(ii)
Gross Assets not offset in the statement of financial position
Offsetting of Financial Liabilit ies, Derivative Liabilit ies and Collateral pledged by counterparty(ii)
Gross Liabilit ies not offset in the statement of financial position
The following table summarises the net financial liabilities per counterparty as at 31 December 2016:
(i) (iii)=(ii)+(i)
Gross amounts of liabilit ies in the statement of financial position
Cash collateral pledged
Financial instruments Net amount
Counterparty € € € €Credit Suisse Securities Europe Limited (16,271,939) 16,271,939 - - Goldman Sachs International (14,042,134) 12,778 14,029,356 - HSBC Bank Plc (17) 17 - - Morgan Stanley & Co. International Plc (275,097) - 80,855 (194,242)Total (30,589,187) 16,284,734 14,110,211 (194,242)
The following table summarises the net financial assets per counterparty as at 31 December 2015:
(i) (iii)=(ii)+(i)
Gross amounts of assets in the statement of financial position
Cash collateral received
Financial instruments Net amount
Counterparty € € € €Goldman Sachs International 11,953,699 - (694,900) 11,258,799 Morgan Stanley & Co. International Plc 2,503 - - 2,503 Total 11,956,202 - (694,900) 11,261,302
Offsetting of Financial Assets, Derivative Assets and Collateral received by counterparty(ii)
Gross Assets not offset in the statement of financial position
Offsetting of Financial Liabilit ies, Derivative Liabilit ies and Collateral pledged by counterparty(ii)
Gross Liabilit ies not offset in the statement of financial position
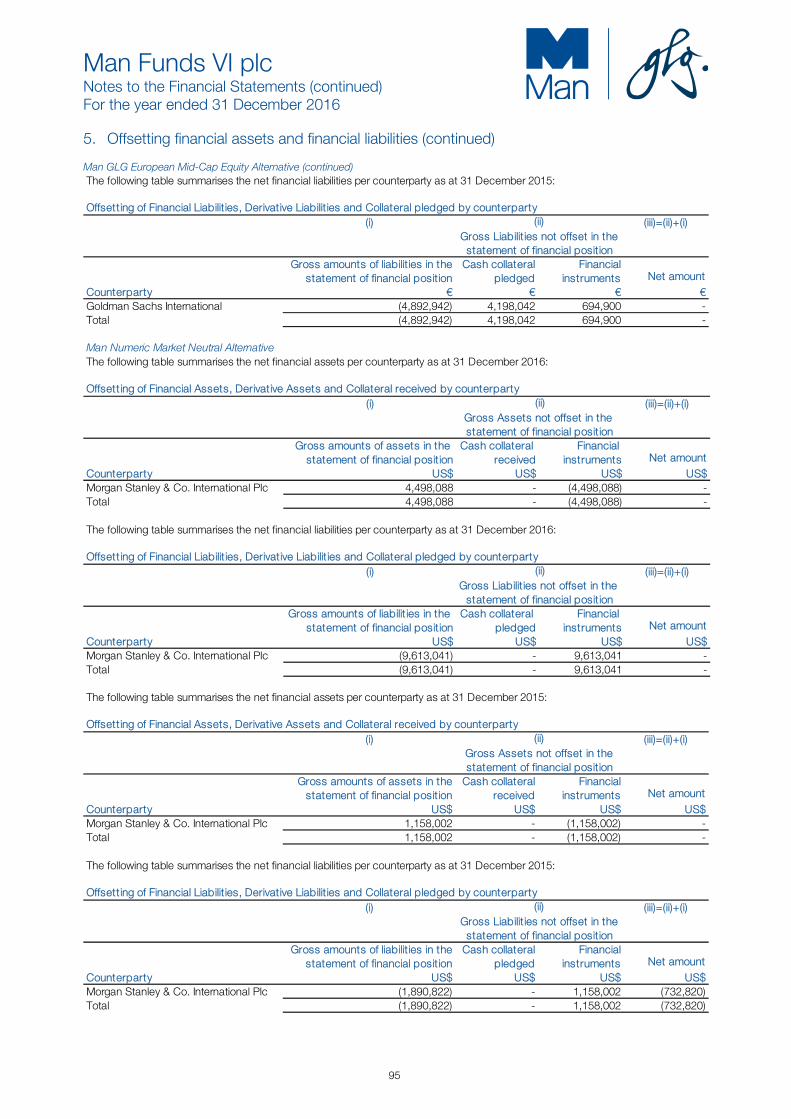
Man Funds VI plc Notes to the Financial Statements (continued) For the year ended 31 December 2016
95
5. Offsetting financial assets and financial liabilities (continued)
Man GLG European Mid-Cap Equity Alternative (continued) The following table summarises the net financial liabilities per counterparty as at 31 December 2015:
(i) (iii)=(ii)+(i)
Gross amounts of liabilit ies in the statement of financial position
Cash collateral pledged
Financial instruments Net amount
Counterparty € € € €Goldman Sachs International (4,892,942) 4,198,042 694,900 - Total (4,892,942) 4,198,042 694,900 -
Offsetting of Financial Liabilit ies, Derivative Liabilit ies and Collateral pledged by counterparty(ii)
Gross Liabilit ies not offset in the statement of financial position
Man Numeric Market Neutral AlternativeThe following table summarises the net financial assets per counterparty as at 31 December 2016:
(i) (iii)=(ii)+(i)
Gross amounts of assets in the statement of financial position
Cash collateral received
Financial instruments Net amount
Counterparty US$ US$ US$ US$Morgan Stanley & Co. International Plc 4,498,088 - (4,498,088) - Total 4,498,088 - (4,498,088) -
The following table summarises the net financial liabilities per counterparty as at 31 December 2016:
(i) (iii)=(ii)+(i)
Gross amounts of liabilit ies in the statement of financial position
Cash collateral pledged
Financial instruments Net amount
Counterparty US$ US$ US$ US$Morgan Stanley & Co. International Plc (9,613,041) - 9,613,041 - Total (9,613,041) - 9,613,041 -
Offsetting of Financial Assets, Derivative Assets and Collateral received by counterparty(ii)
Gross Assets not offset in the statement of financial position
Offsetting of Financial Liabilities, Derivative Liabilities and Collateral pledged by counterparty(ii)
Gross Liabilities not offset in the statement of financial position
The following table summarises the net financial assets per counterparty as at 31 December 2015:
(i) (iii)=(ii)+(i)
Gross amounts of assets in the statement of financial position
Cash collateral received
Financial instruments Net amount
Counterparty US$ US$ US$ US$Morgan Stanley & Co. International Plc 1,158,002 - (1,158,002) - Total 1,158,002 - (1,158,002) -
The following table summarises the net financial liabilities per counterparty as at 31 December 2015:
(i) (iii)=(ii)+(i)
Gross amounts of liabilit ies in the statement of financial position
Cash collateral pledged
Financial instruments Net amount
Counterparty US$ US$ US$ US$Morgan Stanley & Co. International Plc (1,890,822) - 1,158,002 (732,820)Total (1,890,822) - 1,158,002 (732,820)
Offsetting of Financial Assets, Derivative Assets and Collateral received by counterparty(ii)
Gross Assets not offset in the statement of financial position
Offsetting of Financial Liabilit ies, Derivative Liabilit ies and Collateral pledged by counterparty(ii)
Gross Liabilit ies not offset in the statement of financial position

Man Funds VI plc Notes to the Financial Statements (continued) For the year ended 31 December 2016
96
5. Offsetting financial assets and financial liabilities (continued)
Man GLG Unconstrained Emerging EquityThe following table summarises the net financial assets per counterparty as at 31 December 2016:
(i) (iii)=(ii)+(i)
Gross amounts of assets in the statement of financial position
Cash collateral received
Financial instruments Net amount
Counterparty US$ US$ US$ US$BNP Paribas 1,735 - - 1,735 Credit Suisse Securities Europe Limited 742,582 - - 742,582 Deutsche Bank AG, London 1 - - 1 Morgan Stanley & Co. International Plc 12,794,401 - (11,394,181) 1,400,220 Total 13,538,719 - (11,394,181) 2,144,538
Offsetting of Financial Assets, Derivative Assets and Collateral received by counterparty(ii)
Gross Assets not offset in the statement of financial position
The following table summarises the net financial liabilities per counterparty as at 31 December 2016:
(i) (iii)=(ii)+(i)
Gross amounts of liabilit ies in the statement of financial position
Cash collateral pledged
Financial instruments Net amount
Counterparty US$ US$ US$ US$Deutsche Bank AG, London (7) - - (7)Morgan Stanley & Co. International Plc (11,394,181) 11,187,396 206,785 - Total (11,394,188) 11,187,396 206,785 (7)
The following table summarises the net financial assets per counterparty as at 31 December 2015:
(i) (iii)=(ii)+(i)
Gross amounts of assets in the statement of financial position
Cash collateral received
Financial instruments Net amount
Counterparty US$ US$ US$ US$Morgan Stanley & Co. International Plc 15,251,537 - (12,875,130) 2,376,407 Total 15,251,537 - (12,875,130) 2,376,407
The following table summarises the net financial liabilities per counterparty as at 31 December 2015:
(i) (iii)=(ii)+(i)
Gross amounts of liabilit ies in the statement of financial position
Cash collateral pledged
Financial instruments Net amount
Counterparty US$ US$ US$ US$Morgan Stanley & Co. International Plc (12,875,130) 1,895,364 10,979,766 - Total (12,875,130) 1,895,364 10,979,766 -
Offsetting of Financial Assets, Derivative Assets and Collateral received by counterparty(ii)
Gross Assets not offset in the statement of financial position
Offsetting of Financial Liabilit ies, Derivative Liabilit ies and Collateral pledged by counterparty(ii)
Gross Liabilit ies not offset in the statement of financial position
Offsetting of Financial Liabilit ies, Derivative Liabilit ies and Collateral pledged by counterparty(ii)
Gross Liabilit ies not offset in the statement of financial position

Man Funds VI plc Notes to the Financial Statements (continued) For the year ended 31 December 2016
97
5. Offsetting financial assets and financial liabilities (continued)
Man GLG Global Emerging Markets Debt Total ReturnThe following table summarises the net financial assets per counterparty as at 31 December 2016:
(i) (iii)=(ii)+(i)
Gross amounts of assets in the statement of financial position
Cash collateral received
Financial instruments Net amount
Counterparty US$ US$ US$ US$Barclays Plc 8,397,592 - (8,105,164) 292,428 Citibank N.A. 727,558 - (466,427) 261,131 Deutsche Bank AG, London 50,106 - (50,106) - HSBC Bank Plc 21,080,443 - (8,789,007) 12,291,436 JP Morgan Securities Plc 907,916 - (165,664) 742,252 Standard Chartered Plc 974,861 - (381,010) 593,851 UBS AG 19,452,676 - (957,750) 18,494,926 Total 51,591,152 - (18,915,128) 32,676,024
Offsetting of Financial Assets, Derivative Assets and Collateral received by counterparty(ii)
Gross Assets not offset in the statement of financial position
The following table summarises the net financial liabilities per counterparty as at 31 December 2016:
(i) (iii)=(ii)+(i)
Gross amounts of liabilit ies in the statement of financial position
Cash collateral pledged
Financial instruments Net amount
Counterparty US$ US$ US$ US$Barclays Plc (8,105,164) 1,566,682 6,538,482 - Citibank N.A. (466,427) 450,415 16,012 - Deutsche Bank AG, London (55,435) 50,106 - (5,329)HSBC Bank Plc (8,789,007) 8,789,007 - - JP Morgan Securities Plc (165,664) 165,664 - - Standard Chartered Plc (381,010) 170,000 211,010 - UBS AG (957,750) 957,750 - - Total (18,920,457) 12,149,624 6,765,504 (5,329)
Offsetting of Financial Liabilit ies, Derivative Liabilit ies and Collateral pledged by counterparty(ii)
Gross Liabilit ies not offset in the statement of financial position
Man GLG Innovation Equity Alternative There were no offset financial assets or financial liabilities as at 31 December 2016. Man GLG Global Fundamental Equity There were no offset financial assets or financial liabilities as at 31 December 2016.
6. Financial risk management
Overall risk management The Fund’s investment activities expose it to the various types of risk which are associated with the financial instruments and markets in which it invests. The most important types of financial risks to which the Fund is exposed are market risk, credit risk and liquidity risk. Market risk includes equity price risk, interest rate risk and foreign currency risk. The Fund manages these risks on an aggregate basis along with the risks associated with its investing activities as part of its overall risk management policies. The nature and extent of the financial instruments outstanding at the dates of the statement of financial position and the risk management policies employed by the Fund are discussed below. The following summary is not intended to be a comprehensive summary of all of the risks and investors should refer to the Prospectus for a more detailed discussion of the risks inherent in investing in the Fund. Market risk Market risk can include equity risk, commodity risk, interest rate risk, credit spread risk, volatility and foreign currency risk. The Fund’s exposure to these factors is measured and monitored using Value at Risk (“VaR”).

Man Funds VI plc Notes to the Financial Statements (continued) For the year ended 31 December 2016
98
6. Financial risk management (continued)
Market risk (continued) The table below identifies the VAR calculated on the Fund as at 31 December 2016, and the stand alone contribution to the Fund VaR from each of the principal risk factors. The VaR measure is a 1 day, 97.78% confidence Monte Carlo VaR, using a historic observation period of six months. This signifies that the Fund would not be expected to lose more than the stated amount 97.78% of the time. The results are based on historically observed correlations and volatilities which may not always be an accurate prediction of the future and relate only to the positions held as at the close of business on 31 December. These positions inevitably change over time. As of 31 December the following table represents the Fund 1 day VaR as a percentage of Net Assets: Man GLG European Alpha AlternativeAs of 31 December, the following table presents the Portfolio 1 day VaR as percentage of Net Assets:
2016 2015Fund 1 Day VaR as a % of Net Assets 0.05% 0.41%Average 0.30% 0.39%Highest 0.61% 0.71%Lowest - 0.24%
Man GLG Alpha Select AlternativeAs of 31 December, the following table presents the Portfolio 1 day VaR as percentage of Net Assets:
2016 2015Fund 1 Day VaR as a % of Net Assets 0.53% 1.78%Average 0.63% 0.57%Highest 1.37% 1.78%Lowest 0.32% 0.33%
Man GLG Atlas Macro AlternativeAs of 31 December, the following table presents the Portfolio 1 day VaR as percentage of Net Assets:
2016 2015Fund 1 Day VaR as a % of Net Assets n/a 0.03%Average n/a 0.50%Highest n/a 1.28%Lowest n/a 0.03%
Man GLG North American AlternativeAs of 31 December, the following table presents the Portfolio 1 day VaR as percentage of Net Assets:
2016 2015Fund 1 Day VaR as a % of Net Assets n/a 0.01%Average n/a 0.45%Highest n/a 0.73%Lowest n/a 0.01%
Man GLG European Equity AlternativeAs of 31 December, the following table presents the Portfolio 1 day VaR as percentage of Net Assets:
2016 2015Fund 1 Day VaR as a % of Net Assets 0.29% 0.57%Average 0.48% 0.40%Highest 0.79% 0.63%Lowest 0.26% 0.27%
Man GLG Financials AlternativeAs of 31 December, the following table presents the Portfolio 1 day VaR as percentage of Net Assets:
2016 2015Fund 1 Day VaR as a % of Net Assets n/a 0.03%Average n/a 0.52%Highest n/a 0.79%Lowest n/a 0.03%

Man Funds VI plc Notes to the Financial Statements (continued) For the year ended 31 December 2016
99
6. Financial risk management (continued)
Market risk (continued)
Man GLG Total ReturnAs of 31 December, the following table presents the Portfolio 1 day VaR as percentage of Net Assets:
2016 2015Fund 1 Day VaR as a % of Net Assets n/a 0.13%Average n/a 0.52%Highest n/a 0.12%Lowest n/a 0.07%
Man GLG Global Equity AlternativeAs of 31 December, the following table presents the Portfolio 1 day VaR as percentage of Net Assets:
2016 2015Fund 1 Day VaR as a % of Net Assets 0.28% 0.57%Average 0.47% 0.42%Highest 0.78% 0.72%Lowest 0.25% 0.26%
Man GLG Asian Equity AlternativeAs of 31 December, the following table presents the Portfolio 1 day VaR as percentage of Net Assets:
2016 2015Fund 1 Day VaR as a % of Net Assets n/a 0.47%Average n/a 0.47%Highest n/a 0.81%Lowest n/a 0.20%
Man GLG European Alpha Alternative EnhancedAs of 31 December, the following table presents the Portfolio 1 day VaR as percentage of Net Assets:
2016 2015Fund 1 Day VaR as a % of Net Assets 0.48% 0.83%Average 0.65% 0.75%Highest 1.15% 1.42%Lowest 0.38% 0.47%
Man AHL Multi Strategy AlternativeAs of 31 December, the following table presents the Portfolio 1 day VaR as percentage of Net Assets:
2016 2015Fund 1 Day VaR as a % of Net Assets 1.92% - Average 1.28% - Highest 2.20% - Lowest 0.65% -
Man GLG Cred-Eq AlternativeAs of 31 December, the following table presents the Portfolio 1 day VaR as percentage of Net Assets:
2016 2015Fund 1 Day VaR as a % of Net Assets 0.44% 0.57%Average 0.55% 0.71%Highest 1.96% 2.24%Lowest 0.11% 0.15%
Man GLG Directional Equities AlternativeAs of 31 December, the following table presents the Portfolio 1 day VaR as percentage of Net Assets:
2016 2015Fund 1 Day VaR as a % of Net Assets n/a - Average n/a - Highest n/a - Lowest n/a -

Man Funds VI plc Notes to the Financial Statements (continued) For the year ended 31 December 2016
100
6. Financial risk management (continued)
Market risk (continued) Man AHL Target RiskAs of 31 December, the following table presents the Portfolio 1 day VaR as percentage of Net Assets:
2016 2015Fund 1 Day VaR as a % of Net Assets 1.30% - Average 1.27% - Highest 1.70% - Lowest 0.70% -
Man AHL Volatility AlternativeAs of 31 December, the following table presents the Portfolio 1 day VaR as percentage of Net Assets:
2016 2015Fund 1 Day VaR as a % of Net Assets 1.09% - Average 1.52% - Highest 3.24% - Lowest 0.51% -
Man GLG European Mid-Cap Equity AlternativeAs of 31 December, the following table presents the Portfolio 1 day VaR as percentage of Net Assets:
2016 2015Fund 1 Day VaR as a % of Net Assets 0.49% 0.66%Average 0.64% 0.60%Highest 0.92% 0.80%Lowest 0.35% 0.42%
Man Numeric Market Neutral AlternativeAs of 31 December, the following table presents the Portfolio 1 day VaR as percentage of Net Assets:
2016 2015Fund 1 Day VaR as a % of Net Assets 0.64% 1.25%Average 0.71% 0.94%Highest 1.24% 1.25%Lowest 0.49% 0.74%
Man GLG Unconstrained Emerging EquityAs of 31 December, the following table presents the Portfolio 1 day VaR as percentage of Net Assets:
2016 2015Fund 1 Day VaR as a % of Net Assets 0.55% 0.90%Average 0.71% 0.93%Highest 0.98% 1.13%Lowest 0.49% 0.69%
Man GLG Global Emerging Markets Debt Total ReturnAs of 31 December, the following table presents the Portfolio 1 day VaR as percentage of Net Assets:
2016 2015Fund 1 Day VaR as a % of Net Assets 0.98% n/aAverage 0.69% n/aHighest 1.41% n/aLowest 0.11% n/a
Interest rate risk Interest rate risk is the risk that the fair value or future cash flows of a financial instrument will fluctuate because of changes in market interest rates. The Fund has exposure to interest rate risk on cash held at the bank, balances due to and from brokers and certain derivative contracts. That exposure may not necessarily be significant due to the generally short term nature of those holdings. But a more significant exposure exists in that the value of all financial instruments held by the Fund may be affected either positively or negatively by changes in interest rates.
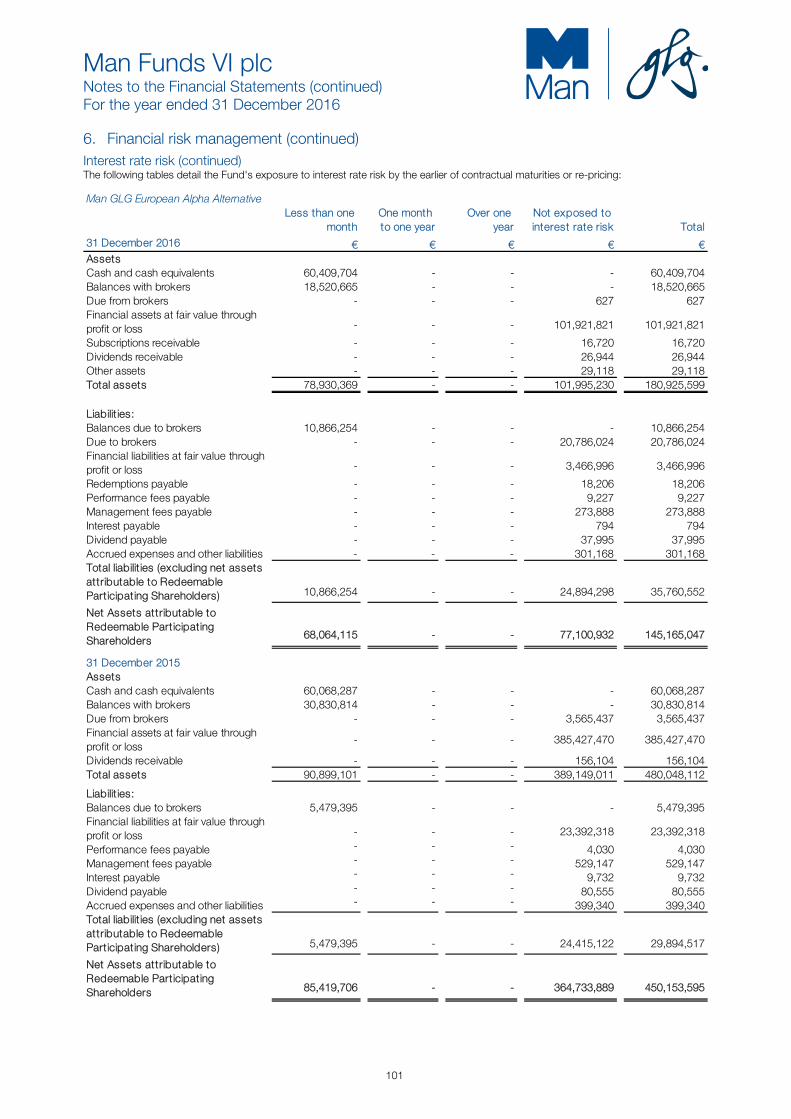
Man Funds VI plc Notes to the Financial Statements (continued) For the year ended 31 December 2016
101
6. Financial risk management (continued) Interest rate risk (continued) The following tables detail the Fund's exposure to interest rate risk by the earlier of contractual maturities or re-pricing:
Man GLG European Alpha AlternativeLess than one
monthOne month to one year
Over one year
Not exposed to interest rate risk Total
31 December 2016 € € € € €AssetsCash and cash equivalents 60,409,704 - - - 60,409,704 Balances with brokers 18,520,665 - - - 18,520,665 Due from brokers - - - 627 627 Financial assets at fair value through profit or loss - - - 101,921,821 101,921,821
Subscriptions receivable - - - 16,720 16,720 Dividends receivable - - - 26,944 26,944 Other assets - - - 29,118 29,118 Total assets 78,930,369 - - 101,995,230 180,925,599
Liabilit ies:Balances due to brokers 10,866,254 - - - 10,866,254 Due to brokers - - - 20,786,024 20,786,024 Financial liabilities at fair value through profit or loss - - - 3,466,996 3,466,996
Redemptions payable - - - 18,206 18,206 Performance fees payable - - - 9,227 9,227 Management fees payable - - - 273,888 273,888 Interest payable - - - 794 794 Dividend payable - - - 37,995 37,995 Accrued expenses and other liabilities - - - 301,168 301,168 Total liabilit ies (excluding net assets attributable to Redeemable Participating Shareholders) 10,866,254 - - 24,894,298 35,760,552
Net Assets attributable to Redeemable Participating Shareholders 68,064,115 - - 77,100,932 145,165,047
31 December 2015AssetsCash and cash equivalents 60,068,287 - - - 60,068,287 Balances with brokers 30,830,814 - - - 30,830,814 Due from brokers - - - 3,565,437 3,565,437 Financial assets at fair value through profit or loss
- - - 385,427,470 385,427,470
Dividends receivable - - - 156,104 156,104 Total assets 90,899,101 - - 389,149,011 480,048,112
Liabilit ies:Balances due to brokers 5,479,395 - - - 5,479,395 Financial liabilities at fair value through profit or loss - - - 23,392,318 23,392,318
Performance fees payable - - - 4,030 4,030 Management fees payable - - - 529,147 529,147 Interest payable - - - 9,732 9,732 Dividend payable - - - 80,555 80,555 Accrued expenses and other liabilities - - - 399,340 399,340 Total liabilit ies (excluding net assets attributable to Redeemable Participating Shareholders) 5,479,395 - - 24,415,122 29,894,517
Net Assets attributable to Redeemable Participating Shareholders 85,419,706 - - 364,733,889 450,153,595
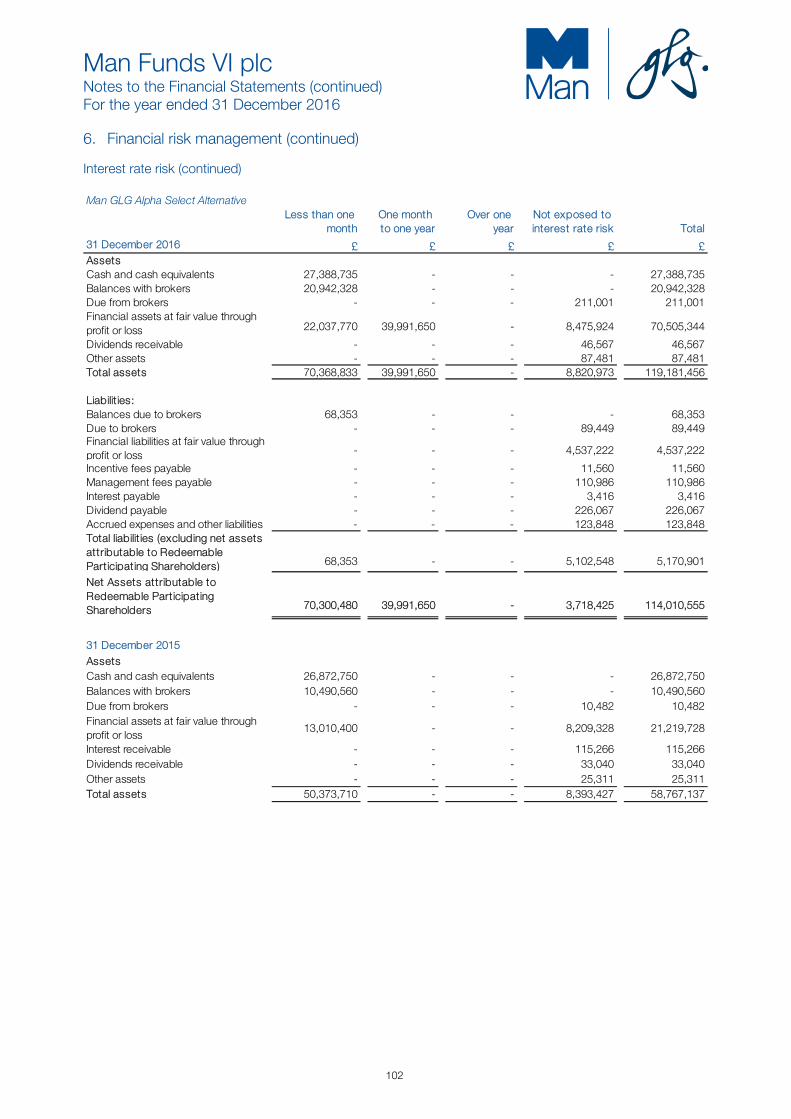
Man Funds VI plc Notes to the Financial Statements (continued) For the year ended 31 December 2016
102
6. Financial risk management (continued)
Interest rate risk (continued)
Man GLG Alpha Select AlternativeLess than one
monthOne month to one year
Over one year
Not exposed to interest rate risk Total
31 December 2016 £ £ £ £ £AssetsCash and cash equivalents 27,388,735 - - - 27,388,735 Balances with brokers 20,942,328 - - - 20,942,328 Due from brokers - - - 211,001 211,001 Financial assets at fair value through profit or loss 22,037,770 39,991,650 - 8,475,924 70,505,344
Dividends receivable - - - 46,567 46,567 Other assets - - - 87,481 87,481 Total assets 70,368,833 39,991,650 - 8,820,973 119,181,456
Liabilit ies:Balances due to brokers 68,353 - - - 68,353 Due to brokers - - - 89,449 89,449 Financial liabilities at fair value through profit or loss - - - 4,537,222 4,537,222
Incentive fees payable - - - 11,560 11,560 Management fees payable - - - 110,986 110,986 Interest payable - - - 3,416 3,416 Dividend payable - - - 226,067 226,067 Accrued expenses and other liabilities - - - 123,848 123,848 Total liabilit ies (excluding net assets attributable to Redeemable Participating Shareholders) 68,353 - - 5,102,548 5,170,901
Net Assets attributable to Redeemable Participating Shareholders 70,300,480 39,991,650 - 3,718,425 114,010,555
31 December 2015AssetsCash and cash equivalents 26,872,750 - - - 26,872,750 Balances with brokers 10,490,560 - - - 10,490,560 Due from brokers - - - 10,482 10,482 Financial assets at fair value through profit or loss
13,010,400 - - 8,209,328 21,219,728
Interest receivable - - - 115,266 115,266 Dividends receivable - - - 33,040 33,040 Other assets - - - 25,311 25,311 Total assets 50,373,710 - - 8,393,427 58,767,137
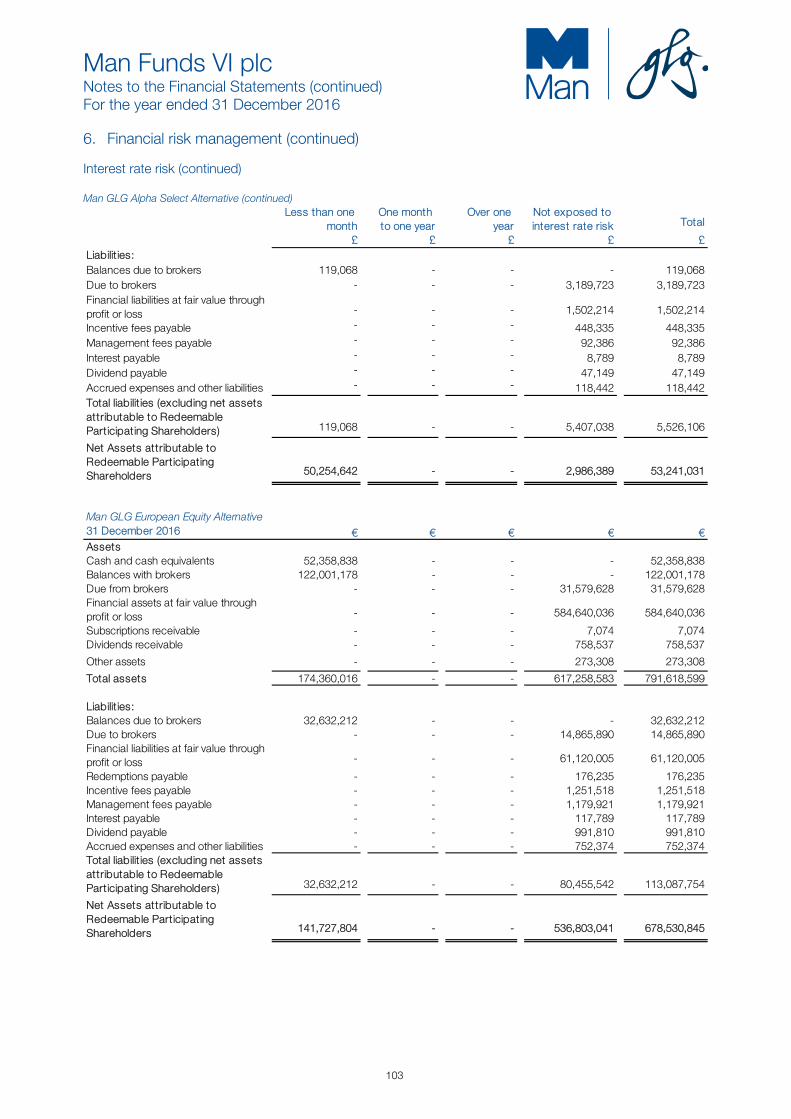
Man Funds VI plc Notes to the Financial Statements (continued) For the year ended 31 December 2016
103
6. Financial risk management (continued)
Interest rate risk (continued) Man GLG Alpha Select Alternative (continued)
Less than one month
One month to one year
Over one year
Not exposed to interest rate risk Total
£ £ £ £ £Liabilit ies:Balances due to brokers 119,068 - - - 119,068 Due to brokers - - - 3,189,723 3,189,723 Financial liabilities at fair value through profit or loss - - - 1,502,214 1,502,214
Incentive fees payable - - - 448,335 448,335 Management fees payable - - - 92,386 92,386 Interest payable - - - 8,789 8,789 Dividend payable - - - 47,149 47,149 Accrued expenses and other liabilities - - - 118,442 118,442 Total liabilit ies (excluding net assets attributable to Redeemable Participating Shareholders) 119,068 - - 5,407,038 5,526,106
Net Assets attributable to Redeemable Participating Shareholders 50,254,642 - - 2,986,389 53,241,031
Man GLG European Equity Alternative31 December 2016 € € € € €AssetsCash and cash equivalents 52,358,838 - - - 52,358,838 Balances with brokers 122,001,178 - - - 122,001,178 Due from brokers - - - 31,579,628 31,579,628 Financial assets at fair value through profit or loss - - - 584,640,036 584,640,036
Subscriptions receivable - - - 7,074 7,074 Dividends receivable - - - 758,537 758,537
Other assets - - - 273,308 273,308
Total assets 174,360,016 - - 617,258,583 791,618,599
Liabilit ies:Balances due to brokers 32,632,212 - - - 32,632,212 Due to brokers - - - 14,865,890 14,865,890 Financial liabilities at fair value through profit or loss - - - 61,120,005 61,120,005
Redemptions payable - - - 176,235 176,235 Incentive fees payable - - - 1,251,518 1,251,518 Management fees payable - - - 1,179,921 1,179,921 Interest payable - - - 117,789 117,789 Dividend payable - - - 991,810 991,810 Accrued expenses and other liabilities - - - 752,374 752,374 Total liabilit ies (excluding net assets attributable to Redeemable Participating Shareholders) 32,632,212 - - 80,455,542 113,087,754
Net Assets attributable to Redeemable Participating Shareholders 141,727,804 - - 536,803,041 678,530,845

Man Funds VI plc Notes to the Financial Statements (continued) For the year ended 31 December 2016
104
6. Financial risk management (continued)
Interest rate risk (continued) Man GLG European Equity Alternative (continued)
Less than one month
One month to one year
Over one year
Not exposed to interest rate risk Total
31 December 2015 € € € € €AssetsCash and cash equivalents 55,255,466 - - - 55,255,466 Balances with brokers 220,019,827 - - - 220,019,827 Due from brokers - - - 6,476,325 6,476,325 Financial assets at fair value through profit or loss
- - - 634,143,420 634,143,420
Dividends receivable - - - 767,651 767,651 Total assets 275,275,293 - - 641,387,396 916,662,689
Liabilit ies:Balances due to brokers 36,476,900 - - - 36,476,900 Due to brokers - - - 10,780,967 10,780,967 Financial liabilities at fair value through profit or loss - - - 34,297,429 34,297,429
Incentive fees payable - - - 1,814,502 1,814,502 Management fees payable - - - 1,512,905 1,512,905 Interest payable - - - 193,365 193,365 Dividend payable - - - 455,092 455,092 Accrued expenses and other liabilities - - - 492,391 492,391 Total liabilit ies (excluding net assets attributable to Redeemable Participating Shareholders) 36,476,900 - - 49,546,651 86,023,551
Net Assets attributable to Redeemable Participating Shareholders 238,798,393 - - 591,840,745 830,639,138
Man GLG Total Return31 December 2016 £ £ £ £ £AssetsCash and cash equivalents 30,117 - - - 30,117 Other assets - - - 1,913 1,913 Total assets 30,117 - - 1,913 32,030
Liabilit ies:Balances due to brokers 15,757 - - - 15,757 Management fees payable - - - 3,920 3,920 Accrued expenses and other liabilities - - - 12,353 12,353 Total liabilit ies (excluding net assets attributable to Redeemable Participating Shareholders 15,757 - - 16,273 32,030
Net Assets attributable to Redeemable Participating Shareholders 14,360 - - (14,360) -

Man Funds VI plc Notes to the Financial Statements (continued) For the year ended 31 December 2016
105
6. Financial risk management (continued)
Interest rate risk (continued) Man GLG Total Return (continued)
Less than one month
One month to one year
Over one year
Not exposed to interest rate risk Total
31 December 2015 £ £ £ £ £AssetsCash and cash equivalents 2,721,958 - - - 2,721,958 Balances with brokers 594,995 - - - 594,995 Due from brokers - - - 168,676 168,676 Financial assets at fair value through profit or loss - - 14,091 35,411 49,502
Interest receivable - - - 14 14 Other assets - - - 8,109 8,109 Total assets 3,316,953 - 14,091 212,210 3,543,254
Liabilit ies:Balances due to brokers 300,847 - - - 300,847 Financial liabilities at fair value through profit or loss - - - 6,518 6,518
Accrued expenses and other liabilities - - - 45,061 45,061 Total liabilit ies (excluding net assets attributable to Redeemable Participating Shareholders) 300,847 - - 51,579 352,426
Net Assets attributable to Redeemable Participating Shareholders
3,016,106 - 14,091 160,631 3,190,828
Man GLG Global Equity Alternative
31 December 2016 € € € € €
AssetsCash and cash equivalents 11,789,555 - - - 11,789,555 Balances with brokers 62,821,584 - - - 62,821,584 Due from brokers - - - 2,980,605 2,980,605 Financial assets at fair value through profit or loss - - - 143,802,941 143,802,941
Dividends receivable - - - 218,983 218,983 Other assets - - - 246,899 246,899 Total assets 74,611,139 - - 147,249,428 221,860,567
Liabilit ies:Balances due to brokers 11,113,899 - - - 11,113,899 Due to brokers - - - 4,058,683 4,058,683 Financial liabilities at fair value through profit or loss - - - 16,254,455 16,254,455
Redemptions payable - - - 1,895 1,895 Incentive fees payable - - - 76,529 76,529 Management fees payable - - - 335,855 335,855 Interest payable - - - 21,136 21,136 Dividend payable - - - 264,040 264,040 Accrued expenses and other liabilities - - - 535,804 535,804 Total liabilit ies (excluding net assets attributable to Redeemable Participating Shareholders) 11,113,899 - - 21,548,397 32,662,296
Net Assets attributable to Redeemable Participating Shareholders
63,497,240 - - 125,701,031 189,198,271
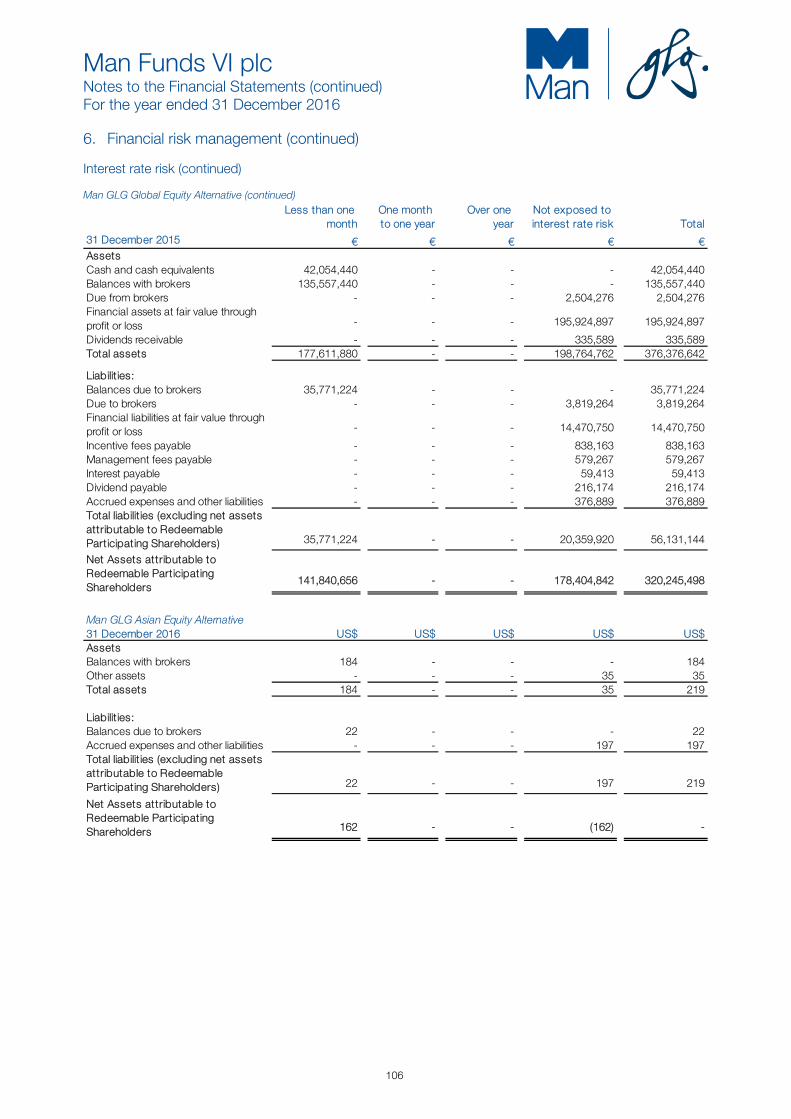
Man Funds VI plc Notes to the Financial Statements (continued) For the year ended 31 December 2016
106
6. Financial risk management (continued)
Interest rate risk (continued) Man GLG Global Equity Alternative (continued)
Less than one month
One month to one year
Over one year
Not exposed to interest rate risk Total
31 December 2015 € € € € €AssetsCash and cash equivalents 42,054,440 - - - 42,054,440 Balances with brokers 135,557,440 - - - 135,557,440 Due from brokers - - - 2,504,276 2,504,276 Financial assets at fair value through profit or loss - - - 195,924,897 195,924,897
Dividends receivable - - - 335,589 335,589 Total assets 177,611,880 - - 198,764,762 376,376,642
Liabilit ies:Balances due to brokers 35,771,224 - - - 35,771,224 Due to brokers - - - 3,819,264 3,819,264 Financial liabilities at fair value through profit or loss - - - 14,470,750 14,470,750
Incentive fees payable - - - 838,163 838,163 Management fees payable - - - 579,267 579,267 Interest payable - - - 59,413 59,413 Dividend payable - - - 216,174 216,174 Accrued expenses and other liabilities - - - 376,889 376,889 Total liabilit ies (excluding net assets attributable to Redeemable Participating Shareholders) 35,771,224 - - 20,359,920 56,131,144
Net Assets attributable to Redeemable Participating Shareholders
141,840,656 - - 178,404,842 320,245,498
Man GLG Asian Equity Alternative31 December 2016 US$ US$ US$ US$ US$AssetsBalances with brokers 184 - - - 184 Other assets - - - 35 35 Total assets 184 - - 35 219
Liabilit ies:Balances due to brokers 22 - - - 22 Accrued expenses and other liabilities - - - 197 197 Total liabilit ies (excluding net assets attributable to Redeemable Participating Shareholders) 22 - - 197 219
Net Assets attributable to Redeemable Participating Shareholders 162 - - (162) -
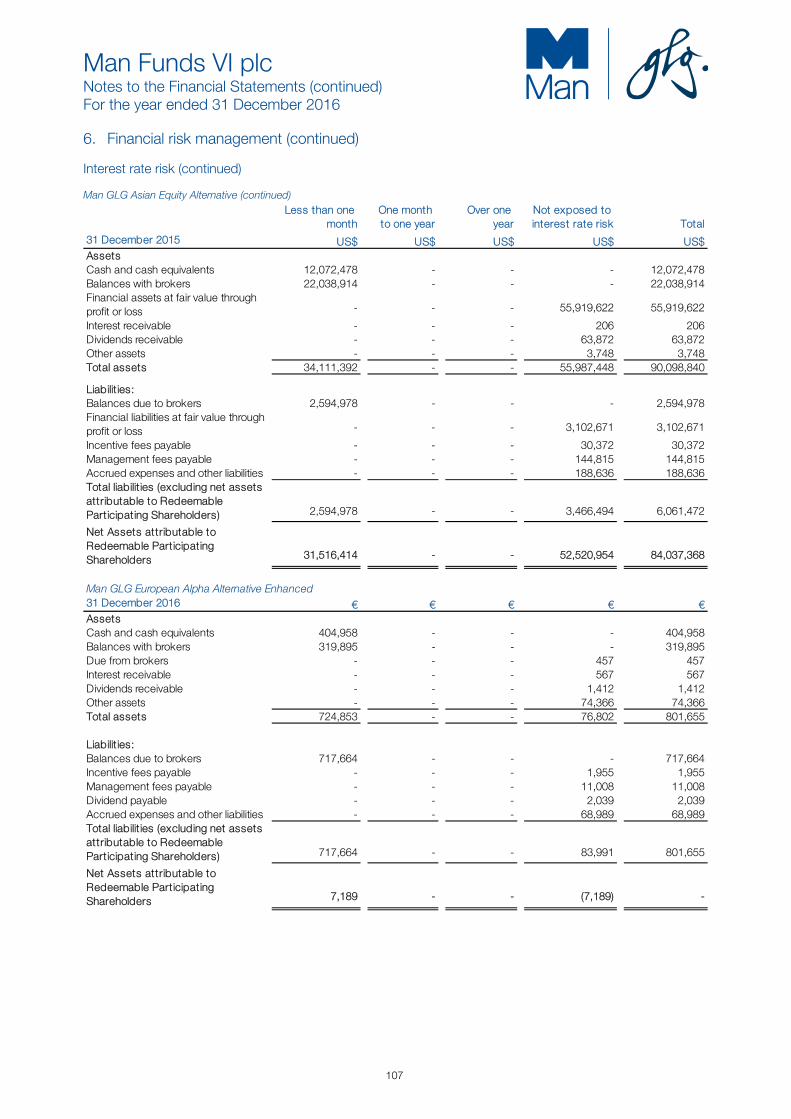
Man Funds VI plc Notes to the Financial Statements (continued) For the year ended 31 December 2016
107
6. Financial risk management (continued)
Interest rate risk (continued) Man GLG Asian Equity Alternative (continued)
Less than one month
One month to one year
Over one year
Not exposed to interest rate risk Total
31 December 2015 US$ US$ US$ US$ US$AssetsCash and cash equivalents 12,072,478 - - - 12,072,478 Balances with brokers 22,038,914 - - - 22,038,914 Financial assets at fair value through profit or loss - - - 55,919,622 55,919,622
Interest receivable - - - 206 206 Dividends receivable - - - 63,872 63,872 Other assets - - - 3,748 3,748 Total assets 34,111,392 - - 55,987,448 90,098,840
Liabilit ies:Balances due to brokers 2,594,978 - - - 2,594,978 Financial liabilities at fair value through profit or loss - - - 3,102,671 3,102,671
Incentive fees payable - - - 30,372 30,372 Management fees payable - - - 144,815 144,815 Accrued expenses and other liabilities - - - 188,636 188,636 Total liabilit ies (excluding net assets attributable to Redeemable Participating Shareholders) 2,594,978 - - 3,466,494 6,061,472
Net Assets attributable to Redeemable Participating Shareholders 31,516,414 - - 52,520,954 84,037,368
Man GLG European Alpha Alternative Enhanced31 December 2016 € € € € €AssetsCash and cash equivalents 404,958 - - - 404,958 Balances with brokers 319,895 - - - 319,895 Due from brokers - - - 457 457 Interest receivable - - - 567 567 Dividends receivable - - - 1,412 1,412 Other assets - - - 74,366 74,366 Total assets 724,853 - - 76,802 801,655
Liabilit ies:Balances due to brokers 717,664 - - - 717,664 Incentive fees payable - - - 1,955 1,955 Management fees payable - - - 11,008 11,008 Dividend payable - - - 2,039 2,039 Accrued expenses and other liabilities - - - 68,989 68,989 Total liabilit ies (excluding net assets attributable to Redeemable Participating Shareholders) 717,664 - - 83,991 801,655
Net Assets attributable to Redeemable Participating Shareholders 7,189 - - (7,189) -

Man Funds VI plc Notes to the Financial Statements (continued) For the year ended 31 December 2016
108
6. Financial risk management (continued)
Interest rate risk (continued) Man GLG European Alpha Alternative Enhanced (continued)
Less than one month
One month to one year
Over one year
Not exposed to interest rate risk Total
31 December 2015 € € € € €AssetsCash and cash equivalents 8,741,205 - - - 8,741,205 Balances with brokers 3,435,923 - - - 3,435,923 Due from brokers - - - 433,973 433,973 Financial assets at fair value through profit or loss
- - - 22,989,210 22,989,210
Dividends receivable - - - 21,741 21,741 Other assets - - - 159 159 Total assets 12,177,128 - - 23,445,083 35,622,211
Liabilit ies:Balances due to brokers 5,718,629 - - - 5,718,629 Due to brokers - - - 7,902 7,902 Financial liabilities at fair value through profit or loss - - - 1,714,673 1,714,673
Management fees payable - - - 52,835 52,835 Interest payable - - - 657 657 Dividend payable - - - 10,322 10,322 Accrued expenses and other liabilities - - - 63,621 63,621 Total liabilit ies (excluding net assets attributable to Redeemable Participating Shareholders) 5,718,629 - - 1,850,010 7,568,639
Net Assets attributable to Redeemable Participating Shareholders
6,458,499 - - 21,595,073 28,053,572
Man GLG Cred-Eq Alternative
31 December 2016AssetsCash and cash equivalents 6,091,258 - - - 6,091,258 Balances with brokers 5,768,188 - - - 5,768,188 Due from brokers - - - - - Financial assets at fair value through profit or loss
- - 16,473,788 19,186,115 35,659,903
Interest receivable - - - 88,664 88,664 Dividends receivable - - - - - Other assets - - - 93,077 93,077 Total assets 11,859,446 - 16,473,788 19,367,856 47,701,090
Liabilit ies:Balances due to brokers 1,877 - - - 1,877 Financial liabilities at fair value through profit or loss - - - 1,596,449 1,596,449
Redemptions payable - - - 1,293 1,293 Incentive fees payable - - - 19,032 19,032 Management fees payable - - - 33,082 33,082 Accrued expenses and other liabilities - - - 116,402 116,402 Total liabilit ies (excluding net assets attributable to Redeemable Participating Shareholders) 1,877 - - 1,766,258 1,768,135
Net Assets attributable to Redeemable Participating Shareholders 11,857,569 - 16,473,788 17,601,598 45,932,955

Man Funds VI plc Notes to the Financial Statements (continued) For the year ended 31 December 2016
109
6. Financial risk management (continued)
Interest rate risk (continued)
Man GLG Cred-Eq Alternative (continued)
Less than one month
One month to one year
Over one year
Not exposed to interest rate risk Total
31 December 2015 € € € € €AssetsCash and cash equivalents 8,964,265 - - - 8,964,265 Balances with brokers 15,677,590 - - - 15,677,590 Financial assets at fair value through profit or loss
- 3,216,910 47,542,006 10,507,479 61,266,395
Interest receivable - - - 248,644 248,644 Other assets - - - 3,015 3,015 Total assets 24,641,855 3,216,910 47,542,006 10,759,138 86,159,909
Liabilit ies:Balances due to brokers 1,616,265 - - - 1,616,265 Financial liabilities at fair value through profit or loss - - - 7,182,837 7,182,837
Incentive fees payable - - - 2,686 2,686 Management fees payable - - - 149,326 149,326 Accrued expenses and other liabilities - - - 102,626 102,626 Total liabilit ies (excluding net assets attributable to Redeemable Participating Shareholders) 1,616,265 - - 7,437,475 9,053,740
Net Assets attributable to Redeemable Participating Shareholders 23,025,590 3,216,910 47,542,006 3,321,663 77,106,169
Man AHL Multi Strategy Alternative31 December 2016 US$ US$ US$ US$ US$AssetsCash and cash equivalents 43,983,530 - - - 43,983,530 Balances with brokers 45,706,014 - - - 45,706,014 Due from brokers - - - 86,778 86,778 Financial assets at fair value through profit or loss 27,494,725 12,010,672 53,653 13,255,308 52,814,358
Interest receivable - - - 368 368 Dividends receivable - - - 105,024 105,024 Other assets - - - 529,417 529,417 Total assets 117,184,269 12,010,672 53,653 13,976,895 143,225,489
Liabilit ies:Balances due to brokers 2,874,506 - - - 2,874,506 Due to brokers - - - 83,930 83,930 Financial liabilities at fair value through profit or loss - 19,243 16,270 11,037,923 11,073,436
Incentive fees payable - - - 869 869 Management fees payable - - - 253,301 253,301 Dividend payable - - - 98,588 98,588 Accrued expenses and other liabilities - - - 806,646 806,646 Total liabilit ies (excluding net assets attributable to Redeemable Participating Shareholders) 2,874,506 19,243 16,270 12,281,257 15,191,276
Net Assets attributable to Redeemable Participating Shareholders 114,309,763 11,991,429 37,383 1,695,638 128,034,213

Man Funds VI plc Notes to the Financial Statements (continued) For the year ended 31 December 2016
110
6. Financial risk management (continued)
Interest rate risk (continued)
Man GLG Multi Strategy Alternative (continued)
Less than one month
One month to one year
Over one year
Not exposed to interest rate risk
Total
31 December 2015 US$ US$ US$ US$ US$AssetsCash and cash equivalents 33,699,769 - - - 33,699,769 Balances with brokers 50,571,360 - - - 50,571,360 Due from brokers - - - 55,699 55,699 Financial assets at fair value through profit or loss
23,998,325 36,996,350 - 9,516,390 70,511,065
Interest receivable - - - 170 170 Dividends receivable - - - 31,349 31,349 Other assets - - - 4,353 4,353 Total assets 108,269,454 36,996,350 - 9,607,961 154,873,765
Liabilit ies:Balances due to brokers 929,316 - - - 929,316 Due to brokers - - - 90,245 90,245 Financial liabilities at fair value through profit or loss - - - 9,410,692 9,410,692
Management fees payable - - - 274,603 274,603 Dividend payable - - - 11,964 11,964 Accrued expenses and other liabilities - - - 121,051 121,051 Total liabilit ies (excluding net assets attributable to Redeemable Participating Shareholders) 929,316 - - 9,908,555 10,837,871
Net Assets attributable to Redeemable Participating Shareholders 107,340,138 36,996,350 - (300,594) 144,035,894
Man AHL Directional Equities Alternative
31 December 2016AssetsCash and cash equivalents 5,676 - - - 5,676 Balances with brokers 672 - - - 672 Other assets - - - 3,763 3,763 Total assets 6,348 - - 3,763 10,111
Liabilit ies:Balances due to brokers 4,748 - - - 4,748 Accrued expenses and other liabilities - - - 5,363 5,363 Total liabilit ies (excluding net assets attributable to Redeemable Participating Shareholders) 4,748 - - 5,363 10,111
Net Assets attributable to Redeemable Participating Shareholders 1,600 - - (1,600) -

Man Funds VI plc Notes to the Financial Statements (continued) For the year ended 31 December 2016
111
6. Financial risk management (continued)
Interest rate risk (continued)
Man AHL Directional Equities Alternative (continued)
Less than one month
One month to one year
Over one year
Not exposed to interest rate risk Total
31 December 2015 US$ US$ US$ US$ US$AssetsCash and cash equivalents 11,929,857 - - - 11,929,857 Balances with brokers 8,477,910 - - - 8,477,910 Due from brokers - - - 74,476 74,476 Financial assets at fair value through profit or loss
- 19,498,445 - 2,193,105 21,691,550
Interest receivable - - - 56 56 Dividends receivable - - - 24,621 24,621 Other assets - - - 6,561 6,561 Total assets 20,407,767 19,498,445 - 2,298,819 42,205,031
Liabilit ies:Balances due to brokers 179,328 - - - 179,328 Due to brokers - - - 62,786 62,786 Financial liabilities at fair value through profit or loss - - - 1,354,113 1,354,113
Management fees payable - - - 40,495 40,495 Interest payable - - - 4,201 4,201 Dividend payable - - - 35,925 35,925 Accrued expenses and other liabilities - - - 67,779 67,779 Total liabilit ies (excluding net assets attributable to Redeemable Participating Shareholders) 179,328 - - 1,565,299 1,744,627
Net Assets attributable to Redeemable Participating Shareholders 20,228,439 19,498,445 - 733,520 40,460,404
Man AHL TargetRisk31 December 2016AssetsCash and cash equivalents 2,996,243 - - - 2,996,243 Balances with brokers 4,631,979 - - - 4,631,979 Financial assets at fair value through profit or loss 399,943 499,786 20,023,828 1,115,391 22,038,948
Interest receivable - - - 25,899 25,899 Other assets - - - 171,973 171,973 Total assets 8,028,165 499,786 20,023,828 1,313,263 29,865,042
Liabilit ies:Balances due to brokers 1,360,446 - - - 1,360,446 Financial liabilities at fair value through profit or loss - - - 157,200 157,200
Management fees payable - - - 17,128 17,128 Accrued expenses and other liabilities - - - 33,291 33,291 Total liabilit ies (excluding net assets attributable to Redeemable Participating Shareholders) 1,360,446 - - 207,619 1,568,065
Net Assets attributable to Redeemable Participating Shareholders 6,667,719 499,786 20,023,828 1,105,644 28,296,977

Man Funds VI plc Notes to the Financial Statements (continued) For the year ended 31 December 2016
112
6. Financial risk management (continued)
Interest rate risk (continued)
Man AHL TargetRisk (continued)
Less than one month
One month to one year
Over one year
Not exposed to interest rate risk Total
31 December 2015 US$ US$ US$ US$ US$
AssetsCash and cash equivalents 5,150,965 - - - 5,150,965 Balances with brokers 5,313,636 - - - 5,313,636 Financial assets at fair value through profit or loss 2,999,820 2,999,685 9,792,331 522,848 16,314,684
Interest receivable - - - 16,339 16,339 Other assets - - - 61,971 61,971 Total assets 13,464,421 2,999,685 9,792,331 601,158 26,857,595
Liabilit ies:Balances due to brokers 51,293 - - - 51,293 Financial liabilities at fair value through profit or loss - - - 104,879 104,879
Management fees payable - - - 17,009 17,009 Accrued expenses and other liabilities - - - 27,817 27,817 Total liabilit ies (excluding net assets attributable to Redeemable Participating Shareholders) 51,293 - - 149,705 200,998
Net Assets attributable to Redeemable Participating Shareholders 13,413,128 2,999,685 9,792,331 451,453 26,656,597
Man AHL Volatility Alternative
31 December 2016AssetsCash and cash equivalents 9,336,447 - - - 9,336,447 Balances with brokers 3,828,363 - - - 3,828,363 Financial assets at fair value through profit or loss 1,399,688 2,898,794 - 132,899 4,431,381
Interest receivable - - - 100 100 Other assets - - - 39,727 39,727 Total assets 14,564,498 2,898,794 - 172,726 17,636,018
Liabilit ies:Balances due to brokers 185,534 - - - 185,534 Financial liabilities at fair value through profit or loss - - - 437,756 437,756
Incentive fees payable - - - 23,569 23,569 Management fees payable - - - 20,856 20,856 Accrued expenses and other liabilities - - - 80,814 80,814 Total liabilit ies (excluding net assets attributable to Redeemable Participating Shareholders) 185,534 - - 562,995 748,529
Net Assets attributable to Redeemable Participating Shareholders 14,378,964 2,898,794 - (390,269) 16,887,489

Man Funds VI plc Notes to the Financial Statements (continued) For the year ended 31 December 2016
113
6. Financial risk management (continued)
Interest rate risk (continued)
Man AHL Volatility Alternative (continued)
Less than one month
One month to one year
Over one year
Not exposed to interest rate risk Total
31 December 2015 US$ US$ US$ US$ US$AssetsCash and cash equivalents 16,795,409 - - - 16,795,409 Balances with brokers 16,497,359 - - - 16,497,359 Due from brokers - - - 637 637 Financial assets at fair value through profit or loss
2,999,763 13,098,527 - 1,003,515 17,101,805
Interest receivable - - - 83 83 Other assets - - - 64,286 64,286 Total assets 36,292,531 13,098,527 - 1,068,521 50,459,579
Liabilit ies:Balances due to brokers 8 - - - 8 Financial liabilities at fair value through profit or loss - - - 2,380,870 2,380,870
Incentive fees payable - - - 244 244 Management fees payable - - - 38,912 38,912 Accrued expenses and other liabilities - - - 56,294 56,294 Total liabilit ies (excluding net assets attributable to Redeemable Participating Shareholders) 8 - - 2,476,320 2,476,328
Net Assets attributable to Redeemable Participating Shareholders 36,292,523 13,098,527 - (1,407,799) 47,983,251
Man GLG European Mid-Cap Equity Alternative31 December 2016 € € € € €AssetsCash and cash equivalents 12,063,959 - - - 12,063,959 Balances with brokers 26,715,409 - - - 26,715,409 Financial assets at fair value through profit or loss - - - 327,772,115 327,772,115
Subscriptions receivable - - - 8,168 8,168 Dividends receivable - - - 106,117 106,117 Other assets - - - 61,142 61,142 Total assets 38,779,368 - - 327,947,542 366,726,910
Liabilit ies:Balances due to brokers 11,573,590 - - - 11,573,590 Financial liabilities at fair value through profit or loss - - - 20,614,640 20,614,640
Redemptipons payable - - - 4,878 4,878 Incentive fees payable - - - 1,504,878 1,504,878 Management fees payable - - - 289,261 289,261 Interest payable - - - 110,963 110,963 Dividend payable - - - 224,008 224,008 Accrued expenses and other liabilities - - - 226,847 226,847 Total liabilit ies (excluding net assets attributable to Redeemable Participating Shareholders) 11,573,590 - - 22,975,475 34,549,065
Net Assets attributable to Redeemable Participating Shareholders 27,205,778 - - 304,972,067 332,177,845

Man Funds VI plc Notes to the Financial Statements (continued) For the year ended 31 December 2016
114
6. Financial risk management (continued)
Interest rate risk (continued)
Man GLG European Mid-Cap Equity Alternative (continued)
Less than one month
One month to one year
Over one year
Not exposed to interest rate risk Total
31 December 2015 € € € € €AssetsCash and cash equivalents 27,970,926 - - - 27,970,926 Balances with brokers 13,866,337 - - - 13,866,337 Due from brokers - - - 39,700 39,700 Financial assets at fair value through profit or loss
- - - 99,121,996 99,121,996
Dividends receivable - - - 79,557 79,557 Total assets 41,837,263 - - 99,241,253 141,078,516
Liabilit ies:Balances due to brokers 8,004,140 - - - 8,004,140 Due to brokers - - - 697,246 697,246 Financial liabilities at fair value through profit or loss - - - 4,927,093 4,927,093
Performance fees payable - - - 454,543 454,543 Management fees payable - - - 133,300 133,300 Dividend payable - - - 16,549 16,549 Accrued expenses and other liabilities - - - 64,237 64,237 Total liabilit ies (excluding net assets attributable to Redeemable Participating Shareholders) 8,004,140 - - 6,292,968 14,297,108
Net Assets attributable to Redeemable Participating Shareholders 33,833,123 - - 92,948,285 126,781,408
Man Numeric Market Neutral Alternative
31 December 2016 US$ US$ US$ US$ US$AssetsCash and cash equivalents 21,087,866 - - - 21,087,866 Balances with brokers 2,751,940 - - - 2,751,940 Due from brokers - - - 21,142,418 21,142,418 Financial assets at fair value through profit or loss
- - - 167,017,788 167,017,788
Subscriptions receivable - - - 191,867 191,867 Interest receivable - - - 52,928 52,928 Other assets - - - 23,373 23,373 Total assets 23,839,806 - - 188,428,374 212,268,180
Liabilit ies:Balances due to brokers 4,279,426 - - - 4,279,426 Due to brokers - - - 32,582,718 32,582,718 Financial liabilities at fair value through profit or loss - - - 4,794,032 4,794,032
Incentive fees payable - - - 875,644 875,644 Management fees payable - - - 157,736 157,736 Interest payable - - - 34,756 34,756 Accrued expenses and other liabilities - - - 88,676 88,676 Total liabilit ies (excluding net assets attributable to Redeemable Participating Shareholders) 4,279,426 - - 38,533,562 42,812,988
Net Assets attributable to Redeemable Participating Shareholders 19,560,380 - - 149,894,812 169,455,192
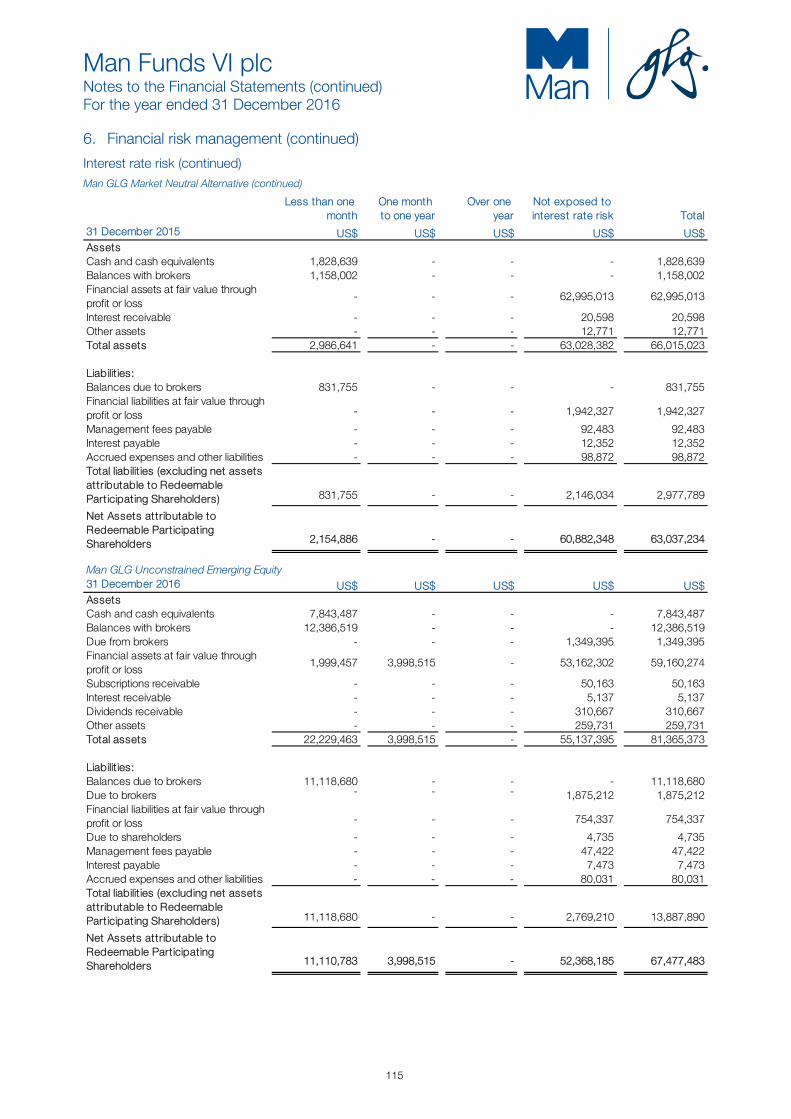
Man Funds VI plc Notes to the Financial Statements (continued) For the year ended 31 December 2016
115
6. Financial risk management (continued)
Interest rate risk (continued)
Man GLG Market Neutral Alternative (continued)
Less than one month
One month to one year
Over one year
Not exposed to interest rate risk Total
31 December 2015 US$ US$ US$ US$ US$AssetsCash and cash equivalents 1,828,639 - - - 1,828,639 Balances with brokers 1,158,002 - - - 1,158,002 Financial assets at fair value through profit or loss
- - - 62,995,013 62,995,013
Interest receivable - - - 20,598 20,598 Other assets - - - 12,771 12,771 Total assets 2,986,641 - - 63,028,382 66,015,023
Liabilit ies:Balances due to brokers 831,755 - - - 831,755 Financial liabilities at fair value through profit or loss - - - 1,942,327 1,942,327
Management fees payable - - - 92,483 92,483 Interest payable - - - 12,352 12,352 Accrued expenses and other liabilities - - - 98,872 98,872 Total liabilit ies (excluding net assets attributable to Redeemable Participating Shareholders) 831,755 - - 2,146,034 2,977,789
Net Assets attributable to Redeemable Participating Shareholders 2,154,886 - - 60,882,348 63,037,234
Man GLG Unconstrained Emerging Equity31 December 2016 US$ US$ US$ US$ US$AssetsCash and cash equivalents 7,843,487 - - - 7,843,487 Balances with brokers 12,386,519 - - - 12,386,519 Due from brokers - - - 1,349,395 1,349,395 Financial assets at fair value through profit or loss
1,999,457 3,998,515 - 53,162,302 59,160,274
Subscriptions receivable - - - 50,163 50,163 Interest receivable - - - 5,137 5,137 Dividends receivable - - - 310,667 310,667 Other assets - - - 259,731 259,731 Total assets 22,229,463 3,998,515 - 55,137,395 81,365,373
Liabilit ies:Balances due to brokers 11,118,680 - - - 11,118,680 Due to brokers - - - 1,875,212 1,875,212 Financial liabilities at fair value through profit or loss - - - 754,337 754,337
Due to shareholders - - - 4,735 4,735 Management fees payable - - - 47,422 47,422 Interest payable - - - 7,473 7,473 Accrued expenses and other liabilities - - - 80,031 80,031 Total liabilit ies (excluding net assets attributable to Redeemable Participating Shareholders) 11,118,680 - - 2,769,210 13,887,890
Net Assets attributable to Redeemable Participating Shareholders 11,110,783 3,998,515 - 52,368,185 67,477,483

Man Funds VI plc Notes to the Financial Statements (continued) For the year ended 31 December 2016
116
6. Financial risk management (continued)
Interest rate risk (continued)
Man GLG Unconstrained Emerging Equity (continued)
Less than one month
One month to one year
Over one year
Not exposed to interest rate risk Total
31 December 2015 US$ US$ US$ US$ US$AssetsCash and cash equivalents 11,871,342 - - - 11,871,342 Balances with brokers 19,022,101 - - - 19,022,101 Financial assets at fair value through profit or loss
- - - 24,884,084 24,884,084
Interest receivable - - - 4,250 4,250 Dividends receivable - - - 56,894 56,894 Other assets - - - 40,581 40,581 Total assets 30,893,443 - - 24,985,809 55,879,252
Liabilit ies:Balances due to brokers 12,086,700 - - - 12,086,700 Financial liabilities at fair value through profit or loss - - - 803,368 803,368
Management fees payable - - - 27,403 27,403 Interest payable - - - 7,210 7,210 Accrued expenses and other liabilities - - - 67,971 67,971 Total liabilit ies (excluding net assets attributable to Redeemable Participating Shareholders) 12,086,700 - - 905,952 12,992,652
Net Assets attributable to Redeemable Participating Shareholders 18,806,743 - - 24,079,857 42,886,600
Man GLG Global Emerging Markets Debt Total Return31 December 2016 US$ US$ US$ US$ US$AssetsCash and cash equivalents 16,365,831 - - - 16,365,831 Balances with brokers 31,265,968 - - - 31,265,968 Financial assets at fair value through profit or loss
17,997,407 58,325,800 387,333,209 24,417,863 488,074,279
Subscriptions receivable - - - 100,000 100,000 Interest receivable - - - 6,218,889 6,218,889 Other assets - - - 383,450 383,450 Total assets 65,629,206 58,325,800 387,333,209 31,120,202 542,408,417
Liabilit ies:Balances due to brokers 1,002 - - - 1,002 Financial liabilities at fair value through profit or loss - - - 18,957,197 18,957,197
Redemptions payable - - - 2,087 2,087 Due to shareholders - - - 6,662 6,662 Performance fees payable - - - 647,962 647,962 Management fees payable - - - 229,946 229,946 Interest payable - - - 25,825 25,825 Accrued expenses and other liabilities - - - 274,881 274,881 Total liabilit ies (excluding net assets attributable to Redeemable Participating Shareholders) 1,002 - - 20,144,560 20,145,562
Net Assets attributable to Redeemable Participating Shareholders 65,628,204 58,325,800 387,333,209 10,975,642 522,262,855
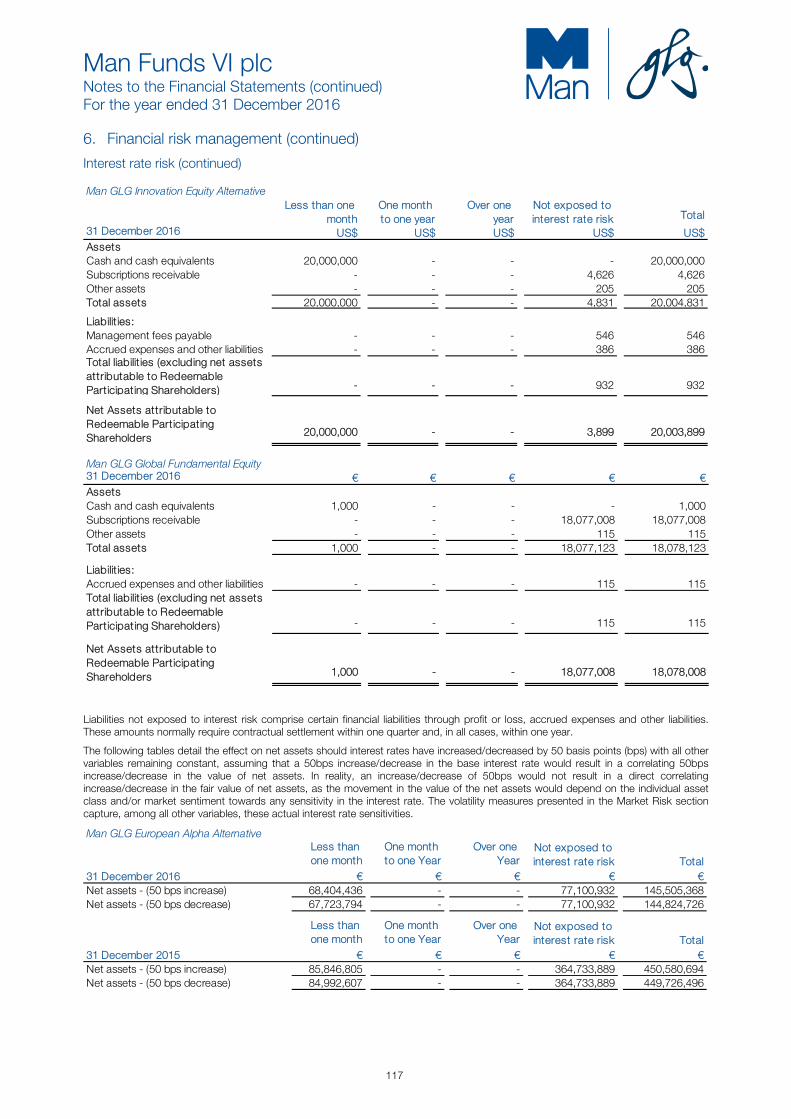
Man Funds VI plc Notes to the Financial Statements (continued) For the year ended 31 December 2016
117
6. Financial risk management (continued)
Interest rate risk (continued) Man GLG Innovation Equity Alternative
Less than one month
One month to one year
Over one year
Not exposed to interest rate risk Total
31 December 2016 US$ US$ US$ US$ US$AssetsCash and cash equivalents 20,000,000 - - - 20,000,000 Subscriptions receivable - - - 4,626 4,626 Other assets - - - 205 205 Total assets 20,000,000 - - 4,831 20,004,831
Liabilit ies:Management fees payable - - - 546 546 Accrued expenses and other liabilities - - - 386 386 Total liabilit ies (excluding net assets attributable to Redeemable Participating Shareholders) - - - 932 932
Net Assets attributable to Redeemable Participating Shareholders 20,000,000 - - 3,899 20,003,899
Man GLG Global Fundamental Equity31 December 2016 € € € € €AssetsCash and cash equivalents 1,000 - - - 1,000 Subscriptions receivable - - - 18,077,008 18,077,008 Other assets - - - 115 115 Total assets 1,000 - - 18,077,123 18,078,123
Liabilities:Accrued expenses and other liabilities - - - 115 115 Total liabilities (excluding net assets attributable to Redeemable Participating Shareholders) - - - 115 115
Net Assets attributable to Redeemable Participating Shareholders 1,000 - - 18,077,008 18,078,008
Liabilities not exposed to interest risk comprise certain financial liabilities through profit or loss, accrued expenses and other liabilities. These amounts normally require contractual settlement within one quarter and, in all cases, within one year.
The following tables detail the effect on net assets should interest rates have increased/decreased by 50 basis points (bps) with all other variables remaining constant, assuming that a 50bps increase/decrease in the base interest rate would result in a correlating 50bps increase/decrease in the value of net assets. In reality, an increase/decrease of 50bps would not result in a direct correlating increase/decrease in the fair value of net assets, as the movement in the value of the net assets would depend on the individual asset class and/or market sentiment towards any sensitivity in the interest rate. The volatility measures presented in the Market Risk section capture, among all other variables, these actual interest rate sensitivities.
Man GLG European Alpha AlternativeLess than one month
One month to one Year
Over one Year
Not exposed to interest rate risk Total
31 December 2016 € € € € €Net assets - (50 bps increase) 68,404,436 - - 77,100,932 145,505,368 Net assets - (50 bps decrease) 67,723,794 - - 77,100,932 144,824,726
Less than one month
One month to one Year
Over one Year
Not exposed to interest rate risk Total
31 December 2015 € € € € €Net assets - (50 bps increase) 85,846,805 - - 364,733,889 450,580,694 Net assets - (50 bps decrease) 84,992,607 - - 364,733,889 449,726,496
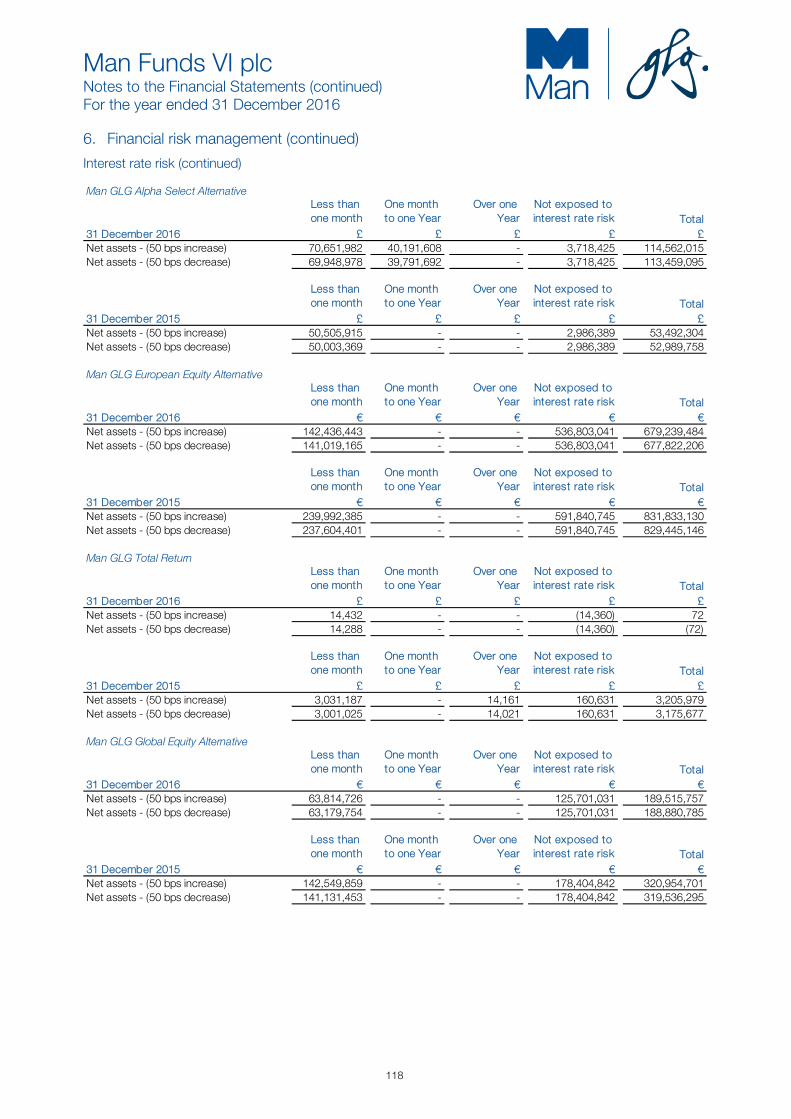
Man Funds VI plc Notes to the Financial Statements (continued) For the year ended 31 December 2016
118
6. Financial risk management (continued)
Interest rate risk (continued) Man GLG Alpha Select Alternative
Less than one month
One month to one Year
Over one Year
Not exposed to interest rate risk Total
31 December 2016 £ £ £ £ £Net assets - (50 bps increase) 70,651,982 40,191,608 - 3,718,425 114,562,015 Net assets - (50 bps decrease) 69,948,978 39,791,692 - 3,718,425 113,459,095
Less than one month
One month to one Year
Over one Year
Not exposed to interest rate risk Total
31 December 2015 £ £ £ £ £Net assets - (50 bps increase) 50,505,915 - - 2,986,389 53,492,304 Net assets - (50 bps decrease) 50,003,369 - - 2,986,389 52,989,758
Man GLG European Equity AlternativeLess than one month
One month to one Year
Over one Year
Not exposed to interest rate risk Total
31 December 2016 € € € € €Net assets - (50 bps increase) 142,436,443 - - 536,803,041 679,239,484 Net assets - (50 bps decrease) 141,019,165 - - 536,803,041 677,822,206
Less than one month
One month to one Year
Over one Year
Not exposed to interest rate risk Total
31 December 2015 € € € € €Net assets - (50 bps increase) 239,992,385 - - 591,840,745 831,833,130 Net assets - (50 bps decrease) 237,604,401 - - 591,840,745 829,445,146
Man GLG Total ReturnLess than one month
One month to one Year
Over one Year
Not exposed to interest rate risk Total
31 December 2016 £ £ £ £ £Net assets - (50 bps increase) 14,432 - - (14,360) 72 Net assets - (50 bps decrease) 14,288 - - (14,360) (72)
Less than one month
One month to one Year
Over one Year
Not exposed to interest rate risk Total
31 December 2015 £ £ £ £ £Net assets - (50 bps increase) 3,031,187 - 14,161 160,631 3,205,979 Net assets - (50 bps decrease) 3,001,025 - 14,021 160,631 3,175,677
Man GLG Global Equity AlternativeLess than one month
One month to one Year
Over one Year
Not exposed to interest rate risk Total
31 December 2016 € € € € €Net assets - (50 bps increase) 63,814,726 - - 125,701,031 189,515,757 Net assets - (50 bps decrease) 63,179,754 - - 125,701,031 188,880,785
Less than one month
One month to one Year
Over one Year
Not exposed to interest rate risk Total
31 December 2015 € € € € €Net assets - (50 bps increase) 142,549,859 - - 178,404,842 320,954,701 Net assets - (50 bps decrease) 141,131,453 - - 178,404,842 319,536,295

Man Funds VI plc Notes to the Financial Statements (continued) For the year ended 31 December 2016
119
6. Financial risk management (continued)
Interest rate risk (continued) Man GLG Asian Equity Alternative
Less than one month
One month to one Year
Over one Year
Not exposed to interest rate risk Total
31 December 2016 US$ US$ US$ US$ US$Net assets - (50 bps increase) 163 - - (162) 1 Net assets - (50 bps decrease) 161 - - (162) (1)
Less than one month
One month to one Year
Over one Year
Not exposed to interest rate risk Total
31 December 2015 US$ US$ US$ US$ US$Net assets - (50 bps increase) 31,673,996 - - 52,520,954 84,194,950 Net assets - (50 bps decrease) 31,358,832 - - 52,520,954 83,879,786
Man GLG European Alpha Alternative EnhancedLess than one month
One month to one Year
Over one Year
Not exposed to interest rate risk Total
31 December 2016 € € € € €Net assets - (50 bps increase) 7,225 - - (7,189) 36 Net assets - (50 bps decrease) 7,153 - - (7,189) (36)
Less than one month
One month to one Year
Over one Year
Not exposed to interest rate risk Total
31 December 2015 € € € € €Net assets - (50 bps increase) 6,490,791 - - 21,595,073 28,085,864 Net assets - (50 bps decrease) 6,426,207 - - 21,595,073 28,021,280
Man GLG Cred-Eq AlternativeLess than one month
One month to one Year
Over one Year
Not exposed to interest rate risk Total
31 December 2016 € € € € €Net assets - (50 bps increase) 11,916,857 - 16,556,157 17,601,598 46,074,612 Net assets - (50 bps decrease) 11,798,281 - 16,391,419 17,601,598 45,791,298
Less than one month
One month to one Year
Over one Year
Not exposed to interest rate risk Total
31 December 2015 € € € € €Net assets - (50 bps increase) 23,140,718 3,232,995 47,779,716 3,321,663 77,475,092 Net assets - (50 bps decrease) 22,910,462 3,200,825 47,304,296 3,321,663 76,737,246
Man AHL Multi Strategy AlternativeLess than one month
One month to one Year
Over one Year
Not exposed to interest rate risk Total
31 December 2016 US$ US$ US$ US$ US$Net assets - (50 bps increase) 114,881,312 12,051,386 37,570 1,695,638 128,665,906 Net assets - (50 bps decrease) 113,738,214 11,931,472 37,196 1,695,638 127,402,520
Less than one month
One month to one Year
Over one Year
Not exposed to interest rate risk Total
31 December 2015 US$ US$ US$ US$ US$Net assets - (50 bps increase) 107,876,839 37,181,332 - (300,594) 144,757,577 Net assets - (50 bps decrease) 106,803,437 36,811,368 - (300,594) 143,314,211
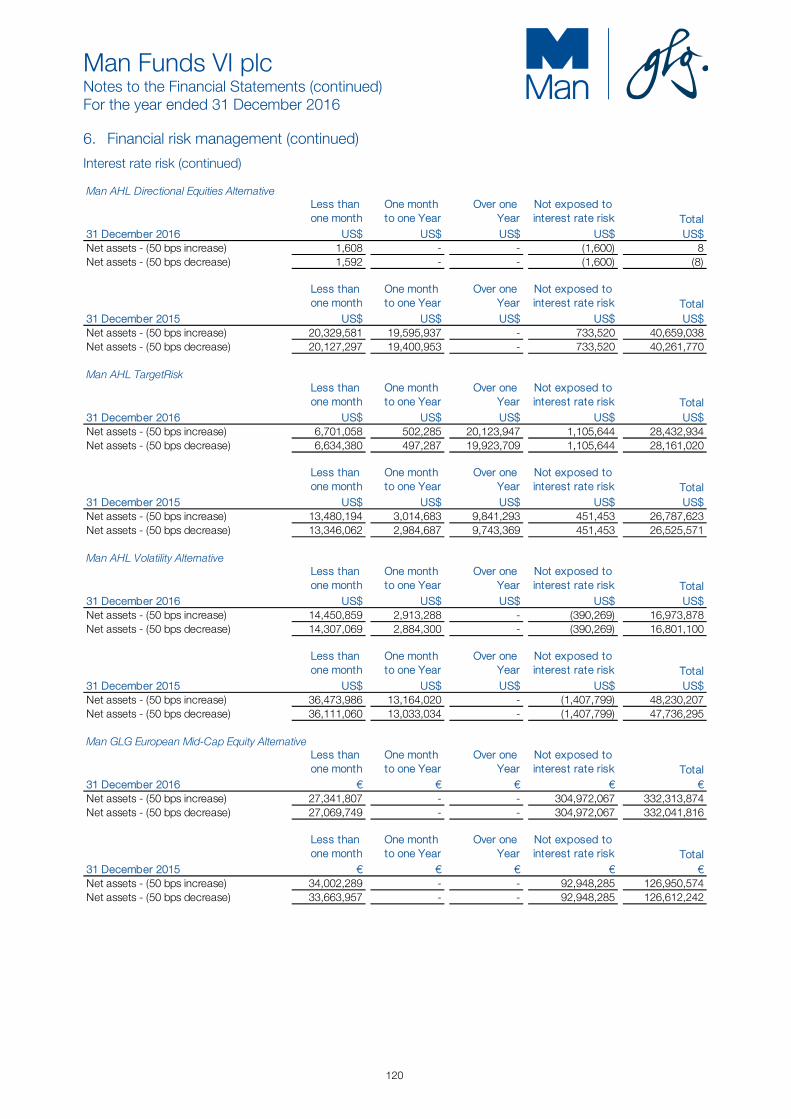
Man Funds VI plc Notes to the Financial Statements (continued) For the year ended 31 December 2016
120
6. Financial risk management (continued)
Interest rate risk (continued) Man AHL Directional Equities Alternative
Less than one month
One month to one Year
Over one Year
Not exposed to interest rate risk Total
31 December 2016 US$ US$ US$ US$ US$Net assets - (50 bps increase) 1,608 - - (1,600) 8 Net assets - (50 bps decrease) 1,592 - - (1,600) (8)
Less than one month
One month to one Year
Over one Year
Not exposed to interest rate risk Total
31 December 2015 US$ US$ US$ US$ US$Net assets - (50 bps increase) 20,329,581 19,595,937 - 733,520 40,659,038 Net assets - (50 bps decrease) 20,127,297 19,400,953 - 733,520 40,261,770
Man AHL TargetRiskLess than one month
One month to one Year
Over one Year
Not exposed to interest rate risk Total
31 December 2016 US$ US$ US$ US$ US$Net assets - (50 bps increase) 6,701,058 502,285 20,123,947 1,105,644 28,432,934 Net assets - (50 bps decrease) 6,634,380 497,287 19,923,709 1,105,644 28,161,020
Less than one month
One month to one Year
Over one Year
Not exposed to interest rate risk Total
31 December 2015 US$ US$ US$ US$ US$Net assets - (50 bps increase) 13,480,194 3,014,683 9,841,293 451,453 26,787,623 Net assets - (50 bps decrease) 13,346,062 2,984,687 9,743,369 451,453 26,525,571
Man AHL Volatility AlternativeLess than one month
One month to one Year
Over one Year
Not exposed to interest rate risk Total
31 December 2016 US$ US$ US$ US$ US$Net assets - (50 bps increase) 14,450,859 2,913,288 - (390,269) 16,973,878 Net assets - (50 bps decrease) 14,307,069 2,884,300 - (390,269) 16,801,100
Less than one month
One month to one Year
Over one Year
Not exposed to interest rate risk Total
31 December 2015 US$ US$ US$ US$ US$Net assets - (50 bps increase) 36,473,986 13,164,020 - (1,407,799) 48,230,207 Net assets - (50 bps decrease) 36,111,060 13,033,034 - (1,407,799) 47,736,295
Man GLG European Mid-Cap Equity AlternativeLess than one month
One month to one Year
Over one Year
Not exposed to interest rate risk Total
31 December 2016 € € € € €Net assets - (50 bps increase) 27,341,807 - - 304,972,067 332,313,874 Net assets - (50 bps decrease) 27,069,749 - - 304,972,067 332,041,816
Less than one month
One month to one Year
Over one Year
Not exposed to interest rate risk Total
31 December 2015 € € € € €Net assets - (50 bps increase) 34,002,289 - - 92,948,285 126,950,574 Net assets - (50 bps decrease) 33,663,957 - - 92,948,285 126,612,242

Man Funds VI plc Notes to the Financial Statements (continued) For the year ended 31 December 2016
121
6. Financial risk management (continued)
Interest rate risk (continued) Man Numeric Market Neutral Alternative
Less than one month
One month to one Year
Over one Year
Not exposed to interest rate risk Total
31 December 2016 US$ US$ US$ US$ US$Net assets - (50 bps increase) 19,658,182 - - 149,894,812 169,552,994 Net assets - (50 bps decrease) 19,462,578 - - 149,894,812 169,357,390
Less than one month
One month to one Year
Over one Year
Not exposed to interest rate risk Total
31 December 2015 US$ US$ US$ US$ US$Net assets - (50 bps increase) 2,165,660 - - 60,882,348 63,048,008 Net assets - (50 bps decrease) 2,144,112 - - 60,882,348 63,026,460
Man GLG Unconstrained Emerging EquityLess than one month
One month to one Year
Over one Year
Not exposed to interest rate risk Total
31 December 2016 US$ US$ US$ US$ US$Net assets - (50 bps increase) 9,156,883 4,018,508 - 52,368,185 65,543,576 Net assets - (50 bps decrease) 9,065,769 3,978,522 - 52,368,185 65,412,476
Less than one month
One month to one Year
Over one Year
Not exposed to interest rate risk Total
31 December 2015 US$ US$ US$ US$ US$Net assets - (50 bps increase) 18,900,777 - - 24,079,857 42,980,634 Net assets - (50 bps decrease) 18,712,709 - - 24,079,857 42,792,566
Man GLG Global Emerging Markets Debt Total ReturnLess than one month
One month to one Year
Over one Year
Not exposed to interest rate risk Total
31 December 2016 US$ US$ US$ US$ US$Net assets - (50 bps increase) 47,868,951 21,504,515 127,363,864 10,975,642 207,712,972 Net assets - (50 bps decrease) 47,392,643 21,290,539 126,096,562 10,975,642 205,755,386
Man GLG Innovation Equity AlternativeLess than one month
One month to one Year
Over one Year
Not exposed to interest rate risk Total
31 December 2016 US$ US$ US$ US$ US$Net assets - (50 bps increase) 20,100,000 - - 3,899 20,103,899 Net assets - (50 bps decrease) 19,900,000 - - 3,899 19,903,899
Man GLG Global Fundamental EquityLess than one month
One month to one Year
Over one Year
Not exposed to interest rate risk Total
31 December 2016 US$ US$ US$ US$ US$Net assets - (50 bps increase) 1,005 - - 18,077,008 18,078,013 Net assets - (50 bps decrease) 995 - - 18,077,008 18,078,003
The Fund is indirectly exposed to interest rate risk through its investment strategy, which is deliberately designed to generate returns through trading strategies focused on exploiting price differentials in rates. The sensitivity of these exposures is modelled through the overall VaR analysis provided in the market risk section. Currency risk Currency risk exists where assets and liabilities are denominated in currencies other than the functional currency, and also on nonfunctional currency redeemable participating shares. The Fund may use forward currency contracts for the purpose of currency speculation, as well as for hedging its foreign currency Share Class exposure.

Man Funds VI plc Notes to the Financial Statements (continued) For the year ended 31 December 2016
122
6. Financial risk management (continued) Currency risk (continued) Monetary assets and liabilities denominated in foreign currencies are summarized below: Man GLG European Alpha AlternativeAs at 31 December 2016Amounts are expressed in their EUR equivalents
CHF GBP DKK US$ Other EUR TotalAssetsCash and cash equivalents - - - - - 60,409,704 60,409,704 Balances with brokers 996,811 719,082 13,304 14,186 40,624 16,736,658 18,520,665 Due from brokers - 145 - - 1 481 627 Financial assets at fair value through profit or loss - 33,587 1,020,599 - 2,830 100,864,805 101,921,821 Subscriptions receivable - - - - - 16,720 16,720 Dividend receivable - 26,944 - - - - 26,944 Other assets - - - - - 29,118 29,118 Total assets 996,811 779,758 1,033,903 14,186 43,455 178,057,486 180,925,599
Liabilit ies:Balances due to brokers 3,627 9 - 550 1,462,599 9,399,469 10,866,254 Due to brokers - - 273,700 - - 20,512,324 20,786,024 Financial liabilities at fair value through profit or loss 9,161 17,248 842 - - 3,439,745 3,466,996 Redemptions payable - 6,035 - - - 12,171 18,206 Performance fees payable - 106 - - - 9,121 9,227 Management fees payable - - - - - 273,888 273,888 Interest payable - - - 9 - 785 794 Dividend payable - 35,571 - 724 - 1,700 37,995 Accrued expenses and otherliabilities - - - - - 301,168 301,168 Total liabilit ies (excluding Net Assets Attributable to Redeemable Participating Shareholders) 12,788 58,969 274,542 1,283 1,462,599 33,950,371 35,760,552
Net assets attributable to Redeemable Participating Shareholders 984,023 720,789 759,361 12,903 (1,419,144) 144,107,115 145,165,047
As at 31 December 2015Amounts are expressed in their EUR equivalents
CHF GBP SEK US$ Other EUR TotalAssetsCash and cash equivalents 187,790 460,870 10,740 902,339 10,443 58,496,105 60,068,287 Balances with brokers 982,943 199,910 178,073 1,820,617 21,524 27,627,747 30,830,814 Due from brokers 690,066 - 2,711,019 - - 164,352 3,565,437 Financial assets at fair value through profit or loss 23,466,319 472,616 6,540,376 - - 354,948,159
385,427,470
Dividend receivable - 156,104 - - - - 156,104 Total assets 25,327,118 1,289,500 9,440,208 2,722,956 31,967 441,236,363 480,048,112
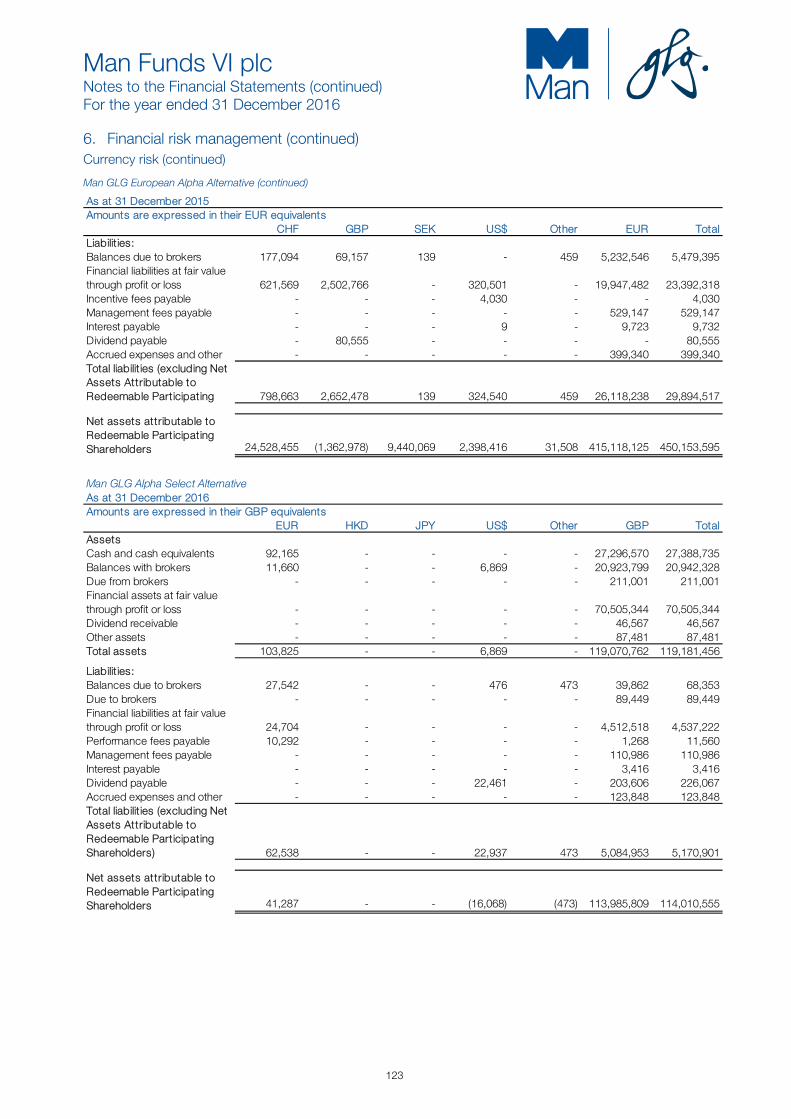
Man Funds VI plc Notes to the Financial Statements (continued) For the year ended 31 December 2016
123
6. Financial risk management (continued) Currency risk (continued)
Man GLG European Alpha Alternative (continued)
As at 31 December 2015Amounts are expressed in their EUR equivalents
CHF GBP SEK US$ Other EUR TotalLiabilit ies:Balances due to brokers 177,094 69,157 139 - 459 5,232,546 5,479,395 Financial liabilities at fair value through profit or loss 621,569 2,502,766 - 320,501 - 19,947,482 23,392,318 Incentive fees payable - - - 4,030 - - 4,030 Management fees payable - - - - - 529,147 529,147 Interest payable - - - 9 - 9,723 9,732 Dividend payable - 80,555 - - - - 80,555 Accrued expenses and other - - - - - 399,340 399,340 Total liabilit ies (excluding Net Assets Attributable to Redeemable Participating 798,663 2,652,478 139 324,540 459 26,118,238 29,894,517
Net assets attributable to Redeemable Participating Shareholders 24,528,455 (1,362,978) 9,440,069 2,398,416 31,508 415,118,125 450,153,595
Man GLG Alpha Select AlternativeAs at 31 December 2016Amounts are expressed in their GBP equivalents
EUR HKD JPY US$ Other GBP TotalAssetsCash and cash equivalents 92,165 - - - - 27,296,570 27,388,735 Balances with brokers 11,660 - - 6,869 - 20,923,799 20,942,328 Due from brokers - - - - - 211,001 211,001 Financial assets at fair value through profit or loss - - - - - 70,505,344 70,505,344 Dividend receivable - - - - - 46,567 46,567 Other assets - - - - - 87,481 87,481 Total assets 103,825 - - 6,869 - 119,070,762 119,181,456
Liabilit ies:Balances due to brokers 27,542 - - 476 473 39,862 68,353 Due to brokers - - - - - 89,449 89,449 Financial liabilities at fair value through profit or loss 24,704 - - - - 4,512,518 4,537,222 Performance fees payable 10,292 - - - - 1,268 11,560 Management fees payable - - - - - 110,986 110,986 Interest payable - - - - - 3,416 3,416 Dividend payable - - - 22,461 - 203,606 226,067 Accrued expenses and other - - - - - 123,848 123,848 Total liabilit ies (excluding Net Assets Attributable to Redeemable Participating Shareholders) 62,538 - - 22,937 473 5,084,953 5,170,901
Net assets attributable to Redeemable Participating Shareholders 41,287 - - (16,068) (473) 113,985,809 114,010,555
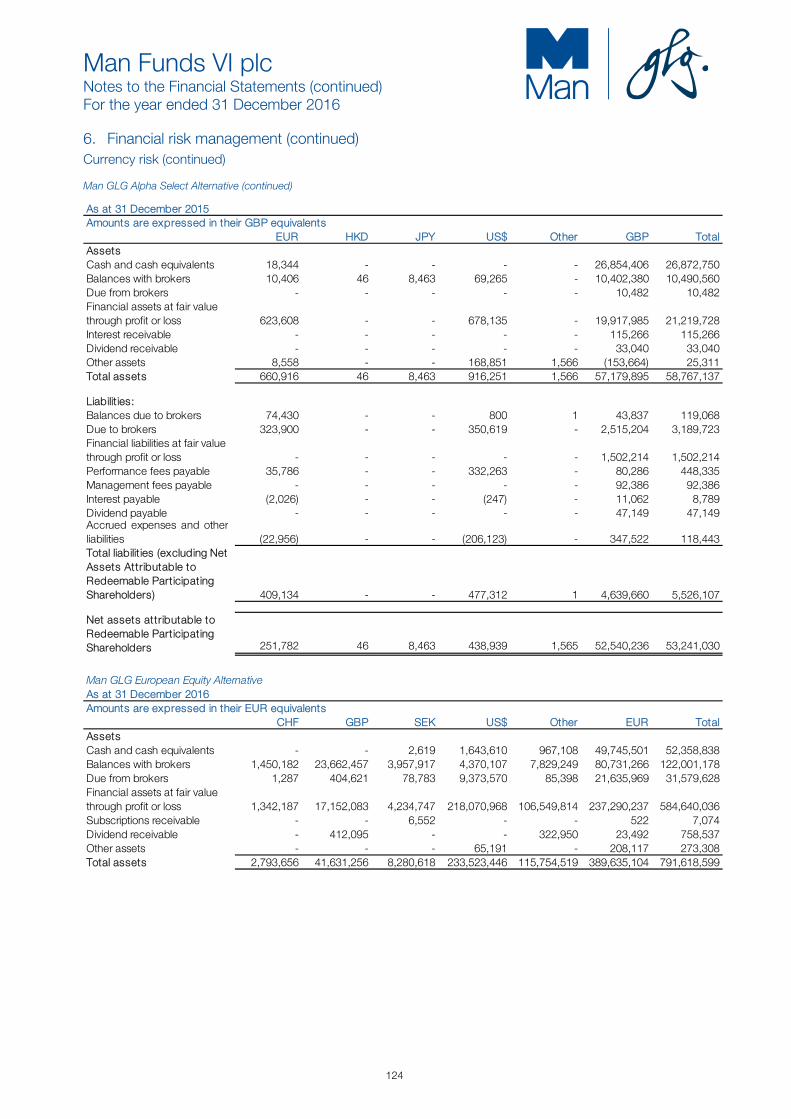
Man Funds VI plc Notes to the Financial Statements (continued) For the year ended 31 December 2016
124
6. Financial risk management (continued) Currency risk (continued) Man GLG Alpha Select Alternative (continued)
As at 31 December 2015Amounts are expressed in their GBP equivalents
EUR HKD JPY US$ Other GBP TotalAssetsCash and cash equivalents 18,344 - - - - 26,854,406 26,872,750 Balances with brokers 10,406 46 8,463 69,265 - 10,402,380 10,490,560 Due from brokers - - - - - 10,482 10,482 Financial assets at fair value through profit or loss 623,608 - - 678,135 - 19,917,985 21,219,728 Interest receivable - - - - - 115,266 115,266 Dividend receivable - - - - - 33,040 33,040 Other assets 8,558 - - 168,851 1,566 (153,664) 25,311 Total assets 660,916 46 8,463 916,251 1,566 57,179,895 58,767,137
Liabilit ies:Balances due to brokers 74,430 - - 800 1 43,837 119,068 Due to brokers 323,900 - - 350,619 - 2,515,204 3,189,723 Financial liabilities at fair value through profit or loss - - - - - 1,502,214 1,502,214 Performance fees payable 35,786 - - 332,263 - 80,286 448,335 Management fees payable - - - - - 92,386 92,386 Interest payable (2,026) - - (247) - 11,062 8,789 Dividend payable - - - - - 47,149 47,149 Accrued expenses and otherliabilities (22,956) - - (206,123) - 347,522 118,443 Total liabilit ies (excluding Net Assets Attributable to Redeemable Participating Shareholders) 409,134 - - 477,312 1 4,639,660 5,526,107
Net assets attributable to Redeemable Participating Shareholders 251,782 46 8,463 438,939 1,565 52,540,236 53,241,030
Man GLG European Equity AlternativeAs at 31 December 2016Amounts are expressed in their EUR equivalents
CHF GBP SEK US$ Other EUR TotalAssetsCash and cash equivalents - - 2,619 1,643,610 967,108 49,745,501 52,358,838 Balances with brokers 1,450,182 23,662,457 3,957,917 4,370,107 7,829,249 80,731,266 122,001,178 Due from brokers 1,287 404,621 78,783 9,373,570 85,398 21,635,969 31,579,628 Financial assets at fair value through profit or loss 1,342,187 17,152,083 4,234,747 218,070,968 106,549,814 237,290,237 584,640,036 Subscriptions receivable - - 6,552 - - 522 7,074 Dividend receivable - 412,095 - - 322,950 23,492 758,537 Other assets - - - 65,191 - 208,117 273,308 Total assets 2,793,656 41,631,256 8,280,618 233,523,446 115,754,519 389,635,104 791,618,599

Man Funds VI plc Notes to the Financial Statements (continued) For the year ended 31 December 2016
125
6. Financial risk management (continued) Currency risk (continued)
Man GLG European Equity Alternative (continued)
As at 31 December 2016Amounts are expressed in their EUR equivalents
CHF GBP SEK US$ Other EUR TotalLiabilit ies:Balances due to brokers 183,959 1,104,343 1,623,003 17,182,092 9,835,532 2,703,283 32,632,212 Due to brokers 3,746 174,303 5,070 10,855,822 2,052,353 1,774,596 14,865,890 Financial liabilities at fair value through profit or loss 1,030,909 12,239,181 1,648,227 7,935,904 8,039,691 30,226,093 61,120,005 Redemptions payable - - 12,536 17,155 - 146,544 176,235 Performance fees payable - 167,911 9,408 367,077 - 707,122 1,251,518 Management fees payable - - - - - 1,179,921 1,179,921 Interest payable - - - - - 117,789 117,789 Dividend payable - 419,941 - 381,518 121,554 68,797 991,810 Accrued expenses and otherliabilities - - - - - 752,374 752,374 Total liabilit ies (excluding Net Assets Attributable to Redeemable Participating Shareholders) 1,218,614 14,105,679 3,298,244 36,739,568 20,049,130 37,676,519 113,087,754
Net assets attributable to Redeemable Participating Shareholders 1,575,042 27,525,577 4,982,374 196,783,878 95,705,389 351,958,585 678,530,845
As at 31 December 2015Amounts are expressed in their EUR equivalents
CHF GBP SEK US$ Other EUR TotalAssetsCash and cash equivalents 102,588 2,039,885 137,526 1,894,360 1,154,234 49,926,873 55,255,466 Balances with brokers 2,373,503 14,482,794 7,149,268 49,173,522 8,077,128 138,763,612 220,019,827 Due from brokers - 6,110 39,567 5,159,190 508,099 763,359 6,476,325 Financial assets at fair value through profit or loss 9,764,170 15,913,434 18,945,392 330,863,432 45,427,104 213,229,888 634,143,420 Dividend receivable - 366,990 - 221,343 143,201 36,117 767,651 Total assets 12,240,261 32,809,213 26,271,753 387,311,847 55,309,766 402,719,849 916,662,689
Liabilit ies:Balances due to brokers 31,504 1,763,126 506 2,010,012 2,197,521 30,474,231 36,476,900 Due to brokers 30 6,054 271,173 5,485,528 1,689,930 3,328,252 10,780,967 Financial liabilities at fair value through profit or loss 437,894 9,398,143 921,133 10,161,018 4,216,419 9,162,822 34,297,429 Incentive fees payable 3,522 383,483 805,148 104,192 475,596 42,561 1,814,502 Management fees payable - - - - - 1,512,905 1,512,905 Interest payable - - - - - 193,365 193,365 Dividend payable - 243,820 - 182,000 11,893 17,379 455,092 Accrued expenses and otherliabilities - - - 10,742 - 481,649 492,391 Total liabilit ies (excluding Net Assets Attributable to Redeemable Participating Shareholders) 472,950 11,794,626 1,997,960 17,953,492 8,591,359 45,213,164 86,023,551
Net assets attributable to Redeemable Participating Shareholders 11,767,311 21,014,587 24,273,793 369,358,355 46,718,407 357,506,685 830,639,138
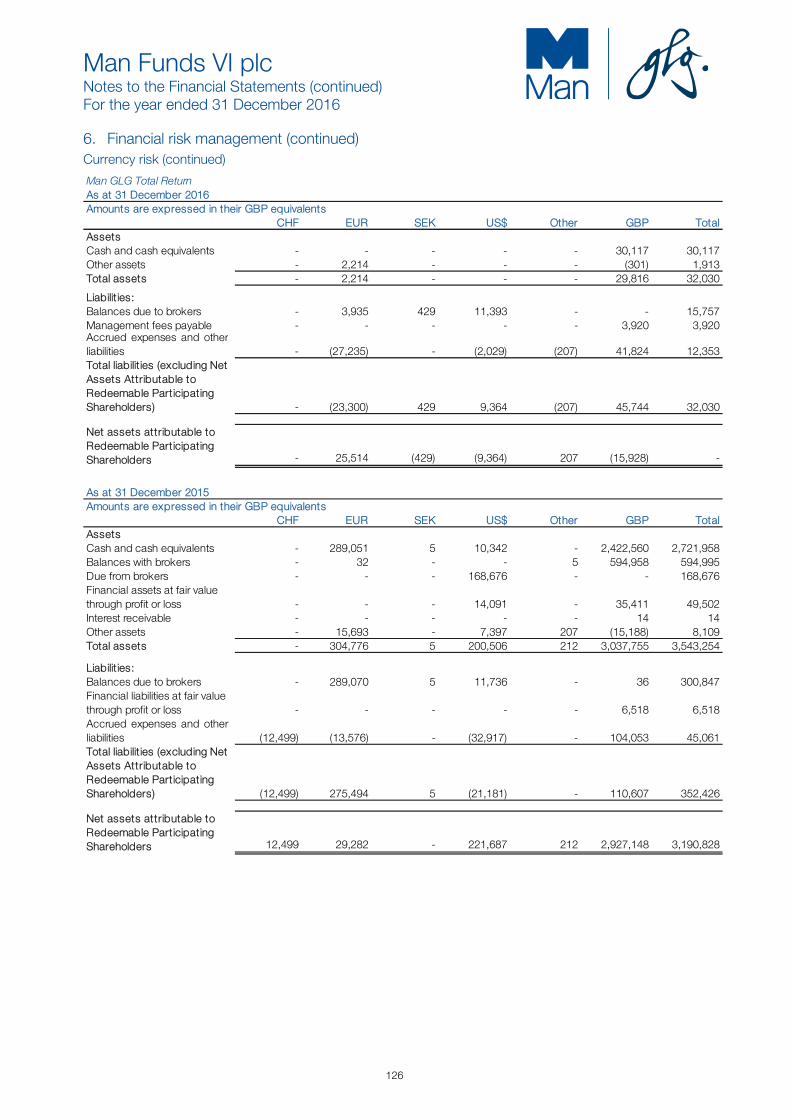
Man Funds VI plc Notes to the Financial Statements (continued) For the year ended 31 December 2016
126
6. Financial risk management (continued) Currency risk (continued)
Man GLG Total ReturnAs at 31 December 2016Amounts are expressed in their GBP equivalents
CHF EUR SEK US$ Other GBP TotalAssetsCash and cash equivalents - - - - - 30,117 30,117 Other assets - 2,214 - - - (301) 1,913 Total assets - 2,214 - - - 29,816 32,030
Liabilit ies:Balances due to brokers - 3,935 429 11,393 - - 15,757 Management fees payable - - - - - 3,920 3,920 Accrued expenses and otherliabilities - (27,235) - (2,029) (207) 41,824 12,353 Total liabilit ies (excluding Net Assets Attributable to Redeemable Participating Shareholders) - (23,300) 429 9,364 (207) 45,744 32,030
Net assets attributable to Redeemable Participating Shareholders - 25,514 (429) (9,364) 207 (15,928) -
As at 31 December 2015Amounts are expressed in their GBP equivalents
CHF EUR SEK US$ Other GBP TotalAssetsCash and cash equivalents - 289,051 5 10,342 - 2,422,560 2,721,958 Balances with brokers - 32 - - 5 594,958 594,995 Due from brokers - - - 168,676 - - 168,676 Financial assets at fair value through profit or loss - - - 14,091 - 35,411 49,502 Interest receivable - - - - - 14 14 Other assets - 15,693 - 7,397 207 (15,188) 8,109 Total assets - 304,776 5 200,506 212 3,037,755 3,543,254
Liabilit ies:Balances due to brokers - 289,070 5 11,736 - 36 300,847 Financial liabilities at fair value through profit or loss - - - - - 6,518 6,518 Accrued expenses and otherliabilities (12,499) (13,576) - (32,917) - 104,053 45,061 Total liabilit ies (excluding Net Assets Attributable to Redeemable Participating Shareholders) (12,499) 275,494 5 (21,181) - 110,607 352,426
Net assets attributable to Redeemable Participating Shareholders 12,499 29,282 - 221,687 212 2,927,148 3,190,828

Man Funds VI plc Notes to the Financial Statements (continued) For the year ended 31 December 2016
127
6. Financial risk management (continued) Currency risk (continued) Man GLG Global Equity AlternativeAs at 31 December 2016Amounts are expressed in their EUR equivalents
CAD GBP HKD US$ Other EUR TotalAssetsCash and cash equivalents 70,197 - 50,372 466,714 561,735 10,640,537 11,789,555 Balances with brokers 180,558 8,445,558 692,278 4,438,326 2,353,102 46,711,762 62,821,584 Due from brokers 419 103,302 - 2,699,860 46,626 130,398 2,980,605 Financial assets at fair value through profit or loss 847,722 4,438,495 517,048 59,239,507 24,705,204 54,054,965 143,802,941 Dividend receivable - 120,552 - 34,489 56,989 6,953 218,983 Other assets - - - - - 246,899 246,899 Total assets 1,098,896 13,107,907 1,259,698 66,878,896 27,723,656 111,791,514 221,860,567
Liabilit ies:Balances due to brokers - 246,093 544,663 5,337,564 3,472,542 1,513,037 11,113,899 Due to brokers 55,571 52,130 - 2,956,117 506,291 488,574 4,058,683 Financial liabilities at fair value through profit or loss 33,096 3,441,965 811,600 2,133,008 2,837,236 6,997,550 16,254,455 Redemptions payable - - - - - 1,895 1,895 Performance fees payable - - - 4,393 - 72,136 76,529 Management fees payable - - - - - 335,855 335,855 Interest payable - - - - - 21,136 21,136 Dividend payable - 125,400 - 106,379 32,089 172 264,040 Accrued expenses and otherliabilities - - - - - 535,804 535,804 Total liabilit ies (excluding Net Assets Attributable to Redeemable Participating Shareholders) 88,667 3,865,588 1,356,263 10,537,461 6,848,158 9,966,159 32,662,296
Net assets attributable to Redeemable Participating Shareholders 1,010,229 9,242,319 (96,565) 56,341,435 20,875,498 101,825,355 189,198,271
As at 31 December 2015Amounts are expressed in their EUR equivalents
CAD GBP HKD US$ Other EUR TotalAssetsCash and cash equivalents 1,125,905 - 883,371 749,822 1,915,105 37,380,237 42,054,440 Balances with brokers 1,004,451 7,606,763 1,110,858 15,715,082 5,776,535 104,343,751 135,557,440 Due from brokers 112,231 2,029 3,180 2,298,731 33,408 54,697 2,504,276 Financial assets at fair value through profit or loss 2,278,404 6,154,355 2,337,318 136,625,441 18,116,473 30,412,906 195,924,897 Dividend receivable 11,555 143,558 - 84,843 82,012 13,621 335,589 Other assets - - - - - - - Total assets 4,532,546 13,906,705 4,334,727 155,473,919 25,923,533 172,205,212 376,376,642

Man Funds VI plc Notes to the Financial Statements (continued) For the year ended 31 December 2016
128
6. Financial risk management (continued) Currency risk (continued)
Man GLG Global Equity Alternative (continued) As at 31 December 2015Amounts are expressed in their EUR equivalents
CAD GBP HKD US$ Other EUR TotalLiabilit ies:Balances due to brokers - 773,940 25,917 331,175 1,383,345 33,256,847 35,771,224 Due to brokers 923 2,173 - 2,774,896 356,302 684,970 3,819,264 Financial liabilities at fair value through profit or loss 104,808 3,560,194 555,720 3,267,995 2,672,297 4,309,736 14,470,750 Incentive fees payable - 147 - 59,885 - 778,131 838,163 Management fees payable - - - - - 579,267 579,267 Interest payable - - - - - 59,413 59,413 Dividend payable 3,223 101,167 7,909 93,170 3,666 7,039 216,174 Accrued expenses and otherliabilities - - - 39,741 - 337,148 376,889 Total liabilit ies (excluding Net Assets Attributable to Redeemable Participating Shareholders) 108,954 4,437,621 589,546 6,566,862 4,415,610 40,012,551 56,131,144
Net assets attributable to Redeemable Participating Shareholders 4,423,592 9,469,084 3,745,181 148,907,057 21,507,923 132,192,661 320,245,498
Man GLG Asian Equity AlternativeAs at 31 December 2016Amounts are expressed in their US$ equivalents
CHF EUR HKD SEK Other US$ TotalAssetsBalances with brokers - - - - - 184 184 Other assets - - - - - 35 35 Total assets - - - - - 219 219
Liabilit ies:Balances due to brokers - 1 - 1 - 20 22 Accrued expenses and otherliabilities (25) (4,392) - - - 4,614 197 Total liabilit ies (excluding Net Assets Attributable to Redeemable Participating Shareholders) (25) (4,391) - 1 - 4,634 219
Net assets attributable to Redeemable Participating Shareholders 25 4,391 - (1) - (4,415) -
As at 31 December 2015Amounts are expressed in their US$ equivalents
CHF EUR HKD SEK Other US$ TotalAssetsCash and cash equivalents - 1 1,104,462 - 147,449 10,820,566 12,072,478 Balances with brokers - 11,938 15,078 - 91,414 21,920,484 22,038,914 Financial assets at fair value through profit or loss 2,902,346 45,785,865 111,375 998,718 1,540,805 4,580,513 55,919,622 Interest receivable - - - - - 206 206 Dividend receivable - - - - 63,872 - 63,872 Other assets - - - - - 3,748 3,748 Total assets 2,902,346 45,797,804 1,230,915 998,718 1,843,540 37,325,517 90,098,840

Man Funds VI plc Notes to the Financial Statements (continued) For the year ended 31 December 2016
129
6. Financial risk management (continued) Currency risk (continued)
Man GLG Asian Equity Alternative (continued) As at 31 December 2015Amounts are expressed in their US$ equivalents
CHF EUR HKD SEK Other US$ TotalLiabilit ies:Balances due to brokers 1 4 - - 1,111,770 1,483,203 2,594,978 Financial liabilities at fair value through profit or loss 113 1,968,101 - 13,268 546,066 575,123 3,102,671 Incentive fees payable - - - - - 30,372 30,372 Management fees payable - - - - - 144,815 144,815 Accrued expenses and otherliabilities - (8,634) - - (103) 197,373 188,636 Total liabilit ies (excluding Net Assets Attributable to Redeemable Participating Shareholders) 114 1,959,471 - 13,268 1,657,733 2,430,886 6,061,472
Net assets attributable to Redeemable Participating Shareholders 2,902,232 43,838,333 1,230,915 985,450 185,807 34,894,631 84,037,368
Man GLG European Alpha Alternative EnhancedAs at 31 December 2016Amounts are expressed in their EUR equivalents
CHF GBP US$ SEK Other EUR TotalAssetsCash and cash equivalents - - - - - 404,958 404,958 Balances with brokers - 7,621 - - - 312,274 319,895 Due from brokers - - - - - 457 457 Interest receivable - - - - - 567 567 Dividend receivable - 1,412 - - - - 1,412 Other assets - - - - - 74,366 74,366 Total assets - 9,033 - - - 792,622 801,655
Liabilit ies:Balances due to brokers 28 12,575 62 1 16 704,982 717,664 Performance fees payable - - - - - 1,955 1,955 Management fees payable - - - - - 11,008 11,008 Dividend payable - 1,954 - - - 85 2,039 Accrued expenses and otherliabilities - - - - - 68,989 68,989 Total liabilit ies (excluding Net Assets Attributable to Redeemable Participating Shareholders) 28 14,529 62 1 16 787,019 801,655
Net assets attributable to Redeemable Participating Shareholders (28) (5,496) (62) (1) (16) 5,603 -
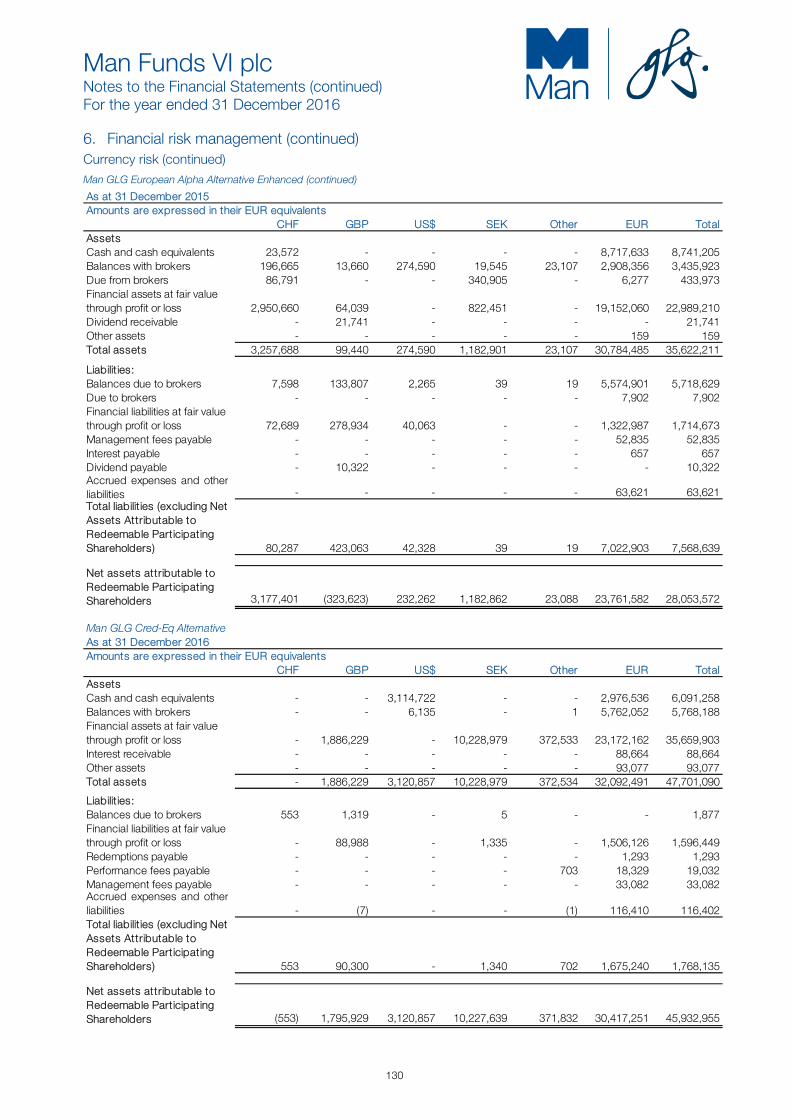
Man Funds VI plc Notes to the Financial Statements (continued) For the year ended 31 December 2016
130
6. Financial risk management (continued) Currency risk (continued)
Man GLG European Alpha Alternative Enhanced (continued)
As at 31 December 2015Amounts are expressed in their EUR equivalents
CHF GBP US$ SEK Other EUR TotalAssetsCash and cash equivalents 23,572 - - - - 8,717,633 8,741,205 Balances with brokers 196,665 13,660 274,590 19,545 23,107 2,908,356 3,435,923 Due from brokers 86,791 - - 340,905 - 6,277 433,973 Financial assets at fair value through profit or loss 2,950,660 64,039 - 822,451 - 19,152,060 22,989,210 Dividend receivable - 21,741 - - - - 21,741 Other assets - - - - - 159 159 Total assets 3,257,688 99,440 274,590 1,182,901 23,107 30,784,485 35,622,211
Liabilit ies:Balances due to brokers 7,598 133,807 2,265 39 19 5,574,901 5,718,629 Due to brokers - - - - - 7,902 7,902 Financial liabilities at fair value through profit or loss 72,689 278,934 40,063 - - 1,322,987 1,714,673 Management fees payable - - - - - 52,835 52,835 Interest payable - - - - - 657 657 Dividend payable - 10,322 - - - - 10,322 Accrued expenses and otherliabilities - - - - - 63,621 63,621 Total liabilit ies (excluding Net Assets Attributable to Redeemable Participating Shareholders) 80,287 423,063 42,328 39 19 7,022,903 7,568,639
Net assets attributable to Redeemable Participating Shareholders 3,177,401 (323,623) 232,262 1,182,862 23,088 23,761,582 28,053,572
Man GLG Cred-Eq AlternativeAs at 31 December 2016Amounts are expressed in their EUR equivalents
CHF GBP US$ SEK Other EUR TotalAssetsCash and cash equivalents - - 3,114,722 - - 2,976,536 6,091,258 Balances with brokers - - 6,135 - 1 5,762,052 5,768,188 Financial assets at fair value through profit or loss - 1,886,229 - 10,228,979 372,533 23,172,162 35,659,903 Interest receivable - - - - - 88,664 88,664 Other assets - - - - - 93,077 93,077 Total assets - 1,886,229 3,120,857 10,228,979 372,534 32,092,491 47,701,090
Liabilit ies:Balances due to brokers 553 1,319 - 5 - - 1,877 Financial liabilities at fair value through profit or loss - 88,988 - 1,335 - 1,506,126 1,596,449 Redemptions payable - - - - - 1,293 1,293 Performance fees payable - - - - 703 18,329 19,032 Management fees payable - - - - - 33,082 33,082 Accrued expenses and otherliabilities - (7) - - (1) 116,410 116,402 Total liabilit ies (excluding Net Assets Attributable to Redeemable Participating Shareholders) 553 90,300 - 1,340 702 1,675,240 1,768,135
Net assets attributable to Redeemable Participating Shareholders (553) 1,795,929 3,120,857 10,227,639 371,832 30,417,251 45,932,955
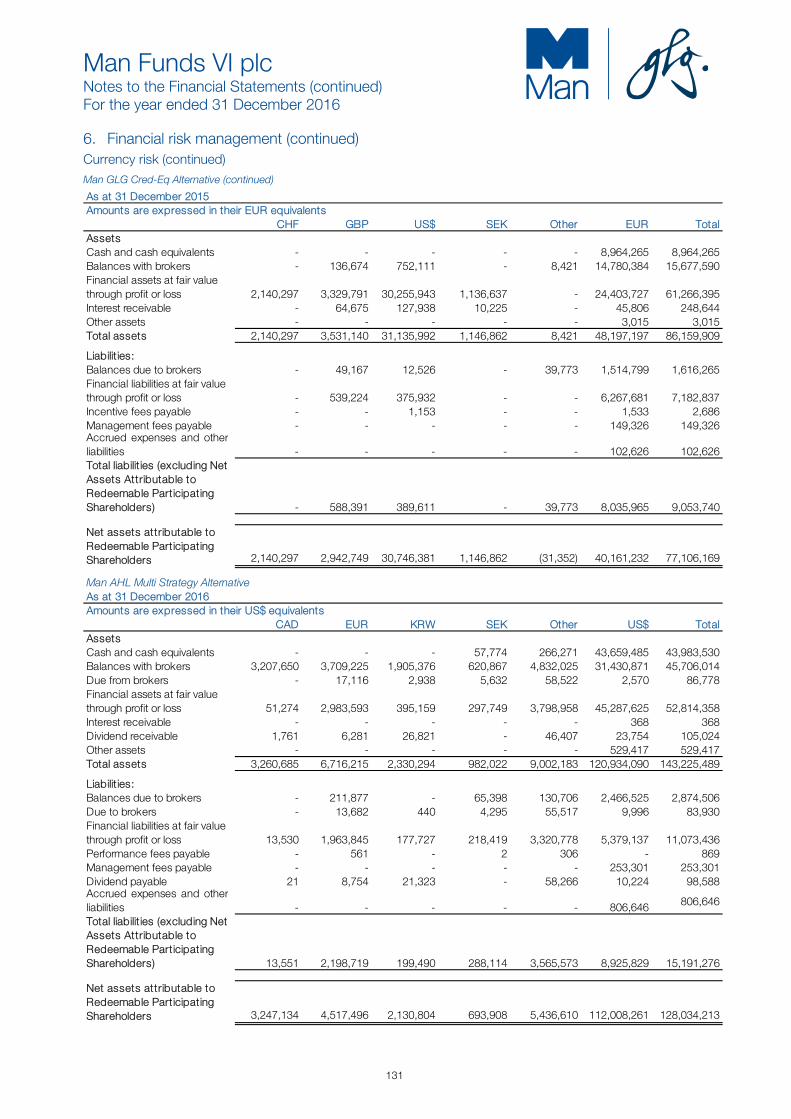
Man Funds VI plc Notes to the Financial Statements (continued) For the year ended 31 December 2016
131
6. Financial risk management (continued) Currency risk (continued)
Man GLG Cred-Eq Alternative (continued)
As at 31 December 2015Amounts are expressed in their EUR equivalents
CHF GBP US$ SEK Other EUR TotalAssetsCash and cash equivalents - - - - - 8,964,265 8,964,265 Balances with brokers - 136,674 752,111 - 8,421 14,780,384 15,677,590 Financial assets at fair value through profit or loss 2,140,297 3,329,791 30,255,943 1,136,637 - 24,403,727 61,266,395 Interest receivable - 64,675 127,938 10,225 - 45,806 248,644 Other assets - - - - - 3,015 3,015 Total assets 2,140,297 3,531,140 31,135,992 1,146,862 8,421 48,197,197 86,159,909
Liabilit ies:Balances due to brokers - 49,167 12,526 - 39,773 1,514,799 1,616,265 Financial liabilities at fair value through profit or loss - 539,224 375,932 - - 6,267,681 7,182,837 Incentive fees payable - - 1,153 - - 1,533 2,686 Management fees payable - - - - - 149,326 149,326 Accrued expenses and otherliabilities - - - - - 102,626 102,626 Total liabilit ies (excluding Net Assets Attributable to Redeemable Participating Shareholders) - 588,391 389,611 - 39,773 8,035,965 9,053,740
Net assets attributable to Redeemable Participating Shareholders 2,140,297 2,942,749 30,746,381 1,146,862 (31,352) 40,161,232 77,106,169
Man AHL Multi Strategy AlternativeAs at 31 December 2016Amounts are expressed in their US$ equivalents
CAD EUR KRW SEK Other US$ TotalAssetsCash and cash equivalents - - - 57,774 266,271 43,659,485 43,983,530 Balances with brokers 3,207,650 3,709,225 1,905,376 620,867 4,832,025 31,430,871 45,706,014 Due from brokers - 17,116 2,938 5,632 58,522 2,570 86,778 Financial assets at fair value through profit or loss 51,274 2,983,593 395,159 297,749 3,798,958 45,287,625 52,814,358 Interest receivable - - - - - 368 368 Dividend receivable 1,761 6,281 26,821 - 46,407 23,754 105,024 Other assets - - - - - 529,417 529,417 Total assets 3,260,685 6,716,215 2,330,294 982,022 9,002,183 120,934,090 143,225,489
Liabilit ies:Balances due to brokers - 211,877 - 65,398 130,706 2,466,525 2,874,506 Due to brokers - 13,682 440 4,295 55,517 9,996 83,930 Financial liabilities at fair value through profit or loss 13,530 1,963,845 177,727 218,419 3,320,778 5,379,137 11,073,436 Performance fees payable - 561 - 2 306 - 869 Management fees payable - - - - - 253,301 253,301 Dividend payable 21 8,754 21,323 - 58,266 10,224 98,588 Accrued expenses and otherliabilities - - - - - 806,646 806,646
Total liabilit ies (excluding Net Assets Attributable to Redeemable Participating Shareholders) 13,551 2,198,719 199,490 288,114 3,565,573 8,925,829 15,191,276
Net assets attributable to Redeemable Participating Shareholders 3,247,134 4,517,496 2,130,804 693,908 5,436,610 112,008,261 128,034,213
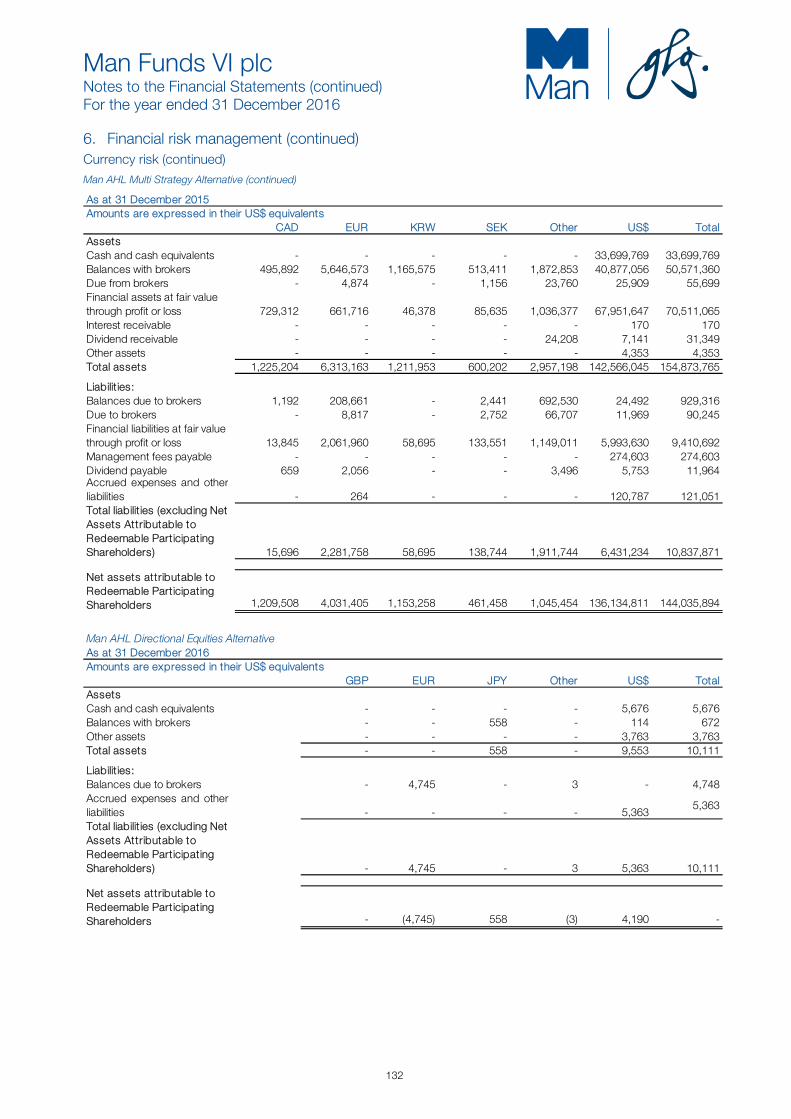
Man Funds VI plc Notes to the Financial Statements (continued) For the year ended 31 December 2016
132
6. Financial risk management (continued) Currency risk (continued)
Man AHL Multi Strategy Alternative (continued)
As at 31 December 2015Amounts are expressed in their US$ equivalents
CAD EUR KRW SEK Other US$ TotalAssetsCash and cash equivalents - - - - - 33,699,769 33,699,769 Balances with brokers 495,892 5,646,573 1,165,575 513,411 1,872,853 40,877,056 50,571,360 Due from brokers - 4,874 - 1,156 23,760 25,909 55,699 Financial assets at fair value through profit or loss 729,312 661,716 46,378 85,635 1,036,377 67,951,647 70,511,065 Interest receivable - - - - - 170 170 Dividend receivable - - - - 24,208 7,141 31,349 Other assets - - - - - 4,353 4,353 Total assets 1,225,204 6,313,163 1,211,953 600,202 2,957,198 142,566,045 154,873,765
Liabilit ies:Balances due to brokers 1,192 208,661 - 2,441 692,530 24,492 929,316 Due to brokers - 8,817 - 2,752 66,707 11,969 90,245 Financial liabilities at fair value through profit or loss 13,845 2,061,960 58,695 133,551 1,149,011 5,993,630 9,410,692 Management fees payable - - - - - 274,603 274,603 Dividend payable 659 2,056 - - 3,496 5,753 11,964 Accrued expenses and otherliabilities - 264 - - - 120,787 121,051 Total liabilit ies (excluding Net Assets Attributable to Redeemable Participating Shareholders) 15,696 2,281,758 58,695 138,744 1,911,744 6,431,234 10,837,871
Net assets attributable to Redeemable Participating Shareholders 1,209,508 4,031,405 1,153,258 461,458 1,045,454 136,134,811 144,035,894
Man AHL Directional Equities AlternativeAs at 31 December 2016Amounts are expressed in their US$ equivalents
GBP EUR JPY Other US$ TotalAssetsCash and cash equivalents - - - - 5,676 5,676 Balances with brokers - - 558 - 114 672 Other assets - - - - 3,763 3,763 Total assets - - 558 - 9,553 10,111
Liabilit ies:Balances due to brokers - 4,745 - 3 - 4,748 Accrued expenses and otherliabilities - - - - 5,363
5,363
Total liabilit ies (excluding Net Assets Attributable to Redeemable Participating Shareholders) - 4,745 - 3 5,363 10,111
Net assets attributable to Redeemable Participating Shareholders - (4,745) 558 (3) 4,190 -
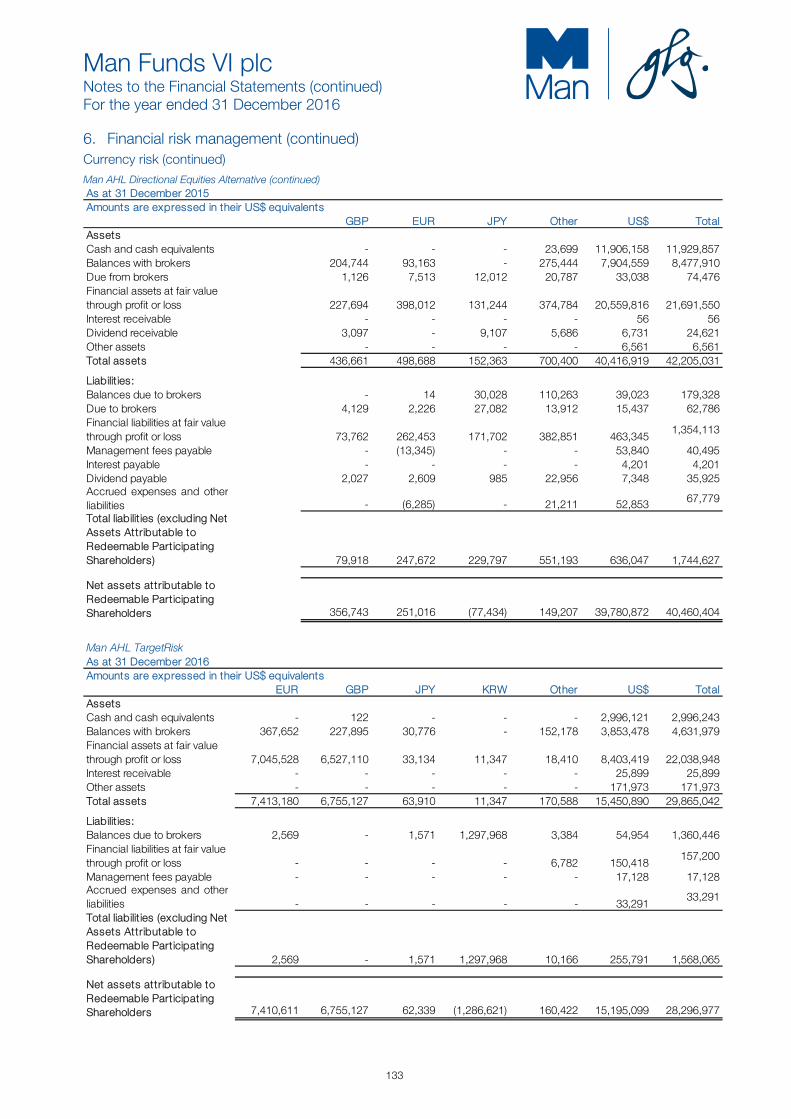
Man Funds VI plc Notes to the Financial Statements (continued) For the year ended 31 December 2016
133
6. Financial risk management (continued) Currency risk (continued)
Man AHL Directional Equities Alternative (continued) As at 31 December 2015Amounts are expressed in their US$ equivalents
GBP EUR JPY Other US$ TotalAssetsCash and cash equivalents - - - 23,699 11,906,158 11,929,857 Balances with brokers 204,744 93,163 - 275,444 7,904,559 8,477,910 Due from brokers 1,126 7,513 12,012 20,787 33,038 74,476 Financial assets at fair value through profit or loss 227,694 398,012 131,244 374,784 20,559,816 21,691,550 Interest receivable - - - - 56 56 Dividend receivable 3,097 - 9,107 5,686 6,731 24,621 Other assets - - - - 6,561 6,561 Total assets 436,661 498,688 152,363 700,400 40,416,919 42,205,031
Liabilit ies:Balances due to brokers - 14 30,028 110,263 39,023 179,328 Due to brokers 4,129 2,226 27,082 13,912 15,437 62,786 Financial liabilities at fair value through profit or loss 73,762 262,453 171,702 382,851 463,345
1,354,113
Management fees payable - (13,345) - - 53,840 40,495 Interest payable - - - - 4,201 4,201 Dividend payable 2,027 2,609 985 22,956 7,348 35,925 Accrued expenses and otherliabilities - (6,285) - 21,211 52,853 67,779
Total liabilit ies (excluding Net Assets Attributable to Redeemable Participating Shareholders) 79,918 247,672 229,797 551,193 636,047 1,744,627
Net assets attributable to Redeemable Participating Shareholders 356,743 251,016 (77,434) 149,207 39,780,872 40,460,404
Man AHL TargetRiskAs at 31 December 2016Amounts are expressed in their US$ equivalents
EUR GBP JPY KRW Other US$ TotalAssetsCash and cash equivalents - 122 - - - 2,996,121 2,996,243 Balances with brokers 367,652 227,895 30,776 - 152,178 3,853,478 4,631,979 Financial assets at fair value through profit or loss 7,045,528 6,527,110 33,134 11,347 18,410 8,403,419 22,038,948 Interest receivable - - - - - 25,899 25,899 Other assets - - - - - 171,973 171,973 Total assets 7,413,180 6,755,127 63,910 11,347 170,588 15,450,890 29,865,042
Liabilit ies:Balances due to brokers 2,569 - 1,571 1,297,968 3,384 54,954 1,360,446 Financial liabilities at fair value through profit or loss - - - - 6,782 150,418
157,200
Management fees payable - - - - - 17,128 17,128 Accrued expenses and otherliabilities - - - - - 33,291
33,291
Total liabilit ies (excluding Net Assets Attributable to Redeemable Participating Shareholders) 2,569 - 1,571 1,297,968 10,166 255,791 1,568,065
Net assets attributable to Redeemable Participating Shareholders 7,410,611 6,755,127 62,339 (1,286,621) 160,422 15,195,099 28,296,977

Man Funds VI plc Notes to the Financial Statements (continued) For the year ended 31 December 2016
134
6. Financial risk management (continued) Currency risk (continued)
Man AHL Target Risk (continued)
As at 31 December 2015Amounts are expressed in their US$ equivalents
EUR GBP JPY KRW Other US$ TotalAssetsCash and cash equivalents - - - - - 5,150,965 5,150,965 Balances with brokers 293,097 113,664 58,316 15,047 34,177 4,799,335 5,313,636 Financial assets at fair value through profit or loss 3,702,011 3,412,659 9,526 3,305 26,506 9,160,677 16,314,684 Interest receivable 6,137 1,094 - - - 9,108 16,339 Other assets - - - - - 61,971 61,971 Total assets 4,001,245 3,527,417 67,842 18,352 60,683 19,182,056 26,857,595
Liabilit ies:Balances due to brokers 6,551 - - - 4,181 40,561 51,293 Financial liabilities at fair value through profit or loss 3,066 23,700 12,910 - 2,903 62,300
104,879
Management fees payable - - - - - 17,009 17,009 Accrued expenses and otherliabilities - - - - - 27,817
27,817
Total liabilit ies (excluding Net Assets Attributable to Redeemable Participating Shareholders) 9,617 23,700 12,910 - 7,084 147,687 200,998
Net assets attributable to Redeemable Participating Shareholders 3,991,628 3,503,717 54,932 18,352 53,599 19,034,369 26,656,597
Man AHL Volatility AlternativeAs at 31 December 2016Amounts are expressed in their US$ equivalents
AUD EUR GBP JPY Other US$ TotalAssetsCash and cash equivalents - - 35 - - 9,336,412 9,336,447 Balances with brokers 27,016 308,137 74,952 45,405 656,101 2,716,752 3,828,363 Financial assets at fair value through profit or loss 3,530 11,022 1,600 - 7,353 4,407,876 4,431,381 Interest receivable - - - - - 100 100 Other assets - - - - - 39,727 39,727 Total assets 30,546 319,159 76,587 45,405 663,454 16,500,867 17,636,018
Liabilit ies:Balances due to brokers - 16,516 - - - 169,018 185,534 Financial liabilities at fair value through profit or loss 15,285 132,054 37,508 19,190 42,765 190,954
437,756
Performance fees payable - - - - - 23,569 23,569 Management fees payable - - - - - 20,856 20,856 Accrued expenses and otherliabilities - (8,147) - - 1 88,960 80,814
Total liabilit ies (excluding Net Assets Attributable to Redeemable Participating Shareholders) 15,285 140,423 37,508 19,190 42,766 493,357 748,529
Net assets attributable to Redeemable Participating Shareholders 15,261 178,736 39,079 26,215 620,688 16,007,510 16,887,489
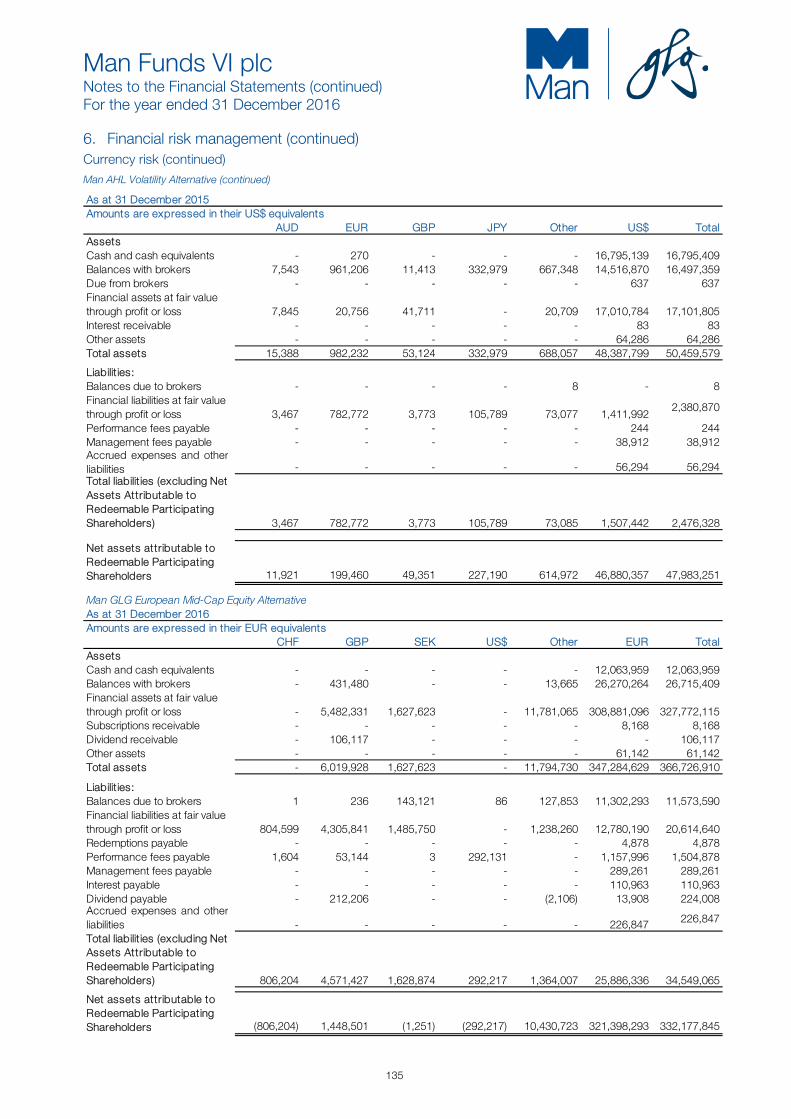
Man Funds VI plc Notes to the Financial Statements (continued) For the year ended 31 December 2016
135
6. Financial risk management (continued) Currency risk (continued)
Man AHL Volatility Alternative (continued)
As at 31 December 2015Amounts are expressed in their US$ equivalents
AUD EUR GBP JPY Other US$ TotalAssetsCash and cash equivalents - 270 - - - 16,795,139 16,795,409 Balances with brokers 7,543 961,206 11,413 332,979 667,348 14,516,870 16,497,359 Due from brokers - - - - - 637 637 Financial assets at fair value through profit or loss 7,845 20,756 41,711 - 20,709 17,010,784 17,101,805 Interest receivable - - - - - 83 83 Other assets - - - - - 64,286 64,286 Total assets 15,388 982,232 53,124 332,979 688,057 48,387,799 50,459,579
Liabilit ies:Balances due to brokers - - - - 8 - 8 Financial liabilities at fair value through profit or loss 3,467 782,772 3,773 105,789 73,077 1,411,992
2,380,870
Performance fees payable - - - - - 244 244 Management fees payable - - - - - 38,912 38,912 Accrued expenses and otherliabilities - - - - - 56,294 56,294 Total liabilit ies (excluding Net Assets Attributable to Redeemable Participating Shareholders) 3,467 782,772 3,773 105,789 73,085 1,507,442 2,476,328
Net assets attributable to Redeemable Participating Shareholders 11,921 199,460 49,351 227,190 614,972 46,880,357 47,983,251
Man GLG European Mid-Cap Equity AlternativeAs at 31 December 2016Amounts are expressed in their EUR equivalents
CHF GBP SEK US$ Other EUR TotalAssetsCash and cash equivalents - - - - - 12,063,959 12,063,959 Balances with brokers - 431,480 - - 13,665 26,270,264 26,715,409 Financial assets at fair value through profit or loss - 5,482,331 1,627,623 - 11,781,065 308,881,096 327,772,115 Subscriptions receivable - - - - - 8,168 8,168 Dividend receivable - 106,117 - - - - 106,117 Other assets - - - - - 61,142 61,142 Total assets - 6,019,928 1,627,623 - 11,794,730 347,284,629 366,726,910
Liabilit ies:Balances due to brokers 1 236 143,121 86 127,853 11,302,293 11,573,590 Financial liabilities at fair value through profit or loss 804,599 4,305,841 1,485,750 - 1,238,260 12,780,190 20,614,640 Redemptions payable - - - - - 4,878 4,878 Performance fees payable 1,604 53,144 3 292,131 - 1,157,996 1,504,878 Management fees payable - - - - - 289,261 289,261 Interest payable - - - - - 110,963 110,963 Dividend payable - 212,206 - - (2,106) 13,908 224,008 Accrued expenses and otherliabilities - - - - - 226,847 226,847
Total liabilit ies (excluding Net Assets Attributable to Redeemable Participating Shareholders) 806,204 4,571,427 1,628,874 292,217 1,364,007 25,886,336 34,549,065
Net assets attributable to Redeemable Participating Shareholders (806,204) 1,448,501 (1,251) (292,217) 10,430,723 321,398,293 332,177,845

Man Funds VI plc Notes to the Financial Statements (continued) For the year ended 31 December 2016
136
6. Financial risk management (continued) Currency risk (continued)
Man GLG European Mid-Cap Equity Alternative (continued)
As at 31 December 2015Amounts are expressed in their EUR equivalents
GBP NOK SEK US$ Other EUR TotalAssetsCash and cash equivalents 11,335 - - 6,332 - 27,953,259 27,970,926 Balances with brokers 81,369 - 47 - 183 13,784,738 13,866,337 Due from brokers - 39,700 - - - - 39,700 Financial assets at fair value through profit or loss 1,730,141 6,661,477 1,879,293 1,264,680 139,975 87,446,430 99,121,996 Dividend receivable 79,557 - - - - - 79,557 Total assets 1,902,402 6,701,177 1,879,340 1,271,012 140,158 129,184,427 141,078,516
Liabilit ies:Balances due to brokers - 12,877 39,145 - 746 7,951,372 8,004,140 Due to brokers - 697,246 - - - - 697,246 Financial liabilities at fair value through profit or loss 407,619 59,835 703,857 - 228,963 3,526,819 4,927,093 Performance fees payable 26,626 - - 304,207 705 123,005 454,543 Management fees payable - - - - - 133,300 133,300 Dividend payable 16,549 - - - - - 16,549 Accrued expenses and otherliabilities - - - - - 64,237 64,237
Total liabilit ies (excluding Net Assets Attributable to Redeemable Participating Shareholders) 450,794 769,958 743,002 304,207 230,414 11,798,733 14,297,108
Net assets attributable to Redeemable Participating Shareholders 1,451,608 5,931,219 1,136,338 966,805 (90,256) 117,385,694 126,781,408
Man Numeric Market Neutral AlternativeAs at 31 December 2016Amounts are expressed in their US$ equivalents
CHF GBP SEK EUR Other US$ TotalAssetsCash and cash equivalents - - - - 6,606 21,081,260 21,087,866 Balances with brokers - - - - - 2,751,940 2,751,940 Due from brokers - - - - - 21,142,418 21,142,418 Financial assets at fair value through profit or loss 8,804,504 1,225,498 6,595,021 143,177,904 2,651,567 4,563,294 167,017,788 Subscriptions receivable - - - - - 191,867 191,867 Interest receivable - - - - - 52,928 52,928 Other assets - - - - - 23,373 23,373 Total assets 8,804,504 1,225,498 6,595,021 143,177,904 2,658,173 49,807,080 212,268,180
Liabilit ies:Balances due to brokers 584 23 5 32,817 1 4,245,996 4,279,426 Due to brokers - - - - - 32,582,718 32,582,718 Financial liabilities at fair value through profit or loss 346,512 83,756 249,253 3,951,215 155,443 7,853 4,794,032 Performance fees payable - - 17 286,593 16 589,018 875,644 Management fees payable - - - - - 157,736 157,736 Interest payable - - - - - 34,756 34,756 Accrued expenses and otherliabilities - - - - - 88,676 88,676 Total liabilit ies (excluding Net Assets Attributable to Redeemable Participating Shareholders) 347,096 83,779 249,275 4,270,625 155,460 37,706,753 42,812,988
Net assets attributable to Redeemable Participating Shareholders 8,457,408 1,141,719 6,345,746 138,907,279 2,502,713 12,100,327 169,455,192
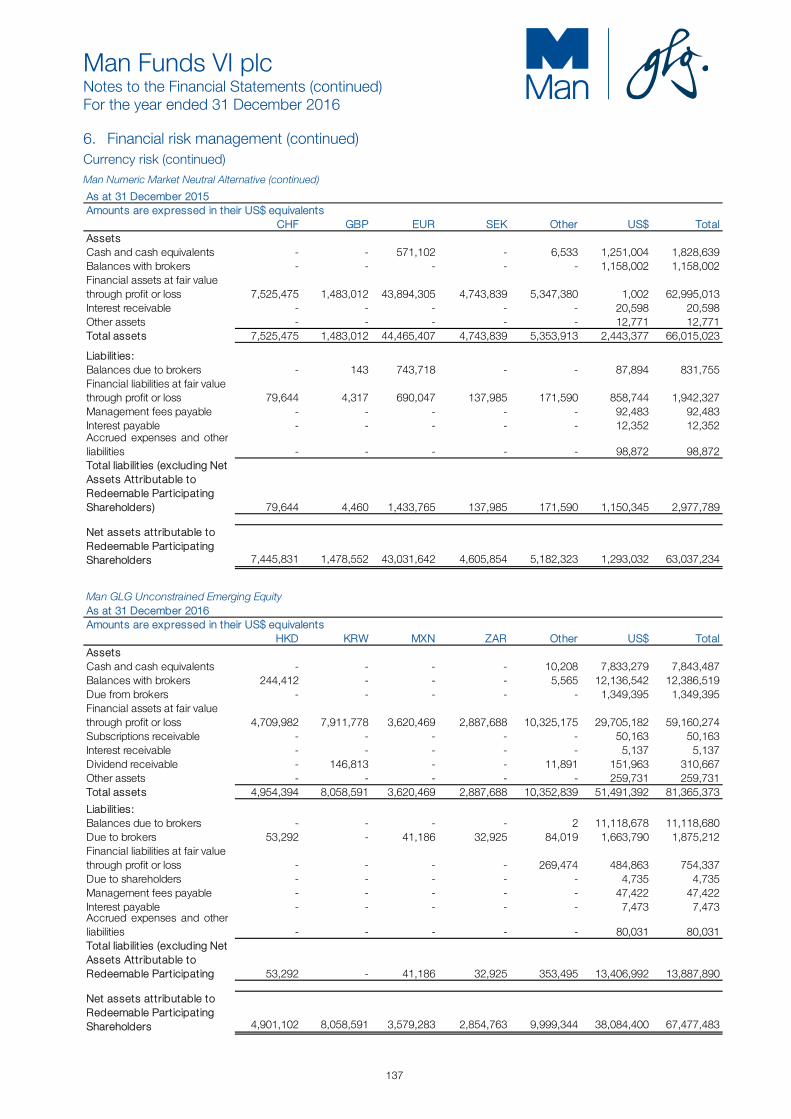
Man Funds VI plc Notes to the Financial Statements (continued) For the year ended 31 December 2016
137
6. Financial risk management (continued) Currency risk (continued)
Man Numeric Market Neutral Alternative (continued)
As at 31 December 2015Amounts are expressed in their US$ equivalents
CHF GBP EUR SEK Other US$ TotalAssetsCash and cash equivalents - - 571,102 - 6,533 1,251,004 1,828,639 Balances with brokers - - - - - 1,158,002 1,158,002 Financial assets at fair value through profit or loss 7,525,475 1,483,012 43,894,305 4,743,839 5,347,380 1,002 62,995,013 Interest receivable - - - - - 20,598 20,598 Other assets - - - - - 12,771 12,771 Total assets 7,525,475 1,483,012 44,465,407 4,743,839 5,353,913 2,443,377 66,015,023
Liabilit ies:Balances due to brokers - 143 743,718 - - 87,894 831,755 Financial liabilities at fair value through profit or loss 79,644 4,317 690,047 137,985 171,590 858,744 1,942,327 Management fees payable - - - - - 92,483 92,483 Interest payable - - - - - 12,352 12,352 Accrued expenses and otherliabilities - - - - - 98,872 98,872 Total liabilit ies (excluding Net Assets Attributable to Redeemable Participating Shareholders) 79,644 4,460 1,433,765 137,985 171,590 1,150,345 2,977,789
Net assets attributable to Redeemable Participating Shareholders 7,445,831 1,478,552 43,031,642 4,605,854 5,182,323 1,293,032 63,037,234
Man GLG Unconstrained Emerging EquityAs at 31 December 2016Amounts are expressed in their US$ equivalents
HKD KRW MXN ZAR Other US$ TotalAssetsCash and cash equivalents - - - - 10,208 7,833,279 7,843,487 Balances with brokers 244,412 - - - 5,565 12,136,542 12,386,519 Due from brokers - - - - - 1,349,395 1,349,395 Financial assets at fair value through profit or loss 4,709,982 7,911,778 3,620,469 2,887,688 10,325,175 29,705,182 59,160,274 Subscriptions receivable - - - - - 50,163 50,163 Interest receivable - - - - - 5,137 5,137 Dividend receivable - 146,813 - - 11,891 151,963 310,667 Other assets - - - - - 259,731 259,731 Total assets 4,954,394 8,058,591 3,620,469 2,887,688 10,352,839 51,491,392 81,365,373
Liabilit ies:Balances due to brokers - - - - 2 11,118,678 11,118,680 Due to brokers 53,292 - 41,186 32,925 84,019 1,663,790 1,875,212 Financial liabilities at fair value through profit or loss - - - - 269,474 484,863 754,337 Due to shareholders - - - - - 4,735 4,735 Management fees payable - - - - - 47,422 47,422 Interest payable - - - - - 7,473 7,473 Accrued expenses and otherliabilities - - - - - 80,031 80,031 Total liabilit ies (excluding Net Assets Attributable to Redeemable Participating 53,292 - 41,186 32,925 353,495 13,406,992 13,887,890
Net assets attributable to Redeemable Participating Shareholders 4,901,102 8,058,591 3,579,283 2,854,763 9,999,344 38,084,400 67,477,483

Man Funds VI plc Notes to the Financial Statements (continued) For the year ended 31 December 2016
138
6. Financial risk management (continued) Currency risk (continued)
Man GLG Unconstrained Emerging Equity (continued) As at 31 December 2015Amounts are expressed in their US$ equivalents
HKD JPY MXN ZAR Other US$ TotalAssetsCash and cash equivalents - - - - 16,452 11,854,890 11,871,342 Balances with brokers 276,084 - - - - 18,746,017 19,022,101 Due from brokers - - - - - - - Financial assets at fair value through profit or loss 5,457,182 1,407,845 1,924,913 2,863,456 2,044,443 11,186,245 24,884,084 Interest receivable - - - - - 4,250 4,250 Dividend receivable - - - - 44,711 12,183 56,894 Other assets - - - - - 40,581 40,581 Total assets 5,733,266 1,407,845 1,924,913 2,863,456 2,105,606 41,844,166 55,879,252
Liabilit ies:Balances due to brokers - - - - 14,901 12,071,799 12,086,700 Financial liabilities at fair value through profit or loss - - - - 803,332 36 803,368 Management fees payable - - - - - 27,403 27,403 Interest payable - - - - - 7,210 7,210 Accrued expenses and otherliabilities - - - - - 67,971 67,971 Total liabilit ies (excluding Net Assets Attributable to Redeemable Participating Shareholders) - - - - 818,233 12,174,419 12,992,652
Net assets attributable to Redeemable Participating Shareholders 5,733,266 1,407,845 1,924,913 2,863,456 1,287,373 29,669,747 42,886,600
Man GLG Global Emerging Markets Debt Total ReturnAs at 31 December 2016Amounts are expressed in their US$ equivalents
BRL GBP EUR MXN Other US$ TotalAssetsCash and cash equivalents 152 - - - 2 16,365,677 16,365,831 Balances with brokers - - - - - 31,265,968 31,265,968 Financial assets at fair value through profit or loss 26,748,993 - - 16,582,527 - 444,742,759 488,074,279 Subscriptions receivable - - - - - 100,000 100,000 Interest receivable 1,382,329 - - 312,892 - 4,523,668 6,218,889 Other assets - - - - - 383,450 383,450 Total assets 28,131,474 - - 16,895,419 2 497,381,522 542,408,417
Liabilit ies:Balances due to brokers - - 836 165 1 - 1,002 Financial liabilities at fair value through profit or loss - - - - - 18,957,197 18,957,197 Redemptions payable - - 2,087 - - - 2,087 Due to shareholders - - - - - 6,662 6,662 Performance fees payable - 5,198 612,532 - - 30,232 647,962 Management fees payable - - - - - 229,946 229,946 Interest payable 25,558 - - - 267 - 25,825 Accrued expenses and otherliabilities - - - - - 274,881 274,881 Total liabilit ies (excluding Net Assets Attributable to Redeemable Participating Shareholders) 25,558 5,198 615,455 165 268 19,498,918 20,145,562
Net assets attributable to Redeemable Participating Shareholders 28,105,916 (5,198) (615,455) 16,895,254 (266) 477,882,604 522,262,855

Man Funds VI plc Notes to the Financial Statements (continued) For the year ended 31 December 2016
139
6. Financial risk management (continued) Currency risk (continued) Man GLG Innovation Equity AlternativeAs at 31 December 2016Amounts are expressed in their EUR equivalents
CHF NOK SEK EUR Other US$ TotalAssetsCash and cash equivalents - - - - - 20,000,000 20,000,000 Other assets - - - - - 205 205 Subscriptions receivable 985 596 585 1,107 1,353 - 4,626 Total assets 985 596 585 1,107 1,353 20,000,205 20,004,831
Liabilit ies:Management fees payable - - - - - 546 546 Accrued expenses and otherliabilities - - - - - 386 386 Total liabilit ies (excluding Net Assets Attributable to Redeemable Participating Shareholders) - - - - - 932 932
Net assets attributable to Redeemable Participating Shareholders 985 596 585 1,107 1,353 19,999,273 20,003,899
Man GLG Global Fundamental EquityAs at 31 December 2016Amounts are expressed in their EUR equivalents
CHF NOK SEK US$ Other EUR TotalAssetsCash and cash equivalents - - - - 1,000 - 1,000 Other assets - - - - 115 - 115 Subscriptions receivable 917 538 528 18,073,800 1,225 - 18,077,008 Total assets 917 538 528 18,073,800 2,340 - 18,078,123
Liabilit ies:Accrued expenses and otherliabilities - - 115 - - - 115 Total liabilit ies (excluding Net Assets Attributable to Redeemable Participating Shareholders)
- - 115 - - -
115
Net assets attributable to Redeemable Participating Shareholders 917 538 413 18,073,800 2,340 - 18,078,008
Other price risk Other market price risks arise mainly from uncertainty about future prices of financial instruments held. They represent the potential loss the Fund might suffer through holding market positions in the face of price movements caused by factors specific to the individual investment or factors affecting all instruments traded in the market.

Man Funds VI plc Notes to the Financial Statements (continued) For the year ended 31 December 2016
140
6. Financial risk management (continued)
Credit/counterparty risk The investment Managers performs due diligence on all counterparties before they become a service provider or counterparty to the Fund, and credit quality checks are part of this process. The credit quality of the Fund’s banks, brokers and Depositary is regularly monitored and factored into allocation decisions.
The Fund is exposed to credit/counterparty risk on parties with whom it trades and bears the risk of settlement default. Credit risk is the risk that a counterparty to a financial instrument will fail to discharge an obligation or commitment that it has entered into with the Fund. For example, it represents the financial risk associated with a security issuer (either Government or Corporate) failing to discharge an obligation or commitment, or filing for bankruptcy. The Fund seeks to reduce concentrations of credit risk by undertaking transactions with several customers and counterparties on recognised and reputable exchanges. The Fund only buys and sells investments through brokers which have been approved by the Investment Manager as an acceptable counterparty.
Financial assets which potentially expose the Fund to counterparty credit risk consist principally of investments in cash balances and deposits with and receivables from brokers and other receivables. The extent of the Fund’s exposure to counterparty credit risk in respect of these financial assets approximates their carrying value as recorded in the Fund’s statement of financial position. In addition, where the Fund borrows cash to finance leveraged investments, additional collateral is lodged with the counterparty to provide them with security for potential adverse movements in the collateral. Whilst most finance providers afford some segregated protection for this collateral, this facility may not always be available to the Fund, and consequently can expose the Fund to the credit worthiness of the counterparty.
Credit risk also arises on transactions with brokers related to transactions awaiting settlement. Risks relating to unsettled transactions are considered small due to the short settlement period involved and the high credit quality of the brokers used. Broker balances are primarily due from large reputable institutions and are, thus, considered at minimal risk for default. As delivery versus payment is the standard procedure for trade settlements, there is no significant credit risk arising from transactions settlements.
Credit risk is the risk that an issuer or counterparty will be unable to meet a commitment that it has entered into with the Fund.
The Fund’s maximum exposure to credit risk (not taking into account the value of any collateral or other security held) in the event that the counterparties fail to perform their obligations as of 31 December 2016 in relation to each class of recognised financial assets, including derivatives, is the carrying amount of those assets in the consolidated statement of financial position. Credit risk is mitigated through the diversity of counterparties and regular monitoring of concentration risk.
As at 31 December 2016 the majority of the Fund’s assets were held with ABN Amro Group NV, Bank of America Merrill Lynch, Barclays Plc, BNP Paribas SA, Citibank N.A., Credit Suisse Securities (Europe) Limited, Deutsche Bank AG London, Goldman Sachs International, HSBC Plc, JP Morgan Securities Plc, Macquarie Group, Morgan Stanley & Co. International Plc, Nomura Holdings, Societe Generale, Standard Chartered, The Bank of New York Mellon (London), The Royal Bank of Scotland Plc and UBS AG, , and. (the ‘‘Brokers’’). Each of these counterparties are considered by the Fund to be a highly rated and reputable institution and, thus, the individual and aggregate credit risk exposure is considered to not be significant.
The following tables detail the Fund’s primary exposures to its counterparties:
Credit Rating 31 December 2016 31 December 2015Ratings Agency € €
Man GLG European Alpha AlternativeBank of New York Mellon A1 Moody's 60,430,815 63,794,229 BNP Paribas A1 Moody's 2,994,926 5,000,000 Credit Suisse Securities Europe Limited A1 Moody's 12,665,865 34,288,298 Goldman Sachs International A3 Moody's 2,961,119 - Morgan Stanley & Co. International Plc A3 Moody's 207,418 3,484,946
£ £
Man GLG Alpha Select AlternativeBank of America Merrill Lynch Baa1 Moody's 6,133 - Bank of New York Mellon A1 Moody's 28,048,995 40,352,573 BNP Paribas A1 Moody's 18,565,106 9,311,426 Credit Suisse Securities Europe Limited A1 Moody's 7,572,083 2,629,687 Goldman Sachs International A3 Moody's 471,139 968,635 Morgan Stanley & Co. International Plc A3 Moody's 119,358 22,180
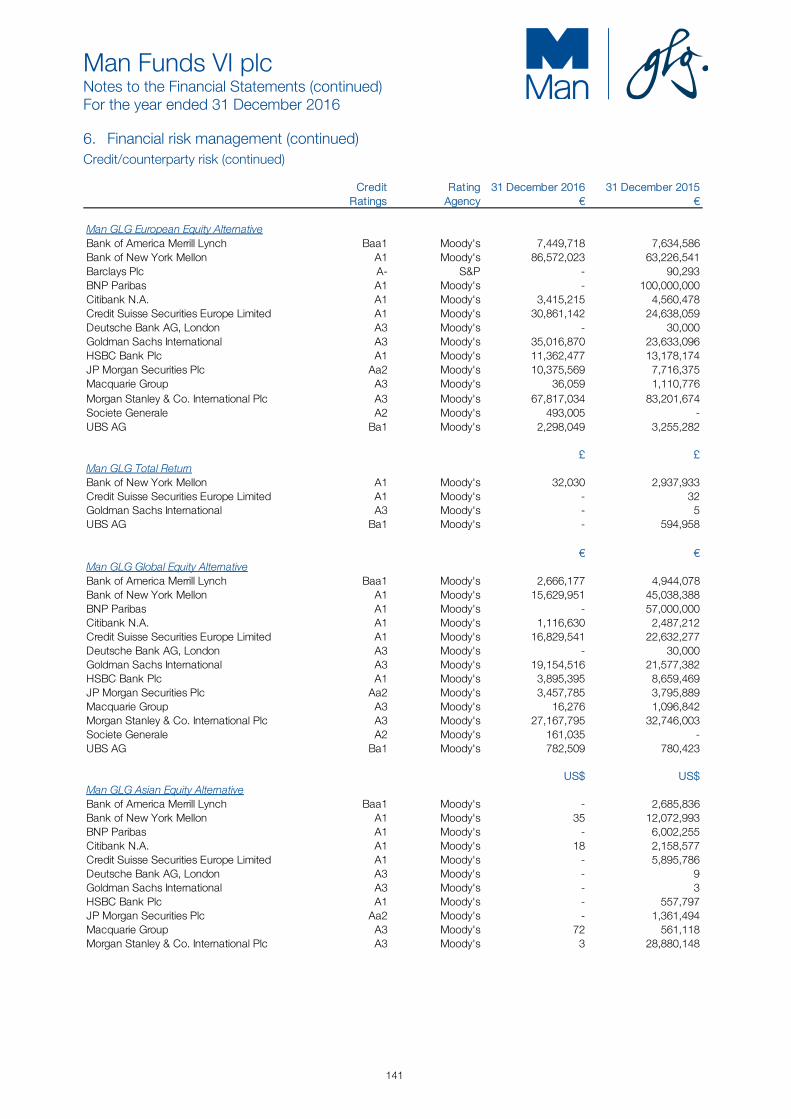
Man Funds VI plc Notes to the Financial Statements (continued) For the year ended 31 December 2016
141
6. Financial risk management (continued) Credit/counterparty risk (continued)
Credit Rating 31 December 2016 31 December 2015Ratings Agency € €
Man GLG European Equity AlternativeBank of America Merrill Lynch Baa1 Moody's 7,449,718 7,634,586 Bank of New York Mellon A1 Moody's 86,572,023 63,226,541 Barclays Plc A- S&P - 90,293 BNP Paribas A1 Moody's - 100,000,000 Citibank N.A. A1 Moody's 3,415,215 4,560,478 Credit Suisse Securities Europe Limited A1 Moody's 30,861,142 24,638,059 Deutsche Bank AG, London A3 Moody's - 30,000 Goldman Sachs International A3 Moody's 35,016,870 23,633,096 HSBC Bank Plc A1 Moody's 11,362,477 13,178,174 JP Morgan Securities Plc Aa2 Moody's 10,375,569 7,716,375 Macquarie Group A3 Moody's 36,059 1,110,776 Morgan Stanley & Co. International Plc A3 Moody's 67,817,034 83,201,674 Societe Generale A2 Moody's 493,005 - UBS AG Ba1 Moody's 2,298,049 3,255,282
£ £
Man GLG Total ReturnBank of New York Mellon A1 Moody's 32,030 2,937,933 Credit Suisse Securities Europe Limited A1 Moody's - 32 Goldman Sachs International A3 Moody's - 5 UBS AG Ba1 Moody's - 594,958
€ €
Man GLG Global Equity AlternativeBank of America Merrill Lynch Baa1 Moody's 2,666,177 4,944,078 Bank of New York Mellon A1 Moody's 15,629,951 45,038,388 BNP Paribas A1 Moody's - 57,000,000 Citibank N.A. A1 Moody's 1,116,630 2,487,212 Credit Suisse Securities Europe Limited A1 Moody's 16,829,541 22,632,277 Deutsche Bank AG, London A3 Moody's - 30,000 Goldman Sachs International A3 Moody's 19,154,516 21,577,382 HSBC Bank Plc A1 Moody's 3,895,395 8,659,469 JP Morgan Securities Plc Aa2 Moody's 3,457,785 3,795,889 Macquarie Group A3 Moody's 16,276 1,096,842 Morgan Stanley & Co. International Plc A3 Moody's 27,167,795 32,746,003 Societe Generale A2 Moody's 161,035 - UBS AG Ba1 Moody's 782,509 780,423
US$ US$
Man GLG Asian Equity AlternativeBank of America Merrill Lynch Baa1 Moody's - 2,685,836 Bank of New York Mellon A1 Moody's 35 12,072,993 BNP Paribas A1 Moody's - 6,002,255 Citibank N.A. A1 Moody's 18 2,158,577 Credit Suisse Securities Europe Limited A1 Moody's - 5,895,786 Deutsche Bank AG, London A3 Moody's - 9 Goldman Sachs International A3 Moody's - 3 HSBC Bank Plc A1 Moody's - 557,797 JP Morgan Securities Plc Aa2 Moody's - 1,361,494 Macquarie Group A3 Moody's 72 561,118 Morgan Stanley & Co. International Plc A3 Moody's 3 28,880,148

Man Funds VI plc Notes to the Financial Statements (continued) For the year ended 31 December 2016
142
6. Financial risk management (continued) Credit/counterparty risk (continued)
Man GLG European Alpha Alternative EnhancedCredit Rating 31 December 2016 31 December 2015
Ratings Agency € €
Bank of New York Mellon A1 Moody's 405,541 9,227,307 Credit Suisse Securities Europe Limited A1 Moody's 317,197 855,289 Morgan Stanley & Co. International Plc A3 Moody's 4,551 3,630,078
Man GLG Cred-Eq AlternativeBank of New York Mellon A1 Moody's 22,851,771 59,877,006 BNP Paribas A1 Moody's 1,888,642 3,500,000 Credit Suisse Securities Europe Limited A1 Moody's 2,998,849 3,237,226 Morgan Stanley & Co. International Plc A3 Moody's 1,060,227 10,365,915
US$ US$Man AHL Multi Strategy AlternativeBank of America Merrill Lynch Baa1 Moody's 3,205,013 2,305,174 Bank of New York Mellon A1 Moody's 44,137,358 100,682,791 BNP Paribas A1 Moody's 22,115,507 22,014,270 Credit Suisse Securities Europe Limited A1 Moody's 10,804,280 7,741,809 Deutsche Bank AG, London A3 Moody's 1,276,656 2,331,577 HSBC Bank Plc A1 Moody's 3,232,863 923,592 JP Morgan Securities Plc Aa2 Moody's 5,953,937 5,635,428 Morgan Stanley & Co. International Plc A3 Moody's 8,227,237 10,936,409 Royal Bank of Scotland Ba1 Moody's 2,325,312 945,611
Man AHL Directional Equities AlternativeBank of New York Mellon A1 Moody's 9,440 31,568,416 BNP Paribas A1 Moody's 110 6,705,054 Credit Suisse Securities Europe Limited A1 Moody's 558 1,425,659 Morgan Stanley & Co. International Plc A3 Moody's - 2,448,952 Royal Bank of Scotland Ba1 Moody's 3 53,949
Man AHL TargetRiskBank of America Merrill Lynch Baa1 Moody's 205,482 190,752 Bank of New York Mellon A1 Moody's 23,061,375 21,068,809 BNP Paribas A1 Moody's 812,792 4,002,797 Credit Suisse Securities Europe Limited A1 Moody's 968,986 488,897 Deutsche Bank AG, London A3 Moody's 16,024 17,164 JP Morgan Securities Plc Aa2 Moody's 3,276,928 853,815 Royal Bank of Scotland Ba1 Moody's 108,512 -
Man AHL Volatility AlternativeBank of America Merrill Lynch Baa1 Moody's 178,626 1,372,685 Bank of New York Mellon A1 Moody's 9,377,203 33,638,460 BNP Paribas A1 Moody's 2,038,030 8,509,605 Credit Suisse Securities Europe Limited A1 Moody's 709,116 1,403,206 Deutsche Bank AG, London A3 Moody's 93,441 760,017 HSBC Bank Plc A1 Moody's 105,856 12,701 JP Morgan Securities Plc Aa2 Moody's 480,372 4,135,109 Royal Bank of Scotland Ba1 Moody's 291,488 389,852
€ €Man GLG European Mid-Cap Equity Alternative
Bank of New York Mellon A1 Moody's 12,076,049 28,177,256 BNP Paribas A1 Moody's - 6,500,000 Credit Suisse Securities Europe Limited A1 Moody's 25,718,847 - Goldman Sachs International A3 Moody's 20,398,279 11,579,468 HSBC Bank Plc A1 Moody's 2,781,037 - Morgan Stanley & Co. International Plc A3 Moody's 355,717 2,503

Man Funds VI plc Notes to the Financial Statements (continued) For the year ended 31 December 2016
143
6. Financial risk management (continued)
Credit/counterparty risk (continued)
Credit Rating 31 December 2016 31 December 2015Ratings Agency US$ US$
Man Numeric Market Neutral AlternativeBank of New York Mellon A1 Moody's 43,189,336 1,829,640 Morgan Stanley & Co. International Plc A3 Moody's 7,301,910 1,177,421
Man GLG Unconstrained Emerging EquityABN AMRO Group NV A1 Moody's - 7,003,082 Bank of New York Mellon A1 Moody's 10,030,971 14,738,035 BNP Paribas A1 Moody's 1,735 4,001,756 Credit Suisse Securities Europe Limited A1 Moody's 742,582 484,889 Deutsche Bank AG, London A3 Moody's 1 - Morgan Stanley & Co. International Plc A3 Moody's 12,799,538 15,307,103
Man GLG Global Emerging Markets Debt Total ReturnBank of New York Mellon A1 Moody's 462,540,380 n/a Barclays Plc A- S&P 8,397,592 n/a Citibank N.A. A1 Moody's 727,558 n/a Deutsche Bank AG, London A3 Moody's 50,106 n/a HSBC Bank Plc A1 Moody's 21,080,443 n/a JP Morgan Securities Plc Aa2 Moody's 907,916 n/a Standard Chartered Plc Aa3 Moody's 974,861 n/a UBS AG Ba1 Moody's 19,452,676 n/a
Man GLG Innovation Equity AlternativeBank of New York Mellon A1 Moody's 20,004,626 n/a
€ €
Man GLG Global Fundamental EquityBank of New York Mellon A1 Moody's 18,078,008 n/a
In addition, at 31 December 2016, the Fund had credit risk exposure equivalent to US$97,925,000 (31 December 2015: US$136,817) on credit instruments over which it has sold protection to third parties through credit default swaps.
The below tables show the breakdown by Credit Spread of all credit securities held in the portfolio. This does not include any non-credit hedges held against these (for example equity securities) or deposits held with credit institutions. The “Credit Spread” is the measure which reflects the difference in yield of a credit security relative to an assumed credit risk-free security. For some security classes, the Credit Spread is the quotation method used by the market. For others, the Credit Spread is implied from the market price. Spread Credit Securities Credit Securities
31 December 2016 31 December 2015 £ £
Man GLG Alpha Select Alternative <25 62,029,420 13,126,343
62,029,420 13,126,343
Man GLG Credit-Eq Alternative € €<25 - 7,749,705 25-100 9,165,915 27,134,581 100-200 2,471,701 17,863,060 200-300 2,328,967 2,115,560 300-400 2,314,448 250,500 400-500 86,025 4,691,829 500-700 289,500 74,618 700-1000 2,721,627 -
19,825,419 59,879,853 As at 31 December 2016, the value of the Portfolio’s assets which are considered to be past due or impaired was US$1,408 (2015: US$Nil).
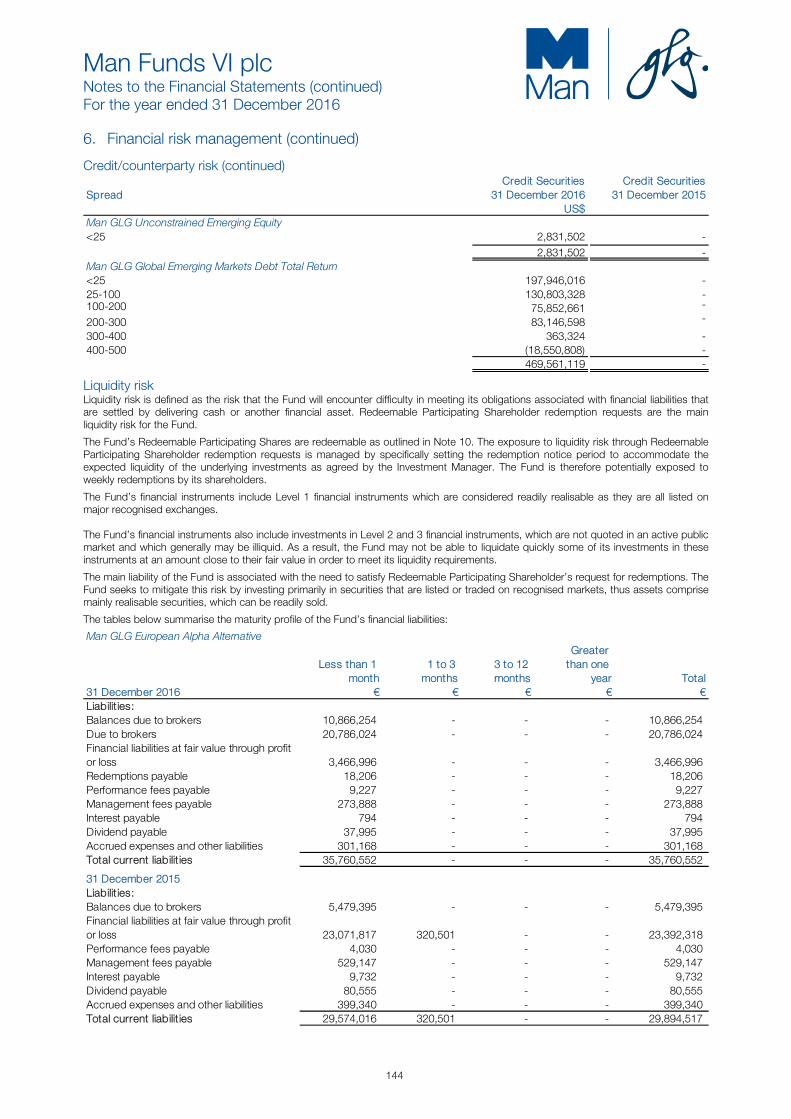
Man Funds VI plc Notes to the Financial Statements (continued) For the year ended 31 December 2016
144
6. Financial risk management (continued)
Credit/counterparty risk (continued) Credit Securities Credit Securities
Spread 31 December 2016 31 December 2015 US$
Man GLG Unconstrained Emerging Equity<25 2,831,502 -
2,831,502 - Man GLG Global Emerging Markets Debt Total Return<25 197,946,016 - 25-100 130,803,328 - 100-200 75,852,661 -
200-300 83,146,598 -
300-400 363,324 - 400-500 (18,550,808) -
469,561,119 -
Liquidity risk Liquidity risk is defined as the risk that the Fund will encounter difficulty in meeting its obligations associated with financial liabilities that are settled by delivering cash or another financial asset. Redeemable Participating Shareholder redemption requests are the main liquidity risk for the Fund.
The Fund’s Redeemable Participating Shares are redeemable as outlined in Note 10. The exposure to liquidity risk through Redeemable Participating Shareholder redemption requests is managed by specifically setting the redemption notice period to accommodate the expected liquidity of the underlying investments as agreed by the Investment Manager. The Fund is therefore potentially exposed to weekly redemptions by its shareholders.
The Fund’s financial instruments include Level 1 financial instruments which are considered readily realisable as they are all listed on major recognised exchanges. The Fund’s financial instruments also include investments in Level 2 and 3 financial instruments, which are not quoted in an active public market and which generally may be illiquid. As a result, the Fund may not be able to liquidate quickly some of its investments in these instruments at an amount close to their fair value in order to meet its liquidity requirements.
The main liability of the Fund is associated with the need to satisfy Redeemable Participating Shareholder’s request for redemptions. The Fund seeks to mitigate this risk by investing primarily in securities that are listed or traded on recognised markets, thus assets comprise mainly realisable securities, which can be readily sold.
The tables below summarise the maturity profile of the Fund’s financial liabilities:
Man GLG European Alpha Alternative
Less than 1 month
1 to 3 months
3 to 12 months
Greater than one
year Total31 December 2016 € € € € €Liabilit ies:Balances due to brokers 10,866,254 - - - 10,866,254 Due to brokers 20,786,024 - - - 20,786,024 Financial liabilities at fair value through profit or loss 3,466,996 - - - 3,466,996 Redemptions payable 18,206 - - - 18,206 Performance fees payable 9,227 - - - 9,227 Management fees payable 273,888 - - - 273,888 Interest payable 794 - - - 794 Dividend payable 37,995 - - - 37,995 Accrued expenses and other liabilities 301,168 - - - 301,168 Total current liabilit ies 35,760,552 - - - 35,760,552
31 December 2015Liabilit ies:Balances due to brokers 5,479,395 - - - 5,479,395 Financial liabilities at fair value through profit or loss 23,071,817 320,501 - - 23,392,318 Performance fees payable 4,030 - - - 4,030 Management fees payable 529,147 - - - 529,147 Interest payable 9,732 - - - 9,732 Dividend payable 80,555 - - - 80,555 Accrued expenses and other liabilities 399,340 - - - 399,340 Total current liabilit ies 29,574,016 320,501 - - 29,894,517

Man Funds VI plc Notes to the Financial Statements (continued) For the year ended 31 December 2016
145
6. Financial risk management (continued)
Liquidity risk (continued) Man GLG Alpha Select Alternative
Less than 1 month
1 to 3 months
3 to 12 months
Greater than one
year Total31 December 2016 £ £ £ £ £Liabilit ies:Balances due to brokers 68,353 - - - 68,353 Due to brokers 89,449 - - - 89,449 Financial liabilities at fair value through profit or loss 4,427,342 109,880 - - 4,537,222 Performance fees payable 11,560 - - - 11,560 Management fees payable 110,986 - - - 110,986 Interest payable 3,416 - - - 3,416 Dividend payable 226,067 - - - 226,067 Accrued expenses and other liabilities 123,848 - - - 123,848 Total current liabilit ies 5,061,021 109,880 - - 5,170,901
31 December 2015Liabilit ies:Balances due to brokers 119,068 - - - 119,068 Due to brokers 3,189,723 - - - 3,189,723 Financial liabilities at fair value through profit or loss 897,094 605,120 - - 1,502,214 Performance fees payable 448,335 - - - 448,335 Management fees payable 92,386 - - - 92,386 Interest payable 8,789 - - - 8,789 Dividend payable 47,149 - - - 47,149 Accrued expenses and other liabilities 118,442 - - - 118,442 Total current liabilit ies 4,920,986 605,120 - - 5,526,106
Man GLG European Equity Alternative31 December 2016 € € € € €Liabilit ies:Balances due to brokers 32,632,212 - - - 32,632,212 Due to brokers 14,865,890 - - - 14,865,890 Financial liabilities at fair value through profit or loss 53,849,929 2,709,954 4,491,831 68,291 61,120,005 Redemptions payable 176,235 - - - 176,235 Performance fees payable 1,251,518 - - - 1,251,518 Management fees payable 1,179,921 - - - 1,179,921 Interest payable 117,789 - - - 117,789 Dividend payable 991,810 - - - 991,810 Accrued expenses and other liabilities 752,374 - - - 752,374 Total current liabilit ies 105,817,678 2,709,954 4,491,831 68,291 113,087,754
31 December 2015Liabilit ies:Balances due to brokers 36,476,900 - - - 36,476,900 Due to brokers 10,780,967 - - - 10,780,967 Financial liabilities at fair value through profit or loss 30,502,584 3,706,769 88,076 - 34,297,429 Performance fees payable 1,814,502 - - - 1,814,502 Management fees payable 1,512,905 - - - 1,512,905 Interest payable 193,365 - - - 193,365 Dividend payable 455,092 - - - 455,092 Accrued expenses and other liabilities 492,391 - - - 492,391 Total current liabilit ies 82,228,706 3,706,769 88,076 - 86,023,551
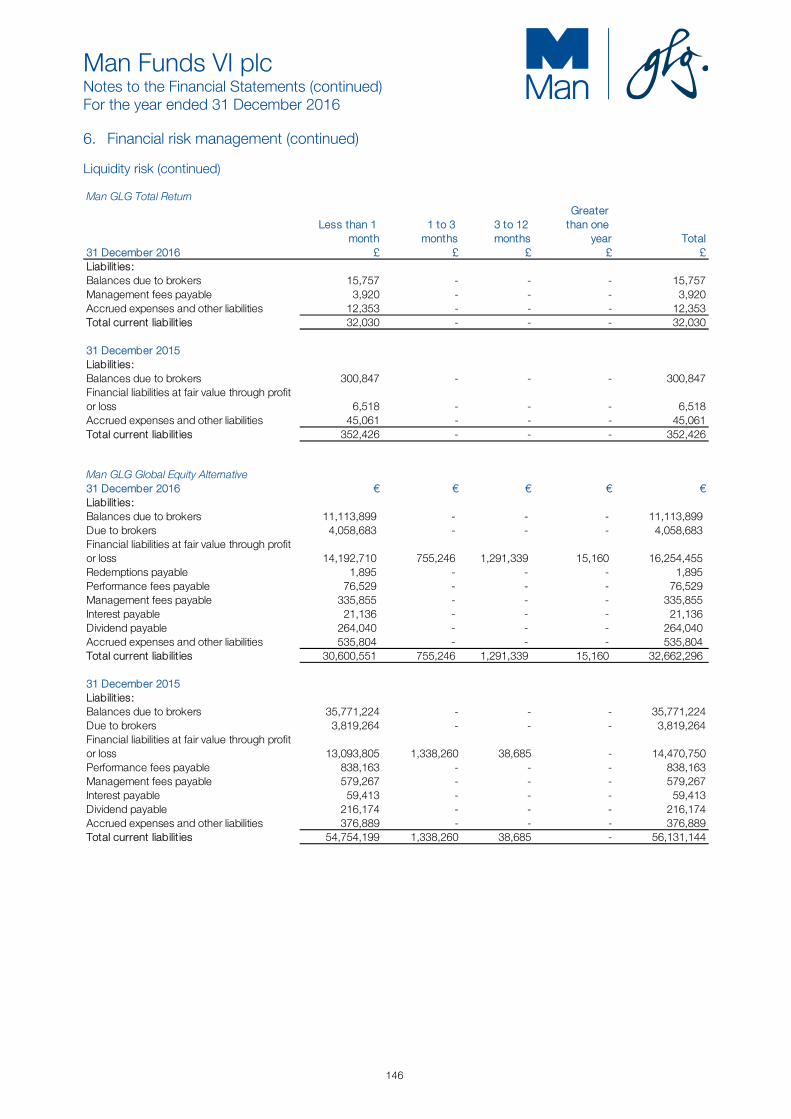
Man Funds VI plc Notes to the Financial Statements (continued) For the year ended 31 December 2016
146
6. Financial risk management (continued)
Liquidity risk (continued) Man GLG Total Return
Less than 1 month
1 to 3 months
3 to 12 months
Greater than one
year Total31 December 2016 £ £ £ £ £Liabilit ies:Balances due to brokers 15,757 - - - 15,757 Management fees payable 3,920 - - - 3,920 Accrued expenses and other liabilities 12,353 - - - 12,353 Total current liabilit ies 32,030 - - - 32,030
31 December 2015Liabilit ies:Balances due to brokers 300,847 - - - 300,847 Financial liabilities at fair value through profit or loss 6,518 - - - 6,518 Accrued expenses and other liabilities 45,061 - - - 45,061 Total current liabilit ies 352,426 - - - 352,426
Man GLG Global Equity Alternative31 December 2016 € € € € €Liabilit ies:Balances due to brokers 11,113,899 - - - 11,113,899 Due to brokers 4,058,683 - - - 4,058,683 Financial liabilities at fair value through profit or loss 14,192,710 755,246 1,291,339 15,160 16,254,455 Redemptions payable 1,895 - - - 1,895 Performance fees payable 76,529 - - - 76,529 Management fees payable 335,855 - - - 335,855 Interest payable 21,136 - - - 21,136 Dividend payable 264,040 - - - 264,040 Accrued expenses and other liabilities 535,804 - - - 535,804 Total current liabilit ies 30,600,551 755,246 1,291,339 15,160 32,662,296
31 December 2015Liabilit ies:Balances due to brokers 35,771,224 - - - 35,771,224 Due to brokers 3,819,264 - - - 3,819,264 Financial liabilities at fair value through profit or loss 13,093,805 1,338,260 38,685 - 14,470,750 Performance fees payable 838,163 - - - 838,163 Management fees payable 579,267 - - - 579,267 Interest payable 59,413 - - - 59,413 Dividend payable 216,174 - - - 216,174 Accrued expenses and other liabilities 376,889 - - - 376,889 Total current liabilit ies 54,754,199 1,338,260 38,685 - 56,131,144

Man Funds VI plc Notes to the Financial Statements (continued) For the year ended 31 December 2016
147
6. Financial risk management (continued)
Liquidity risk (continued) Man GLG Asian Equity Alternative
Less than 1 month
1 to 3 months
3 to 12 months
Greater than one
year Total31 December 2016 US$ US$ US$ US$ US$Liabilit ies:Balances due to brokers 22 - - - 22 Accrued expenses and other liabilities 197 - - - 197 Total current liabilit ies 219 - - - 219
31 December 2015Liabilit ies:Balances due to brokers 2,594,978 - - - 2,594,978 Financial liabilities at fair value through profit or loss 2,936,367 166,304 - - 3,102,671 Performance fees payable 30,372 - - - 30,372 Management fees payable 144,815 - - - 144,815 Accrued expenses and other liabilities 188,636 - - - 188,636 Total current liabilit ies 5,895,168 166,304 - - 6,061,472
Man GLG European Alpha Alternative Enhanced31 December 2016 € € € € €Liabilit ies:Balances due to brokers 717,664 - - - 717,664 Performance fees payable 1,955 - - - 1,955 Management fees payable 11,008 - - - 11,008 Dividend payable 2,039 - - - 2,039 Accrued expenses and other liabilities 68,989 - - - 68,989 Total current liabilit ies 801,655 - - - 801,655
31 December 2015Liabilit ies:Balances due to brokers 5,718,629 - - - 5,718,629 Due to brokers 7,902 - - - 7,902 Financial liabilities at fair value through profit or loss 1,674,610 40,063 - - 1,714,673 Management fees payable 52,835 - - - 52,835 Interest payable 657 - - - 657 Dividend payable 10,322 - - - 10,322 Accrued expenses and other liabilities 63,621 - - - 63,621 Total current liabilit ies 7,528,576 40,063 - - 7,568,639
Man GLG Cred-Eq Alternative31 December 2016Liabilit ies:Balances due to brokers 1,877 - - - 1,877 Financial liabilities at fair value through profit or loss 1,596,449 - - - 1,596,449 Redemptions payable 1,293 - - - 1,293 Performance fees payable 19,032 - - - 19,032 Management fees payable 33,082 - - - 33,082 Accrued expenses and other liabilities 116,402 - - - 116,402 Total current liabilit ies 1,768,135 - - - 1,768,135

Man Funds VI plc Notes to the Financial Statements (continued) For the year ended 31 December 2016
148
6. Financial risk management (continued)
Liquidity risk (continued)
Man GLG Cred-Eq Alternative (continued)
Less than 1 month
1 to 3 months
3 to 12 months
Greater than one
year Total31 December 2015 € € € € €Liabilit ies:Balances due to brokers 1,616,265 - - - 1,616,265 Financial liabilities at fair value through profit or loss 6,806,905 375,932 - - 7,182,837 Performance fees payable 2,686 - - - 2,686 Management fees payable 149,326 - - - 149,326 Accrued expenses and other liabilities 102,626 - - - 102,626 Total current liabilit ies 8,677,808 375,932 - - 9,053,740
Man AHL Multi Strategy Alternative31 December 2016 US$ US$ US$ US$ US$Liabilit ies:Balances due to brokers 2,874,506 - - - 2,874,506 Due to brokers 83,930 - - - 83,930 Financial liabilities at fair value through profit or loss 10,119,841 918,082 19,243 16,270 11,073,436 Performance fees payable 869 - - - 869 Management fees payable 253,301 - - - 253,301 Dividend payable 98,588 - - - 98,588 Accrued expenses and other liabilities 806,646 - - - 806,646 Total current liabilit ies 14,237,681 918,082 19,243 16,270 15,191,276
31 December 2015Liabilit ies:Balances due to brokers 929,316 - - - 929,316 Due to brokers 90,245 - - - 90,245 Financial liabilities at fair value through profit or loss 5,434,676 3,786,822 38,544 150,650 9,410,692 Management fees payable 274,603 - - - 274,603 Dividend payable 11,964 - - - 11,964 Accrued expenses and other liabilities 121,051 - - - 121,051 Total current liabilit ies 6,861,855 3,786,822 38,544 150,650 10,837,871
Man AHL Directional Equities Alternative31 December 2016Liabilit ies:Balances due to brokers 4,748 - - - 4,748 Accrued expenses and other liabilities 5,363 - - - 5,363 Total current liabilit ies 10,111 - - - 10,111
31 December 2015Liabilit ies:Balances due to brokers 179,328 - - - 179,328 Due to brokers 62,786 - - - 62,786 Financial liabilities at fair value through profit or loss 1,354,113 - - - 1,354,113 Management fees payable 40,495 - - - 40,495 Interest payable 4,201 - - - 4,201 Dividend payable 35,925 - - - 35,925 Accrued expenses and other liabilities 67,779 - - - 67,779 Total current liabilit ies 1,744,627 - - - 1,744,627
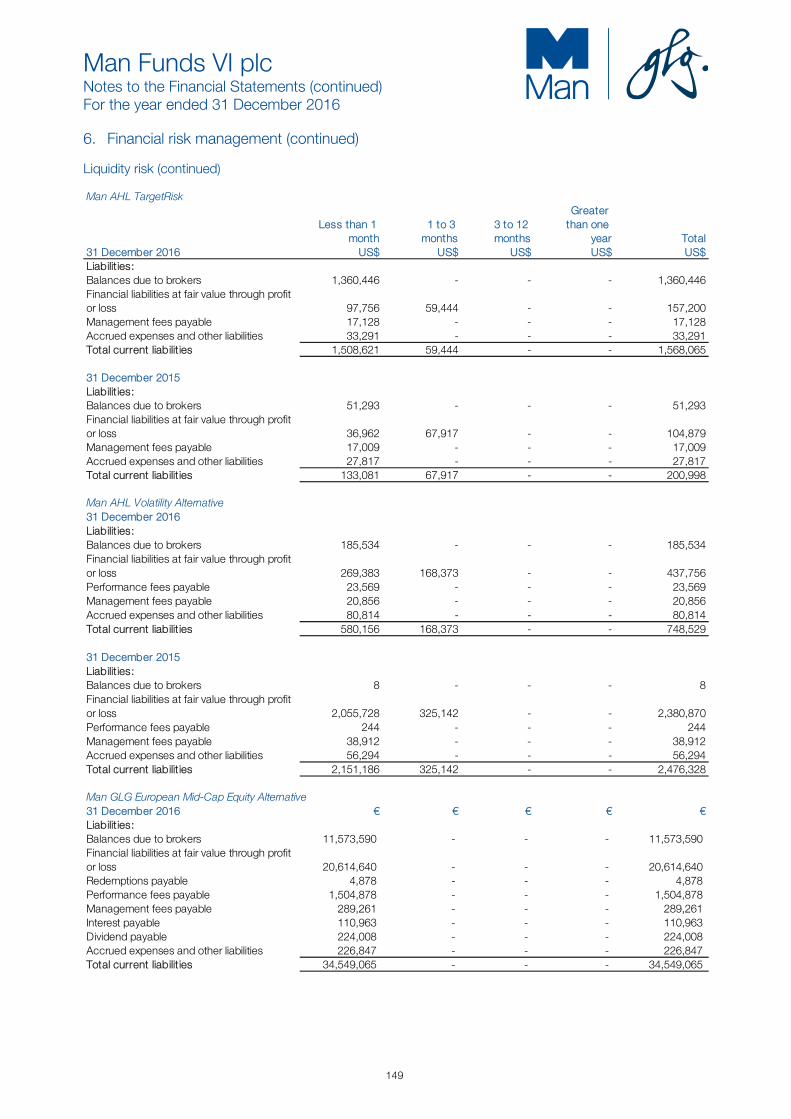
Man Funds VI plc Notes to the Financial Statements (continued) For the year ended 31 December 2016
149
6. Financial risk management (continued)
Liquidity risk (continued) Man AHL TargetRisk
Less than 1 month
1 to 3 months
3 to 12 months
Greater than one
year Total31 December 2016 US$ US$ US$ US$ US$Liabilit ies:Balances due to brokers 1,360,446 - - - 1,360,446 Financial liabilities at fair value through profit or loss 97,756 59,444 - - 157,200 Management fees payable 17,128 - - - 17,128 Accrued expenses and other liabilities 33,291 - - - 33,291 Total current liabilit ies 1,508,621 59,444 - - 1,568,065
31 December 2015Liabilit ies:Balances due to brokers 51,293 - - - 51,293 Financial liabilities at fair value through profit or loss 36,962 67,917 - - 104,879 Management fees payable 17,009 - - - 17,009 Accrued expenses and other liabilities 27,817 - - - 27,817 Total current liabilit ies 133,081 67,917 - - 200,998
Man AHL Volatility Alternative31 December 2016Liabilit ies:Balances due to brokers 185,534 - - - 185,534 Financial liabilities at fair value through profit or loss 269,383 168,373 - - 437,756 Performance fees payable 23,569 - - - 23,569 Management fees payable 20,856 - - - 20,856 Accrued expenses and other liabilities 80,814 - - - 80,814 Total current liabilit ies 580,156 168,373 - - 748,529
31 December 2015Liabilit ies:Balances due to brokers 8 - - - 8 Financial liabilities at fair value through profit or loss 2,055,728 325,142 - - 2,380,870 Performance fees payable 244 - - - 244 Management fees payable 38,912 - - - 38,912 Accrued expenses and other liabilities 56,294 - - - 56,294 Total current liabilit ies 2,151,186 325,142 - - 2,476,328
Man GLG European Mid-Cap Equity Alternative31 December 2016 € € € € €Liabilit ies:Balances due to brokers 11,573,590 - - - 11,573,590 Financial liabilities at fair value through profit or loss 20,614,640 - - - 20,614,640 Redemptions payable 4,878 - - - 4,878 Performance fees payable 1,504,878 - - - 1,504,878 Management fees payable 289,261 - - - 289,261 Interest payable 110,963 - - - 110,963 Dividend payable 224,008 - - - 224,008 Accrued expenses and other liabilities 226,847 - - - 226,847 Total current liabilit ies 34,549,065 - - - 34,549,065

Man Funds VI plc Notes to the Financial Statements (continued) For the year ended 31 December 2016
150
6. Financial risk management (continued) Liquidity risk (continued)
Man GLG European Mid-Cap Equity Alternative (continued)
Less than 1 month
1 to 3 months
3 to 12 months
Greater than one
year Total31 December 2015 € € € € €Liabilit ies:Balances due to brokers 8,004,140 - - - 8,004,140 Due to brokers 697,246 - - - 697,246 Financial liabilities at fair value through profit or loss 4,927,093 - - - 4,927,093 Performance fees payable 454,543 - - - 454,543 Management fees payable 133,300 - - - 133,300 Dividend payable 16,549 - - - 16,549 Accrued expenses and other liabilities 64,237 - - - 64,237 Total current liabilit ies 14,297,108 - - - 14,297,108
Man Numeric Market Neutral Alternative31 December 2016 US$ US$ US$ US$ US$Liabilit ies:Balances due to brokers 4,279,426 - - - 4,279,426 Due to brokers 32,582,718 - - - 32,582,718 Financial liabilities at fair value through profit or loss 4,794,032 - - - 4,794,032 Performance fees payable 875,644 - - - 875,644 Management fees payable 157,736 - - - 157,736 Interest payable 34,756 - - - 34,756 Accrued expenses and other liabilities 88,676 - - - 88,676 Total current liabilit ies 42,812,988 - - - 42,812,988
31 December 2015Liabilit ies:Balances due to brokers 831,755 - - - 831,755 Financial liabilities at fair value through profit or loss 1,942,327 - - - 1,942,327 Management fees payable 92,483 - - - 92,483 Interest payable 12,352 - - - 12,352 Accrued expenses and other liabilities 98,872 - - - 98,872 Total current liabilit ies 2,977,789 - - - 2,977,789
Man GLG Unconstrained Emerging Equity31 December 2016Liabilit ies:Balances due to brokers 11,118,680 - - - 11,118,680 Due to brokers 1,875,212 - - - 1,875,212 Financial liabilities at fair value through profit or loss 269,522 - 484,815 - 754,337 Due to shareholders 4,735 - - - 4,735 Management fees payable 47,422 - - - 47,422 Interest payable 7,473 - - - 7,473 Accrued expenses and other liabilities 80,031 - - - 80,031 Total current liabilit ies 13,403,075 - 484,815 - 13,887,890
31 December 2015Liabilit ies:Balances due to brokers 12,086,700 - - - 12,086,700 Financial liabilities at fair value through profit or loss 803,368 - - - 803,368 Management fees payable 27,403 - - - 27,403 Interest payable 7,210 - - - 7,210 Accrued expenses and other liabilities 67,971 - - - 67,971 Total current liabilit ies 12,992,652 - - - 12,992,652

Man Funds VI plc Notes to the Financial Statements (continued) For the year ended 31 December 2016
151
6. Financial risk management (continued)
Liquidity risk (continued) Man GLG Global Emerging Markets Debt Total Return
Less than 1 month
1 to 3 months
3 to 12 months
Greater than one
year Total31 December 2016 US$ US$ US$ US$ US$Liabilit ies:Balances due to brokers 1,002 - - - 1,002 Financial liabilities at fair value through profit or loss 9,823,033 3,180,047 2,083,084 3,871,033 18,957,197 Redemptions payable 2,087 - - - 2,087 Due to shareholders 6,662 - - - 6,662 Performance fees payable 647,962 - - - 647,962 Management fees payable 229,946 - - - 229,946 Interest payable 25,825 - - - 25,825 Accrued expenses and other liabilities 274,881 - - - 274,881 Total current liabilit ies 11,011,398 3,180,047 2,083,084 3,871,033 20,145,562
Man GLG Innovation Equity Alternative31 December 2016Liabilit ies:Management fees payable 546 - - - 546 Accrued expenses and other liabilities 386 - - - 386 Total current liabilit ies 932 - - - 932
Man GLG Global Fundamental Equity31 December 2016 € € € € €Liabilit ies:Accrued expenses and other liabilities 115 - - - 115 Total current liabilit ies 115 - - - 115
Option writing As a writer of options, the Fund receives a premium at the outset and then bears the risk of unfavorable changes in the price of the financial instrument underlying the option. As a result of writing option contracts, the Fund is obligated to purchase or sell, at the holder’s option, the underlying financial instrument at a fixed price which may differ from the prevailing market price at that date. Writing options may incur losses which greatly exceed the premium income received. Securities sold short Securities sold short are those in which a security is sold that the Fund does not own in anticipation of a decline in the market value of the security. The Fund’s risk is that the value of the security will increase rather than decrease. Consequently, the settlement amount of the liability for securities sold short may exceed the amount recorded in the statement of financial position, as the Fund is obligated to purchase the security in the market at prevailing prices to settle its obligations.

Man Funds VI plc Notes to the Financial Statements (continued) For the year ended 31 December 2016
152
7. Net gain/(loss) on financial assets and liabilities at fair value through profit or loss
Combined Company
Man GLG European
Alpha Alternative
Man GLG Alpha Select
Alternative
Man GLG European
Equity Alternative
2016 2016 2016 2016
US$ € £ €Interest income 9,613,572 47,734 272,525 110,335 Interest expense (20,704,161) (1,243,049) (569,660) (9,089,777)Dividend income 67,647,156 6,254,045 2,061,084 31,960,737 Dividend expense (61,855,987) (4,294,267) (1,984,609) (31,454,411)
(5,299,420) 764,463 (220,660) (8,473,116)
Realised and unrealised (loss)/gain on investments and foreign currency
Net realised (loss)/gain on investments (11,790,182) (19,331,740) 20,406,382 407,525 Net realised foreign currency gain/(loss) 21,436,387 2,388,176 (6,049,928) 17,030,464
9,646,205 (16,943,564) 14,356,454 17,437,989
Movement in net unrealised gain/(loss) on investments 15,966,749 16,753,395 14,796 (17,619,631)Movement in net unrealised foreign currency (loss)/gain (679,894) (5,474) (14,782) (472,698)
15,286,855 16,747,921 14 (18,092,329)
Net (loss)/gain on financial assets and liabilit ies at fair value through profit or loss 19,633,640 568,820 14,135,808 (9,127,456)
Man GLG Total Return
Man GLG Global Equity
Alternative
Man GLG Asian Equity
Alternative
Man GLG European
Alpha Alternative Enhanced
2016 2016 2016 2016£ € US$ €
Interest income 4,047 501,607 75,454 4,735 Interest expense (9,136) (3,493,082) (135,677) (101,655)Dividend income - 11,290,262 160,131 644,310 Dividend expense - (11,651,027) (82,062) (437,273)
(5,089) (3,352,240) 17,846 110,117
Realised and unrealised (loss)/gain on investments and foreign currencyNet realised (loss)/gain on investments (535,150) 4,178,637 813,349 (1,043,367)Net realised foreign currency gain/(loss) 204,028 6,269,773 (2,355,133) (385,129)
(331,122) 10,448,410 (1,541,784) (1,428,496)
Movement in net unrealised gain/(loss) on investments 604,872 (6,986,443) (4,683,585) 905,703 10,594.00 242,664 (49,857) (6,807) 615,466 (6,743,779) (4,733,442) 898,896
Net (loss)/gain on financial assets and liabilit ies at fair value through profit or loss 279,255 352,391 (6,257,380) (419,483)
Movement in net unrealised foreign currency (loss)/gain
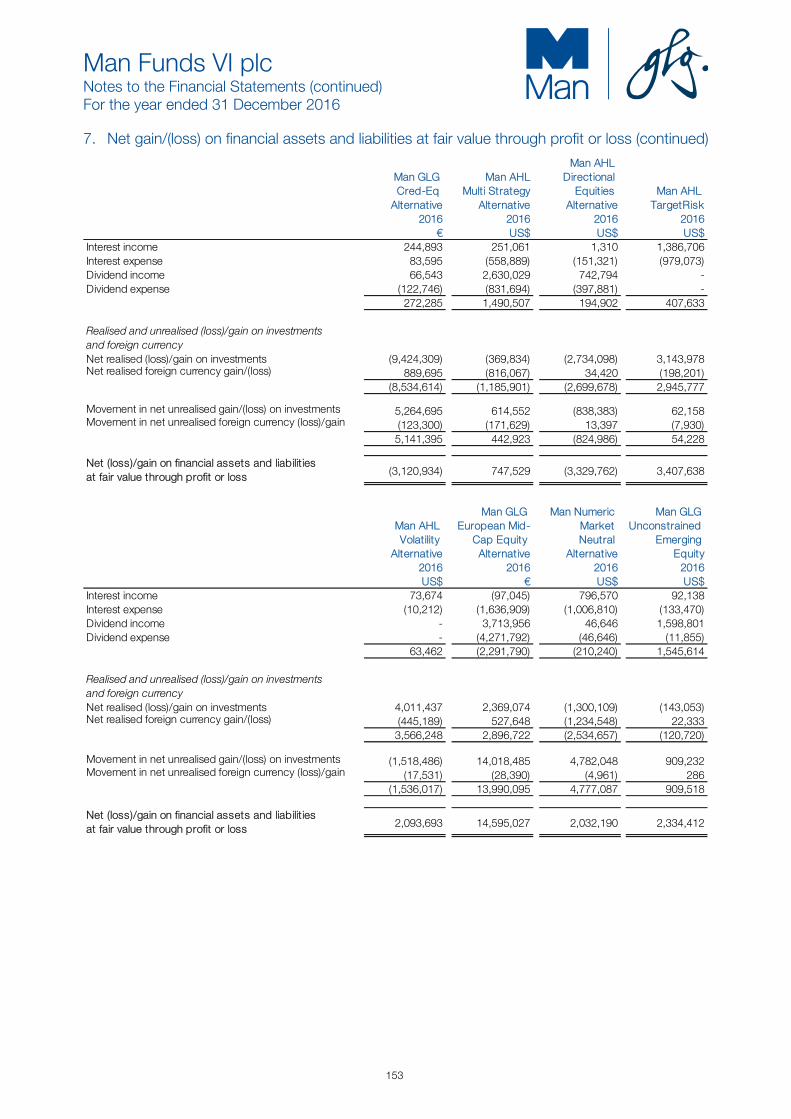
Man Funds VI plc Notes to the Financial Statements (continued) For the year ended 31 December 2016
153
7. Net gain/(loss) on financial assets and liabilities at fair value through profit or loss (continued)
Man GLG Cred-Eq
Alternative
Man AHL Multi Strategy
Alternative
Man AHL Directional
Equities Alternative
Man AHL TargetRisk
2016 2016 2016 2016€ US$ US$ US$
Interest income 244,893 251,061 1,310 1,386,706 Interest expense 83,595 (558,889) (151,321) (979,073)Dividend income 66,543 2,630,029 742,794 - Dividend expense (122,746) (831,694) (397,881) -
272,285 1,490,507 194,902 407,633
Realised and unrealised (loss)/gain on investments and foreign currencyNet realised (loss)/gain on investments (9,424,309) (369,834) (2,734,098) 3,143,978 Net realised foreign currency gain/(loss) 889,695 (816,067) 34,420 (198,201)
(8,534,614) (1,185,901) (2,699,678) 2,945,777
Movement in net unrealised gain/(loss) on investments 5,264,695 614,552 (838,383) 62,158 (123,300) (171,629) 13,397 (7,930) 5,141,395 442,923 (824,986) 54,228
Net (loss)/gain on financial assets and liabilit ies at fair value through profit or loss (3,120,934) 747,529 (3,329,762) 3,407,638
Movement in net unrealised foreign currency (loss)/gain
Man AHL Volatility
Alternative
Man GLG European Mid-
Cap Equity Alternative
Man Numeric Market Neutral
Alternative
Man GLG Unconstrained
Emerging Equity
2016 2016 2016 2016US$ € US$ US$
Interest income 73,674 (97,045) 796,570 92,138 Interest expense (10,212) (1,636,909) (1,006,810) (133,470)Dividend income - 3,713,956 46,646 1,598,801 Dividend expense - (4,271,792) (46,646) (11,855)
63,462 (2,291,790) (210,240) 1,545,614
Realised and unrealised (loss)/gain on investments and foreign currencyNet realised (loss)/gain on investments 4,011,437 2,369,074 (1,300,109) (143,053)Net realised foreign currency gain/(loss) (445,189) 527,648 (1,234,548) 22,333
3,566,248 2,896,722 (2,534,657) (120,720)
Movement in net unrealised gain/(loss) on investments (1,518,486) 14,018,485 4,782,048 909,232 (17,531) (28,390) (4,961) 286 (1,536,017) 13,990,095 4,777,087 909,518
Net (loss)/gain on financial assets and liabilit ies at fair value through profit or loss 2,093,693 14,595,027 2,032,190 2,334,412
Movement in net unrealised foreign currency (loss)/gain

Man Funds VI plc Notes to the Financial Statements (continued) For the year ended 31 December 2016
154
7. Net gain/(loss) on financial assets and liabilities at fair value through profit or loss (continued)
Man GLG Global
Emerging Markets Debt
Total Return2016US$
Interest income 5,663,304 Interest expense 185,908 Dividend income - Dividend expense -
5,849,212
Realised and unrealised (loss)/gain on investments and foreign currencyNet realised (loss)/gain on investments (16,841,966)Net realised foreign currency gain/(loss) 4,776,603
(12,065,363)
Movement in net unrealised gain/(loss) on investments 2,149,081 - 2,149,081
Net (loss)/gain on financial assets and liabilit ies at fair value through profit or loss (4,067,070)
Movement in net unrealised foreign currency (loss)/gain
Combined Company
Man GLG European
Alpha Alternative
Man GLG Alpha Select
Alternative
*Man GLG Atlas Macro
Alternative
2015 2015 2015 2015
US$ € £ US$ Interest income 6,899,480 5,353 701,279 101 Interest expense (17,918,961) (1,814,644) (711,861) (242,556)Dividend income 55,782,165 8,104,661 1,473,485 - Dividend expense (48,547,449) (6,113,831) (1,314,463) -
(3,784,765) 181,539 148,440 (242,455)Realised and unrealised gain/(loss) on investments and foreign currencyNet realised gain/(loss) on investments 125,141,868 18,918,021 11,276,023 (18,023,712)Net realised foreign currency gain/(loss) 43,535,081 3,293,636 (1,441,172) 5,406,653
168,676,949 22,211,657 9,834,851 (12,617,059)
Movement in net unrealised (loss)/gain on investments 33,539,998 (5,878,516) (1,597,719) 2,725,091 Movement in net unrealised foreign currency (loss)/gain (34,854,563) (145,315) 36,975 (2,069,457)
(1,314,565) (6,023,831) (1,560,744) 655,634
Net gain/(loss) on financial assets and liabilit ies at fair value through profit or loss
163,577,619 16,369,365 8,422,547 (12,203,880)
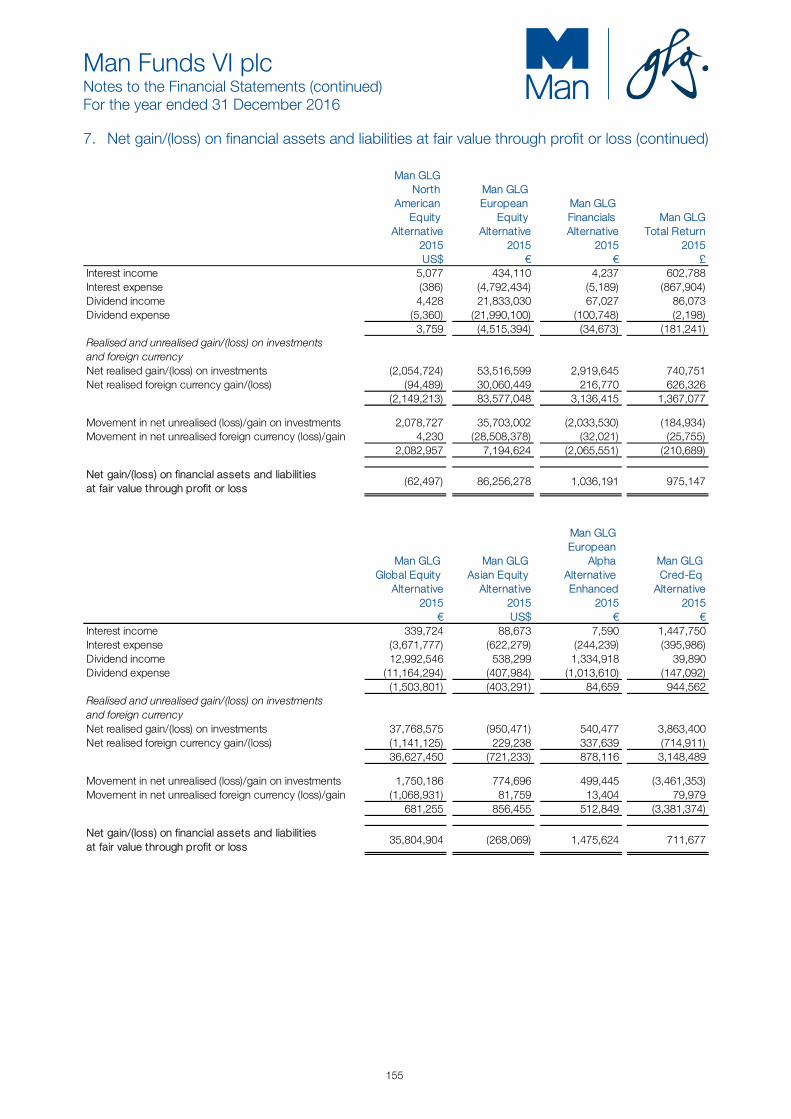
Man Funds VI plc Notes to the Financial Statements (continued) For the year ended 31 December 2016
155
7. Net gain/(loss) on financial assets and liabilities at fair value through profit or loss (continued)
Man GLG North
American Equity
Alternative
Man GLG European
Equity Alternative
Man GLG Financials Alternative
Man GLG Total Return
2015 2015 2015 2015 US$ € € £
Interest income 5,077 434,110 4,237 602,788 Interest expense (386) (4,792,434) (5,189) (867,904)Dividend income 4,428 21,833,030 67,027 86,073 Dividend expense (5,360) (21,990,100) (100,748) (2,198)
3,759 (4,515,394) (34,673) (181,241)Realised and unrealised gain/(loss) on investments and foreign currencyNet realised gain/(loss) on investments (2,054,724) 53,516,599 2,919,645 740,751 Net realised foreign currency gain/(loss) (94,489) 30,060,449 216,770 626,326
(2,149,213) 83,577,048 3,136,415 1,367,077
Movement in net unrealised (loss)/gain on investments 2,078,727 35,703,002 (2,033,530) (184,934)Movement in net unrealised foreign currency (loss)/gain 4,230 (28,508,378) (32,021) (25,755)
2,082,957 7,194,624 (2,065,551) (210,689)
Net gain/(loss) on financial assets and liabilit ies at fair value through profit or loss
(62,497) 86,256,278 1,036,191 975,147
Man GLG Global Equity
Alternative
Man GLG Asian Equity
Alternative
Man GLG European
Alpha Alternative Enhanced
Man GLG Cred-Eq
Alternative 2015 2015 2015 2015
€ US$ € € Interest income 339,724 88,673 7,590 1,447,750 Interest expense (3,671,777) (622,279) (244,239) (395,986)Dividend income 12,992,546 538,299 1,334,918 39,890 Dividend expense (11,164,294) (407,984) (1,013,610) (147,092)
(1,503,801) (403,291) 84,659 944,562 Realised and unrealised gain/(loss) on investments and foreign currencyNet realised gain/(loss) on investments 37,768,575 (950,471) 540,477 3,863,400 Net realised foreign currency gain/(loss) (1,141,125) 229,238 337,639 (714,911)
36,627,450 (721,233) 878,116 3,148,489
Movement in net unrealised (loss)/gain on investments 1,750,186 774,696 499,445 (3,461,353)Movement in net unrealised foreign currency (loss)/gain (1,068,931) 81,759 13,404 79,979
681,255 856,455 512,849 (3,381,374)
Net gain/(loss) on financial assets and liabilit ies at fair value through profit or loss
35,804,904 (268,069) 1,475,624 711,677
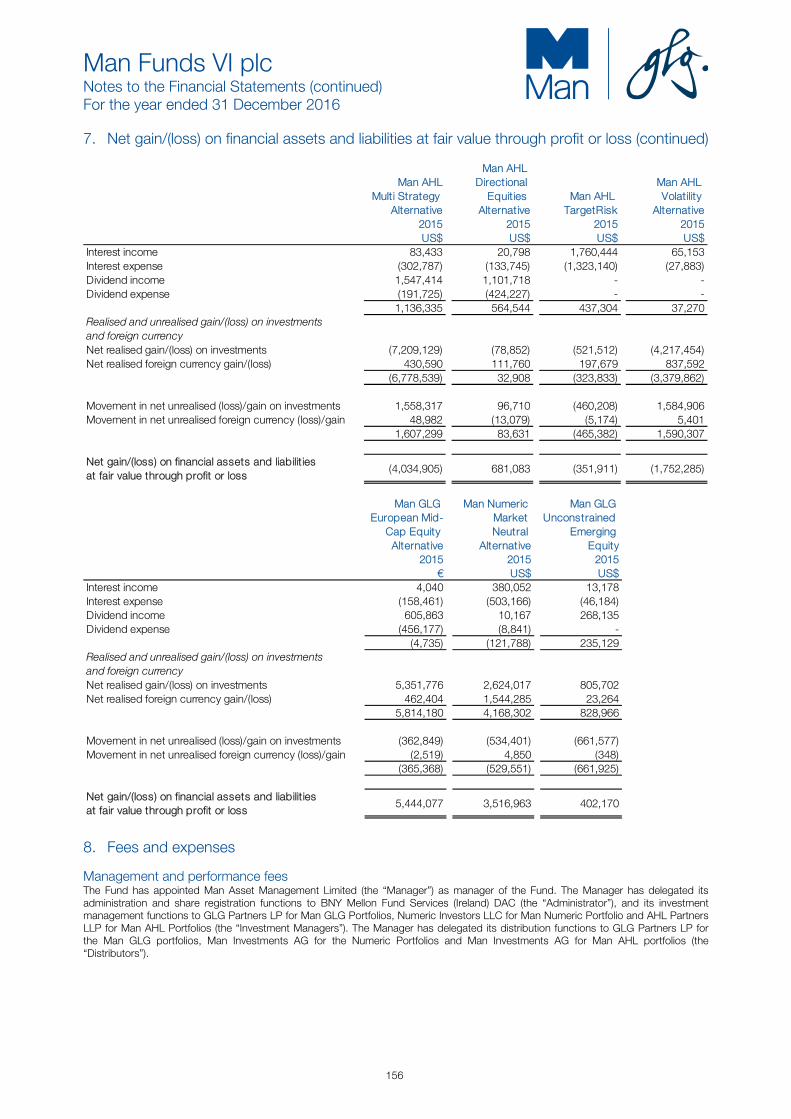
Man Funds VI plc Notes to the Financial Statements (continued) For the year ended 31 December 2016
156
7. Net gain/(loss) on financial assets and liabilities at fair value through profit or loss (continued)
Man AHL Multi Strategy
Alternative
Man AHL Directional
Equities Alternative
Man AHL TargetRisk
Man AHL Volatility
Alternative 2015 2015 2015 2015 US$ US$ US$ US$
Interest income 83,433 20,798 1,760,444 65,153 Interest expense (302,787) (133,745) (1,323,140) (27,883)Dividend income 1,547,414 1,101,718 - - Dividend expense (191,725) (424,227) - -
1,136,335 564,544 437,304 37,270 Realised and unrealised gain/(loss) on investments and foreign currencyNet realised gain/(loss) on investments (7,209,129) (78,852) (521,512) (4,217,454)Net realised foreign currency gain/(loss) 430,590 111,760 197,679 837,592
(6,778,539) 32,908 (323,833) (3,379,862)
Movement in net unrealised (loss)/gain on investments 1,558,317 96,710 (460,208) 1,584,906 Movement in net unrealised foreign currency (loss)/gain 48,982 (13,079) (5,174) 5,401
1,607,299 83,631 (465,382) 1,590,307
Net gain/(loss) on financial assets and liabilit ies at fair value through profit or loss
(4,034,905) 681,083 (351,911) (1,752,285)
Man GLG
European Mid-Cap Equity Alternative
Man Numeric Market Neutral
Alternative
Man GLG Unconstrained
Emerging Equity
2015 2015 2015 € US$ US$
Interest income 4,040 380,052 13,178 Interest expense (158,461) (503,166) (46,184)Dividend income 605,863 10,167 268,135 Dividend expense (456,177) (8,841) -
(4,735) (121,788) 235,129 Realised and unrealised gain/(loss) on investments and foreign currencyNet realised gain/(loss) on investments 5,351,776 2,624,017 805,702 Net realised foreign currency gain/(loss) 462,404 1,544,285 23,264
5,814,180 4,168,302 828,966
Movement in net unrealised (loss)/gain on investments (362,849) (534,401) (661,577)Movement in net unrealised foreign currency (loss)/gain (2,519) 4,850 (348)
(365,368) (529,551) (661,925)
Net gain/(loss) on financial assets and liabilit ies at fair value through profit or loss
5,444,077 3,516,963 402,170
8. Fees and expenses Management and performance fees The Fund has appointed Man Asset Management Limited (the “Manager”) as manager of the Fund. The Manager has delegated its administration and share registration functions to BNY Mellon Fund Services (Ireland) DAC (the “Administrator”), and its investment management functions to GLG Partners LP for Man GLG Portfolios, Numeric Investors LLC for Man Numeric Portfolio and AHL Partners LLP for Man AHL Portfolios (the “Investment Managers”). The Manager has delegated its distribution functions to GLG Partners LP for the Man GLG portfolios, Man Investments AG for the Numeric Portfolios and Man Investments AG for Man AHL portfolios (the “Distributors”).

Man Funds VI plc Notes to the Financial Statements (continued) For the year ended 31 December 2016
157
8. Fees and expenses (continued) Management and performance fees (continued)
The Manager receives management fees of 0.50%, up to 0.50%, 0.75%, up to 0.75%, 0.95%, up to 1.00%, 1.00%, 1.25%, 1.50%, 1.70%, 1.75%, 1.95%, up to 2.00%, 2.00%, 2.25%, 2.75% and 3% per annum of the average Net Asset Value of each of the portfolio by class as per the table below:
The Manager receives management fees for classes and on rates prescribed as per below table:-
Man GLG Portfolios 0.50% 0.75% 0.95% Up to 1.00% 1.00% 1.25% 1.50%
Man GLG European Alpha Alternative - - - - -
IN EUR,IN H GBP,IN H NOK,IN H
SEK,IN H USD -
Man GLG European Equity Alternative - - - - - - IXN H GBP
Man GLG Total Return
IN GBP,IN H AUD,IN H CHF,IN H EUR,IN H USD
I H USD,I H USD Dist,I H EUR,I H
EUR Dist,I H CHF,I GBP,I GBP
Dist,I H SEK,I H NOK,I H DKK,I H SGD,I H AUD,I H
PLN,I H JPY - - -
DN GBP,DN H AUD,DN H
CHF,DN H EUR,DN H
USD
D H USD,D H USD Dist,D H EUR,D H EUR
Dist,D H CHF,D GBP, D GBP
Dist,D H SEK,D H NOK, D H DKK, D
H SGD,D H AUD,D H PLN,D H
JPY
Man GLG Cred-Eq Equity Alternative - - - -
IN EUR,IN H AUD,IN H CHF,IN H DKK,IN H GBP,IN H NOK,IN H SEK,IN H SGD,IN H
USD,IN H PLN - -
Man GLG European Mid-Cap Equity Alternative - - - -
INF EUR,INF H USD,INF H GBP,INF H
CHF,IN EUR,IN H AUD,IN H
CHF, IN H DKK,IN H GBP,IN H JPY,IN H
NOK,IN H SEK,IN H
SGD,IN H USD - -
Man GLG Unconstrained Emerging Equity -
IF C CHF,IF C EUR,IF C GBP,IF
C NOK,IF C SEK,IF C USD, IM
C AUD,IM C CHF,IM C EUR,IM
C GBP,IM C JPY,IM C NOK,IM
C SEK,IM C SGD,IM C USD
I C AUD,I C CHF, I C DKK,I C EUR, I C GBP,I C JPY, I C NOK I C SEK,I C SGD,I
C USD - - -
DF C CHF,DF C EUR,DF C GBP,DF C NOK,DF C
SEK,DF C USD, DM C AUD,DM C
CHF,DM C EUR,DM C GBP,DM C JPY,DM C
NOK,DM C SEK,DM C
SGD,DM C USD

Man Funds VI plc Notes to the Financial Statements (continued) For the year ended 31 December 2016
158
8. Fees and expenses (continued)
Management and performance fees (continued)
Man GLG Portfolios (continued)
0.50% 0.75% 0.95% Up to 1.00% 1.00% 1.25% 1.50%
Man GLG Global Markets Debt Total Return
IL H EUR, IL USD, IMF H EUR, IMF H
EUR Dist, IMF H GBP Dist,
IMF USD
I H CHF, I H EUR, I H EUR
Dist, I H GBP I H NOK, I H SEK, I
USD - - -DL H EUR,
DMF USD
D H EUR, D H GBP, D H NOK,
D H SEK, D USD
Up to 2.00% 1.75% 2.00% Up to 1.00% 2.75% 3.00%
Man GLG European Alpha Alternative
- -
DN EUR,DN H GBP,DN H NOK,DN H SEK,DN H
USD - -
Man GLG Alpha Select Alternative - -
IN GBP, IN H DKK, IN H EUR, IN H JPY, IN H
NOK, IN H SEK -
DN GBP, DN H EUR, DH H DKK, DN H JPY, DN H
NOK, DN H SEK, DN H USD -
Man GLG AtlasMacro Alternative - -
IN USD,IN H AUD,IN H DKK,IN H EUR,IN H GBP,IN H NOK,IN H
SEK,IN H SGD
DN USD,DN H AUD,DN H DKK,DN H EUR,DN H GBP,DN H NOK,DN H
SEK,DN H SGD
DNY H EUR,DNY
USDMan GLG North American Equity Alternative - -
IN USD,IN H EUR,IN H GBP,IN H NOK,IN H SEK
DN USD,DN H EUR,DN H GBP,DN H NOK,DN H SEK -
Man GLG European Equity Alternative INU GBP -
IN EUR,IN H CHF,IN H DKK,IN H GBP,IN H NOK,IN H PLN,IN H
SEK,IN H USD
DN EUR,DN H CHF,DN H DKK,DN H GBP,DN H NOK,DN H SEK,DN H
SGD,DN H USD -
Man GLG Financials Alternative - -
IN EUR,IN H CHF,IN H GBP,IN H NOK,IN H
SEK,IN H USD
DN EUR,DN H CHF,DN H GBP,DN H NOK,DN H
SEK,DN H USD -
Man GLG Total Return -
DNY H EUR,DNY H USD - - -
Man GLG Global Equity Alternative - -
IN H USD,IN H AUD, IN H CHF,IN H DKK,IN EUR,IN
H GBP,IN H NOK,IN H SEK,IN H SGD Class IN U
DN H USD,DN H AUD,DN H CHF,DN H DKK,DN EUR,DN H GBP,DN H NOK,DN H PLN, DN H
SEK,DN H SGD
DNY EUR,DNY
H USD
Man GLG Asian Equity Alternative - -
IN USD,IN H CHF,IN H DKK,IN H EUR,IN H GBP,IN H NOK,IN H
PLN,IN H SEK
DN USD,DN H CHF,DN H DKK,DN H EUR,DN H GBP,DN H NOK,DN H
PLN,DN H SEK,DN H SGD
DNY H EUR,DNY
USD
Man GLG European Alpha Alternative Enhanced - -
IN EUR,IN H AUD,IN H CHF,IN H DKK,IN H GBP,IN H NOK,IN H
SEK,IN H SGD,IN H USD
DN EUR,DN H AUD,DN H CHF,DN H DKK,DN H GBP,DN H NOK,DN H
SEK,DN H SGD,DN H USD
DNY EUR,DNY
H USD
Man GLG Cred-Eq Alternative -
DN EUR,DN H AUD,DN H CHF,DN H DKK,DN H GBP,DN H NOK,DN H SEK,DN H SGD,DN H
USD,DN H PLN DNY EUR,DNY H USD
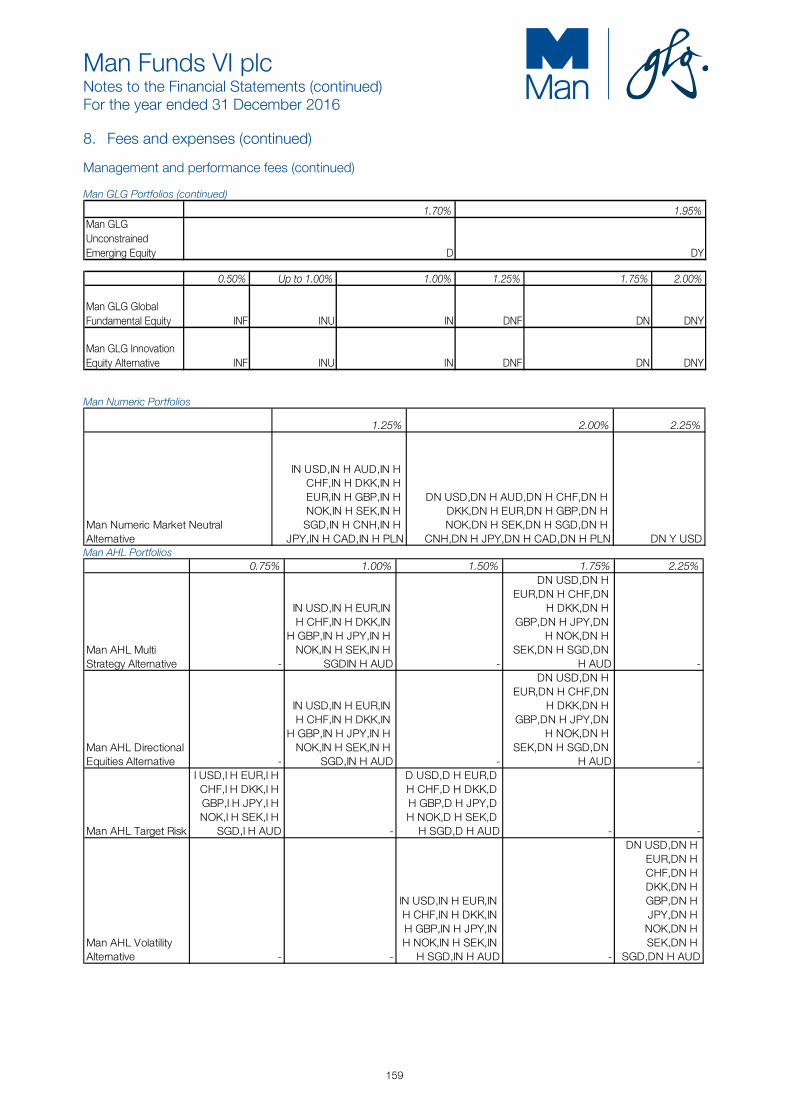
Man Funds VI plc Notes to the Financial Statements (continued) For the year ended 31 December 2016
159
8. Fees and expenses (continued) Management and performance fees (continued) Man GLG Portfolios (continued)
1.70% 1.95%Man GLG Unconstrained Emerging Equity D DY
0.50% Up to 1.00% 1.00% 1.25% 1.75% 2.00%
Man GLG Global Fundamental Equity INF INU IN DNF DN DNY
Man GLG Innovation Equity Alternative INF INU IN DNF DN DNY Man Numeric Portfolios
1.25% 2.00% 2.25%
Man Numeric Market Neutral Alternative
IN USD,IN H AUD,IN H CHF,IN H DKK,IN H EUR,IN H GBP,IN H NOK,IN H SEK,IN H SGD,IN H CNH,IN H
JPY,IN H CAD,IN H PLN
DN USD,DN H AUD,DN H CHF,DN H DKK,DN H EUR,DN H GBP,DN H NOK,DN H SEK,DN H SGD,DN H
CNH,DN H JPY,DN H CAD,DN H PLN DN Y USD Man AHL Portfolios
0.75% 1.00% 1.50% 1.75% 2.25%
Man AHL Multi Strategy Alternative -
IN USD,IN H EUR,IN H CHF,IN H DKK,IN
H GBP,IN H JPY,IN H NOK,IN H SEK,IN H
SGDIN H AUD -
DN USD,DN H EUR,DN H CHF,DN
H DKK,DN H GBP,DN H JPY,DN
H NOK,DN H SEK,DN H SGD,DN
H AUD -
Man AHL Directional Equities Alternative -
IN USD,IN H EUR,IN H CHF,IN H DKK,IN
H GBP,IN H JPY,IN H NOK,IN H SEK,IN H
SGD,IN H AUD -
DN USD,DN H EUR,DN H CHF,DN
H DKK,DN H GBP,DN H JPY,DN
H NOK,DN H SEK,DN H SGD,DN
H AUD -
Man AHL Target Risk
I USD,I H EUR,I H CHF,I H DKK,I H GBP,I H JPY,I H NOK,I H SEK,I H
SGD,I H AUD -
D USD,D H EUR,D H CHF,D H DKK,D H GBP,D H JPY,D H NOK,D H SEK,D
H SGD,D H AUD - -
Man AHL Volatility Alternative - -
IN USD,IN H EUR,IN H CHF,IN H DKK,IN H GBP,IN H JPY,IN H NOK,IN H SEK,IN
H SGD,IN H AUD -
DN USD,DN H EUR,DN H CHF,DN H DKK,DN H GBP,DN H JPY,DN H NOK,DN H SEK,DN H
SGD,DN H AUD

Man Funds VI plc Notes to the Financial Statements (continued) For the year ended 31 December 2016
160
8. Fees and expenses (continued) Management and performance fees (continued) The Manager receives performance fees for classes and on rates prescribed as per below table:- Man GLG Portfolios
10.00% 15.00% 20.00% N/A
Man GLG European Alpha Alternative - -
DN EUR,DN H GBP,DN H NOK,DN H SEK,DN H
USD,IN EUR,IN H GBP,IN H NOK,IN H SEK,IN H
USD -
Man GLG Alpha Select Alternative - -
IN GBP,IN H DKK,IN H EUR,IN H JPY,IN H NOK,IN H SEK,IN H USD,DN GBP,DN H
EUR,DN H DKK,DN H JPY,DN H NOK,DN H
SEK,DN H USD -
Man GLG Atlas Macro Alternative - -
IN USD,IN H AUD,IN H DKK,IN H EUR,IN H GBP,IN H NOK,IN H SEK,IN H SGD,DN
USD,DN H AUD,DN H DKK,DN H EUR,DN H GBP,DN H NOK,DN H
SEK,DN H SGD,DNY H EUR,DNY USD -
Man GLG North American Equity Alternative - -
IN USD,IN H EUR,IN H GBP,IN H NOK,IN H SEK,DN USD,DN H
EUR,DN H GBP,DN H NOK,DN H SEK -
Man GLG European Equity Alternative - -
IN EUR,IN H CHF,IN H DKK,IN H GBP,IN H NOK,IN H PLN,IN H SEK,IN H USD,DN
EUR,DN H CHF,DN H DKK,DN H GBP,DN H NOK,DN H SEK,DN H SGD,DN H USD,IXN H
GBP -
Man GLG Financials Alternative - -
IN EUR,IN H CHF,IN H GBP,IN H NOK,IN H SEK,IN H USD,DN
EUR,DN H CHF,DN H GBP,DN H NOK,DN H
SEK,DN H USD -
Man GLG Total Return
DN GBP,DN H AUD,DN H CHF,DN H EUR,DN H
USD,DNY H EUR,DNY H USD,IN GBP,IN H
AUD,IN H CHF,IN H EUR,IN H USD -
-
DH USD, DH USD Dist, DH EUR, DH EUR Dist,
DH CHF, D GBP, D GBP Dist, DH SEK, DH NOK, DH DKK, DH SGD, DH
AUD, DH PLN, DH JPY, IH USD, IH USD Dist, IH
EUR, IH EUR Dist, IH CHF, I GBP, I GBP Dist,
IH SEK, IH NOK, IH DKK, IH SGD, IH AUD, IH PLN,
IH JPY
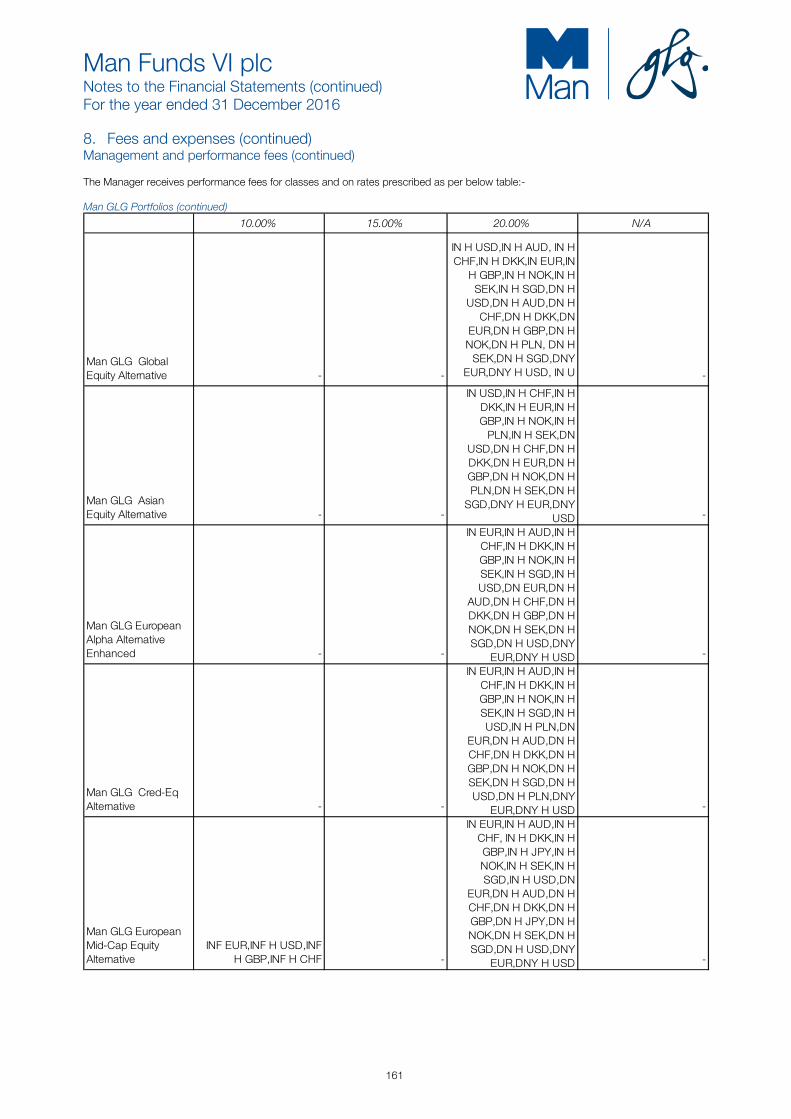
Man Funds VI plc Notes to the Financial Statements (continued) For the year ended 31 December 2016
161
8. Fees and expenses (continued) Management and performance fees (continued) The Manager receives performance fees for classes and on rates prescribed as per below table:- Man GLG Portfolios (continued)
10.00% 15.00% 20.00% N/A
Man GLG Global Equity Alternative - -
IN H USD,IN H AUD, IN H CHF,IN H DKK,IN EUR,IN
H GBP,IN H NOK,IN H SEK,IN H SGD,DN H
USD,DN H AUD,DN H CHF,DN H DKK,DN
EUR,DN H GBP,DN H NOK,DN H PLN, DN H
SEK,DN H SGD,DNY EUR,DNY H USD, IN U -
Man GLG Asian Equity Alternative - -
IN USD,IN H CHF,IN H DKK,IN H EUR,IN H GBP,IN H NOK,IN H
PLN,IN H SEK,DN USD,DN H CHF,DN H DKK,DN H EUR,DN H GBP,DN H NOK,DN H PLN,DN H SEK,DN H
SGD,DNY H EUR,DNY USD -
Man GLG European Alpha Alternative Enhanced - -
IN EUR,IN H AUD,IN H CHF,IN H DKK,IN H GBP,IN H NOK,IN H SEK,IN H SGD,IN H USD,DN EUR,DN H
AUD,DN H CHF,DN H DKK,DN H GBP,DN H NOK,DN H SEK,DN H SGD,DN H USD,DNY
EUR,DNY H USD -
Man GLG Cred-Eq Alternative - -
IN EUR,IN H AUD,IN H CHF,IN H DKK,IN H GBP,IN H NOK,IN H SEK,IN H SGD,IN H USD,IN H PLN,DN
EUR,DN H AUD,DN H CHF,DN H DKK,DN H GBP,DN H NOK,DN H SEK,DN H SGD,DN H USD,DN H PLN,DNY
EUR,DNY H USD -
Man GLG European Mid-Cap Equity Alternative
INF EUR,INF H USD,INF H GBP,INF H CHF -
IN EUR,IN H AUD,IN H CHF, IN H DKK,IN H GBP,IN H JPY,IN H NOK,IN H SEK,IN H SGD,IN H USD,DN
EUR,DN H AUD,DN H CHF,DN H DKK,DN H GBP,DN H JPY,DN H NOK,DN H SEK,DN H SGD,DN H USD,DNY
EUR,DNY H USD -

Man Funds VI plc Notes to the Financial Statements (continued) For the year ended 31 December 2016
162
8. Fees and expenses (continued) Management and performance fees (continued)
Man GLG Portfolios (continued)
10.00% Up to 20.00% 20.00% N/A
Man GLG Unconstrained Emerging Equity
DM C AUD,DM C CHF,DM C EUR,DM C GBP,DM C
JPY,DM C NOK,DM C SEK,DM C SGD,DM C
USD,IM C AUD,IM C CHF,IM C EUR,IM C
GBP,IM C JPY,IM C NOK,IM C SEK,IM C SGD,IM C USD - -
D C AUD, D C CHF, D C EUR, D C GBP, D C JPY, D
C SGD, D C USD, DF C EUR, DF C GBP, DF C
NOK, DF C SEK, DF C USD, DY C EUR, DY C USD, I C
AUD, I C CHF, I C DKK, I C EUR, I C GBP, I C JPY,I C
NOK, I C SEK, I C SGD, I C USD, IF C CHF, IF C EUR, IF
C EUR, IF C GBP, IF C
NOK, IF C SEK, IF C USD
Man GLG Global Markets Debt Total Return
IL H EUR, IL USD, IMF H EUR, IMF H EUR Dist, IMF H
GBP Dist, IMF USD, DL H EUR, DMF USD
D H EUR, D H GBP, D H NOK, D H SEK, D USD, I H
CHF, I H EUR, I H EUR Dist, I H GBP I H NOK, I H SEK, I
USD, DY USDMan GLG Global Fundamental Equity INU DN, DNY, DNF, IN, INF
Man GLG Innovation Equity Alternative INU DN, DNY, DNF, IN, INF
Man Numeric Portfolios
10.00% 15.00% 20.00% N/A
Man Numeric Market Neutral Alternative
- -
IN USD,IN H AUD,IN H CHF,IN H DKK,IN H EUR,IN H GBP,IN H NOK,IN H SEK,IN H SGD,IN H CNH,IN H JPY,IN H CAD,IN H PLN,DN USD,DN H AUD,DN H CHF,DN H DKK,DN H EUR,DN
H GBP,DN H NOK,DN H SEK,DN H SGD,DN H CNH,DN
H JPY,DN H CAD,DN H PLN,DN Y USD
-
Man AHL Portfolios
10.00% 15.00% 20.00% N/A
Man AHL Multi Strategy Alternative
- -
IN USD,IN H EUR,IN H CHF,IN H DKK,IN H GBP,IN H JPY,IN H NOK,IN H SEK,IN H SGDIN H
AUD,DN USD,DN H EUR,DN H CHF,DN H DKK,DN H GBP,DN
H JPY,DN H NOK,DN H SEK,DN H SGD,DN H AUD
-
Man AHL Directional Equities Alternative
- -
IN USD,IN H EUR,IN H CHF,IN H DKK,IN H GBP,IN H JPY,IN H NOK,IN H SEK,IN H SGD,IN H
AUD,DN USD,DN H EUR,DN H CHF,DN H DKK,DN H GBP,DN
H JPY,DN H NOK,DN H SEK,DN H SGD,DN H AUD
-
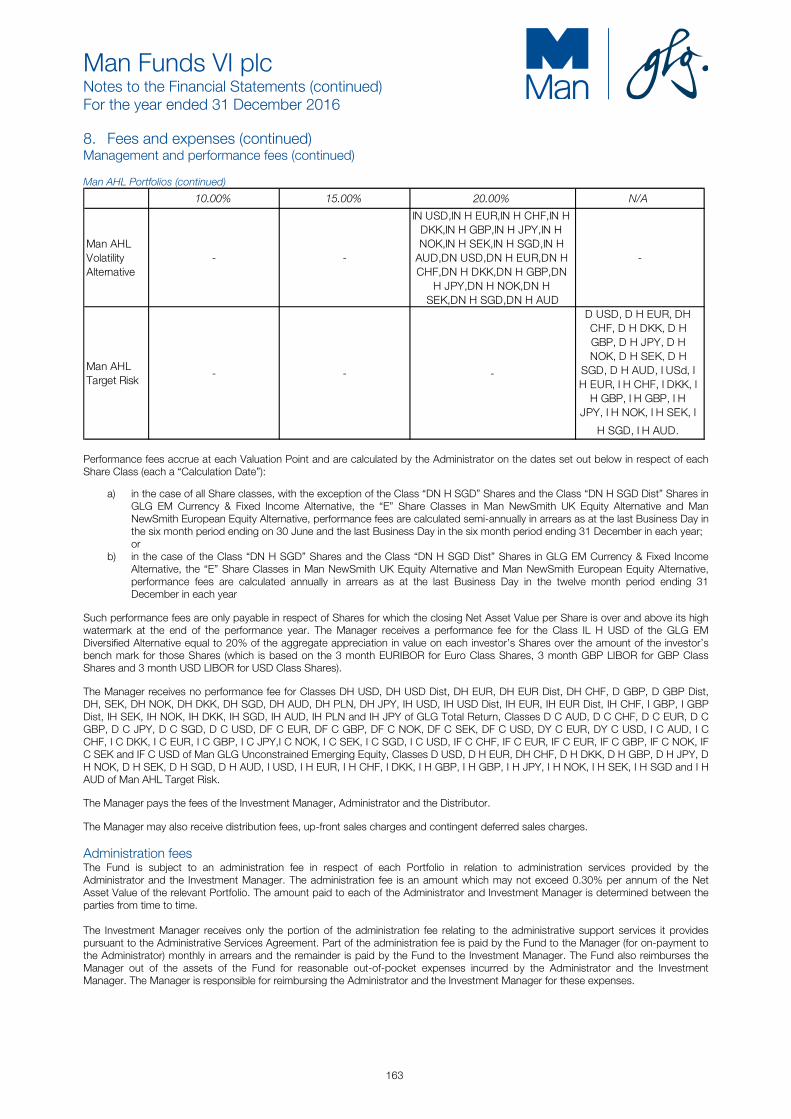
Man Funds VI plc Notes to the Financial Statements (continued) For the year ended 31 December 2016
163
8. Fees and expenses (continued) Management and performance fees (continued) Man AHL Portfolios (continued)
10.00% 15.00% 20.00% N/A
Man AHL Volatility Alternative
- -
IN USD,IN H EUR,IN H CHF,IN H DKK,IN H GBP,IN H JPY,IN H NOK,IN H SEK,IN H SGD,IN H
AUD,DN USD,DN H EUR,DN H CHF,DN H DKK,DN H GBP,DN
H JPY,DN H NOK,DN H SEK,DN H SGD,DN H AUD
-
Man AHL Target Risk
- - -
D USD, D H EUR, DH CHF, D H DKK, D H GBP, D H JPY, D H NOK, D H SEK, D H
SGD, D H AUD, I USd, I H EUR, I H CHF, I DKK, I
H GBP, I H GBP, I H JPY, I H NOK, I H SEK, I
H SGD, I H AUD. Performance fees accrue at each Valuation Point and are calculated by the Administrator on the dates set out below in respect of each Share Class (each a “Calculation Date”):
a) in the case of all Share classes, with the exception of the Class “DN H SGD” Shares and the Class “DN H SGD Dist” Shares in GLG EM Currency & Fixed Income Alternative, the “E” Share Classes in Man NewSmith UK Equity Alternative and Man NewSmith European Equity Alternative, performance fees are calculated semi-annually in arrears as at the last Business Day in the six month period ending on 30 June and the last Business Day in the six month period ending 31 December in each year; or
b) in the case of the Class “DN H SGD” Shares and the Class “DN H SGD Dist” Shares in GLG EM Currency & Fixed Income Alternative, the “E” Share Classes in Man NewSmith UK Equity Alternative and Man NewSmith European Equity Alternative, performance fees are calculated annually in arrears as at the last Business Day in the twelve month period ending 31 December in each year
Such performance fees are only payable in respect of Shares for which the closing Net Asset Value per Share is over and above its high watermark at the end of the performance year. The Manager receives a performance fee for the Class IL H USD of the GLG EM Diversified Alternative equal to 20% of the aggregate appreciation in value on each investor’s Shares over the amount of the investor’s bench mark for those Shares (which is based on the 3 month EURIBOR for Euro Class Shares, 3 month GBP LIBOR for GBP Class Shares and 3 month USD LIBOR for USD Class Shares). The Manager receives no performance fee for Classes DH USD, DH USD Dist, DH EUR, DH EUR Dist, DH CHF, D GBP, D GBP Dist, DH, SEK, DH NOK, DH DKK, DH SGD, DH AUD, DH PLN, DH JPY, IH USD, IH USD Dist, IH EUR, IH EUR Dist, IH CHF, I GBP, I GBP Dist, IH SEK, IH NOK, IH DKK, IH SGD, IH AUD, IH PLN and IH JPY of GLG Total Return, Classes D C AUD, D C CHF, D C EUR, D C GBP, D C JPY, D C SGD, D C USD, DF C EUR, DF C GBP, DF C NOK, DF C SEK, DF C USD, DY C EUR, DY C USD, I C AUD, I C CHF, I C DKK, I C EUR, I C GBP, I C JPY,I C NOK, I C SEK, I C SGD, I C USD, IF C CHF, IF C EUR, IF C EUR, IF C GBP, IF C NOK, IF C SEK and IF C USD of Man GLG Unconstrained Emerging Equity, Classes D USD, D H EUR, DH CHF, D H DKK, D H GBP, D H JPY, D H NOK, D H SEK, D H SGD, D H AUD, I USD, I H EUR, I H CHF, I DKK, I H GBP, I H GBP, I H JPY, I H NOK, I H SEK, I H SGD and I H AUD of Man AHL Target Risk. The Manager pays the fees of the Investment Manager, Administrator and the Distributor. The Manager may also receive distribution fees, up-front sales charges and contingent deferred sales charges. Administration fees The Fund is subject to an administration fee in respect of each Portfolio in relation to administration services provided by the Administrator and the Investment Manager. The administration fee is an amount which may not exceed 0.30% per annum of the Net Asset Value of the relevant Portfolio. The amount paid to each of the Administrator and Investment Manager is determined between the parties from time to time. The Investment Manager receives only the portion of the administration fee relating to the administrative support services it provides pursuant to the Administrative Services Agreement. Part of the administration fee is paid by the Fund to the Manager (for on-payment to the Administrator) monthly in arrears and the remainder is paid by the Fund to the Investment Manager. The Fund also reimburses the Manager out of the assets of the Fund for reasonable out-of-pocket expenses incurred by the Administrator and the Investment Manager. The Manager is responsible for reimbursing the Administrator and the Investment Manager for these expenses.

Man Funds VI plc Notes to the Financial Statements (continued) For the year ended 31 December 2016
164
8. Fees and expenses (continued)
Depositary fees The Fund pays the Depositary a depositary fee which may not exceed 0.04% per annum of the Net Asset Value of the relevant Portfolio together with value added tax, if any, applicable to such fees. The Fund also reimburses the Depositary out of the assets of the relevant Portfolio for reasonable out-of-pocket expenses will accrue from day to day (which will not exceed normal commercial rates) and reasonable out of pocket expenses of any sub-custodian appointed by the Depositary and will be liable for transaction charges. The fee and expenses of the Depositary are paid monthly in arrears.
Amounts unpaid by the Fund at the year end relating to management, performance, administration and depositary fees are shown below:
2016 Combined 2015 Combined
Fund Fund
US$ US$
Management fees 3,108,281 3,983,838
Performance fees 4,582,368 4,074,073
Administration fees 1,239,509 1,216,783
Depositary fees 479,719 180,553 Directors’ fees The Fund will pay the fees of the Directors. Currently each Director’s fee is not expected to exceed €8,000 per annum. The Directors’ fees for the year ended 31 December 2016 and 31 December 2015 were US$24,000 (2015: US$24,000). In addition, the Directors receive reimbursement for travel and other out-of-pocket expenses relating to attendance at meetings and other matters, including any expenses relating to the performance of due diligence for the benefit of the Fund.
9. Related party transactions
The Fund has adopted the corporate governance code for collective investment schemes and management companies issued by the Irish Funds Industry Association (the “IF Code”). The Directors are satisfied that they act independently and in the interests of the Fund as a whole and have determined that Eric Fortier and Ronan Daly are independent directors as that term is defined in the IF Code.
During the period Eric Fortier earned Directors’ fee of €8,000, Michael Jackson and Victoria Parry each earned Directors’ fee of €2,433 and Ronan Daly and Bronwyn Wright each earned Directors’ fee of €5,568. John Morton has elected to waive his Directors’ fee as he is the Global Co-Head of GLG Product Legal within Man Group Plc.
Victoria Parry is also a Director of Man Asset Management (Ireland) Limited, the Manager of the Fund, she resigned as Director of the Fund on 21 April 2016.
Michael Jackson is a partner at Matheson, the legal advisers of the Fund. He resigned as Director of the Fund on 21 April 2016, but was not involved in the provision of day-to-day legal assistance to the Fund.
During the year fees of US$301,656 (31 December 2015: US$168,131) were paid to Matheson, as Legal Advisers to the Fund.
Each of the Directors is or may become involved in other financial investment and professional activities which may cause conflicts of interest with the management of the Fund. These activities include management or administration of other companies (including those with investment objectives similar to those of the Fund or structures that may be related to Man Group plc sponsored investment funds), purchases and sales of securities and other investments, investment and management counselling and serving as directors, advisers and/or agents of other companies, including companies and legal structures in which the Fund may invest and/or which may invest into the Fund.
Man Asset Management (Ireland) Limited (formerly GLG Partners Asset Management Limited) is a related party through its holding of 1 Subscriber Share in the Fund. John Morton, a director of the Fund, holds the second Subscriber Share.
GLG Partners LP is also a related party as the Investment Manager of the Fund, and therefore all subsidiaries of Man Group plc are also related parties.
31 December 2016 Total Fees Fees payable
Related party Type of fee US$ US$
Man Asset Management (Ireland) Limited Management fees 41,549,957 3,108,281
Man Asset Management (Ireland) Limited Performance fees 5,170,713 4,582,368
Man Asset Management (Ireland) Limited Administration fees 8,101,236 1,239,509
Directors Directors' fees 47,765 -
Matheson Legal fees 301,656 -

Man Funds VI plc Notes to the Financial Statements (continued) For the year ended 31 December 2016
165
9. Related party transactions (continued)
31 December 2015 Total Fees Fees payable
Related party Type of fee US$ US$
Man Asset Management (Ireland) Limited Management fees 44,611,780 3,983,838
Man Asset Management (Ireland) Limited Performance fees 8,286,314 4,074,073
Man Asset Management (Ireland) Limited Administration fees 7,634,271 1,216,783
Directors Directors' fees 33,821 249,314 * The amount paid to each of the Administrator and Investment Manager is determined between the parties from time to time, but, for the avoidance of doubt, the Investment Manager receives only the portion of the administration fee relating to the administrative support services it provides pursuant to the Administrative Services Agreement. Part of the administration fee will be paid by the Fund to the Manager (for on-payment to the Administrator) monthly in arrears and the remainder will be paid by the Fund to the Investment Manager.
The above amounts are payable on demand and do not bear interest. Furthermore, the above transactions were made on terms equivalent to those that prevail in arm’s length transactions.
As at 31 December 2016 entities affiliated with Man Group plc owned Redeemable Participating Shares as detailed below:
Portfolio Redeemable Participating Shares
2016 2015
Man GLG European Alpha Alternative 420,899 3,150
Man Numeric Market Neutral Alternative 378,210 378,000
Man GLG Global Fundamental Equity 200,130 -
Man GLG Innovation Equity Alternative 200,130 -
Man GLG Unconstrained Emerging Equity 188,396 188,086
Man AHL Volatility Alternative 146,345 146,335
Man AHL TargetRisk 57,538 144,941
Man GLG Alpha Select Alternative 31,805 21,670
Man GLG Global Emerging Markets Debt Total Return 14,510 -
Man GLG European Equity Alternative 10,084 -
Man GLG European Mid-Cap Equity Alternative 9,628 -
Man GLG Cred-Eq Alternative 3,453 2,753
As at 31 December 2016 and 31 December 2015 none of any outstanding Redeemable Participating Shares were owned by entities affiliated with Man Group plc.
10. Share capital The authorised share capital of the Fund is 500,000,000,002 divided into 2 Subscriber Shares of €1 each and 500,000,000,000 Shares of no par value initially designated as unclassified Shares. The Directors are empowered to issue up to 500,000,000,000 Shares of no par value designated as Shares of any series or class on such terms as they think fit.
Subscriber Shares of the Fund The Subscriber Shares are each held by Man Asset Management (Ireland) Limited (formerly GLG Partners Asset Management Limited) and John Morton in Nominee capacity.
Redeemable Participating Shares The Fund’s Redeemable Participating Shares are redeemable at the shareholder’s option on each weekly Dealing Day with 1 business day written notice for Man GLG European Alpha Alternative, Man GLG European Alpha Alternative Enhanced, Man GLG Unconstrained Emerging Equity, Man GLG Total Return, Man Numeric Market Neutral Alternative, Man AHL Multi Strategy Alternative, Man AHL Directional Equities Alternative and Man AHL Target Risk and with 5 days’ written notice for GLG EM Currency & Fixed Income Alternative, EM Diversified Alternative, Man GLG Alpha Select Alternative, Man GLG European Equity Alternative, Man GLG Atlas Macro Alternative, Man GLG Global Equity Alternative, GLG Global Emerging Markets Macro Alternative, Man GLG European Mid-Cap Equity Alternative, Man GLG Cred-Eq Alternative, Man GLG Asian Equity Alternative and Man AHL Volatility Alternative. The Fund’s Redeemable Participating Shares are classified as financial liabilities. The Fund is therefore potentially exposed to weekly redemptions by its shareholders. The exposure to liquidity risk through shareholder redemption requests is managed by specifically setting the redemption notice period to accommodate the expected liquidity of the underlying investment as agreed by the Investment Managers.

Man Funds VI plc Notes to the Financial Statements (continued) For the year ended 31 December 2016
166
10. Share capital (continued)
Redeemable Participating Shares (continued) The Fund manages its obligation to repurchase the Shares when required to do so and its overall liquidity risk by:
Allowing for redemptions only during the first Business Day of each calendar week. Requiring a 5 Business Day notice period before redemptions.
The Subscriber Shares were fully issued when the Fund was launched. They entitle the holders to attend and vote at general meetings of the Fund but do not entitle the holders to participate in the profits or assets of the Fund except for a return of capital on a winding-up. The Subscriber Share capital is beneficially held by or on behalf of the Manager. All issued Shares are fully paid. All these Issued Subscriber Shares are fully paid.
The Shares are entitled to dividends and to payment of a proportionate share based on the Fund’s NAV per Share on the redemption date.
Subscriptions for Shares Classes may be subject to an up-front sales charge of up to 5% of the subscription amount, payable to the Manager.
Shares at Shares at1 January 2016 Subscriptions Redemptions 31 December 2016
Man GLG European Alpha AlternativeDN EUR 542,030 71,005 (536,497) 76,538 DN H GBP 11,207 1,089 (3,252) 9,044 DN H USD 123,458 9,811 (101,891) 31,378 IN EUR 2,974,820 1,136,606 (3,407,672) 703,754 IN H GBP 8,697 1,094 (4,187) 5,604 IN H USD 145,911 418,277 (136,192) 427,996 Total 3,806,123 1,637,882 (4,189,691) 1,254,314 Man GLG Alpha Select AlternativeDN GBP 1,078 3,560 (98) 4,540 DN H EUR 40,584 35,681 (14,841) 61,424 DN H SEK - 50 - 50 DN H USD 184,178 162,816 (66,566) 280,428 IN GBP 33,284 21,885 (20,096) 35,073 IN H EUR 30,421 47,527 (25,404) 52,544 IN H JPY - 64,417 (64,417) - IN H SEK - 50 - 50 IN H USD 396,668 586,509 (186,250) 796,927 IN U GBP - 31,705 - 31,705 Total 686,213 954,200 (377,672) 1,262,741 Man GLG European Equity AlternativeDN EUR 718,464 933,617 (517,784) 1,134,297 DN H CHF 88,047 7,083 (17,059) 78,071 DN H GBP 31,977 3,732 (19,822) 15,887 DN H NOK 66,662 - (2,542) 64,120 DN H SEK 11,693 44 (9,894) 1,843 DN H SGD 7,843 - (5,564) 2,279 DN H USD 686,063 82,303 (297,096) 471,270 IN EUR 3,696,718 1,642,076 (2,707,094) 2,631,700 IN H GBP 877,509 348,693 (939,862) 286,340 IN H NOK 670,061 14,679 (684,692) 48 IN H SEK 4,456,660 1,002,066 (952,041) 4,506,685 IN H USD 118,354 992,719 (222,456) 888,617 IXN H GBP 142,756 - (70,304) 72,452 Total 11,572,807 5,027,012 (6,446,210) 10,153,609 Man GLG Total ReturnIH USD 49,856 - (49,856) - Total 49,856 - (49,856) - Man GLG Global Equity AlternativeDN EUR 32,260 48,888 (67,839) 13,309 DN H CHF 23,950 772 (11,022) 13,700 DN H GBP 2,701 - (2,701) - DN H USD 139,160 57,482 (42,180) 154,462 IN EUR 3,075,214 900,266 (2,172,090) 1,803,390 IN H USD 24,157 - (20,795) 3,362 Total 3,297,442 1,007,408 (2,316,627) 1,988,223

Man Funds VI plc Notes to the Financial Statements (continued) For the year ended 31 December 2016
167
10. Share capital (continued)
Shares at Shares at1 January 2016 Subscriptions Redemptions 31 December 2016
Man GLG Asian Equity AlternativeIN H GBP 293,648 - (293,648) - IN USD 430,341 331 (430,672) - Total 723,989 331 (724,320) - Man GLG European Alpha Alternative EnhancedDN EUR 100 - (100) - DN H GBP 450 - (450) - IN EUR 228,602 2,181 (230,783) - IN H CHF 21,294 - (21,294) - IN H USD 57,026 72,937 (129,963) - Total 307,472 75,118 (382,590) - Man GLG Cred-Eq AlternativeDN EUR 69,725 - (52,062) 17,663 DN H USD 219,362 - (214,535) 4,827 IN EUR 517,250 121,506 (185,642) 453,114 IN H USD 10,904 1,632 (180) 12,356 Total 817,241 123,138 (452,419) 487,960 Man AHL Multi Strategy AlternativeDN H EUR - 2,589 (1,226) 1,363 DN H GBP 8,934 1,773 (867) 9,840 DN H SEK - 50 - 50 DN USD 434,104 35,098 (96,919) 372,283 IN H CHF 7,350 - - 7,350 IN H EUR 798,525 188,646 (260,079) 727,092 IN H GBP - 810 (10) 800 IN H SEK 576,065 344,542 (361,216) 559,391 IN USD 77,643 - (5,788) 71,855 Total 1,902,621 573,508 (726,105) 1,750,024 Man AHL Directional Equities AlternativeDN USD 96,593 13,523 (110,116) - IN USD 250,000 - (250,000) - IN H EUR 47,077 28,285 (75,362) - Total 393,670 41,808 (435,478) - Man AHL TargetRiskD H EUR - 10 - 10 D H SEK - 50 - 50 D USD - 1,960 - 1,960 I H EUR - 10 - 10 I H GBP - 3,611 - 3,611 I H SEK - 50 - 50 I USD 261,920 34,850 (53,033) 243,737 Total 261,920 40,541 (53,033) 249,428 Man AHL Volatility AlternativeD N USD - 10 - 10 IN H EUR 278,459 13,767 (276,180) 16,046 IN USD 197,460 8,665 (49,011) 157,114 Total 475,919 22,442 (325,191) 173,170 Man GLG European Mid-Cap Equity AlternativeDN EUR - 1,312 - 1,312 DN H SEK - 50 - 50 DN H USD 136,410 193,540 (67,120) 262,830 DNY EUR - 29,446 - 29,446 IN EUR - 2,008,634 (283,214) 1,725,420 IN H CHF - 10,000 - 10,000 IN H GBP 5,956 453 (1,483) 4,926 IN H SEK - 50 - 50 IN H USD 174,014 29,016 (166,523) 36,507 INF EUR 818,874 363,039 (267,708) 914,205 INF H CHF 10,950 - (8,400) 2,550 INF H GBP 67,000 20,666 (1,000) 86,666 INF H USD 3,000 589 - 3,589 Total 1,216,204 2,656,795 (795,448) 3,077,551

Man Funds VI plc Notes to the Financial Statements (continued) For the year ended 31 December 2016
168
10. Share capital (continued) Shares at Shares at
1 January 2016 Subscriptions Redemptions 31 December 2016Man Numeric Market Neutral AlternativeDN H EUR - 738 - 738 DN H NOK - 50 - 50 DN H SEK - 50 - 50 DN USD 156,010 128,338 (33,173) 251,175 IN H CHF - 18,422 - 18,422 IN H EUR 87,768 437,101 (152,177) 372,692 IN H NOK - 50 - 50 IN H SEK - 50 - 50 IN USD 372,884 500 (4,884) 368,500 INU H EUR - 382,815 (25,557) 357,258 INU H GBP Dist - 4,660 - 4,660 INU USD - 240,666 (395) 240,271 Total 616,662 1,213,440 (216,186) 1,613,916 Man GLG Unconstrained Emerging EquityD C SEK - 50 - 50 D C USD - 10 - 10 DF C NOK - 50 - 50 DF C SEK - 50 - 50 DF C USD - 109,359 (6,322) 103,037 I C SEK - 50 - 50 I C USD 1,553 - - 1,553 IF C EUR 33,894 104,765 - 138,659 IF C GBP 127,834 127,834 IF C NOK - 50 - 50 IF C SEK - 50 - 50 IF C USD 188,086 - - 188,086 Total 351,367 214,434 (6,322) 559,479 Man GLG Global Emerging Markets Debt Total ReturnD H EUR - 251 - 251 D H GBP - 10 - 10 D H NOK - 50 - 50 D H SEK - 50 - 50 D USD - 39,537 (289) 39,248 DL H EUR - 999 - 999 DMF USD - 13,715 - 13,715 DY USD - 13,340 (5,977) 7,363 I H CHF - 2,600 - 2,600 I H EUR - 371,978 (14,491) 357,487 I H EUR Dist - 96,493 (10,328) 86,165 I H GBP - 10 - 10 I H NOK - 50 - 50 I H SEK - 50 - 50 I USD - 1,394,728 (200,547) 1,194,181 IL H EUR - 10 - 10 IL USD - 10 - 10 IMF H EUR - 971,746 (149,230) 822,516 IMF H EUR Dist - 2,137,141 - 2,137,141 IMF H GBP Dist - 52,586 - 52,586 IMF USD - 88,369 (3,107) 85,262
- 5,183,723 (383,969) 4,842,489 Man GLG Innovation Equity AlternativeIN H CHF - 10 - 10 IN H EUR - 10 - 10 IN H GBP - 10 - 10 IN H NOK - 50 - 50 IN H SEK - 50 - 50 IN USD - 200,000 - 200,000
- 200,130 - 200,130

Man Funds VI plc Notes to the Financial Statements (continued) For the year ended 31 December 2016
169
10. Share capital (continued)
Shares at Shares at1 January 2016 Subscriptions Redemptions 31 December 2016
Man GLG Global Fundamental EquityIN EUR - 10 - 10 INH GBP - 10 - 10 IN H CHF - 10 - 10 IN H NOK - 50 - 50 IN H SEK - 50 - 50 IN H USD - 200,000 - 200,000
- 200,130 - 200,130
Shares at Shares at1 January 2015 Subscriptions Redemptions 31 December 2015
Man GLG European Alpha AlternativeD N EUR 730,211 198,218 (386,399) 542,030 D N H GBP 13,530 2,959 (5,282) 11,207 D N H USD 205,286 28,736 (110,564) 123,458 I N EUR 3,033,728 1,480,151 (1,539,059) 2,974,820 I N H GBP 11,218 411 (2,932) 8,697 I N H USD 667,856 253,678 (775,623) 145,911 Total 4,661,829 1,964,153 (2,819,859) 3,806,123 Man GLG Alpha Select AlternativeDN GBP 1,323 - (245) 1,078 DN H EUR 33,277 25,524 (18,217) 40,584 DN H USD 509,080 3,193 (328,095) 184,178 IN GBP 245,158 16,141 (228,015) 33,284 IN H EUR 35,394 28,048 (33,021) 30,421 IN H USD 466,917 23,073 (93,322) 396,668 Total 1,291,149 95,979 (700,915) 686,213 Man GLG Atlas Macro AlternativeDN H EUR 717 - (717) - DN H GBP 499 - (499) - IN H AUD 238,708 5,525 (244,233) - IN H EUR 440,777 8,100 (448,877) - IN H GBP 170,319 - (170,319) - IN USD 4,392 - (4,392) - Total 855,412 13,625 (869,037) - Man GLG North American Equity AlternativeD N H EUR 15,907 - (15,907) - D N USD 3,545 - (3,545) - I N H EUR 151 - (151) - I N USD 150,309 - (150,309) - Total 169,912 - (169,912) - Man GLG European Equity AlternativeDN EUR 747,183 185,197 (213,916) 718,464 DN H CHF 90,149 7,057 (9,159) 88,047 DN H GBP 34,329 8,592 (10,944) 31,977 DN H NOK 59,529 7,373 (240) 66,662 DN H SEK 15,271 - (3,578) 11,693 DN H SGD 13,389 1,601 (7,147) 7,843 DN H USD 724,710 88,665 (127,312) 686,063 IN EUR 2,258,226 2,114,837 (676,345) 3,696,718 IN H GBP 969,782 264,328 (356,601) 877,509 IN H NOK - 1,057,915 (387,854) 670,061 IN H SEK 5,103,167 729,904 (1,376,411) 4,456,660 IN H USD 300,277 51,802 (233,725) 118,354 IXN H GBP - 142,756 - 142,756 Total 10,316,012 4,660,027 (3,403,232) 11,572,807

Man Funds VI plc Notes to the Financial Statements (continued) For the year ended 31 December 2016
170
10. Share capital (continued)
Shares at Shares at1 January 2015 Subscriptions Redemptions 31 December 2015
Man GLG Financials AlternativeDN EUR 390 - (390) - DN H GBP 201 - (201) - DN H USD 11,696 - (11,696) - IN EUR 146,647 6,017 (152,664) - IN H GBP 2,000 - (2,000) - IN H USD 62,980 - (62,980) - Total 223,914 6,017 (229,931) - Man GLG Total ReturnD H USD 100,000 - (100,000) - I N H USD 300,000 - (250,144) 49,856 Total 400,000 - (350,144) 49,856 Man GLG Global Equity AlternativeDN EUR 50,226 677 (18,643) 32,260 DN H CHF 24,750 - (800) 23,950 DN H GBP 2,500 201 - 2,701 DN H USD 448,968 168,851 (478,659) 139,160 IN EUR 3,307,514 852,004 (1,084,304) 3,075,214 IN H NOK 1,040,081 1,277,556 (2,317,637) - IN H USD 25,266 24,208 (25,317) 24,157 Total 4,899,305 2,323,497 (3,925,360) 3,297,442 Man GLG Asian Equity AlternativeDN USD - 159,616 (159,616) - IN H EUR 2,700 - (2,700) - IN H GBP 306,733 - (13,085) 293,648 IN USD 703,226 350,667 (623,552) 430,341 Total 1,012,659 510,283 (798,953) 723,989 Man GLG European Alpha Alternative EnhancedDN EUR 157 - (57) 100 DN H GBP 500 - (50) 450 DN H USD 1,240 - (1,240) - IN EUR 385,187 34,972 (191,557) 228,602 IN H CHF - 22,589 (1,294) 21,294 IN H USD 41,482 58,849 (43,305) 57,026 Total 428,566 116,410 (237,503) 307,472 Man GLG Cred-Eq AlternativeDN EUR 42,773 30,022 (3,070) 69,725 DN H USD 146,158 73,281 (77) 219,362 IN EUR 356,608 247,607 (86,966) 517,250 IN H USD 1,684 10,904 (1,684) 10,904 Total 547,223 361,814 (91,797) 817,240 Man AHL Multi Strategy AlternativeDN H GBP - 8,934 - 8,934 DN USD 120,000 316,470 (2,366) 434,104 IN H CHF - 7,350 - 7,350 IN H EUR - 798,525 - 798,525 IN H SEK - 614,398 (38,333) 576,065 IN USD 400,000 77,643 (400,000) 77,643 Total 520,000 1,823,320 (440,699) 1,902,621 Man AHL Directional Equities AlternativeDN USD - 96,593 - 96,593 IN USD 250,000 - - 250,000 IN H EUR - 72,814 (25,736) 47,078 Total 250,000 169,407 (25,736) 393,671 Man AHL TargetRiskI USD 200,000 153,781 (91,861) 261,920 Total 200,000 153,781 (91,861) 261,920 Man AHL Volatility AlternativeIN H EUR 129,832 198,398 (49,771) 278,459 IN USD 216,730 516,710 (535,980) 197,460 Total 346,562 715,108 (585,751) 475,919

Man Funds VI plc Notes to the Financial Statements (continued) For the year ended 31 December 2016
171
10. Share capital (continued)
Shares at Shares at1 January 2015 Subscriptions Redemptions 31 December 2015
Man GLG European Mid-Cap Equity AlternativeDN H USD - 136,410 - 136,410 IN EUR - 1,000 (1,000) - IN F EUR - 829,808 (10,934) 818,874 IN H GBP - 69,283 (63,327) 5,956 IN H USD - 205,716 (31,702) 174,014 INF H CHF - 10,950 - 10,950 INF H GBP - 67,000 - 67,000 INF H USD - 3,000 - 3,000 Total - 1,323,167 (106,963) 1,216,204 Man Numeric Market Neutral AlternativeDN H USD - 156,010 - 156,010 IN H EUR - 94,035 (6,267) 87,768 IN USD - 392,857 (19,973) 372,884 Total - 642,902 (26,240) 616,662 Man GLG Unconstrained Emerging EquityI C USD - 1,553 - 1,553 IF C EUR - 33,894 - 33,894 IF C GBP - 247,700 (119,866) 127,834 IF C USD - 188,086 - 188,086 Total - 471,233 (119,866) 351,367
Capital management As a result of the ability to issue, repurchase and resell Redeemable Participating Shares, the capital of the Fund can vary depending on the demand for the redemptions and subscriptions to the Fund. The Fund is not subject to externally imposed capital requirements and has no restrictions on the issue, redemption of Redeemable Participating Shares other than those set out in the Fund’ Prospectus, repurchase and resell of the shares.
The Fund’s objectives for managing capital may include:
investing the capital in investments meeting the description, risk exposure and expected return indicated in the Fund’s Prospectus;
achieving consistent returns while safeguarding capital by investing in diversified portfolios, by participating in derivative and other advanced capital markets and by using various investment strategies and hedging techniques; maintaining sufficient liquidity to meet the expenses of the Fund and to meet redemption requests as they arise; and
maintaining sufficient size to make the operation of the Fund cost-efficient; and Maintaining sufficient liquidity to meet the expenses of the Fund and to meet redemption requests as they arise.
Refer to ‘Risk Associated with Financial Instruments’ (note 6 under Liquidity risk) for the policies and processes applied by the Fund in managing its capital and its obligation to repurchase the Shares.
11. Exchange rates
The following exchange rates were used to translate foreign currency assets and liabilities in Man GLG Asian Equity Alternative, Man AHL Multi Strategy Alternative, Man AHL Directional Equities Alternative, Man AHL TargetRisk, Man Volatility Alternative, Man Numeric Market Neutral Alternative, Man GLG Unconstrained Emerging Equity, Man GLG Innovation Equity Alternative and Man GLG Global Markets Debt Total Return at 31 December 2016:
US$1 = AUD1.38103 US$1 = €0.94805 US$1 = JPY116.27907 US$1 = RUB60.97561 US$1 = BRL3.25521 US$1 = £0.80926 US$1 = KRW1250 US$1 = SEK9.08265 US$1 = CAD1.34102 US$1 = HKD7.75194 US$1 = MXN20.61856 US$1 = SGD1.44467 US$1 = CHF1.01636 US$1 = HUF294.11760 US$1 = NOK8.60585 US$1 = TRY3.51741 US$1 = CNY6.94927 US$1 = ILS3.84911 US$1 = PHP49.75124 US$1 = ZAR13.67989 US$1 = COP3333.33333 US$1 = INR68.02721 US$1 = PLN4.17362

Man Funds VI plc Notes to the Financial Statements (continued) For the year ended 31 December 2016
172
11. Exchange rates (continued)
The following exchange rates were used to translate foreign currency assets and liabilities in Man GLG European Alpha Alternative, Man GLG European Equity Alternative, Man GLG Global Equity Alternative, Man GLG European Alpha Alternative Enhanced, GLG Cred-Eq Alternative, Man GLG Global Fundamental Equity and Man GLG European Mid-Cap Equity Alternative at 31 December 2016:
€1 = AED3.87367 €1 = COP3516.00 €1 = JPY122.6511 €1 = SEK9.58038
€1 = ARS16.68987 €1 = CZK27.04615 €1 = KRW1318.5 €1 = SGD1.52384
€1 = AUD1.45670 €1 = DKK7.43340 €1 = MXN21.74845 €1 = TRY3.71017
€1 = BRL3.43359 €1 = £0.85360 €1 = MYR4.73217 €1 = TWD34.02581
€1 = CAD1.41450 €1 = HKD8.17674 €1 = NOK9.07745 €1 = UAH28.58536
€1 = CHF1.07206 €1 = HUF310.2353 €1 = NZD1.51269 €1 = US$1.05480
€1 = CLP703.200 €1 = ILS4.06004 €1 = PLN4.40233 €1 = ZAR14.42955
€1 = CNY7.33009 €1 = INR71.7551 €1 = RUB64.31707
The following exchange rates were used to translate foreign currency assets and liabilities in the Man GLG Alpha Select Alternative and Man GLG Total Return at 31 December 2016:
£1 = AUD1.70653 £1 = HKD9.57907 £1 = JPY143.68605 £1 = US$1.2357
£1 = CHF1.25592 £1 = €1.71502 £1 = NOK10.63425
The following exchange rates were used to translate foreign currency assets and liabilities in Man GLG Atlas Macro Alternative, Man GLG North American Equity Alternative, Man GLG Asian Equity Alternative, Man AHL Multi Strategy Alternative, Man AHL Directional Equities Alternative, Man AHL TargetRisk, Man Volatility Alternative, Man Numeric Market Neutral Alternative and Man GLG Unconstrained Emerging Equity at 31 December 2015:
US$1 = AUD1.374480 US$1 = €0.92056 US$1 = JPY120.29500 US$1 = RUB73.03500 US$1 = BRL3.95625 US$1 = £0.67847 US$1 = KRW1172.55000 US$1 = SEK8.43060 US$1 = CAD1.38910 US$1 = HKD7.75015 US$1 = MXN17.271150 US$1 = SGD1.41865 US$1 = CHF1.0010 US$1 = HUF290.90035 US$1 = NOK8.851350 US$1 = TRY2.91885 US$1 = CNY6.49360 US$1 = ILS3.89105 US$1 = PHP47.05500 US$1 = ZAR15.49550 US$1 = COP3174.5000 US$1 = INR66.15625 US$1 = PLN3.94895
The following exchange rates were used to translate foreign currency assets and liabilities in the Fund, Man GLG European Alpha Alternative, Man GLG European Equity Alternative, Man GLG Financials Alternative, Man GLG Global Equity Alternative, Man GLG European Alpha Alternative Enhanced, GLG Cred-Eq Alternative and Man GLG European Mid-Cap Equity Alternative at 31 December 2015:
€1 = AED3.98998 €1 = COP3448.45940 €1 = JPY130.67646 €1 = SEK9.15816
€1 = ARS14.06215 €1 = CZK27.02203 €1 = KRW1273.74108 €1 = SGD1.54107
€1 = AUD1.49309 €1 = DKK7.46266 €1 = MXN18.76165 €1 = TRY3.17074
€1 = BRL4.297670 €1 = £0.73702 €1 = MYR4.66402 €1 = TWD35.68169
€1 = CAD1.50898 €1 = HKD8.41899 €1 = NOK9.61522 €1 = UAH26.10161
€1 = CHF1.08739 €1 = HUF316.00505 €1 = NZD1.58676 €1 = US$1.08630
€1 = CLP769.75219 €1 = ILS4.22684 €1 = PLN4.28974 €1 = ZAR16.83276
€1 = CNY7.05400 €1 = INR71.86553 €1 = RUB79.33792
The following exchange rates were used to translate foreign currency assets and liabilities in the Man GLG Alpha Select Alternative and Man GLG Total Return at 31 December 2015:
£1 = AUD2.02584 £1 = HKD11.422940 £1 = JPY177.30282 £1 = US$1.47390
£1 = CHF1.47537 £1 = €1.35680 £1 = NOK13.04601
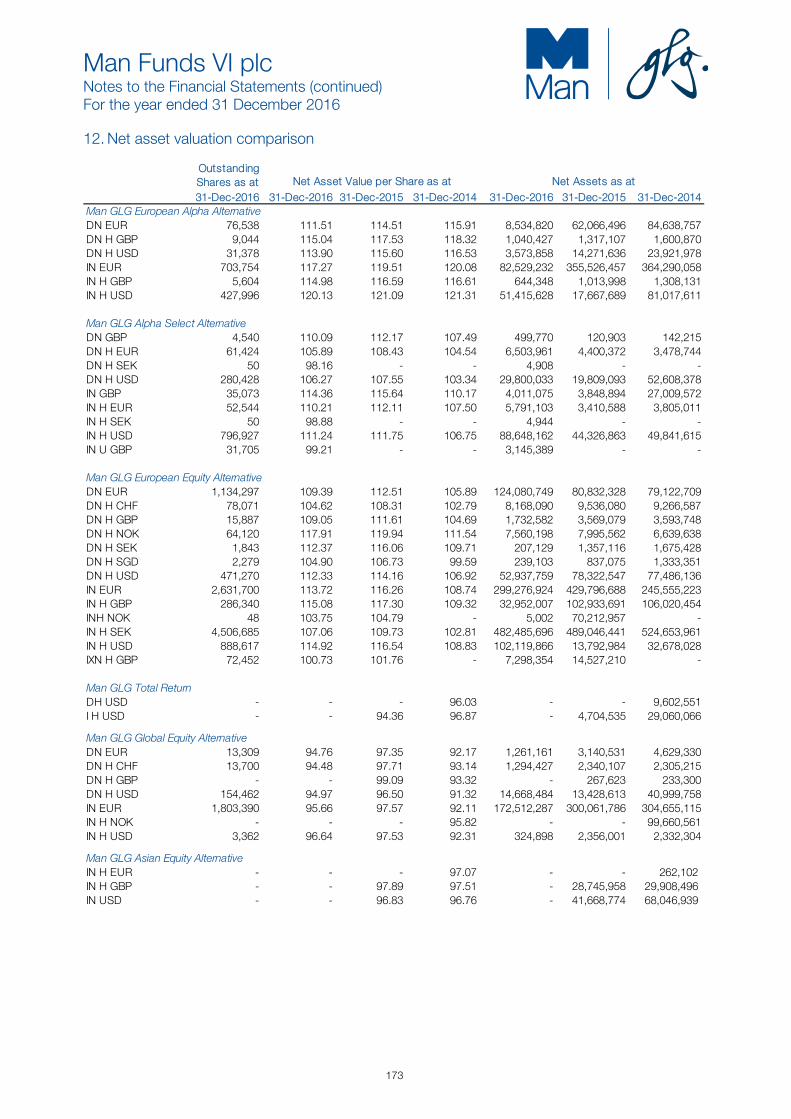
Man Funds VI plc Notes to the Financial Statements (continued) For the year ended 31 December 2016
173
12. Net asset valuation comparison
OutstandingShares as at31-Dec-2016 31-Dec-2016 31-Dec-2015 31-Dec-2014 31-Dec-2016 31-Dec-2015 31-Dec-2014
Man GLG European Alpha AlternativeDN EUR 76,538 111.51 114.51 115.91 8,534,820 62,066,496 84,638,757 DN H GBP 9,044 115.04 117.53 118.32 1,040,427 1,317,107 1,600,870 DN H USD 31,378 113.90 115.60 116.53 3,573,858 14,271,636 23,921,978 IN EUR 703,754 117.27 119.51 120.08 82,529,232 355,526,457 364,290,058 IN H GBP 5,604 114.98 116.59 116.61 644,348 1,013,998 1,308,131 IN H USD 427,996 120.13 121.09 121.31 51,415,628 17,667,689 81,017,611
Man GLG Alpha Select AlternativeDN GBP 4,540 110.09 112.17 107.49 499,770 120,903 142,215 DN H EUR 61,424 105.89 108.43 104.54 6,503,961 4,400,372 3,478,744 DN H SEK 50 98.16 - - 4,908 - - DN H USD 280,428 106.27 107.55 103.34 29,800,033 19,809,093 52,608,378 IN GBP 35,073 114.36 115.64 110.17 4,011,075 3,848,894 27,009,572 IN H EUR 52,544 110.21 112.11 107.50 5,791,103 3,410,588 3,805,011 IN H SEK 50 98.88 - - 4,944 - - IN H USD 796,927 111.24 111.75 106.75 88,648,162 44,326,863 49,841,615 IN U GBP 31,705 99.21 - - 3,145,389 - -
Man GLG European Equity AlternativeDN EUR 1,134,297 109.39 112.51 105.89 124,080,749 80,832,328 79,122,709 DN H CHF 78,071 104.62 108.31 102.79 8,168,090 9,536,080 9,266,587 DN H GBP 15,887 109.05 111.61 104.69 1,732,582 3,569,079 3,593,748 DN H NOK 64,120 117.91 119.94 111.54 7,560,198 7,995,562 6,639,638 DN H SEK 1,843 112.37 116.06 109.71 207,129 1,357,116 1,675,428 DN H SGD 2,279 104.90 106.73 99.59 239,103 837,075 1,333,351 DN H USD 471,270 112.33 114.16 106.92 52,937,759 78,322,547 77,486,136 IN EUR 2,631,700 113.72 116.26 108.74 299,276,924 429,796,688 245,555,223 IN H GBP 286,340 115.08 117.30 109.32 32,952,007 102,933,691 106,020,454 INH NOK 48 103.75 104.79 - 5,002 70,212,957 - IN H SEK 4,506,685 107.06 109.73 102.81 482,485,696 489,046,441 524,653,961 IN H USD 888,617 114.92 116.54 108.83 102,119,866 13,792,984 32,678,028 IXN H GBP 72,452 100.73 101.76 - 7,298,354 14,527,210 -
Man GLG Total ReturnDH USD - - - 96.03 - - 9,602,551 I H USD - - 94.36 96.87 - 4,704,535 29,060,066
Man GLG Global Equity AlternativeDN EUR 13,309 94.76 97.35 92.17 1,261,161 3,140,531 4,629,330 DN H CHF 13,700 94.48 97.71 93.14 1,294,427 2,340,107 2,305,215 DN H GBP - - 99.09 93.32 - 267,623 233,300 DN H USD 154,462 94.97 96.50 91.32 14,668,484 13,428,613 40,999,758 IN EUR 1,803,390 95.66 97.57 92.11 172,512,287 300,061,786 304,655,115 IN H NOK - - - 95.82 - - 99,660,561 IN H USD 3,362 96.64 97.53 92.31 324,898 2,356,001 2,332,304
Man GLG Asian Equity AlternativeIN H EUR - - - 97.07 - - 262,102 IN H GBP - - 97.89 97.51 - 28,745,958 29,908,496 IN USD - - 96.83 96.76 - 41,668,774 68,046,939
Net Asset Value per Share as at Net Assets as at

Man Funds VI plc Notes to the Financial Statements (continued) For the year ended 31 December 2016
174
12. Net asset valuation comparison (continued)
OutstandingShares as at31-Dec-2016 31-Dec-2016 31-Dec-2015 31-Dec-2014 31-Dec-2016 31-Dec-2015 31-Dec-2014
Man GLG European Alpha Alternative EnhancedDN EUR - - 92.07 93.65 - 9,226 14,703 DN H GBP - - 93.00 94.04 - 41,849 47,020 DN H USD - - - 93.52 - - 115,965 IN EUR - - 92.95 93.84 - 21,249,171 36,145,948 IN H CHF - - 94.28 - - 2,007,663 - IN H USD - - 93.19 93.97 - 5,314,324 3,898,064
Man GLG Cred-Eq AlternativeDN EUR 17,663 92.65 95.79 98.79 1,636,458 6,679,243 4,225,545 DN H USD 4,827 93.58 95.79 98.75 451,763 21,013,100 14,433,103 IN EUR 453,114 94.31 96.85 99.25 42,733,181 50,095,517 35,393,344 IN H USD 12,356 96.76 98.39 101.05 1,195,590 1,072,910 170,168
Man AHL Multi Strategy AlternativeDN USD 372,283 101.61 100.49 102.02 37,829,342 43,623,680 12,242,080 DN H EUR 1,363 100.61 - - 137,151 - - DN H GBP 9,840 96.52 95.72 - 949,763 855,193 - DN H SEK 50 101.34 - - 5,067 - - IN H CHF 7,350 96.24 96.34 - 707,387 708,076 - IN H EUR 727,092 97.32 96.71 - 70,759,576 77,225,650 - IN H GBP 800 100.94 - - 80,763 - - IN USD 71,855 103.37 101.46 102.10 7,427,547 7,877,970 40,839,207 IN H SEK 559,391 97.90 97.70 - 54,766,924 56,280,871 -
Man AHL Directional Equities AlternativeDN USD - - 94.50 - - 9,127,611 - IN USD - - 104.71 103.38 - 26,176,439 25,846,081 IN H EUR - - 100.83 - - 4,746,718 -
Man AHL TargetRiskD H EUR 10 96.67 - - 967 - - D H SEK 50 97.37 - - 4,868 - - D USD 1,960 96.88 - - 189,934 - - I H EUR 10 100.49 - - 1,005 - - I H GBP 3,611 97.73 - - 352,892 - - I H SEK 50 96.92 - - 4,846 - - I USD 243,737 113.52 101.77 102.45 27,667,827 26,656,597 20,489,397
Man AHL Volatility AlternativeDN USD 10 100.86 - - 1,009 - - IN USD 157,114 96.83 94.02 96.40 15,212,784 18,564,510 20,891,875 IN H EUR 16,046 98.89 97.26 100.25 1,586,896 27,081,674 13,016,217
Man GLG European Mid-Cap Equity AlternativeDN EUR 1,312 103.03 - - 135,187 - - DN H SEK 50 101.36 - - 5,068 - - DN H USD 262,830 110.71 106.55 - 29,098,374 14,534,023 - DNY EUR 29,446 101.77 - - 2,996,856 - - IN EUR 1,725,420 107.67 - - 185,776,138 - - IN H CHF 10,000 100.29 - - 1,002,865 - - IN H GBP 4,926 111.79 107.16 - 550,717 638,198 - IN H SEK 50 100.92 - - 5,046 - - IN H USD 36,507 112.13 107.02 - 4,093,462 18,622,219 - IN F EUR 914,205 108.06 103.63 - 98,788,992 84,857,680 - INF H CHF 2,550 104.18 100.45 - 265,658 1,099,924 - INF H GBP 86,666 106.44 101.64 - 9,224,797 6,809,891 - INF H USD 3,589 108.59 103.00 - 389,753 308,997 -
Net Asset Value per Share as at Net Assets as at

Man Funds VI plc Notes to the Financial Statements (continued) For the year ended 31 December 2016
175
12. Net asset valuation comparison (continued)
OutstandingShares as at31-Dec-2016 31-Dec-2016 31-Dec-2015 31-Dec-2014 31-Dec-2016 31-Dec-2015 31-Dec-2014
Man Numeric Market Neutral AlternativeDN H EUR 738 104.84 - - 77,422 - - DN H NOK 50 105.53 - - 5,277 - - DN H SEK 50 105.89 - - 5,294 - - DN USD 251,175 103.63 100.62 - 26,029,098 15,697,461 - IN H CHF 18,422 98.77 - - 1,819,491 - - IN H EUR 372,692 103.11 100.66 - 38,428,272 8,834,985 - IN H NOK 50 105.68 - - 5,284 - - IN H SEK 50 106.49 - - 5,325 - - IN USD 368,500 104.97 101.22 - 38,681,469 37,742,329 - INU H EUR 357,258 100.06 - - 35,746,811 - - INU H GBP Dist 4,660 99.86 - - 465,373 - - INU USD 240,271 100.13 - - 24,058,335 - -
Man GLG Unconstrained Emerging EquityD C SEK 50 110.99 - - 5,549 - - D C USD 10 95.77 - - 958 - - DF C NOK 50 100.56 - - 5,028 - - DF C SEK 50 99.53 - - 4,976 - - DF C USD 103,037 95.47 - - 9,836,942 - - I C SEK 50 111.75 - - 5,587 - - I C USD 1,553 103.32 98.32 - 160,415 152,655 - IF C EUR 138,659 112.84 103.94 - 15,646,278 3,523,021 - IF C GBP 127,834 131.56 104.74 - 16,817,898 13,388,783 - IF C NOK 50 98.04 - - 4,902 - - IF C SEK 50 99.66 - - 4,983 - - IF C USD 188,086 107.35 101.94 - 20,191,779 19,173,160 -
Man GLG Global Emerging Markets Debt Total ReturnD H EUR 251 104.34 - - 26,186 - - D H GBP 10 105.05 - - 1,050 - - D H NOK 50 101.88 - - 5,094 - - D H SEK 50 104.06 - - 5,203 - - D USD 39,248 105.37 - - 4,135,585 - - DL H EUR 999 103.03 - - 102,964 - - DMF USD 13,715 101.18 - - 1,387,656 - - DY USD 7,363 101.73 - - 749,038 - - I H CHF 2,600 100.83 - - 262,150 - - I H EUR 357,487 104.79 - - 37,461,669 - - I H EUR Dist 86,165 103.27 - - 8,898,152 - - I H GBP 10 105.38 - - 1,054 - - I H NOK 50 101.81 - - 5,090 - - I H SEK 50 104.55 - - 5,228 - - I USD 1,194,181 105.76 - - 126,297,228 - - IL H EUR 10 104.39 - - 1,044 - - IL USD 10 105.26 - - 1,053 - - IMF H EUR 822,516 101.69 - - 83,641,652 - - IMF H EUR Dist 2,137,141 104.96 - - 224,314,319 - - IMF H GBP Dist 52,586 101.44 - - 5,334,224 - - IMF USD 85,262 105.50 - - 8,995,100 - -
Man GLG Innovation Equity AlternativeIN H CHF 10 100.00 - - 1,000 - - IN H EUR 10 100.00 - - 1,000 - - IN H GBP 10 100.00 - - 1,000 - - IN H NOK 50 100.00 - - 5,000 - - IN H SEK 50 100.00 - - 5,000 - - IN USD 200,000 100.00 - - 19,999,273 - -
Man GLG Global Fundamental EquityIN EUR 10 100.00 - - 1,000 - - IN H CHF 10 100.00 - - 1,000 - - IN H GBP 10 100.00 - - 1,000 - - IN H NOK 50 100.00 - - 5,000 - - IN H SEK 50 100.00 - - 5,000 - - IN H USD 200,000 100.00 - - 20,000,000 - -
Net Asset Value per Share as at Net Assets as at
Man Funds VI plc Notes to the Financial Statements (continued) For the year ended 31 December 2016
176
13. Segregation of liabilities between portfolios
Upon the establishment of the Fund on 28 November 2007, the Fund availed of the provisions of the Investment Funds, Companies and Miscellaneous Provisions Act, 2005 to segregate liabilities between each portfolio.
14. Securities owned and securities sold, not yet purchased
Possession of securities owned is maintained by major multinational broker-dealers as at 31 December 2016 and 31 December 2015. Securities sold, not yet purchased represent obligations of the Fund to purchase the securities at prevailing market prices. The future satisfaction of such obligations may be for an amount greater than the amount recorded.
15. Taxation
The Fund qualifies as an investment undertaking as defined in Section 739 B of the Taxes (Consolidation) Acts 1997. It is not chargeable to Irish tax on its income or capital gains. Tax may arise on the happening of a chargeable event. A chargeable event includes any distribution payments to Shareholders or any encashment, redemption or transfer of Shares. No tax will arise on the Fund in respect of chargeable events regarding:
(i) a Shareholder who is not Irish resident and not ordinarily resident in Ireland at the time of the chargeable event, provided the necessary signed statutory declarations are held by the Fund; or
(ii) certain exempted Irish resident investors who have provided the Fund with the necessary signed statutory declarations; or (iii) Shares held in a recognised clearing system as designated by the order of the Irish Revenue Commissioners.
Following legislative changes in the Finance Act 2006, the holding of Shares at the end of a relevant year will, in respect of Irish Resident investors, also constitute a chargeable event. To the extent that any tax issues arise on such a chargeable event, such tax will be allowed as a credit against any tax payable on the subsequent encashment, redemption, cancellation or transfer of the relevant Shares. Relevant Year is defined as a period of 8 years beginning with the acquisition of a share by a shareholder and each subsequent period of 8 years beginning immediately after the preceding relevant year.
16. Soft commissions
The Investment Managers have entered into arrangements with the brokerage houses from which the Fund derives benefit. These commission sharing agreements are in conformity with the rules of the Investment Managers’ UK regulator, the UK’s Financial Conduct Authority.
17. Auditors’ remuneration
For the year ended 31 December 2016, the Fund incurred audit fees as disclosed in the statement of comprehensive income; these amounts represent a provision. The actual audit fees are US$236,099 (31 December 2015: US$204,731). The fees paid during the year for any tax advisory services, other assurance services or other non-audit services provided by the auditors of the Fund were US$124,803 (31 December 2015: US$44,489).
18. Efficient portfolio management
The Fund may employ investment techniques and instruments for efficient portfolio management of the assets of any Portfolio including hedging against market movements, currency exchange or interest rate risks under the conditions and within the limits stipulated by the Central Bank under the UCITS Regulations and described below. Techniques and instruments which are used for the purpose of efficient portfolio management, including FDIs which are not used for direct investment purposes, shall be understood as a reference to techniques and instruments which fulfil the following criteria:
i. they are economically appropriate in that they are realised in a cost effective way; ii. they are entered into for one or more of the following specific aims:
(a) reduction of risk; (b) reduction of cost; (c) generation of additional capital or income for a Portfolio with an appropriate level of risk taking into account the risk profile of
the Portfolio as described in the Prospectus, the risk diversification rules set out in UCITS Notice 9 and the general provisions of the UCITS Regulations
iii. their risks are adequately captured by the risk management procedures implemented by the Fund, and iv. they cannot result in a change to a Portfolio’s declared investment objective or add substantial supplementary risks in comparison
to the general risk policy as described in its sales documents. While the use of such techniques and instruments will be in line with the best interests of the Fund, individual techniques may result in increased counterparty risk and potential conflicts of interest. Details of the proposed efficient portfolio management techniques and policies adopted by the Fund in relation to their use by the Portfolios and details of the relevant risks are set out in the Prospectus. As at 31 December 2016 there were no investment techniques or instruments being used for efficient portfolio management purposes.
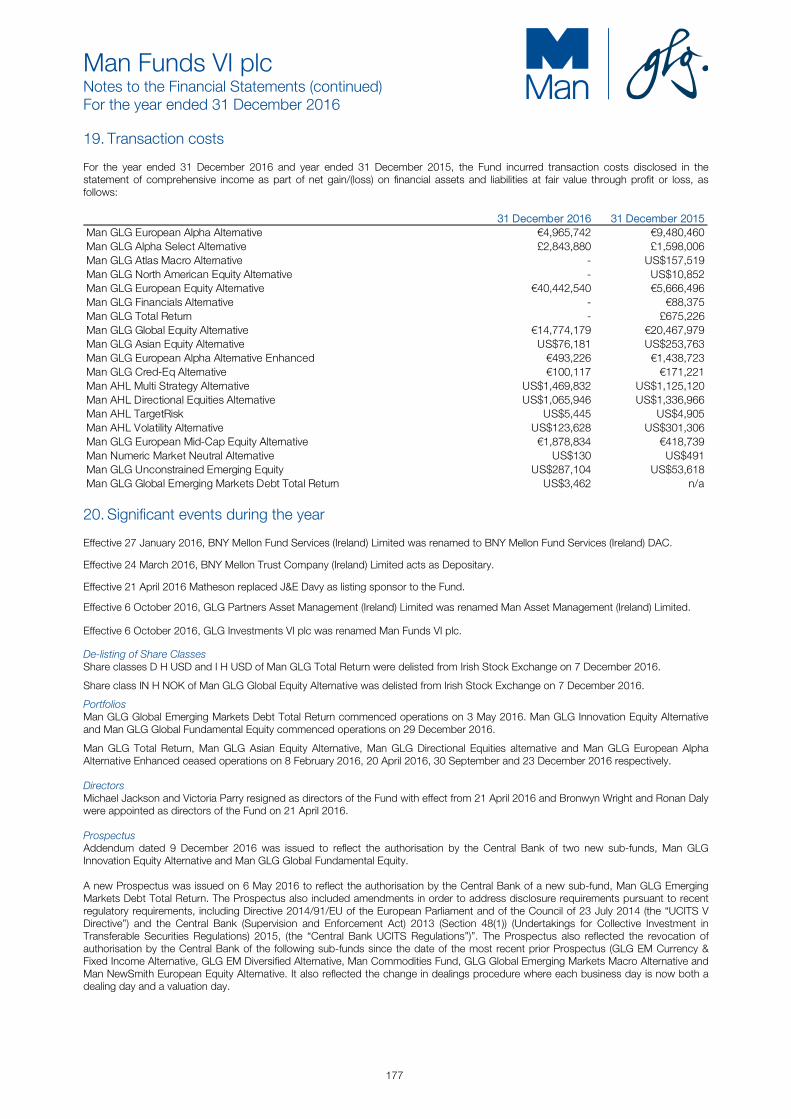
Man Funds VI plc Notes to the Financial Statements (continued) For the year ended 31 December 2016
177
19. Transaction costs
For the year ended 31 December 2016 and year ended 31 December 2015, the Fund incurred transaction costs disclosed in the statement of comprehensive income as part of net gain/(loss) on financial assets and liabilities at fair value through profit or loss, as follows:
31 December 2016 31 December 2015Man GLG European Alpha Alternative €4,965,742 €9,480,460Man GLG Alpha Select Alternative £2,843,880 £1,598,006Man GLG Atlas Macro Alternative - US$157,519Man GLG North American Equity Alternative - US$10,852Man GLG European Equity Alternative €40,442,540 €5,666,496Man GLG Financials Alternative - €88,375Man GLG Total Return - £675,226Man GLG Global Equity Alternative €14,774,179 €20,467,979Man GLG Asian Equity Alternative US$76,181 US$253,763Man GLG European Alpha Alternative Enhanced €493,226 €1,438,723Man GLG Cred-Eq Alternative €100,117 €171,221Man AHL Multi Strategy Alternative US$1,469,832 US$1,125,120Man AHL Directional Equities Alternative US$1,065,946 US$1,336,966Man AHL TargetRisk US$5,445 US$4,905Man AHL Volatility Alternative US$123,628 US$301,306Man GLG European Mid-Cap Equity Alternative €1,878,834 €418,739Man Numeric Market Neutral Alternative US$130 US$491Man GLG Unconstrained Emerging Equity US$287,104 US$53,618 Man GLG Global Emerging Markets Debt Total Return US$3,462 n/a
20. Significant events during the year
Effective 27 January 2016, BNY Mellon Fund Services (Ireland) Limited was renamed to BNY Mellon Fund Services (Ireland) DAC.
Effective 24 March 2016, BNY Mellon Trust Company (Ireland) Limited acts as Depositary.
Effective 21 April 2016 Matheson replaced J&E Davy as listing sponsor to the Fund.
Effective 6 October 2016, GLG Partners Asset Management (Ireland) Limited was renamed Man Asset Management (Ireland) Limited. Effective 6 October 2016, GLG Investments VI plc was renamed Man Funds VI plc. De-listing of Share Classes Share classes D H USD and I H USD of Man GLG Total Return were delisted from Irish Stock Exchange on 7 December 2016.
Share class IN H NOK of Man GLG Global Equity Alternative was delisted from Irish Stock Exchange on 7 December 2016.
Portfolios Man GLG Global Emerging Markets Debt Total Return commenced operations on 3 May 2016. Man GLG Innovation Equity Alternative and Man GLG Global Fundamental Equity commenced operations on 29 December 2016.
Man GLG Total Return, Man GLG Asian Equity Alternative, Man GLG Directional Equities alternative and Man GLG European Alpha Alternative Enhanced ceased operations on 8 February 2016, 20 April 2016, 30 September and 23 December 2016 respectively. Directors Michael Jackson and Victoria Parry resigned as directors of the Fund with effect from 21 April 2016 and Bronwyn Wright and Ronan Daly were appointed as directors of the Fund on 21 April 2016. Prospectus Addendum dated 9 December 2016 was issued to reflect the authorisation by the Central Bank of two new sub-funds, Man GLG Innovation Equity Alternative and Man GLG Global Fundamental Equity. A new Prospectus was issued on 6 May 2016 to reflect the authorisation by the Central Bank of a new sub-fund, Man GLG Emerging Markets Debt Total Return. The Prospectus also included amendments in order to address disclosure requirements pursuant to recent regulatory requirements, including Directive 2014/91/EU of the European Parliament and of the Council of 23 July 2014 (the “UCITS V Directive”) and the Central Bank (Supervision and Enforcement Act) 2013 (Section 48(1)) (Undertakings for Collective Investment in Transferable Securities Regulations) 2015, (the “Central Bank UCITS Regulations”)”. The Prospectus also reflected the revocation of authorisation by the Central Bank of the following sub-funds since the date of the most recent prior Prospectus (GLG EM Currency & Fixed Income Alternative, GLG EM Diversified Alternative, Man Commodities Fund, GLG Global Emerging Markets Macro Alternative and Man NewSmith European Equity Alternative. It also reflected the change in dealings procedure where each business day is now both a dealing day and a valuation day.
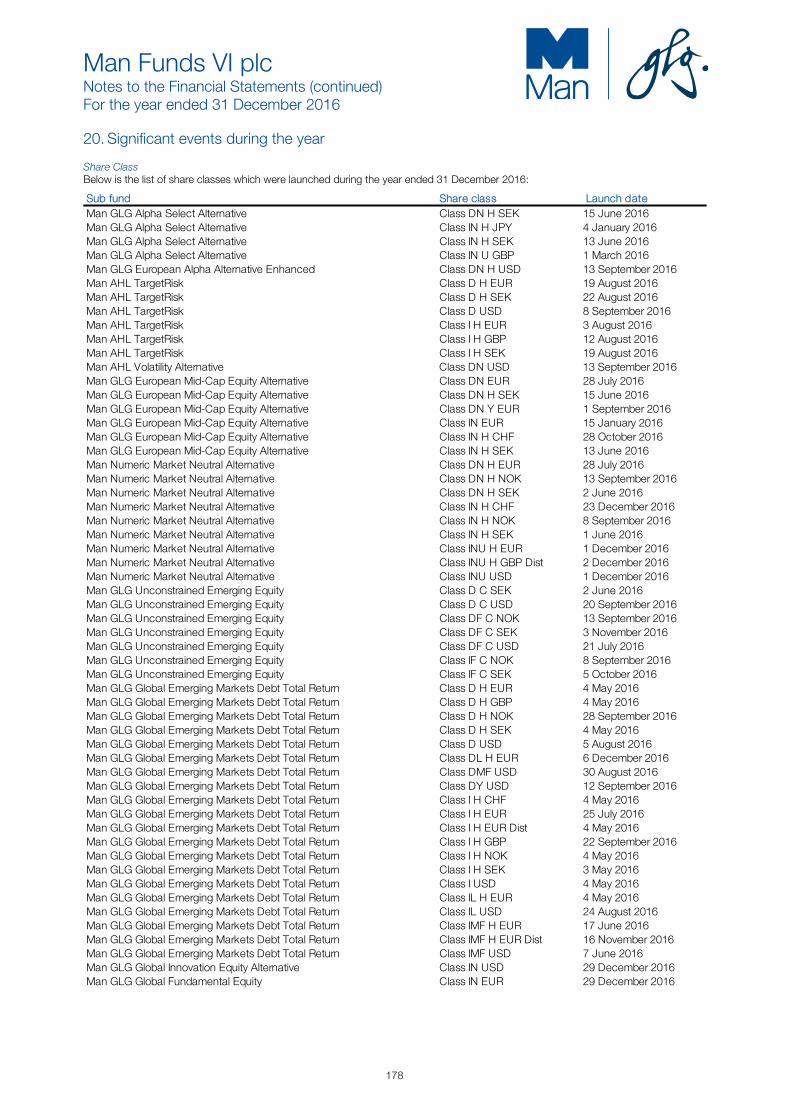
Man Funds VI plc Notes to the Financial Statements (continued) For the year ended 31 December 2016
178
20. Significant events during the year
Share Class Below is the list of share classes which were launched during the year ended 31 December 2016:
Sub fund Share class Launch dateMan GLG Alpha Select Alternative Class DN H SEK 15 June 2016Man GLG Alpha Select Alternative Class IN H JPY 4 January 2016Man GLG Alpha Select Alternative Class IN H SEK 13 June 2016Man GLG Alpha Select Alternative Class IN U GBP 1 March 2016Man GLG European Alpha Alternative Enhanced Class DN H USD 13 September 2016Man AHL TargetRisk Class D H EUR 19 August 2016Man AHL TargetRisk Class D H SEK 22 August 2016Man AHL TargetRisk Class D USD 8 September 2016Man AHL TargetRisk Class I H EUR 3 August 2016Man AHL TargetRisk Class I H GBP 12 August 2016Man AHL TargetRisk Class I H SEK 19 August 2016Man AHL Volatility Alternative Class DN USD 13 September 2016Man GLG European Mid-Cap Equity Alternative Class DN EUR 28 July 2016Man GLG European Mid-Cap Equity Alternative Class DN H SEK 15 June 2016Man GLG European Mid-Cap Equity Alternative Class DN Y EUR 1 September 2016Man GLG European Mid-Cap Equity Alternative Class IN EUR 15 January 2016Man GLG European Mid-Cap Equity Alternative Class IN H CHF 28 October 2016Man GLG European Mid-Cap Equity Alternative Class IN H SEK 13 June 2016Man Numeric Market Neutral Alternative Class DN H EUR 28 July 2016Man Numeric Market Neutral Alternative Class DN H NOK 13 September 2016Man Numeric Market Neutral Alternative Class DN H SEK 2 June 2016Man Numeric Market Neutral Alternative Class IN H CHF 23 December 2016Man Numeric Market Neutral Alternative Class IN H NOK 8 September 2016Man Numeric Market Neutral Alternative Class IN H SEK 1 June 2016Man Numeric Market Neutral Alternative Class INU H EUR 1 December 2016Man Numeric Market Neutral Alternative Class INU H GBP Dist 2 December 2016Man Numeric Market Neutral Alternative Class INU USD 1 December 2016Man GLG Unconstrained Emerging Equity Class D C SEK 2 June 2016Man GLG Unconstrained Emerging Equity Class D C USD 20 September 2016Man GLG Unconstrained Emerging Equity Class DF C NOK 13 September 2016Man GLG Unconstrained Emerging Equity Class DF C SEK 3 November 2016Man GLG Unconstrained Emerging Equity Class DF C USD 21 July 2016Man GLG Unconstrained Emerging Equity Class IF C NOK 8 September 2016Man GLG Unconstrained Emerging Equity Class IF C SEK 5 October 2016Man GLG Global Emerging Markets Debt Total Return Class D H EUR 4 May 2016Man GLG Global Emerging Markets Debt Total Return Class D H GBP 4 May 2016Man GLG Global Emerging Markets Debt Total Return Class D H NOK 28 September 2016Man GLG Global Emerging Markets Debt Total Return Class D H SEK 4 May 2016Man GLG Global Emerging Markets Debt Total Return Class D USD 5 August 2016Man GLG Global Emerging Markets Debt Total Return Class DL H EUR 6 December 2016Man GLG Global Emerging Markets Debt Total Return Class DMF USD 30 August 2016Man GLG Global Emerging Markets Debt Total Return Class DY USD 12 September 2016Man GLG Global Emerging Markets Debt Total Return Class I H CHF 4 May 2016Man GLG Global Emerging Markets Debt Total Return Class I H EUR 25 July 2016Man GLG Global Emerging Markets Debt Total Return Class I H EUR Dist 4 May 2016Man GLG Global Emerging Markets Debt Total Return Class I H GBP 22 September 2016Man GLG Global Emerging Markets Debt Total Return Class I H NOK 4 May 2016Man GLG Global Emerging Markets Debt Total Return Class I H SEK 3 May 2016Man GLG Global Emerging Markets Debt Total Return Class I USD 4 May 2016Man GLG Global Emerging Markets Debt Total Return Class IL H EUR 4 May 2016Man GLG Global Emerging Markets Debt Total Return Class IL USD 24 August 2016Man GLG Global Emerging Markets Debt Total Return Class IMF H EUR 17 June 2016Man GLG Global Emerging Markets Debt Total Return Class IMF H EUR Dist 16 November 2016Man GLG Global Emerging Markets Debt Total Return Class IMF USD 7 June 2016Man GLG Global Innovation Equity Alternative Class IN USD 29 December 2016Man GLG Global Fundamental Equity Class IN EUR 29 December 2016
Man Funds VI plc Notes to the Financial Statements (continued) For the year ended 31 December 2016
179
20. Significant events during the year (continued)
In response to the CBI publishing the Central Bank (Supervision and Enforcement) Act 2013 (Section 48(1)) Investor Money Regulations 2015 for Fund Service Providers (the “Investor Money Regulations” or “IMR”) in March 2015 (effective from 1 July 2016), the Manager undertook, together with BNY Mellon Fund Services (Ireland) Designated Activity Company, a review of the way in which subscription, distribution and redemption monies are channelled to and from the Fund or the relevant sub-fund. As a result of this review, subscription and redemption monies will (effective from 1 July 2016), be channelled through a sub-fund cash collection account in the name of the sub-fund. Pending issue of the units and / or payment of subscription proceeds to an account in the name of the sub-funds, and pending payment of redemption proceeds or distributions, the relevant investor will be an unsecured creditor of the sub-fund in respect of amounts paid by or due to it.
21. Significant events since the year end
Effective 26 January 2017, GLG Asian Equity Alternative Fund has been removed from the Official List and from trading on the Main Securities Market of the Irish Stock Exchange.
22. Stock lending
The Fund may enter into stock lending programmes organised by generally recognised International Central Securities Depositaries Systems provided that the programme is subject to a guarantee from the system operator. No such transactions incurred during the year.
23. Contingent liabilities and commitments
There were no contingent liabilities or commitments other than those already disclosed in these financial statements as at 31 December 2016 (31 December 2015: Nil).
24. Approval of financial statements
The Directors approved these financial statements on 21 April 2017.

Man Funds VI PlcSchedule of Investments as at 31 December 2016 Man GLG European Alpha Alternative
Financial assets at fair value through profit or loss Fair % of
Value Net
Nominal Description € Assets
Contracts for difference (b)France
4,897 Atos SE 2,364 0.008,089 Elior Group 602 0.008,411 RUBIS 1,075 0.00
4,041 0.00
Germany
(3,308.0) Covestro AG 34 0.00(24,477.0) Linde AG 35,492 0.02
35,526 0.02
Ireland
13,324 CRH Plc 10,987 0.01
Isle Of Man
87,820 Playtech Limited 14,348 0.01
Netherlands
(988,026.0) Delta Lloyd NV 170,928 0.12(228,873.0) Randstad Holdings NV 34,331 0.02
205,259 0.14
Sweden
(6,958.0) Assa Abloy AB 636 0.00(6,865.0) Hennes & Mauritz AB 579 0.00
(17,667.0) Volvo AB 1,615 0.00 2,830 0.00
United Kingdom9,121 Associated British Foods Plc 860 0.00
335,446 Booker group Plc 7,242 0.0146,032 Legal & General Group Plc 150 0.00
8,252 0.01
Total contracts for difference 281,243 0.19
EquitiesDenmark
13,242 DSV A/S 559,563 0.403,710 Pandora A/S 461,036 0.32
1,020,599 0.72 Germany
8,318 Brenntag AG 439,190 0.303,356 Daimler AG 237,336 0.163,549 Deutsche Bank AG # 61,220 0.048,993 Deutsche Telekom AG # 147,081 0.10
570,119 E.ON SE 3,819,797 2.6332,149 Fresenius SE & Company KGaA # 2,387,385 1.65
974,522 Infineon Technologies AG # 16,089,358 11.0824,477 Linde AG # 3,820,860 2.63
421,624 SAP SE # 34,914,683 24.05 61,916,910 42.64
Italy
13,169 Moncler SpA 217,684 0.155,592 Prysmian SpA 136,445 0.10
280,745 Telecom Italia SpA # 234,984 0.16 589,113 0.41
Netherlands
988,026 Delta Lloyd NV 5,253,334 3.621,506,591 ING Groep NV 20,143,122 13.88
16,140 Koninklijke DSM NV # 919,334 0.63228,873 Randstad Holdings NV # 11,793,826 8.12
38,109,616 26.25
Total equities 101,636,238 70.02
Future contract (a)Germany
(2.0) DAX Index Future March 2017 100 0.00
Total future contract 100 0.00
182

Man Funds VI PlcSchedule of Investments as at 31 December 2016 (continued) Man GLG European Alpha Alternative (continued)Financial assets at fair value through profit or loss (continued)
Forward currency contracts (note 4)* (b)Unrealised % of
gain Net
Amount Receivable Amount Payable Maturity Date Contracts € Assets€1,003,000 CHF1,071,244 19 January 2017 1 3,339 0.00€131,545 DKK 977,589 19 January 2017 1 53 0.00€2,926 GBP 2,495 19 January 2017 1 5 0.00€91,051 US$95,279 06 January 2017 2 765 0.00€8,609 US$9,008 19 January 2017 1 78 0.00
Total unrealised gain on forward currency contracts 4,240 0.00
Total financial assets at fair value through profit or loss - trading 101,921,821 70.21
183

Man Funds VI PlcSchedule of Investments as at 31 December 2016 (continued)Man GLG European Alpha Alternative (continued)Financial liabilities at fair value through profit or loss
Fair % of Fair % of Value Net Value Net
Nominal Description € Assets Nominal Description € Assets
Contracts for difference Total return swap Bermuda European Union
(14) FTSE 250 Index (2,539) (0.00) (3,996) CitiPriceMomPure Europe TRS (2,806) (0.00)
Denmark Total total return swap (2,806) (0.00) (4,501) Novozymes A/S (842) (0.00)
European Union
(2,845) ESTX SML EUR Price (2,400) (0.00) (111) FTSE Developed Europe SMID Cap Tradable Plus (834) (0.00) (170) GS EU Momentum Long Price (2,287) (0.00)
(1,243) STXE 600 Eur Price Index (2,121) (0.00) (7,642) (0.00)
France
(1,748) Cie Generale des Etablissements Michelin (159) (0.00) (3,796) CREDIT AGRICOLE SA (821) (0.00)
(420) Hermes International (1,110) (0.00) (2,770) JC Decaux SA (45) (0.00)
(563) Kering (181) (0.00) (1,481) L'Oreal SA (1,170) (0.00) (1,216) LVMH Moet Hennessy Louis Vuitton SE (1,995) (0.00) (5,086) Peugeot SA (1,630) (0.00) (5,051) Renault SA (1,717) (0.00)
(14,692) Teleperformance (4,146) (0.00) (433) Unibail-Rodamco SE (2,006) (0.00)
(14,980) (0.00)
Germany
(1,649) Bayerische Motoren Werke AG (545) (0.00) (570,119) E.ON AG (136,258) (0.10)
(32,149) Fresenius SE & Company KGaA (175,534) (0.13)(974,522) Infineon Technologies AG (316,720) (0.22)
(3,424) Rheinmetall AG (416) (0.00) (423,533) SAP SE (2,127,450) (1.47)
(2,756,923) (1.92)
Ireland
(3,089) DCC Plc (587) (0.00) (5,838) Experian Plc (1,500) (0.00) (2,539) Paddy Power Plc (2,176) (0.00)
(4,263) (0.00)
Italy
(22,117) Eni SpA (3,577) (0.00)
Malta
(45,173) GVC Holdings Plc (599) (0.00)
Netherlands
(16,140) DSM NV (4,035) (0.00) (1,506,591) ING Groep NV (153,126) (0.11)
(1,773) Royal Dutch Shell (229) (0.00) (157,390) (0.11)
Spain
(8,418) Inditex SA (1,486) (0.00)
Switzerland
(666) Geberit AG (1,107) (0.00)(141) Givaudan (2,393) (0.00)
(4,233) Lafargeholcim Limited (643) (0.00) (2,385) Schindler Holding-Part Cert (1,972) (0.00)
(234) SGS SA (3,046) (0.00)(9,161) (0.01)
United Kingdom
(24,385) BP Plc (524) (0.00) (6,051) Compass Group Plc (2,661) (0.00) (2,387) Croda International Plc (1,285) (0.00)
(80,589) G4S Plc (3,453) (0.00) (17,881) Marks & Spencer Group (225) (0.00) (11,776) Merlin Entertainments Plc-Wi Cfd (115) (0.00) (17,741) National Grid Plc (1,897) (0.00)
(577) Reckitt Benckiser Group Plc (546) (0.00) (5,853) Sage Group Plc (98) (0.00)
(25,935) Serco Group Plc (226) (0.00) (2,185) Whitbread Plc (993) (0.00)
(12,023) (0.00)
Total contracts for difference (2,971,425) (2.04)
184

Man Funds VI PlcSchedule of Investments as at 31 December 2016 (continued)Man GLG European Alpha Alternative (continued)Financial liabilities at fair value through profit or loss (continued)
Forward currency contracts (note 4)* Unrealised % of
loss Net
Amount Receivable Amount Payable Maturity Date Contracts € Assets€730,365 US$5,431,657 19 January 2017 2 (227) (0.00) €4,507 US$3,867 06 January 2017 1 (22) (0.00) GBP 1,695,840 €2,017,969 06 January 2017 2 (31,796) (0.03)NOK 12,109,019 €1,339,000 19 January 2017 1 (6,467) (0.00) US$55,130,647 €52,695,935 06 January 2017 3 (454,253) (0.32)
Total unrealised loss on forward currency contracts (492,765) (0.35).
Total financial liabilities at fair value through profit or loss - trading (3,466,996) (2.39)
Total financial assets at fair value through profit or loss - trading 101,921,821 70.21
Total financial liabilities at fair value through profit or loss - trading (3,466,996) (2.39)
Other net assets 46,710,223 32.18
Net Assets Attributable to Holders of Redeemable Participating Shares 145,165,048 (100.00)
*The forward currency contracts are held with The Bank of New York Mellon, Brussels
Classifications : (a) Exchange traded derivative instruments (b) OTC financial derivatives instruments All other investments held at the year end are transferable securities listed on an official stock exchange
% of Total Analysis of Total Assets Assets Transferable securities listed on official stock exchange 17.28 Exchange traded financial derivative instruments described in classification (a) above 0.00 OTC financial derivative instruments described in classification (b) above 0.16
Transferable Securities as described in # above 38.9 Transferrable securities dealt on another regulated market described in * above 0.00
Other current assets 43.66100.00
Analysis of Total Assets rather than Net Assets is required under UCITS Notice 8.2 appendix B.
OTC financial derivatives are held with Bank of New York Mellon, Credit Suisse Securities Europe Limited and Morgan Stanley & Co. International Plc.
185

Man Funds VI PlcSchedule of Investments as at 31 December 2016 (continued)
Man GLG Alpha Select Alternative
Financial assets at fair value through profit or lossFinancial assets at fair value through profit or lossFinancial assets at fair value through profit or lossFinancial assets at fair value through profit or loss
Fair Fair Fair Fair % of% of% of% of Fair Fair Fair Fair % of% of% of% of
Value Value Value Value NetNetNetNet Value Value Value Value NetNetNetNet
Nominal Nominal Nominal Nominal DescriptionDescriptionDescriptionDescription £ £ £ £ AssetsAssetsAssetsAssets Nominal Nominal Nominal Nominal DescriptionDescriptionDescriptionDescription £ £ £ £ AssetsAssetsAssetsAssets
Contracts for differences (b)Contracts for differences (b)Contracts for differences (b)Contracts for differences (b) Government bondsGovernment bondsGovernment bondsGovernment bonds
IrelandIrelandIrelandIreland United KingdomUnited KingdomUnited KingdomUnited Kingdom
4,903 DCC Plc 6,027 0.01 4,040,000 United Kingdom Treasury Bill 0% 03/01/2017 # 4,040,000 3.54
(179,182) Henderson Group Plc 11,082 0.01 9,000,000 United Kingdom Treasury Bill 0% 06/02/2017 # 8,998,515 7.89
17,109 0.02 2,000,000 United Kingdom Treasury Bill 0% 09/01/2017 # 1,999,930 1.75
2,000,000 United Kingdom Treasury Bill 0% 13/02/2017 # 1,999,620 1.75
2,000,000 United Kingdom Treasury Bill 0% 13/03/2017 # 1,999,670 1.75
NetherlandsNetherlandsNetherlandsNetherlands 10,000,000 United Kingdom Treasury Bill 0% 18/04/2017 # 9,996,650 8.77
42,906 Royal Dutch Shell Plc 99,633 0.09 17,000,000 United Kingdom Treasury Bill 0% 20/02/2017 # 16,997,195 14.92
16,000,000 United Kingdom Treasury Bill 0% 30/01/2017 # 15,997,840 14.04
62,029,420 54.41
SwitzerlandSwitzerlandSwitzerlandSwitzerland
31,164 Wolseley Plc 30,282 0.03 Total government bonds Total government bonds Total government bonds Total government bonds 62,029,420 54.41
United KingdomUnited KingdomUnited KingdomUnited Kingdom
344,010 Aldermore Group Plc 220,801 0.19
1,082,140 Aviva Plc 254,497 0.22
(68,229) Babcock International Group Plc 13,344 0.01
29,853 Berkeley Group Holdings Plc 129,263 0.11
55,100 British Land Company Plc 20,767 0.02
(179,526) Card Factory Plc 94,101 0.08
57,319 Character Group Plc 22,181 0.02
(778,173) Convatec Group Plc 17,586 0.02
138,090 Conviviality Plc 8,495 0.01
(840,619) Debenhams Plc 92,989 0.08
552,802 Direct Line Insurance Group Plc 111,522 0.10
224,613 Dixons Carphone Plc 37,625 0.03
(20,745) easyJet Plc 37 0.00
326,457 Fenner Plc 101,331 0.09
(245,378) G4S Plc 1,869 0.00
(289,963) Greene King Plc 77,626 0.07
(179,294) Greggs Plc 69,950 0.06
(172,441) Halma Plc 96,968 0.09
308,154 Hays Plc 27,633 0.02
157,746 Hollywood Bowl Group Plc 9,859 0.01
192,157 Hostelworld Group Plc 59,600 0.05
760,045 Ibstock Plc 175,998 0.15
63,756 IMI Plc 28,553 0.03
477,057 Informa Plc 248,286 0.22
134,455 Intercontinental Hotels Group Plc 500,630 0.43
636,201 ITV Plc 133,556 0.12
(9,642) Johnson Matthey Plc 1,283 0.00
855,489 JRP Group Plc 111,542 0.10
(394,849) Kingfisher Plc 18,548 0.02
61,374 Land Securities Group Plc 35,587 0.03
1,615,012 Legal & General Group Plc 150,434 0.13
3,912,387 Lloyds Banking Group Plc 41,489 0.04
143,540 London Stock Exchange Group Plc 289,747 0.25
576,319 Mcbride Plc 19,124 0.02
927,762 Melrose Industries Plc 266,880 0.23
(131,634) Merlin Entertainments Plc 19,476 0.02
67,005 National Grid Plc 4,980 0.00
(613,342) NCC Group Plc 105,631 0.09
17,504 Persimmon Plc 6,778 0.01
587,059 RELX Plc 365,226 0.32
42,157 Renishaw Plc 82,827 0.07
1,344,076 Rentokil Initial Plc 50,559 0.04
(57,008) Rolls-Royce Holdings Plc 32,436 0.03
(101,516) Royal Mail Plc 22,909 0.02
180,983 RPC Group Plc 206,716 0.18
320,525 RSA Insurance Group Plc 162,206 0.14
372,406 Shawbrook Group Plc 189,619 0.17
53,669 Smith & Nephew Plc 28,121 0.02
(14,899) Spirax-Sarco Engineering Plc 7,592 0.01
235,199 St James'S Place Plc 99,777 0.09
278,644 Synthomer Plc 19,962 0.02
993,559 Taylor Wimpey Plc 7,851 0.01
1,241,646 Tesco Plc 47,465 0.04
(30,896) Unilever Plc 45,048 0.04
636,932 Volution Group Plc 37,493 0.03
317,162 Walker Greenbank Plc 52,280 0.05
236,816 WPP Plc 301,376 0.26
265,259 Zoopla Property Group Plc 870 0.00
5,386,899 4.71
Total contracts for differences Total contracts for differences Total contracts for differences Total contracts for differences 5,533,923 4.85
EquitiesEquitiesEquitiesEquities
United KingdomUnited KingdomUnited KingdomUnited Kingdom
472,366 Conviviality Plc 1,019,130 0.90
15,873 Costain Group Plc 56,151 0.05
2,976,294 Gaming Realms Plc 472,487 0.41
623,332 Watkin Jones Plc 733,973 0.64
2,281,741 2.00
Total equities Total equities Total equities Total equities 2,281,741 2.00
186

Man Funds VI PlcSchedule of Investments as at 31 December 2016 (continued)Man GLG Alpha Select Alternative (continued)
Financial assets at fair value through profit or loss (continued)Financial assets at fair value through profit or loss (continued)Financial assets at fair value through profit or loss (continued)Financial assets at fair value through profit or loss (continued)
Forward currency contracts (note 4) (b)Forward currency contracts (note 4) (b)Forward currency contracts (note 4) (b)Forward currency contracts (note 4) (b)
Unrealised Unrealised Unrealised Unrealised % of% of% of% of Unrealised Unrealised Unrealised Unrealised
gain gain gain gain Net Net Net Net
Amount ReceivableAmount ReceivableAmount ReceivableAmount Receivable Amount PayableAmount PayableAmount PayableAmount Payable Maturity DateMaturity DateMaturity DateMaturity Date ContractsContractsContractsContracts £ £ £ £ AssetsAssetsAssetsAssets
€12,396,940 GBP10,418,245 06 January 2017 5 166,552 0.15
GBP24,114 €28,108 06 January 2017 1 115 0.00
GBP104,702 US$128,498 19 January 2017 2 771 0.00
SEK9,894 GBP851 05 January 2017 2 30 0.00
US$118,839,519 GBP95,658,019 06 January 2017 2 492,792 0.43
Total unrealised gain on forward currency contractsTotal unrealised gain on forward currency contractsTotal unrealised gain on forward currency contractsTotal unrealised gain on forward currency contracts 660,260 0.58
Total financial assets at fair value through profit or loss -trading Total financial assets at fair value through profit or loss -trading Total financial assets at fair value through profit or loss -trading Total financial assets at fair value through profit or loss -trading 70,505,344 61.84
187
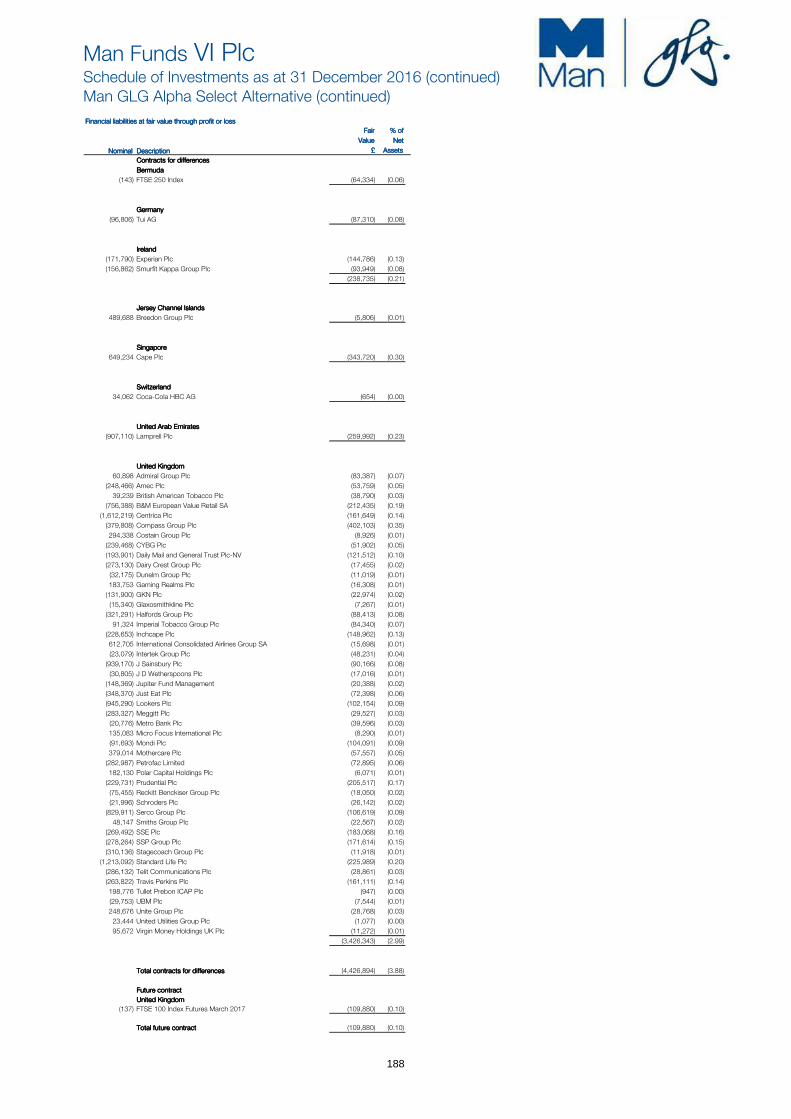
Man Funds VI PlcSchedule of Investments as at 31 December 2016 (continued)
Man GLG Alpha Select Alternative (continued)
Financial liabilities at fair value through profit or lossFinancial liabilities at fair value through profit or lossFinancial liabilities at fair value through profit or lossFinancial liabilities at fair value through profit or loss
Fair Fair Fair Fair % of% of% of% of
Value Value Value Value NetNetNetNet
Nominal Nominal Nominal Nominal DescriptionDescriptionDescriptionDescription £ £ £ £ AssetsAssetsAssetsAssets
Contracts for differences Contracts for differences Contracts for differences Contracts for differences
BermudaBermudaBermudaBermuda
(143) FTSE 250 Index (64,334) (0.06)
GermanyGermanyGermanyGermany
(96,806) Tui AG (87,310) (0.08)
IrelandIrelandIrelandIreland
(171,790) Experian Plc (144,786) (0.13)
(156,862) Smurfit Kappa Group Plc (93,949) (0.08)
(238,735) (0.21)
Jersey Channel IslandsJersey Channel IslandsJersey Channel IslandsJersey Channel Islands
489,688 Breedon Group Plc (5,806) (0.01)
SingaporeSingaporeSingaporeSingapore
649,234 Cape Plc (343,720) (0.30)
SwitzerlandSwitzerlandSwitzerlandSwitzerland
34,062 Coca-Cola HBC AG (654) (0.00)
United Arab Emirates United Arab Emirates United Arab Emirates United Arab Emirates
(907,110) Lamprell Plc (259,992) (0.23)
United KingdomUnited KingdomUnited KingdomUnited Kingdom
60,898 Admiral Group Plc (83,387) (0.07)
(248,466) Amec Plc (53,759) (0.05)
39,239 British American Tobacco Plc (38,790) (0.03)
(756,388) B&M European Value Retail SA (212,435) (0.19)
(1,612,219) Centrica Plc (161,649) (0.14)
(379,808) Compass Group Plc (402,103) (0.35)
294,338 Costain Group Plc (8,926) (0.01)
(239,468) CYBG Plc (51,902) (0.05)
(193,901) Daily Mail and General Trust Plc-NV (121,512) (0.10)
(273,130) Dairy Crest Group Plc (17,455) (0.02)
(32,175) Dunelm Group Plc (11,019) (0.01)
183,753 Gaming Realms Plc (16,308) (0.01)
(131,900) GKN Plc (22,974) (0.02)
(15,340) Glaxosmithkline Plc (7,267) (0.01)
(321,291) Halfords Group Plc (88,413) (0.08)
91,324 Imperial Tobacco Group Plc (84,340) (0.07)
(228,653) Inchcape Plc (148,962) (0.13)
612,705 International Consolidated Airlines Group SA (15,698) (0.01)
(23,079) Intertek Group Plc (48,231) (0.04)
(939,170) J Sainsbury Plc (90,166) (0.08)
(30,805) J D Wetherspoons Plc (17,016) (0.01)
(148,369) Jupiter Fund Management (20,388) (0.02)
(348,370) Just Eat Plc (72,398) (0.06)
(945,290) Lookers Plc (102,154) (0.09)
(283,327) Meggitt Plc (29,527) (0.03)
(20,776) Metro Bank Plc (39,596) (0.03)
135,083 Micro Focus International Plc (8,290) (0.01)
(91,693) Mondi Plc (104,091) (0.09)
379,014 Mothercare Plc (57,557) (0.05)
(282,987) Petrofac Limited (72,895) (0.06)
182,130 Polar Capital Holdings Plc (6,071) (0.01)
(229,731) Prudential Plc (205,517) (0.17)
(75,455) Reckitt Benckiser Group Plc (18,050) (0.02)
(21,996) Schroders Plc (26,142) (0.02)
(829,911) Serco Group Plc (106,619) (0.09)
48,147 Smiths Group Plc (22,567) (0.02)
(269,492) SSE Plc (183,068) (0.16)
(278,264) SSP Group Plc (171,614) (0.15)
(310,136) Stagecoach Group Plc (11,918) (0.01)
(1,213,092) Standard Life Plc (225,989) (0.20)
(286,132) Telit Communications Plc (28,861) (0.03)
(263,822) Travis Perkins Plc (161,111) (0.14)
198,776 Tullet Prebon ICAP Plc (947) (0.00)
(29,753) UBM Plc (7,544) (0.01)
248,676 Unite Group Plc (28,768) (0.03)
23,444 United Utilities Group Plc (1,077) (0.00)
95,672 Virgin Money Holdings UK Plc (11,272) (0.01)
(3,426,343) (2.99)
Total contracts for differences Total contracts for differences Total contracts for differences Total contracts for differences (4,426,894) (3.88)
Future contractFuture contractFuture contractFuture contract
United KingdomUnited KingdomUnited KingdomUnited Kingdom
(137) FTSE 100 Index Futures March 2017 (109,880) (0.10)
Total future contractTotal future contractTotal future contractTotal future contract (109,880) (0.10)
188
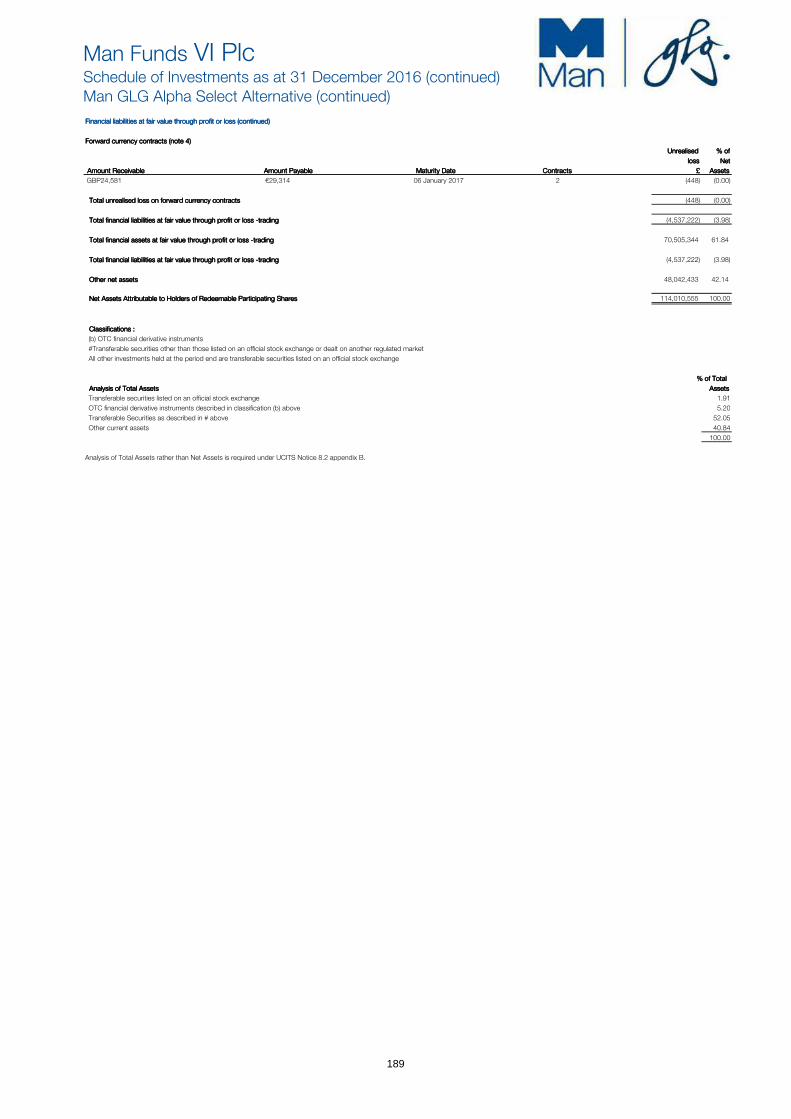
Man Funds VI PlcSchedule of Investments as at 31 December 2016 (continued)Man GLG Alpha Select Alternative (continued)
Financial liabilities at fair value through profit or loss (continued)Financial liabilities at fair value through profit or loss (continued)Financial liabilities at fair value through profit or loss (continued)Financial liabilities at fair value through profit or loss (continued)
Forward currency contracts (note 4)Forward currency contracts (note 4)Forward currency contracts (note 4)Forward currency contracts (note 4)
Unrealised Unrealised Unrealised Unrealised % of% of% of% of
loss loss loss loss Net Net Net Net
Amount ReceivableAmount ReceivableAmount ReceivableAmount Receivable Amount PayableAmount PayableAmount PayableAmount Payable Maturity DateMaturity DateMaturity DateMaturity Date ContractsContractsContractsContracts £ £ £ £ AssetsAssetsAssetsAssets
GBP24,581 €29,314 06 January 2017 2 (448) (0.00)
Total unrealised loss on forward currency contracts Total unrealised loss on forward currency contracts Total unrealised loss on forward currency contracts Total unrealised loss on forward currency contracts (448) (0.00)
Total financial liabilities at fair value through profit or loss -trading Total financial liabilities at fair value through profit or loss -trading Total financial liabilities at fair value through profit or loss -trading Total financial liabilities at fair value through profit or loss -trading (4,537,222) (3.98)
Total financial assets at fair value through profit or loss -trading Total financial assets at fair value through profit or loss -trading Total financial assets at fair value through profit or loss -trading Total financial assets at fair value through profit or loss -trading 70,505,344 61.84
Total financial liabilities at fair value through profit or loss -trading Total financial liabilities at fair value through profit or loss -trading Total financial liabilities at fair value through profit or loss -trading Total financial liabilities at fair value through profit or loss -trading (4,537,222) (3.98)
Other net assets Other net assets Other net assets Other net assets 48,042,433 42.14
Net Assets Attributable to Holders of Redeemable Participating Shares Net Assets Attributable to Holders of Redeemable Participating Shares Net Assets Attributable to Holders of Redeemable Participating Shares Net Assets Attributable to Holders of Redeemable Participating Shares 114,010,555 100.00
Classifications : Classifications : Classifications : Classifications :
(b) OTC financial derivative instruments
#Transferable securities other than those listed on an official stock exchange or dealt on another regulated market
All other investments held at the period end are transferable securities listed on an official stock exchange
% of Total % of Total % of Total % of Total
Analysis of Total Assets Analysis of Total Assets Analysis of Total Assets Analysis of Total Assets AssetsAssetsAssetsAssets
Transferable securities listed on an official stock exchange 1.91
OTC financial derivative instruments described in classification (b) above 5.20
Transferable Securities as described in # above 52.05
Other current assets 40.84
100.00
Analysis of Total Assets rather than Net Assets is required under UCITS Notice 8.2 appendix B.
189

Man Funds VI PlcSchedule of Investments as at 31 December 2016 (continued)Man GLG European Equity AlternativeFinancial assets at fair value through profit or loss
Fair % of Fair % of Value Net Value Net
Nominal Description € Assets Nominal Description € AssetsContracts for difference (b) Contracts for difference (b) (continued)Australia Finland (continued)
304,831 Alumina Limited 118,006 0.02 (14,559) Konecranes OYJ 23,205 0.00 454,419 Evolution Mining Limited 38,462 0.01 (43,529) Metso OYJ 23,632 0.00 449,457 Iluka Resources Limited 343,622 0.05 (21,336) Neste OYJ 10,188 0.00 723,279 S2 Resources Limited 55,835 0.01 112,182 Nokia OYJ 29,643 0.00 883,471 South32 Limited 90,977 0.01 25,600 Nokian Renkaat OYJ 43,401 0.01 4,405,444 South32 Limited 15,624 0.00 10,649 Orion OYJ 23,876 0.00 373,493 Western Areas Limited 191,408 0.03 (6,205) Outetec OYJ 261 0.00 (35,819) Woodside Petroleum Limited 11,094 0.00 7,983 Outokumpu OYJ 25,388 0.00
865,028 0.13 127,694 Stora Enso OYJ 41,697 0.02 97,836 UPM-Kymmene OYJ 207,868 0.04
Austria 65,885 Valmet Corporation 53,367 0.01 6,650 OMV AG 11,869 0.00 1,587 Wartsila OYJ 2,198 0.00 (17,409) Voestalpine AG 1,761 0.00 (1,824) YIT-Yhtyma OYJ 187 0.00 19,916 Zumtobel AG 37,200 0.01 538,912 0.08
50,830 0.01 France
Belgium (167,285) Air France-KLM 5,870 0.00 70,508 Anheuser-Busch InBev SA 247,785 0.04 88,178 Air Liquide SA 730,142 0.11 (185,789) bpost SA 280,595 0.04 13,513 Airbus Group SE 1,034 0.00 25,807 Euronav SA 5,044 0.00 23,189 Alten SA 259,670 0.04 4,625 Melexis NV 537 0.00 171,521 Altran Technologies SA 171,270 0.03 61,061 Nyrstar NV NPV 83,264 0.01 9,692 Amundi SA 49,911 0.01
617,225 0.09 39,815 Arkema SA 595,723 0.09 20,023 Atos SE 59,528 0.01
Bermuda (22,604) BNP Paribas SA 2,543 0.00 5 FTSE 250 Index 2,137 0.00 239,647 Carrefour SA 29,197 0.00 2,775 Seadrill Limited 3,506 0.00 6,978 Casino Guichard Perrachon 339 0.00
5,643 0.00 16,511 Cie de Saint-Gobain 22,745 0.00 135 Dassault Aviation SA 5,989 0.00
Brazil (20,806) Edenred 27,071 0.00 21,975 Totvs S.A. 10,987 0.00 218,534 Elior Group 488,636 0.07
40,583 Engie SA 7,165 0.00 Canada (1,024) Euro Stoxx Food & Beverage Index 56,091 0.01
(34,300) ishares S&P/TSX 60 Index ETF 2,284 0.00 (287) Eurofins Scientific 7 0.00 (2,854) Ritchie Bros Auctioneers Inc 4,648 0.00 12,951 Europe STOXX Bank EUR Price Index 40,994 0.01 (77,680) Teck Resources Limited 262,339 0.04 3,966 Kering 12,302 0.00
269,271 0.04 (103,579) Klepierre 156,357 0.02 27,552 Legrand SA 46,663 0.01
Chile 67,699 Maisons Du Monde S.A. 2,179 0.00 226,714 Parque Arauco S.A. 1,497 0.00 (9,984) Nexans SA 5,473 0.00
67,694 Numericable SFR SA 140,531 0.02 China 48,265 Orange SA 44,602 0.01
(18,837) Baidu Inc 108,287 0.02 (136,346) Peugeot SA 20,956 0.00 (825,539) Bank of Communications Company Limited 16,145 0.00 53,118 Plastic Omnium 36,270 0.01 (349,349) China Maple Leaf Educational 76,896 0.01 163,661 Renault SA 1,143,260 0.17 (779,492) China Railway Construction Corporation Limited 64,448 0.01 6,442 Sanofi 12,675 0.00 (1,487,285) China Shenhua Energy Company Limited 291,741 0.05 116,455 Schneider Electric SA 256,245 0.04 (857,352) China Telecom Corporation Limited-Class H Shares 50,324 0.01 (3,761) SEB SA 2,681 0.00 (521,000) CRRC Corporation Limited 906 0.00 8,750 STOXX Europe 600 Basic Resources Price Index 82,919 0.01 (361,882) Great Wall Motor Company 30,977 0.00 561 Stoxx Europe 600 Food & Beverage Price Euro Index 10,695 0.00 (93,473) JD.com Inc 21,847 0.00 14,313 Technip SA 61,871 0.01 27,481 Livzon Pharmaceutical Group 2,604 0.00 179,662 Teleperformance 1,103,956 0.16 808,617 Sany Heavy Industry Company Limited 23,386 0.00 6,704 Thales SA 1,239 0.00 (4,692,611) Shanghai Electric Group Company 107,558 0.02 14,894 Total SA 52,406 0.01 (1,076,374) Uni-President China Holdings 3,949 0.00 (1,222) Valeo SA 397 0.00 (37,969) Vipshop Holdings Limited 125,514 0.02 43,357 Vallourec SA 90,412 0.01 256,122 Xinhua Winshare Publishing 2,769 0.00 40,031 Zodiac Aerospace 13,108 0.00 (418,000) Yanzhou Coal Mining 28,019 0.00 5,851,122 0.86
955,370 0.14 Germany
Cyprus 47,885 BASF SE 95,101 0.01 720,445 Bank Of Cyprus Public Company Limited 10,807 0.00 43,965 Bayer AG 221,424 0.04
(49,647) Bayerische Motoren Werke AG 17,858 0.00 Denmark 80,025 Brenntag AG 322,561 0.06
40,689 DSV A/S 13,503 0.00 288,199 Celesio AG 23,056 0.00 63,894 FLSmidth & Company A/S 37,354 0.01 (3,421) Covestro AG 35 0.00 (2,943) Genmab A/S 4,547 0.00 19,098 Deutsche Boerse AG 82,831 0.01 5,945 H Lundbeck A/S 5,774 0.00 (279,368) Deutsche Lufthansa AG 51,170 0.01 (14,976) ISS A/S 2,430 0.00 350 Drillisch AG 49 0.00 (4,184) NETS A/S 1,344 0.00 147,776 Evonik Industries AG 35,673 0.01 35,968 NKT Holding A/S 244,367 0.04 (38,083) Fielmann AG 148,041 0.02 13,706 Novozymes A/S 15,554 0.00 4,767 GEA Group AG 20,069 0.00 85,424 Pandora A/S 792,178 0.12 39,340 Kabel Deutschland Holding AG 261,730 0.04 46,628 Vestas Wind Systems A/S 358,643 0.05 4,868 Kion Group AG 2,775 0.00 (2,632) William Demant Holding 172 0.00 19,585 Kuka AG 199,522 0.03
1,475,866 0.22 26,342 Man AG 31,041 0.00 (466) MTU Aero Engines AG 31 0.00
European Union (24,109) Norma Group SE 115,735 0.02 18,939 EU Momentum Long 33,241 0.00 84,973 Schaeffler AG 58,098 0.01 16,067 MSGLGEU4 66,542 0.01 6,527 Symrise AG 2,671 0.00 8,855 STOXX Europe 600 Travel & Leisure 52,777 0.01 (20,242) ThyssenKrupp AG 20,117 0.00
152,560 0.02 20,004 United Internet AG 19,269 0.00 (14,076) Wirecard AG 2,977 0.00
Finland 1,731,834 0.26 2,136 Cargotec OYJ 4,843 0.00 35,276 Fortum OYJ 27,624 0.00 Hong Kong 3,815 Huhtamaki OYJ 303 0.00 (557,000) Cathay Pacific Airways Limited 46,317 0.01 11,823 Kone OYJ 21,231 0.00 130,000 Good Resources Holdings Limited 730 0.00
190

Man Funds VI PlcSchedule of Investments as at 31 December 2016 (continued)Man GLG European Equity Alternative (continued)Financial assets at fair value through profit or loss (continued)
Fair % of Fair % of Value Net Value Net
Nominal Description € Assets Nominal Description € AssetsContracts for difference (b) (continued) Contracts for difference (b) (continued)Hong Kong (continued) Netherlands (continued)
(510,000) HK Electric Investments 22,561 0.00 57,402 Fugro NV 1,335 0.00 (242,000) Hong Kong and China Gas Company Limited 15,971 0.00 52,568 Imcd Group NV 247,915 0.04 21,522 Jardine Strategic Hldgs Limited 6,357 0.00 (414,128) ING Groep NV 93,179 0.01 (20,658) Lee & Man Paper Manufacturing 1,360 0.00 398,628 Koninklijke Ahold Delhaize NV 341,715 0.06
93,296 0.01 199,946 Koninklijke Philips NV 253,354 0.04 9,185 Philips Lighting NV 5,904 0.00
India 37,875 Royal Dutch Shell Plc 78,517 0.01 109,809 Berger Paints India Limited 13,615 0.00 421,562 Royal Dutch Shell Plc 837,617 0.12
67,077 SBM Offshore NV 96,604 0.01 Ireland (2,494,984) SNS Reaal AG - 0.00
224,479 C&C Group Plc 28,884 0.00 11,797 Tomtom NV 510 0.00 8,891 CRH Plc 11,577 0.00 2,442,166 0.36 32,417 CRH Plc 35,203 0.01 43,542 DCC Plc 83,720 0.02 Northern Mariana Islands (173,297) Henderson Group Plc 10,032 0.00 78,491 Rockcastle Global Real Estat 2,526 0.00 15,009 Kingspan Group Plc 10,939 0.00 7,017 Paddy Power Plc 9,754 0.00 Norway 43,694 Ryanair Holdings Plc 26,505 0.00 8,640 Aker BP ASA 4,047 0.00 2,787 Shire Plc 60,479 0.02 95,992 Avance Gas Holding Limited 12,622 0.00 10,520 Smurfit Kappa Group Plc 16,103 0.00 345,718 BW LPG Limited 53,632 0.01 40,761 Smurfit Kappa Group Plc 31,907 0.00 52,528 Golden Ocean Group Limited 13,433 0.00
325,103 0.05 101,910 Norsk Hydro ASA 31,675 0.00 (6,749) Norwegian Air Shuttle ASA 2,546 0.00
Isle of Man 52,294 Orkla ASA 5,802 0.00 (185,414) Paysafe Group Plc 44,650 0.01 19,022 Skandiabanken ASA 20,907 0.00
61,852 Statoil ASA 97,602 0.02 Italy 18 Telenor ASA 6 0.00
(30,142) Azimut Holding SpA 60 0.00 26,734 Yara International ASA 86,758 0.02 (3,474) Buzzi Unicem SpA 592 0.00 329,030 0.05 (3,046) Luxottica Group SpA 245 0.00 (29,412) Moncler SpA 2,555 0.00 Pakistan (471) Salvatore Ferragamo SpA 13 0.00 83,838 Fauji Fertilizer Company Limited 71 0.00
3,465 0.00 97,931 Habib Bank Limited 4,133 0.00 28,959 Lucky Cement 7,022 0.00
Japan 109,164 Oil & Gas Development Company 707 0.00 (7,900) AI Holdings Corporation 1,621 0.00 84,893 United Bank Limited 2,979 0.00 (55,700) Aiful Corporation 1,749 0.00 14,912 0.00 (9,100) Alfresa Holdings Corporation 5,388 0.00 800 Daito Pharmaceutical Company Limited 195 0.00 Philippines (4,500) Ichibanya Company Limited 675 0.00 5,134,972 Metro Pacific Investments Company 32,083 0.00 (892,404) IHI Corporation 70,416 0.01 12,700 Istyle Inc 7,011 0.00 Portugal (12,021) Japan Steel Works Limited 25,696 0.00 (2,098,432) Banco Comercial Portugese 373,373 0.06 (120,929) Kubota Corporation 40,795 0.01 9 EDP Energias De Portugal SA 1 0.00 2,500 Mimasu Semiconductor Industry 1,119 0.00 70,009 Galp Energia SGPS SA 80,262 0.01 (64,957) MISUMI Group Inc 72,565 0.01 453,636 0.07 1,400 Nihon M&A Center Inc 2,389 0.00 (130,787) Nippon Paint Holdings Company Limited 312,229 0.06 Qatar 3,954 Nippon View Hotel Company Limited 792 0.00 3,800 Barwa Real Estate Company 281 0.00 (10,100) Nipro Corporation 1,275 0.00 6,409 Commercial Bank of Qatar QSC 2,106 0.00 (2,800) Olympus Corporation 574 0.00 4,987 Doha Bank QSC 237 0.00 (23,100) Rakuten Inc 10,452 0.00 5,966 Industries Qatar QSC 1,136 0.00 (15,200) Resorttrust Inc 3,648 0.00 13,787 Masraf Al Rayan 336 0.00 700 Ryohin Keikaku Company Limited 378 0.00 1,115 Qatar Electricity & Water Company 1,286 0.00 (3,306) SMC Corporation 92,491 0.02 10,801 Qatar Gas Transport Company Nakilat New 17 0.00 338,077 Sumitomo Chemical Company Limited 88,287 0.01 4,696 Qatar Insurance Company 830 0.00 (19,300) Sumitomo Corporation 5,248 0.00 1,504 Qatar International Islamic 138 0.00 (1,300) Tamron Company Limited 558 0.00 2,327 Qatar Islamic Bank 1,030 0.00 (23,535) Toyo Seikan Group Holdings Limited 319 0.00 8,150 Qatar National Bank 1,153 0.00 (2,600) Tsuruha Holdings Inc 8,723 0.00 2,175 Qatar Navigation 849 0.00 (12,700) Yamazaki Baking Company Limited 9,556 0.00 4,247 Qatar Telecom 362 0.00 (26,177) Zenkoku Hosho Company Limited 28,128 0.00 7,005 United Development Company 1,131 0.00
792,277 0.12 13,146 Vodafone Qatar 131 0.00 11,023 0.00
Jersey Channel Islands 5,127 Randgold Resources Limited 31,610 0.00 Singapore 35,873 Sanne Group Plc 69,920 0.01 4,112 Broadcom Limited 94,364 0.01
101,530 0.01 South Africa
Luxembourg (64,510) Grindrod Limited 1,193 0.00 21,087 Aperam SA 71,583 0.01 (111,554) ArcelorMittal 103,128 0.02 South Korea
174,711 0.03 1,338 Samsung Electronics Company Limited 113,742 0.02
Malta Spain (79,407) GVC Holdings Plc 14,955 0.00 (383,705) Abengoa S.A. 767 0.00
9 Bankia SA - 0.00 Mexico (355,089) Distribuidora Internacional De Alimentacion SA 481,437 0.08
(14,482) Cemex SAB SPONS 13,628 0.00 24,652 Endesa SA 13,160 0.00 13,002 Grupo Financiero Interacciones 1,195 0.00 224,452 Ferrovial SA 79,989 0.01
14,823 0.00 (21,367) Gamesa Corporation Tecnologica SA 8,900 0.00 16,587 Grifols SA 36,182 0.01
Monaco 62,310 Iberdrola SA 30,690 0.00 (24,488) Scorpio Tankers Inc 6,298 0.00 (25,553) Mapfre SA 1,059 0.00
27,590 Merlin Properties SOCIMI SA 3,568 0.00 Netherlands 200,443 Obrascon Huarte Lain SA 32,071 0.00
148,436 Aalberts Industries NV 107,990 0.02 70,618 Repsol SA 39,478 0.01 63,585 Altice SA 365,710 0.05 46,680 Talgo SA 5,375 0.00 10,039 ASM International NV 11,816 0.00 732,676 0.11
191

Man Funds VI PlcSchedule of Investments as at 31 December 2016 (continued)Man GLG European Equity Alternative (continued)Financial assets at fair value through profit or loss (continued)
Fair % of Fair % of Value Net Value Net
Nominal Description € Assets Nominal Description € AssetsContracts for difference (b) (continued) Contracts for difference (b) (continued)Sweden United Kingdom (continued)
65,654 Alfa Laval AB 100,258 0.01 235,463 Esure Group Plc 8,798 0.00 29,031 Assa Abloy AB 19,671 0.00 51,293 FDM Group Holdings Plc 18,635 0.00 (35,443) Atlas Copco AB 3,674 0.00 17,152 Fevertree Drinks Plc 87,433 0.01 3,621 Autoliv Inc 56,379 0.01 (23,978) Fiat Chrysler Automobiles NV 563 0.00 3,209 Autoliv Inc 21,652 0.00 17 FTSE 100 Index 6,522 0.00 20,143 Boliden AB 57,545 0.01 (260,214) G4S Plc 825 0.00 230,846 Bravida Holding AB 57,320 0.01 1,865,864 GKN Plc 2,048,060 0.30 531,943 Dometic Group 150,732 0.02 4,934 GlaxoSmithKline Plc 152 0.00 (320,309) Getinge AB 385,650 0.06 (199,382) Greene King Plc 47,586 0.01 (33,102) Hennes and Mauritz AB 10,887 0.00 (246,944) Halma Plc 127,777 0.02 159,158 Hexagon AB 116,699 0.02 298,032 Hays Plc 31,199 0.00 4,496 Holmen AB-Class B Shares 9,722 0.00 17,447 IMI Plc 4,628 0.00 (121,083) ICA Gruppen AB 115,497 0.02 121,753 Imperial Tobacco Group Plc 30,711 0.00 53,512 Nobia Ab 20,384 0.00 1,669,580 Informa Plc 501,135 0.07 14,387 Nordic Waterprofing Holding 6,621 0.00 228,673 Intercontinental Hotels 963,100 0.14 6,181 Skanska AB 4,579 0.00 585,517 International Consolidated Airlines Group SA 16,257 0.00 (118,548) SKF AB 74,553 0.01 529,556 ITV Plc 123,572 0.02 173,565 Svenska Cellulosa AB SCA 165,200 0.02 (173,210) Johnson Matthey Plc 177,733 0.03 (120,866) Swedish Match AB 113,467 0.02 153,420 Kaz Minerals Plc 305,697 0.05 24,885 Swedish Orphan Biovitrum AB 17,971 0.00 (1,783,273) Kingfisher Plc 109,482 0.02 188,538 Telefonaktiebolaget LM Ericsson 108,301 0.02 7,503 Land Securities Group Plc 3,924 0.00 61,688 Teliasonera AB 10,906 0.00 125,365 lbstock Plc 15,596 0.00 92,887 Thule Group AB 63,512 0.01 2,969,087 Legal and General Group Plc 264,082 0.04 (42,662) Trelleborg AB 16,256 0.00 10,946,501 Lloyds Banking Group Plc 115,063 0.02 1,224,126 Volvo AB 723,569 0.12 229,603 London Stock Exchange Group Plc 502,962 0.07
2,431,005 0.36 952,173 Marks & Spencer Group Plc 186,027 0.03 (404,077) Marstons Plc 47,710 0.01
Switzerland 1,311,508 Melrose Industries Plc 279,261 0.04 23,481 ABB Limited 5,759 0.00 (666,938) Merlin Entertainments Plc 22,454 0.00 15,807 Actelion Limited 46,037 0.01 (32,113) Michael Kors Holdings Limited 137,364 0.02 15,905 Adecco SA 66,144 0.01 302,168 Microfocus International Plc 429,045 0.06 11,759 Aryzta AG 47,334 0.01 1 NEX Group Plc - 0.00 765,954 Clariant AG 724,846 0.12 85,217 Next Plc 256 0.00 38,547 Coca-Cola HBC AG 2,989 0.00 (63,724) Noble Corporation Plc 14,831 0.00 382 Dormakaba Holding 9,580 0.00 (52,086) Reckitt Benckiser Group Plc 75,976 0.01 391 Galenica AG 26,475 0.00 861,594 RELX Plc 500,643 0.08 (36,131) Garmin Limited 28,554 0.00 1,417,853 Rentokil Initial Plc 71,979 0.01 293 Givaudan 22,338 0.00 559,514 Rio Tinto Plc 758,385 0.12 (306,243) Glencore International Plc 82,984 0.02 (281,365) Rolls-Royce Holdings Plc 143,613 0.02 3,949 Kuehne + Nagel International AG 9,579 0.00 (132,307) Rotork Plc 6,107 0.00 21,422 Logitech International SA 17,821 0.00 (21,815) Royal Bank of Scotland Group Plc 316 0.00 7,650 Nestle SA 32,161 0.00 (114,885) Royal Mail Plc 19,607 0.00 14,252 Novartis AG 70,977 0.01 1,032,046 RPC Group Plc 1,838,541 0.28 (922) Partners Group Holding AG 16,091 0.00 240,821 RSA Insurance Group Plc 128,883 0.02 2,368 Roche Holding AG 27,174 0.00 (30,803) Sage Group Plc 2,027 0.00 2,915 Schindler Holding 492 0.00 538,071 Serco Group Plc 22,939 0.00 1,378 Swatch Group AG 22,439 0.00 53,345 Smith & Nephew Plc 32,761 0.00 5,448 Swiss Re AG 5,087 0.00 (29,407) Spirax-Sarco Engineering Plc 11,100 0.00 (108,008) Transocean Limited 37,277 0.01 563,304 St James'S Place Plc 356,112 0.06 48,488 Wolseley Plc 95,055 0.02 40,754 Subsea 7 SA 8,159 0.00 479 Zurich Insurance Group AG 179 0.00 7,235 Ted Baker Plc 9,489 0.00
1,397,372 0.21 1,253,282 Tesco Plc 20,064 0.00 (679) Tullett Prebon Plc 5 0.00
Taiwan 217,987 UBM Plc 90,541 0.01 34,958 Nan Ya Printed Circuit Board Corporation Swap 295 0.00 9,761 Unilever NV 19,814 0.00 (19,850) Taiwan Semiconductor SP 21,334 0.00 68,655 Unite Group Plc 4,710 0.00
21,629 0.00 184,309 Vesuvius Plc 7,720 0.00 184,057 Weir Group Plc 323,175 0.06
United Kingdom (143,640) William Hill Plc 316 0.00 34,022 Anglo American Plc 19,826 0.00 476,014 WPP Plc 674,961 0.11 63,937 Antofagasta Plc 61,771 0.01 14,594,324 2.15 593,112 Ascential Plc 96,329 0.01 200,980 Associated British Foods Plc 413,795 0.06 United States 10,077 AstraZeneca Plc 36,476 0.01 (60,042) Abbott Laboratories 60,819 0.01 2,080,329 Aviva Plc 666,566 0.10 (2,569) Acuity Brands Inc 44,163 0.01 (112,326) Babcock International Group Plc 17,302 0.00 (5,117) Advanced Micro Devices 3,260 0.00 (130,340) BAE Systems Plc 7,027 0.00 (31,867) Alcoa Upstream Corporation 65,882 0.01 682,246 Barclays Plc 36,380 0.01 (71,005) Bank of America Corporation 8,590 0.00 (87,230) Barratt Developments Plc 6,421 0.00 (17,088) Bed Bath & Beyond Inc 63,592 0.01 (14,215) Berkeley Group Holdings Plc 10,407 0.00 (220,149) Best Buy Company Inc 735,494 0.11 849,129 BHP Billiton Plc 559,813 0.08 (21,967) Big 5 Sporting Goods Corporation 30,695 0.00 1,476,500 Booker Group Plc 20,685 0.00 207 Boeing Company 819 0.00 171,612 BP Plc 41,338 0.01 (16,861) CarMax Inc 25,502 0.00 57,834 British American Tobacco Plc 43,916 0.01 11,792 Carnival Plc 32,795 0.00 13,068 British Land Company Plc 5,353 0.00 (97,814) Caterpillar Inc 31,498 0.00 321,298 Cineworld Group Plc 93,073 0.01 (59,647) Cliffs Natural Resources Inc 81,659 0.01 (25,466) Cobham Plc 1,491 0.00 54,218 Columbia Pipeline Partners LP 350 0.00 (850,334) Convatec Group Plc 26,264 0.00 (23,544) Cree Inc 18,536 0.00 (19,477) Croda International Plc 4,045 0.00 (3,500) Darden Restaurants Inc 8,346 0.00 56,097 Diageo Plc 59,514 0.01 45,541 Dell Technologies Inc 550,938 0.08 1,363,029 Direct Line Insurance Group Plc 276,390 0.04 (39,921) Diamond Offshore Drilling 89,512 0.01 216,370 Dixons Carphone Plc 30,773 0.00 (11,578) Dollar General Corporation 42,637 0.01 276,109 Dominos Pizza Uk & Ireland Plc 34,199 0.01 (18,699) Dollar Tree Inc 32,267 0.00 3,328 DS Smith Plc 677 0.00 (12,361) DSW Inc 25,006 0.00 (20,496) easyJet Plc 43 0.00 14,131 Energy Transfer Equity LP 1,574 0.00 9,836 Electra Private Equity Plc 110,315 0.02 (3,400) Financial Select Sector SPDR 1,125 0.00 (19,387) Ensco Plc 7,225 0.00 (15,324) Five Below Inc 14,856 0.00 746,574 Equiniti Group Plc 150,527 0.02 146,477 FMC Technologies Inc 1,036,857 0.15
42,991 General Motors Company 43,796 0.01
192

Man Funds VI PlcSchedule of Investments as at 31 December 2016 (continued)Man GLG European Equity Alternative (continued)Financial assets at fair value through profit or loss (continued)
Fair % of Fair % of Value Net Value Net
Nominal Description € Assets Nominal Description € AssetsContracts for difference (b) (continued) Equities (continued)United States (continued) China
(2,025) Global X MSCI Pakistan ETF 359 0.00 34,969 Alibaba Group Holding Limited 2,911,239 0.43 (199,953) Groupon Inc 84,390 0.01 442,785 Angang Steel Company Limited 249,612 0.04 (380,347) Hanesbrands Inc 805,428 0.12 515,361 Anhui Conch Cement Company Limited 1,329,739 0.20 (24,721) Hasbro Inc 48,391 0.01 55,064 Baoxin Auto Group Limited 12,861 0.00 (32,324) Helmerich & Payne 48,474 0.01 3,228,488 BBMG Corporation 1,058,050 0.16 56,626 Hi-Crush Partners LP 205,724 0.03 54,165 China Communications Construction Company Limited 59,082 0.01 11,732 Humana Inc 312,554 0.05 1,150,994 China Longyuan Power Group Corporation Limited 852,939 0.13 (42,944) ishares FTSE China 25 Index 47,417 0.01 1,119,000 CRRC Corporation Limited 952,383 0.14 (1,100) iShares MSCI Mexico Capped ETF 301 0.00 23,499 Ctrip com International Limited 891,169 0.13 94,283 ishares Russell 2000 ETF 174,308 0.03 321,702 ikang Healthcare Group Inc 5,285,703 0.78 (4,955) Kraneshares CSI China Intern 1,112 0.00 328,878 Jiangxi Copper Company Limited 435,145 0.06 (3,751) Lowes Companies Inc 14,841 0.00 108,828 Jumei International Holding Limited 516,927 0.08 (5,596) VanEck Vectors Semiconductor ETF 4,287 0.00 692,500 Li Ning Company Limited 412,402 0.06 400,350 Media General Inc 471,194 0.08 978,315 Luye Pharma Group Limited 550,312 0.08 93,778 Nexteer Automotive Group Limited 1,523 0.00 969,487 Maanshan Iron & Steel Company Limited 267,931 0.04 (2,859) Nike Inc 4,707 0.00 22,771 Momo Inc 396,806 0.06 245,977 Northstar Asset ManAGement 297,102 0.05 9,195 NetEase Inc 1,877,271 0.28 (4,239) NVIDIA Corporation 14,268 0.00 137,894 Shenzhou International Group Holdings Limited 827,097 0.12 (14,866) Oracle Corporation 5,705 0.00 8,382 SINA Corporation 483,092 0.07 (27,208) Owens Corning 59,968 0.01 6,900 TAL Education Group 458,910 0.07 (2,130) PPG Industries Inc 14,506 0.00 124,752 Tencent Holdings Limited 2,893,924 0.43 (72,510) Quotient Technology Inc 84,570 0.01 1,748,874 Tianhe Chemicals Group Limited - 0.00 (6,824) Ralph Lauren Corporation 25,605 0.00 16,409 Weibo Corporation 631,624 0.09 66,194 Reynolds American Inc 112,215 0.03 337,397 Weichai Power Company Limited 492,627 0.07 (20,272) Rowan Companies Plc 11,926 0.00 12,754,528 West China Cement Limited 1,356,925 0.19 (67,611) RPC Inc 66,042 0.01 335,543 Zhuzhou CRRC Times Electric Company 1,614,601 0.23 11,305 Sanchez Production Partners 7,503 0.00 26,818,371 3.95 (15,048) Servicenow Inc 86,065 0.01 (2,919) Sherwin-Williams Company 7,231 0.00 Colombia (12,736) SPDR S&P 500 ETF Trust 18,627 0.00 1 Pacific Exploration and Production Corporation 42 0.00 (67,458) SPDR S&P Oil & Gas Exploration & Production ETF 48,518 0.01 (16,741) SPDR S&P Retail ETF 18,881 0.00 Finland (14,396) Splunk Inc 90,035 0.01 142,942 Outokumpu OYJ 1,215,722 0.18 68,996 St Jude Medical Inc 235,334 0.04 (23,804) Starbucks Corporation 2,896 0.00 France (34,562) Superior Energy Services Inc 9,920 0.00 24,098 Criteo SA 938,561 0.14 (19,539) Synchronoss Technologies Inc 73,693 0.01 2,031 LVMH Moet Hennessy Louis Vuitton SA 73,162 0.01 (53,606) Target Corporation 128,054 0.02 1,011,723 0.15 (37,255) Tesoro Corporation 83,610 0.01 (25,465) Tiffany & Co 48,749 0.01 Germany (87,622) TJX Companies Inc 211,167 0.04 44,476 BASF SE 3,927,676 0.58 (6,113) TripAdvisor Inc 6,294 0.00 4,814 BASF SE 422,501 0.06 (5,330) Ulta Salon Cosmetics & Fragrance Inc 4,848 0.00 70,133 Bayer AG 6,952,284 1.02 (12,913) Urban Outfitters Inc 84,250 0.01 343,317 Brenntag AG 18,127,138 2.67 (6,417) USG Corporation 2,067 0.00 21,116 Continental AG 3,879,009 0.57 (31,882) Vaneck Vectors Gold Miners E 141,831 0.03 67,735 CTS Eventim AG & Company KGaA 2,028,663 0.30 (13,568) VF Corporation 8,641 0.00 65,127 Daimler AG 4,605,781 0.68 (14,706) Wal-Mart Stores Inc 11,151 0.00 14,159 Deutsche Bank AG 244,243 0.04 (44,724) Whole Foods Market Inc 37,641 0.01 47,644 Deutsche Lufthansa AG 584,592 0.09 (10,883) Workday Inc 32,229 0.00 9,302 Deutsche Telekom AG 152,134 0.02
7,366,720 1.09 94,711 Drillisch AG 3,873,206 0.57 4,211 Duerr AG 321,510 0.05
Total contracts for difference 44,160,076 6.51 1,957,720 E.ON SE 13,116,724 1.93 370,884 Evonik Industries AG 10,525,688 1.55
Equities 86,895 GEA Group AG 3,321,996 0.49 Australia 75,000 Hannover Rueck SE 7,710,000 1.14
42,196 Independence Group NL 125,142 0.02 133 HeidelbergCement AG 11,788 0.00 18,759 Hochtief AG 2,495,885 0.37
Bermuda 7,047 Hugo Boss AG 409,642 0.06 31,226 DHT Holdings Inc 122,565 0.02 106,131 Infineon Technologies AG 1,752,223 0.26 31,428 Marvell Technology Group Limited 413,279 0.06 3,086 ishares Core DAX UCITS ETF 309,773 0.05 91,466 Nabors Industries Limited 1,422,178 0.21 69,463 K+S AG 1,576,115 0.23 6,013 Signet Jewelers Limited 537,365 0.08 4,435 KION Group AG 234,434 0.03
2,495,387 0.37 5,150 Krones AG 447,535 0.07 28,223 Leoni AG 955,207 0.14
Brazil 12,757 Linde AG 1,991,368 0.29 47,840 Vale SA 345,618 0.05 1,707 Linde AG 26,817 0.00
729 Merck KGaA 72,280 0.01 Canada 15,785 Metro AG 498,569 0.07
5,600 Aecon Group Inc 60,376 0.01 5,757 Nordex SE 117,385 0.02 5,200 Altagas Limited 124,626 0.02 22,338 Norma Group SE 905,806 0.13 41,414 Amaya Inc 556,589 0.08 544,812 SAP SE 45,115,882 6.65 95,660 Cameco Corporation 949,571 0.14 54,341 Scout24 AG 1,838,084 0.27 11,062 Centerra Gold Inc 49,191 0.01 4,385 Siemens AG 512,168 0.08 36,641 Concordia International Corporation 73,647 0.01 50,474 Symrise AG 2,918,911 0.43 96,387 Eldorado Gold Corporation 294,256 0.04 10,099 ThyssenKrupp AG 228,641 0.04 700 Equitable Group Inc 29,921 0.00 134,805 United Internet AG 5,000,591 0.74 11,567 Gran Tierra Energy Inc 33,119 0.00 147,212,249 21.70 49,073 HudBay Minerals Inc 266,446 0.04 3,800 Intertape Polymer Group Inc 67,646 0.01 Hong Kong 304,033 Lundin Mining Corporation 1,375,644 0.21 140,116 China Cord Blood Corporation 812,998 0.12 91,883 Nevsun Resources Limited 269,581 0.04 59,913 China Mobile Limited 602,234 0.09 4,500 North West Company Inc 87,552 0.01 5,555 China Mobile Limited 276,132 0.04 52,892 Potash Corporation of Saskatchewan Inc 907,150 0.14 2,526,469 China Resources Cement Holdings Limited 929,935 0.13 2,798 Silver Wheaton Corporation 51,251 0.01 580,286 CSPC Pharmaceutical Group Limited 587,550 0.09
5,196,566 0.77 1,248,577 Haier Electronics Group Company Limited 1,862,719 0.27 5,071,568 0.74
193

Man Funds VI PlcSchedule of Investments as at 31 December 2016 (continued)Man GLG European Equity Alternative (continued)Financial assets at fair value through profit or loss (continued)
Fair % of Fair % of Value Net Value Net
Nominal Description € Assets Nominal Description € AssetsEquities (continued) Equities (continued)India Japan (continued)
51,906 Videocon D2H Limited 408,949 0.06 299,116 Sumitomo Heavy Industries Limited 1,830,864 0.27 26,418 Sumitomo Mitsui Financial Group Inc 957,759 0.14
Israel 120,000 Sumitomo Warehouse Company Limited 602,825 0.09 44,553 Mobileye NV 1,610,202 0.24 10,177 Sysmex Corporation 560,054 0.08 13,519 Teva Pharmaceutical Industries Limited 464,626 0.07 28,400 Tamron Company Limited 448,090 0.07
2,074,828 0.31 70,503 Temp Holdings Company Limited 1,039,027 0.15 128,339 THK Company Limited 2,697,794 0.40
Italy 240,376 Tokyu Fudosan Holdings Corporation 1,348,223 0.20 171,373 Amplifon SpA 1,550,926 0.23 22,100 Towa Corporation 295,874 0.04 13,073 Buzzi Unicem SpA 294,273 0.04 51,582 Trusco Nakayama Corporation 1,026,434 0.14 3,451 Buzzi Unicem SpA 39,790 0.01 789,743 Ube Industries Limited 1,572,800 0.23 4,504 Ferrari NV 249,071 0.04 1,763 West Japan Railway Company 102,796 0.02 7,677 Ferrari NV 423,172 0.06 23,171 Zenkoku Hosho Company Limited 707,255 0.09 66,372 Intesa Sanpaolo SpA 161,018 0.02 80,752,317 11.90 45,165 Leonardo Finmeccanica SpA 602,501 0.09 46,999 Luxottica Group SpA 2,401,649 0.35 Jersey Channel Islands 429,072 Moncler SpA 7,092,560 1.05 16,991 Sanne Group Plc 116,445 0.02 284,803 Prada SpA 915,952 0.13 417,769 Prysmian SpA 10,193,564 1.51 Netherlands 1,023,702 Saipem SpA 547,681 0.08 250,000 Aalberts Industries NV 7,705,000 1.14 99,841 Salvatore Ferragamo SpA 2,239,434 0.33 2,127 ASML Holding NV 226,262 0.03 2,136,034 Telecom Italia SpA 1,787,860 0.26 414,128 ING Groep NV 5,536,891 0.82 70,679 Yoox Net-A-Porter Group SpA 1,904,092 0.28 325,000 Koninklijke Ahold Delhaize NV 6,509,750 0.96
30,403,543 4.48 333,860 Koninklijke DSM NV 19,016,666 2.80 34,973 Nxp Semiconductors NV 3,249,778 0.48
Japan 15,862 Qiagen NV 423,198 0.06 58,400 AEON Financial Service Company Limited 985,986 0.15 42,667,545 6.29 34,893 Aisin Seiki Company Limited 1,438,030 0.21 16,607 Asahi Intecc Company Limited 639,194 0.09 Singapore 14,100 Chudenko Corporation 295,821 0.04 13,521 Broadcom Limited 2,266,041 0.33 48,421 Coca-Cola West Company Limited 1,355,953 0.20 19,776 Daiwa House Industry Company Limited 513,768 0.08 Sweden 98,244 DIC Corporation 2,835,019 0.42 251,451 Dometic Group 1,756,906 0.26 202,464 DMG Mori Company Limited 2,333,703 0.34 24,136 Don Quijote Holdings Company Limited 848,541 0.13 Switzerland 9,786 East Japan Railway Company 803,430 0.12 5,596 Actelion Limited 288,887 0.04 30,100 Electric Power Development Company Limited 658,173 0.10 3,028 ST Microelectronics NV 32,702 0.00 5,076 Fast Retailing Company Limited 1,725,961 0.25 16,676 Syngenta AG 1,249,811 0.18 136,800 Financial Products Group Company Limited 1,122,015 0.17 218,719 Weatherford International Plc 1,034,755 0.15 23,277 Fuji Heavy Industries Limited 902,919 0.13 2,606,155 0.37 42,700 FULLCAST Holdings Company Limited 334,600 0.05 25,241 Hamamatsu Photonics KK 630,918 0.09 United Kingdom 51,572 Hitachi Construction Machinery Company Limited 1,061,030 0.16 150,843 BHP Billiton Plc 4,499,191 0.66 113,827 Honda Motor Company Limited 3,159,785 0.47 7,695 BP Plc 272,709 0.04 104,768 Isetan Mitsukoshi Holdings Limited 1,073,052 0.16 57,427 CNH Industrial NV 474,634 0.07 190,667 Isuzu Motors Limited 2,295,367 0.34 25,504 Delphi Automotive Plc 1,628,532 0.24 38,700 Japan Tobacco Inc 1,209,250 0.18 60,681 Fiat Chrysler Automobiles NV 525,801 0.09 201,393 JGC Corporation 3,477,126 0.51 65,061 Fiat Chrysler Automobiles NV 562,556 0.08 1,147 Kaneka Corporation 8,876 0.00 3,752 Next Plc 219,028 0.03 60,699 Kansai Paint Company Limited 1,062,300 0.16 8,182,451 1.21 3,100 Kawada Technologies Inc 199,576 0.03 116,700 KH Neochem Company Limited 1,166,803 0.17 United States 3,704 Koito Manufacturing Company Limited 186,373 0.03 10,821 Abeona Therapeutics Inc 49,758 0.01 54,388 Komatsu Limited 1,170,471 0.17 4,372 ABM Industries Inc 169,284 0.02 21,770 Kose Corporation 1,718,301 0.25 12,099 Adobe Systems Inc 1,180,936 0.17 35,785 K's Holdings Corporation 595,443 0.09 68,327 Advance Auto Parts Inc 10,955,641 1.61 46,629 Lixil Group Corporation 1,005,955 0.15 14,110 Akamai Technologies Inc 892,017 0.13 15,100 Maruwa Company Limited 475,017 0.07 40,145 Alere Inc 1,483,243 0.22 18,600 Megachips Corporation 391,139 0.06 5,134 Alphabet Inc 3,857,254 0.57 21,500 Meitec Corporation 782,083 0.12 9,237 Amazon.com Inc 6,567,006 0.97 115,199 Mitsubishi Chemical Holdings Corporation 709,806 0.10 26,837 AMC Networks Inc 1,331,736 0.20 281,439 Mitsubishi Electric Corporation 3,727,865 0.55 11,123 Anadarko Petroleum Corporation 735,347 0.11 524,157 Mitsubishi Heavy Industries Limited 2,269,259 0.33 12,145 Anthera Pharmaceuticals Inc 7,474 0.00 71,700 Mitsui & Company Limited 936,605 0.14 101,132 Aptevo Therapeutics Inc 233,953 0.03 17,093 Mitsui Chemicals Inc 72,946 0.01 10,484 Arch Coal Inc 775,801 0.11 39,174 Mitsui Fudosan Company Limited 861,364 0.13 6,230 Asbury Automotive Group Inc 364,438 0.05 519,500 Mizuho Financial Group Inc 885,957 0.13 21,651 Atwood Oceanics Inc 269,521 0.04 64,685 NGK Insulators Limited 1,192,001 0.18 548 Autozone Inc 410,339 0.06 24,810 NGK Spark Plug Company Limited 523,947 0.08 6,938 Baker Hughes Inc 427,364 0.06 28,680 Nippo Corporation 508,460 0.07 10,369 Basic Energy Services Inc 347,518 0.05 87,565 Nippon Concrete Industries Company Limited 242,009 0.04 24,650 Bill Barrett Corporation 163,360 0.02 24,627 Nippon Telegraph & Telephone Corporation 983,312 0.14 18,270 Boulevard Acquisition Corporation II 175,988 0.03 113,000 Nishimatsu Construction Company Limited 519,896 0.08 612 Burlington Stores Inc 49,175 0.01 9,918 Nissan Motor Company Limited 188,064 0.03 17,582 Cabot Oil & Gas Corporation 389,396 0.06 37,000 Nomura Real Estate Holdings Inc 597,915 0.09 39,687 Callon Petroleum Company 578,326 0.09 55,700 Oki Electric Industry Company Limited 743,447 0.11 11,011 Cedar Fair LP 670,212 0.10 11,629 Olympus Corporation 381,896 0.06 5,528 Charter Communications Inc 1,509,004 0.22 78,607 Omron Corporation 2,865,796 0.42 160,350 Chelsea Therapeutics International Limited # - 0.00 45,988 Pigeon Corporation 1,117,357 0.16 10,608 Cheniere Energy Inc 416,676 0.06 8,200 Pola Orbis Holdings Inc 643,225 0.09 12,390 Coach Inc 411,375 0.06 15,877 Ryohin Keikaku Company Limited 2,956,753 0.44 11,112 Coca-Cola Company 436,789 0.06 55,500 San-In Godo Bank Limited 439,865 0.06 5,017 Comcast Corporation 328,442 0.05 52,800 Sanwa Holdings Corporation 478,553 0.07 9,404 Commercial Metals Company 194,187 0.03 56,240 Sekisui House Limited 889,402 0.13 2,590 Community Bank System Inc 151,729 0.02 14,700 Shima Seiki Manufacturing Limited 472,591 0.07 3,052 Cooper Tire & Rubber Company 112,415 0.02 35,265 Shimadzu Corporation 533,759 0.08 6,115 Costco Wholesale Corporation 928,251 0.14 169,453 Showa Denko K.K. 2,305,825 0.34 6,384 Cypress Semiconductor Corporation 69,242 0.01 25,185 Sumco Corporation 309,130 0.05 7,931 Deckers Outdoor Corporation 416,495 0.06 66,500 Sumitomo Corporation 743,539 0.11 22,499 Dell Technologies Inc 1,172,572 0.17
194

Man Funds VI PlcSchedule of Investments as at 31 December 2016 (continued)Man GLG European Equity Alternative (continued)Financial assets at fair value through profit or loss (continued)
Fair % of Fair % of Value Net Value Net
Nominal Description € Assets Nominal Description € AssetsEquities (continued) Exchanged traded fundsUnited States (continued) United States
30,126 Devon Energy Corporation 1,304,437 0.19 21,198 Consumer Staples Select Sector SPDR Fund 1,039,250 0.15 76,974 Dick'S Sporting Goods Inc 3,875,155 0.57 23,722 Health Care Select Sector SPDR Fund 1,550,505 0.23 18,000 Dollar General Corporation 1,264,053 0.19 107,404 iPATH S&P 500 VIX Short-Term Futures ETN 2,597,654 0.38 5,177 Double Eagle Acquisition Corporation 51,488 0.01 42,842 iShares 20+ Year Treasury Bond ETF 4,838,841 0.71 7,836 Dow Chemical Company 425,102 0.06 39,567 iShares MSCI Mexico Capped ETF 1,649,453 0.24 6,578 Emerge Energy Services LP 76,772 0.01 11,202 iShares US Real Estate 817,143 0.12 4,307 Esterline Technologies Corporation 364,242 0.05 61,600 SPDR Euro Stoxx 50 ETF 1,954,146 0.29 11,202 Extraction Oil & Gas Inc 212,835 0.03 222,589 SPDR S&P Metals & Mining ETF 6,417,570 0.95 50,445 Facebook Inc 5,502,439 0.81 74,204 Vaneck Vectors Gold Miners ETF 1,471,768 0.22 122,379 Fairmount Santrol Holdings Inc 1,367,953 0.20 22,336,330 3.29 15,867 FireEye Inc 179,016 0.03 30,311 Fortune Brands Home & Security Inc 1,536,313 0.23 Total exchanged traded funds 22,336,330 3.29 211,847 Freeport-McMoRan Inc 2,649,217 0.39 57,172 General Motors Company 1,888,478 0.28 Futures Contracts (a) 12,572 Genesee & Wyoming Inc 827,326 0.12 France 3,378 Gilead Sciences Inc 229,342 0.03 39 CAC 40 10 Euro Index Futures January 2017 21,605 0.00 23,642 GNC Holdings Inc 247,459 0.04 289 Orange SSDF December 2018 578 0.00 32,016 Goodyear Tire & Rubber Company 937,031 0.14 134 Renault SA Dividend December 2017 43,490 0.01 26,866 Gulfport Energy Corporation 551,202 0.08 152 Total SA SSDF December 2018 28,040 0.00 101,610 Halliburton Company 5,210,794 0.77 93,713 0.01 3,440 Herc Holdings Inc 130,979 0.02 38,650 Home Depot Inc 4,913,195 0.72 Germany 4,848 Hubbell Inc 536,394 0.08 229 Adidas Dividend December 2017 20,650 0.00 14,533 Independence Company Contract Drilling Inc 92,317 0.01 50 BMW AG SSDF Futures December 2017 11,250 0.00 7,630 Insys Therapeutics Inc 66,552 0.01 3 DAX Index Futures March 2017 14,588 0.00 10,398 Intuit Inc 1,129,855 0.17 3 DAX Mini Index Futures March 2017 225 0.00 165,165 JC Penney Company Inc 1,301,276 0.19 50 Volkswagen Dividend Futures December 2017 2,500 0.00 6,388 Johnson Controls International plc 249,464 0.04 49,213 0.00 38,690 JRjr33 Inc 27,511 0.00 24,538 Kate Spade & Company 434,344 0.06 Italy 14,711 Key Energy Services Inc 443,666 0.07 288 Assicurazioni Generali SSDF December 2018 25,920 0.00 37,725 Kroger Company 1,234,311 0.18 578 ENI SpA SSDF December 2018 37,570 0.01 25,714 L Brands Inc 1,605,129 0.24 63,490 0.01 50,769 Lam Research Corporation 5,089,174 0.75 7,538 Lear Corporation 946,011 0.14 Netherlands 1,087 Lockheed Martin Corporation 257,582 0.04 134 ING Groep SSDF December 2017 2,680 0.00 74,266 Lowe's Companies Inc 5,007,630 0.74 5,137 Mammoth Energy Services Inc 74,029 0.01 Singapore 28,541 Manitowoc Foodservice Inc 523,060 0.08 18 Nikkei Dividend Index Futures December 2018 37,311 0.01 44,630 Marathon Petroleum Corporation 2,130,477 0.31 36 Martin Marietta Materials Inc 7,561 0.00 Sweden 14,066 Mastercard Inc 1,376,928 0.20 (250) OMXS 30 Index Futures January 2017 68,488 0.01 1,836 Matthews International Corporation 133,773 0.02 5,775 Maxim Integrated Products Inc 211,180 0.03 Switzerland 11,708 Merck & Company Inc 653,472 0.10 132 Zurich Financial AG SSDF December 2018 134,562 0.02 53,337 Nike Inc 2,570,391 0.38 8,386 Nucor Corporation 473,226 0.07 United Kingdom 15,075 Oceaneering International Inc 403,191 0.06 500 BP Plc SSDF December 2017 36,864 0.01 5,229 Oil States International Inc 193,345 0.03 4,359 Palo Alto Networks Inc 516,798 0.08 United States 6,329 Pandora Media Inc 78,246 0.01 (111) DJIA Mini e-CBOT Index Futures March 2017 71,562 0.01 2,324 Performance Food Group Company 52,881 0.01 (24) Nasdaq 100 E-Mini Index Futures March 2017 34,141 0.01 12,397 Philip Morris International Inc 1,075,327 0.16 (18) S&P500 EMini Index Futures March 2017 27,049 0.00 70,519 Plains All American Pipeline LP 2,158,861 0.32 132,752 0.02 8,517 Platform Specialty Products Corporation 79,215 0.01 6,211 PVH Corporation 531,387 0.08 Total futures Contracts 619,073 0.09 56,462 Qualcomm Inc 3,490,232 0.51 11,629 Range Resources Corporation 378,831 0.06 Options (b) 491,343 Rite Aid Corporation 3,838,508 0.57 Brazil 39,642 Ross Stores Inc 2,465,528 0.36 2,633 Call on 10 VALE US 20 January 2017 2,496 0.00 8,395 Salesforce.com Inc 544,889 0.08 49,608 Schlumberger Limited 3,948,416 0.58 China 4,299 Silicon Laboratories Inc 264,930 0.04 29 Call on 105 BABA US 20 January 2017 27 0.00 29,323 SM Energy Company 958,575 0.14 45,627 Smart Sand Inc 715,930 0.11 France 70,273 Southwestern Energy Company 720,885 0.11 135 Call on 66 SU FP 20 January 2017 15,525 0.00 209,420 Sprouts Farmers Market Inc 3,756,555 0.55 695 Call on 88 RNO FP 20 January 2017 75,060 0.01 6,989 Steel Dynamics Inc 235,761 0.03 90,585 0.01 70,907 Stillwater Mining Company 1,083,017 0.16 58,526 Team Health Holdings Inc 2,410,955 0.36 Germany 1,662 Tesla Motors Inc 336,718 0.05 1,082 Call on 120 SX7E Index 20 January 2017 116,315 0.02 56,943 Tractor Supply Company 4,092,770 0.60 833 Call on 127.50 SX7E Index 20 January 2017 18,743 0.00 15,003 Twilio Inc 410,369 0.06 5,576 Call on 140 SX7E Index 16 June 2017 473,960 0.07 32,328 Under Armour Inc 890,380 0.13 333 Call on 290 SXKP Index 20 January 2017 84,915 0.01 9,147 United States Steel Corporation 286,269 0.04 2,254 Call on 3,400 SX5E Index 17 March 2017 1,111,222 0.16 36,727 US Silica Holdings Inc 1,973,630 0.29 560 Call on 66 DAI GR 20 January 2017 281,680 0.04 3,070 Valspar Corporation 301,572 0.04 563 Call on 72 DAI GR 20 January 2017 58,552 0.01 2,046 Versum Materials Inc 54,450 0.01 304 Put on 2,900 SX5E Index 17 March 2017 72,352 0.01 94,111 Visa Inc 6,961,403 1.03 29 Put on 3,075 SX5E Index 20 January 2017 1,798 0.00 5,842 Vulcan Materials Company 693,175 0.10 2,219,537 0.32 29,802 Wal-Mart Stores Inc 1,952,988 0.30 15,626 Whiting Petroleum Corporation 178,075 0.03 Netherlands 7,739 Williams Company Inc 228,483 0.03 1,158 Put on 0.90 SR NA 15 February 2017 103,062 0.02
146,814,950 21.64 Switzerland
Total equities 507,542,518 74.80 187 Call on 400 SYNN VX 16 June 2017 57,112 0.01 543 Put on 2.70 GLEN LN 20 January 2017 39,957 0.01
195

Man Funds VI PlcSchedule of Investments as at 31 December 2016 (continued)Man GLG European Equity Alternative (continued)Financial assets at fair value through profit or loss (continued)
Fair % of Fair % of Value Net Value Net
Nominal Description € Assets Nominal Description € AssetsOptions (b) (continued) Warrants (b) (continued)Switzerland (continued) United States (continued)
417 Put on 2.80 GLEN LN 20 January 2017 51,551 0.01 213,453 Kinder Morgan Inc 1,113 0.00 806 Put on 3 GLEN LN 20 January 2017 234,867 0.03 205 Scynexis Inc - 0.00
383,487 0.06 1,113 0.00
United Kingdom Total warrants 28,429 0.00 673 Call on 250 TLW LN 17 March 2017 547,956 0.09 39 Call on 32 RIO LN 20 January 2017 30,383 0.00 76 Call on 34 RIO LN 20 January 2017 12,910 0.00 1,437 Call on 40 LBTYA US 20 January 2017 20,436 0.00 40 Call on 40 LILA US 20 January 2017 758 0.00 29 Call on 50 NXT LN 20 January 2017 59,964 0.01 4 Call on 52 NXT LN 20 January 2017 4,592 0.00
676,999 0.10
United States 287 Call on 17 FCX US 20 January 2017 272 0.00 629 Call on 17 VIX Index 18 January 2017 51,286 0.02 278 Call on 2,305 SPX Index 20 January 2017 67,210 0.01 359 Call on 25 GNC US 20 January 2017 1,702 0.00 350 Call on 29 VXX US 20 January 2017 23,892 0.00 256 Call on 30 WFM US 19 January 2017 98,541 0.01 280 Call on 36 RRC US 16 June 2017 92,913 0.01 1,028 Call on 54 NKE US 20 January 2017 11,696 0.00 141 Put on 102 NVDA US 06 January 2017 18,983 0.00 141 Put on 11.50 AMD US 06 January 2017 6,684 0.00 1,431 Put on 125 IWM US 17 February 2017 161,450 0.03 560 Put on 134 IWM US 17 February 2017 177,331 0.04 14 Put on 2,230 SPX Index 20 January 2017 27,210 0.00 280 Put on 21 BAC US 20 January 2017 6,637 0.00 280 Put on 21.50 BAC US 13 January 2017 7,433 0.00 56 Put on 235 GS US 20 January 2017 23,361 0.00 28 Put on 720 AMZN US 20 January 2017 15,822 0.00
792,423 0.12
Total options 4,268,616 0.63
Preferred stocksGermany
6,978 Jungheinrich AG 190,220 0.03 36,293 Schaeffler AG 510,098 0.07
700,318 0.10
Total preferred stocks 700,318 0.10
Real Estate Investment TrustCanada
3,400 Allied Properties Real Estate Investment Trust 86,414 0.01 2,900 Boardwalk Real Estate Investment Trust 99,744 0.02
186,158 0.03
United States 8,811 Apollo Commercial Real Estate Finance Inc 138,837 0.02
Total real estate investment trust 324,995 0.05
RightNorway
(2,126) Petroleum Geo-Services ASA # - 0.00
Total right - 0.00
Total return swaps (b)European Union
(20,776) Citi Price Momentum Pure Europe 46,401 0.01
Finland (107,306) Outotec OYJ 3,005 0.00
South Korea (7,877,050) KOSPI 200 Index KMH7 10 March 2017 6,222 0.00
Total total return swaps 55,628 0.01
Warrants (b)Canada
361,310 Growmax Resources Corporation - 0.00 84,917 HudBay Minerals Inc 27,316 0.00
27,316 0.00
Ireland 12,050 Kenmare Resources Plc - 0.00
United States 7,211 Basic Energy SVSC - 0.00 15,059 CVSL Inc - 0.00
196

Man Funds VI PlcSchedule of Investments as at 31 December 2016 (continued)Man GLG European Equity Alternative (continued)Financial assets at fair value through profit or loss (continued)
Forward currency contracts (note 4) (b)*Unrealised % of
gain Net Amount Receivable Amount Payable Maturity Date Contracts € Assets
€553,426 CAD778,287 19 January 2017 3 3,681 0.00 €10,287 CHF11,021 06 January 2017 2 6 0.00 €17,415 CHF18,645 19 January 2017 1 16 0.00 €169 DKK1,256 19 January 2017 1 - 0.00 €331,285 GBP281,570 06 January 2017 4 1,509 0.00 €30,526,112 GBP25,718,683 19 January 2017 7 412,761 0.06 €15,438,350 HKD125,084,362 19 January 2017 2 158,154 0.02 €72,984,988 JPY8,905,017,949 19 January 2017 14 590,204 0.09 €6,262 SEK59,894 05 January 2017 1 10 0.00 €529,561 SGD797,037 19 January 2017 1 7,145 0.00 €2,200,663 US$2,300,325 06 January 2017 8 20,880 0.00 €203,662,519 US$212,436,078 19 January 2017 10 2,481,948 0.37 SEK484,987,893 €49,692,520 05 January 2017 7 927,739 0.14
Total unrealised gain on forward currency contracts 4,604,053 0.68
Total financial assets at fair value through profit or loss - trading 584,640,036 86.16
197

Man Funds VI PlcSchedule of Investments as at 31 December 2016 (continued)Man GLG European Equity Alternative (continued)Financial liabilities at fair value through profit or loss
Fair % of Fair % of Value Net Value Net
Nominal Description € Assets Nominal Description € AssetsContracts for difference Contracts for difference (continued)Australia France (continued)
(105,117) BHP Billiton Limited (166,595) (0.02) 19,183 Credit AGricole SA (112) (0.00) (133,327) BHP Billiton Limited (712,300) (0.10) 37,078 Danone SA (47,201) (0.01) (224,197) Fortescue Metals Group Limited (397,104) (0.06) (7,404) Dassault Systemes (15,809) (0.00) 633,888 Perseus Mining Limited (102,923) (0.02) (1,350) Dow Jones Europe Stoxx Personal and Household Index (48,153) (0.01) (484) S&P/ASX 200 Resources Index (198,078) (0.03) 41,544 EDF (27,681) (0.00) (450) S&P/ASX 300 Met and Mining Index (138,365) (0.02) (20,636) Eiffage (66,819) (0.01) 116,922 Sandfire Resources NL (3,309) (0.00) (16,079) Euro Stoxx 600 Industrial Goods & Services Price Index (205,784) (0.03)
(1,718,674) (0.25) 31,006 Europe STOXX Bank EUR Price Index (47,509) (0.01) (8,987) Faurecia (33,812) (0.00)
Austria (1,739) Hermes International (2,982) (0.00) (14,918) Erste Group Bank AG (7,343) (0.00) (2,315) Iliad SA (6,044) (0.00)
(13,371) Ingenico (47,284) (0.01)Belgium (7,852) JCDecaux SA (71) (0.00)
(1,785) Solvay SA (283) (0.00) 54 Kaufman & Broad SA (112) (0.00) (15,251) Umicore SA (21,513) (0.00) (60,436) Klepierre (70,813) (0.01)
(21,796) (0.00) (1,530) L'Oreal SA (1,209) (0.00) (51,574) LVMH Moet Hennessy Louis Vuitton SE (369,079) (0.05)
Bermuda 23,365 Nexity SA (952) (0.00) (357) FTSE 250 Index (152,271) (0.02) (8,741) Pernod Ricard SA (32,937) (0.00) (36,423) Seadrill Limited (7,061) (0.00) 25,972 Peugeot SA (3,006) (0.00)
(159,332) (0.02) (14,743) Publicis Groupe SA (68,992) (0.01) (437) Remy Cointreau (4,683) (0.00)
Canada 1,085 Renault SA (1,176) (0.00) (149,243) First Quantum Minerals Limited (114,660) (0.02) (98,529) Rexel SA (184,822) (0.03) (23,702) Potash Corporation Of Saskatchewan (46,407) (0.01) 112,654 Rubis SCA (139,970) (0.02) (65,657) Sherritt International Corporation (24,544) (0.00) (66,420) Safran SA (302,564) (0.04)
(185,611) (0.03) (4,097) Sodexo SA (30,285) (0.00) (76,400) SPIE SA (195,255) (0.03)
China (6,155) STOXX 600 Automobiles & Parts Price EUR Index (52,153) (0.01) 293,521 Baoshan Iron & Steel Company (12,367) (0.00) (17,878) STOXX Europe 600 Basic Resources Price Index (2,499,674) (0.38) (1,242,644) Changsha Zoomlion Heavy Industry (40,176) (0.01) (3,429) STOXX Europe 600 Chemicals Price EUR Index (120,997) (0.02) (682,000) Petrochina Company Limited (17,514) (0.00) (6,490) STOXX Europe 600 Oil & Gas Price EUR Index (105,188) (0.02) 429,800 Qingdao Haier Company Limited (41,095) (0.01) (6,685) STXE 600 Retail EUR Price index (82,100) (0.01) 153,080 Sany Heavy Equipment International (486) (0.00) (299) SXOP Index (7,114) (0.00) 12,907,305 West China Cement Limited (1,123,044) (0.16) (83,921) Technip SA (1,244,622) (0.19)
(1,234,682) (0.18) (4,542) Teleperformance (9,619) (0.00) (1,880) Thales SA (617) (0.00)
Denmark (10,735) Ubisoft Entertainment (20,897) (0.00) 691 AP Moeller-Maersk A/S (11,518) (0.00) (2,203) Unibail-Rodamco SE (34,975) (0.01) (667) AP Moeller-Maersk A/S (3,528) (0.00) (201,454) Valeo SA (434,265) (0.06) (7,262) Carlsberg A/S (6,069) (0.00) (3) Vallourec SA (7) (0.00) (9,479) Chr Hansen Holding A/S (11,532) (0.00) (14,131) Vinci SA (66,666) (0.01) (7,023) Coloplast (26,157) (0.00) (7,755,492) (1.14) (32,690) Danske Bank A/S (16,123) (0.00) (67,695) Dong Energy A/S (117,747) (0.02) Germany 60,841 DSV A/S (53,757) (0.01) (3,055) Adidas AG (38,744) (0.01) 132,630 ISS A/S (150,732) (0.03) 77,262 Aixtron AG (185,506) (0.03) (8,014) Jyske Bank A/S (9,682) (0.00) (5,973) Bayerische Motoren Werke AG (1,978) (0.00) (7,552) Novozymes A/S (1,764) (0.00) (207,741) Brenntag AG (929,002) (0.14) (8,137) Pandora A/S (116,668) (0.02) 60 Continental AG (42) (0.00) (126,188) Scandinavian Tobacco Group (122,426) (0.02) (50,522) Covestro AG (91,660) (0.01) (187,080) TDC A/S (20,258) (0.00) 1,363 Daimler AG (153) (0.00)
(667,961) (0.10) (18,930) Deutsche Boerse AG (54,647) (0.01) (14,150) Deutsche Wohnen AG (15,213) (0.00)
European Union (1,886,868) E.ON SE (239,632) (0.04) (13) CAC 40 Index (3,503) (0.00) (168,911) Fraport AG Frankfurt Airport Services Worldwide (549,412) (0.08) (6,328) Dow Jones Europe Telecom Index (39,590) (0.01) (5,666) Fresenius Medical Care AG & Company KGaA (28,517) (0.00) (13) ESTX Chemicals EUR Price (844) (0.00) (6,351) Fresenius SE and Company KGaA (51,700) (0.01) (873) GS EU Momentum Long (36,664) (0.01) (64,927) GEA Group AG (105,014) (0.02) (21,473) EU Momentum Short (61,549) (0.01) (75,000) Hannover Rueck SE (150,000) (0.02) (28,189) ESTX Small Cap Eur Price Index (416,594) (0.06) (66,206) Heidelberg Cement AG (116,499) (0.02) (19) FTSE MIB Index (36,075) (0.01) (10,665) Hella Kgaa Hueck & Company (22,552) (0.00) (5,602) MSGL3PXS Index (5,938) (0.00) 2,907 Henkel AG & Company KGaA (11,112) (0.00) (165,221) MSGLSXNP Index (1,355,058) (0.19) (2,826) Henkel AG and Company KGaA (9,522) (0.00) (6,635) Russell Europe SMID 300 Euro (530,798) (0.08) (18,759) Hochtief AG (15,945) (0.00) (25,429) STXE 600 Eur Price Index (498,245) (0.07) (13,358) Hugo Boss AG (1,747) (0.00)
(2,984,858) (0.44) (27,089) Infineon Technologies AG (20,278) (0.00) (3,086) ishares Core DAX UCITS ETF (6,049) (0.00)
Finland (6,548) K+S AG (2,184) (0.00) 15,952 Metso OYJ (8,541) (0.00) (199,498) Lanxess AG (417,606) (0.06) 23,944 Neste OYJ (18,556) (0.00) 9,241 Linde AG (27,746) (0.00) (54,222) Outetec OYJ (5,107) (0.00) (135,987) Metro AG (568,950) (0.09) (51,632) Outokumpu OYJ (34,222) (0.01) (10,208) MTU Aero Engines AG (132,142) (0.02) (44,590) Wartsila OYJ (187,546) (0.03) (2,429) Muenchener Rueckversicherungs-Gesellschaft AG (11,657) (0.00)
(253,972) (0.04) (24,922) Prosieben Sat 1 Media SE (36,981) (0.01) (3,543) Rheinmetall AG (430) (0.00)
France (566,178) SAP SE (2,174,838) (0.33) (13,869) Accor SA (6,709) (0.00) (67,676) Siemens AG (203,977) (0.03) (7,103) ADP Promesses (74,133) (0.01) (15,901) Software AG (21,832) (0.00) 406,889 Air France-KLM (126,724) (0.02) (115,949) TUI AG (119,653) (0.02) 16,952 Arkema SA (45,378) (0.01) (22,036) United Internet AG (21,673) (0.00) (9,366) Atos SE (37,729) (0.01) (7,035) Volkswagen AG (28,136) (0.00) (3,493) BNP Paribas SA (22,421) (0.00) (18,348) Wacker Chemie AG (289,400) (0.04) (5,866) Cap Gemini SA (32,966) (0.00) (38,551) Zalando SE (8,154) (0.00) 35,576 Carrefour SA (16,414) (0.00) (6,710,283) (0.99) 1,500 Cellectis SA (18,788) (0.00) (119,435) Cie Generale des Etablissements Michelin (721,277) (0.11) Hong Kong (4,131) Cie Generale d'Optique Essilor International SA (18,943) (0.00) (453,211) China State Construction International Holdings Limited (59,877) (0.01)
198
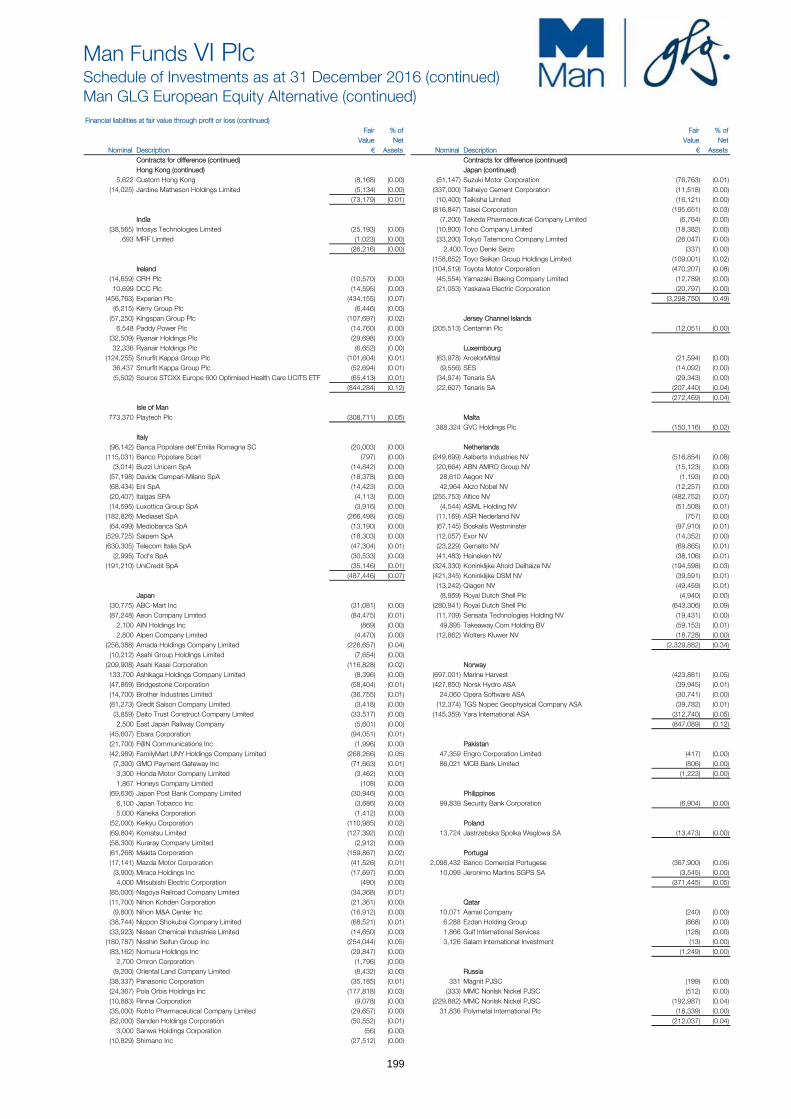
Man Funds VI PlcSchedule of Investments as at 31 December 2016 (continued)Man GLG European Equity Alternative (continued)Financial liabilities at fair value through profit or loss (continued)
Fair % of Fair % of Value Net Value Net
Nominal Description € Assets Nominal Description € AssetsContracts for difference (continued) Contracts for difference (continued)Hong Kong (continued) Japan (continued)
5,622 Custom Hong Kong (8,168) (0.00) (51,147) Suzuki Motor Corporation (76,763) (0.01) (14,025) Jardine Matheson Holdings Limited (5,134) (0.00) (337,000) Taiheiyo Cement Corporation (11,518) (0.00)
(73,179) (0.01) (10,400) Taikisha Limited (16,121) (0.00) (816,847) Taisei Corporation (195,651) (0.03)
India (7,200) Takeda Pharmaceutical Company Limited (6,764) (0.00) (38,565) Infosys Technologies Limited (25,193) (0.00) (10,800) Toho Company Limited (18,382) (0.00) 693 MRF Limited (1,023) (0.00) (33,200) Tokyo Tatemono Company Limited (26,047) (0.00)
(26,216) (0.00) 2,400 Toyo Denki Seizo (337) (0.00) (158,652) Toyo Seikan Group Holdings Limited (109,001) (0.02)
Ireland (104,519) Toyota Motor Corporation (470,207) (0.08) (14,659) CRH Plc (10,570) (0.00) (45,554) Yamazaki Baking Company Limited (12,789) (0.00) 10,699 DCC Plc (14,595) (0.00) (21,053) Yaskawa Electric Corporation (20,797) (0.00) (456,763) Experian Plc (434,155) (0.07) (3,298,750) (0.49) (6,215) Kerry Group Plc (6,446) (0.00) (57,250) Kingspan Group Plc (107,697) (0.02) Jersey Channel Islands 6,548 Paddy Power Plc (14,760) (0.00) (205,513) Centamin Plc (12,051) (0.00) (32,509) Ryanair Holdings Plc (29,698) (0.00) 32,336 Ryanair Holdings Plc (6,652) (0.00) Luxembourg (124,255) Smurfit Kappa Group Plc (101,604) (0.01) (63,978) ArcelorMittal (21,594) (0.00) 36,437 Smurfit Kappa Group Plc (52,694) (0.01) (9,556) SES (14,092) (0.00) (5,502) Source STOXX Europe 600 Optimised Health Care UCITS ETF (65,413) (0.01) (34,974) Tenaris SA (29,343) (0.00)
(844,284) (0.12) (22,607) Tenaris SA (207,440) (0.04) (272,469) (0.04)
Isle of Man 773,370 Playtech Plc (308,711) (0.05) Malta
388,324 GVC Holdings Plc (150,116) (0.02)Italy
(96,142) Banca Popolare dell'Emilia Romagna SC (20,003) (0.00) Netherlands (115,031) Banco Popolare Scarl (797) (0.00) (249,699) Aalberts Industries NV (516,854) (0.08) (3,014) Buzzi Unicem SpA (14,842) (0.00) (20,664) ABN AMRO Group NV (15,123) (0.00) (57,198) Davide Campari-Milano SpA (18,378) (0.00) 28,610 Aegon NV (1,193) (0.00) (68,434) Eni SpA (14,423) (0.00) 42,964 Akzo Nobel NV (12,257) (0.00) (20,407) Italgas SPA (4,113) (0.00) (255,753) Altice NV (482,752) (0.07) (14,595) Luxottica Group SpA (3,916) (0.00) (4,544) ASML Holding NV (51,508) (0.01) (182,826) Mediaset SpA (266,498) (0.05) (11,169) ASR Nederland NV (757) (0.00) (64,499) Mediobanca SpA (13,190) (0.00) (67,145) Boskalis Westminster (97,910) (0.01) (529,725) Saipem SpA (18,303) (0.00) (12,057) Exor NV (14,352) (0.00) (630,305) Telecom Italia SpA (47,304) (0.01) (23,229) Gemalto NV (69,865) (0.01) (2,995) Tod's SpA (30,533) (0.00) (41,483) Heineken NV (38,106) (0.01) (191,210) UniCredit SpA (35,146) (0.01) (324,330) Koninklijke Ahold Delhaize NV (194,598) (0.03)
(487,446) (0.07) (421,345) Koninklijke DSM NV (39,591) (0.01) (13,242) Qiagen NV (49,459) (0.01)
Japan (8,959) Royal Dutch Shell Plc (4,940) (0.00) (30,775) ABC-Mart Inc (31,081) (0.00) (280,941) Royal Dutch Shell Plc (643,306) (0.09) (87,248) Aeon Company Limited (84,475) (0.01) (11,709) Sensata Technologies Holding NV (19,431) (0.00) 2,100 AIN Holdings Inc (869) (0.00) 49,895 Takeaway.Com Holding BV (59,152) (0.01) 2,800 Alpen Company Limited (4,470) (0.00) (12,862) Wolters Kluwer NV (18,728) (0.00) (256,388) Amada Holdings Company Limited (226,657) (0.04) (2,329,882) (0.34) (10,212) Asahi Group Holdings Limited (7,654) (0.00) (209,908) Asahi Kasei Corporation (116,828) (0.02) Norway 133,700 Ashikaga Holdings Company Limited (8,396) (0.00) (697,001) Marine Harvest (423,881) (0.05) (47,869) Bridgestone Corporation (58,404) (0.01) (427,850) Norsk Hydro ASA (39,945) (0.01) (14,700) Brother Industries Limited (36,755) (0.01) 24,060 Opera Software ASA (30,741) (0.00) (81,273) Credit Saison Company Limited (3,418) (0.00) (12,374) TGS Nopec Geophysical Company ASA (39,782) (0.01) (3,859) Daito Trust Construct Company Limited (33,517) (0.00) (145,359) Yara International ASA (312,740) (0.05) 2,500 East Japan Railway Company (5,601) (0.00) (847,089) (0.12) (45,607) Ebara Corporation (94,051) (0.01) (21,700) F@N Communications Inc (1,996) (0.00) Pakistan (42,989) FamilyMart UNY Holdings Company Limited (268,266) (0.05) 47,359 Engro Corporation Limited (417) (0.00) (7,300) GMO Payment Gateway Inc (71,663) (0.01) 86,021 MCB Bank Limited (806) (0.00) 3,300 Honda Motor Company Limited (3,462) (0.00) (1,223) (0.00) 1,867 Honeys Company Limited (108) (0.00) (69,636) Japan Post Bank Company Limited (30,946) (0.00) Philippines 6,100 Japan Tobacco Inc (3,686) (0.00) 99,839 Security Bank Corporation (6,904) (0.00) 5,000 Kaneka Corporation (1,412) (0.00) (52,000) Keikyu Corporation (110,985) (0.02) Poland (69,804) Komatsu Limited (127,392) (0.02) 13,724 Jastrzebska Spolka Weglowa SA (13,473) (0.00) (58,300) Kuraray Company Limited (2,912) (0.00) (61,268) Makita Corporation (159,867) (0.02) Portugal (17,141) Mazda Motor Corporation (41,526) (0.01) 2,098,432 Banco Comercial Portugese (367,900) (0.05) (3,900) Miraca Holdings Inc (17,697) (0.00) 10,099 Jeronimo Martins SGPS SA (3,545) (0.00) 4,000 Mitsubishi Electric Corporation (490) (0.00) (371,445) (0.05) (85,000) Nagoya Railroad Company Limited (34,368) (0.01) (11,700) Nihon Kohden Corporation (21,361) (0.00) Qatar (9,800) Nihon M&A Center Inc (16,912) (0.00) 10,071 Aamal Company (240) (0.00) (38,744) Nippon Shokubai Company Limited (68,521) (0.01) 6,288 Ezdan Holding Group (868) (0.00) (33,923) Nissan Chemical Industries Limited (14,650) (0.00) 1,866 Gulf International Services (128) (0.00) (180,787) Nisshin Seifun Group Inc (254,044) (0.05) 3,126 Salam International Investment (13) (0.00) (83,162) Nomura Holdings Inc (29,847) (0.00) (1,249) (0.00) 2,700 Omron Corporation (1,796) (0.00) (9,200) Oriental Land Company Limited (8,432) (0.00) Russia (38,337) Panasonic Corporation (35,185) (0.01) 331 Magnit PJSC (199) (0.00) (24,367) Pola Orbis Holdings Inc (177,818) (0.03) (333) MMC Norilsk Nickel PJSC (512) (0.00) (10,883) Rinnai Corporation (9,078) (0.00) (229,882) MMC Norilsk Nickel PJSC (192,987) (0.04) (35,000) Rohto Pharmaceutical Company Limited (29,657) (0.00) 31,836 Polymetal International Plc (18,339) (0.00) (82,000) Sanden Holdings Corporation (50,552) (0.01) (212,037) (0.04) 3,000 Sanwa Holdings Corporation (56) (0.00) (10,829) Shimano Inc (27,512) (0.00)
199

Man Funds VI PlcSchedule of Investments as at 31 December 2016 (continued)Man GLG European Equity Alternative (continued)Financial liabilities at fair value through profit or loss (continued)
Fair % of Fair % of Value Net Value Net
Nominal Description € Assets Nominal Description € AssetsContracts for difference (continued) Contracts for difference (continued)South Africa United Kingdom (continued)
(36,260) Lonmin Plc (3,057) (0.00) (2,472,175) Centrica Plc (346,680) (0.05) 34,358 Mediclinic International Plc (51,717) (0.01) 20,280 Coca-Cola European Partners (14,793) (0.00) (25,762) Sun International Limited (5,031) (0.00) (762,650) Compass Group Plc (817,843) (0.12)
(59,805) (0.01) (12,062) Croda International Plc (13,400) (0.00) (84,000) Daily Mail&General Tst-A NV (35,337) (0.01)
Spain (200,046) Dairy Crest Group Plc (55,892) (0.01) 16,399 Acerinox SA (6,353) (0.00) (15,780) Derwent Valley Holdings Plc (23,353) (0.00) (89,587) ACS Actividades Construction y Servicios (87,854) (0.02) (105,495) Diageo Plc (76,551) (0.01) (10,215) Aena SA (24,988) (0.00) (6) Dialog Semiconductor Plc (19) (0.00) (10,254) Amadeus IT Holding SA (13,111) (0.00) (139,914) Dixons Carphone Plc (31,093) (0.00) 450,175 Banco Popular Espanol SA (19,736) (0.00) (224,724) DS Smith Plc (68,466) (0.01) (83,085) Industria de Diseno Textil SA (10,681) (0.00) (31,118) Dunelm Group Plc (11,686) (0.00) (31,546) Mediaset Espana Comunicacion (27,455) (0.01) 136,344 easyJet Plc (16,926) (0.00) (200,443) Obrascon Huarte Lain SA (32,071) (0.01) (4,543) Fevertree Drinks Plc (8,390) (0.00) (4,021) Tecnicas Reunidas SA (21,275) (0.00) (890) FTSE 350 Mining Index (1,179,223) (0.17)
(243,524) (0.04) (83,375) G4S Plc (3,573) (0.00) (160,864) GKN Plc (46,691) (0.01)
Sweden (190,123) GlaxoSmithKline Plc (59,531) (0.01) (194,789) Alfa Laval AB (309,152) (0.05) (88,082) Greggs Plc (1,014) (0.00) (102,224) Alimak Group AB (124,682) (0.02) (797,051) Halfords Group Plc (40,581) (0.01) 2,448 Assa Abloy AB (7,174) (0.00) (74,851) Hammerson Plc (21,120) (0.00) 16,592 Atlas Copco AB (18,239) (0.00) (21,832) Hargreaves Lansdown Plc (15,735) (0.00) (13,854) Autoliv Inc (51,948) (0.01) (3,845) Hikma Pharmaceuticals Plc (3,641) (0.00) (143,564) Boliden AB (75,612) (0.01) 224,346 Howden Joinery Group Plc (254,900) (0.04) (4,583) Electrolux AB (452) (0.00) (190) HSBC Holdings Plc (7,238) (0.00) (5,009) Elekta AB (980) (0.00) (85,525) IMI Plc (57,776) (0.01) 10,457 Hennes and Mauritz AB (11,847) (0.00) 129,956 Imperial Tobacco Group Plc (180,935) (0.03) (438,522) Husqvarna AB (235,248) (0.04) (90,175) Inchcape Plc (80,158) (0.01) (40,259) ICA Gruppen AB (5,783) (0.00) (387,465) International Consolidated Airlines Group S.A. (170,684) (0.03) (5,099) JM AB (6,994) (0.00) (489,892) International Consolidated Airlines Group SA (23,306) (0.00) (971,875) Sandvik AB (417,184) (0.07) (66,490) Intertek Group Plc (114,817) (0.02) 21,587 Skanska AB (7,049) (0.00) (112,616) Intu Properties Plc (14,986) (0.00) 182,347 SSAB AB (27,401) (0.00) (30,510) JD Wetherspoon Plc (19,952) (0.00) (6,424) Swedish Match AB (282) (0.00) (18,280) John Wood Group Plc (1,453) (0.00) (301,487) Volvo AB (348,200) (0.05) (12,242) Johnson Matthey Plc (10,038) (0.00)
(1,648,227) (0.25) (16,832) Johnson Service Group Plc (1,822) (0.00) (146,676) Jupiter Fund Management (23,656) (0.00)
Switzerland (369,936) Just Eat Plc (73,105) (0.01) (88,480) ABB Limited (64,382) (0.01) (410,363) Marks & Spencer Group Plc (54,838) (0.01) (4,396) Aryzta AG (1,887) (0.00) (246,411) Merlin Entertainments Plc (16,858) (0.00) (36,632) Cie Financiere Richemont SA (60,034) (0.01) (280,083) Mitie Group Plc (13,748) (0.00) 176 Credit Suisse Group AG (122) (0.00) (365,645) Mondi Plc (340,594) (0.05) (27,869) DKSH Holding AG (96,409) (0.01) 173,734 Monitise Plc (1,152) (0.00) (704) EMS-Chemie Holding AG (45,617) (0.01) (121,893) National Grid Plc (52,251) (0.01) (4,414) Geberit AG (26,647) (0.00) (4,824) Next Plc (670) (0.00) (4,503) Givaudan (64,369) (0.01) 74,229 Patisserie Holdings Plc (36,815) (0.01) 4,127 LafargeHolcim Limited (10,168) (0.00) (792,769) Pearson Plc (418,060) (0.06) (143,423) LafargeHolcim Limited (7,562) (0.00) (10,832) Persimmon Plc (6,562) (0.00) (9,461) MSBPGLPP (537,191) (0.09) (353,105) Petrofac Limited (320,133) (0.05) (13,112) Panalpina Welttransport Holding AG (207,066) (0.03) (15,146) Provident Financial Plc (25,097) (0.00) (6,806) Schindler Holding (7,735) (0.00) (468,308) Prudential Plc (454,960) (0.07) (1,919) SGS SA (59,811) (0.01) (83,634) Reckitt Benckiser Group Plc (51,529) (0.01) (386) SIKA FIN I (16,987) (0.00) (6,797) Rightmove Plc (15,756) (0.00) (12,240) STMicroelectronics NV (29,933) (0.00) (24,346) Rio Tinto Limited (266,690) (0.04) (3,181) Swatch Group AG (17,636) (0.00) (1,301) Russell UK MID 150 Index (111,287) (0.02) 1,287 Syngenta AG (5,026) (0.00) (178,894) Sage Group Plc (47,090) (0.01) 30,667 Syngenta AG (301,909) (0.05) (2,561,990) J Sainsbury Plc (349,647) (0.05) 4,999 Temenos Group AG (1,458) (0.00) (21,605) Schroders Plc (23,662) (0.00) 29,811 UBS Group AG (43,640) (0.01) (68,684) Segro Plc (13,108) (0.00)
(1,605,589) (0.24) (11,418) Severn Trent Plc (673) (0.00) 17,924 Smiths Group Plc (38,106) (0.01)
Taiwan 84,361 Softcat Plc (35,471) (0.01) 1,397,468 China Life Insurance Company Limited (7,787) (0.00) (22,871) Spectris Plc (66,324) (0.01)
108,617 Spire Healthcare Group Plc (43,998) (0.01)Ukraine (540,761) SSE Plc (508,225) (0.08)
7,046 Kernel Holdings SA (184) (0.00) (2,238,740) Standard Life Plc (495,348) (0.08) (8,553) TalkTalk Telecom Group Plc (125) (0.00)
United Kingdom 76,413 Tate and Lyle Plc (12,229) (0.00) (116,216) 3I Group Plc (50,754) (0.01) 600,599 Taylor Wimpey Plc (5,866) (0.00) (874,354) AA Plc (143,107) (0.02) 217,484 Topps Tiles Plc (135,666) (0.02) (19,604) Admiral Group Plc (8,479) (0.00) (402,801) Travis Perkins Plc (311,984) (0.05) 82,807 Aggreko Plc (4,916) (0.00) (373,992) Tullow Oil Plc (12,268) (0.00) (267,908) Amec Plc (30,488) (0.00) (29,480) UBM Plc (8,745) (0.00) 224,140 Anglo American Plc (53,496) (0.01) (34,584) Unilever NV (38,781) (0.01) 91,084 Antofagasta Plc (20,217) (0.00) (19,279) Unilever Plc (9,322) (0.00) (30,329) Ashtead Group Plc (111,877) (0.02) 25,552 United Utilities Group Plc (502) (0.00) 34,484 ASOS Plc (7,764) (0.00) (212,473) Victrex Plc (845,892) (0.12) (162,138) Auto Trader Group Plc (61,021) (0.01) 92,530 Virgin Money Holdings (12,854) (0.00) (380,652) B&M European Value Retail SA (110,348) (0.02) 87,531 Vodafone Group Plc (419) (0.00) 143,085 BAE Systems Plc (8,769) (0.00) (41,997) WH Smith Plc (25,367) (0.00) (12,491) Bellway Plc (4,712) (0.00) (110,685) Whitbread Plc (328,096) (0.05) 49,101 Big Yellow Group Plc (22,197) (0.00) (905,762) WM Morrison Supermarkets Plc (100,134) (0.02) 1,787,985 Booker Group Plc (37,647) (0.01) (280,042) Worldpay Group Plc (10,715) (0.00) 25,226 BP Plc (542) (0.00) (10,349,041) (1.53) (18,209) British American Tobacco Plc (20,233) (0.00) (138,753) BT Group Plc (9,866) (0.00) United States 65,088 Capita Group Plc (7,894) (0.00) (9,825) Aetna Inc (38,256) (0.01) (271,637) Capital & Counties Properties Plc (40,733) (0.01) 5,789 Amazon.com Inc (48,511) (0.01)
200

Man Funds VI PlcSchedule of Investments as at 31 December 2016 (continued)Man GLG European Equity Alternative (continued)Financial liabilities at fair value through profit or loss (continued)
Fair % of Fair % of Value Net Value Net
Nominal Description € Assets Nominal Description € AssetsContracts for difference (continued) Future contracts (continued)United States (continued) Hong Kong (continued)
(12,259) Anthem Inc (49,757) (0.01) Italy (24,335) Apple Inc (67,949) (0.01) (575) ENI SpA SSDF December 2017 (20,715) (0.00) (6,359) Automatic Data Processing Inc (90,765) (0.01) (188) MINI FTSE/MIB Index Futures March 2017 (94,085) (0.02) (12,877) Avis Budget Group Inc (4,788) (0.00) (114,800) (0.02) 21,685 Boardwalk Pipeline Partners (20,856) (0.00) (6,102) Boeing Company (12,973) (0.00) Japan (87,542) Borgwarner Inc (310,185) (0.06) (111) TOPIX Index Futures March 2017 (124,260) (0.02) (14,104) CarMax Inc (74,194) (0.01) (9,979) Carnival Plc (13,749) (0.00) Netherlands (38,305) Century Aluminum Company (59,005) (0.01) (253) Royal Dutch SSDF December 2017 (35,185) (0.01) (86,657) CF Industries Holdings Inc (179,768) (0.04) 19,969 Cigna Corporation (93,640) (0.01) Poland (98,236) Cisco Systems Inc (24,469) (0.00) (31) WIG20 Index Futures March 2017 (422) (0.00) (129,863) Colony Capital Inc (191,913) (0.04) 24,564 Costco Wholesale Corporation (62,293) (0.01) Singapore (20,607) Custom GSG1CONS Index (133,866) (0.02) (29) Nikkei Dividend Futures December 2017 (17,867) (0.00) (843) Custom Offshore Drillers (3,389) (0.00) (35) SGX Nifty 50 Index Futures January 2017 (6,795) (0.00) (6,138) Eastman Chemical Company (4,271) (0.00) (24,662) (0.00) 147 Emerson Electric Company (160) (0.00) (17,074) Energy Select Sector SPDR Fund (646) (0.00) Spain 18,039 Energy Transfer Partners LP (6,222) (0.00) 466 Telefonica SSDF December 2017 (92,932) (0.01) (12,628) Fiserv Inc (38,698) (0.01) (24,375) Five Below Inc (7,875) (0.00) Switzerland (48,781) FMC Technologies Inc (27,916) (0.00) (56) Zurich Financial AG SSDF December 2017 (2,612) (0.00) (15,251) General Electric Company (33,690) (0.00) (2,873) HCP Inc (890) (0.00) United Kingdom (14,265) Industrial Select Sector Index (333,329) (0.06) (286) FTSE 100 Index Futures March 2017 (360,825) (0.05) 40,492 Industrial Select Sector SPDR Fund (71,007) (0.01) (20,011) International Business Machines Corporation (80,213) (0.01) United States (4,800) iShares MSCI Brazil Capped ETF (7,737) (0.00) 239 S&P500 EMini Index Futures March 2017 (345,947) (0.05) (13,871) ishares MSCI Chile Capped ET (1,657) (0.00) (45,862) ishares MSCI Emerging Markets Index Fund (16,763) (0.00) Total future contracts (2,752,339) (0.41) (16,695) iShares MSCI Philippines ETF (18,254) (0.00) (86,383) ishares Russell 2000 ETF (148,778) (0.02) Options (1,979) Jack Henry & Associates Inc (9,531) (0.00) Chile (27,257) Lyondellbasell Industries (79,122) (0.01) (364) Put on 6 ANTO LN 20 January 2017 (13,859) (0.00) (76,607) VanEck Vectors Semiconductor ETF (265,771) (0.05) (3,766) Martin Marietta Materials Inc (122,899) (0.02) France (14,644) Mosaic Company (16,250) (0.00) (143) Call on 23 CA FP 17 March 2017 (14,157) (0.00) (4,492) MSBPSLUX Index (17,799) (0.00) (55,239) National Oilwell Varco Inc (190,912) (0.03) Germany (50,061) Nexstar Broadcasting Group Inc (498,591) (0.07) (46) Call on 115 SX7E Index 16 June 2017 (21,045) (0.00) 56,659 Nike Inc (24,054) (0.00) (11,475) Call on 120 SX7E Index 16 June 2017 (3,930,188) (0.58) (22,192) O'Reilly Automotive Inc (185,013) (0.03) (1,016) Call on 125 SX7E Index 16 June 2017 (251,460) (0.04) (10,611) Owens Corning (21,840) (0.00) (1,390) Put on 2,900 SX5E Index 17 March 2017 (330,820) (0.05) (7,713) PACCAR Inc (72,323) (0.01) (4,533,513) (0.67) (29,077) Patterson-UTI Energy Inc (1,287) (0.00) 21,541 Plains All Amer Pipeline LP (4,200) (0.00) United Kingdom (44,854) Powershares Qqq (23,682) (0.00) (718) Call on 37.50 LBTYA US 20 January 2017 (11,572) (0.00) (67,814) RPC Inc (32,793) (0.00) (10,558) RUSSELL 2000 Index (205,042) (0.03) United States (100) S&P Biotech Select Tr (22,640) (0.00) (69) Call on 120 FB US 20 January 2017 (4,579) (0.00) (11,910) Scripps Networks Inter (31,039) (0.00) (700) Call on 33.50 VXX US 20 January 2017 (24,556) (0.00) 921 SPDR S&P 500 ETF Trust (1,479) (0.00) (256) Call on 40 WFM US 19 January 2017 (21,601) (0.00) 3,820 SPDR S&P Biotech ETF (2,959) (0.00) (280) Call on 44 RRC US 16 June 2017 (30,529) (0.00) (49,645) SPDR S&P Metals & Mining ETF (124,052) (0.02) (2,862) Put on 115 IWM US 17 February 2017 (100,397) (0.02) (37,639) SPDR S&P Retail ETF (51,513) (0.01) (560) Put on 128 IWM US 17 February 2017 (89,727) (0.02) (78,641) Starbucks Corporation (175,236) (0.03) (56) Put on 227.50 GS US 20 January 2017 (11,999) (0.00) (11,946) Tallgrass Energy GP LP (27,043) (0.00) (280) Put on 28 RRC US 16 June 2017 (43,138) (0.01) (44,836) Tallgrass Energy Partners Lp (109,293) (0.02) (141) Put on 98.50 NVDA US 06 January 2017 (8,957) (0.00) (26,896) Target Corporation (20,287) (0.00) (335,483) (0.05) (82,215) Texas Instruments Inc (206,496) (0.03) (17,901) Ulta Salon Cosmetics & Fragrance Inc (30,811) (0.00) Total options (4,908,584) (0.72) (6,945) Valero Energy Corporation (16,731) (0.00) (52,543) VMware Inc (956,085) (0.14) Total return swaps (171,351) Western Union Company (115,015) (0.02) India 37 WW Grainger Inc (228) (0.00) (214,165) Hindalco Industries (9,225) (0.00) (6,142) Yelp Inc (15,959) (0.00) (67,233) Zillow Group Inc (53,092) (0.01) Spain
(6,009,499) (0.89) 383,705 Abengoa SA (384) (0.00)
Total contracts for difference (50,880,184) (7.50) Taiwan (24) Taiex Futures FTF7 18 January 2017 (6,145) (0.00)
Future contractsGermany Total total return swaps (15,754) (0.00)
(114) Daimler AG SSDF December 2017 (28,470) (0.00) (18) DAX Index Futures March 2017 (31,175) (0.00) (1,934) Euro STOXX 50 Index Futures March 2017 (1,109,779) (0.17) 3,828 Euro STOXX Bank Index Futures March 2017 (108,360) (0.02) (87) SX5E Dividend Index Futures December 2017 (17,690) (0.00) (87) SX5E Dividend Index Futures December 2018 (46,690) (0.01)
(1,342,164) (0.20)
Hong Kong (148) Hang Seng Index Futures January 2017 (282,973) (0.05) (42) H-Shares Index Futures January 2017 (25,557) (0.00)
(308,530) (0.05)
201

Man Funds VI PlcSchedule of Investments as at 31 December 2016 (continued)Man GLG European Equity Alternative (continued)Financial liabilities at fair value through profit or loss (continued)
Forward currency contracts (note 4)Unrealised % of
loss Net Amount Receivable Amount Payable Maturity Date Contracts € AssetsAUD1,500,007 €1,036,840 19 January 2017 1 (8,785) 0.00 CHF8,175,115 €7,652,418 06 January 2017 3 (26,190) 0.00 CHF343,114 €320,763 19 January 2017 1 (577) 0.00 €2,709 CHF2,906 06 January 2017 1 (2) 0.00 €113,328 GBP97,291 19 January 2017 1 (587) 0.00 €804,543 JPY98,985,284 19 January 2017 1 (174) 0.00 €1,915 NOK17,433 19 January 2017 1 (4) 0.00 €299,775 SEK2,888,251 05 January 2017 5 (1,684) 0.00 €82,987 SEK800,493 19 January 2017 1 (578) 0.00 GBP42,212,087 €50,230,374 06 January 2017 3 (791,472) (0.12)JPY92,562,278 €753,108 19 January 2017 1 (608) 0.00 NOK7,551,917 €833,460 06 January 2017 2 (1,966) 0.00 SEK295,000 €30,842 05 January 2017 1 (52) 0.00 SGD238,672 €157,894 06 January 2017 1 (1,351) 0.00 US$157,104,364 €150,532,463 06 January 2017 7 (1,660,707) (0.25)US$7,713,178 €7,372,918 19 January 2017 2 (68,407) (0.01)
Total unrealised loss on forward currency contracts (2,563,144) (0.38)
Total financial liabilities at fair value through profit or loss - trading (61,120,005) (9.01)
Total financial assets at fair value through profit or loss - trading 584,640,036 86.16
Total financial liabilities at fair value through profit or loss - trading (61,120,005) (9.01)
Other net assets 155,010,814 22.85
Net Assets Attributable to Holders of Redeembale Participating Shares 678,530,845 100.00
*The forward currency contracts are held with the Bank of New York Mellon, Brussels
Classification(a) Exchange traded derivative instruments(b) OTC financial derivative instrumentsAll other investments held at the year end are transferable securities listed on an official stock exchange
TotalAnalysis of Total Assets AssetsTransferable securities listed on an official stock exchange 67.09Exchange traded financial derivative instruments described in classification (a) above 0.08OTC financial derivative instruments described in classification (b) above 6.71Other current assets 26.12
100.00
202
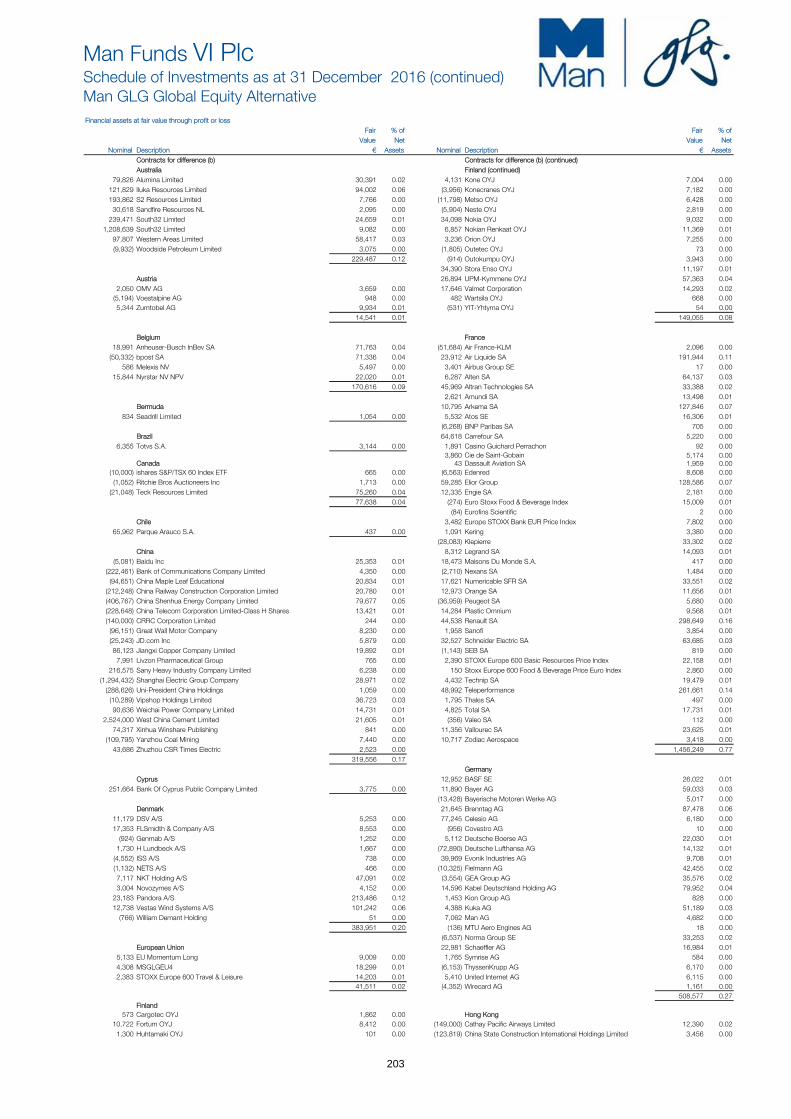
Man Funds VI PlcSchedule of Investments as at 31 December 2016 (continued)Man GLG Global Equity AlternativeFinancial assets at fair value through profit or loss
Fair % of Fair % of Value Net Value Net
Nominal Description € Assets Nominal Description € AssetsContracts for difference (b) Contracts for difference (b) (continued)Australia Finland (continued)
79,826 Alumina Limited 30,391 0.02 4,131 Kone OYJ 7,004 0.00 121,829 Iluka Resources Limited 94,002 0.06 (3,956) Konecranes OYJ 7,182 0.00 193,862 S2 Resources Limited 7,766 0.00 (11,798) Metso OYJ 6,428 0.00 30,618 Sandfire Resources NL 2,095 0.00 (5,904) Neste OYJ 2,819 0.00 239,471 South32 Limited 24,659 0.01 34,098 Nokia OYJ 9,032 0.00 1,208,639 South32 Limited 9,082 0.00 6,857 Nokian Renkaat OYJ 11,369 0.01 97,807 Western Areas Limited 58,417 0.03 3,236 Orion OYJ 7,255 0.00 (9,932) Woodside Petroleum Limited 3,075 0.00 (1,805) Outetec OYJ 73 0.00
229,487 0.12 (914) Outokumpu OYJ 3,943 0.00 34,390 Stora Enso OYJ 11,197 0.01
Austria 26,894 UPM-Kymmene OYJ 57,363 0.04 2,050 OMV AG 3,659 0.00 17,646 Valmet Corporation 14,293 0.02 (5,194) Voestalpine AG 948 0.00 482 Wartsila OYJ 668 0.00 5,344 Zumtobel AG 9,934 0.01 (531) YIT-Yhtyma OYJ 54 0.00
14,541 0.01 149,055 0.08
Belgium France 18,991 Anheuser-Busch InBev SA 71,763 0.04 (51,684) Air France-KLM 2,096 0.00 (50,332) bpost SA 71,336 0.04 23,912 Air Liquide SA 191,944 0.11 586 Melexis NV 5,497 0.00 3,401 Airbus Group SE 17 0.00 15,844 Nyrstar NV NPV 22,020 0.01 6,287 Alten SA 64,137 0.03
170,616 0.09 45,969 Altran Technologies SA 33,388 0.02 2,621 Amundi SA 13,498 0.01
Bermuda 10,795 Arkema SA 127,846 0.07 834 Seadrill Limited 1,054 0.00 5,532 Atos SE 16,306 0.01
(6,268) BNP Paribas SA 705 0.00 Brazil 64,618 Carrefour SA 5,220 0.00
6,355 Totvs S.A. 3,144 0.00 1,891 Casino Guichard Perrachon 92 0.00 3,860 Cie de Saint-Gobain 5,174 0.00
Canada 43 Dassault Aviation SA 1,959 0.00 (10,000) ishares S&P/TSX 60 Index ETF 665 0.00 (6,563) Edenred 8,608 0.00 (1,052) Ritchie Bros Auctioneers Inc 1,713 0.00 59,285 Elior Group 128,586 0.07 (21,048) Teck Resources Limited 75,260 0.04 12,335 Engie SA 2,181 0.00
77,638 0.04 (274) Euro Stoxx Food & Beverage Index 15,009 0.01 (84) Eurofins Scientific 2 0.00
Chile 3,482 Europe STOXX Bank EUR Price Index 7,802 0.00 65,962 Parque Arauco S.A. 437 0.00 1,091 Kering 3,380 0.00
(28,083) Klepierre 33,302 0.02 China 8,312 Legrand SA 14,093 0.01
(5,081) Baidu Inc 25,353 0.01 18,473 Maisons Du Monde S.A. 417 0.00 (222,461) Bank of Communications Company Limited 4,350 0.00 (2,710) Nexans SA 1,484 0.00 (94,651) China Maple Leaf Educational 20,834 0.01 17,621 Numericable SFR SA 33,551 0.02 (212,248) China Railway Construction Corporation Limited 20,780 0.01 12,973 Orange SA 11,656 0.01 (406,767) China Shenhua Energy Company Limited 79,677 0.05 (36,959) Peugeot SA 5,680 0.00 (228,648) China Telecom Corporation Limited-Class H Shares 13,421 0.01 14,284 Plastic Omnium 9,568 0.01 (140,000) CRRC Corporation Limited 244 0.00 44,538 Renault SA 298,649 0.16 (96,151) Great Wall Motor Company 8,230 0.00 1,958 Sanofi 3,854 0.00 (25,243) JD.com Inc 5,879 0.00 32,527 Schneider Electric SA 63,685 0.03 86,123 Jiangxi Copper Company Limited 19,892 0.01 (1,143) SEB SA 819 0.00 7,991 Livzon Pharmaceutical Group 765 0.00 2,390 STOXX Europe 600 Basic Resources Price Index 22,158 0.01 216,575 Sany Heavy Industry Company Limited 6,238 0.00 150 Stoxx Europe 600 Food & Beverage Price Euro Index 2,860 0.00 (1,294,432) Shanghai Electric Group Company 28,971 0.02 4,432 Technip SA 19,479 0.01 (288,626) Uni-President China Holdings 1,059 0.00 48,992 Teleperformance 261,661 0.14 (10,289) Vipshop Holdings Limited 36,723 0.03 1,795 Thales SA 497 0.00 90,636 Weichai Power Company Limited 14,731 0.01 4,825 Total SA 17,731 0.01 2,524,000 West China Cement Limited 21,605 0.01 (356) Valeo SA 112 0.00 74,317 Xinhua Winshare Publishing 841 0.00 11,356 Vallourec SA 23,625 0.01 (109,795) Yanzhou Coal Mining 7,440 0.00 10,717 Zodiac Aerospace 3,418 0.00 43,686 Zhuzhou CSR Times Electric 2,523 0.00 1,456,249 0.77
319,556 0.17 Germany
Cyprus 12,952 BASF SE 26,022 0.01 251,664 Bank Of Cyprus Public Company Limited 3,775 0.00 11,890 Bayer AG 59,033 0.03
(13,428) Bayerische Motoren Werke AG 5,017 0.00 Denmark 21,645 Brenntag AG 87,478 0.06
11,179 DSV A/S 5,253 0.00 77,245 Celesio AG 6,180 0.00 17,353 FLSmidth & Company A/S 8,553 0.00 (956) Covestro AG 10 0.00 (924) Genmab A/S 1,252 0.00 5,112 Deutsche Boerse AG 22,030 0.01 1,730 H Lundbeck A/S 1,667 0.00 (72,890) Deutsche Lufthansa AG 14,132 0.01 (4,552) ISS A/S 738 0.00 39,969 Evonik Industries AG 9,708 0.01 (1,132) NETS A/S 466 0.00 (10,325) Fielmann AG 42,455 0.02 7,117 NKT Holding A/S 47,091 0.02 (3,554) GEA Group AG 35,576 0.02 3,004 Novozymes A/S 4,152 0.00 14,596 Kabel Deutschland Holding AG 79,952 0.04 23,183 Pandora A/S 213,486 0.12 1,453 Kion Group AG 828 0.00 12,738 Vestas Wind Systems A/S 101,242 0.06 4,388 Kuka AG 51,189 0.03 (766) William Demant Holding 51 0.00 7,062 Man AG 4,682 0.00
383,951 0.20 (136) MTU Aero Engines AG 18 0.00 (6,537) Norma Group SE 33,253 0.02
European Union 22,981 Schaeffler AG 16,984 0.01 5,133 EU Momentum Long 9,009 0.00 1,765 Symrise AG 584 0.00 4,308 MSGLGEU4 18,299 0.01 (6,153) ThyssenKrupp AG 6,170 0.00 2,383 STOXX Europe 600 Travel & Leisure 14,203 0.01 5,410 United Internet AG 6,115 0.00
41,511 0.02 (4,352) Wirecard AG 1,161 0.00 508,577 0.27
Finland 573 Cargotec OYJ 1,862 0.00 Hong Kong 10,722 Fortum OYJ 8,412 0.00 (149,000) Cathay Pacific Airways Limited 12,390 0.02 1,300 Huhtamaki OYJ 101 0.00 (123,819) China State Construction International Holdings Limited 3,456 0.00
203

Man Funds VI PlcSchedule of Investments as at 31 December 2016 (continued)Man GLG Global Equity Alternative (continued)Financial assets at fair value through profit or loss (continued)
Fair % of Fair % of Value Net Value Net
Nominal Description € Assets Nominal Description € AssetsContracts for difference (b) (continued) Contracts for difference (b) (continued)Hong Kong (continued) Netherlands
154,000 CSPC Pharmaceutical Group Limited 738 0.00 40,327 Aalberts Industries NV 29,945 0.02 40,000 Good Resources Holdings Limited 225 0.00 17,043 Altice SA 46,195 0.02 (135,000) HK Electric Investments 5,863 0.00 2,689 ASM International NV 3,212 0.00 (65,000) Hong Kong and China Gas Company Limited 4,171 0.00 15,916 Fugro NV 370 0.00 6,422 Jardine Strategic Hldgs Limited 1,885 0.00 14,252 Imcd Group NV 66,171 0.03 1,658 Lee & Man Paper Manufacturing 35 0.00 (1,105,025) ING Groep NV 248,631 0.14
28,763 0.02 107,734 Koninklijke Ahold Delhaize NV 95,796 0.05 (938) Koninklijke DSM NV 104 0.00
India 56,767 Koninklijke Philips NV 70,633 0.04 31,931 Berger Paints India Limited 3,959 0.00 2,489 Philips Lighting NV 1,600 0.00
11,723 Royal Dutch Shell Plc 24,495 0.01 Ireland 133,566 Royal Dutch Shell Plc 267,847 0.14
60,145 C&C Group Plc 8,767 0.00 20,788 SBM Offshore NV 30,327 0.02 2,899 CRH Plc 3,902 0.00 3,081 Tomtom NV 133 0.00 9,150 CRH Plc 9,889 0.01 885,459 0.47 11,830 DCC Plc 22,720 0.02 (46,993) Henderson Group Plc 2,652 0.00 Northern Mariana Islands 4,367 Kingspan Group Plc 3,186 0.00 22,724 Rockcastle Global Real Estat 709 0.00 1,880 Paddy Power Plc 2,613 0.00 12,398 Ryanair Holdings Plc 6,079 0.00 Norway 747 Shire Plc 10,205 0.01 2,514 Aker BP ASA 1,165 0.00 2,640 Smurfit Kappa Group Plc 3,817 0.00 26,027 Avance Gas Holding Limited 3,422 0.00 9,903 Smurfit Kappa Group Plc 7,265 0.00 94,567 BW LPG Limited 14,027 0.01
81,095 0.04 14,242 Golden Ocean Group Limited 3,642 0.00 32,147 Norsk Hydro ASA 10,244 0.01
Isle of Man (1,968) Norwegian Air Shuttle ASA 1,026 0.00 (57,353) Paysafe Group Plc 14,353 0.01 15,957 Orkla ASA 1,777 0.00
5,144 Skandiabanken ASA 5,666 0.00 Italy 19,081 Statoil ASA 30,627 0.02
(9,162) Azimut Holding SpA 18 0.00 6 Telenor ASA 2 0.00 (1,011) Buzzi Unicem SpA 174 0.00 8,279 Yara International ASA 27,391 0.01 (886) Luxottica Group SpA 71 0.00 98,989 0.05 (8,940) Moncler SpA 777 0.00 (137) Salvatore Ferragamo SpA 4 0.00 Pakistan
1,044 0.00 24,398 Fauji Fertilizer Company Limited 21 0.00 28,500 Habib Bank Limited 1,203 0.00
Japan 8,428 Lucky Cement 2,044 0.00 (2,400) AI Holdings Corporation 493 0.00 31,768 Oil & Gas Development Company 206 0.00 (15,100) Aiful Corporation 473 0.00 24,706 United Bank Limited 867 0.00 (2,500) Alfresa Holdings Corporation 1,511 0.00 4,341 0.00 200 Daito Pharmaceutical Company Limited 49 0.00 (1,300) Ichibanya Company Limited 195 0.00 Philippines (241,791) IHI Corporation 16,752 0.01 1,494,060 Metro Pacific Investments Company 9,244 0.00 3,800 Istyle Inc 2,098 0.00 (4,179) Japan Steel Works Limited 6,763 0.00 Portugal (32,744) Kubota Corporation 11,845 0.01 (766,256) Banco Comercial Portugese 136,356 0.08 700 Mimasu Semiconductor Industry 313 0.00 3 EDP Energias De Portugal SA - 0.00 (17,589) MISUMI Group Inc 21,494 0.01 21,681 Galp Energia SGPS SA 25,330 0.01 400 Nihon M&A Center Inc 682 0.00 161,686 0.09 (34,997) Nippon Paint Holdings Company Limited 87,319 0.05 1,104 Nippon View Hotel Company Limited 230 0.00 Qatar (2,700) Nipro Corporation 296 0.00 1,106 Barwa Real Estate Company 78 0.00 (800) Olympus Corporation 161 0.00 1,865 Commercial Bank of Qatar QSC 618 0.00 (6,300) Rakuten Inc 2,669 0.00 1,451 Doha Bank QSC 72 0.00 (4,300) Resorttrust Inc 1,014 0.00 1,736 Industries Qatar QSC 328 0.00 200 Ryohin Keikaku Company Limited 336 0.00 4,011 Masraf Al Rayan 84 0.00 (895) SMC Corporation 28,409 0.02 324 Qatar Electricity & Water Company 384 0.00 91,542 Sumitomo Chemical Company Limited 29,605 0.02 3,143 Qatar Gas Transport Company Nakilat New 6 0.00 (5,600) Sumitomo Corporation 1,523 0.00 1,366 Qatar Insurance Company 246 0.00 (400) Tamron Company Limited 171 0.00 437 Qatar International Islamic 38 0.00 (6,365) Toyo Seikan Group Holdings Limited 63 0.00 677 Qatar Islamic Bank 291 0.00 (800) Tsuruha Holdings Inc 2,681 0.00 2,371 Qatar National Bank 330 0.00 (3,300) Yamazaki Baking Company Limited 3,163 0.00 633 Qatar Navigation 233 0.00 (7,088) Zenkoku Hosho Company Limited 7,400 0.00 1,236 Qatar Telecom 97 0.00
227,708 0.12 2,038 United Development Company 330 0.00 3,825 Vodafone Qatar 40 0.00
Jersey Channel Islands 3,175 0.00 1,619 Randgold Resources Limited 9,465 0.01 9,828 Sanne Group Plc 17,844 0.01 Singapore
27,309 0.02 1,102 Broadcom Limited 22,395 0.01
Luxembourg South Africa 5,559 Aperam SA 19,253 0.01 (18,624) Grindrod Limited 343 0.00 (26,101) ArcelorMittal 32,697 0.02
51,950 0.03 South Korea 358 Samsung Electronics Company Limited 28,619 0.02
Malta (24,759) GVC Holdings Plc 4,820 0.00 Spain
(120,438) Abengoa S.A. 241 0.00 Mexico 3 Bankia SA - 0.00
(3,881) Cemex SAB SPONS 3,945 0.00 (96,865) Distribuidora Internacional De Alimentacion SA 155,755 0.08 3,764 Grupo Financiero Interacciones 347 0.00 7,493 Endesa SA 4,000 0.00
4,292 0.00 63,266 Ferrovial SA 18,663 0.01 (6,740) Gamesa Corporation Tecnologica SA 2,853 0.00
Monaco 5,041 Grifols SA 10,996 0.01 (6,561) Scorpio Tankers Inc 773 0.00 18,939 Iberdrola SA 9,328 0.00
(7,440) Mapfre SA 297 0.00 8,027 Merlin Properties SOCIMI SA 1,009 0.00 59,458 Obrascon Huarte Lain SA 9,513 0.01
204
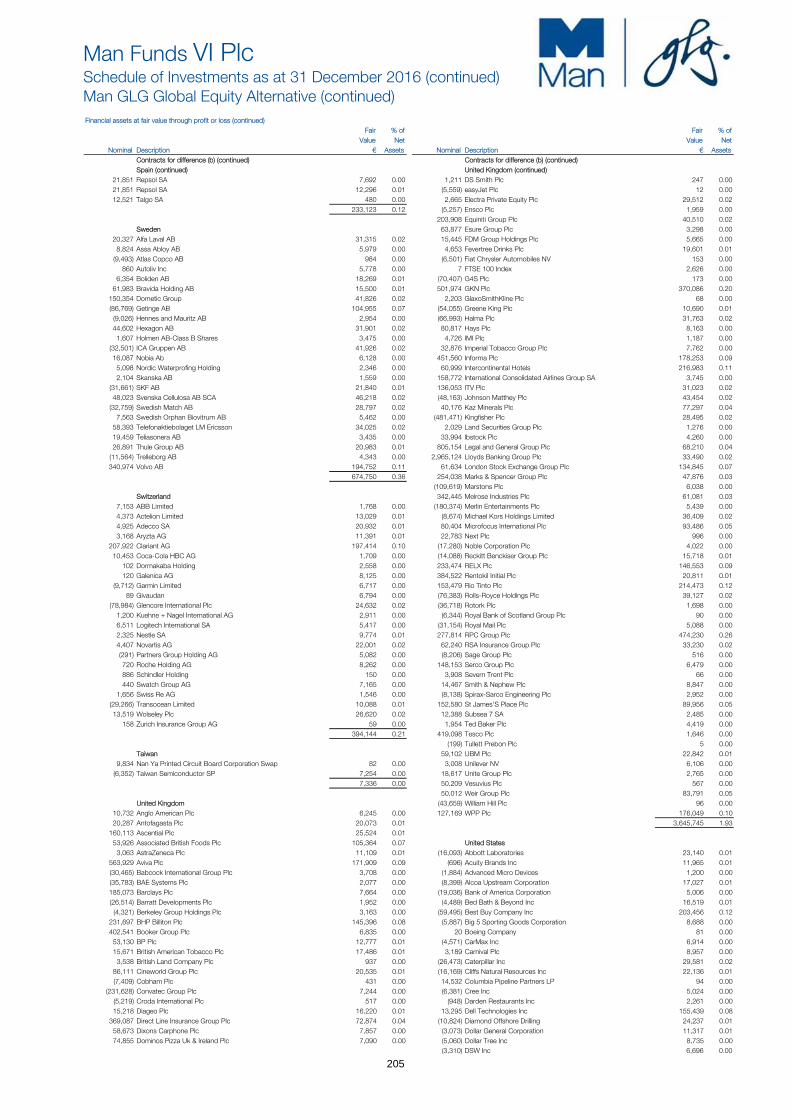
Man Funds VI PlcSchedule of Investments as at 31 December 2016 (continued)Man GLG Global Equity Alternative (continued)Financial assets at fair value through profit or loss (continued)
Fair % of Fair % of Value Net Value Net
Nominal Description € Assets Nominal Description € AssetsContracts for difference (b) (continued) Contracts for difference (b) (continued)Spain (continued) United Kingdom (continued)
21,851 Repsol SA 7,692 0.00 1,211 DS Smith Plc 247 0.00 21,851 Repsol SA 12,296 0.01 (5,559) easyJet Plc 12 0.00 12,521 Talgo SA 480 0.00 2,665 Electra Private Equity Plc 29,512 0.02
233,123 0.12 (5,257) Ensco Plc 1,959 0.00 203,908 Equiniti Group Plc 40,510 0.02
Sweden 63,877 Esure Group Plc 3,298 0.00 20,327 Alfa Laval AB 31,315 0.02 15,445 FDM Group Holdings Plc 5,665 0.00 8,824 Assa Abloy AB 5,979 0.00 4,653 Fevertree Drinks Plc 19,601 0.01 (9,493) Atlas Copco AB 984 0.00 (6,501) Fiat Chrysler Automobiles NV 153 0.00 860 Autoliv Inc 5,778 0.00 7 FTSE 100 Index 2,626 0.00 6,354 Boliden AB 18,269 0.01 (70,407) G4S Plc 173 0.00 61,983 Bravida Holding AB 15,500 0.01 501,974 GKN Plc 370,086 0.20 150,354 Dometic Group 41,826 0.02 2,203 GlaxoSmithKline Plc 68 0.00 (86,769) Getinge AB 104,955 0.07 (54,055) Greene King Plc 10,690 0.01 (9,026) Hennes and Mauritz AB 2,954 0.00 (66,993) Halma Plc 31,763 0.02 44,602 Hexagon AB 31,901 0.02 80,817 Hays Plc 8,163 0.00 1,607 Holmen AB-Class B Shares 3,475 0.00 4,726 IMI Plc 1,187 0.00 (32,501) ICA Gruppen AB 41,926 0.02 32,876 Imperial Tobacco Group Plc 7,762 0.00 16,087 Nobia Ab 6,128 0.00 451,560 Informa Plc 178,253 0.09 5,098 Nordic Waterprofing Holding 2,346 0.00 60,999 Intercontinental Hotels 216,983 0.11 2,104 Skanska AB 1,559 0.00 158,772 International Consolidated Airlines Group SA 3,745 0.00 (31,661) SKF AB 21,840 0.01 136,053 ITV Plc 31,023 0.02 48,023 Svenska Cellulosa AB SCA 46,218 0.02 (48,163) Johnson Matthey Plc 43,454 0.02 (32,759) Swedish Match AB 28,797 0.02 40,176 Kaz Minerals Plc 77,297 0.04 7,563 Swedish Orphan Biovitrum AB 5,462 0.00 (481,471) Kingfisher Plc 28,495 0.02 58,393 Telefonaktiebolaget LM Ericsson 34,025 0.02 2,029 Land Securities Group Plc 1,276 0.00 19,459 Teliasonera AB 3,435 0.00 33,994 lbstock Plc 4,260 0.00 26,891 Thule Group AB 20,983 0.01 805,154 Legal and General Group Plc 68,210 0.04 (11,564) Trelleborg AB 4,343 0.00 2,965,124 Lloyds Banking Group Plc 33,490 0.02 340,974 Volvo AB 194,752 0.11 61,634 London Stock Exchange Group Plc 134,845 0.07
674,750 0.36 254,038 Marks & Spencer Group Plc 47,876 0.03 (109,619) Marstons Plc 6,038 0.00
Switzerland 342,445 Melrose Industries Plc 61,081 0.03 7,153 ABB Limited 1,768 0.00 (180,374) Merlin Entertainments Plc 5,439 0.00 4,373 Actelion Limited 13,029 0.01 (8,674) Michael Kors Holdings Limited 36,409 0.02 4,925 Adecco SA 20,932 0.01 80,404 Microfocus International Plc 93,486 0.05 3,168 Aryzta AG 11,391 0.01 22,783 Next Plc 996 0.00 207,922 Clariant AG 197,414 0.10 (17,280) Noble Corporation Plc 4,022 0.00 10,453 Coca-Cola HBC AG 1,709 0.00 (14,088) Reckitt Benckiser Group Plc 15,718 0.01 102 Dormakaba Holding 2,558 0.00 233,474 RELX Plc 146,553 0.09 120 Galenica AG 8,125 0.00 384,522 Rentokil Initial Plc 20,811 0.01 (9,712) Garmin Limited 6,717 0.00 153,479 Rio Tinto Plc 214,473 0.12 89 Givaudan 6,794 0.00 (76,383) Rolls-Royce Holdings Plc 39,127 0.02 (78,984) Glencore International Plc 24,632 0.02 (36,718) Rotork Plc 1,698 0.00 1,200 Kuehne + Nagel International AG 2,911 0.00 (6,344) Royal Bank of Scotland Group Plc 90 0.00 6,511 Logitech International SA 5,417 0.00 (31,154) Royal Mail Plc 5,088 0.00 2,325 Nestle SA 9,774 0.01 277,814 RPC Group Plc 474,230 0.26 4,407 Novartis AG 22,001 0.02 62,240 RSA Insurance Group Plc 33,230 0.02 (291) Partners Group Holding AG 5,082 0.00 (8,206) Sage Group Plc 516 0.00 720 Roche Holding AG 8,262 0.00 148,153 Serco Group Plc 6,479 0.00 886 Schindler Holding 150 0.00 3,908 Severn Trent Plc 66 0.00 440 Swatch Group AG 7,165 0.00 14,467 Smith & Nephew Plc 8,847 0.00 1,656 Swiss Re AG 1,546 0.00 (8,138) Spirax-Sarco Engineering Plc 2,952 0.00 (29,266) Transocean Limited 10,088 0.01 152,580 St James'S Place Plc 89,956 0.05 13,519 Wolseley Plc 26,620 0.02 12,388 Subsea 7 SA 2,485 0.00 158 Zurich Insurance Group AG 59 0.00 1,954 Ted Baker Plc 4,419 0.00
394,144 0.21 419,098 Tesco Plc 1,646 0.00 (199) Tullett Prebon Plc 5 0.00
Taiwan 59,102 UBM Plc 22,842 0.01 9,834 Nan Ya Printed Circuit Board Corporation Swap 82 0.00 3,008 Unilever NV 6,106 0.00 (6,352) Taiwan Semiconductor SP 7,254 0.00 18,617 Unite Group Plc 2,765 0.00
7,336 0.00 50,209 Vesuvius Plc 567 0.00 50,012 Weir Group Plc 83,791 0.05
United Kingdom (43,659) William Hill Plc 96 0.00 10,732 Anglo American Plc 6,245 0.00 127,169 WPP Plc 176,049 0.10 20,287 Antofagasta Plc 20,073 0.01 3,645,745 1.93 160,113 Ascential Plc 25,524 0.01 53,926 Associated British Foods Plc 105,364 0.07 United States 3,063 AstraZeneca Plc 11,109 0.01 (16,093) Abbott Laboratories 23,140 0.01 563,929 Aviva Plc 171,909 0.09 (696) Acuity Brands Inc 11,965 0.01 (30,465) Babcock International Group Plc 3,708 0.00 (1,884) Advanced Micro Devices 1,200 0.00 (35,783) BAE Systems Plc 2,077 0.00 (8,399) Alcoa Upstream Corporation 17,027 0.01 185,073 Barclays Plc 7,664 0.00 (19,036) Bank of America Corporation 5,006 0.00 (26,514) Barratt Developments Plc 1,952 0.00 (4,489) Bed Bath & Beyond Inc 16,519 0.01 (4,321) Berkeley Group Holdings Plc 3,163 0.00 (59,495) Best Buy Company Inc 203,456 0.12 231,697 BHP Billiton Plc 145,396 0.08 (5,887) Big 5 Sporting Goods Corporation 8,688 0.00 402,541 Booker Group Plc 6,835 0.00 20 Boeing Company 81 0.00 53,130 BP Plc 12,777 0.01 (4,571) CarMax Inc 6,914 0.00 15,671 British American Tobacco Plc 17,486 0.01 3,189 Carnival Plc 8,957 0.00 3,538 British Land Company Plc 937 0.00 (26,473) Caterpillar Inc 29,581 0.02 86,111 Cineworld Group Plc 20,535 0.01 (16,169) Cliffs Natural Resources Inc 22,136 0.01 (7,409) Cobham Plc 431 0.00 14,532 Columbia Pipeline Partners LP 94 0.00 (231,628) Convatec Group Plc 7,244 0.00 (6,381) Cree Inc 5,024 0.00 (5,219) Croda International Plc 517 0.00 (948) Darden Restaurants Inc 2,261 0.00 15,218 Diageo Plc 16,220 0.01 13,295 Dell Technologies Inc 155,439 0.08 369,087 Direct Line Insurance Group Plc 72,874 0.04 (10,824) Diamond Offshore Drilling 24,237 0.01 58,673 Dixons Carphone Plc 7,857 0.00 (3,073) Dollar General Corporation 11,317 0.01 74,855 Dominos Pizza Uk & Ireland Plc 7,090 0.00 (5,060) Dollar Tree Inc 8,735 0.00
(3,310) DSW Inc 6,696 0.00
205
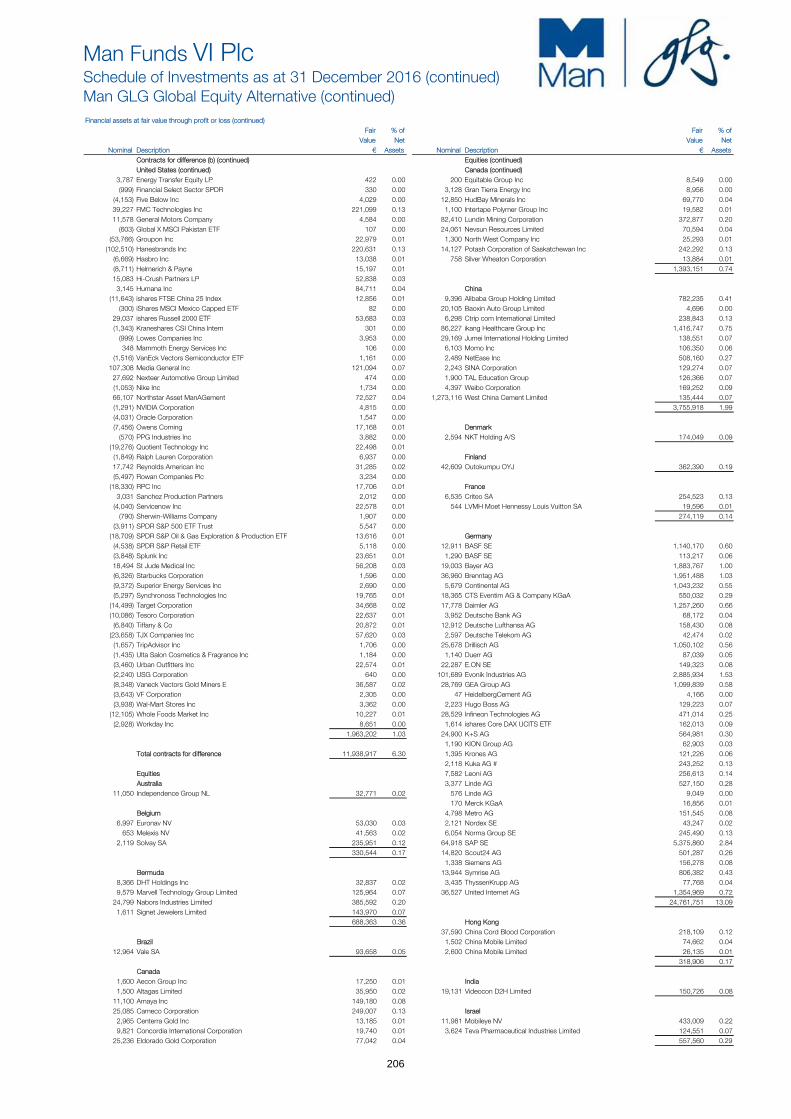
Man Funds VI PlcSchedule of Investments as at 31 December 2016 (continued)Man GLG Global Equity Alternative (continued)Financial assets at fair value through profit or loss (continued)
Fair % of Fair % of Value Net Value Net
Nominal Description € Assets Nominal Description € AssetsContracts for difference (b) (continued) Equities (continued)United States (continued) Canada (continued)
3,787 Energy Transfer Equity LP 422 0.00 200 Equitable Group Inc 8,549 0.00 (999) Financial Select Sector SPDR 330 0.00 3,128 Gran Tierra Energy Inc 8,956 0.00 (4,153) Five Below Inc 4,029 0.00 12,850 HudBay Minerals Inc 69,770 0.04 39,227 FMC Technologies Inc 221,099 0.13 1,100 Intertape Polymer Group Inc 19,582 0.01 11,578 General Motors Company 4,584 0.00 82,410 Lundin Mining Corporation 372,877 0.20 (603) Global X MSCI Pakistan ETF 107 0.00 24,061 Nevsun Resources Limited 70,594 0.04 (53,766) Groupon Inc 22,979 0.01 1,300 North West Company Inc 25,293 0.01 (102,510) Hanesbrands Inc 220,631 0.13 14,127 Potash Corporation of Saskatchewan Inc 242,292 0.13 (6,669) Hasbro Inc 13,038 0.01 758 Silver Wheaton Corporation 13,884 0.01 (8,711) Helmerich & Payne 15,197 0.01 1,393,151 0.74 15,083 Hi-Crush Partners LP 52,838 0.03 3,145 Humana Inc 84,711 0.04 China (11,643) ishares FTSE China 25 Index 12,856 0.01 9,396 Alibaba Group Holding Limited 782,235 0.41 (300) iShares MSCI Mexico Capped ETF 82 0.00 20,105 Baoxin Auto Group Limited 4,696 0.00 29,037 ishares Russell 2000 ETF 53,683 0.03 6,298 Ctrip com International Limited 238,843 0.13 (1,343) Kraneshares CSI China Intern 301 0.00 86,227 ikang Healthcare Group Inc 1,416,747 0.75 (999) Lowes Companies Inc 3,953 0.00 29,169 Jumei International Holding Limited 138,551 0.07 348 Mammoth Energy Services Inc 106 0.00 6,103 Momo Inc 106,350 0.06 (1,516) VanEck Vectors Semiconductor ETF 1,161 0.00 2,489 NetEase Inc 508,160 0.27 107,308 Media General Inc 121,094 0.07 2,243 SINA Corporation 129,274 0.07 27,692 Nexteer Automotive Group Limited 474 0.00 1,900 TAL Education Group 126,366 0.07 (1,053) Nike Inc 1,734 0.00 4,397 Weibo Corporation 169,252 0.09 66,107 Northstar Asset ManAGement 72,527 0.04 1,273,116 West China Cement Limited 135,444 0.07 (1,291) NVIDIA Corporation 4,815 0.00 3,755,918 1.99 (4,031) Oracle Corporation 1,547 0.00 (7,456) Owens Corning 17,168 0.01 Denmark (570) PPG Industries Inc 3,882 0.00 2,594 NKT Holding A/S 174,049 0.09 (19,276) Quotient Technology Inc 22,498 0.01 (1,849) Ralph Lauren Corporation 6,937 0.00 Finland 17,742 Reynolds American Inc 31,285 0.02 42,609 Outokumpu OYJ 362,390 0.19 (5,497) Rowan Companies Plc 3,234 0.00 (18,330) RPC Inc 17,706 0.01 France 3,031 Sanchez Production Partners 2,012 0.00 6,535 Criteo SA 254,523 0.13 (4,040) Servicenow Inc 22,578 0.01 544 LVMH Moet Hennessy Louis Vuitton SA 19,596 0.01 (790) Sherwin-Williams Company 1,907 0.00 274,119 0.14 (3,911) SPDR S&P 500 ETF Trust 5,547 0.00 (18,709) SPDR S&P Oil & Gas Exploration & Production ETF 13,616 0.01 Germany (4,538) SPDR S&P Retail ETF 5,118 0.00 12,911 BASF SE 1,140,170 0.60 (3,848) Splunk Inc 23,651 0.01 1,290 BASF SE 113,217 0.06 18,494 St Jude Medical Inc 56,208 0.03 19,003 Bayer AG 1,883,767 1.00 (6,326) Starbucks Corporation 1,596 0.00 36,960 Brenntag AG 1,951,488 1.03 (9,372) Superior Energy Services Inc 2,690 0.00 5,679 Continental AG 1,043,232 0.55 (5,297) Synchronoss Technologies Inc 19,765 0.01 18,365 CTS Eventim AG & Company KGaA 550,032 0.29 (14,499) Target Corporation 34,668 0.02 17,778 Daimler AG 1,257,260 0.66 (10,086) Tesoro Corporation 22,637 0.01 3,952 Deutsche Bank AG 68,172 0.04 (6,840) Tiffany & Co 20,872 0.01 12,912 Deutsche Lufthansa AG 158,430 0.08 (23,658) TJX Companies Inc 57,620 0.03 2,597 Deutsche Telekom AG 42,474 0.02 (1,657) TripAdvisor Inc 1,706 0.00 25,678 Drillisch AG 1,050,102 0.56 (1,435) Ulta Salon Cosmetics & Fragrance Inc 1,184 0.00 1,140 Duerr AG 87,039 0.05 (3,460) Urban Outfitters Inc 22,574 0.01 22,287 E.ON SE 149,323 0.08 (2,240) USG Corporation 640 0.00 101,689 Evonik Industries AG 2,885,934 1.53 (8,348) Vaneck Vectors Gold Miners E 36,587 0.02 28,769 GEA Group AG 1,099,839 0.58 (3,643) VF Corporation 2,305 0.00 47 HeidelbergCement AG 4,166 0.00 (3,938) Wal-Mart Stores Inc 3,362 0.00 2,223 Hugo Boss AG 129,223 0.07 (12,105) Whole Foods Market Inc 10,227 0.01 28,529 Infineon Technologies AG 471,014 0.25 (2,928) Workday Inc 8,651 0.00 1,614 ishares Core DAX UCITS ETF 162,013 0.09
1,963,202 1.03 24,900 K+S AG 564,981 0.30 1,190 KION Group AG 62,903 0.03
Total contracts for difference 11,938,917 6.30 1,395 Krones AG 121,226 0.06 2,118 Kuka AG # 243,252 0.13
Equities 7,582 Leoni AG 256,613 0.14 Australia 3,377 Linde AG 527,150 0.28
11,050 Independence Group NL 32,771 0.02 576 Linde AG 9,049 0.00 170 Merck KGaA 16,856 0.01
Belgium 4,798 Metro AG 151,545 0.08 6,997 Euronav NV 53,030 0.03 2,121 Nordex SE 43,247 0.02 653 Melexis NV 41,563 0.02 6,054 Norma Group SE 245,490 0.13 2,119 Solvay SA 235,951 0.12 64,918 SAP SE 5,375,860 2.84
330,544 0.17 14,820 Scout24 AG 501,287 0.26 1,338 Siemens AG 156,278 0.08
Bermuda 13,944 Symrise AG 806,382 0.43 8,366 DHT Holdings Inc 32,837 0.02 3,435 ThyssenKrupp AG 77,768 0.04 9,579 Marvell Technology Group Limited 125,964 0.07 36,527 United Internet AG 1,354,969 0.72 24,799 Nabors Industries Limited 385,592 0.20 24,761,751 13.09 1,611 Signet Jewelers Limited 143,970 0.07
688,363 0.36 Hong Kong 37,590 China Cord Blood Corporation 218,109 0.12
Brazil 1,502 China Mobile Limited 74,662 0.04 12,964 Vale SA 93,658 0.05 2,600 China Mobile Limited 26,135 0.01
318,906 0.17 Canada
1,600 Aecon Group Inc 17,250 0.01 India 1,500 Altagas Limited 35,950 0.02 19,131 Videocon D2H Limited 150,726 0.08 11,100 Amaya Inc 149,180 0.08 25,085 Cameco Corporation 249,007 0.13 Israel 2,965 Centerra Gold Inc 13,185 0.01 11,981 Mobileye NV 433,009 0.22 9,821 Concordia International Corporation 19,740 0.01 3,624 Teva Pharmaceutical Industries Limited 124,551 0.07 25,236 Eldorado Gold Corporation 77,042 0.04 557,560 0.29
206

Man Funds VI PlcSchedule of Investments as at 31 December 2016 (continued)Man GLG Global Equity Alternative (continued)Financial assets at fair value through profit or loss (continued)
Fair % of Fair % of Value Net Value Net
Nominal Description € Assets Nominal Description € AssetsEquities (continued) Equities (continued)Italy Japan (continued)
46,463 Amplifon SpA 420,490 0.21 65,116 Tokyu Fudosan Holdings Corporation 365,223 0.19 4,453 Buzzi Unicem SpA 100,237 0.05 6,000 Towa Corporation 80,328 0.04 1,004 Buzzi Unicem SpA 11,576 0.01 13,968 Trusco Nakayama Corporation 277,950 0.15 1,207 Ferrari NV 66,747 0.04 213,840 Ube Industries Limited 425,870 0.23 2,057 Ferrari NV 113,386 0.06 477 West Japan Railway Company 27,813 0.01 25,989 Intesa Sanpaolo SpA 63,049 0.03 6,265 Zenkoku Hosho Company Limited 191,228 0.10 12,241 Leonardo Finmeccanica SpA 163,295 0.09 21,823,898 11.53 12,586 Luxottica Group SpA 643,145 0.34 115,330 Moncler SpA 1,906,405 1.01 Jersey Channel Islands 24,271 Prada SpA 78,058 0.04 5,106 Sanne Group Plc 34,993 0.02 116,200 Prysmian SpA 2,835,280 1.50 311,155 Saipem SpA 166,468 0.09 Netherlands 26,813 Salvatore Ferragamo SpA 601,416 0.32 784 ASML Holding NV 83,399 0.04 602,881 Telecom Italia SpA 504,611 0.27 1,105,025 ING Groep NV 14,774,184 7.81 19,186 Yoox Net-A-Porter Group SpA 516,871 0.27 9,438 Nxp Semiconductors NV 877,003 0.46
8,191,034 4.33 4,820 Qiagen NV 128,598 0.07 15,863,184 8.38
Japan 15,800 AEON Financial Service Company Limited 266,757 0.14 Singapore 9,455 Aisin Seiki Company Limited 389,665 0.21 3,661 Broadcom Limited 613,562 0.32 4,564 Asahi Intecc Company Limited 175,666 0.09 3,800 Chudenko Corporation 79,725 0.04 Sweden 13,111 Coca-Cola West Company Limited 367,153 0.19 1,166 Autoliv Inc 125,094 0.07 5,302 Daiwa House Industry Company Limited 137,743 0.07 74,985 Dometic Group 523,926 0.27 26,449 DIC Corporation 763,237 0.40 649,020 0.34 54,822 DMG Mori Company Limited 631,906 0.33 6,535 Don Quijote Holdings Company Limited 229,749 0.12 Switzerland 2,654 East Japan Railway Company 217,893 0.12 1,516 Actelion Limited 78,261 0.04 8,100 Electric Power Development Company Limited 177,116 0.09 920 ST Microelectronics NV 9,936 0.01 1,374 Fast Retailing Company Limited 467,193 0.25 4,470 Syngenta AG 335,012 0.18 36,900 Financial Products Group Company Limited 302,649 0.16 59,270 Weatherford International Plc 280,405 0.14 6,269 Fuji Heavy Industries Limited 243,176 0.13 703,614 0.37 11,500 FULLCAST Holdings Company Limited 90,115 0.05 6,861 Hamamatsu Photonics KK 171,496 0.09 United Kingdom 13,964 Hitachi Construction Machinery Company Limited 287,292 0.15 41,448 BHP Billiton Plc 1,236,268 0.66 29,257 Honda Motor Company Limited 812,161 0.43 2,062 BP Plc 73,077 0.04 28,368 Isetan Mitsukoshi Holdings Limited 290,550 0.15 17,455 CNH Industrial NV 144,266 0.08 51,626 Isuzu Motors Limited 621,506 0.33 6,885 Delphi Automotive Plc 439,635 0.23 10,400 Japan Tobacco Inc 324,966 0.17 18,444 Fiat Chrysler Automobiles NV 159,817 0.08 54,527 JGC Corporation 941,429 0.50 17,640 Fiat Chrysler Automobiles NV 152,526 0.08 341 Kaneka Corporation 2,639 0.00 1,107 Next Plc 64,623 0.03 16,436 Kansai Paint Company Limited 287,648 0.15 2,270,212 1.20 800 Kawada Technologies Inc 51,504 0.03 31,700 KH Neochem Company Limited 316,946 0.17 United States 1,055 Koito Manufacturing Company Limited 53,084 0.03 2,901 Abeona Therapeutics Inc 13,340 0.01 14,649 Komatsu Limited 315,258 0.17 1,271 ABM Industries Inc 49,213 0.03 5,895 Kose Corporation 465,291 0.25 3,242 Adobe Systems Inc 316,439 0.17 9,690 K's Holdings Corporation 161,236 0.09 18,422 Advance Auto Parts Inc 2,953,808 1.56 12,626 Lixil Group Corporation 272,388 0.14 3,796 Akamai Technologies Inc 239,978 0.13 4,100 Maruwa Company Limited 128,978 0.07 10,760 Alere Inc 397,551 0.21 5,000 Megachips Corporation 105,145 0.06 1,382 Alphabet Inc 1,038,318 0.55 5,800 Meitec Corporation 210,981 0.11 2,477 Amazon.com Inc 1,761,013 0.93 31,113 Mitsubishi Chemical Holdings Corporation 191,705 0.10 7,277 AMC Networks Inc 361,108 0.19 76,177 Mitsubishi Electric Corporation 1,009,020 0.53 3,016 Anadarko Petroleum Corporation 199,389 0.11 142,311 Mitsubishi Heavy Industries Limited 616,114 0.33 448 Anthera Pharmaceuticals Inc 276 0.00 19,400 Mitsui & Company Limited 253,419 0.13 27,110 Aptevo Therapeutics Inc 62,715 0.03 4,624 Mitsui Chemicals Inc 19,733 0.01 2,826 Arch Coal Inc 209,120 0.11 10,610 Mitsui Fudosan Company Limited 233,294 0.12 1,670 Asbury Automotive Group Inc 97,690 0.05 140,600 Mizuho Financial Group Inc 239,780 0.13 5,869 Atwood Oceanics Inc 73,060 0.04 17,721 NGK Insulators Limited 326,559 0.17 148 Autozone Inc 110,821 0.06 6,985 NGK Spark Plug Company Limited 147,512 0.08 1,912 Baker Hughes Inc 117,774 0.06 7,893 Nippo Corporation 139,933 0.07 2,811 Basic Energy Services Inc 94,211 0.05 23,612 Nippon Concrete Industries Company Limited 65,258 0.03 7,358 Bill Barrett Corporation 48,763 0.03 6,609 Nippon Telegraph & Telephone Corporation 263,886 0.14 5,462 Boulevard Acquisition Corporation II 52,613 0.03 31,000 Nishimatsu Construction Company Limited 142,626 0.08 164 Burlington Stores Inc 13,178 0.01 2,981 Nissan Motor Company Limited 56,525 0.03 4,767 Cabot Oil & Gas Corporation 105,577 0.06 10,000 Nomura Real Estate Holdings Inc 161,599 0.09 11,456 Callon Petroleum Company 166,939 0.09 15,000 Oki Electric Industry Company Limited 200,210 0.11 2,962 Cedar Fair LP 180,290 0.10 3,117 Olympus Corporation 102,362 0.05 1,482 Charter Communications Inc 404,548 0.21 21,280 Omron Corporation 775,810 0.41 65,319 Chelsea Therapeutics International Limited # - 0.00 12,452 Pigeon Corporation 302,543 0.16 3,154 Cheniere Energy Inc 123,887 0.07 2,200 Pola Orbis Holdings Inc 172,572 0.09 3,358 Coach Inc 111,493 0.06 4,301 Ryohin Keikaku Company Limited 800,970 0.42 3,014 Coca-Cola Company 118,474 0.06 14,400 San-In Godo Bank Limited 114,127 0.06 1,360 Comcast Corporation 89,033 0.05 14,800 Sanwa Holdings Corporation 134,140 0.07 2,653 Commercial Metals Company 54,783 0.03 15,229 Sekisui House Limited 240,838 0.13 740 Community Bank System Inc 43,351 0.02 4,000 Shima Seiki Manufacturing Limited 128,596 0.07 818 Cooper Tire & Rubber Company 30,130 0.02 9,853 Shimadzu Corporation 149,132 0.08 1,658 Costco Wholesale Corporation 251,683 0.13 45,878 Showa Denko K.K. 624,283 0.33 1,711 Cypress Semiconductor Corporation 18,558 0.01 6,747 Sumco Corporation 82,815 0.04 2,149 Deckers Outdoor Corporation 112,854 0.06 18,000 Sumitomo Corporation 201,259 0.11 4,942 Dell Technologies Inc 257,560 0.14 80,992 Sumitomo Heavy Industries Limited 495,745 0.26 8,160 Devon Energy Corporation 353,323 0.19 7,197 Sumitomo Mitsui Financial Group Inc 260,920 0.14 20,819 Dick'S Sporting Goods Inc 1,048,105 0.55 32,000 Sumitomo Warehouse Company Limited 160,753 0.08 4,841 Dollar General Corporation 339,960 0.18 2,716 Sysmex Corporation 149,465 0.08 1,989 Double Eagle Acquisition Corporation 19,782 0.01 7,600 Tamron Company Limited 119,911 0.06 2,125 Dow Chemical Company 115,281 0.06 19,090 Temp Holdings Company Limited 281,336 0.15 1,762 Emerge Energy Services LP 20,564 0.01 34,751 THK Company Limited 730,495 0.39 1,165 Esterline Technologies Corporation 98,524 0.05
207
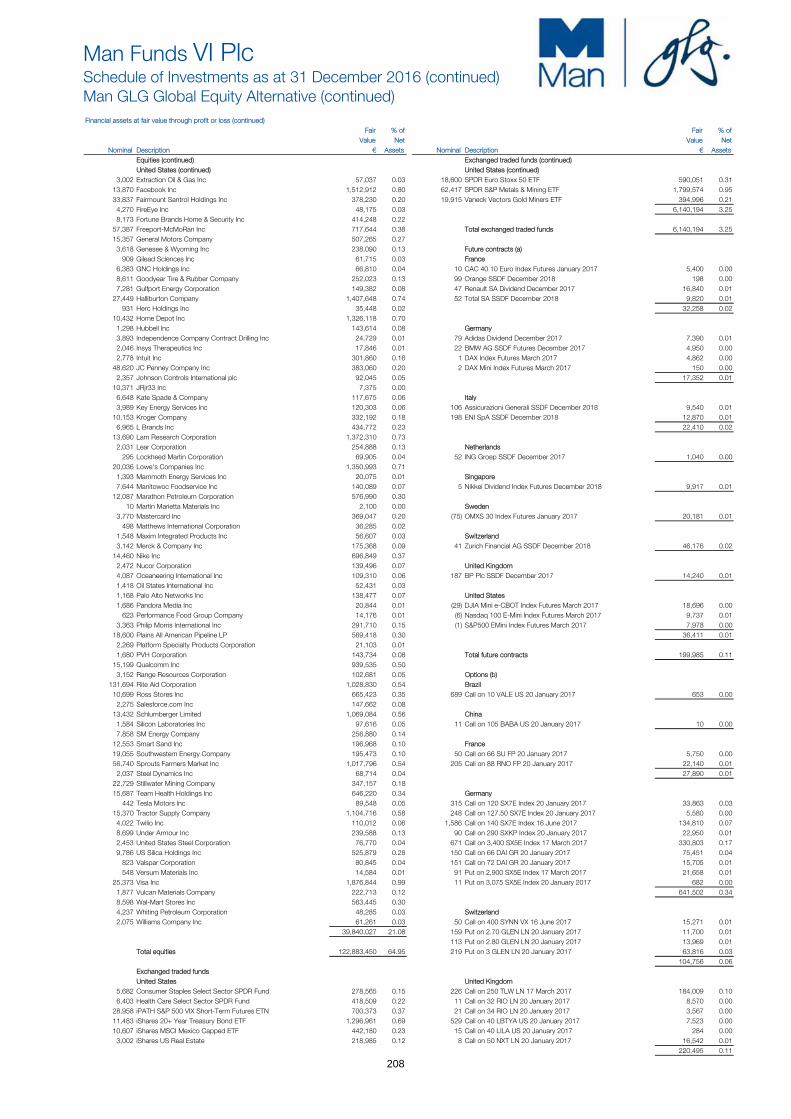
Man Funds VI PlcSchedule of Investments as at 31 December 2016 (continued)Man GLG Global Equity Alternative (continued)Financial assets at fair value through profit or loss (continued)
Fair % of Fair % of Value Net Value Net
Nominal Description € Assets Nominal Description € AssetsEquities (continued) Exchanged traded funds (continued)United States (continued) United States (continued)
3,002 Extraction Oil & Gas Inc 57,037 0.03 18,600 SPDR Euro Stoxx 50 ETF 590,051 0.31 13,870 Facebook Inc 1,512,912 0.80 62,417 SPDR S&P Metals & Mining ETF 1,799,574 0.95 33,837 Fairmount Santrol Holdings Inc 378,230 0.20 19,915 Vaneck Vectors Gold Miners ETF 394,996 0.21 4,270 FireEye Inc 48,175 0.03 6,140,194 3.25 8,173 Fortune Brands Home & Security Inc 414,248 0.22 57,387 Freeport-McMoRan Inc 717,644 0.38 Total exchanged traded funds 6,140,194 3.25 15,357 General Motors Company 507,265 0.27 3,618 Genesee & Wyoming Inc 238,090 0.13 Future contracts (a) 909 Gilead Sciences Inc 61,715 0.03 France 6,383 GNC Holdings Inc 66,810 0.04 10 CAC 40 10 Euro Index Futures January 2017 5,400 0.00 8,611 Goodyear Tire & Rubber Company 252,023 0.13 99 Orange SSDF December 2018 198 0.00 7,281 Gulfport Energy Corporation 149,382 0.08 47 Renault SA Dividend December 2017 16,840 0.01 27,449 Halliburton Company 1,407,648 0.74 52 Total SA SSDF December 2018 9,820 0.01 931 Herc Holdings Inc 35,448 0.02 32,258 0.02 10,432 Home Depot Inc 1,326,118 0.70 1,298 Hubbell Inc 143,614 0.08 Germany 3,893 Independence Company Contract Drilling Inc 24,729 0.01 79 Adidas Dividend December 2017 7,390 0.01 2,046 Insys Therapeutics Inc 17,846 0.01 22 BMW AG SSDF Futures December 2017 4,950 0.00 2,778 Intuit Inc 301,860 0.16 1 DAX Index Futures March 2017 4,862 0.00 48,620 JC Penney Company Inc 383,060 0.20 2 DAX Mini Index Futures March 2017 150 0.00 2,357 Johnson Controls International plc 92,045 0.05 17,352 0.01 10,371 JRjr33 Inc 7,375 0.00 6,648 Kate Spade & Company 117,675 0.06 Italy 3,989 Key Energy Services Inc 120,303 0.06 106 Assicurazioni Generali SSDF December 2018 9,540 0.01 10,153 Kroger Company 332,192 0.18 198 ENI SpA SSDF December 2018 12,870 0.01 6,965 L Brands Inc 434,772 0.23 22,410 0.02 13,690 Lam Research Corporation 1,372,310 0.73 2,031 Lear Corporation 254,888 0.13 Netherlands 295 Lockheed Martin Corporation 69,905 0.04 52 ING Groep SSDF December 2017 1,040 0.00 20,036 Lowe's Companies Inc 1,350,993 0.71 1,393 Mammoth Energy Services Inc 20,075 0.01 Singapore 7,644 Manitowoc Foodservice Inc 140,089 0.07 5 Nikkei Dividend Index Futures December 2018 9,917 0.01 12,087 Marathon Petroleum Corporation 576,990 0.30 10 Martin Marietta Materials Inc 2,100 0.00 Sweden 3,770 Mastercard Inc 369,047 0.20 (75) OMXS 30 Index Futures January 2017 20,181 0.01 498 Matthews International Corporation 36,285 0.02 1,548 Maxim Integrated Products Inc 56,607 0.03 Switzerland 3,142 Merck & Company Inc 175,368 0.09 41 Zurich Financial AG SSDF December 2018 46,176 0.02 14,460 Nike Inc 696,849 0.37 2,472 Nucor Corporation 139,496 0.07 United Kingdom 4,087 Oceaneering International Inc 109,310 0.06 187 BP Plc SSDF December 2017 14,240 0.01 1,418 Oil States International Inc 52,431 0.03 1,168 Palo Alto Networks Inc 138,477 0.07 United States 1,686 Pandora Media Inc 20,844 0.01 (29) DJIA Mini e-CBOT Index Futures March 2017 18,696 0.00 623 Performance Food Group Company 14,176 0.01 (6) Nasdaq 100 E-Mini Index Futures March 2017 9,737 0.01 3,363 Philip Morris International Inc 291,710 0.15 (1) S&P500 EMini Index Futures March 2017 7,978 0.00 18,600 Plains All American Pipeline LP 569,418 0.30 36,411 0.01 2,269 Platform Specialty Products Corporation 21,103 0.01 1,680 PVH Corporation 143,734 0.08 Total future contracts 199,985 0.11 15,199 Qualcomm Inc 939,535 0.50 3,152 Range Resources Corporation 102,681 0.05 Options (b) 131,694 Rite Aid Corporation 1,028,830 0.54 Brazil 10,699 Ross Stores Inc 665,423 0.35 689 Call on 10 VALE US 20 January 2017 653 0.00 2,275 Salesforce.com Inc 147,662 0.08 13,432 Schlumberger Limited 1,069,084 0.56 China 1,584 Silicon Laboratories Inc 97,616 0.05 11 Call on 105 BABA US 20 January 2017 10 0.00 7,858 SM Energy Company 256,880 0.14 12,553 Smart Sand Inc 196,968 0.10 France 19,055 Southwestern Energy Company 195,473 0.10 50 Call on 66 SU FP 20 January 2017 5,750 0.00 56,740 Sprouts Farmers Market Inc 1,017,796 0.54 205 Call on 88 RNO FP 20 January 2017 22,140 0.01 2,037 Steel Dynamics Inc 68,714 0.04 27,890 0.01 22,729 Stillwater Mining Company 347,157 0.18 15,687 Team Health Holdings Inc 646,220 0.34 Germany 442 Tesla Motors Inc 89,548 0.05 315 Call on 120 SX7E Index 20 January 2017 33,863 0.03 15,370 Tractor Supply Company 1,104,716 0.58 248 Call on 127.50 SX7E Index 20 January 2017 5,580 0.00 4,022 Twilio Inc 110,012 0.06 1,586 Call on 140 SX7E Index 16 June 2017 134,810 0.07 8,699 Under Armour Inc 239,588 0.13 90 Call on 290 SXKP Index 20 January 2017 22,950 0.01 2,453 United States Steel Corporation 76,770 0.04 671 Call on 3,400 SX5E Index 17 March 2017 330,803 0.17 9,786 US Silica Holdings Inc 525,879 0.28 150 Call on 66 DAI GR 20 January 2017 75,451 0.04 823 Valspar Corporation 80,845 0.04 151 Call on 72 DAI GR 20 January 2017 15,705 0.01 548 Versum Materials Inc 14,584 0.01 91 Put on 2,900 SX5E Index 17 March 2017 21,658 0.01 25,373 Visa Inc 1,876,844 0.99 11 Put on 3,075 SX5E Index 20 January 2017 682 0.00 1,877 Vulcan Materials Company 222,713 0.12 641,502 0.34 8,598 Wal-Mart Stores Inc 563,445 0.30 4,237 Whiting Petroleum Corporation 48,285 0.03 Switzerland 2,075 Williams Company Inc 61,261 0.03 50 Call on 400 SYNN VX 16 June 2017 15,271 0.01
39,840,027 21.08 159 Put on 2.70 GLEN LN 20 January 2017 11,700 0.01 113 Put on 2.80 GLEN LN 20 January 2017 13,969 0.01
Total equities 122,883,450 64.95 219 Put on 3 GLEN LN 20 January 2017 63,816 0.03 104,756 0.06
Exchanged traded fundsUnited States United Kingdom
5,682 Consumer Staples Select Sector SPDR Fund 278,565 0.15 226 Call on 250 TLW LN 17 March 2017 184,009 0.10 6,403 Health Care Select Sector SPDR Fund 418,509 0.22 11 Call on 32 RIO LN 20 January 2017 8,570 0.00 28,958 iPATH S&P 500 VIX Short-Term Futures ETN 700,373 0.37 21 Call on 34 RIO LN 20 January 2017 3,567 0.00 11,483 iShares 20+ Year Treasury Bond ETF 1,296,961 0.69 529 Call on 40 LBTYA US 20 January 2017 7,523 0.00 10,607 iShares MSCI Mexico Capped ETF 442,180 0.23 15 Call on 40 LILA US 20 January 2017 284 0.00 3,002 iShares US Real Estate 218,985 0.12 8 Call on 50 NXT LN 20 January 2017 16,542 0.01
220,495 0.11
208

Man Funds VI PlcSchedule of Investments as at 31 December 2016 (continued)Man GLG Global Equity Alternative (continued)Financial assets at fair value through profit or loss (continued)
Fair % of Fair % of Value Net Value Net
Nominal Description € Assets Nominal Description € AssetsOptions (b) (continued)United States
106 Call on 17 FCX US 20 January 2017 101 0.00 174 Call on 17 VIX Index 18 January 2017 14,187 0.01 78 Call on 2,305 SPX Index 20 January 2017 18,858 0.01 115 Call on 25 GNC US 20 January 2017 545 0.00 95 Call on 29 VXX US 20 January 2017 6,485 0.00 69 Call on 30 WFM US 19 January 2017 26,560 0.01 76 Call on 36 RRC US 16 June 2017 25,219 0.01 279 Call on 54 NKE US 20 January 2017 3,174 0.00 42 Put on 102 NVDA US 06 January 2017 5,654 0.00 45 Put on 11.50 AMD US 06 January 2017 2,133 0.00 426 Put on 125 IWM US 17 February 2017 48,063 0.04 152 Put on 134 IWM US 17 February 2017 48,133 0.04 4 Put on 2,230 SPX Index 20 January 2017 7,774 0.00 76 Put on 21 BAC US 20 January 2017 1,801 0.00 76 Put on 21.50 BAC US 13 January 2017 2,018 0.00 15 Put on 235 GS US 20 January 2017 6,256 0.00 7 Put on 720 AMZN US 20 January 2017 3,955 0.00
220,916 0.12
Total options 1,216,222 0.64
Preferred stocksGermany
1,872 Jungheinrich AG 51,031 0.03 10,119 Schaeffler AG 142,222 0.07
193,253 0.10
Total preferred stocks 193,253 0.10
Real Estate Investment TrustCanada
1,000 Allied Properties Real Estate Investment Trust 25,416 0.01 800 Boardwalk Real Estate Investment Trust 27,516 0.02
52,932 0.03
United States 2,389 Apollo Commercial Real Estate Finance Inc 37,644 0.02
Total real estate investment trust 90,576 0.05
RightNorway
(625) Petroleum Geo-Services ASA # - 0.00
Total right - 0.00
Total return swaps (b)European Union
(6,177) Citi Price Momentum Pure Europe 13,794 0.01
Finland (36,955) Outotec OYJ 1,035 0.00
South Korea (2,362,780) KOSPI 200 Index KMH7 10 March 2017 1,866 0.00
Total total return swaps 16,695 0.01
Warrants (b)Canada
152,016 Growmax Resources Corporation - 0.00 36,978 HudBay Minerals Inc 11,895 0.01
11,895 0.01
United States 1,955 Basic Energy SVSC - 0.00 8,780 CVSL Inc - 0.00 94,883 Kinder Morgan Inc 495 0.00 113 Scynexis Inc - 0.00
495 0.00
Total warrants 12,390 0.01
209

Man Funds VI PlcSchedule of Investments as at 31 December 2016 (continued)Man GLG Global Equity Alternative (continued)Financial assets at fair value through profit or loss (continued)
Forward currency contracts (note 4) (b)*Unrealised % of
gain Net Amount Receivable Amount Payable Maturity Date Contracts € Assets
€2,785 CHF2,982 05 January 2017 1 3 0.00 €10,413,876 GBP8,768,698 05 January 2017 4 143,570 0.07 €11,551 GBP9,732 06 January 2017 1 153 0.00 €18,779,290 JPY2,290,957,929 05 January 2017 4 155,368 0.08 €68,931,999 US$71,888,322 05 January 2017 8 805,708 0.43 SEK6,512,813 €673,314 05 January 2017 1 6,457 0.00
Total unrealised gain on forward currency contracts 1,111,259 0.58
Total financial assets at fair value through profit or loss - trading 143,802,941 76.00
210

Man Funds VI PlcSchedule of Investments as at 31 December 2016 (continued)Man GLG Global Equity Alternative (continued)Financial liabilities at fair value through profit or loss
Fair % of Fair % of Value Net Value Net
Nominal Description € Assets Nominal Description € AssetsContracts for difference Contracts for difference (continued)Australia France
(28,493) BHP Billiton Limited (45,157) (0.02) (4,216) Accor SA (2,043) (0.00) (36,691) BHP Billiton Limited (191,446) (0.10) (1,908) ADP Promesses (19,958) (0.01) 118,999 Evolution Mining Limited (3,407) (0.00) 108,923 Air France-KLM (35,380) (0.02) (60,770) Fortescue Metals Group Limited (90,956) (0.05) 4,637 Arkema SA (14,547) (0.01) 218,610 Perseus Mining Limited (35,495) (0.02) (2,898) Atos SE (11,799) (0.01) (127) S&P/ASX 200 Resources Index (55,893) (0.03) (1,102) BNP Paribas SA (7,183) (0.00) (118) S&P/ASX 300 Met and Mining Index (36,288) (0.02) (1,847) Cap Gemini SA (10,396) (0.01)
(458,642) (0.24) 11,742 Carrefour SA (6,412) (0.00) 402 Cellectis SA (7,390) (0.00)
Austria (521) Cie de Saint-Gobain (423) (0.00) (4,706) Erste Group Bank AG (2,615) (0.00) (32,154) Cie Generale des Etablissements Michelin (194,341) (0.10)
(1,303) Cie Generale d'Optique Essilor International SA (5,994) (0.00) Belgium 5,354 Credit AGricole SA (31) (0.00)
(2,619) Solvay SA (5,255) (0.00) 9,935 Danone SA (9,600) (0.01) (4,134) Umicore SA (5,831) (0.01) (2,318) Dassault Systemes (4,914) (0.00)
(11,086) (0.01) (362) Dow Jones Europe Stoxx Personal and Household Index (12,912) (0.01) 13,105 EDF (8,909) (0.00)
Bermuda (5,860) Eiffage (18,447) (0.01) (95) FTSE 250 Index (39,606) (0.02) (4,371) Euro Stoxx 600 Industrial Goods & Services Price Index (57,316) (0.03) (10,953) Seadrill Limited (2,049) (0.00) 8,708 Europe STOXX Bank EUR Price Index (12,944) (0.01)
(41,655) (0.02) (2,407) Faurecia (9,056) (0.00) (486) Hermes International (829) (0.00)
Canada (730) Iliad SA (1,901) (0.00) (40,453) First Quantum Minerals Limited (26,470) (0.01) (3,603) Ingenico (12,589) (0.01) (6,311) Potash Corporation Of Saskatchewan (12,362) (0.01) (2,190) JCDecaux SA (20) (0.00) (17,193) Sherritt International Corporation (6,626) (0.00) 15 Kaufman & Broad SA (34) (0.00)
(45,458) (0.02) (16,428) Klepierre (20,644) (0.01) (428) L'Oreal SA (337) (0.00)
China (13,901) LVMH Moet Hennessy Louis Vuitton SE (94,908) (0.05) 125,359 Angang Steel Company Limited (5,843) (0.00) 6,335 Nexity SA (2,665) (0.00) 141,637 Anhui Conch Cement Company Limited (25,488) (0.01) (2,349) Pernod Ricard SA (8,847) (0.00) 83,711 Baoshan Iron & Steel Company (3,542) (0.00) 7,249 Peugeot SA (832) (0.00) 884,405 BBMG Corporation (30,765) (0.02) (4,561) Publicis Groupe SA (21,378) (0.01) (311,567) Changsha Zoomlion Heavy Industry (7,546) (0.00) (117) Remy Cointreau (1,254) (0.00) 12,174 China Communications Construction (561) (0.00) 316 Renault SA (345) (0.00) 304,520 China Longyuan Power Group Corporation Limited (4,246) (0.00) (25,522) Rexel SA (43,076) (0.02) 305,259 CRRC Corporation Limited (24,351) (0.01) 30,502 Rubis SCA (35,679) (0.02) 187,500 Li Ning Company Limited (2,234) (0.00) (17,865) Safran SA (77,252) (0.04) 260,500 Luye Pharma Group Limited (31,537) (0.02) (1,292) Sodexo SA (9,554) (0.01) 275,345 Maanshan Iron and Steel (2,463) (0.00) (20,832) SPIE SA (52,844) (0.03) (182,000) Petrochina Company Limited (4,674) (0.00) (1,665) STOXX 600 Automobiles & Parts Price EUR Index (12,433) (0.01) 115,100 Qingdao Haier Company Limited (11,005) (0.01) (4,904) STOXX Europe 600 Basic Resources Price Index (687,329) (0.36) 45,021 Sany Heavy Equipment International (142) (0.00) (1,019) STOXX Europe 600 Chemicals Price EUR Index (33,383) (0.02) 37,000 Shenzhou International Group Holdings Limited (17,872) (0.01) (1,848) STOXX Europe 600 Oil & Gas Price EUR Index (30,272) (0.02) 33,440 Tencent Holdings Limited (83,480) (0.04) (1,791) STXE 600 Retail EUR Price index (22,894) (0.01) 732,592 Tianhe Chemicals Group Limited (104,814) (0.06) (111) SXOP Index (2,550) (0.00) 3,115,724 West China Cement Limited (256,589) (0.15) (22,494) Technip SA (318,618) (0.17) 46,000 Zhuzhou CSR Times Electric (2,404) (0.00) (1,379) Teleperformance (2,920) (0.00)
(619,556) (0.33) (547) Thales SA (172) (0.00) (3,246) Ubisoft Entertainment (6,327) (0.00)
Denmark (615) Unibail-Rodamco SE (9,766) (0.01) 187 AP Moeller-Maersk A/S (3,117) (0.00) (54,400) Valeo SA (126,436) (0.07) (181) AP Moeller-Maersk A/S (910) (0.00) (1) Vallourec SA (2) (0.00) (2,200) Carlsberg A/S (1,878) (0.00) (3,785) Vinci SA (17,388) (0.01) (2,881) Chr Hansen Holding A/S (3,438) (0.00) (2,105,473) (1.11) (2,215) Coloplast (8,309) (0.00) (10,114) Danske Bank A/S (5,167) (0.00) Germany (18,575) Dong Energy A/S (31,840) (0.02) (964) Adidas AG (12,399) (0.01) 15,572 DSV A/S (12,139) (0.01) 31,402 Aixtron AG (75,396) (0.04) 35,955 ISS A/S (40,662) (0.03) (1,667) Bayerische Motoren Werke AG (552) (0.00) (2,429) Jyske Bank A/S (2,941) (0.00) 18 Continental AG (15) (0.00) (2,107) Novozymes A/S (492) (0.00) (14,125) Covestro AG (27,554) (0.01) (2,517) Pandora A/S (36,161) (0.02) 397 Daimler AG (52) (0.00) (34,602) Scandinavian Tobacco Group (33,450) (0.02) (5,068) Deutsche Boerse AG (14,482) (0.01) (57,843) TDC A/S (6,241) (0.00) (4,237) Deutsche Lufthansa AG (17) (0.00)
(186,745) (0.10) (4,464) Deutsche Wohnen AG (4,401) (0.00) 95 Drillisch AG (75) (0.00)
European Union (45,706) Fraport AG Frankfurt Airport Services Worldwide (162,534) (0.10) (5) CAC 40 Index (1,407) (0.00) (1,787) Fresenius Medical Care AG & Company KGaA (9,074) (0.00) (1,716) Dow Jones Europe Telecom Index (10,298) (0.01) (2,003) Fresenius SE and Company KGaA (16,551) (0.01) (4) ESTX Chemicals EUR Price (255) (0.00) (17,595) GEA Group AG (32,007) (0.02) (239) GS EU Momentum Long (10,036) (0.01) (18,092) Heidelberg Cement AG (27,674) (0.01) (5,820) EU Momentum Short (16,682) (0.01) (2,934) Hella Kgaa Hueck & Company (6,211) (0.00) (7,688) ESTX Small Cap Eur Price Index (113,006) (0.06) 779 Henkel AG & Company KGaA (2,740) (0.00) (7) FTSE MIB Index (13,500) (0.01) (757) Henkel AG and Company KGaA (1,515) (0.00) (1,502) MSGL3PXS Index (1,592) (0.00) (3,555) Hugo Boss AG (1,236) (0.00) (44,946) MSGLSXNP Index (373,312) (0.20) (8,545) Infineon Technologies AG (6,406) (0.00) (1,799) Russell Europe SMID 300 Euro (141,334) (0.07) (1,614) ishares Core DAX UCITS ETF (3,163) (0.00) (6,905) STXE 600 Eur Price Index (130,116) (0.06) (7,806) K+S AG (3,547) (0.00)
(811,538) (0.43) (54,481) Lanxess AG (110,752) (0.06) 2,500 Linde AG (7,312) (0.00)
Finland (36,852) Metro AG (163,307) (0.10) 4,869 Metso OYJ (2,607) (0.00) (2,747) MTU Aero Engines AG (34,922) (0.02) 7,404 Neste OYJ (5,925) (0.00) (766) Muenchener Rueckversicherungs-Gesellschaft AG (3,702) (0.00) (6,509) Outetec OYJ (613) (0.00) (7,703) Prosieben Sat 1 Media SE (11,509) (0.01) (14,902) Outokumpu OYJ (10,096) (0.01) (988) Rheinmetall AG (120) (0.00) (12,089) Wartsila OYJ (50,032) (0.03) (71,004) SAP SE (387,355) (0.20)
(69,273) (0.04) (18,893) Siemens AG (57,747) (0.03)
211

Man Funds VI PlcSchedule of Investments as at 31 December 2016 (continued)Man GLG Global Equity Alternative (continued)Financial liabilities at fair value through profit or loss (continued)
Fair % of Fair % of Value Net Value Net
Nominal Description € Assets Nominal Description € AssetsContracts for difference (continued) Contracts for difference (continued)Germany (continued) Japan (continued)
(4,261) Software AG (5,955) (0.00) (12,089) Nippon Shokubai Company Limited (16,666) (0.01) (11,480) TUI AG (13,445) (0.01) (9,185) Nissan Chemical Industries Limited (4,019) (0.00) (14,648) TUI AG (14,454) (0.01) (49,045) Nisshin Seifun Group Inc (73,577) (0.05) (6,797) United Internet AG (6,654) (0.00) (22,517) Nomura Holdings Inc (8,025) (0.00) (2,048) Volkswagen AG (8,911) (0.00) 800 Omron Corporation (532) (0.00) (4,914) Wacker Chemie AG (77,534) (0.04) (2,400) Oriental Land Company Limited (2,140) (0.00) (11,263) Zalando SE (2,835) (0.00) (10,412) Panasonic Corporation (9,065) (0.00)
(1,314,115) (0.69) (6,600) Pola Orbis Holdings Inc (48,669) (0.03) (2,947) Rinnai Corporation (2,518) (0.00)
Hong Kong (9,000) Rohto Pharmaceutical Company Limited (7,870) (0.00) 14,222 China Mobile Limited (26,522) (0.01) (22,000) Sanden Holdings Corporation (14,256) (0.01) 706,912 China Resources Cement (33,751) (0.02) 1,000 Sanwa Holdings Corporation (19) (0.00) 1,506 Custom Hong Kong (1,652) (0.00) (2,932) Shimano Inc (8,011) (0.00) 335,500 Haier Electronics Group Company Limited (52,514) (0.03) (13,849) Suzuki Motor Corporation (22,648) (0.01) (4,098) Jardine Matheson Holdings Limited (1,539) (0.00) (91,000) Taiheiyo Cement Corporation (3,125) (0.00)
(115,978) (0.06) (2,800) Taikisha Limited (4,010) (0.00) (221,520) Taisei Corporation (60,608) (0.04)
India (1,900) Takeda Pharmaceutical Company Limited (1,763) (0.00) (10,335) Infosys Technologies Limited (6,670) (0.00) (2,900) Toho Company Limited (4,932) (0.00) 204 MRF Limited (328) (0.00) (9,100) Tokyo Tatemono Company Limited (8,617) (0.00)
(6,998) (0.00) 799 Toyo Denki Seizo (112) (0.00) (43,015) Toyo Seikan Group Holdings Limited (33,193) (0.02)
Ireland (28,360) Toyota Motor Corporation (121,395) (0.06) (4,624) CRH Plc (3,334) (0.00) (12,335) Yamazaki Baking Company Limited (3,379) (0.00) 3,159 DCC Plc (4,275) (0.00) (5,447) Yaskawa Electric Corporation (4,657) (0.00) (125,024) Experian Plc (118,555) (0.05) (929,628) (0.49) (1,960) Kerry Group Plc (1,996) (0.00) (16,391) Kingspan Group Plc (29,262) (0.02) Jersey Channel Islands 1,729 Paddy Power Plc (4,239) (0.00) (62,465) Centamin Plc (3,663) (0.00) (10,255) Ryanair Holdings Plc (9,465) (0.01) 10,172 Ryanair Holdings Plc (1,616) (0.00) Luxembourg (34,013) Smurfit Kappa Group Plc (28,399) (0.02) (17,161) ArcelorMittal (5,570) (0.00) 9,878 Smurfit Kappa Group Plc (15,444) (0.01) (2,585) SES (4,048) (0.00) (1,493) Source STOXX Europe 600 Optimised Health Care UCITS ETF (17,690) (0.01) (10,565) Tenaris SA (8,892) (0.00)
(234,275) (0.12) (5,920) Tenaris SA (54,227) (0.04) (72,737) (0.04)
Isle of Man 209,282 Playtech Plc (83,697) (0.04) Malta
105,650 GVC Holdings Plc (38,494) (0.02)Italy
(29,222) Banca Popolare dell'Emilia Romagna SC (6,080) (0.00) Netherlands (34,964) Banco Popolare Scarl (242) (0.00) (6,518) ABN AMRO Group NV (4,770) (0.00) (1,025) Buzzi Unicem SpA (5,048) (0.00) 7,984 Aegon NV (333) (0.00) (16,059) Davide Campari-Milano SpA (5,024) (0.00) 11,551 Akzo Nobel NV (4,315) (0.00) (19,051) Eni SpA (4,024) (0.00) (70,971) Altice NV (150,120) (0.09) (6,203) Italgas SPA (1,250) (0.00) (1,433) ASML Holding NV (16,336) (0.01) (3,958) Luxottica Group SpA (1,126) (0.00) (3,347) ASR Nederland NV (233) (0.00) (55,570) Mediaset SpA (81,002) (0.05) (18,205) Boskalis Westminster (27,229) (0.01) (19,604) Mediobanca SpA (4,009) (0.00) (3,665) Exor NV (4,369) (0.00) 52,045 Prada SpA (7,831) (0.00) (6,787) Gemalto NV (21,428) (0.01) (143,634) Saipem SpA (4,963) (0.00) (11,193) Heineken NV (10,692) (0.01) (191,582) Telecom Italia SpA (14,378) (0.02) (23,631) Koninklijke DSM NV (6,035) (0.00) (802) Tod's SpA (8,195) (0.00) (3,582) Qiagen NV (13,361) (0.01) (58,119) UniCredit SpA (10,683) (0.01) (2,500) Royal Dutch Shell Plc (1,378) (0.00)
(153,855) (0.08) (94,650) Royal Dutch Shell Plc (234,583) (0.13) (3,175) Sensata Technologies Holding NV (5,090) (0.00)
Japan 12,849 Takeaway.Com Holding BV (14,790) (0.01) (8,333) ABC-Mart Inc (7,327) (0.00) (4,057) Wolters Kluwer NV (5,911) (0.00) (23,624) Aeon Company Limited (25,864) (0.01) (520,973) (0.28) 600 AIN Holdings Inc (246) (0.00) 800 Alpen Company Limited (1,277) (0.00) Norway (69,917) Amada Holdings Company Limited (64,634) (0.04) (190,107) Marine Harvest (105,987) (0.06) (2,796) Asahi Group Holdings Limited (1,404) (0.00) (116,575) Norsk Hydro ASA (10,036) (0.01) (56,837) Asahi Kasei Corporation (38,845) (0.02) 6,449 Opera Software ASA (8,240) (0.00) 39,900 Ashikaga Holdings Company Limited (2,506) (0.00) (3,347) TGS Nopec Geophysical Company ASA (10,954) (0.01) (12,962) Bridgestone Corporation (14,074) (0.01) (39,575) Yara International ASA (86,276) (0.05) (4,000) Brother Industries Limited (9,287) (0.00) (221,493) (0.13) (22,028) Credit Saison Company Limited (2,842) (0.00) (1,045) Daito Trust Construct Company Limited (10,570) (0.01) Pakistan 700 East Japan Railway Company (1,568) (0.00) 13,783 Engro Corporation Limited (121) (0.00) (12,349) Ebara Corporation (27,012) (0.01) 25,027 MCB Bank Limited (226) (0.00) (5,900) F@N Communications Inc (548) (0.00) (347) (0.00) (11,638) FamilyMart UNY Holdings Company Limited (77,448) (0.05) (1,900) GMO Payment Gateway Inc (18,479) (0.01) Philippines 2,539 Honda Motor Company Limited (3,071) (0.00) 29,000 Security Bank Corporation (2,007) (0.00) 545 Honeys Company Limited (32) (0.00) (18,856) Japan Post Bank Company Limited (8,475) (0.00) Poland 1,800 Japan Tobacco Inc (1,088) (0.00) 3,993 Jastrzebska Spolka Weglowa SA (3,984) (0.00) 1,000 Kaneka Corporation (282) (0.00) (15,000) Keikyu Corporation (29,263) (0.03) Portugal (18,987) Komatsu Limited (36,526) (0.03) 766,256 Banco Comercial Portugese (134,341) (0.07) (15,800) Kuraray Company Limited (765) (0.00) 3,069 Jeronimo Martins SGPS SA (1,080) (0.00) (16,646) Makita Corporation (45,825) (0.03) (135,421) (0.07) (5,359) Mazda Motor Corporation (12,731) (0.01) (1,100) Miraca Holdings Inc (5,069) (0.00) Qatar 1,000 Mitsubishi Electric Corporation (122) (0.00) 2,930 Aamal Company (69) (0.00) (23,000) Nagoya Railroad Company Limited (8,866) (0.00) 1,830 Ezdan Holding Group (248) (0.00) (3,200) Nihon Kohden Corporation (5,368) (0.00) (2,600) Nihon M&A Center Inc (4,408) (0.00)
212

Man Funds VI PlcSchedule of Investments as at 31 December 2016 (continued)Man GLG Global Equity Alternative (continued)Financial liabilities at fair value through profit or loss (continued)
Fair % of Fair % of Value Net Value Net
Nominal Description € Assets Nominal Description € AssetsContracts for difference (continued) Contracts for difference (continued)Qatar (continued) United Kingdom (continued)
543 Gulf International Services (36) (0.00) 9,267 ASOS Plc (4,253) (0.00) 909 Salam International Investment (4) (0.00) (50,421) Auto Trader Group Plc (19,101) (0.01)
(357) (0.00) (103,173) B&M European Value Retail SA (28,317) (0.01) 38,505 BAE Systems Plc (2,309) (0.00)
Russia (3,795) Bellway Plc (1,432) (0.00) 89 Magnit PJSC (318) (0.00) 13,320 Big Yellow Group Plc (5,310) (0.00) (97) MMC Norilsk Nickel PJSC (161) (0.00) 482,800 Booker Group Plc (9,893) (0.01) (62,259) MMC Norilsk Nickel PJSC (56,240) (0.03) 7,042 BP Plc (151) (0.00) 10,079 Polymetal International Plc (5,800) (0.00) (4,881) British American Tobacco Plc (6,621) (0.00)
(62,519) (0.03) (37,907) BT Group Plc (2,695) (0.00) 20,531 Capita Group Plc (2,274) (0.00)
South Africa (73,363) Capital & Counties Properties Plc (9,075) (0.00) (10,119) Lonmin Plc (853) (0.00) (658,081) Centrica Plc (89,559) (0.05) 11,017 Mediclinic International Plc (16,537) (0.01) 5,901 Coca-Cola European Partners (4,302) (0.00) (7,504) Sun International Limited (1,463) (0.00) (207,032) Compass Group Plc (229,154) (0.13)
(18,853) (0.01) (3,366) Croda International Plc (3,739) (0.00) (22,953) Daily Mail&General Tst-A NV (9,914) (0.01)
Spain (54,230) Dairy Crest Group Plc (14,826) (0.01) 4,399 Acerinox SA (1,723) (0.00) (4,796) Derwent Valley Holdings Plc (7,097) (0.00) (24,718) ACS Actividades Construction y Servicios (22,910) (0.02) (28,202) Diageo Plc (21,609) (0.01) (2,868) Aena SA (7,114) (0.00) (2) Dialog Semiconductor Plc (6) (0.00) (3,234) Amadeus IT Holding SA (4,139) (0.00) (37,640) Dixons Carphone Plc (7,639) (0.00) 142,004 Banco Popular Espanol SA (6,010) (0.00) (60,928) DS Smith Plc (16,335) (0.01) (22,506) Industria de Diseno Textil SA (2,984) (0.00) (8,438) Dunelm Group Plc (3,106) (0.00) (9,588) Mediaset Espana Comunicacion (8,359) (0.00) 37,263 Easy Jet Plc (4,652) (0.00) (59,458) Obrascon Huarte Lain SA (9,513) (0.02) (1,229) Fevertree Drinks Plc (2,383) (0.00) (1,051) Tecnicas Reunidas SA (5,561) (0.00) (238) FTSE 350 Mining Index (274,587) (0.16)
(68,313) (0.04) (23,273) G4S Plc (997) (0.00) (43,622) GKN Plc (12,272) (0.01)
Sweden (51,423) GlaxoSmithKline Plc (18,260) (0.01) (52,792) Alfa Laval AB (78,860) (0.05) (23,885) Greggs Plc (1,552) (0.00) (27,491) Alimak Group AB (31,656) (0.02) (216,104) Halfords Group Plc (42,604) (0.02) 2,568 Assa Abloy AB (2,495) (0.00) (22,751) Hammerson Plc (6,424) (0.00) 5,043 Atlas Copco AB (5,544) (0.00) (5,904) Hargreaves Lansdown Plc (4,286) (0.00) (4,158) Autoliv Inc (12,859) (0.01) (1,119) Hikma Pharmaceuticals Plc (1,055) (0.00) (38,884) Boliden AB (12,091) (0.01) 58,453 Howden Joinery Group Plc (79,730) (0.04) (1,509) Electrolux AB (149) (0.00) (48) HSBC Holdings Plc (1,829) (0.00) (1,457) Elekta AB (277) (0.00) (23,133) IMI Plc (15,810) (0.01) 3,298 Hennes and Mauritz AB (3,564) (0.00) 35,248 Imperial Tobacco Group Plc (43,766) (0.02) (118,894) Husqvarna AB (63,097) (0.03) (24,455) Inchcape Plc (22,006) (0.01) (10,888) ICA Gruppen AB (1,578) (0.00) (104,798) International Consolidated Airlines Group S.A. (45,565) (0.02) (1,735) JM AB (2,380) (0.00) (134,046) International Consolidated Airlines Group SA (5,919) (0.00) (266,691) Sandvik AB (99,765) (0.05) (18,001) Intertek Group Plc (33,493) (0.02) 6,561 Skanska AB (2,145) (0.00) (34,229) Intu Properties Plc (4,555) (0.00) 49,959 SSAB AB (7,500) (0.00) (8,287) JD Wetherspoon Plc (5,480) (0.00) (1,869) Swedish Match AB (82) (0.00) (4,957) John Wood Group Plc (393) (0.00) (79,202) Volvo AB (94,621) (0.06) (3,349) Johnson Matthey Plc (2,792) (0.00)
(418,663) (0.23) (4,300) Johnson Service Group Plc (466) (0.00) (39,784) Jupiter Fund Management (6,416) (0.00)
Switzerland (105,067) Just Eat Plc (20,639) (0.01) (28,039) ABB Limited (20,366) (0.01) (106,076) Marks & Spencer Group Plc (15,439) (0.01) (1,279) Aryzta AG (551) (0.00) (68,539) Merlin Entertainments Plc (4,975) (0.00) (9,296) Cie Financiere Richemont SA (15,966) (0.01) (76,254) Mitie Group Plc (12,289) (0.01) 55 Credit Suisse Group AG (38) (0.00) (99,396) Mondi Plc (92,712) (0.05) (7,556) DKSH Holding AG (22,561) (0.01) 46,572 Monitise Plc (183) (0.00) (190) EMS-Chemie Holding AG (10,230) (0.01) (33,775) National Grid Plc (14,335) (0.01) (1,307) Geberit AG (7,812) (0.00) (1,227) Next Plc (162) (0.00) (1,228) Givaudan (24,425) (0.01) 20,137 Patisserie Holdings Plc (9,639) (0.01) 1,403 LafargeHolcim Limited (3,457) (0.00) (216,755) Pearson Plc (123,666) (0.08) (39,046) LafargeHolcim Limited (2,287) (0.00) (4,051) Persimmon Plc (2,694) (0.00) (2,508) MSBPGLPP (139,847) (0.08) (91,877) Petrofac Limited (84,483) (0.04) (3,561) Panalpina Welttransport Holding AG (45,483) (0.02) (4,594) Provident Financial Plc (7,579) (0.00) (1,897) Schindler Holding (2,826) (0.00) (126,987) Prudential Plc (121,670) (0.07) (528) SGS SA (16,640) (0.01) (22,709) Reckitt Benckiser Group Plc (20,653) (0.01) (102) SIKA FIN I (3,659) (0.00) (2,065) Rightmove Plc (4,788) (0.00) (3,310) STMicroelectronics NV (8,140) (0.00) (6,599) Rio Tinto Limited (72,444) (0.04) (856) Swatch Group AG (4,736) (0.00) (353) Russell UK MID 150 Index (30,681) (0.02) 391 Syngenta AG (1,537) (0.00) (48,873) Sage Group Plc (13,413) (0.01) 8,218 Syngenta AG (150,009) (0.09) (687,348) J Sainsbury Plc (98,284) (0.05) 1,455 Temenos Group AG (434) (0.00) (5,860) Schroders Plc (5,948) (0.00) 9,061 UBS Group AG (13,264) (0.01) (20,876) Segro Plc (3,990) (0.00)
(494,268) (0.26) (7,053) Severn Trent Plc (235) (0.00) 4,983 Smiths Group Plc (10,130) (0.01)
Taiwan 22,885 Softcat Plc (10,251) (0.01) 406,556 China Life Insurance Company Limited (2,213) (0.00) (6,212) Spectris Plc (17,863) (0.01)
29,376 Spire Healthcare Group Plc (11,907) (0.01)Ukraine (145,407) SSE Plc (138,976) (0.07)
2,034 Kernel Holdings SA (47) (0.00) (606,408) Standard Life Plc (130,292) (0.07) (2,489) TalkTalk Telecom Group Plc (36) (0.00)
United Kingdom 20,476 Tate and Lyle Plc (2,347) (0.00) (35,983) 3I Group Plc (15,939) (0.01) 147,851 Taylor Wimpey Plc (2,275) (0.00) (237,059) AA Plc (51,546) (0.03) (70,564) Tesco Plc (557) (0.00) (6,184) Admiral Group Plc (2,670) (0.00) 59,000 Topps Tiles Plc (29,314) (0.02) 22,442 Aggreko Plc (1,332) (0.00) (109,138) Travis Perkins Plc (86,242) (0.05) (66,962) Amec Plc (6,789) (0.00) (158,774) Tullow Oil Plc (19,428) (0.01) 60,820 Anglo American Plc (19,394) (0.01) (8,395) UBM Plc (2,470) (0.00) 24,691 Antofagasta Plc (5,788) (0.00) (9,354) Unilever NV (9,962) (0.01) (9,567) Ashtead Group Plc (35,759) (0.02) (4,795) Unilever Plc (3,229) (0.00)
213
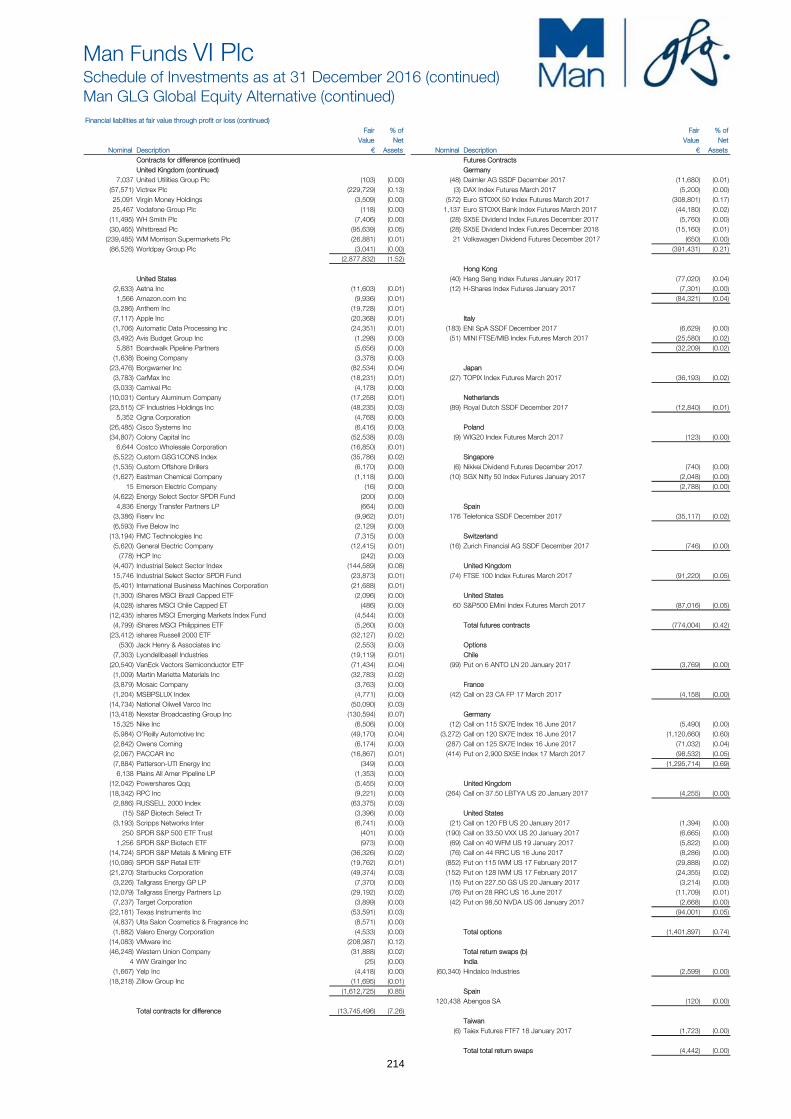
Man Funds VI PlcSchedule of Investments as at 31 December 2016 (continued)Man GLG Global Equity Alternative (continued)Financial liabilities at fair value through profit or loss (continued)
Fair % of Fair % of Value Net Value Net
Nominal Description € Assets Nominal Description € AssetsContracts for difference (continued) Futures ContractsUnited Kingdom (continued) Germany
7,037 United Utilities Group Plc (103) (0.00) (48) Daimler AG SSDF December 2017 (11,680) (0.01) (57,571) Victrex Plc (229,729) (0.13) (3) DAX Index Futures March 2017 (5,200) (0.00) 25,091 Virgin Money Holdings (3,509) (0.00) (572) Euro STOXX 50 Index Futures March 2017 (308,801) (0.17) 25,467 Vodafone Group Plc (118) (0.00) 1,137 Euro STOXX Bank Index Futures March 2017 (44,180) (0.02) (11,495) WH Smith Plc (7,406) (0.00) (28) SX5E Dividend Index Futures December 2017 (5,760) (0.00) (30,465) Whitbread Plc (95,639) (0.05) (28) SX5E Dividend Index Futures December 2018 (15,160) (0.01) (239,485) WM Morrison Supermarkets Plc (26,881) (0.01) 21 Volkswagen Dividend Futures December 2017 (650) (0.00) (86,526) Worldpay Group Plc (3,041) (0.00) (391,431) (0.21)
(2,877,832) (1.52)Hong Kong
United States (40) Hang Seng Index Futures January 2017 (77,020) (0.04) (2,633) Aetna Inc (11,603) (0.01) (12) H-Shares Index Futures January 2017 (7,301) (0.00) 1,566 Amazon.com Inc (9,936) (0.01) (84,321) (0.04) (3,286) Anthem Inc (19,728) (0.01) (7,117) Apple Inc (20,368) (0.01) Italy (1,706) Automatic Data Processing Inc (24,351) (0.01) (183) ENI SpA SSDF December 2017 (6,629) (0.00) (3,492) Avis Budget Group Inc (1,298) (0.00) (51) MINI FTSE/MIB Index Futures March 2017 (25,580) (0.02) 5,881 Boardwalk Pipeline Partners (5,656) (0.00) (32,209) (0.02) (1,638) Boeing Company (3,378) (0.00) (23,476) Borgwarner Inc (82,534) (0.04) Japan (3,783) CarMax Inc (18,231) (0.01) (27) TOPIX Index Futures March 2017 (36,193) (0.02) (3,033) Carnival Plc (4,178) (0.00) (10,031) Century Aluminum Company (17,258) (0.01) Netherlands (23,515) CF Industries Holdings Inc (48,235) (0.03) (89) Royal Dutch SSDF December 2017 (12,840) (0.01) 5,352 Cigna Corporation (4,768) (0.00) (26,485) Cisco Systems Inc (6,416) (0.00) Poland (34,807) Colony Capital Inc (52,538) (0.03) (9) WIG20 Index Futures March 2017 (123) (0.00) 6,644 Costco Wholesale Corporation (16,850) (0.01) (5,522) Custom GSG1CONS Index (35,786) (0.02) Singapore (1,535) Custom Offshore Drillers (6,170) (0.00) (6) Nikkei Dividend Futures December 2017 (740) (0.00) (1,627) Eastman Chemical Company (1,118) (0.00) (10) SGX Nifty 50 Index Futures January 2017 (2,048) (0.00) 15 Emerson Electric Company (16) (0.00) (2,788) (0.00) (4,622) Energy Select Sector SPDR Fund (200) (0.00) 4,836 Energy Transfer Partners LP (664) (0.00) Spain (3,386) Fiserv Inc (9,962) (0.01) 176 Telefonica SSDF December 2017 (35,117) (0.02) (6,593) Five Below Inc (2,129) (0.00) (13,194) FMC Technologies Inc (7,315) (0.00) Switzerland (5,620) General Electric Company (12,415) (0.01) (16) Zurich Financial AG SSDF December 2017 (746) (0.00) (778) HCP Inc (242) (0.00) (4,407) Industrial Select Sector Index (144,589) (0.08) United Kingdom 15,746 Industrial Select Sector SPDR Fund (23,873) (0.01) (74) FTSE 100 Index Futures March 2017 (91,220) (0.05) (5,401) International Business Machines Corporation (21,688) (0.01) (1,300) iShares MSCI Brazil Capped ETF (2,096) (0.00) United States (4,028) ishares MSCI Chile Capped ET (486) (0.00) 60 S&P500 EMini Index Futures March 2017 (87,016) (0.05) (12,435) ishares MSCI Emerging Markets Index Fund (4,544) (0.00) (4,799) iShares MSCI Philippines ETF (5,260) (0.00) Total futures contracts (774,004) (0.42) (23,412) ishares Russell 2000 ETF (32,127) (0.02) (530) Jack Henry & Associates Inc (2,553) (0.00) Options (7,303) Lyondellbasell Industries (19,119) (0.01) Chile (20,540) VanEck Vectors Semiconductor ETF (71,434) (0.04) (99) Put on 6 ANTO LN 20 January 2017 (3,769) (0.00) (1,009) Martin Marietta Materials Inc (32,783) (0.02) (3,879) Mosaic Company (3,763) (0.00) France (1,204) MSBPSLUX Index (4,771) (0.00) (42) Call on 23 CA FP 17 March 2017 (4,158) (0.00) (14,734) National Oilwell Varco Inc (50,090) (0.03) (13,418) Nexstar Broadcasting Group Inc (130,594) (0.07) Germany 15,325 Nike Inc (6,506) (0.00) (12) Call on 115 SX7E Index 16 June 2017 (5,490) (0.00) (5,984) O'Reilly Automotive Inc (49,170) (0.04) (3,272) Call on 120 SX7E Index 16 June 2017 (1,120,660) (0.60) (2,842) Owens Corning (6,174) (0.00) (287) Call on 125 SX7E Index 16 June 2017 (71,032) (0.04) (2,067) PACCAR Inc (16,867) (0.01) (414) Put on 2,900 SX5E Index 17 March 2017 (98,532) (0.05) (7,884) Patterson-UTI Energy Inc (349) (0.00) (1,295,714) (0.69) 6,138 Plains All Amer Pipeline LP (1,353) (0.00) (12,042) Powershares Qqq (5,455) (0.00) United Kingdom (18,342) RPC Inc (9,221) (0.00) (264) Call on 37.50 LBTYA US 20 January 2017 (4,255) (0.00) (2,886) RUSSELL 2000 Index (63,375) (0.03) (15) S&P Biotech Select Tr (3,396) (0.00) United States (3,193) Scripps Networks Inter (6,741) (0.00) (21) Call on 120 FB US 20 January 2017 (1,394) (0.00) 250 SPDR S&P 500 ETF Trust (401) (0.00) (190) Call on 33.50 VXX US 20 January 2017 (6,665) (0.00) 1,256 SPDR S&P Biotech ETF (973) (0.00) (69) Call on 40 WFM US 19 January 2017 (5,822) (0.00) (14,724) SPDR S&P Metals & Mining ETF (36,326) (0.02) (76) Call on 44 RRC US 16 June 2017 (8,286) (0.00) (10,086) SPDR S&P Retail ETF (19,762) (0.01) (852) Put on 115 IWM US 17 February 2017 (29,888) (0.02) (21,270) Starbucks Corporation (49,374) (0.03) (152) Put on 128 IWM US 17 February 2017 (24,355) (0.02) (3,226) Tallgrass Energy GP LP (7,370) (0.00) (15) Put on 227.50 GS US 20 January 2017 (3,214) (0.00) (12,079) Tallgrass Energy Partners Lp (29,192) (0.02) (76) Put on 28 RRC US 16 June 2017 (11,709) (0.01) (7,237) Target Corporation (3,899) (0.00) (42) Put on 98.50 NVDA US 06 January 2017 (2,668) (0.00) (22,181) Texas Instruments Inc (53,591) (0.03) (94,001) (0.05) (4,837) Ulta Salon Cosmetics & Fragrance Inc (8,571) (0.00) (1,882) Valero Energy Corporation (4,533) (0.00) Total options (1,401,897) (0.74) (14,083) VMware Inc (208,987) (0.12) (46,248) Western Union Company (31,888) (0.02) Total return swaps (b) 4 WW Grainger Inc (25) (0.00) India (1,667) Yelp Inc (4,418) (0.00) (60,340) Hindalco Industries (2,599) (0.00) (18,218) Zillow Group Inc (11,695) (0.01)
(1,612,725) (0.85) Spain 120,438 Abengoa SA (120) (0.00)
Total contracts for difference (13,745,496) (7.26)Taiwan
(6) Taiex Futures FTF7 18 January 2017 (1,723) (0.00)
Total total return swaps (4,442) (0.00)
214

Man Funds VI PlcSchedule of Investments as at 31 December 2016 (continued)Man GLG Global Equity Alternative (continued)Financial liabilities at fair value through profit or loss (continued)
Forward currency contracts (note 4)Unrealised % of
loss Net Amount Receivable Amount Payable Maturity Date Contracts € Assets
CHF1,294,031 €1,211,292 06 January 2017 1 (4,145) 0.00 €42,979 GBP36,880 05 January 2017 1 (217) 0.00 €217,779 JPY26,792,407 05 January 2017 1 (25) 0.00 GBP9,733 €11,581 06 January 2017 1 (182) 0.00 NOK6,474,411 €715,397 05 January 2017 1 (2,503) 0.00 US$12,745,538 €12,242,090 05 January 2017 3 (163,546) (0.09)US$14,976,017 €14,349,239 06 January 2017 2 (157,998) (0.08)
Total unrealised loss on forward currency contracts (328,616) (0.17)
Total financial liabilities at fair value through profit or loss - trading (16,254,455) (8.59)
Total financial assets at fair value through profit or loss - trading 143,802,941 76.01
Total financial liabilities at fair value through profit or loss - trading (16,254,455) (8.59)
Other net assets 61,649,785 32.58
Net Assets Attributable to Holders of Redeemable Participating Shares 189,198,271 100.00
*The forward currency contracts are held with the Bank of New York Mellon, Brussels
Classification(a) Exchange traded derivative instruments(b) OTC financial derivative instrumentsAll other investments held at the year end are transferable securities listed on an official stock exchange
TotalAnalysis of Total Assets AssetsTransferable securities listed on an official stock exchange 58.17Exchange traded financial derivative instruments described in classification (a) above 0.09
Transferable securities as described in # above 0.11OTC financial derivative instruments described in classification (b) above 6.44Other current assets 35.19
100.00
215
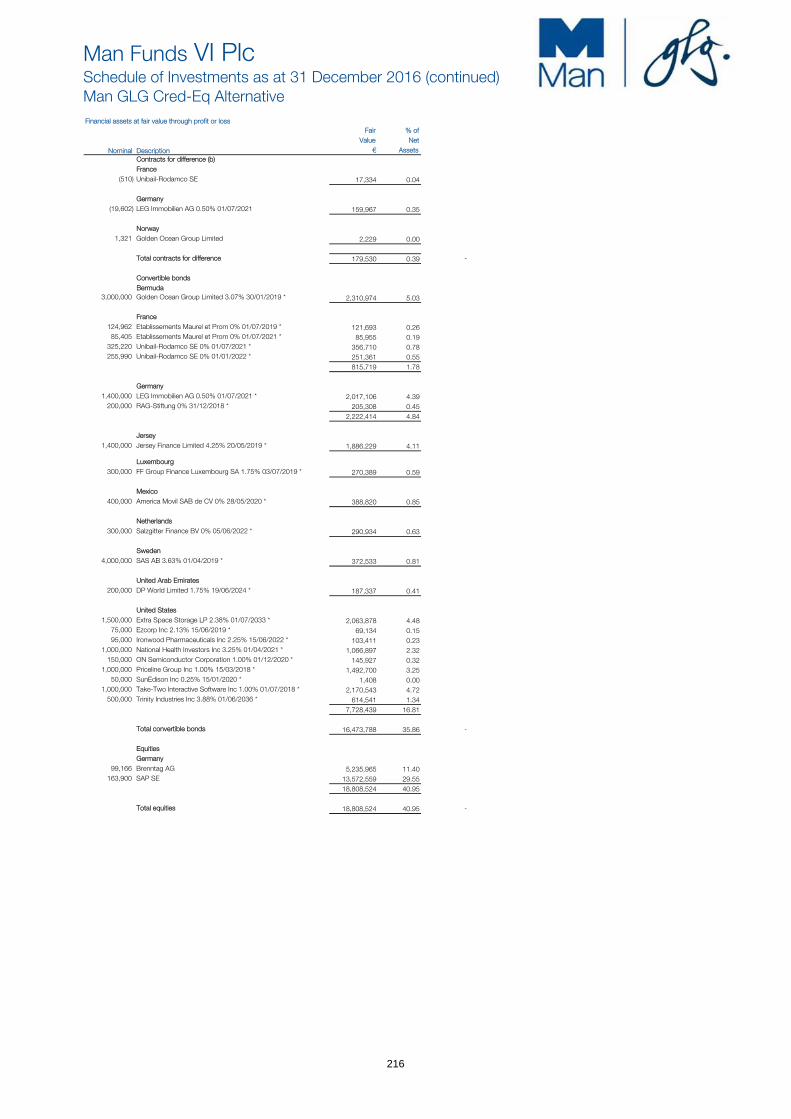
Man Funds VI PlcSchedule of Investments as at 31 December 2016 (continued)Man GLG Cred-Eq AlternativeFinancial assets at fair value through profit or loss
Fair % of Value Net
Nominal Description € AssetsContracts for difference (b)France
(510) Unibail-Rodamco SE 17,334 0.04
Germany(19,602) LEG Immobilien AG 0.50% 01/07/2021 159,967 0.35
Norway1,321 Golden Ocean Group Limited 2,229 0.00
Total contracts for difference 179,530 0.39 -
Convertible bondsBermuda
3,000,000 Golden Ocean Group Limited 3.07% 30/01/2019 * 2,310,974 5.03
France124,962 Etablissements Maurel et Prom 0% 01/07/2019 * 121,693 0.26
85,405 Etablissements Maurel et Prom 0% 01/07/2021 * 85,955 0.19325,220 Unibail-Rodamco SE 0% 01/07/2021 * 356,710 0.78255,990 Unibail-Rodamco SE 0% 01/01/2022 * 251,361 0.55
815,719 1.78
Germany1,400,000 LEG Immobilien AG 0.50% 01/07/2021 * 2,017,106 4.39
200,000 RAG-Stiftung 0% 31/12/2018 * 205,308 0.45 2,222,414 4.84
Jersey1,400,000 Jersey Finance Limited 4.25% 20/05/2019 * 1,886,229 4.11
Luxembourg300,000 FF Group Finance Luxembourg SA 1.75% 03/07/2019 * 270,389 0.59
Mexico400,000 America Movil SAB de CV 0% 28/05/2020 * 388,820 0.85
Netherlands300,000 Salzgitter Finance BV 0% 05/06/2022 * 290,934 0.63
Sweden4,000,000 SAS AB 3.63% 01/04/2019 * 372,533 0.81
United Arab Emirates200,000 DP World Limited 1.75% 19/06/2024 * 187,337 0.41
United States1,500,000 Extra Space Storage LP 2.38% 01/07/2033 * 2,063,878 4.48
75,000 Ezcorp Inc 2.13% 15/06/2019 * 69,134 0.1595,000 Ironwood Pharmaceuticals Inc 2.25% 15/06/2022 * 103,411 0.23
1,000,000 National Health Investors Inc 3.25% 01/04/2021 * 1,066,897 2.32150,000 ON Semiconductor Corporation 1.00% 01/12/2020 * 145,927 0.32
1,000,000 Priceline Group Inc 1.00% 15/03/2018 * 1,492,700 3.2550,000 SunEdison Inc 0.25% 15/01/2020 * 1,408 0.00
1,000,000 Take-Two Interactive Software Inc 1.00% 01/07/2018 * 2,170,543 4.72500,000 Trinity Industries Inc 3.88% 01/06/2036 * 614,541 1.34
7,728,439 16.81
Total convertible bonds 16,473,788 35.86 -
EquitiesGermany
99,166 Brenntag AG 5,235,965 11.40163,900 SAP SE 13,572,559 29.55
18,808,524 40.95
Total equities 18,808,524 40.95 -
216

Man Funds VI PlcSchedule of Investments as at 31 December 2016 (continued)Man GLG Cred-Eq Alternative (continued)Financial assets at fair value through profit or loss (continued)
Forward currency contracts (note 4) (b) Unrealised % of
gain Net
Amount Receivable Amount Payable Maturity Date Contracts € Assets €2,019,387 GBP1,701,132 19 January 2017 1 27,576 0.06 €14,462,876 US$15,092,011 19 January 2017 1 170,485 0.37
Total unrealised gain on forward currency contracts 198,061 0.43
Total financial assets at fair value through profit or loss - trading 35,659,903 77.63
217

Man Funds VI PlcSchedule of Investments as at 31 December 2016 (continued)Man GLG Cred-Eq Alternative (continued)
Financial liabilities at fair value through profit or loss Fair % of
Value Net
Nominal Description € AssetsContracts for differenceEurope
179,655 Morgan Stanley Credit Equity Alternative Fund (740,746) (1.61)
Germany(99,166) Brenntag AG (273,698) (0.60)
(1,372) Evonik Industries AG (527) (0.00)
(2,250) Salzgitter AG (15,090) (0.03)
(163,900) SAP SE (427,779) (0.93) (717,094) (1.56)
Mexico(603) Cemex SAB de CV (1,329) (0.00)
Norway(3) Golden Ocean Group Limited (6) (0.00)
United Kingdom(1,299,944) Primary Health Properties Plc (88,988) (0.20)
Total contracts for difference (1,548,163) (3.37) -
218

Man Funds VI PlcSchedule of Investments as at 31 December 2016 (continued)Man GLG Cred-Eq Alternative (continued)Financial liabilities at fair value through profit or loss (continued)
Forward currency contracts (note 4) Unrealised % of
loss Net
Amount Receivable Amount Payable Maturity Date Contracts € Assets€542,109 SEK5,299,332 19 January 2017 1 (11,095) (0.02)US$1,642,671 €1,573,922 06 January 2017 2 (17,330) (0.04)US$1,422,918 €1,367,389 19 January 2017 1 (19,861) (0.05)
Total unrealised loss on forward currency contracts (48,286) (0.11)
Total financial liabilities at fair value through profit or loss - trading (1,596,449) (3.48)
Total financial assets at fair value through profit or loss - trading 35,659,903 77.63
Total financial liabilities at fair value through profit or loss - trading (1,596,449) (3.48)
Other net assets 11,869,501 25.85
Net Assets Attributable to Holders of Redeemable Participating Shares 45,932,955 100.00
** The forward currency contracts are held with The Bank of New York Mellon, Brussels
Classifications : (a) Exchange traded derivative instruments (b) OTC financial derivatives instruments # Transferable securities other than those listed on official stock exchange or dealt on another regulated market* Transferable securities dealt on another regulated market.All other investments held at the year end are transferable securities listed on an official stock exchange
Total Analysis of Total Assets AssetsTransferable securities listed on official stock exchange 39.43OTC financial derivative instruments described in classification (b) above 0.79Transferable securities dealt on another regulated market described in * above 34.54Other current assets 25.24
100.00
219
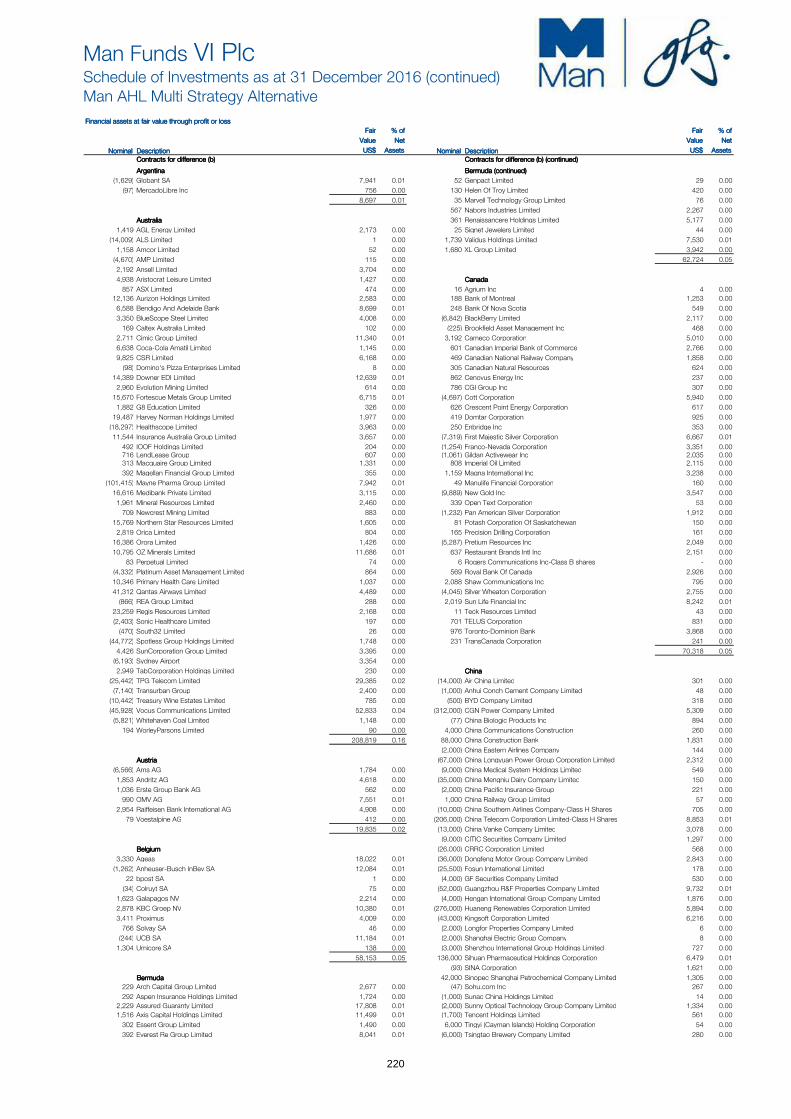
Man Funds VI PlcSchedule of Investments as at 31 December 2016 (continued)Man AHL Multi Strategy Alternative
Financial assets at fair value through profit or lossFinancial assets at fair value through profit or lossFinancial assets at fair value through profit or lossFinancial assets at fair value through profit or loss
Fair Fair Fair Fair % of% of% of% of Fair Fair Fair Fair % of% of% of% of
Value Value Value Value NetNetNetNet Value Value Value Value NetNetNetNet
Nominal Nominal Nominal Nominal DescriptionDescriptionDescriptionDescription US$ US$ US$ US$ AssetsAssetsAssetsAssets Nominal Nominal Nominal Nominal DescriptionDescriptionDescriptionDescription US$ US$ US$ US$ AssetsAssetsAssetsAssets
Contracts for difference (b)Contracts for difference (b)Contracts for difference (b)Contracts for difference (b) Contracts for difference (b) (continued)Contracts for difference (b) (continued)Contracts for difference (b) (continued)Contracts for difference (b) (continued)
ArgentinaArgentinaArgentinaArgentina Bermuda (continued)Bermuda (continued)Bermuda (continued)Bermuda (continued)
(1,629) Globant SA 7,941 0.01 52 Genpact Limited 29 0.00
(97) MercadoLibre Inc 756 0.00 130 Helen Of Troy Limited 420 0.00
8,697 0.01 35 Marvell Technology Group Limited 76 0.00
567 Nabors Industries Limited 2,267 0.00
AustraliaAustraliaAustraliaAustralia 361 Renaissancere Holdings Limited 5,177 0.00
1,419 AGL Energy Limited 2,173 0.00 25 Signet Jewelers Limited 44 0.00
(14,009) ALS Limited 1 0.00 1,739 Validus Holdings Limited 7,530 0.01
1,158 Amcor Limited 52 0.00 1,680 XL Group Limited 3,942 0.00
(4,670) AMP Limited 115 0.00 62,724 0.05
2,192 Ansell Limited 3,704 0.00
4,938 Aristocrat Leisure Limited 1,427 0.00 CanadaCanadaCanadaCanada
857 ASX Limited 474 0.00 16 Agrium Inc 4 0.00
12,136 Aurizon Holdings Limited 2,583 0.00 188 Bank of Montreal 1,253 0.00
6,588 Bendigo And Adelaide Bank 8,699 0.01 248 Bank Of Nova Scotia 549 0.00
3,350 BlueScope Steel Limited 4,008 0.00 (6,842) BlackBerry Limited 2,117 0.00
169 Caltex Australia Limited 102 0.00 (225) Brookfield Asset Management Inc 468 0.00
2,711 Cimic Group Limited 11,340 0.01 3,192 Cameco Corporation 5,010 0.00
6,638 Coca-Cola Amatil Limited 1,145 0.00 601 Canadian Imperial Bank of Commerce 2,766 0.00
9,825 CSR Limited 6,168 0.00 469 Canadian National Railway Company 1,858 0.00
(98) Domino's Pizza Enterprises Limited 8 0.00 305 Canadian Natural Resources 624 0.00
14,389 Downer EDI Limited 12,639 0.01 862 Cenovus Energy Inc 237 0.00
2,960 Evolution Mining Limited 614 0.00 786 CGI Group Inc 307 0.00
15,670 Fortescue Metals Group Limited 6,715 0.01 (4,697) Cott Corporation 5,940 0.00
1,882 G8 Education Limited 326 0.00 626 Crescent Point Energy Corporation 617 0.00
19,487 Harvey Norman Holdings Limited 1,977 0.00 419 Domtar Corporation 925 0.00
(18,297) Healthscope Limited 3,963 0.00 250 Enbridge Inc 353 0.00
11,544 Insurance Australia Group Limited 3,657 0.00 (7,319) First Majestic Silver Corporation 6,667 0.01
492 IOOF Holdings Limited 204 0.00 (1,254) Franco-Nevada Corporation 3,351 0.00 716 LendLease Group 607 0.00 (1,061) Gildan Activewear Inc 2,035 0.00 313 Macquaire Group Limited 1,331 0.00 808 Imperial Oil Limited 2,115 0.00
392 Magellan Financial Group Limited 355 0.00 1,159 Magna International Inc 3,238 0.00
(101,415) Mayne Pharma Group Limited 7,942 0.01 49 Manulife Financial Corporation 160 0.00
16,616 Medibank Private Limited 3,115 0.00 (9,889) New Gold Inc 3,547 0.00
1,961 Mineral Resources Limited 2,460 0.00 339 Open Text Corporation 53 0.00
709 Newcrest Mining Limited 883 0.00 (1,232) Pan American Silver Corporation 1,912 0.00
15,769 Northern Star Resources Limited 1,605 0.00 81 Potash Corporation Of Saskatchewan 150 0.00
2,819 Orica Limited 804 0.00 165 Precision Drilling Corporation 161 0.00
16,386 Orora Limited 1,426 0.00 (5,287) Pretium Resources Inc 2,049 0.00
10,795 OZ Minerals Limited 11,686 0.01 637 Restaurant Brands Intl Inc 2,151 0.00
83 Perpetual Limited 74 0.00 6 Rogers Communications Inc-Class B shares - 0.00
(4,332) Platinum Asset Management Limited 864 0.00 569 Royal Bank Of Canada 2,926 0.00
10,346 Primary Health Care Limited 1,037 0.00 2,088 Shaw Communications Inc 795 0.00
41,312 Qantas Airways Limited 4,489 0.00 (4,045) Silver Wheaton Corporation 2,755 0.00
(866) REA Group Limited 288 0.00 2,019 Sun Life Financial Inc 8,242 0.01
23,259 Regis Resources Limited 2,168 0.00 11 Teck Resources Limited 43 0.00
(2,403) Sonic Healthcare Limited 197 0.00 701 TELUS Corporation 831 0.00
(470) South32 Limited 26 0.00 976 Toronto-Dominion Bank 3,868 0.00
(44,772) Spotless Group Holdings Limited 1,748 0.00 231 TransCanada Corporation 241 0.00
4,426 SunCorporation Group Limited 3,395 0.00 70,318 0.05
(6,193) Sydney Airport 3,354 0.00
2,949 TabCorporation Holdings Limited 230 0.00 ChinaChinaChinaChina
(25,442) TPG Telecom Limited 29,385 0.02 (14,000) Air China Limited 301 0.00
(7,140) Transurban Group 2,400 0.00 (1,000) Anhui Conch Cement Company Limited 48 0.00
(10,442) Treasury Wine Estates Limited 785 0.00 (500) BYD Company Limited 318 0.00
(45,928) Vocus Communications Limited 52,833 0.04 (312,000) CGN Power Company Limited 5,309 0.00
(5,821) Whitehaven Coal Limited 1,148 0.00 (77) China Biologic Products Inc 894 0.00
194 WorleyParsons Limited 90 0.00 4,000 China Communications Construction 260 0.00
208,819 0.16 88,000 China Construction Bank 1,831 0.00
(2,000) China Eastern Airlines Company 144 0.00
AustriaAustriaAustriaAustria (67,000) China Longyuan Power Group Corporation Limited 2,312 0.00
(6,566) Ams AG 1,784 0.00 (9,000) China Medical System Holdings Limited 549 0.00
1,853 Andritz AG 4,618 0.00 (35,000) China Mengniu Dairy Company Limited 150 0.00
1,036 Erste Group Bank AG 562 0.00 (2,000) China Pacific Insurance Group 221 0.00
990 OMV AG 7,551 0.01 1,000 China Railway Group Limited 57 0.00
2,954 Raiffeisen Bank International AG 4,908 0.00 (10,000) China Southern Airlines Company-Class H Shares 705 0.00
79 Voestalpine AG 412 0.00 (206,000) China Telecom Corporation Limited-Class H Shares 8,853 0.01
19,835 0.02 (13,000) China Vanke Company Limited 3,078 0.00
(9,000) CITIC Securities Company Limited 1,297 0.00
BelgiumBelgiumBelgiumBelgium (26,000) CRRC Corporation Limited 568 0.00
3,330 Ageas 18,022 0.01 (36,000) Dongfeng Motor Group Company Limited 2,843 0.00
(1,262) Anheuser-Busch InBev SA 12,084 0.01 (25,500) Fosun International Limited 178 0.00
22 bpost SA 1 0.00 (4,000) GF Securities Company Limited 530 0.00
(34) Colruyt SA 75 0.00 (52,000) Guangzhou R&F Properties Company Limited 9,732 0.01
1,623 Galapagos NV 2,214 0.00 (4,000) Hengan International Group Company Limited 1,876 0.00
2,878 KBC Groep NV 10,380 0.01 (276,000) Huaneng Renewables Corporation Limited 5,894 0.00
3,411 Proximus 4,009 0.00 (43,000) Kingsoft Corporation Limited 6,216 0.00
766 Solvay SA 46 0.00 (2,000) Longfor Properties Company Limited 6 0.00
(244) UCB SA 11,184 0.01 (2,000) Shanghai Electric Group Company 8 0.00
1,304 Umicore SA 138 0.00 (3,000) Shenzhou International Group Holdings Limited 727 0.00
58,153 0.05 136,000 Sihuan Pharmaceutical Holdings Corporation 6,479 0.01
(93) SINA Corporation 1,621 0.00
BermudaBermudaBermudaBermuda 42,000 Sinopec Shanghai Petrochemical Company Limited 1,305 0.00
229 Arch Capital Group Limited 2,677 0.00 (47) Sohu.com Inc 267 0.00
292 Aspen Insurance Holdings Limited 1,724 0.00 (1,000) Sunac China Holdings Limited 14 0.00
2,229 Assured Guaranty Limited 17,808 0.01 (2,000) Sunny Optical Technology Group Company Limited 1,334 0.00
1,516 Axis Capital Holdings Limited 11,499 0.01 (1,700) Tencent Holdings Limited 561 0.00
302 Essent Group Limited 1,490 0.00 6,000 Tingyi (Cayman Islands) Holding Corporation 54 0.00
392 Everest Re Group Limited 8,041 0.01 (6,000) Tsingtao Brewery Company Limited 280 0.00
220

Man Funds VI PlcSchedule of Investments as at 31 December 2016 (continued)Man AHL Multi Strategy Alternative (continued)
Financial assets at fair value through profit or loss (continued)Financial assets at fair value through profit or loss (continued)Financial assets at fair value through profit or loss (continued)Financial assets at fair value through profit or loss (continued)
Fair Fair Fair Fair % of% of% of% of Fair Fair Fair Fair % of% of% of% of
Value Value Value Value NetNetNetNet Value Value Value Value NetNetNetNet
Nominal Nominal Nominal Nominal DescriptionDescriptionDescriptionDescription US$ US$ US$ US$ AssetsAssetsAssetsAssets Nominal Nominal Nominal Nominal DescriptionDescriptionDescriptionDescription US$ US$ US$ US$ AssetsAssetsAssetsAssets
Contracts for difference (b) (continued)Contracts for difference (b) (continued)Contracts for difference (b) (continued)Contracts for difference (b) (continued) Contracts for difference (b) (continued)Contracts for difference (b) (continued)Contracts for difference (b) (continued)Contracts for difference (b) (continued)
China (continued)China (continued)China (continued)China (continued) France (continued)France (continued)France (continued)France (continued)
65,000 Want Want China Holdings Limited 523 0.00 5,773 Schneider Electric SA 14,862 0.01
(114,000) Xinyi Solar Holdings Limited 7,106 0.01 99 SCOR Regroupe 314 0.00
126,700 Yangzijiang Shipbuilding Holdings Limited 3,234 0.00 (50) SEB SA 105 0.00
6,000 Zijin Mining Group Company Limited 178 0.00 287 Societe BIC SA 1,507 0.00
1,400 ZTE Corporation 388 0.00 347 Societe Generale 2,956 0.00
78,249 0.06 998 Sodexo SA 9,332 0.01
53 Teleperformance 844 0.00
DenmarkDenmarkDenmarkDenmark 874 Thales SA 7,600 0.01
(1,192) Carlsberg A/S 336 0.00 202 Ubisoft Entertainment 366 0.00
(1,127) Coloplast 729 0.00 1,243 Valeo SA 4,130 0.00
2,095 Danske Bank A/S 4,980 0.00 24,958 Vallourec SA 30,351 0.02
(1,215) Dong Energy A/S 434 0.00 (8,608) Veolia Environnement SA 19,659 0.02
(741) DSV A/S 4,259 0.00 516 Vinci SA 762 0.00
619 FLSmidth & Company A/S 1,191 0.00 126 Wendel Investissement 1,171 0.00
2,804 Genmab A/S 1,419 0.00 396,111 0.31
7,784 GN Store Nord A/S 9,780 0.01
3,498 H Lundbeck A/S 11,426 0.01 GermanyGermanyGermanyGermany
13,812 Novo Nordisk A/S 10,735 0.01 1,561 Aareal Bank AG 7,268 0.01
2,761 Pandora A/S 18,301 0.01 (585) Adidas AG 1,626 0.00
(3,642) TDC A/S 925 0.00 968 Allianz SE 8,301 0.01
250 Tryg A/S 7 0.00 4,624 BASF SE 28,430 0.02
11,831 Vestas Wind Systems A/S 31,179 0.02 2,546 Bayer AG 15,454 0.01
(670) William Demant Holding 8 0.00 (172) Bayerische Motoren Werke AG 43 0.00
95,709 0.07 105 Brenntag AG 459 0.00
1,242 Commerzbank AG 1,131 0.00
Faeroe IslandsFaeroe IslandsFaeroe IslandsFaeroe Islands 549 Continental AG 4,171 0.00
(118) Bakkafrost P/F 116 0.00 4,388 Covestro AG 81,069 0.06
(11,119) Deutsche Lufthansa AG 445 0.00
FinlandFinlandFinlandFinland 5,452 Deutsche Post AG 2,330 0.00
(4,711) Amer Sports OYJ 6,195 0.00 12,473 Deutsche Telekom AG 18,051 0.01
2,247 Cargotec OYJ 8,735 0.01 3,025 Deutsche Wohnen AG 4,661 0.00
2,864 Elisa OYJ 2,397 0.00 41 Duerr AG 10 0.00
5,614 Metso OYJ 6,280 0.00 12,054 E.ON SE 4,924 0.00
5,296 Neste OYJ 7,719 0.01 5,900 Evonik Industries AG 917 0.00
(12,029) Nokia OYJ 828 0.00 1,427 Fraport AG Frankfurt Airport Services Worldwide 5,394 0.00
173 Nokian Renkaat OYJ 641 0.00 5,488 Fresenius Medical Care AG & Company KGaA 38,127 0.03
2,060 Orion OYJ 13,403 0.01 4,906 Fresenius SE and Company KGaA 28,560 0.02
5,019 Outokumpu OYJ 14,651 0.01 4,439 GEA Group AG 4,622 0.00
338 Sampo OYJ 467 0.00 (1,568) Gerresheimer AG 3,524 0.00
42,175 Stora Enso OYJ 64,765 0.05 415 Hannover Rueck SE 4,275 0.00
13,125 UPM-Kymmene OYJ 60,218 0.05 2 Heidelberg Cement AG 7 0.00
4,716 Wartsila OYJ 13,887 0.01 1,512 Hochtief AG 17,671 0.01
200,186 0.16 336 Hugo Boss AG 1,450 0.00
43 Infineon Technologies AG 34 0.00
FranceFranceFranceFrance 1,406 K+S AG 3,983 0.00
10,391 Air France-KLM 400 0.00 1,866 Kion Group AG 13,405 0.01
48 Air Liquide SA 656 0.00 4,213 Kloeckner & Company 1,209 0.00
5,514 Airbus Group SE 7,243 0.01 375 Lanxess AG 1,831 0.00
28 Alstom SA 70 0.00 (2,832) Leg Immobilien AG 10,673 0.01
1,311 Arkema SA 12,697 0.01 716 Merck KGaA 3,599 0.00
652 Atos SE 1,649 0.00 2,823 Metro AG 11,614 0.01
4,492 AXA SA 16,706 0.01 829 Muenchener Rueckversicherungs-Gesellschaft AG 9,713 0.01
985 BNP Paribas SA 9,035 0.01 (2,737) Nordex SE 12,250 0.01
4,114 Cap Gemini SA 20,949 0.02 (1,485) Orsam Licht 4,708 0.00
3,244 Carrefour SA 5,105 0.00 4,598 Prosieben Sat 1 Media SE 8,901 0.01
5,375 Casino Guichard Perrachon 7,976 0.01 (834) RWE AG 34,022 0.03
134 Christian Dior SE 5,098 0.00 8,937 Schaeffler AG 5,345 0.00
3,543 Cie de Saint-Gobain 17,533 0.01 737 Siemens AG 8,180 0.01
1,263 Cie Generale des Etablissements Michelin 11,422 0.01 4,604 Software AG 2,338 0.00
(598) Cie Generale d'Optique Essilor International SA 90 0.00 1,410 STADA Arzneimittel AG 1,650 0.00
2,594 CNP Assurances 8,030 0.01 123 Suedzucker AG 3 0.00
(706) Danone SA 2,150 0.00 2,170 Telefonica Deutschland Holding AG 1,231 0.00
(1,062) Dassault Systemes 273 0.00 (1,635) TUI AG 130 0.00
(3,247) Edenred 4,528 0.00 6,657 Uniper SE 9,466 0.01
(23,167) EDF 19,432 0.02 (3,553) United Internet AG 1,610 0.00
301 Eiffage 498 0.00 366 Volkswagen AG 2,266 0.00
3,531 Engie SA 1,599 0.00 (984) Vonovia 1,001 0.00
583 Eurazeo SA 1,827 0.00 30 Wacker Chemie AG 516 0.00
2,995 Faurecia 7,809 0.01 (3,305) Wirecard AG 5,569 0.00
(5,167) Groupe Eurotunnel SA 11,880 0.01 6,957 Zalando SE 12,108 0.01
(47) Hermes International 3 0.00 450,275 0.35
(1,123) Iliad SA 1,794 0.00
878 Imerys SA 9,186 0.01 Hong KongHong KongHong KongHong Kong
574 Ingenico 546 0.00 (580,000) Alibaba Pictures Group Limited 21,412 0.02
(230) JCDecaux SA 105 0.00 (158,000) Beijing Enterprises Water Group Limited 2,015 0.00
1,393 Legrand SA 3,282 0.00 (2,000) Cheung Kong Infrastructure Holdings Limited 721 0.00
1,610 L'Oreal SA 19,498 0.02 (7,500) Cheung Kong Property Holding 3,452 0.00
1,767 LVMH Moet Hennessy Louis Vuitton SE 15,288 0.01 (54,000) China Everbright International Limited 2,828 0.00
6,124 Natixis SA 8,746 0.01 (18,000) China Everbright Limited 1,337 0.00
154 Nexans SA 90 0.00 (4,000) China Merchants Holdings International Company Limited 1,738 0.00
15,810 Orange SA 20,379 0.02 (86,000) China Power International 1,914 0.00
1,905 Pernod Ricard SA 1,468 0.00 (2,000) China Resources Gas Group Limited 276 0.00
12,745 Peugeot SA 8,360 0.01 (26,000) China Unicom Hong Kong Limited 468 0.00
1,614 Plastic Omnium 2,138 0.00 (60,000) Citic Pacific Limited 1,256 0.00
38 Publicis Groupe SA 181 0.00 18,000 CSPC Pharmaceutical Group Limited 484 0.00
3,422 Renault SA 8,816 0.01 (729,000) GCL-Poly Energy Holdings Limited 10,454 0.01
1,826 Rexel SA 2,565 0.00 (51,000) Guotai Junan International 3,905 0.00
4,672 Safran SA 17,256 0.01 (14,000) Haitong International Securities Group Limited 626 0.00
1,296 Sanofi 7,796 0.01 (7,000) Hang Lung Properties Limited 438 0.00
221
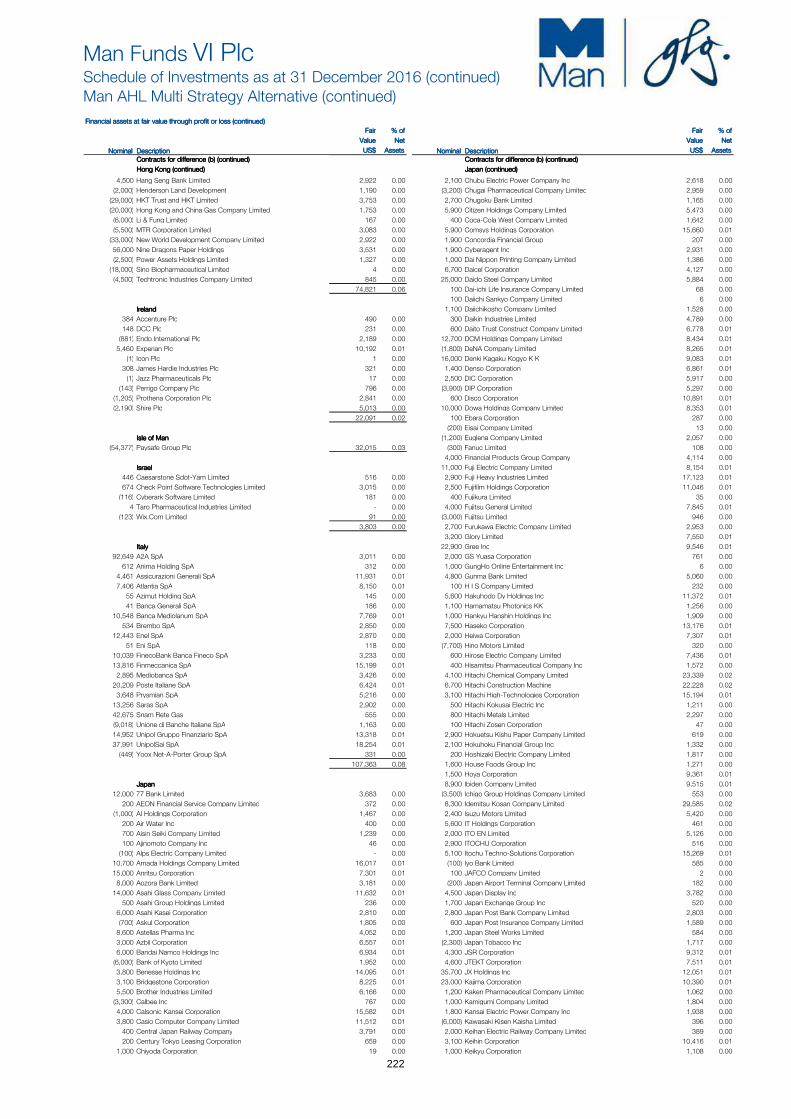
Man Funds VI PlcSchedule of Investments as at 31 December 2016 (continued)Man AHL Multi Strategy Alternative (continued)
Financial assets at fair value through profit or loss (continued)Financial assets at fair value through profit or loss (continued)Financial assets at fair value through profit or loss (continued)Financial assets at fair value through profit or loss (continued)
Fair Fair Fair Fair % of% of% of% of Fair Fair Fair Fair % of% of% of% of
Value Value Value Value NetNetNetNet Value Value Value Value NetNetNetNet
Nominal Nominal Nominal Nominal DescriptionDescriptionDescriptionDescription US$ US$ US$ US$ AssetsAssetsAssetsAssets Nominal Nominal Nominal Nominal DescriptionDescriptionDescriptionDescription US$ US$ US$ US$ AssetsAssetsAssetsAssets
Contracts for difference (b) (continued)Contracts for difference (b) (continued)Contracts for difference (b) (continued)Contracts for difference (b) (continued) Contracts for difference (b) (continued)Contracts for difference (b) (continued)Contracts for difference (b) (continued)Contracts for difference (b) (continued)
Hong Kong (continued)Hong Kong (continued)Hong Kong (continued)Hong Kong (continued) Japan (continued)Japan (continued)Japan (continued)Japan (continued)
4,500 Hang Seng Bank Limited 2,922 0.00 2,100 Chubu Electric Power Company Inc 2,618 0.00
(2,000) Henderson Land Development 1,190 0.00 (3,200) Chugai Pharmaceutical Company Limited 2,959 0.00
(29,000) HKT Trust and HKT Limited 3,753 0.00 2,700 Chugoku Bank Limited 1,165 0.00
(20,000) Hong Kong and China Gas Company Limited 1,753 0.00 5,900 Citizen Holdings Company Limited 5,473 0.00
(6,000) Li & Fung Limited 167 0.00 400 Coca-Cola West Company Limited 1,642 0.00
(5,500) MTR Corporation Limited 3,083 0.00 5,900 Comsys Holdings Corporation 15,660 0.01
(33,000) New World Development Company Limited 2,922 0.00 1,900 Concordia Financial Group 207 0.00
56,000 Nine Dragons Paper Holdings 3,531 0.00 1,900 Cyberagent Inc 2,931 0.00
(2,500) Power Assets Holdings Limited 1,327 0.00 1,000 Dai Nippon Printing Company Limited 1,386 0.00
(18,000) Sino Biopharmaceutical Limited 4 0.00 6,700 Daicel Corporation 4,127 0.00
(4,500) Techtronic Industries Company Limited 845 0.00 25,000 Daido Steel Company Limited 5,884 0.00
74,821 0.06 100 Dai-ichi Life Insurance Company Limited 68 0.00
100 Daiichi Sankyo Company Limited 6 0.00
IrelandIrelandIrelandIreland 1,100 Daiichikosho Company Limited 1,528 0.00
384 Accenture Plc 490 0.00 300 Daikin Industries Limited 4,789 0.00
148 DCC Plc 231 0.00 600 Daito Trust Construct Company Limited 6,778 0.01
(881) Endo International Plc 2,189 0.00 12,700 DCM Holdings Company Limited 8,434 0.01
5,460 Experian Plc 10,192 0.01 (1,800) DeNA Company Limited 8,265 0.01
(1) Icon Plc 1 0.00 16,000 Denki Kagaku Kogyo K K 9,083 0.01
308 James Hardie Industries Plc 321 0.00 1,400 Denso Corporation 6,861 0.01
(1) Jazz Pharmaceuticals Plc 17 0.00 2,500 DIC Corporation 5,917 0.00
(143) Perrigo Company Plc 796 0.00 (3,900) DIP Corporation 5,297 0.00
(1,205) Prothena Corporation Plc 2,841 0.00 600 Disco Corporation 10,891 0.01
(2,190) Shire Plc 5,013 0.00 10,000 Dowa Holdings Company Limited 8,353 0.01
22,091 0.02 100 Ebara Corporation 287 0.00
(200) Eisai Company Limited 13 0.00
Isle of ManIsle of ManIsle of ManIsle of Man (1,200) Euglena Company Limited 2,057 0.00
(54,377) Paysafe Group Plc 32,015 0.03 (300) Fanuc Limited 108 0.00
4,000 Financial Products Group Company 4,114 0.00
IsraelIsraelIsraelIsrael 11,000 Fuji Electric Company Limited 8,154 0.01
446 Caesarstone Sdot-Yam Limited 516 0.00 2,900 Fuji Heavy Industries Limited 17,123 0.01
674 Check Point Software Technologies Limited 3,015 0.00 2,500 Fujifilm Holdings Corporation 11,046 0.01
(116) Cyberark Software Limited 181 0.00 400 Fujikura Limited 35 0.00
4 Taro Pharmaceutical Industries Limited - 0.00 4,000 Fujitsu General Limited 7,845 0.01
(123) Wix.Com Limited 91 0.00 (3,000) Fujitsu Limited 946 0.00
3,803 0.00 2,700 Furukawa Electric Company Limited 2,953 0.00
3,200 Glory Limited 7,550 0.01
ItalyItalyItalyItaly 22,900 Gree Inc 9,546 0.01
92,649 A2A SpA 3,011 0.00 2,000 GS Yuasa Corporation 761 0.00
612 Anima Holding SpA 312 0.00 1,000 GungHo Online Entertainment Inc 6 0.00
4,461 Assicurazioni Generali SpA 11,931 0.01 4,800 Gunma Bank Limited 5,060 0.00
7,406 Atlantia SpA 8,150 0.01 100 H I S Company Limited 232 0.00
55 Azimut Holding SpA 145 0.00 5,600 Hakuhodo Dy Holdings Inc 11,372 0.01
41 Banca Generali SpA 186 0.00 1,100 Hamamatsu Photonics KK 1,256 0.00
10,548 Banca Mediolanum SpA 7,769 0.01 1,000 Hankyu Hanshin Holdings Inc 1,909 0.00
534 Brembo SpA 2,850 0.00 7,500 Haseko Corporation 13,176 0.01
12,443 Enel SpA 2,870 0.00 2,000 Heiwa Corporation 7,307 0.01
51 Eni SpA 118 0.00 (7,700) Hino Motors Limited 320 0.00
10,039 FinecoBank Banca Fineco SpA 3,233 0.00 600 Hirose Electric Company Limited 7,436 0.01
13,816 Finmeccanica SpA 15,199 0.01 400 Hisamitsu Pharmaceutical Company Inc 1,572 0.00
2,895 Mediobanca SpA 3,426 0.00 4,100 Hitachi Chemical Company Limited 23,339 0.02
20,209 Poste Italiane SpA 6,424 0.01 6,700 Hitachi Construction Machine 22,228 0.02
3,648 Prysmian SpA 5,216 0.00 3,100 Hitachi High-Technologies Corporation 15,194 0.01
13,256 Saras SpA 2,902 0.00 500 Hitachi Kokusai Electric Inc 1,211 0.00
42,675 Snam Rete Gas 555 0.00 800 Hitachi Metals Limited 2,297 0.00
(9,018) Unione di Banche Italiane SpA 1,163 0.00 100 Hitachi Zosen Corporation 47 0.00
14,952 Unipol Gruppo Finanziario SpA 13,318 0.01 2,900 Hokuetsu Kishu Paper Company Limited 619 0.00
37,991 UnipolSai SpA 18,254 0.01 2,100 Hokuhoku Financial Group Inc 1,332 0.00
(449) Yoox Net-A-Porter Group SpA 331 0.00 200 Hoshizaki Electric Company Limited 1,817 0.00
107,363 0.08 1,600 House Foods Group Inc 1,271 0.00
1,500 Hoya Corporation 9,361 0.01
JapanJapanJapanJapan 8,900 Ibiden Company Limited 9,515 0.01
12,000 77 Bank Limited 3,683 0.00 (3,500) Ichigo Group Holdings Company Limited 553 0.00
200 AEON Financial Service Company Limited 372 0.00 8,300 Idemitsu Kosan Company Limited 29,585 0.02
(1,000) AI Holdings Corporation 1,467 0.00 2,400 Isuzu Motors Limited 5,420 0.00
200 Air Water Inc 400 0.00 5,600 IT Holdings Corporation 461 0.00
700 Aisin Seiki Company Limited 1,239 0.00 2,000 ITO EN Limited 5,126 0.00
100 Ajinomoto Company Inc 46 0.00 2,900 ITOCHU Corporation 516 0.00
(100) Alps Electric Company Limited - 0.00 5,100 Itochu Techno-Solutions Corporation 15,269 0.01
10,700 Amada Holdings Company Limited 16,017 0.01 (100) Iyo Bank Limited 585 0.00
15,000 Anritsu Corporation 7,301 0.01 100 JAFCO Company Limited 2 0.00
8,000 Aozora Bank Limited 3,181 0.00 (200) Japan Airport Terminal Company Limited 182 0.00
14,000 Asahi Glass Company Limited 11,632 0.01 4,500 Japan Display Inc 3,782 0.00
500 Asahi Group Holdings Limited 236 0.00 1,700 Japan Exchange Group Inc 520 0.00
6,000 Asahi Kasei Corporation 2,810 0.00 2,800 Japan Post Bank Company Limited 2,803 0.00
(700) Askul Corporation 1,805 0.00 600 Japan Post Insurance Company Limited 1,589 0.00
8,600 Astellas Pharma Inc 4,052 0.00 1,200 Japan Steel Works Limited 584 0.00
3,000 Azbil Corporation 6,557 0.01 (2,300) Japan Tobacco Inc 1,717 0.00
6,000 Bandai Namco Holdings Inc 6,934 0.01 4,300 JSR Corporation 9,312 0.01
(6,000) Bank of Kyoto Limited 1,952 0.00 4,600 JTEKT Corporation 7,511 0.01
3,800 Benesse Holdings Inc 14,095 0.01 35,700 JX Holdings Inc 12,051 0.01
3,100 Bridgestone Corporation 8,225 0.01 23,000 Kajima Corporation 10,390 0.01
5,500 Brother Industries Limited 6,166 0.00 1,200 Kaken Pharmaceutical Company Limited 1,062 0.00
(3,300) Calbee Inc 767 0.00 1,000 Kamigumi Company Limited 1,804 0.00
4,000 Calsonic Kansei Corporation 15,582 0.01 1,800 Kansai Electric Power Company Inc 1,938 0.00
3,800 Casio Computer Company Limited 11,512 0.01 (6,000) Kawasaki Kisen Kaisha Limited 396 0.00
400 Central Japan Railway Company 3,791 0.00 2,000 Keihan Electric Railway Company Limited 389 0.00
200 Century Tokyo Leasing Corporation 659 0.00 3,100 Keihin Corporation 10,416 0.01
1,000 Chiyoda Corporation 19 0.00 1,000 Keikyu Corporation 1,108 0.00
222

Man Funds VI PlcSchedule of Investments as at 31 December 2016 (continued)Man AHL Multi Strategy Alternative (continued)
Financial assets at fair value through profit or loss (continued)Financial assets at fair value through profit or loss (continued)Financial assets at fair value through profit or loss (continued)Financial assets at fair value through profit or loss (continued)
Fair Fair Fair Fair % of% of% of% of Fair Fair Fair Fair % of% of% of% of
Value Value Value Value NetNetNetNet Value Value Value Value NetNetNetNet
Nominal Nominal Nominal Nominal DescriptionDescriptionDescriptionDescription US$ US$ US$ US$ AssetsAssetsAssetsAssets Nominal Nominal Nominal Nominal DescriptionDescriptionDescriptionDescription US$ US$ US$ US$ AssetsAssetsAssetsAssets
Contracts for difference (b) (continued)Contracts for difference (b) (continued)Contracts for difference (b) (continued)Contracts for difference (b) (continued) Contracts for difference (b) (continued)Contracts for difference (b) (continued)Contracts for difference (b) (continued)Contracts for difference (b) (continued)
Japan (continued)Japan (continued)Japan (continued)Japan (continued) Japan (continued)Japan (continued)Japan (continued)Japan (continued)
11,200 Kinden Corporation 14,723 0.01 300 Oki Electric Industry Company Limited 428 0.00
100 Kirin Holdings Company Limited 8 0.00 3,000 Okuma Corporation 6,537 0.01
900 Kobayashi Pharmaceutical Company Limited 620 0.00 1,400 Omron Corporation 7,014 0.01
500 Koito Manufacturing Company Limited 4,045 0.00 (8,800) ONO Pharmaceutical Company Limited 8,627 0.01
1,800 Komatsu Limited 3,726 0.00 700 Oracle Corporation Japan 900 0.00
600 Konami Holdings Corporation 4,634 0.00 4,000 Orix Corporation 7,456 0.01
500 Konica Minolta Inc 1,221 0.00 14,000 Osaka Gas Company Limited 2,248 0.00
35,000 Kumagai Gumi Company Limited 3,756 0.00 800 OSG Corporation 513 0.00
4,400 Kuraray Company Limited 12,973 0.01 (100) Otsuka Corporation 119 0.00
3,700 Kurita Water Industries Limited 5,987 0.00 200 Otsuka Holdings Company Limited 704 0.00
1,200 Kyocera Corporation 9,719 0.01 (5,800) Rakuten Inc 5,102 0.00
4,100 Kyowa Exeo Corporation 2,804 0.00 1,000 Recruit Holdings Company Limited 5,443 0.00
(1,400) Kyowa Hakko Kirin Company Limited 649 0.00 (500) Renesas Electronics Corporation 586 0.00
2,000 Kyudenko Corporation 1,238 0.00 12,500 Resona Holdings Inc 10,830 0.01
400 Kyushu Financial Group Inc 34 0.00 (100) Resorttrust Inc 33 0.00
400 Lawson Inc 1,213 0.00 4,400 Sankyo Company Limited 8,489 0.01
7,300 Leopalace21 Corporation 3,403 0.00 8,000 Sankyu Inc 1,472 0.00
(2,700) Line Corporation NPV 15,137 0.01 (600) Sanrio Company Limited 224 0.00
2,000 Lixil Group Corporation 5,268 0.00 (10,100) Santen Pharmaceutical Company Limited 777 0.00
500 Makita Corporation 2,636 0.00 15,900 Sanwa Holdings Corporation 13,202 0.01
3,500 Marubeni Corporation 434 0.00 400 Sapporo Holdings Limited 202 0.00
700 Maruha Nichiro Corporation 1,587 0.00 (2,000) Sawai Pharmaceutical Company Limited 4,628 0.00
2,500 Maruichi Steel Tube Limited 7,070 0.01 10,300 SBI Holdings Inc 16,410 0.01
700 Matsui Securities Company Limited 1,098 0.00 1,200 SCREEN Holdings Company Limited 7,621 0.01
600 Matsumotokiyoshi Holdings Company Limited 2,022 0.00 100 SCSK Corporation 147 0.00
4,600 Mazda Motor Corporation 8,331 0.01 700 Secom Company Limited 2,928 0.00
3,600 Meitec Corporation 19,204 0.02 9,600 Sega Sammy Holdings Inc 9,953 0.01
1,000 Minebea Company Limited 216 0.00 4,500 Seiko Epson Corporation 17,570 0.01
1,500 Miraca Holdings Inc 3,999 0.00 12,600 Seino Holdings Company Limited 14,613 0.01
(1,300) MISUMI Group Inc 422 0.00 6,500 Sekisui Chemical Company Limited 15,479 0.01
5,400 Mitsubishi Chemical Holdings Corporation 3,493 0.00 400 Seven Bank Limited 48 0.00
1,900 Mitsubishi Corporation 1,601 0.00 16,000 Shimizu Corporation 6,936 0.01
4,400 Mitsubishi Electric Corporation 8,643 0.01 100 Shin-Etsu Chemical Company Limited 1,640 0.00
7,800 Mitsubishi Gas Chemical Company 37,729 0.03 41,000 Shinsei Bank Limited 5,961 0.00
200 Mitsubishi Materials Corporation 1,431 0.00 (800) Sohgo Security Services Company Limited 3,354 0.00
100 Mitsubishi Motors Corporation 75 0.00 29,800 Sojitz Corporation 889 0.00
4,000 Mitsubishi Tanabe Pharma Corporation 6,452 0.01 700 Sompo Japan Nipponkoa Holdings Inc 3,866 0.00
200 Mitsubishi UFJ Financial Group 336 0.00 (5,400) So-Net M3 Inc 9,504 0.01
100 Mitsubishi UFJ Lease & Finance Company Limited 36 0.00 2,000 Sony Financial Holdings Inc 4,581 0.00
8,000 Mitsui Chemicals Inc 2,367 0.00 (1,300) Sosei Group Corporation 5,950 0.00
2,000 Mitsui Engineering and Shipbuilding Company Limited 612 0.00 1,000 Sotetsu Holdings Inc 3 0.00
2,000 Mitsui Mining and Smelting Company Limited 958 0.00 (100) Square Enix Holdings Company Limited 8 0.00
3,900 Mixi Inc 13,039 0.01 500 Stanley Electric Company Limited 1,013 0.00
(7,800) MonotaRO Company Limited 10,451 0.01 3,700 Start Today Company Limited 9,462 0.01
500 Morinaga and Company Limited 263 0.00 9,600 Sumitomo Corporation 9,781 0.01
(1,000) Morinaga Milk Industry Company Limited 84 0.00 3,300 Sumitomo Dainippon Pharma Company Limited 4,938 0.00
1,900 Ms&Ad Insurance Group Holdin 1,361 0.00 3,200 Sumitomo Electric Industries Limited 4,949 0.00
3,000 Nagoya Railroad Company Limited 887 0.00 (11,800) Sumitomo Forestry Company Limited 2,379 0.00
10,000 NEC Corporation 2,730 0.00 9,000 Sumitomo Heavy Industries Limited 7,526 0.01
3,700 Nexon Company Limited 2,631 0.00 2,100 Sumitomo Mitsui Financial Group Inc 5,716 0.00
100 Next Company Limited 4 0.00 18,000 Sumitomo Osaka Cement Company Limited 1,178 0.00
1,000 NGK Insulators Limited 2,178 0.00 7,800 Sumitomo Rubber Industries Limited 14,097 0.01
2,000 NH Foods Limited 3,423 0.00 1,000 Sundrug Company Limited 3,813 0.00
8,400 NHK Spring Company Limited 8,406 0.01 3,200 Suruga Bank Limited 2,460 0.00
400 Nichi-Iko Pharmaceutical Company 311 0.00 2,700 Suzuken Company Limited 10,161 0.01
7,800 Nichirei Corporation 13,154 0.01 1,300 Suzuki Motor Corporation 5,488 0.00
1,300 Nifco Inc 3,845 0.00 (1,500) Sysmex Corporation 5,116 0.00
(900) Nihon M&A Center Inc 136 0.00 4,300 T&D Holdings Inc 9,638 0.01
8,200 Nihon Unisys Limited 11,901 0.01 100 Tadano Limited 226 0.00
5,500 Nikon Corporation 13,131 0.01 24,000 Taisei Corporation 7,063 0.01
(600) Nintendo Company Limited 6,143 0.00 500 Takara Holdings Inc 120 0.00
4,000 Nippo Corporation 3,818 0.00 1,800 TechnoPro Holdings Inc 1,742 0.00
4,000 Nippon Electric Glass Company Limited 1,334 0.00 1,100 Teijin Limited 4,294 0.00
5,000 Nippon Express Company Limited 765 0.00 2,900 Temp Holdings Company Limited 2,812 0.00
10,000 Nippon Kayaku Company Limited 13,423 0.01 1,100 Terumo Corporation 1,585 0.00
47,700 Nippon Light Metal Holdings Company 3,983 0.00 1,700 Toho Company Limited 2,615 0.00
1,000 Nippon Paper Industries Company Limited 135 0.00 15,000 Toho Gas Company Limited 13,567 0.01
600 Nippon Shokubai Company Limited 2,552 0.00 1,800 Toho Holdings Company Limited 1,074 0.00
1,500 Nippon Steel and Sumitomo Metal Corporation 6,753 0.01 100 Tokai Rika Company Limited 366 0.00
200 Nippon Suisan Kaisha Limited 129 0.00 4,200 Tokai Tokyo Financial Holdings 3,470 0.00
900 Nippon Telegraph and Telephone Corporation 1,286 0.00 700 Tokyo Electron Limited 12,103 0.01
2,200 Nippon Television Network Corporation 1,742 0.00 27,000 Tokyo Gas Company Limited 15,167 0.01
34,000 Nishimatsu Construction Company Limited 1,870 0.00 1,800 Tokyo Seimitsu Company Limited 4,135 0.00
300 Nissan Chemical Industries Limited 2,158 0.00 20,100 Tokyo Steel Manufacturing Company Limited 22,356 0.02
100 Nisshin Seifun Group Inc 107 0.00 300 Topcon Corporation 149 0.00
1,500 Nisshin Steel Company Limited 1,325 0.00 6,000 Toppan Printing Company Limited 7,764 0.01
200 Nisshinbo Holdings Inc 157 0.00 (3,000) Toray Industries Inc 286 0.00
700 NOK Corporation 992 0.00 1,700 Toridoll Corporation 2,018 0.00
5,200 Nomura Holdings Inc 2,404 0.00 (20,000) Toshiba Corporation 3,569 0.00
1,600 Nomura Research Institute Limited 5,024 0.00 15,000 Tosoh Corporation 16,088 0.01
200 NS Solutions Corporation 903 0.00 200 Toyo Suisan Kaisha Limited 141 0.00
11,500 NSK Limited 17,299 0.01 1,000 Toyobo Company Limited 42 0.00
1,000 NTN Corporation 463 0.00 1,400 Toyoda Gosei Company Limited 3,676 0.00
1,000 NTT Data Corporation 4,551 0.00 5,400 Toyota Boshoku Corporation 7,965 0.01
2,300 NTT DOCOMO Inc 1,112 0.00 500 Toyota Motor Corporation 1,369 0.00
400 NTT Urban Development Corporation 407 0.00 5,100 Toyota Tsusho Corporation 23,321 0.02
14,500 Obayashi Corporation 12,568 0.01 (800) Trend Micro Inc 577 0.00
7,000 OJI Holdings Corporation 190 0.00 5,000 TS Tech Company Limited 14,716 0.01
1,000 Okamoto Industries Inc 559 0.00 2,600 Tsumura & Company 3,523 0.00
223

Man Funds VI PlcSchedule of Investments as at 31 December 2016 (continued)Man AHL Multi Strategy Alternative (continued)
Financial assets at fair value through profit or loss (continued)Financial assets at fair value through profit or loss (continued)Financial assets at fair value through profit or loss (continued)Financial assets at fair value through profit or loss (continued)
Fair Fair Fair Fair % of% of% of% of Fair Fair Fair Fair % of% of% of% of
Value Value Value Value NetNetNetNet Value Value Value Value NetNetNetNet
Nominal Nominal Nominal Nominal DescriptionDescriptionDescriptionDescription US$ US$ US$ US$ AssetsAssetsAssetsAssets Nominal Nominal Nominal Nominal DescriptionDescriptionDescriptionDescription US$ US$ US$ US$ AssetsAssetsAssetsAssets
Contracts for difference (b) (continued)Contracts for difference (b) (continued)Contracts for difference (b) (continued)Contracts for difference (b) (continued) Contracts for difference (b) (continued)Contracts for difference (b) (continued)Contracts for difference (b) (continued)Contracts for difference (b) (continued)
Japan (continued)Japan (continued)Japan (continued)Japan (continued) PortugalPortugalPortugalPortugal
(600) Tsuruha Holdings Inc 391 0.00 2,676 EDP Energias De Portugal SA 22 0.00
9,000 Ube Industries Limited 4,351 0.00 793 Galp Energia SGPS SA 284 0.00
3,700 Ulvac Inc 16,487 0.01 306 0.00
5,900 Unipres Corporation 18,940 0.01
1,600 Ushio Inc 4,133 0.00 Puerto RicoPuerto RicoPuerto RicoPuerto Rico
3,400 Uss Company Limited 3,874 0.00 619 Popular Inc 3,451 0.00
800 Welcia Holdings Company Limited 519 0.00
2,900 Yamaha Corporation 7,005 0.01 RussiaRussiaRussiaRussia
5,500 Yamato Holdings Company Limited 4,838 0.00 1,650 Polymetal International Plc 1,707 0.00
2,000 Yamato Kogyo Company Limited 4,572 0.00
5,200 Yokogawa Electric Corporation 8,410 0.01 SingaporeSingaporeSingaporeSingapore
4,700 Yokohama Rubber Company Limited 9,207 0.01 (2,100) Capitaland Limited 151 0.00
2,300 Zensho Holdings Company Limited 135 0.00 (2,500) City Developments Limited 46 0.00
6,000 Zeon Corporation 9,079 0.01 19,000 ComfortDelGro Corporation Limited 37 0.00
300 Zojirushi Corporation 494 0.00 400 DBS Group Holdings Limited 645 0.00
1,551,349 1.21 102,900 Genting Singapore Plc 6,435 0.01
(9,100) Global Logistic Properties Limited 17 0.00
JerseyJerseyJerseyJersey 1,300 Jardine Cycle & Carriage Limited 1,363 0.00
175,020 Centamin Plc 2,240 0.00 11,900 Oversea-Chinese Banking Corporation 1,566 0.00
1,811 Phoenix Group Holdings Plc 636 0.00 (2,100) Singapore Airlines Limited 122 0.00
6,187 Randgold Resources Limited 60,897 0.05 22,700 Singapore Airport Terminal Services Limited 703 0.00
63,773 0.05 (50,200) Singapore Post Limited 914 0.00
(25,500) Singapore Telecommunications Limited 4,675 0.00
LuxembourgLuxembourgLuxembourgLuxembourg 4,700 United Overseas Bank Limited 5,236 0.00
5,073 Aperam SA 12,158 0.01 4,000 Wilmar International Limited 934 0.00
(219) Millicom International Cellular SA 77 0.00 22,844 0.02
(576) SES 516 0.00
12,751 0.01 South AfricaSouth AfricaSouth AfricaSouth Africa
(420) Mediclinic International Plc 432 0.00
MaltaMaltaMaltaMalta
(26,985) GVC Holdings Plc 23,959 0.02 South KoreaSouth KoreaSouth KoreaSouth Korea
11,976 Kindred Group Plc 10,236 0.01 (397) Amorepacific Corporation 7,769 0.01
34,195 0.03 (121) BGF retail Company Limited 679 0.00
(3,945) BNK Financial Group Inc 245 0.00
NetherlandsNetherlandsNetherlandsNetherlands (1,382) Cheil Worldwide Inc 355 0.00
186 Aalberts Industries NV 178 0.00 (24) CJ CGV Company Limited 777 0.00
3,182 ABN AMRO Group NV 5,248 0.00 (265) CJ CheilJedang Corporation 1,772 0.00
20,321 Aegon NV 26,937 0.02 (254) CJ Korea Express Company Limited 3,598 0.00
2,144 Akzo Nobel NV 835 0.00 179 Com2uSCorporation 4 0.00
3,252 Altice NV 3,476 0.00 (61) Cosmax Inc 1,802 0.00
306 ASM International NV 1,183 0.00 (694) Coway Company Limited 1,383 0.00
7 ASML Holding NV 89 0.00 337 Daelim Industrial Company Limited 1,891 0.00
3,426 BE Semiconductor Industries 1,058 0.00 (2,327) Daewoo Securities Company Limited 1,481 0.00
2,041 Boskalis Westminster 3,078 0.00 120 Doosan Corporation 331 0.00
1,011 Chicago Bridge and Iron Company NV 1,275 0.00 476 Doosan Heavy Industries and Construction Co Limited 159 0.00
113 Core Laboratories NV 1,259 0.00 3,128 Doosan Infracore Company Limited 3,239 0.00
24 Exor NV 33 0.00 (751) Green Cross Corporation 437 0.00
2,316 Franks International NV 417 0.00 903 GS Engineering and Construction Corporation 503 0.00
782 Heineken NV 6,496 0.01 2,590 Hana Financial Group 1,132 0.00
(10,656) ING Groep NV 9,119 0.01 772 Hankook Tire Company Limited 1,090 0.00
(1,514) Interxion Holding NV 1,675 0.00 (990) Hanmi Science Company Limited 22,221 0.02
3,228 Koninklijke Ahold Delhaize NV 1,942 0.00 36 Hanwha Chemical Corporation 21 0.00
1,053 Koninklijke BAM Groep NV 83 0.00 (231) Hanwha Techwin Company Limited 83 0.00
3,076 Koninklijke Philips NV 5,781 0.00 (1,040) Hite Jinro Company Limited 95 0.00
172 Koninklijke Vopak NV 158 0.00 (157) Hotel Shilla Company Limited 2,521 0.00
2,699 NN Group NV 6,861 0.01 509 Hyosung Corporation 4,307 0.00
(40) Nxp Semiconductors NV 123 0.00 (238) Hyundai Department Store Company Limited 3,123 0.00
365 PostNL NV 30 0.00 31 Hyundai Development Company 38 0.00
188 Qiagen NV 960 0.00 1,696 Hyundai Engineering & Construction Company Limited 3,991 0.00
604 Randstad Holding NV 907 0.00 206 Hyundai Heavy Industries Company Limited 1,061 0.00
4,615 Royal Dutch Shell Plc 7,562 0.01 (33) Hyundai Marine and Fire Insurance Company Limited 4 0.00
(801) Steinhoff International Holdings NV 106 0.00 219 Hyundai Mobis 1,267 0.00
8,728 Tomtom NV 9,996 0.01 303 Hyundai Steel Company Limited 1,827 0.00
96,865 0.08 (1,338) Hyundai Wia Corporation 5,803 0.00
1,099 KB Financial Group Inc 2,280 0.00
New ZealandNew ZealandNew ZealandNew Zealand (39) KCC Corporation 1,037 0.00
5,276 Fletcher Building Limited 2,052 0.00 (590) KEPCO Plant Service & Engineering Company Limited 420 0.00
(14,769) SpArk New Zealand Limited 1,475 0.00 1,035 Kia Motors Corporation 1,773 0.00
3,527 0.00 (351) Kolon Industries Inc 755 0.00
(728) Korea Aerospace Industries Limited 1,853 0.00
NorwayNorwayNorwayNorway 812 Korea Gas Corporation 2,822 0.00
4,327 DNB ASA 4,540 0.00 (900) Korea Kolmar Company Limited 3,823 0.00
(53,297) DNO International ASA 2,974 0.00 128 Korea Petro Chemical Ind 6,909 0.01
3,453 Marine Harvest 956 0.00 31 Korea Zinc Company Limited 256 0.00
26,354 Norsk Hydro ASA 15,144 0.01 820 KT Corporation 124 0.00
5,616 Orkla ASA 1,449 0.00 127 LG Chem Limited 1,851 0.00
3,240 Salmar ASA 7,525 0.01 22 LG Corporation 30 0.00
(5,114) Schibsted ASA 14,780 0.01 310 LG Electronics Inc 621 0.00
1,700 Ship Finance International Limited 414 0.00 129 Lotte Chemical Corporation 7,488 0.01
6,048 Statoil ASA 1,687 0.00 (3) Lotte Chilsung Beverage Company 231 0.00
6,789 TGS Nopec Geophysical Company ASA 13,296 0.01 (94) Mando Corporation 369 0.00
1,391 Yara International ASA 9,362 0.01 (578) Medy-Tox Inc 7,214 0.01
72,127 0.06 (4,964) Meritz Securities Company Limited 79 0.00
(79) NAVER Corporation 338 0.00
PanamaPanamaPanamaPanama (100) NCSOFT Corporation 895 0.00
596 Copa Holdings SA 1,525 0.00 (578) NH Investment & Securities Company Limited 167 0.00
127 Nongshim Company Limited 3,898 0.00
PeruPeruPeruPeru (103) Orion Corporation 5,039 0.00
160 CrediCorporation Limited 773 0.00 268 Posco 5,613 0.00
224
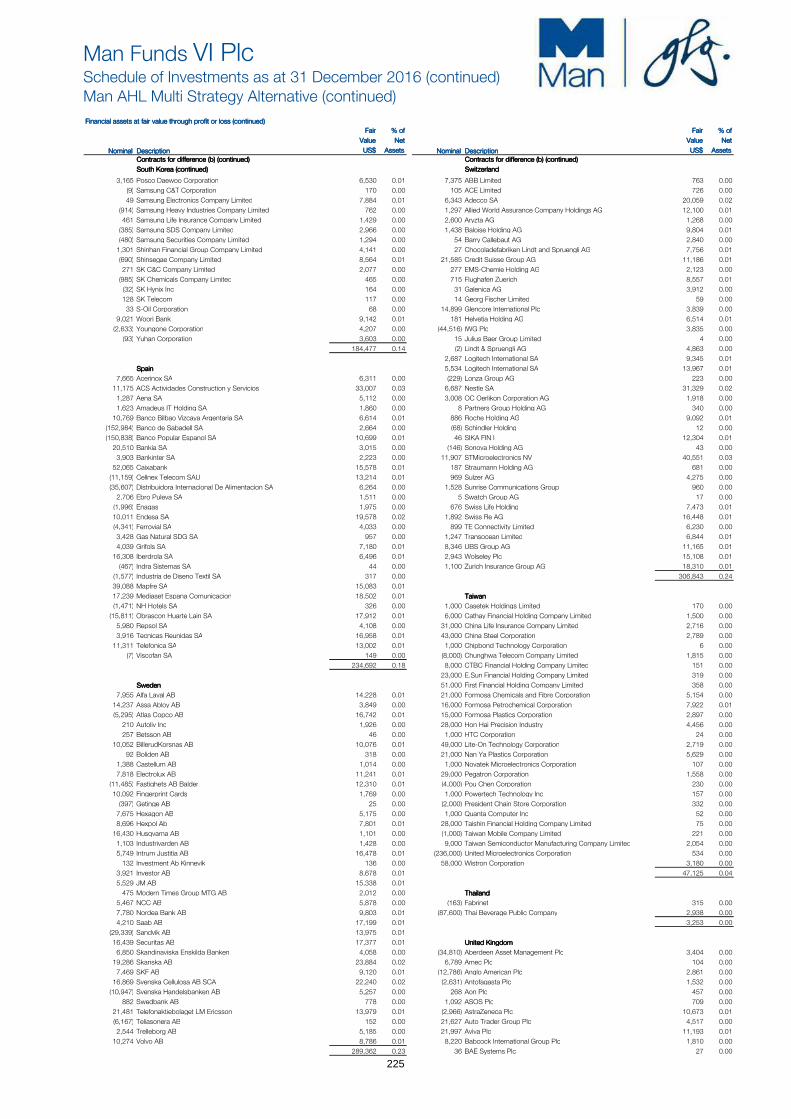
Man Funds VI PlcSchedule of Investments as at 31 December 2016 (continued)Man AHL Multi Strategy Alternative (continued)
Financial assets at fair value through profit or loss (continued)Financial assets at fair value through profit or loss (continued)Financial assets at fair value through profit or loss (continued)Financial assets at fair value through profit or loss (continued)
Fair Fair Fair Fair % of% of% of% of Fair Fair Fair Fair % of% of% of% of
Value Value Value Value NetNetNetNet Value Value Value Value NetNetNetNet
Nominal Nominal Nominal Nominal DescriptionDescriptionDescriptionDescription US$ US$ US$ US$ AssetsAssetsAssetsAssets Nominal Nominal Nominal Nominal DescriptionDescriptionDescriptionDescription US$ US$ US$ US$ AssetsAssetsAssetsAssets
Contracts for difference (b) (continued)Contracts for difference (b) (continued)Contracts for difference (b) (continued)Contracts for difference (b) (continued) Contracts for difference (b) (continued)Contracts for difference (b) (continued)Contracts for difference (b) (continued)Contracts for difference (b) (continued)
South Korea (continued)South Korea (continued)South Korea (continued)South Korea (continued) SwitzerlandSwitzerlandSwitzerlandSwitzerland
3,165 Posco Daewoo Corporation 6,530 0.01 7,375 ABB Limited 763 0.00
(9) Samsung C&T Corporation 170 0.00 105 ACE Limited 726 0.00
49 Samsung Electronics Company Limited 7,884 0.01 6,343 Adecco SA 20,059 0.02
(914) Samsung Heavy Industries Company Limited 762 0.00 1,297 Allied World Assurance Company Holdings AG 12,100 0.01
461 Samsung Life Insurance Company Limited 1,429 0.00 2,600 Aryzta AG 1,268 0.00
(385) Samsung SDS Company Limited 2,966 0.00 1,438 Baloise Holding AG 9,804 0.01
(480) Samsung Securities Company Limited 1,294 0.00 54 Barry Callebaut AG 2,840 0.00
1,301 Shinhan Financial Group Company Limited 4,141 0.00 27 Chocoladefabriken Lindt and Spruengli AG 7,756 0.01
(690) Shinsegae Company Limited 8,564 0.01 21,585 Credit Suisse Group AG 11,186 0.01
271 SK C&C Company Limited 2,077 0.00 277 EMS-Chemie Holding AG 2,123 0.00
(985) SK Chemicals Company Limited 465 0.00 715 Flughafen Zuerich 8,557 0.01
(32) SK Hynix Inc 164 0.00 31 Galenica AG 3,912 0.00
128 SK Telecom 117 0.00 14 Georg Fischer Limited 59 0.00
33 S-Oil Corporation 68 0.00 14,899 Glencore International Plc 3,839 0.00
9,021 Woori Bank 9,142 0.01 181 Helvetia Holding AG 6,514 0.01
(2,633) Youngone Corporation 4,207 0.00 (44,516) IWG Plc 3,835 0.00
(93) Yuhan Corporation 3,603 0.00 15 Julius Baer Group Limited 4 0.00
184,477 0.14 (2) Lindt & Spruengli AG 4,863 0.00
2,687 Logitech International SA 9,345 0.01
SpainSpainSpainSpain 5,534 Logitech International SA 13,967 0.01
7,665 Acerinox SA 6,311 0.00 (229) Lonza Group AG 223 0.00
11,175 ACS Actividades Construction y Servicios 33,007 0.03 6,687 Nestle SA 31,329 0.02
1,287 Aena SA 5,112 0.00 3,008 OC Oerlikon Corporation AG 1,918 0.00
1,623 Amadeus IT Holding SA 1,860 0.00 8 Partners Group Holding AG 340 0.00
10,769 Banco Bilbao Vizcaya Argentaria SA 6,614 0.01 886 Roche Holding AG 9,092 0.01
(152,984) Banco de Sabadell SA 2,664 0.00 (68) Schindler Holding 12 0.00
(150,838) Banco Popular Espanol SA 10,699 0.01 46 SIKA FIN I 12,304 0.01
20,510 Bankia SA 3,015 0.00 (146) Sonova Holding AG 43 0.00
3,903 Bankinter SA 2,223 0.00 11,907 STMicroelectronics NV 40,551 0.03
52,065 Caixabank 15,578 0.01 187 Straumann Holding AG 681 0.00
(11,159) Cellnex Telecom SAU 13,214 0.01 969 Sulzer AG 4,275 0.00
(35,607) Distribuidora Internacional De Alimentacion SA 6,264 0.00 1,528 Sunrise Communications Group 960 0.00
2,706 Ebro Puleva SA 1,511 0.00 5 Swatch Group AG 17 0.00
(1,996) Enagas 1,975 0.00 676 Swiss Life Holding 7,473 0.01
10,011 Endesa SA 19,578 0.02 1,892 Swiss Re AG 16,448 0.01
(4,341) Ferrovial SA 4,033 0.00 899 TE Connectivity Limited 6,230 0.00
3,428 Gas Natural SDG SA 957 0.00 1,247 Transocean Limited 6,844 0.01
4,039 Grifols SA 7,180 0.01 8,346 UBS Group AG 11,165 0.01
16,308 Iberdrola SA 6,496 0.01 2,943 Wolseley Plc 15,108 0.01
(467) Indra Sistemas SA 44 0.00 1,100 Zurich Insurance Group AG 18,310 0.01
(1,577) Industria de Diseno Textil SA 317 0.00 306,843 0.24
39,088 Mapfre SA 15,083 0.01
17,239 Mediaset Espana Comunicacion 18,502 0.01 TaiwanTaiwanTaiwanTaiwan
(1,471) NH Hotels SA 326 0.00 1,000 Casetek Holdings Limited 170 0.00
(15,811) Obrascon Huarte Lain SA 17,912 0.01 6,000 Cathay Financial Holding Company Limited 1,500 0.00
5,980 Repsol SA 4,108 0.00 31,000 China Life Insurance Company Limited 2,716 0.00
3,916 Tecnicas Reunidas SA 16,958 0.01 43,000 China Steel Corporation 2,789 0.00
11,311 Telefonica SA 13,002 0.01 1,000 Chipbond Technology Corporation 6 0.00
(7) Viscofan SA 149 0.00 (8,000) Chunghwa Telecom Company Limited 1,815 0.00
234,692 0.18 8,000 CTBC Financial Holding Company Limited 151 0.00
23,000 E.Sun Financial Holding Company Limited 319 0.00
SwedenSwedenSwedenSweden 51,000 First Financial Holding Company Limited 358 0.00
7,955 Alfa Laval AB 14,228 0.01 21,000 Formosa Chemicals and Fibre Corporation 5,154 0.00
14,237 Assa Abloy AB 3,849 0.00 16,000 Formosa Petrochemical Corporation 7,922 0.01
(5,295) Atlas Copco AB 16,742 0.01 15,000 Formosa Plastics Corporation 2,897 0.00
210 Autoliv Inc 1,926 0.00 28,000 Hon Hai Precision Industry 4,456 0.00
257 Betsson AB 46 0.00 1,000 HTC Corporation 24 0.00
10,052 BillerudKorsnas AB 10,076 0.01 49,000 Lite-On Technology Corporation 2,719 0.00
92 Boliden AB 318 0.00 21,000 Nan Ya Plastics Corporation 5,629 0.00
1,388 Castellum AB 1,014 0.00 1,000 Novatek Microelectronics Corporation 107 0.00
7,818 Electrolux AB 11,241 0.01 29,000 Pegatron Corporation 1,558 0.00
(11,485) Fastighets AB Balder 12,310 0.01 (4,000) Pou Chen Corporation 230 0.00
10,092 Fingerprint Cards 1,769 0.00 1,000 Powertech Technology Inc 157 0.00
(397) Getinge AB 25 0.00 (2,000) President Chain Store Corporation 332 0.00
7,675 Hexagon AB 5,175 0.00 1,000 Quanta Computer Inc 52 0.00
8,696 Hexpol Ab 7,801 0.01 28,000 Taishin Financial Holding Company Limited 75 0.00
16,430 Husqvarna AB 1,101 0.00 (1,000) Taiwan Mobile Company Limited 221 0.00
1,103 Industrivarden AB 1,428 0.00 9,000 Taiwan Semiconductor Manufacturing Company Limited 2,054 0.00
5,749 Intrum Justitia AB 16,478 0.01 (236,000) United Microelectronics Corporation 534 0.00
132 Investment Ab Kinnevik 136 0.00 58,000 Wistron Corporation 3,180 0.00
3,921 Investor AB 8,678 0.01 47,125 0.04
5,529 JM AB 15,338 0.01
475 Modern Times Group MTG AB 2,012 0.00 ThailandThailandThailandThailand
5,467 NCC AB 5,878 0.00 (163) Fabrinet 315 0.00
7,780 Nordea Bank AB 9,803 0.01 (87,600) Thai Beverage Public Company 2,938 0.00
4,210 Saab AB 17,199 0.01 3,253 0.00
(29,339) Sandvik AB 13,975 0.01
16,439 Securitas AB 17,377 0.01 United KingdomUnited KingdomUnited KingdomUnited Kingdom
6,850 Skandinaviska Enskilda Banken 4,058 0.00 (34,810) Aberdeen Asset Management Plc 3,404 0.00
19,286 Skanska AB 23,884 0.02 6,789 Amec Plc 104 0.00
7,469 SKF AB 9,120 0.01 (12,786) Anglo American Plc 2,861 0.00
16,869 Svenska Cellulosa AB SCA 22,240 0.02 (2,631) Antofagasta Plc 1,532 0.00
(10,947) Svenska Handelsbanken AB 5,257 0.00 268 Aon Plc 457 0.00
882 Swedbank AB 778 0.00 1,092 ASOS Plc 709 0.00
21,481 Telefonaktiebolaget LM Ericsson 13,979 0.01 (2,966) AstraZeneca Plc 10,673 0.01
(6,167) Teliasonera AB 152 0.00 21,627 Auto Trader Group Plc 4,517 0.00
2,544 Trelleborg AB 5,185 0.00 21,997 Aviva Plc 11,193 0.01
10,274 Volvo AB 8,786 0.01 8,220 Babcock International Group Plc 1,810 0.00
289,362 0.23 36 BAE Systems Plc 27 0.00
225

Man Funds VI PlcSchedule of Investments as at 31 December 2016 (continued)Man AHL Multi Strategy Alternative (continued)
Financial assets at fair value through profit or loss (continued)Financial assets at fair value through profit or loss (continued)Financial assets at fair value through profit or loss (continued)Financial assets at fair value through profit or loss (continued)
Fair Fair Fair Fair % of% of% of% of Fair Fair Fair Fair % of% of% of% of
Value Value Value Value NetNetNetNet Value Value Value Value NetNetNetNet
Nominal Nominal Nominal Nominal DescriptionDescriptionDescriptionDescription US$ US$ US$ US$ AssetsAssetsAssetsAssets Nominal Nominal Nominal Nominal DescriptionDescriptionDescriptionDescription US$ US$ US$ US$ AssetsAssetsAssetsAssets
Contracts for difference (b) (continued)Contracts for difference (b) (continued)Contracts for difference (b) (continued)Contracts for difference (b) (continued) Contracts for difference (b) (continued)Contracts for difference (b) (continued)Contracts for difference (b) (continued)Contracts for difference (b) (continued)
United Kingdom (continued)United Kingdom (continued)United Kingdom (continued)United Kingdom (continued) United Kingdom (continued)United Kingdom (continued)United Kingdom (continued)United Kingdom (continued)
4,068 Barclays Plc 269 0.00 67,700 Taylor Wimpey Plc 4,777 0.00
(15,561) Barratt Developments Plc 1,506 0.00 (115,606) Tesco Plc 8,242 0.01
6,631 Bellway Plc 15,403 0.01 (14,120) Travis Perkins Plc 2,012 0.00
4,129 Berkeley Group Holdings Plc 453 0.00 142 Tullett Prebon Plc 41 0.00
49,087 Booker Group Plc 842 0.00 17,682 UBM Plc 9,941 0.01
13,783 Bovis Homes Group 5,347 0.00 (8,128) United Utilities Group Plc 7,596 0.01
41,447 BP Plc 20,547 0.02 2,890 Vodafone Group Plc 16,400 0.01
98,683 BT Group Plc 12,996 0.01 25 Weir Group Plc 101 0.00
57 Bunzl Plc 45 0.00 2,494 WH Smith Plc 1,246 0.00
7,793 Burberry Group Plc 2,963 0.00 (4,575) Whitbread Plc 3,280 0.00
(125) Capita Group Plc 1,320 0.00 (98) Willis Towers Watson Plc 496 0.00
478 Cardtronics Plc 3,272 0.00 113,952 WM Morrison Supermarkets Plc 19,551 0.02
2,651 Centrica Plc 906 0.00 (2,802) Worldpay Group Plc 145 0.00
35 CNH Industrial NV 64 0.00 3,696 WPP Plc 5,561 0.00
(13,317) Cobham Plc 863 0.00 646,675 0.50
(1,332) Coca-Cola European Partners Plc 3,151 0.00
5,212 Compass Group Plc 8,189 0.01 United StatesUnited StatesUnited StatesUnited States
1,268 Croda International Plc 290 0.00 (1,955) 2U Inc 5,870 0.00
11,549 Daily Mail&General Tst-A NV 8,116 0.01 (2,635) 3D Systems Corporation 597 0.00
184 Delphi Automotive Plc 297 0.00 210 3M Company 1,054 0.00
601 Diageo Plc 176 0.00 860 Aaron's Inc 4,733 0.00
3,789 Dialog Semiconductor Plc 17,578 0.01 (23) Abbott Laboratories 34 0.00
22,707 Direct Line Insurance Group Plc 2,472 0.00 7 AbbVie Inc 40 0.00
83,375 Dixons Carphone Plc 7,722 0.01 (2,602) Abercrombie & Fitch Company 5,493 0.00
21,234 DS Smith Plc 968 0.00 (119) Abiomed Inc 11 0.00
2,364 Ensco Plc 3,950 0.00 40 ABM Industries Inc 45 0.00
10,782 Fiat Chrysler Automobiles NV 28,351 0.02 (83) Acacia Communications Inc 1,142 0.00
(748) G4S Plc 89 0.00 (2,370) Acceleron Pharma Inc 8,030 0.01
39,225 GKN Plc 5,151 0.00 (1,449) ACI Worldwide Inc 592 0.00
22,995 GlaxoSmithKline Plc 29,768 0.02 (66) Acuity Brands Inc 985 0.00
(10,617) Greene King Plc 7,147 0.01 95 Acxiom Corporation 60 0.00
(3,720) Hargreaves Lansdown Plc 1,484 0.00 (25) Adobe Systems Inc 11 0.00
27,011 Hays Plc 4,213 0.00 284 Advanced Drainage Systems Inc 219 0.00
1,922 Hikma Pharmaceuticals Plc 3,979 0.00 759 Advanced Energy Industries 8,473 0.01
10,050 HSBC Holdings Plc 7,948 0.01 (514) Advisory Board Company 606 0.00
(358) IHS Markit Limited 461 0.00 1,449 AES Corporation 555 0.00
1,343 IMI Plc 111 0.00 438 Aetna Inc 3,349 0.00
3,487 Imperial Tobacco Group Plc 2,138 0.00 22 AGCO Corporation 172 0.00
20,218 Inchcape Plc 9,643 0.01 (1,313) Agios Pharmaceuticals Inc 3,974 0.00
2,681 Intercontinental Hotels 13,661 0.01 17 Air Methods Corporation 2 0.00
1,492 International Game Technology 426 0.00 298 Air Products and Chemicals Inc 2,331 0.00
(3,028) Intertek Group Plc 1,268 0.00 47 Aircastle Limited 22 0.00
121,726 ITV Plc 26,824 0.02 49 Akamai Technologies Inc 275 0.00
11,144 John Wood Group Plc 18,824 0.01 (573) Akorn Inc 2,608 0.00
(56,774) Ladbrokes Plc 7,043 0.01 148 Alaska Air Group Inc 2,058 0.00
55,419 Legal and General Group Plc 13,739 0.01 138 Albemarle Corporation 738 0.00
(3,401) Liberty Global Plc 12,285 0.01 (444) Alcoa Upstream Corporation 971 0.00
(878) Liberty Global Plc 539 0.00 (2,558) Alder Biopharmaceuticals Inc 10,851 0.01
91,667 Lloyds Banking Group Plc 5,662 0.00 (145) Alexion Pharmaceuticals Inc 692 0.00
113,386 Marks & Spencer Group Plc 24,678 0.02 169 Align Technology Inc 2,983 0.00
(24,601) Meggitt Plc 6,137 0.00 54 Alleghany Corporation 4,185 0.00
637 Melrose Industries Plc 412 0.00 146 Allegiant Travel Company 3,232 0.00
(1,237) Merlin Entertainments Plc 38 0.00 167 Allete Inc 418 0.00
15,558 Michael Page International 4,526 0.00 3 Alliance Data Systems Corporation 37 0.00
11,702 Mondi Plc 11,334 0.01 1,389 Allison Transmission Holding 6,767 0.01
(1,192) National Grid Plc 4,627 0.00 1,032 Allstate Corporation 5,085 0.00
173 NEX Group Plc 18 0.00 (1,392) Alnylam Pharmaceuticals Inc 594 0.00
1,288 Next Plc 3,478 0.00 90 Alphabet Inc 1,144 0.00
7,093 Noble Corporation Plc 1,415 0.00 (33) Amazon.com Inc 1,005 0.00
(1,418) Ocado Group Plc 20 0.00 (113) Ambarella Inc 1,546 0.00
7,642 Old Mutual Plc 1,176 0.00 147 AMC Networks Inc 110 0.00
1,368 Pearson Plc 572 0.00 175 American Airlines Group Inc 514 0.00
(10,056) Pennon Group Plc 2,621 0.00 1,003 American Axle & Manufacturing Holdings Inc 2,786 0.00
85 Pentair Plc 106 0.00 495 American Express Company 4,032 0.00
13,120 Persimmon Plc 6,010 0.00 305 American Financial Group Inc 3,909 0.00
(20,549) Petrofac Limited 2,208 0.00 973 American International Group Inc 4,085 0.00
(1,015) Provident Financial Plc 2,041 0.00 (17) American Water Works Company Inc 45 0.00
5,578 Prudential Plc 2,807 0.00 230 Ameriprise Financial Inc 2,415 0.00
3,201 Reckitt Benckiser Group Plc 7,361 0.01 171 AMETEK Inc 135 0.00
16,799 RELX Plc 10,740 0.01 3 Amgen Inc 17 0.00
30,825 Rentokil Initial Plc 4,065 0.00 456 Amphenol Corporation 3,023 0.00
37 Rightmove Plc 16 0.00 370 Analog Devices Inc 3,515 0.00
1,263 Rio Tinto Limited 7,390 0.01 173 Anixter International Inc 1,576 0.00
5,077 Rio Tinto Plc 28,672 0.02 99 ANSYS Inc 116 0.00
3,353 Rolls-Royce Holdings Plc 160 0.00 (1,162) Antero Resources Corporation 1,737 0.00
1,450 Royal Mail Plc 17 0.00 382 Anthem Inc 4,860 0.00
6,720 RPC Group Plc 1,590 0.00 296 AO Smith Corporation 38 0.00
5,390 RSA Insurance Group Plc 4,455 0.00 36 Apache Corporation 286 0.00
44,366 J Sainsbury Plc 1,192 0.00 154 Apogee Enterprises Inc 1,156 0.00
(4,379) Severn Trent Plc 2,748 0.00 605 Apple Inc 4,541 0.00
9,746 Smith & Nephew Plc 9,732 0.01 760 Applied Industrial Tech Inc 8,406 0.01
1,522 Smiths Group Plc 11 0.00 1,722 Applied Materials Inc 4,738 0.00
4,507 Spectris Plc 16,289 0.01 99 Aqua America Inc 19 0.00
(104) Spirax-Sarco Engineering Plc 145 0.00 368 Aramark 186 0.00
(1,802) Sports Direct International 445 0.00 17 Archer-Daniels-Midland Company 11 0.00
1,215 St James'S Place Plc 938 0.00 340 Arris International Plc 794 0.00
13,475 Standard Life Plc 4,688 0.00 563 Arrow Electronics Inc 3,825 0.00
16,194 Subsea 7 SA 33,342 0.03 169 Arthur J Gallagher & Company 363 0.00
(4,005) Tate and Lyle Plc 1,320 0.00 111 Artisan Partners Asset Management 217 0.00
226
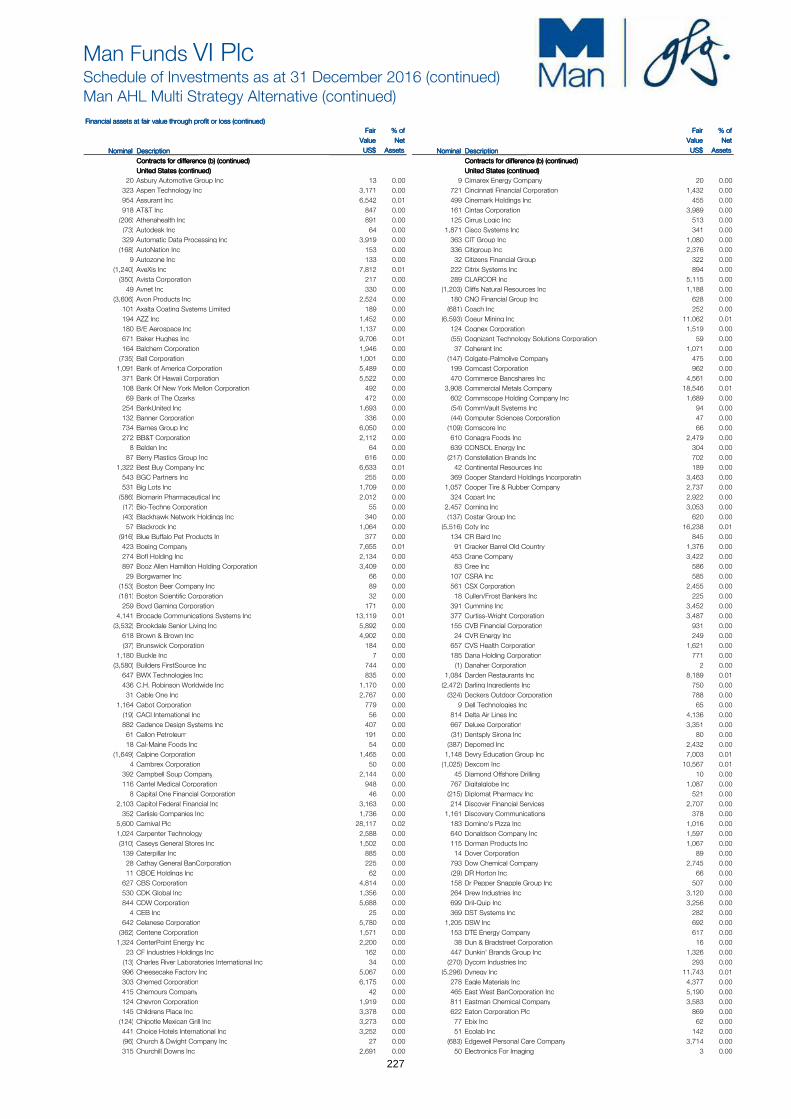
Man Funds VI PlcSchedule of Investments as at 31 December 2016 (continued)Man AHL Multi Strategy Alternative (continued)
Financial assets at fair value through profit or loss (continued)Financial assets at fair value through profit or loss (continued)Financial assets at fair value through profit or loss (continued)Financial assets at fair value through profit or loss (continued)
Fair Fair Fair Fair % of% of% of% of Fair Fair Fair Fair % of% of% of% of
Value Value Value Value NetNetNetNet Value Value Value Value NetNetNetNet
Nominal Nominal Nominal Nominal DescriptionDescriptionDescriptionDescription US$ US$ US$ US$ AssetsAssetsAssetsAssets Nominal Nominal Nominal Nominal DescriptionDescriptionDescriptionDescription US$ US$ US$ US$ AssetsAssetsAssetsAssets
Contracts for difference (b) (continued)Contracts for difference (b) (continued)Contracts for difference (b) (continued)Contracts for difference (b) (continued) Contracts for difference (b) (continued)Contracts for difference (b) (continued)Contracts for difference (b) (continued)Contracts for difference (b) (continued)
United States (continued)United States (continued)United States (continued)United States (continued) United States (continued)United States (continued)United States (continued)United States (continued)
20 Asbury Automotive Group Inc 13 0.00 9 Cimarex Energy Company 20 0.00
323 Aspen Technology Inc 3,171 0.00 721 Cincinnati Financial Corporation 1,432 0.00
954 Assurant Inc 6,542 0.01 499 Cinemark Holdings Inc 455 0.00
918 AT&T Inc 847 0.00 161 Cintas Corporation 3,989 0.00
(206) Athenahealth Inc 891 0.00 125 Cirrus Logic Inc 513 0.00
(73) Autodesk Inc 64 0.00 1,871 Cisco Systems Inc 341 0.00
329 Automatic Data Processing Inc 3,919 0.00 363 CIT Group Inc 1,080 0.00
(168) AutoNation Inc 153 0.00 336 Citigroup Inc 2,376 0.00
9 Autozone Inc 133 0.00 32 Citizens Financial Group 322 0.00
(1,240) AveXis Inc 7,812 0.01 222 Citrix Systems Inc 894 0.00
(350) Avista Corporation 217 0.00 289 CLARCOR Inc 5,115 0.00
49 Avnet Inc 330 0.00 (1,203) Cliffs Natural Resources Inc 1,188 0.00
(3,606) Avon Products Inc 2,524 0.00 180 CNO Financial Group Inc 628 0.00
101 Axalta Coating Systems Limited 189 0.00 (681) Coach Inc 252 0.00
194 AZZ Inc 1,452 0.00 (6,593) Coeur Mining Inc 11,062 0.01
180 B/E Aerospace Inc 1,137 0.00 124 Cognex Corporation 1,519 0.00
671 Baker Hughes Inc 9,706 0.01 (55) Cognizant Technology Solutions Corporation 59 0.00
164 Balchem Corporation 1,946 0.00 37 Coherent Inc 1,071 0.00
(735) Ball Corporation 1,001 0.00 (147) Colgate-Palmolive Company 475 0.00
1,091 Bank of America Corporation 5,489 0.00 199 Comcast Corporation 962 0.00
371 Bank Of Hawaii Corporation 5,522 0.00 470 Commerce Bancshares Inc 4,561 0.00
108 Bank Of New York Mellon Corporation 492 0.00 3,908 Commercial Metals Company 18,546 0.01
69 Bank of The Ozarks 472 0.00 602 Commscope Holding Company Inc 1,689 0.00
254 BankUnited Inc 1,693 0.00 (54) CommVault Systems Inc 94 0.00
132 Banner Corporation 336 0.00 (44) Computer Sciences Corporation 47 0.00
734 Barnes Group Inc 6,050 0.00 (109) Comscore Inc 66 0.00
272 BB&T Corporation 2,112 0.00 610 Conagra Foods Inc 2,479 0.00
8 Belden Inc 64 0.00 639 CONSOL Energy Inc 304 0.00
87 Berry Plastics Group Inc 616 0.00 (217) Constellation Brands Inc 702 0.00
1,322 Best Buy Company Inc 6,633 0.01 42 Continental Resources Inc 189 0.00
543 BGC Partners Inc 255 0.00 369 Cooper Standard Holdings Incorporatin 3,463 0.00
531 Big Lots Inc 1,709 0.00 1,057 Cooper Tire & Rubber Company 2,737 0.00
(586) Biomarin Pharmaceutical Inc 2,012 0.00 324 Copart Inc 2,922 0.00
(17) Bio-Techne Corporation 55 0.00 2,457 Corning Inc 3,053 0.00
(43) Blackhawk Network Holdings Inc 340 0.00 (137) Costar Group Inc 620 0.00
57 Blackrock Inc 1,064 0.00 (5,516) Coty Inc 16,238 0.01
(916) Blue Buffalo Pet Products In 377 0.00 134 CR Bard Inc 845 0.00
423 Boeing Company 7,655 0.01 91 Cracker Barrel Old Country 1,376 0.00
274 BofI Holding Inc 2,134 0.00 453 Crane Company 3,422 0.00
897 Booz Allen Hamilton Holding Corporation 3,409 0.00 83 Cree Inc 586 0.00
29 Borgwarner Inc 66 0.00 107 CSRA Inc 585 0.00
(153) Boston Beer Company Inc 89 0.00 561 CSX Corporation 2,455 0.00
(181) Boston Scientific Corporation 32 0.00 18 Cullen/Frost Bankers Inc 225 0.00
259 Boyd Gaming Corporation 171 0.00 391 Cummins Inc 3,452 0.00
4,141 Brocade Communications Systems Inc 13,119 0.01 377 Curtiss-Wright Corporation 3,487 0.00
(3,532) Brookdale Senior Living Inc 5,892 0.00 155 CVB Financial Corporation 931 0.00
618 Brown & Brown Inc 4,902 0.00 24 CVR Energy Inc 249 0.00
(37) Brunswick Corporation 184 0.00 657 CVS Health Corporation 1,621 0.00
1,180 Buckle Inc 7 0.00 185 Dana Holding Corporation 771 0.00
(3,580) Builders FirstSource Inc 744 0.00 (1) Danaher Corporation 2 0.00
647 BWX Technologies Inc 835 0.00 1,084 Darden Restaurants Inc 8,189 0.01
436 C.H. Robinson Worldwide Inc 1,170 0.00 (2,472) Darling Ingredients Inc 750 0.00
31 Cable One Inc 2,767 0.00 (324) Deckers Outdoor Corporation 788 0.00
1,164 Cabot Corporation 779 0.00 9 Dell Technologies Inc 65 0.00
(19) CACI International Inc 56 0.00 814 Delta Air Lines Inc 4,136 0.00
882 Cadence Design Systems Inc 407 0.00 667 Deluxe Corporation 3,351 0.00
61 Callon Petroleum 191 0.00 (31) Dentsply Sirona Inc 80 0.00
18 Cal-Maine Foods Inc 54 0.00 (387) Depomed Inc 2,432 0.00
(1,649) Calpine Corporation 1,465 0.00 1,148 Devry Education Group Inc 7,003 0.01
4 Cambrex Corporation 50 0.00 (1,025) Dexcom Inc 10,567 0.01
392 Campbell Soup Company 2,144 0.00 45 Diamond Offshore Drilling 10 0.00
116 Cantel Medical Corporation 948 0.00 767 Digitalglobe Inc 1,087 0.00
8 Capital One Financial Corporation 46 0.00 (215) Diplomat Pharmacy Inc 521 0.00
2,103 Capitol Federal Financial Inc 3,163 0.00 214 Discover Financial Services 2,707 0.00
352 Carlisle Companies Inc 1,736 0.00 1,161 Discovery Communications 378 0.00
5,600 Carnival Plc 28,117 0.02 183 Domino's Pizza Inc 1,016 0.00
1,024 Carpenter Technology 2,588 0.00 640 Donaldson Company Inc 1,597 0.00
(310) Caseys General Stores Inc 1,502 0.00 115 Dorman Products Inc 1,067 0.00
139 Caterpillar Inc 885 0.00 14 Dover Corporation 89 0.00
28 Cathay General BanCorporation 225 0.00 793 Dow Chemical Company 2,745 0.00
11 CBOE Holdings Inc 62 0.00 (29) DR Horton Inc 66 0.00
627 CBS Corporation 4,814 0.00 158 Dr Pepper Snapple Group Inc 507 0.00
530 CDK Global Inc 1,356 0.00 264 Drew Industries Inc 3,120 0.00
844 CDW Corporation 5,688 0.00 699 Dril-Quip Inc 3,256 0.00
4 CEB Inc 25 0.00 369 DST Systems Inc 282 0.00
642 Celanese Corporation 5,780 0.00 1,205 DSW Inc 692 0.00
(362) Centene Corporation 1,571 0.00 153 DTE Energy Company 617 0.00
1,324 CenterPoint Energy Inc 2,200 0.00 38 Dun & Bradstreet Corporation 16 0.00
23 CF Industries Holdings Inc 162 0.00 447 Dunkin' Brands Group Inc 1,326 0.00
(13) Charles River Laboratories International Inc 34 0.00 (270) Dycom Industries Inc 293 0.00
996 Cheesecake Factory Inc 5,067 0.00 (5,296) Dynegy Inc 11,743 0.01
303 Chemed Corporation 6,175 0.00 278 Eagle Materials Inc 4,377 0.00
415 Chemours Company 42 0.00 465 East West BanCorporation Inc 5,190 0.00
124 Chevron Corporation 1,919 0.00 811 Eastman Chemical Company 3,583 0.00
145 Childrens Place Inc 3,378 0.00 622 Eaton Corporation Plc 869 0.00
(124) Chipotle Mexican Grill Inc 3,273 0.00 77 Ebix Inc 62 0.00
441 Choice Hotels International Inc 3,252 0.00 51 Ecolab Inc 142 0.00
(96) Church & Dwight Company Inc 27 0.00 (683) Edgewell Personal Care Company 3,714 0.00
315 Churchill Downs Inc 2,691 0.00 50 Electronics For Imaging 3 0.00
227
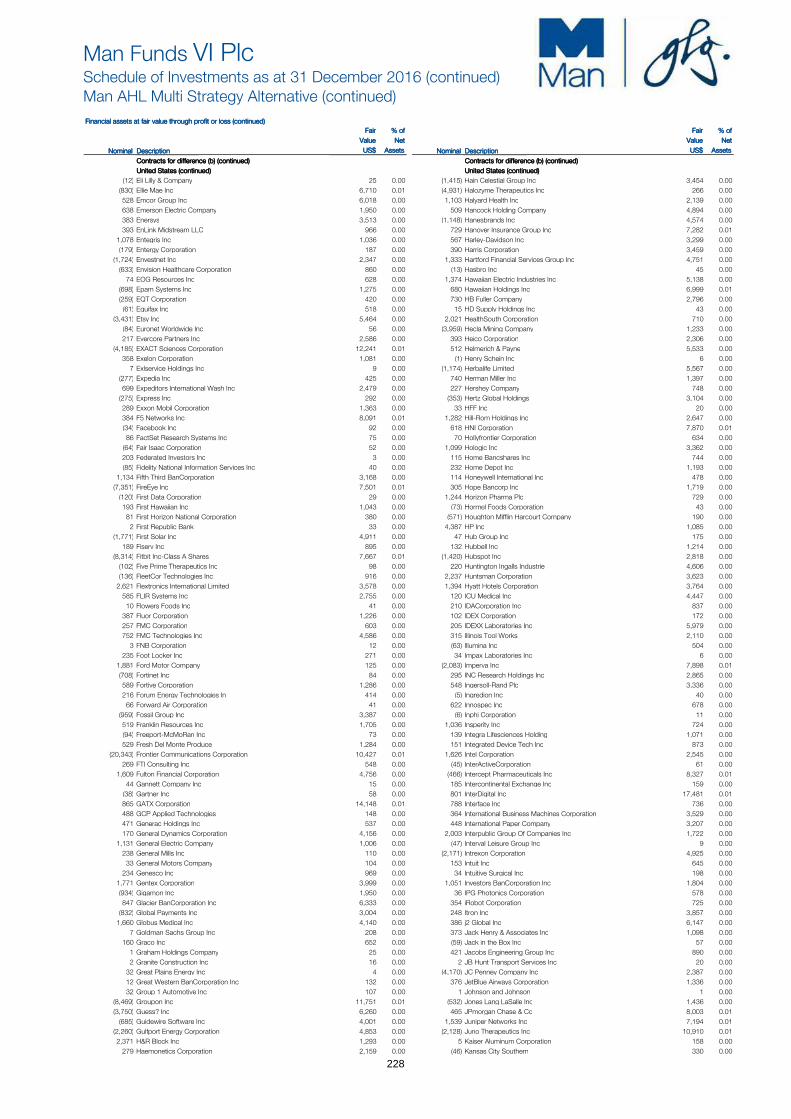
Man Funds VI PlcSchedule of Investments as at 31 December 2016 (continued)Man AHL Multi Strategy Alternative (continued)
Financial assets at fair value through profit or loss (continued)Financial assets at fair value through profit or loss (continued)Financial assets at fair value through profit or loss (continued)Financial assets at fair value through profit or loss (continued)
Fair Fair Fair Fair % of% of% of% of Fair Fair Fair Fair % of% of% of% of
Value Value Value Value NetNetNetNet Value Value Value Value NetNetNetNet
Nominal Nominal Nominal Nominal DescriptionDescriptionDescriptionDescription US$ US$ US$ US$ AssetsAssetsAssetsAssets Nominal Nominal Nominal Nominal DescriptionDescriptionDescriptionDescription US$ US$ US$ US$ AssetsAssetsAssetsAssets
Contracts for difference (b) (continued)Contracts for difference (b) (continued)Contracts for difference (b) (continued)Contracts for difference (b) (continued) Contracts for difference (b) (continued)Contracts for difference (b) (continued)Contracts for difference (b) (continued)Contracts for difference (b) (continued)
United States (continued)United States (continued)United States (continued)United States (continued) United States (continued)United States (continued)United States (continued)United States (continued)
(12) Eli Lilly & Company 25 0.00 (1,415) Hain Celestial Group Inc 3,454 0.00
(830) Ellie Mae Inc 6,710 0.01 (4,931) Halozyme Therapeutics Inc 266 0.00
528 Emcor Group Inc 6,018 0.00 1,103 Halyard Health Inc 2,139 0.00
638 Emerson Electric Company 1,950 0.00 509 Hancock Holding Company 4,894 0.00
383 Enersys 3,513 0.00 (1,148) Hanesbrands Inc 4,574 0.00
393 EnLink Midstream LLC 966 0.00 729 Hanover Insurance Group Inc 7,282 0.01
1,078 Entegris Inc 1,036 0.00 567 Harley-Davidson Inc 3,299 0.00
(179) Entergy Corporation 187 0.00 390 Harris Corporation 3,459 0.00
(1,724) Envestnet Inc 2,347 0.00 1,333 Hartford Financial Services Group Inc 4,751 0.00
(633) Envision Healthcare Corporation 860 0.00 (13) Hasbro Inc 45 0.00
74 EOG Resources Inc 628 0.00 1,374 Hawaiian Electric Industries Inc 5,138 0.00
(698) Epam Systems Inc 1,275 0.00 680 Hawaiian Holdings Inc 6,999 0.01
(259) EQT Corporation 420 0.00 730 HB Fuller Company 2,796 0.00
(61) Equifax Inc 518 0.00 15 HD Supply Holdings Inc 43 0.00
(3,431) Etsy Inc 5,464 0.00 2,021 HealthSouth Corporation 710 0.00
(84) Euronet Worldwide Inc 56 0.00 (3,959) Hecla Mining Company 1,233 0.00
217 Evercore Partners Inc 2,586 0.00 393 Heico Corporation 2,306 0.00
(4,185) EXACT Sciences Corporation 12,241 0.01 512 Helmerich & Payne 5,533 0.00
358 Exelon Corporation 1,081 0.00 (1) Henry Schein Inc 6 0.00
7 Exlservice Holdings Inc 9 0.00 (1,174) Herbalife Limited 5,567 0.00
(277) Expedia Inc 425 0.00 740 Herman Miller Inc 1,397 0.00
699 Expeditors International Wash Inc 2,479 0.00 227 Hershey Company 748 0.00
(275) Express Inc 292 0.00 (353) Hertz Global Holdings 3,104 0.00
289 Exxon Mobil Corporation 1,363 0.00 33 HFF Inc 20 0.00
384 F5 Networks Inc 8,091 0.01 1,282 Hill-Rom Holdings Inc 2,647 0.00
(34) Facebook Inc 92 0.00 618 HNI Corporation 7,870 0.01
86 FactSet Research Systems Inc 75 0.00 70 Hollyfrontier Corporation 634 0.00
(64) Fair Isaac Corporation 52 0.00 1,099 Hologic Inc 3,362 0.00
203 Federated Investors Inc 3 0.00 115 Home Bancshares Inc 744 0.00
(85) Fidelity National Information Services Inc 40 0.00 232 Home Depot Inc 1,193 0.00
1,134 Fifth Third BanCorporation 3,168 0.00 114 Honeywell International Inc 478 0.00
(7,351) FireEye Inc 7,501 0.01 305 Hope Bancorp Inc 1,719 0.00
(120) First Data Corporation 29 0.00 1,244 Horizon Pharma Plc 729 0.00
193 First Hawaiian Inc 1,043 0.00 (73) Hormel Foods Corporation 43 0.00
81 First Horizon National Corporation 380 0.00 (571) Houghton Mifflin Harcourt Company 190 0.00
2 First Republic Bank 33 0.00 4,387 HP Inc 1,085 0.00
(1,771) First Solar Inc 4,911 0.00 47 Hub Group Inc 175 0.00
189 Fiserv Inc 895 0.00 132 Hubbell Inc 1,214 0.00
(8,314) Fitbit Inc-Class A Shares 7,667 0.01 (1,420) Hubspot Inc 2,818 0.00
(102) Five Prime Therapeutics Inc 98 0.00 220 Huntington Ingalls Industrie 4,606 0.00
(136) FleetCor Technologies Inc 916 0.00 2,237 Huntsman Corporation 3,623 0.00
2,621 Flextronics International Limited 3,578 0.00 1,394 Hyatt Hotels Corporation 3,764 0.00
585 FLIR Systems Inc 2,755 0.00 120 ICU Medical Inc 4,447 0.00
10 Flowers Foods Inc 41 0.00 210 IDACorporation Inc 837 0.00
387 Fluor Corporation 1,226 0.00 102 IDEX Corporation 172 0.00
257 FMC Corporation 603 0.00 205 IDEXX Laboratories Inc 5,979 0.00
752 FMC Technologies Inc 4,586 0.00 315 Illinois Tool Works 2,110 0.00
3 FNB Corporation 12 0.00 (63) Illumina Inc 504 0.00
235 Foot Locker Inc 271 0.00 34 Impax Laboratories Inc 6 0.00
1,881 Ford Motor Company 125 0.00 (2,083) Imperva Inc 7,898 0.01
(708) Fortinet Inc 84 0.00 295 INC Research Holdings Inc 2,865 0.00
589 Fortive Corporation 1,286 0.00 548 Ingersoll-Rand Plc 3,336 0.00
216 Forum Energy Technologies In 414 0.00 (5) Ingredion Inc 40 0.00
66 Forward Air Corporation 41 0.00 622 Innospec Inc 678 0.00
(959) Fossil Group Inc 3,387 0.00 (6) Inphi Corporation 11 0.00
519 Franklin Resources Inc 1,705 0.00 1,036 Insperity Inc 724 0.00
(94) Freeport-McMoRan Inc 73 0.00 139 Integra Lifesciences Holding 1,071 0.00
529 Fresh Del Monte Produce 1,284 0.00 151 Integrated Device Tech Inc 873 0.00
(20,343) Frontier Communications Corporation 10,427 0.01 1,626 Intel Corporation 2,545 0.00
269 FTI Consulting Inc 548 0.00 (45) InterActiveCorporation 61 0.00
1,609 Fulton Financial Corporation 4,756 0.00 (466) Intercept Pharmaceuticals Inc 8,327 0.01
44 Gannett Company Inc 15 0.00 185 Intercontinental Exchange Inc 159 0.00
(38) Gartner Inc 58 0.00 801 InterDigital Inc 17,481 0.01
865 GATX Corporation 14,148 0.01 788 Interface Inc 736 0.00
488 GCP Applied Technologies 148 0.00 364 International Business Machines Corporation 3,529 0.00
471 Generac Holdings Inc 537 0.00 448 International Paper Company 3,207 0.00
170 General Dynamics Corporation 4,156 0.00 2,003 Interpublic Group Of Companies Inc 1,722 0.00
1,131 General Electric Company 1,006 0.00 (47) Interval Leisure Group Inc 9 0.00
238 General Mills Inc 110 0.00 (2,171) Intrexon Corporation 4,925 0.00
33 General Motors Company 104 0.00 153 Intuit Inc 645 0.00
234 Genesco Inc 969 0.00 34 Intuitive Surgical Inc 198 0.00
1,771 Gentex Corporation 3,999 0.00 1,051 Investors BanCorporation Inc 1,804 0.00
(934) Gigamon Inc 1,950 0.00 36 IPG Photonics Corporation 578 0.00
847 Glacier BanCorporation Inc 6,333 0.00 354 iRobot Corporation 725 0.00
(832) Global Payments Inc 3,004 0.00 248 Itron Inc 3,857 0.00
1,660 Globus Medical Inc 4,140 0.00 386 j2 Global Inc 6,147 0.00
7 Goldman Sachs Group Inc 208 0.00 373 Jack Henry & Associates Inc 1,098 0.00
160 Graco Inc 652 0.00 (59) Jack in the Box Inc 57 0.00
1 Graham Holdings Company 25 0.00 421 Jacobs Engineering Group Inc 890 0.00
2 Granite Construction Inc 16 0.00 2 JB Hunt Transport Services Inc 20 0.00
32 Great Plains Energy Inc 4 0.00 (4,170) JC Penney Company Inc 2,387 0.00
12 Great Western BanCorporation Inc 132 0.00 376 JetBlue Airways Corporation 1,336 0.00
32 Group 1 Automotive Inc 107 0.00 1 Johnson and Johnson 1 0.00
(8,469) Groupon Inc 11,751 0.01 (532) Jones Lang LaSalle Inc 1,436 0.00
(3,750) Guess? Inc 6,260 0.00 465 JPmorgan Chase & Co 8,003 0.01
(685) Guidewire Software Inc 4,001 0.00 1,539 Juniper Networks Inc 7,194 0.01
(2,260) Gulfport Energy Corporation 4,853 0.00 (2,128) Juno Therapeutics Inc 10,910 0.01
2,371 H&R Block Inc 1,293 0.00 5 Kaiser Aluminum Corporation 158 0.00
279 Haemonetics Corporation 2,159 0.00 (46) Kansas City Southern 330 0.00
228

Man Funds VI PlcSchedule of Investments as at 31 December 2016 (continued)Man AHL Multi Strategy Alternative (continued)
Financial assets at fair value through profit or loss (continued)Financial assets at fair value through profit or loss (continued)Financial assets at fair value through profit or loss (continued)Financial assets at fair value through profit or loss (continued)
Fair Fair Fair Fair % of% of% of% of Fair Fair Fair Fair % of% of% of% of
Value Value Value Value NetNetNetNet Value Value Value Value NetNetNetNet
Nominal Nominal Nominal Nominal DescriptionDescriptionDescriptionDescription US$ US$ US$ US$ AssetsAssetsAssetsAssets Nominal Nominal Nominal Nominal DescriptionDescriptionDescriptionDescription US$ US$ US$ US$ AssetsAssetsAssetsAssets
Contracts for difference (b) (continued)Contracts for difference (b) (continued)Contracts for difference (b) (continued)Contracts for difference (b) (continued) Contracts for difference (b) (continued)Contracts for difference (b) (continued)Contracts for difference (b) (continued)Contracts for difference (b) (continued)
United States (continued)United States (continued)United States (continued)United States (continued) United States (continued)United States (continued)United States (continued)United States (continued)
1,336 KapStone Paper and Packaging Corporation 4,053 0.00 (5) Murphy USA Inc 18 0.00
(21) KB Home 5 0.00 (11) Mylan NV 36 0.00
85 KBR Inc 97 0.00 1,077 National Instruments Corporation 2,973 0.00
21 Kennametal Inc 59 0.00 894 National Oilwell Varco Inc 1,425 0.00
(2,425) Kennedy-Wilson Holdings Inc 1,196 0.00 91 Nationstar Mortgage Holdings 74 0.00
196 KeyCorporation 73 0.00 (11) Natus Medical Inc 43 0.00
347 Keysight Technologies Inc 1,930 0.00 2,622 Navient Corporation 4,047 0.00
(1) Kimberly-Clark Corporation 3 0.00 433 NCR Corporation 3,222 0.00
28 Kirby Corporation 68 0.00 (4,717) Nektar Therapeutics 6,787 0.01
(1,263) Kite Pharma Inc 5,804 0.00 2,033 NetApp Inc 4,626 0.00
666 KLA Tencor Corporation 2,845 0.00 (20) Netflix Inc 17 0.00
(102) L Brands Inc 779 0.00 417 NETGEAR Inc 161 0.00
277 L-3 Communications Holdings 1,059 0.00 422 Netscout Systems Inc 520 0.00
889 La Quinta Holdings Inc 1,849 0.00 (1,462) Neurocrine Biosciences Inc 7,061 0.01
(92) Laclede Group Inc 78 0.00 (1,184) Nevro Corporation 9,829 0.01
239 Lam Research Corporation 2,061 0.00 (2,275) New Relic Inc 3,474 0.00
84 Lancaster Colony Corporation 904 0.00 526 New York Times Company 966 0.00
398 Landstar System Inc 6,299 0.00 (430) Newell Rubbermaid Inc 2,323 0.00
681 La-Z-Boy Inc 4,285 0.00 (963) Newfield Exploration Company 1,809 0.00
435 Lear Corporation 6,559 0.01 112 Newmarket Corporation 1,481 0.00
27 LegacyTexas Financial Group 29 0.00 (2,257) News Corporation 2,026 0.00
(1,188) Legg Mason Inc 2,076 0.00 45 Nexstar Broadcasting Group Inc 13 0.00
552 Leggett & Platt Inc 372 0.00 (23) Nike Inc 20 0.00
284 Leidos Holdings Inc 1,942 0.00 (1,597) NiSource Inc 382 0.00
(12,033) LendingClub Corporation 1,225 0.00 7 Noble Energy Inc 4 0.00
(459) Lennar Corporation 605 0.00 113 Nordson Corporation 2,294 0.00
125 Lennox International Inc 1,350 0.00 183 Norfolk Southern Corporation 2,229 0.00
512 Leucadia National Corporation 1,924 0.00 160 Northern Trust Corporation 1,943 0.00
20 Liberty Broadband Corporation 48 0.00 195 Northrop Grumman Corporation 1,952 0.00
(9) Liberty Interactive Corporation 31 0.00 352 Now Inc 608 0.00
12 Liberty Media Corporation 2 0.00 (223) NRG Energy Inc 195 0.00
446 Lincoln Electric Holdings 4,722 0.00 1,251 Nuance Communications Inc 285 0.00
852 Lincoln National Corporation 10,122 0.01 681 Nucor Corporation 6,561 0.01
(125) Lions Gate Entertainment Corporation 43 0.00 2 NVIDIA Corporation 91 0.00
48 Littelfuse Inc 1,228 0.00 7 NVR Inc 590 0.00
(552) Live Nation Entertainment Inc 458 0.00 1,224 Oceaneering International Inc 1,264 0.00
(641) LKQ Corporation 1,141 0.00 95 OGE Energy Corporation 184 0.00
72 Lockheed Martin Corporation 278 0.00 349 Oil States International Inc 2,962 0.00
823 Loews Corporation 4,021 0.00 1,064 Old Republic International Corporation 1,620 0.00
(49) LogMeIn Inc 87 0.00 53 Olin Corporation 35 0.00
463 Louisiana-Pacific Corporation 494 0.00 621 Omnicom Group Inc 1,738 0.00
(219) Lumentum Holdings 382 0.00 89 On Assignment Inc 219 0.00
1,038 Lyondellbasell Industries 5,068 0.00 290 ON Semiconductor Corporation 517 0.00
64 M & T Bank Corporation 2,205 0.00 183 ONE Gas Inc 617 0.00
308 Magellan Health Inc 1,968 0.00 221 OneMain Holdings Inc 256 0.00
(217) Manhattan Associates Inc 1,110 0.00 354 ONEOK Inc 3,121 0.00
249 Manitowoc Foodservice In 523 0.00 (146) OPKO Health Inc 278 0.00
713 ManpowerGroup Inc 9,554 0.01 9 O'Reilly Automotive Inc 12 0.00
477 Marathon Petroleum Corporation 4,512 0.00 702 Oshkosh Corporation 3,383 0.00
(16) MarketAxess Holdings Inc 45 0.00 4 OSI Systems Inc 32 0.00
(2) Marriott International 5 0.00 1,216 Owens and Minor Inc 444 0.00
622 Marriott Vacations Worldwide Corporation 10,016 0.01 638 Owens Corning 637 0.00
439 Marsh & Mclennan Companies 691 0.00 16 PACCAR Inc 82 0.00
21 Martin Marietta Materials Inc 717 0.00 (1,638) Pacira Pharmaceuticals Inc 2,985 0.00
516 Masimo Corporation 9,020 0.01 829 Packaging Corporation Of America 4,813 0.00
(610) Matson Inc 1,591 0.00 7 Pacwest BanCorporation 86 0.00
(734) Mattel Inc 2,420 0.00 (168) Palo Alto Networks Inc 2,127 0.00
1 MB Financial Inc 9 0.00 317 Papa John's International Inc 2,637 0.00
1,139 MBIA Inc 2,167 0.00 (11) PAREXEL International Corporation 29 0.00
1,292 McDermott International 381 0.00 234 Parker Hannifin Corporation 3,726 0.00
619 Mcdonalds Corporation 2,237 0.00 (1,606) Pattern Energy Group Inc 4,803 0.00
361 MDU Resources Group Inc 1,225 0.00 663 Patterson-UTI Energy Inc 3,346 0.00
(42) Mead Johnson Nutrition Company 33 0.00 540 Paychex Inc 1,518 0.00
(1,328) Medicines Company 2,437 0.00 (975) Paylocity Holding Corporation 3,646 0.00
(229) Medidata Solutions Inc 36 0.00 87 PayPal Holdings Inc 80 0.00
8 MEDNAX Inc 6 0.00 29 PBF Energy Inc 198 0.00
922 Mercury General Corporation 4,875 0.00 (632) Penumbra Inc 809 0.00
943 Meredith Corporation 8,300 0.01 8 Peoples United Financial 29 0.00
1,050 Methode Electronics Inc 7,885 0.01 13 Pfizer Inc 1 0.00
908 MetLife Inc 4,161 0.00 (17) Philip Morris International Inc 1 0.00
38 Mettler-Toledo International Inc 794 0.00 360 Phillips 66 2,325 0.00
890 MGIC Investment Corporation 1,510 0.00 31 Pilgrim's Pride Corporation 10 0.00
431 Microchip Technology Inc 1,425 0.00 30 Pinnacle Financial Partners 227 0.00
392 Microsoft Corporation 2,144 0.00 (424) Pitney Bowes Inc 53 0.00
7 MicroStrategy Inc 192 0.00 917 Plantronics Inc 4,297 0.00
353 Minerals Technologies Inc 3,336 0.00 799 Plexus Corporation 6,202 0.00
357 MKS Instruments Inc 3,629 0.00 308 PNC Financial Services Group Inc 7,215 0.01
(655) Molson Coors Brewing Company 2,501 0.00 (329) Polaris Industries Inc 452 0.00
55 Monolithic Power Systems Inc 330 0.00 406 PolyOne Corporation 727 0.00
(167) Monro Muffler Brake Inc 105 0.00 257 Pool Corporation 3,103 0.00
278 Moog Inc-Class A Shares 965 0.00 342 Power Integrations Inc 4,127 0.00
542 Morgan Stanley 3,562 0.00 98 PPG Industries Inc 16 0.00
42 Morningstar Inc 32 0.00 25 PRA Group Inc 79 0.00
91 Mosaic Company 441 0.00 168 PRA Health Sciences Inc 891 0.00
614 Motorola Solutions Inc 5,243 0.00 250 Praxair Inc 57 0.00
2,104 MRC Global Inc 6,487 0.01 104 Prestige Brands Holdings Inc 84 0.00
671 MSC Industrial Direct Company-Class A Shares 11,911 0.01 (13) Pricesmart Inc 21 0.00
647 Mueller Water Products Inc 1,203 0.00 624 Primerica Inc 6,563 0.01
11 Murphy Oil Corporation 22 0.00 1,168 Principal Financial Group Inc 5,292 0.00
229
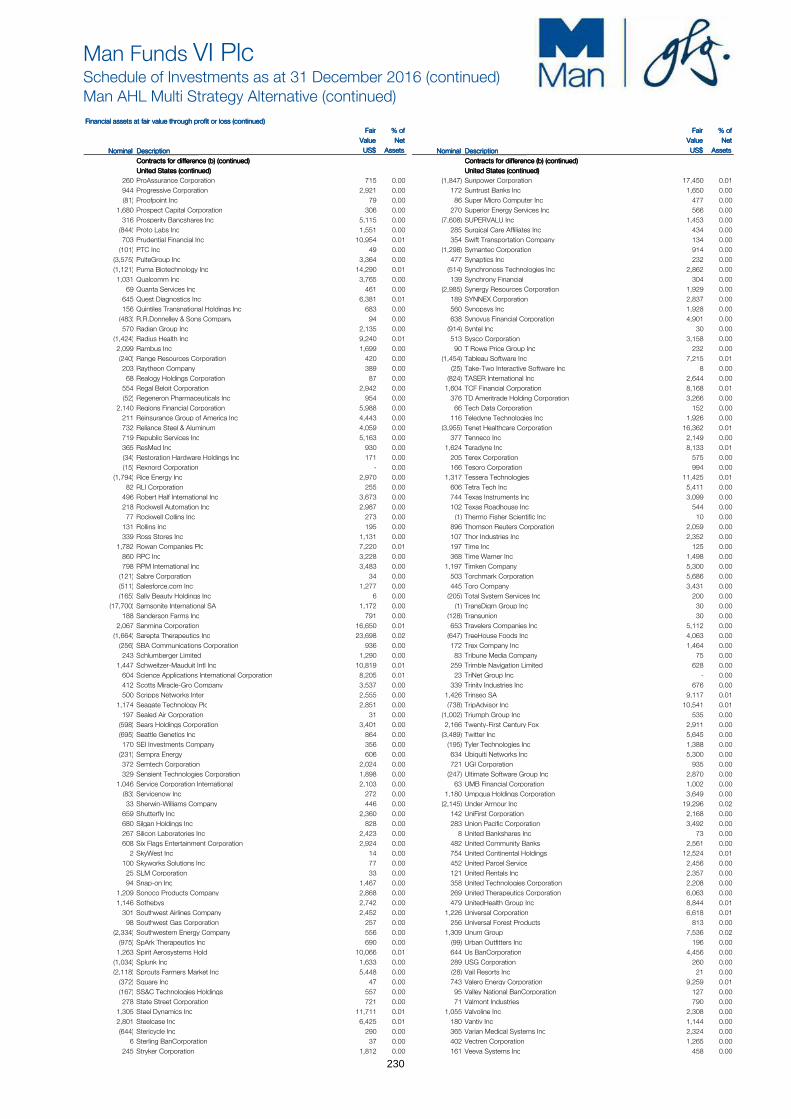
Man Funds VI PlcSchedule of Investments as at 31 December 2016 (continued)Man AHL Multi Strategy Alternative (continued)
Financial assets at fair value through profit or loss (continued)Financial assets at fair value through profit or loss (continued)Financial assets at fair value through profit or loss (continued)Financial assets at fair value through profit or loss (continued)
Fair Fair Fair Fair % of% of% of% of Fair Fair Fair Fair % of% of% of% of
Value Value Value Value NetNetNetNet Value Value Value Value NetNetNetNet
Nominal Nominal Nominal Nominal DescriptionDescriptionDescriptionDescription US$ US$ US$ US$ AssetsAssetsAssetsAssets Nominal Nominal Nominal Nominal DescriptionDescriptionDescriptionDescription US$ US$ US$ US$ AssetsAssetsAssetsAssets
Contracts for difference (b) (continued)Contracts for difference (b) (continued)Contracts for difference (b) (continued)Contracts for difference (b) (continued) Contracts for difference (b) (continued)Contracts for difference (b) (continued)Contracts for difference (b) (continued)Contracts for difference (b) (continued)
United States (continued)United States (continued)United States (continued)United States (continued) United States (continued)United States (continued)United States (continued)United States (continued)
260 ProAssurance Corporation 715 0.00 (1,847) Sunpower Corporation 17,450 0.01
944 Progressive Corporation 2,921 0.00 172 Suntrust Banks Inc 1,650 0.00
(81) Proofpoint Inc 79 0.00 86 Super Micro Computer Inc 477 0.00
1,680 Prospect Capital Corporation 306 0.00 270 Superior Energy Services Inc 566 0.00
316 Prosperity Bancshares Inc 5,115 0.00 (7,608) SUPERVALU Inc 1,453 0.00
(844) Proto Labs Inc 1,551 0.00 285 Surgical Care Affiliates Inc 434 0.00
703 Prudential Financial Inc 10,954 0.01 354 Swift Transportation Company 134 0.00
(101) PTC Inc 49 0.00 (1,298) Symantec Corporation 914 0.00
(3,575) PulteGroup Inc 3,364 0.00 477 Synaptics Inc 232 0.00
(1,121) Puma Biotechnology Inc 14,290 0.01 (514) Synchronoss Technologies Inc 2,862 0.00
1,031 Qualcomm Inc 3,765 0.00 139 Synchrony Financial 304 0.00
69 Quanta Services Inc 461 0.00 (2,985) Synergy Resources Corporation 1,929 0.00
645 Quest Diagnostics Inc 6,381 0.01 189 SYNNEX Corporation 2,837 0.00
156 Quintiles Transnational Holdings Inc 683 0.00 560 Synopsys Inc 1,928 0.00
(483) R.R.Donnelley & Sons Company 94 0.00 638 Synovus Financial Corporation 4,901 0.00
570 Radian Group Inc 2,135 0.00 (914) Syntel Inc 30 0.00
(1,424) Radius Health Inc 9,240 0.01 513 Sysco Corporation 3,158 0.00
2,099 Rambus Inc 1,699 0.00 90 T Rowe Price Group Inc 232 0.00
(240) Range Resources Corporation 420 0.00 (1,454) Tableau Software Inc 7,215 0.01
203 Raytheon Company 389 0.00 (25) Take-Two Interactive Software Inc 8 0.00
68 Realogy Holdings Corporation 87 0.00 (824) TASER International Inc 2,644 0.00
554 Regal Beloit Corporation 2,942 0.00 1,604 TCF Financial Corporation 8,168 0.01
(52) Regeneron Pharmaceuticals Inc 954 0.00 376 TD Ameritrade Holding Corporation 3,266 0.00
2,140 Regions Financial Corporation 5,988 0.00 66 Tech Data Corporation 152 0.00
211 Reinsurance Group of America Inc 4,443 0.00 116 Teledyne Technologies Inc 1,926 0.00
732 Reliance Steel & Aluminum 4,059 0.00 (3,955) Tenet Healthcare Corporation 16,362 0.01
719 Republic Services Inc 5,163 0.00 377 Tenneco Inc 2,149 0.00
365 ResMed Inc 930 0.00 1,624 Teradyne Inc 8,133 0.01
(34) Restoration Hardware Holdings Inc 171 0.00 205 Terex Corporation 575 0.00
(15) Rexnord Corporation - 0.00 166 Tesoro Corporation 994 0.00
(1,794) Rice Energy Inc 2,970 0.00 1,317 Tessera Technologies 11,425 0.01
82 RLI Corporation 255 0.00 606 Tetra Tech Inc 5,411 0.00
496 Robert Half International Inc 3,673 0.00 744 Texas Instruments Inc 3,099 0.00
218 Rockwell Automation Inc 2,987 0.00 102 Texas Roadhouse Inc 544 0.00
77 Rockwell Collins Inc 273 0.00 (1) Thermo Fisher Scientific Inc 10 0.00
131 Rollins Inc 195 0.00 896 Thomson Reuters Corporation 2,059 0.00
339 Ross Stores Inc 1,131 0.00 107 Thor Industries Inc 2,352 0.00
1,782 Rowan Companies Plc 7,220 0.01 197 Time Inc 125 0.00
860 RPC Inc 3,228 0.00 368 Time Warner Inc 1,498 0.00
798 RPM International Inc 3,483 0.00 1,197 Timken Company 5,300 0.00
(121) Sabre Corporation 34 0.00 503 Torchmark Corporation 5,686 0.00
(511) Salesforce.com Inc 1,277 0.00 445 Toro Company 3,431 0.00
(165) Sally Beauty Holdings Inc 6 0.00 (205) Total System Services Inc 200 0.00
(17,700) Samsonite International SA 1,172 0.00 (1) TransDigm Group Inc 30 0.00
188 Sanderson Farms Inc 791 0.00 (128) Transunion 30 0.00
2,067 Sanmina Corporation 16,650 0.01 653 Travelers Companies Inc 5,112 0.00
(1,664) Sarepta Therapeutics Inc 23,698 0.02 (647) TreeHouse Foods Inc 4,063 0.00
(256) SBA Communications Corporation 936 0.00 172 Trex Company Inc 1,464 0.00
243 Schlumberger Limited 1,290 0.00 83 Tribune Media Company 75 0.00
1,447 Schweitzer-Mauduit Intl Inc 10,819 0.01 259 Trimble Navigation Limited 628 0.00
604 Science Applications International Corporation 8,205 0.01 23 TriNet Group Inc - 0.00
412 Scotts Miracle-Gro Company 3,537 0.00 339 Trinity Industries Inc 676 0.00
500 Scripps Networks Inter 2,555 0.00 1,426 Trinseo SA 9,117 0.01
1,174 Seagate Technology Plc 2,851 0.00 (738) TripAdvisor Inc 10,541 0.01
197 Sealed Air Corporation 31 0.00 (1,002) Triumph Group Inc 535 0.00
(598) Sears Holdings Corporation 3,401 0.00 2,166 Twenty-First Century Fox 2,911 0.00
(695) Seattle Genetics Inc 864 0.00 (3,489) Twitter Inc 5,645 0.00
170 SEI Investments Company 356 0.00 (195) Tyler Technologies Inc 1,388 0.00
(231) Sempra Energy 606 0.00 634 Ubiquiti Networks Inc 5,300 0.00
372 Semtech Corporation 2,024 0.00 721 UGI Corporation 935 0.00
329 Sensient Technologies Corporation 1,898 0.00 (247) Ultimate Software Group Inc 2,870 0.00
1,046 Service Corporation International 2,103 0.00 63 UMB Financial Corporation 1,002 0.00
(83) Servicenow Inc 272 0.00 1,180 Umpqua Holdings Corporation 3,649 0.00
33 Sherwin-Williams Company 446 0.00 (2,145) Under Armour Inc 19,296 0.02
659 Shutterfly Inc 2,360 0.00 142 UniFirst Corporation 2,168 0.00
680 Silgan Holdings Inc 828 0.00 283 Union Pacific Corporation 3,492 0.00
267 Silicon Laboratories Inc 2,423 0.00 8 United Bankshares Inc 73 0.00
608 Six Flags Entertainment Corporation 2,924 0.00 482 United Community Banks 2,561 0.00
2 SkyWest Inc 14 0.00 754 United Continental Holdings 12,524 0.01
100 Skyworks Solutions Inc 77 0.00 452 United Parcel Service 2,456 0.00
25 SLM Corporation 33 0.00 121 United Rentals Inc 2,357 0.00
94 Snap-on Inc 1,467 0.00 358 United Technologies Corporation 2,208 0.00
1,209 Sonoco Products Company 2,868 0.00 269 United Therapeutics Corporation 6,063 0.00
1,146 Sothebys 2,742 0.00 479 UnitedHealth Group Inc 8,844 0.01
301 Southwest Airlines Company 2,452 0.00 1,226 Universal Corporation 6,618 0.01
98 Southwest Gas Corporation 257 0.00 256 Universal Forest Products 813 0.00
(2,334) Southwestern Energy Company 556 0.00 1,309 Unum Group 7,536 0.02
(975) SpArk Therapeutics Inc 690 0.00 (99) Urban Outfitters Inc 196 0.00
1,263 Spirit Aerosystems Hold 10,066 0.01 644 Us BanCorporation 4,456 0.00
(1,034) Splunk Inc 1,633 0.00 289 USG Corporation 260 0.00
(2,118) Sprouts Farmers Market Inc 5,448 0.00 (28) Vail Resorts Inc 21 0.00
(372) Square Inc 47 0.00 743 Valero Energy Corporation 9,259 0.01
(167) SS&C Technologies Holdings 557 0.00 95 Valley National BanCorporation 127 0.00
278 State Street Corporation 721 0.00 71 Valmont Industries 790 0.00
1,305 Steel Dynamics Inc 11,711 0.01 1,055 Valvoline Inc 2,308 0.00
2,801 Steelcase Inc 6,425 0.01 180 Vantiv Inc 1,144 0.00
(644) Stericycle Inc 290 0.00 365 Varian Medical Systems Inc 2,324 0.00
6 Sterling BanCorporation 37 0.00 402 Vectren Corporation 1,265 0.00
245 Stryker Corporation 1,812 0.00 161 Veeva Systems Inc 458 0.00
230
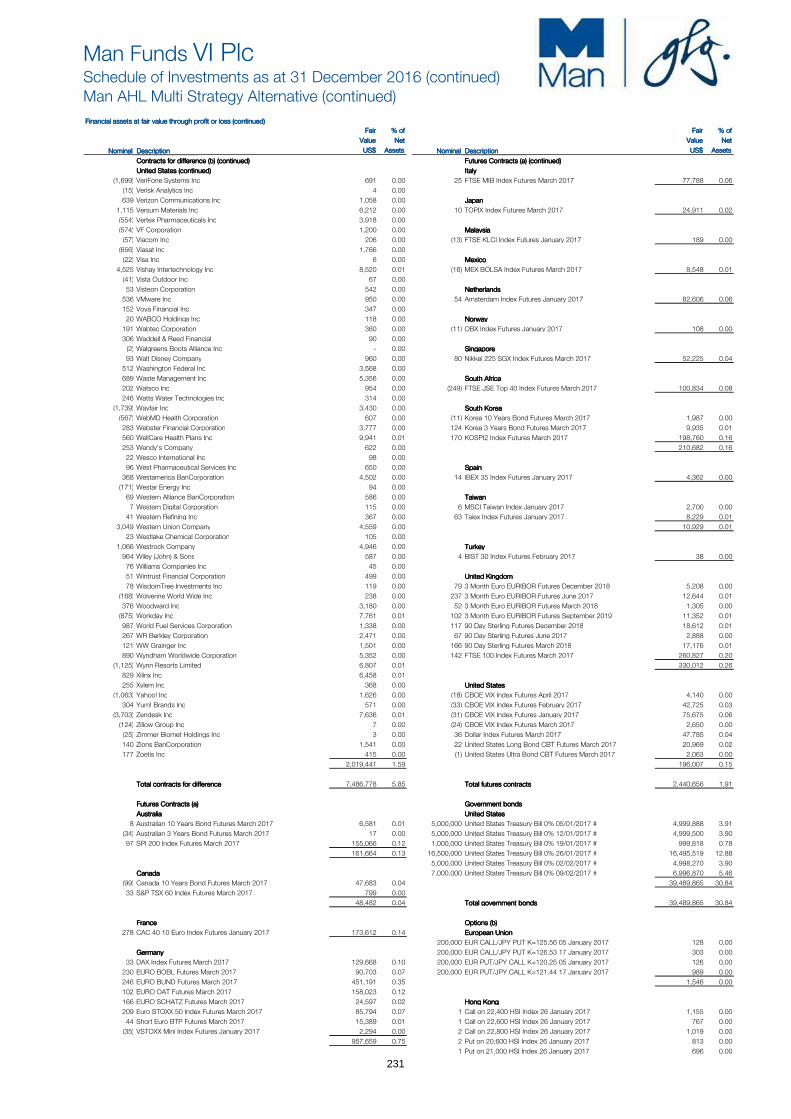
Man Funds VI PlcSchedule of Investments as at 31 December 2016 (continued)Man AHL Multi Strategy Alternative (continued)
Financial assets at fair value through profit or loss (continued)Financial assets at fair value through profit or loss (continued)Financial assets at fair value through profit or loss (continued)Financial assets at fair value through profit or loss (continued)
Fair Fair Fair Fair % of% of% of% of Fair Fair Fair Fair % of% of% of% of
Value Value Value Value NetNetNetNet Value Value Value Value NetNetNetNet
Nominal Nominal Nominal Nominal DescriptionDescriptionDescriptionDescription US$ US$ US$ US$ AssetsAssetsAssetsAssets Nominal Nominal Nominal Nominal DescriptionDescriptionDescriptionDescription US$ US$ US$ US$ AssetsAssetsAssetsAssets
Contracts for difference (b) (continued)Contracts for difference (b) (continued)Contracts for difference (b) (continued)Contracts for difference (b) (continued) Futures Contracts (a) (continued)Futures Contracts (a) (continued)Futures Contracts (a) (continued)Futures Contracts (a) (continued)
United States (continued)United States (continued)United States (continued)United States (continued) ItalyItalyItalyItaly
(1,699) VeriFone Systems Inc 691 0.00 25 FTSE MIB Index Futures March 2017 77,788 0.06
(15) Verisk Analytics Inc 4 0.00
639 Verizon Communications Inc 1,058 0.00 JapanJapanJapanJapan
1,115 Versum Materials Inc 6,212 0.00 10 TOPIX Index Futures March 2017 24,911 0.02
(554) Vertex Pharmaceuticals Inc 3,918 0.00
(574) VF Corporation 1,200 0.00 MalaysiaMalaysiaMalaysiaMalaysia
(57) Viacom Inc 206 0.00 (13) FTSE KLCI Index Futures January 2017 189 0.00
(656) Viasat Inc 1,766 0.00
(22) Visa Inc 6 0.00 MexicoMexicoMexicoMexico
4,525 Vishay Intertechnology Inc 8,520 0.01 (16) MEX BOLSA Index Futures March 2017 8,548 0.01
(41) Vista Outdoor Inc 67 0.00
53 Visteon Corporation 542 0.00 NetherlandsNetherlandsNetherlandsNetherlands
536 VMware Inc 950 0.00 54 Amsterdam Index Futures January 2017 82,606 0.06
152 Voya Financial Inc 347 0.00
20 WABCO Holdings Inc 118 0.00 NorwayNorwayNorwayNorway
191 Wabtec Corporation 360 0.00 (11) OBX Index Futures January 2017 108 0.00
306 Waddell & Reed Financial 90 0.00
(2) Walgreens Boots Alliance Inc - 0.00 SingaporeSingaporeSingaporeSingapore
93 Walt Disney Company 960 0.00 80 Nikkei 225 SGX Index Futures March 2017 52,225 0.04
512 Washington Federal Inc 3,568 0.00
689 Waste Management Inc 5,356 0.00 South AfricaSouth AfricaSouth AfricaSouth Africa
202 Watsco Inc 954 0.00 (249) FTSE JSE Top 40 Index Futures March 2017 100,834 0.08
246 Watts Water Technologies Inc 314 0.00
(1,739) Wayfair Inc 3,430 0.00 South KoreaSouth KoreaSouth KoreaSouth Korea
(567) WebMD Health Corporation 607 0.00 (11) Korea 10 Years Bond Futures March 2017 1,987 0.00
283 Webster Financial Corporation 3,777 0.00 124 Korea 3 Years Bond Futures March 2017 9,935 0.01
560 WellCare Health Plans Inc 9,941 0.01 170 KOSPI2 Index Futures March 2017 198,760 0.16
253 Wendy's Company 622 0.00 210,682 0.16
22 Wesco International Inc 98 0.00
96 West Pharmaceutical Services Inc 650 0.00 SpainSpainSpainSpain
368 Westamerica BanCorporation 4,502 0.00 14 IBEX 35 Index Futures January 2017 4,362 0.00
(171) Westar Energy Inc 94 0.00
69 Western Alliance BanCorporation 586 0.00 TaiwanTaiwanTaiwanTaiwan
7 Western Digital Corporation 115 0.00 6 MSCI Taiwan Index January 2017 2,700 0.00
41 Western Refining Inc 367 0.00 63 Taiex Index Futures January 2017 8,229 0.01
3,049 Western Union Company 4,559 0.00 10,929 0.01
23 Westlake Chemical Corporation 105 0.00
1,066 Westrock Company 4,946 0.00 TurkeyTurkeyTurkeyTurkey
964 Wiley (John) & Sons 587 0.00 4 BIST 30 Index Futures February 2017 38 0.00
76 Williams Companies Inc 45 0.00
51 Wintrust Financial Corporation 499 0.00 United KingdomUnited KingdomUnited KingdomUnited Kingdom
78 WisdomTree Investments Inc 119 0.00 79 3 Month Euro EURIBOR Futures December 2018 5,208 0.00
(168) Wolverine World Wide Inc 238 0.00 237 3 Month Euro EURIBOR Futures June 2017 12,644 0.01
376 Woodward Inc 3,180 0.00 52 3 Month Euro EURIBOR Futures March 2018 1,305 0.00
(875) Workday Inc 7,761 0.01 102 3 Month Euro EURIBOR Futures September 2019 11,352 0.01
987 World Fuel Services Corporation 1,338 0.00 117 90 Day Sterling Futures December 2018 18,612 0.01
267 WR Berkley Corporation 2,471 0.00 67 90 Day Sterling Futures June 2017 2,888 0.00
121 WW Grainger Inc 1,501 0.00 166 90 Day Sterling Futures March 2018 17,176 0.01
890 Wyndham Worldwide Corporation 5,352 0.00 142 FTSE 100 Index Futures March 2017 260,827 0.20
(1,125) Wynn Resorts Limited 6,807 0.01 330,012 0.26
829 Xilinx Inc 6,458 0.01
255 Xylem Inc 368 0.00 United StatesUnited StatesUnited StatesUnited States
(1,063) Yahoo! Inc 1,626 0.00 (18) CBOE VIX Index Futures April 2017 4,140 0.00
304 Yum! Brands Inc 571 0.00 (33) CBOE VIX Index Futures February 2017 42,725 0.03
(3,703) Zendesk Inc 7,636 0.01 (31) CBOE VIX Index Futures January 2017 75,675 0.06
(124) Zillow Group Inc 7 0.00 (24) CBOE VIX Index Futures March 2017 2,650 0.00
(25) Zimmer Biomet Holdings Inc 3 0.00 36 Dollar Index Futures March 2017 47,785 0.04
140 Zions BanCorporation 1,541 0.00 22 United States Long Bond CBT Futures March 2017 20,969 0.02
177 Zoetis Inc 415 0.00 (1) United States Ultra Bond CBT Futures March 2017 2,063 0.00
2,019,441 1.59 196,007 0.15
Total contracts for differenceTotal contracts for differenceTotal contracts for differenceTotal contracts for difference 7,486,778 5.85 Total futures contractsTotal futures contractsTotal futures contractsTotal futures contracts 2,440,656 1.91
Futures Contracts (a)Futures Contracts (a)Futures Contracts (a)Futures Contracts (a) Government bondsGovernment bondsGovernment bondsGovernment bonds
AustraliaAustraliaAustraliaAustralia United StatesUnited StatesUnited StatesUnited States
8 Australian 10 Years Bond Futures March 2017 6,581 0.01 5,000,000 United States Treasury Bill 0% 05/01/2017 # 4,999,888 3.91
(34) Australian 3 Years Bond Futures March 2017 17 0.00 5,000,000 United States Treasury Bill 0% 12/01/2017 # 4,999,500 3.90
97 SPI 200 Index Futures March 2017 155,066 0.12 1,000,000 United States Treasury Bill 0% 19/01/2017 # 999,818 0.78
161,664 0.13 16,500,000 United States Treasury Bill 0% 26/01/2017 # 16,495,519 12.88
5,000,000 United States Treasury Bill 0% 02/02/2017 # 4,998,270 3.90
CanadaCanadaCanadaCanada 7,000,000 United States Treasury Bill 0% 09/02/2017 # 6,996,870 5.46
(99) Canada 10 Years Bond Futures March 2017 47,683 0.04 39,489,865 30.84
33 S&P TSX 60 Index Futures March 2017 799 0.00
48,482 0.04 Total government bondsTotal government bondsTotal government bondsTotal government bonds 39,489,865 30.84
FranceFranceFranceFrance Options (b)Options (b)Options (b)Options (b)
278 CAC 40 10 Euro Index Futures January 2017 173,612 0.14 European UnionEuropean UnionEuropean UnionEuropean Union
200,000 EUR CALL/JPY PUT K=125.56 05 January 2017 128 0.00
GermanyGermanyGermanyGermany 200,000 EUR CALL/JPY PUT K=126.53 17 January 2017 303 0.00
33 DAX Index Futures March 2017 129,668 0.10 200,000 EUR PUT/JPY CALL K=120.25 05 January 2017 126 0.00
230 EURO BOBL Futures March 2017 90,703 0.07 200,000 EUR PUT/JPY CALL K=121.44 17 January 2017 989 0.00
246 EURO BUND Futures March 2017 451,191 0.35 1,546 0.00
102 EURO OAT Futures March 2017 158,023 0.12
166 EURO SCHATZ Futures March 2017 24,597 0.02 Hong KongHong KongHong KongHong Kong
209 Euro STOXX 50 Index Futures March 2017 85,794 0.07 1 Call on 22,400 HSI Index 26 January 2017 1,155 0.00
44 Short Euro BTP Futures March 2017 15,389 0.01 1 Call on 22,600 HSI Index 26 January 2017 767 0.00
(35) VSTOXX Mini Index Futures January 2017 2,294 0.00 2 Call on 22,800 HSI Index 26 January 2017 1,019 0.00
957,659 0.75 2 Put on 20,600 HSI Index 26 January 2017 813 0.00
1 Put on 21,000 HSI Index 26 January 2017 696 0.00
231
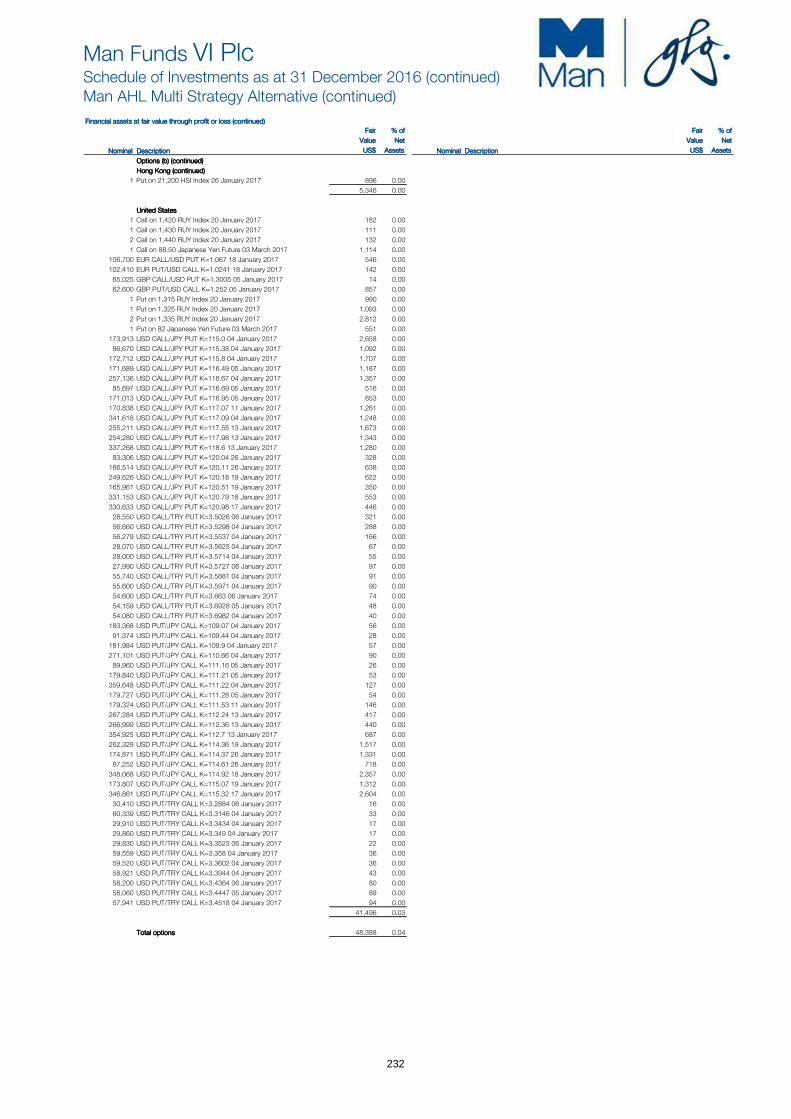
Man Funds VI PlcSchedule of Investments as at 31 December 2016 (continued)Man AHL Multi Strategy Alternative (continued)
Financial assets at fair value through profit or loss (continued)Financial assets at fair value through profit or loss (continued)Financial assets at fair value through profit or loss (continued)Financial assets at fair value through profit or loss (continued)
Fair Fair Fair Fair % of% of% of% of Fair Fair Fair Fair % of% of% of% of
Value Value Value Value NetNetNetNet Value Value Value Value NetNetNetNet
Nominal Nominal Nominal Nominal DescriptionDescriptionDescriptionDescription US$ US$ US$ US$ AssetsAssetsAssetsAssets Nominal Nominal Nominal Nominal DescriptionDescriptionDescriptionDescription US$ US$ US$ US$ AssetsAssetsAssetsAssets
Options (b) (continued)Options (b) (continued)Options (b) (continued)Options (b) (continued)
Hong Kong (continued)Hong Kong (continued)Hong Kong (continued)Hong Kong (continued)
1 Put on 21,200 HSI Index 26 January 2017 896 0.00
5,346 0.00
United StatesUnited StatesUnited StatesUnited States
1 Call on 1,420 RUY Index 20 January 2017 182 0.00
1 Call on 1,430 RUY Index 20 January 2017 111 0.00
2 Call on 1,440 RUY Index 20 January 2017 132 0.00
1 Call on 88.50 Japanese Yen Future 03 March 2017 1,114 0.00
106,700 EUR CALL/USD PUT K=1.067 18 January 2017 546 0.00
102,410 EUR PUT/USD CALL K=1.0241 18 January 2017 142 0.00
65,025 GBP CALL/USD PUT K=1.3005 05 January 2017 14 0.00
62,600 GBP PUT/USD CALL K=1.252 05 January 2017 857 0.00
1 Put on 1,315 RUY Index 20 January 2017 990 0.00
1 Put on 1,325 RUY Index 20 January 2017 1,093 0.00
2 Put on 1,335 RUY Index 20 January 2017 2,812 0.00
1 Put on 82 Japanese Yen Future 03 March 2017 551 0.00
173,913 USD CALL/JPY PUT K=115.0 04 January 2017 2,658 0.00
86,670 USD CALL/JPY PUT K=115.38 04 January 2017 1,092 0.00
172,712 USD CALL/JPY PUT K=115.8 04 January 2017 1,707 0.00
171,689 USD CALL/JPY PUT K=116.49 05 January 2017 1,187 0.00
257,136 USD CALL/JPY PUT K=116.67 04 January 2017 1,357 0.00
85,697 USD CALL/JPY PUT K=116.69 05 January 2017 516 0.00
171,013 USD CALL/JPY PUT K=116.95 05 January 2017 853 0.00
170,838 USD CALL/JPY PUT K=117.07 11 January 2017 1,261 0.00
341,618 USD CALL/JPY PUT K=117.09 04 January 2017 1,248 0.00
255,211 USD CALL/JPY PUT K=117.55 13 January 2017 1,673 0.00
254,280 USD CALL/JPY PUT K=117.98 13 January 2017 1,343 0.00
337,268 USD CALL/JPY PUT K=118.6 13 January 2017 1,280 0.00
83,306 USD CALL/JPY PUT K=120.04 26 January 2017 328 0.00
166,514 USD CALL/JPY PUT K=120.11 26 January 2017 638 0.00
249,626 USD CALL/JPY PUT K=120.18 19 January 2017 622 0.00
165,961 USD CALL/JPY PUT K=120.51 19 January 2017 350 0.00
331,153 USD CALL/JPY PUT K=120.79 18 January 2017 553 0.00
330,633 USD CALL/JPY PUT K=120.98 17 January 2017 446 0.00
28,550 USD CALL/TRY PUT K=3.5026 06 January 2017 321 0.00
56,660 USD CALL/TRY PUT K=3.5298 04 January 2017 288 0.00
56,279 USD CALL/TRY PUT K=3.5537 04 January 2017 166 0.00
28,070 USD CALL/TRY PUT K=3.5625 04 January 2017 67 0.00
28,000 USD CALL/TRY PUT K=3.5714 04 January 2017 55 0.00
27,990 USD CALL/TRY PUT K=3.5727 06 January 2017 97 0.00
55,740 USD CALL/TRY PUT K=3.5881 04 January 2017 91 0.00
55,600 USD CALL/TRY PUT K=3.5971 04 January 2017 90 0.00
54,600 USD CALL/TRY PUT K=3.663 06 January 2017 74 0.00
54,159 USD CALL/TRY PUT K=3.6928 05 January 2017 48 0.00
54,080 USD CALL/TRY PUT K=3.6982 04 January 2017 40 0.00
183,368 USD PUT/JPY CALL K=109.07 04 January 2017 56 0.00
91,374 USD PUT/JPY CALL K=109.44 04 January 2017 28 0.00
181,984 USD PUT/JPY CALL K=109.9 04 January 2017 57 0.00
271,101 USD PUT/JPY CALL K=110.66 04 January 2017 90 0.00
89,960 USD PUT/JPY CALL K=111.16 05 January 2017 26 0.00
179,840 USD PUT/JPY CALL K=111.21 05 January 2017 53 0.00
359,648 USD PUT/JPY CALL K=111.22 04 January 2017 127 0.00
179,727 USD PUT/JPY CALL K=111.28 05 January 2017 54 0.00
179,324 USD PUT/JPY CALL K=111.53 11 January 2017 146 0.00
267,284 USD PUT/JPY CALL K=112.24 13 January 2017 417 0.00
266,999 USD PUT/JPY CALL K=112.36 13 January 2017 440 0.00
354,925 USD PUT/JPY CALL K=112.7 13 January 2017 687 0.00
262,329 USD PUT/JPY CALL K=114.36 19 January 2017 1,517 0.00
174,871 USD PUT/JPY CALL K=114.37 26 January 2017 1,331 0.00
87,252 USD PUT/JPY CALL K=114.61 26 January 2017 718 0.00
348,068 USD PUT/JPY CALL K=114.92 18 January 2017 2,357 0.00
173,807 USD PUT/JPY CALL K=115.07 19 January 2017 1,312 0.00
346,861 USD PUT/JPY CALL K=115.32 17 January 2017 2,604 0.00
30,410 USD PUT/TRY CALL K=3.2884 06 January 2017 16 0.00
60,339 USD PUT/TRY CALL K=3.3146 04 January 2017 33 0.00
29,910 USD PUT/TRY CALL K=3.3434 04 January 2017 17 0.00
29,860 USD PUT/TRY CALL K=3.349 04 January 2017 17 0.00
29,830 USD PUT/TRY CALL K=3.3523 06 January 2017 22 0.00
59,559 USD PUT/TRY CALL K=3.358 04 January 2017 36 0.00
59,520 USD PUT/TRY CALL K=3.3602 04 January 2017 36 0.00
58,921 USD PUT/TRY CALL K=3.3944 04 January 2017 43 0.00
58,200 USD PUT/TRY CALL K=3.4364 06 January 2017 80 0.00
58,060 USD PUT/TRY CALL K=3.4447 05 January 2017 89 0.00
57,941 USD PUT/TRY CALL K=3.4518 04 January 2017 94 0.00
41,496 0.03
Total optionsTotal optionsTotal optionsTotal options 48,388 0.04
232
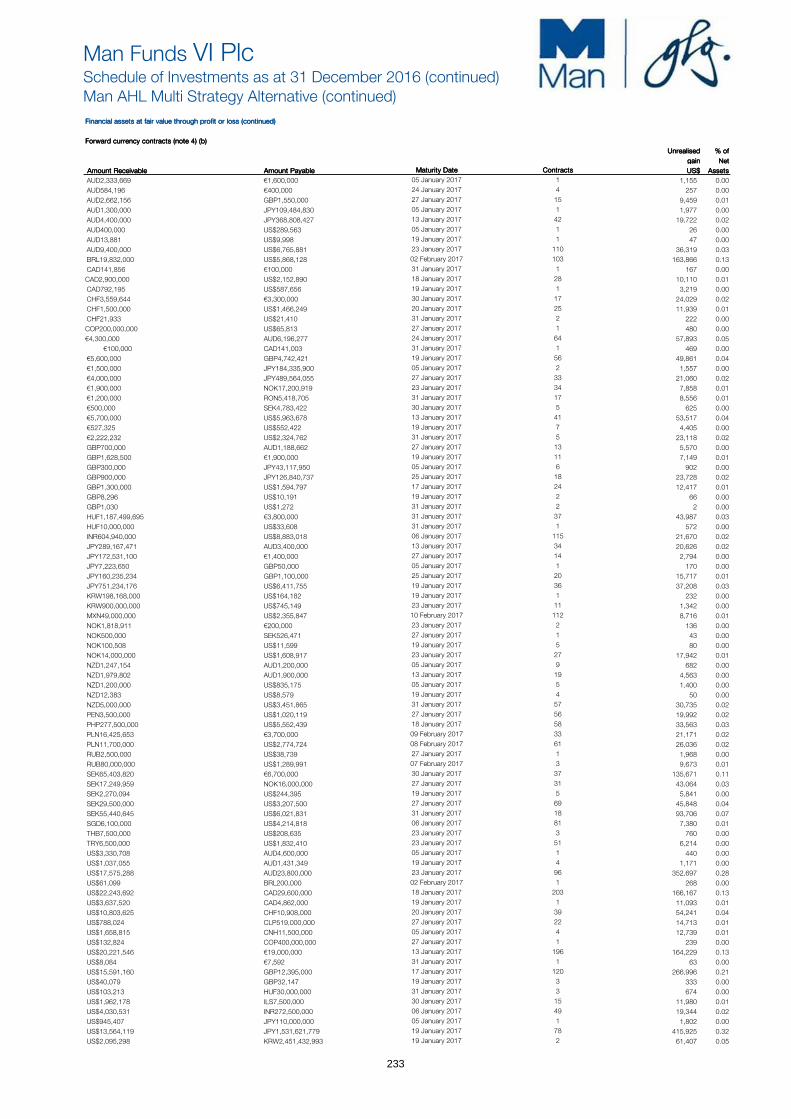
Man Funds VI PlcSchedule of Investments as at 31 December 2016 (continued)Man AHL Multi Strategy Alternative (continued)
Financial assets at fair value through profit or loss (continued)Financial assets at fair value through profit or loss (continued)Financial assets at fair value through profit or loss (continued)Financial assets at fair value through profit or loss (continued)
Forward currency contracts (note 4) (b)Forward currency contracts (note 4) (b)Forward currency contracts (note 4) (b)Forward currency contracts (note 4) (b)
Unrealised Unrealised Unrealised Unrealised % of% of% of% of Unrealised Unrealised Unrealised Unrealised
gain gain gain gain Net Net Net Net
Amount ReceivableAmount ReceivableAmount ReceivableAmount Receivable Amount PayableAmount PayableAmount PayableAmount Payable Maturity DateMaturity DateMaturity DateMaturity Date ContractsContractsContractsContracts US$ US$ US$ US$ AssetsAssetsAssetsAssets
AUD2,333,669 €1,600,000 05 January 2017 1 1,155 0.00
AUD584,196 €400,000 24 January 2017 4 257 0.00
AUD2,662,156 GBP1,550,000 27 January 2017 15 9,459 0.01
AUD1,300,000 JPY109,484,830 05 January 2017 1 1,977 0.00
AUD4,400,000 JPY368,808,427 13 January 2017 42 19,722 0.02
AUD400,000 US$289,563 05 January 2017 1 26 0.00
AUD13,881 US$9,998 19 January 2017 1 47 0.00
AUD9,400,000 US$6,765,881 23 January 2017 110 36,319 0.03
BRL19,832,000 US$5,868,128 02 February 2017 103 163,866 0.13
CAD141,856 €100,000 31 January 2017 1 167 0.00
CAD2,900,000 US$2,152,890 18 January 2017 28 10,110 0.01
CAD792,195 US$587,656 19 January 2017 1 3,219 0.00
CHF3,559,644 €3,300,000 30 January 2017 17 24,029 0.02
CHF1,500,000 US$1,466,249 20 January 2017 25 11,939 0.01
CHF21,933 US$21,410 31 January 2017 2 222 0.00
COP200,000,000 US$65,813 27 January 2017 1 480 0.00
€4,300,000 AUD6,196,277 24 January 2017 64 57,893 0.05
€100,000 CAD141,003 31 January 2017 1 469 0.00
€5,600,000 GBP4,742,421 19 January 2017 56 49,861 0.04
€1,500,000 JPY184,335,900 05 January 2017 2 1,557 0.00
€4,000,000 JPY489,564,055 27 January 2017 33 21,060 0.02
€1,900,000 NOK17,200,919 23 January 2017 34 7,858 0.01
€1,200,000 RON5,418,705 31 January 2017 17 8,556 0.01
€500,000 SEK4,783,422 30 January 2017 5 625 0.00
€5,700,000 US$5,963,678 13 January 2017 41 53,517 0.04
€527,325 US$552,422 19 January 2017 7 4,405 0.00
€2,222,232 US$2,324,762 31 January 2017 5 23,118 0.02
GBP700,000 AUD1,188,662 27 January 2017 13 5,570 0.00
GBP1,628,500 €1,900,000 19 January 2017 11 7,149 0.01
GBP300,000 JPY43,117,950 05 January 2017 6 902 0.00
GBP900,000 JPY126,840,737 25 January 2017 18 23,728 0.02
GBP1,300,000 US$1,594,797 17 January 2017 24 12,417 0.01
GBP8,296 US$10,191 19 January 2017 2 66 0.00
GBP1,030 US$1,272 31 January 2017 2 2 0.00
HUF1,187,499,695 €3,800,000 31 January 2017 37 43,987 0.03
HUF10,000,000 US$33,608 31 January 2017 1 572 0.00
INR604,940,000 US$8,883,018 06 January 2017 115 21,670 0.02
JPY289,167,471 AUD3,400,000 13 January 2017 34 20,626 0.02
JPY172,531,100 €1,400,000 27 January 2017 14 2,794 0.00
JPY7,223,650 GBP50,000 05 January 2017 1 170 0.00
JPY160,235,234 GBP1,100,000 25 January 2017 20 15,717 0.01
JPY751,234,176 US$6,411,755 19 January 2017 36 37,208 0.03
KRW198,168,000 US$164,182 19 January 2017 1 232 0.00
KRW900,000,000 US$745,149 23 January 2017 11 1,342 0.00
MXN49,000,000 US$2,355,847 10 February 2017 112 8,716 0.01
NOK1,818,911 €200,000 23 January 2017 2 136 0.00
NOK500,000 SEK526,471 27 January 2017 1 43 0.00
NOK100,508 US$11,599 19 January 2017 5 80 0.00
NOK14,000,000 US$1,608,917 23 January 2017 27 17,942 0.01
NZD1,247,154 AUD1,200,000 05 January 2017 9 682 0.00
NZD1,979,802 AUD1,900,000 13 January 2017 19 4,563 0.00
NZD1,200,000 US$835,175 05 January 2017 5 1,400 0.00
NZD12,383 US$8,579 19 January 2017 4 50 0.00
NZD5,000,000 US$3,451,865 31 January 2017 57 30,735 0.02
PEN3,500,000 US$1,020,119 27 January 2017 56 19,992 0.02
PHP277,500,000 US$5,552,439 18 January 2017 58 33,563 0.03
PLN16,425,653 €3,700,000 09 February 2017 33 21,171 0.02
PLN11,700,000 US$2,774,724 08 February 2017 61 26,036 0.02
RUB2,500,000 US$38,739 27 January 2017 1 1,968 0.00
RUB80,000,000 US$1,289,991 07 February 2017 3 9,673 0.01
SEK65,403,820 €6,700,000 30 January 2017 37 135,671 0.11
SEK17,249,959 NOK16,000,000 27 January 2017 31 43,064 0.03
SEK2,270,094 US$244,395 19 January 2017 5 5,841 0.00
SEK29,500,000 US$3,207,500 27 January 2017 69 45,848 0.04
SEK55,440,645 US$6,021,831 31 January 2017 18 93,706 0.07
SGD6,100,000 US$4,214,818 06 January 2017 81 7,380 0.01
THB7,500,000 US$208,635 23 January 2017 3 760 0.00
TRY6,500,000 US$1,832,410 23 January 2017 51 6,214 0.00
US$3,330,708 AUD4,600,000 05 January 2017 1 440 0.00
US$1,037,055 AUD1,431,349 19 January 2017 4 1,171 0.00
US$17,575,288 AUD23,800,000 23 January 2017 96 352,697 0.28
US$61,099 BRL200,000 02 February 2017 1 268 0.00
US$22,243,692 CAD29,600,000 18 January 2017 203 166,167 0.13
US$3,637,520 CAD4,862,000 19 January 2017 1 11,093 0.01
US$10,803,625 CHF10,908,000 20 January 2017 39 54,241 0.04
US$788,024 CLP519,000,000 27 January 2017 22 14,713 0.01
US$1,658,815 CNH11,500,000 05 January 2017 4 12,739 0.01
US$132,824 COP400,000,000 27 January 2017 1 239 0.00
US$20,221,546 €19,000,000 13 January 2017 196 164,229 0.13
US$8,084 €7,592 31 January 2017 1 63 0.00
US$15,591,160 GBP12,395,000 17 January 2017 120 266,996 0.21
US$40,079 GBP32,147 19 January 2017 3 333 0.00
US$103,213 HUF30,000,000 31 January 2017 3 674 0.00
US$1,962,178 ILS7,500,000 30 January 2017 15 11,980 0.01
US$4,030,531 INR272,500,000 06 January 2017 49 19,344 0.02
US$945,407 JPY110,000,000 05 January 2017 1 1,802 0.00
US$13,564,119 JPY1,531,621,779 19 January 2017 78 415,925 0.32
US$2,095,298 KRW2,451,432,993 19 January 2017 2 61,407 0.05
233

Man Funds VI PlcSchedule of Investments as at 31 December 2016 (continued)Man AHL Multi Strategy Alternative (continued)
Financial assets at fair value through profit or loss (continued)Financial assets at fair value through profit or loss (continued)Financial assets at fair value through profit or loss (continued)Financial assets at fair value through profit or loss (continued)
Forward currency contracts (note 4)* (b) (continued)Forward currency contracts (note 4)* (b) (continued)Forward currency contracts (note 4)* (b) (continued)Forward currency contracts (note 4)* (b) (continued)
Unrealised Unrealised Unrealised Unrealised % of% of% of% of
gain gain gain gain Net Net Net Net
Amount ReceivableAmount ReceivableAmount ReceivableAmount Receivable Amount PayableAmount PayableAmount PayableAmount Payable Maturity DateMaturity DateMaturity DateMaturity Date ContractsContractsContractsContracts US$ US$ US$ US$ AssetsAssetsAssetsAssets
US$9,126,592 KRW10,900,000,000 23 January 2017 32 85,753 0.07
US$3,392,615 MXN69,681,000 10 February 2017 86 30,062 0.02
US$3,678,393 NOK31,000,000 23 January 2017 50 76,062 0.06
US$571,013 NZD800,000 17 January 2017 2 13,530 0.01
US$4,178,787 NZD5,900,000 31 January 2017 47 69,319 0.04
US$148,672 PEN500,000 27 January 2017 1 85 0.00
US$1,208,943 PLN4,988,000 08 February 2017 26 14,910 0.01
US$498,060 SEK4,500,000 27 January 2017 7 1,787 0.00
US$15,725,152 SGD22,500,000 06 January 2017 145 151,469 0.13
US$2,665,385 TRY9,200,000 23 January 2017 34 63,026 0.05
US$1,639,411 TWD52,500,000 06 January 2017 16 18,040 0.01
US$77,640 TWD2,500,000 10 February 2017 1 403 0.00
US$551,236 ZAR7,500,000 25 January 2017 14 5,594 0.00
ZAR3,239,301 US$230,447 19 January 2017 1 5,511 0.00
ZAR41,337,000 US$2,972,059 25 January 2017 99 35,300 0.03
Total unrealised gain on forward currency contractsTotal unrealised gain on forward currency contractsTotal unrealised gain on forward currency contractsTotal unrealised gain on forward currency contracts 3,348,671 2.62
Total financial assets at fair value through profit or loss - tradingTotal financial assets at fair value through profit or loss - tradingTotal financial assets at fair value through profit or loss - tradingTotal financial assets at fair value through profit or loss - trading 52,814,358 41.26
234
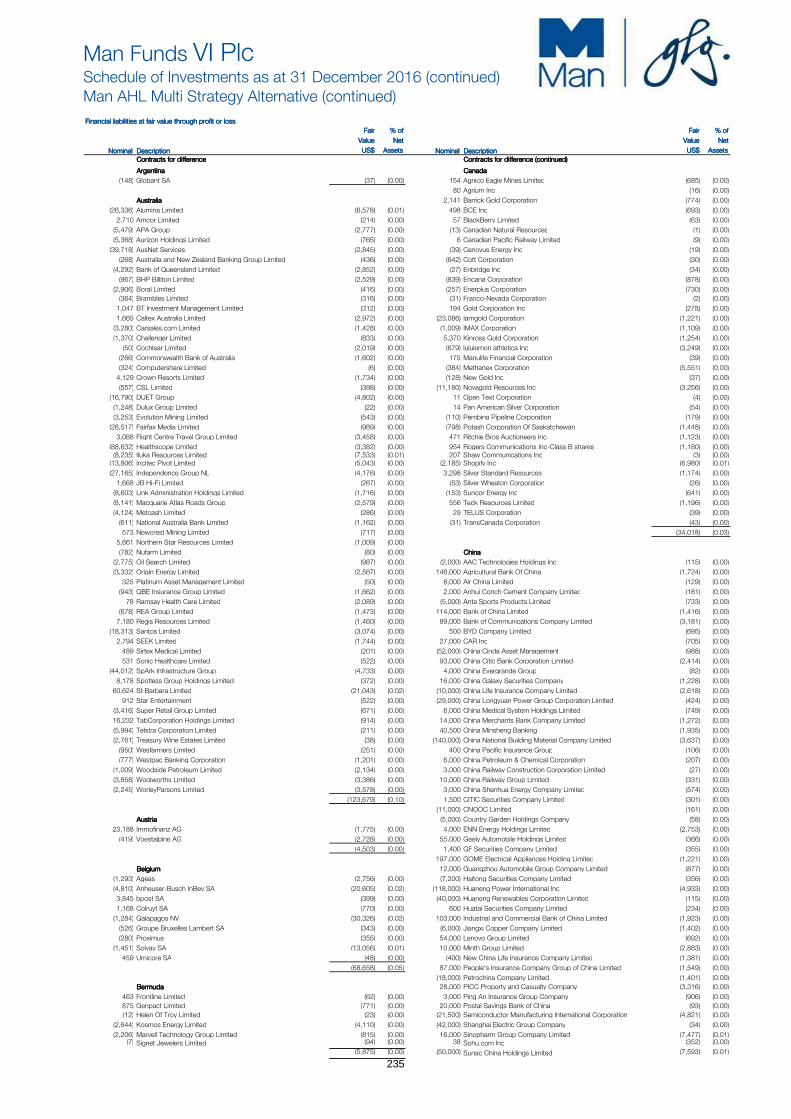
Man Funds VI PlcSchedule of Investments as at 31 December 2016 (continued)Man AHL Multi Strategy Alternative (continued)
Financial liabilities at fair value through profit or lossFinancial liabilities at fair value through profit or lossFinancial liabilities at fair value through profit or lossFinancial liabilities at fair value through profit or loss
Fair Fair Fair Fair % of% of% of% of Fair Fair Fair Fair % of% of% of% of
Value Value Value Value NetNetNetNet Value Value Value Value NetNetNetNet
Nominal Nominal Nominal Nominal DescriptionDescriptionDescriptionDescription US$ US$ US$ US$ AssetsAssetsAssetsAssets Nominal Nominal Nominal Nominal DescriptionDescriptionDescriptionDescription US$ US$ US$ US$ AssetsAssetsAssetsAssets
Contracts for differenceContracts for differenceContracts for differenceContracts for difference Contracts for difference (continued)Contracts for difference (continued)Contracts for difference (continued)Contracts for difference (continued)
ArgentinaArgentinaArgentinaArgentina CanadaCanadaCanadaCanada
(148) Globant SA (37) (0.00) 154 Agnico Eagle Mines Limited (685) (0.00)
80 Agrium Inc (16) (0.00)
AustraliaAustraliaAustraliaAustralia 2,141 Barrick Gold Corporation (774) (0.00)
(26,336) Alumina Limited (6,578) (0.01) 498 BCE Inc (693) (0.00)
2,710 Amcor Limited (214) (0.00) 57 BlackBerry Limited (63) (0.00)
(5,479) APA Group (2,777) (0.00) (13) Canadian Natural Resources (1) (0.00)
(5,368) Aurizon Holdings Limited (765) (0.00) 6 Canadian Pacific Railway Limited (9) (0.00)
(39,718) AusNet Services (2,845) (0.00) (39) Cenovus Energy Inc (19) (0.00)
(268) Australia and New Zealand Banking Group Limited (436) (0.00) (642) Cott Corporation (30) (0.00)
(4,292) Bank of Queensland Limited (2,852) (0.00) (27) Enbridge Inc (34) (0.00)
(967) BHP Billiton Limited (2,529) (0.00) (839) Encana Corporation (878) (0.00)
(2,906) Boral Limited (416) (0.00) (257) Enerplus Corporation (730) (0.00)
(364) Brambles Limited (316) (0.00) (31) Franco-Nevada Corporation (2) (0.00)
1,047 BT Investment Management Limited (312) (0.00) 194 Gold Corporation Inc (278) (0.00)
1,665 Caltex Australia Limited (2,972) (0.00) (23,086) Iamgold Corporation (1,221) (0.00)
(3,280) Carsales.com Limited (1,428) (0.00) (1,009) IMAX Corporation (1,109) (0.00)
(1,370) Challenger Limited (833) (0.00) 5,370 Kinross Gold Corporation (1,254) (0.00)
(50) Cochlear Limited (2,019) (0.00) (679) lululemon athletica Inc (3,249) (0.00)
(266) Commonwealth Bank of Australia (1,602) (0.00) 175 Manulife Financial Corporation (39) (0.00)
(324) Computershare Limited (6) (0.00) (384) Methanex Corporation (5,551) (0.00)
4,129 Crown Resorts Limited (1,734) (0.00) (128) New Gold Inc (37) (0.00)
(557) CSL Limited (398) (0.00) (11,180) Novagold Resources Inc (3,256) (0.00)
(16,790) DUET Group (4,802) (0.00) 11 Open Text Corporation (4) (0.00)
(1,248) Dulux Group Limited (22) (0.00) 14 Pan American Silver Corporation (54) (0.00)
(3,253) Evolution Mining Limited (543) (0.00) (110) Pembina Pipeline Corporation (179) (0.00)
(26,517) Fairfax Media Limited (989) (0.00) (798) Potash Corporation Of Saskatchewan (1,448) (0.00)
3,088 Flight Centre Travel Group Limited (3,458) (0.00) 471 Ritchie Bros Auctioneers Inc (1,123) (0.00)
(88,632) Healthscope Limited (3,382) (0.00) 954 Rogers Communications Inc-Class B shares (1,180) (0.00) (8,235) Iluka Resources Limited (7,533) (0.01) 207 Shaw Communications Inc (3) (0.00) (13,806) Incitec Pivot Limited (5,043) (0.00) (2,185) Shopify Inc (6,980) (0.01)
(27,165) Independence Group NL (4,176) (0.00) 3,298 Silver Standard Resources (1,174) (0.00)
1,668 JB Hi-Fi Limited (267) (0.00) (53) Silver Wheaton Corporation (26) (0.00)
(8,603) Link Administration Holdings Limited (1,716) (0.00) (153) Suncor Energy Inc (641) (0.00)
(8,141) Macquarie Atlas Roads Group (2,579) (0.00) 556 Teck Resources Limited (1,196) (0.00)
(4,124) Metcash Limited (286) (0.00) 29 TELUS Corporation (39) (0.00)
(611) National Australia Bank Limited (1,162) (0.00) (31) TransCanada Corporation (43) (0.00)
573 Newcrest Mining Limited (717) (0.00) (34,018) (0.03)
5,661 Northern Star Resources Limited (1,009) (0.00)
(782) Nufarm Limited (80) (0.00) ChinaChinaChinaChina
(2,775) Oil Search Limited (987) (0.00) (2,000) AAC Technologies Holdings Inc (115) (0.00)
(3,332) Origin Energy Limited (2,567) (0.00) 146,000 Agricultural Bank Of China (1,724) (0.00)
325 Platinum Asset Management Limited (50) (0.00) 8,000 Air China Limited (129) (0.00)
(943) QBE Insurance Group Limited (1,662) (0.00) 2,000 Anhui Conch Cement Company Limited (181) (0.00)
78 Ramsay Health Care Limited (2,089) (0.00) (5,000) Anta Sports Products Limited (733) (0.00)
(678) REA Group Limited (1,473) (0.00) 114,000 Bank of China Limited (1,416) (0.00)
7,180 Regis Resources Limited (1,460) (0.00) 89,000 Bank of Communications Company Limited (3,181) (0.00)
(18,313) Santos Limited (3,074) (0.00) 500 BYD Company Limited (695) (0.00)
2,794 SEEK Limited (1,744) (0.00) 27,000 CAR Inc (705) (0.00)
489 Sirtex Medical Limited (201) (0.00) (52,000) China Cinda Asset Management (988) (0.00)
531 Sonic Healthcare Limited (522) (0.00) 93,000 China Citic Bank Corporation Limited (2,414) (0.00)
(44,012) SpArk Infrastructure Group (4,733) (0.00) 4,000 China Evergrande Group (82) (0.00)
8,178 Spotless Group Holdings Limited (372) (0.00) 16,000 China Galaxy Securities Company (1,228) (0.00)
60,624 St Barbara Limited (21,043) (0.02) (10,000) China Life Insurance Company Limited (2,618) (0.00)
912 Star Entertainment (522) (0.00) (29,000) China Longyuan Power Group Corporation Limited (424) (0.00)
(3,416) Super Retail Group Limited (671) (0.00) 6,000 China Medical System Holdings Limited (749) (0.00)
16,232 TabCorporation Holdings Limited (914) (0.00) 14,000 China Merchants Bank Company Limited (1,272) (0.00)
(5,994) Telstra Corporation Limited (211) (0.00) 40,500 China Minsheng Banking (1,935) (0.00)
(2,761) Treasury Wine Estates Limited (38) (0.00) (140,000) China National Building Material Company Limited (3,637) (0.00)
(950) Wesfarmers Limited (251) (0.00) 400 China Pacific Insurance Group (106) (0.00)
(777) Westpac Banking Corporation (1,201) (0.00) 6,000 China Petroleum & Chemical Corporation (207) (0.00)
(1,009) Woodside Petroleum Limited (2,134) (0.00) 3,000 China Railway Construction Corporation Limited (27) (0.00)
(3,858) Woolworths Limited (3,386) (0.00) 10,000 China Railway Group Limited (331) (0.00)
(2,245) WorleyParsons Limited (3,578) (0.00) 3,000 China Shenhua Energy Company Limited (574) (0.00)
(123,679) (0.10) 1,500 CITIC Securities Company Limited (301) (0.00)
(11,000) CNOOC Limited (161) (0.00)
AustriaAustriaAustriaAustria (5,000) Country Garden Holdings Company (58) (0.00)
23,188 Immofinanz AG (1,775) (0.00) 4,000 ENN Energy Holdings Limited (2,753) (0.00)
(419) Voestalpine AG (2,728) (0.00) 55,000 Geely Automobile Holdings Limited (366) (0.00)
(4,503) (0.00) 1,400 GF Securities Company Limited (355) (0.00)
197,000 GOME Electrical Appliances Holding Limited (1,221) (0.00)
BelgiumBelgiumBelgiumBelgium 12,000 Guangzhou Automobile Group Company Limited (877) (0.00)
(1,293) Ageas (2,756) (0.00) (7,200) Haitong Securities Company Limited (356) (0.00)
(4,810) Anheuser-Busch InBev SA (20,605) (0.02) (118,000) Huaneng Power International Inc (4,933) (0.00)
3,845 bpost SA (399) (0.00) (40,000) Huaneng Renewables Corporation Limited (115) (0.00)
1,168 Colruyt SA (770) (0.00) 600 Huatai Securities Company Limited (234) (0.00)
(1,284) Galapagos NV (30,326) (0.02) 103,000 Industrial and Commercial Bank of China Limited (1,923) (0.00)
(526) Groupe Bruxelles Lambert SA (343) (0.00) (6,000) Jiangxi Copper Company Limited (1,402) (0.00)
(280) Proximus (355) (0.00) 54,000 Lenovo Group Limited (692) (0.00)
(1,451) Solvay SA (13,056) (0.01) 10,000 Minth Group Limited (2,883) (0.00)
459 Umicore SA (48) (0.00) (400) New China Life Insurance Company Limited (1,381) (0.00)
(68,658) (0.05) 87,000 People's Insurance Company Group of China Limited (1,549) (0.00)
(18,000) Petrochina Company Limited (1,401) (0.00)
BermudaBermudaBermudaBermuda 28,000 PICC Property and Casualty Company (3,316) (0.00)
463 Frontline Limited (62) (0.00) 3,000 Ping An Insurance Group Company (906) (0.00)
875 Genpact Limited (771) (0.00) 20,000 Postal Savings Bank of China (93) (0.00)
(12) Helen Of Troy Limited (23) (0.00) (21,500) Semiconductor Manufacturing International Corporation (4,821) (0.00)
(2,644) Kosmos Energy Limited (4,110) (0.00) (42,000) Shanghai Electric Group Company (34) (0.00)
(2,206) Marvell Technology Group Limited (815) (0.00) 16,000 Sinopharm Group Company Limited (7,477) (0.01) (7) Signet Jewelers Limited (94) (0.00) 38 Sohu.com Inc (352) (0.00)
(5,875) (0.00) (50,000) Sunac China Holdings Limited (7,593) (0.01)
235
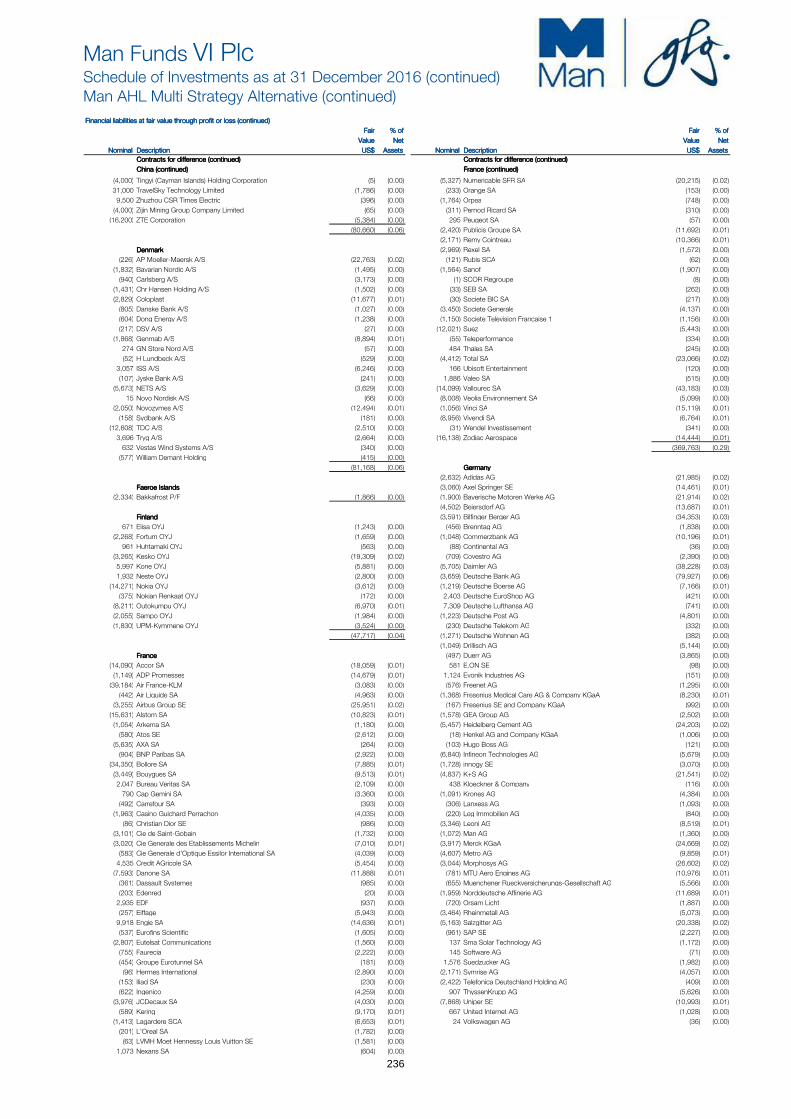
Man Funds VI PlcSchedule of Investments as at 31 December 2016 (continued)Man AHL Multi Strategy Alternative (continued)
Financial liabilities at fair value through profit or loss (continued)Financial liabilities at fair value through profit or loss (continued)Financial liabilities at fair value through profit or loss (continued)Financial liabilities at fair value through profit or loss (continued)
Fair Fair Fair Fair % of% of% of% of Fair Fair Fair Fair % of% of% of% of
Value Value Value Value NetNetNetNet Value Value Value Value NetNetNetNet
Nominal Nominal Nominal Nominal DescriptionDescriptionDescriptionDescription US$ US$ US$ US$ AssetsAssetsAssetsAssets Nominal Nominal Nominal Nominal DescriptionDescriptionDescriptionDescription US$ US$ US$ US$ AssetsAssetsAssetsAssets
Contracts for difference (continued)Contracts for difference (continued)Contracts for difference (continued)Contracts for difference (continued) Contracts for difference (continued)Contracts for difference (continued)Contracts for difference (continued)Contracts for difference (continued)
China (continued)China (continued)China (continued)China (continued) France (continued)France (continued)France (continued)France (continued)
(4,000) Tingyi (Cayman Islands) Holding Corporation (5) (0.00) (5,327) Numericable SFR SA (20,215) (0.02)
31,000 TravelSky Technology Limited (1,786) (0.00) (233) Orange SA (153) (0.00)
9,500 Zhuzhou CSR Times Electric (396) (0.00) (1,764) Orpea (748) (0.00)
(4,000) Zijin Mining Group Company Limited (65) (0.00) (311) Pernod Ricard SA (310) (0.00)
(16,200) ZTE Corporation (5,384) (0.00) 295 Peugeot SA (57) (0.00)
(80,660) (0.06) (2,420) Publicis Groupe SA (11,692) (0.01)
(2,171) Remy Cointreau (10,366) (0.01)
DenmarkDenmarkDenmarkDenmark (2,969) Rexel SA (1,572) (0.00)
(226) AP Moeller-Maersk A/S (22,763) (0.02) (121) Rubis SCA (62) (0.00)
(1,832) Bavarian Nordic A/S (1,495) (0.00) (1,564) Sanofi (1,907) (0.00)
(940) Carlsberg A/S (3,173) (0.00) (1) SCOR Regroupe (8) (0.00)
(1,431) Chr Hansen Holding A/S (1,502) (0.00) (33) SEB SA (262) (0.00)
(2,829) Coloplast (11,677) (0.01) (30) Societe BIC SA (217) (0.00)
(805) Danske Bank A/S (1,027) (0.00) (3,450) Societe Generale (4,137) (0.00)
(604) Dong Energy A/S (1,238) (0.00) (1,150) Societe Television Francaise 1 (1,156) (0.00)
(217) DSV A/S (27) (0.00) (12,021) Suez (5,443) (0.00)
(1,868) Genmab A/S (8,894) (0.01) (55) Teleperformance (334) (0.00)
274 GN Store Nord A/S (57) (0.00) 484 Thales SA (245) (0.00)
(52) H Lundbeck A/S (529) (0.00) (4,412) Total SA (23,066) (0.02)
3,057 ISS A/S (6,246) (0.00) 166 Ubisoft Entertainment (120) (0.00)
(107) Jyske Bank A/S (241) (0.00) 1,886 Valeo SA (515) (0.00)
(5,673) NETS A/S (3,629) (0.00) (14,099) Vallourec SA (43,183) (0.03)
15 Novo Nordisk A/S (66) (0.00) (8,008) Veolia Environnement SA (5,099) (0.00)
(2,050) Novozymes A/S (12,494) (0.01) (1,056) Vinci SA (15,119) (0.01)
(158) Sydbank A/S (181) (0.00) (8,956) Vivendi SA (6,764) (0.01)
(12,608) TDC A/S (2,510) (0.00) (31) Wendel Investissement (341) (0.00)
3,696 Tryg A/S (2,664) (0.00) (16,138) Zodiac Aerospace (14,444) (0.01)
632 Vestas Wind Systems A/S (340) (0.00) (369,763) (0.29)
(577) William Demant Holding (415) (0.00)
(81,168) (0.06) GermanyGermanyGermanyGermany
(2,632) Adidas AG (21,985) (0.02)
Faeroe IslandsFaeroe IslandsFaeroe IslandsFaeroe Islands (3,060) Axel Springer SE (14,461) (0.01)
(2,334) Bakkafrost P/F (1,866) (0.00) (1,900) Bayerische Motoren Werke AG (21,914) (0.02)
(4,502) Beiersdorf AG (13,687) (0.01)
FinlandFinlandFinlandFinland (3,591) Bilfinger Berger AG (34,353) (0.03)
671 Elisa OYJ (1,243) (0.00) (456) Brenntag AG (1,838) (0.00)
(2,268) Fortum OYJ (1,659) (0.00) (1,048) Commerzbank AG (10,196) (0.01)
961 Huhtamaki OYJ (563) (0.00) (88) Continental AG (36) (0.00)
(3,265) Kesko OYJ (19,309) (0.02) (709) Covestro AG (2,390) (0.00)
5,997 Kone OYJ (5,881) (0.00) (5,705) Daimler AG (38,228) (0.03)
1,932 Neste OYJ (2,800) (0.00) (3,659) Deutsche Bank AG (79,927) (0.06)
(14,271) Nokia OYJ (3,612) (0.00) (1,219) Deutsche Boerse AG (7,166) (0.01)
(375) Nokian Renkaat OYJ (172) (0.00) 2,403 Deutsche EuroShop AG (421) (0.00)
(8,211) Outokumpu OYJ (6,970) (0.01) 7,309 Deutsche Lufthansa AG (741) (0.00)
(2,055) Sampo OYJ (1,984) (0.00) (1,223) Deutsche Post AG (4,801) (0.00)
(1,830) UPM-Kymmene OYJ (3,524) (0.00) (230) Deutsche Telekom AG (332) (0.00)
(47,717) (0.04) (1,271) Deutsche Wohnen AG (382) (0.00)
(1,049) Drillisch AG (5,144) (0.00)
FranceFranceFranceFrance (497) Duerr AG (3,865) (0.00)
(14,090) Accor SA (18,059) (0.01) 581 E.ON SE (98) (0.00)
(1,149) ADP Promesses (14,679) (0.01) 1,124 Evonik Industries AG (151) (0.00)
(39,184) Air France-KLM (3,083) (0.00) (576) Freenet AG (1,295) (0.00)
(442) Air Liquide SA (4,963) (0.00) (1,368) Fresenius Medical Care AG & Company KGaA (8,230) (0.01)
(3,255) Airbus Group SE (25,951) (0.02) (167) Fresenius SE and Company KGaA (992) (0.00)
(15,631) Alstom SA (10,823) (0.01) (1,578) GEA Group AG (2,502) (0.00)
(1,054) Arkema SA (1,180) (0.00) (5,457) Heidelberg Cement AG (24,203) (0.02)
(580) Atos SE (2,612) (0.00) (18) Henkel AG and Company KGaA (1,006) (0.00)
(5,635) AXA SA (264) (0.00) (103) Hugo Boss AG (121) (0.00)
(904) BNP Paribas SA (2,922) (0.00) (6,840) Infineon Technologies AG (5,679) (0.00)
(34,350) Bollore SA (7,885) (0.01) (1,728) innogy SE (3,070) (0.00)
(3,449) Bouygues SA (9,513) (0.01) (4,837) K+S AG (21,541) (0.02)
2,047 Bureau Veritas SA (2,109) (0.00) 438 Kloeckner & Company (116) (0.00)
790 Cap Gemini SA (3,360) (0.00) (1,091) Krones AG (4,384) (0.00)
(492) Carrefour SA (393) (0.00) (306) Lanxess AG (1,093) (0.00)
(1,963) Casino Guichard Perrachon (4,035) (0.00) (220) Leg Immobilien AG (840) (0.00)
(86) Christian Dior SE (986) (0.00) (3,346) Leoni AG (8,519) (0.01)
(3,101) Cie de Saint-Gobain (1,732) (0.00) (1,072) Man AG (1,360) (0.00)
(3,020) Cie Generale des Etablissements Michelin (7,010) (0.01) (3,917) Merck KGaA (24,669) (0.02)
(583) Cie Generale d'Optique Essilor International SA (4,039) (0.00) (4,607) Metro AG (9,859) (0.01)
4,535 Credit AGricole SA (5,454) (0.00) (3,044) Morphosys AG (26,602) (0.02)
(7,593) Danone SA (11,888) (0.01) (781) MTU Aero Engines AG (10,976) (0.01)
(361) Dassault Systemes (985) (0.00) (655) Muenchener Rueckversicherungs-Gesellschaft AG (5,566) (0.00)
(203) Edenred (20) (0.00) (1,959) Norddeutsche Affinerie AG (11,689) (0.01)
2,935 EDF (937) (0.00) (720) Orsam Licht (1,887) (0.00)
(257) Eiffage (5,943) (0.00) (3,464) Rheinmetall AG (5,073) (0.00)
9,918 Engie SA (14,636) (0.01) (5,163) Salzgitter AG (20,338) (0.02)
(537) Eurofins Scientific (1,605) (0.00) (961) SAP SE (2,227) (0.00)
(2,807) Eutelsat Communications (1,560) (0.00) 137 Sma Solar Technology AG (1,172) (0.00)
(755) Faurecia (2,222) (0.00) 145 Software AG (71) (0.00)
(454) Groupe Eurotunnel SA (181) (0.00) 1,576 Suedzucker AG (1,982) (0.00)
(96) Hermes International (2,890) (0.00) (2,171) Symrise AG (4,057) (0.00)
(153) Iliad SA (230) (0.00) (2,422) Telefonica Deutschland Holding AG (409) (0.00)
(622) Ingenico (4,259) (0.00) 907 ThyssenKrupp AG (5,626) (0.00)
(3,976) JCDecaux SA (4,030) (0.00) (7,868) Uniper SE (10,993) (0.01)
(589) Kering (9,170) (0.01) 667 United Internet AG (1,028) (0.00)
(1,413) Lagardere SCA (6,653) (0.01) 24 Volkswagen AG (36) (0.00)
(201) L'Oreal SA (1,782) (0.00)
(63) LVMH Moet Hennessy Louis Vuitton SE (1,581) (0.00)
1,073 Nexans SA (604) (0.00)
236
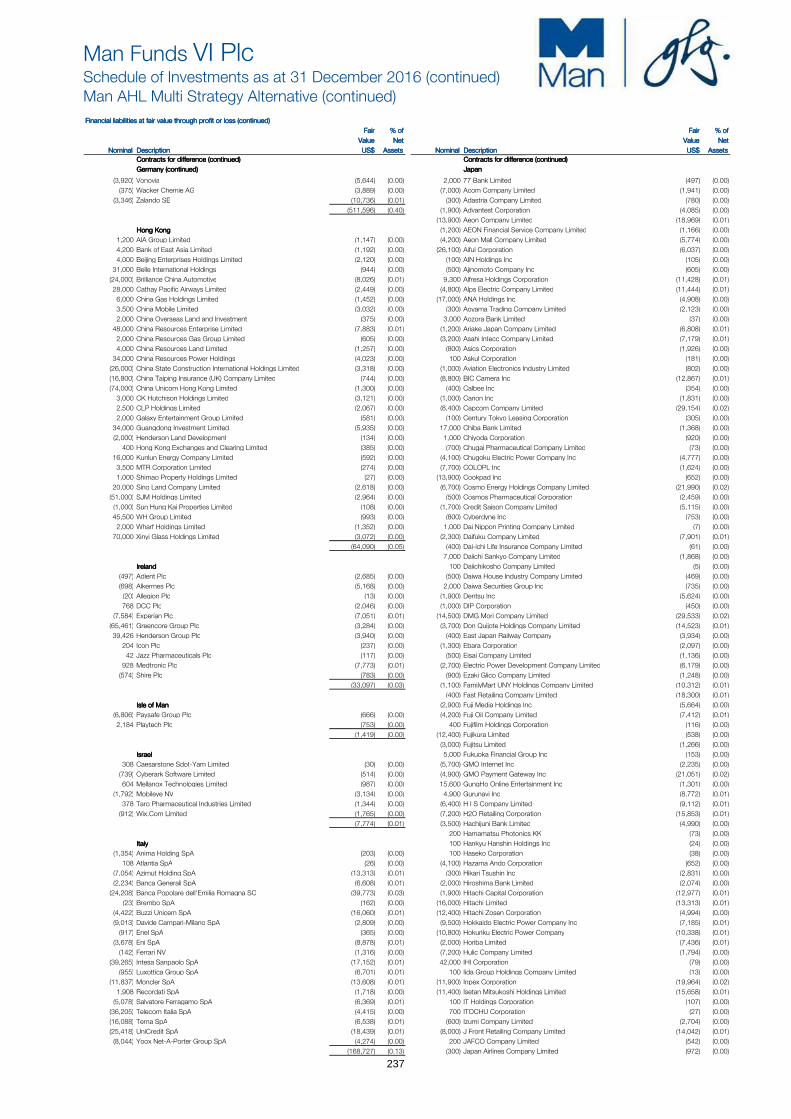
Man Funds VI PlcSchedule of Investments as at 31 December 2016 (continued)Man AHL Multi Strategy Alternative (continued)
Financial liabilities at fair value through profit or loss (continued)Financial liabilities at fair value through profit or loss (continued)Financial liabilities at fair value through profit or loss (continued)Financial liabilities at fair value through profit or loss (continued)
Fair Fair Fair Fair % of% of% of% of Fair Fair Fair Fair % of% of% of% of
Value Value Value Value NetNetNetNet Value Value Value Value NetNetNetNet
Nominal Nominal Nominal Nominal DescriptionDescriptionDescriptionDescription US$ US$ US$ US$ AssetsAssetsAssetsAssets Nominal Nominal Nominal Nominal DescriptionDescriptionDescriptionDescription US$ US$ US$ US$ AssetsAssetsAssetsAssets
Contracts for difference (continued)Contracts for difference (continued)Contracts for difference (continued)Contracts for difference (continued) Contracts for difference (continued)Contracts for difference (continued)Contracts for difference (continued)Contracts for difference (continued)
Germany (continued)Germany (continued)Germany (continued)Germany (continued) JapanJapanJapanJapan
(3,920) Vonovia (5,644) (0.00) 2,000 77 Bank Limited (497) (0.00)
(375) Wacker Chemie AG (3,889) (0.00) (7,000) Acom Company Limited (1,941) (0.00)
(3,346) Zalando SE (10,736) (0.01) (300) Adastria Company Limited (780) (0.00)
(511,596) (0.40) (1,900) Advantest Corporation (4,085) (0.00)
(13,900) Aeon Company Limited (18,969) (0.01)
Hong KongHong KongHong KongHong Kong (1,200) AEON Financial Service Company Limited (1,166) (0.00)
1,200 AIA Group Limited (1,147) (0.00) (4,200) Aeon Mall Company Limited (5,774) (0.00)
4,200 Bank of East Asia Limited (1,192) (0.00) (26,100) Aiful Corporation (6,037) (0.00)
4,000 Beijing Enterprises Holdings Limited (2,120) (0.00) (100) AIN Holdings Inc (105) (0.00)
31,000 Belle International Holdings (944) (0.00) (500) Ajinomoto Company Inc (605) (0.00)
(24,000) Brilliance China Automotive (8,026) (0.01) 9,300 Alfresa Holdings Corporation (11,428) (0.01)
28,000 Cathay Pacific Airways Limited (2,449) (0.00) (4,800) Alps Electric Company Limited (11,444) (0.01)
6,000 China Gas Holdings Limited (1,452) (0.00) (17,000) ANA Holdings Inc (4,908) (0.00)
3,500 China Mobile Limited (3,032) (0.00) (300) Aoyama Trading Company Limited (2,123) (0.00)
2,000 China Overseas Land and Investment (375) (0.00) 3,000 Aozora Bank Limited (37) (0.00)
48,000 China Resources Enterprise Limited (7,883) (0.01) (1,200) Ariake Japan Company Limited (6,808) (0.01)
2,000 China Resources Gas Group Limited (605) (0.00) (3,200) Asahi Intecc Company Limited (7,179) (0.01)
4,000 China Resources Land Limited (1,257) (0.00) (800) Asics Corporation (1,926) (0.00)
34,000 China Resources Power Holdings (4,023) (0.00) 100 Askul Corporation (181) (0.00)
(26,000) China State Construction International Holdings Limited (3,318) (0.00) (1,000) Aviation Electronics Industry Limited (802) (0.00)
(16,800) China Taiping Insurance (UK) Company Limited (744) (0.00) (8,800) BIC Camera Inc (12,867) (0.01)
(74,000) China Unicom Hong Kong Limited (1,300) (0.00) (400) Calbee Inc (354) (0.00)
3,000 CK Hutchison Holdings Limited (3,121) (0.00) (1,000) Canon Inc (1,831) (0.00)
2,500 CLP Holdings Limited (2,067) (0.00) (8,400) Capcom Company Limited (29,154) (0.02)
2,000 Galaxy Entertainment Group Limited (581) (0.00) (100) Century Tokyo Leasing Corporation (305) (0.00)
34,000 Guangdong Investment Limited (5,935) (0.00) 17,000 Chiba Bank Limited (1,368) (0.00)
(2,000) Henderson Land Development (134) (0.00) 1,000 Chiyoda Corporation (920) (0.00)
400 Hong Kong Exchanges and Clearing Limited (385) (0.00) (700) Chugai Pharmaceutical Company Limited (73) (0.00)
16,000 Kunlun Energy Company Limited (592) (0.00) (4,100) Chugoku Electric Power Company Inc (4,777) (0.00)
3,500 MTR Corporation Limited (274) (0.00) (7,700) COLOPL Inc (1,624) (0.00)
1,000 Shimao Property Holdings Limited (27) (0.00) (13,900) Cookpad Inc (652) (0.00)
20,000 Sino Land Company Limited (2,618) (0.00) (6,700) Cosmo Energy Holdings Company Limited (21,990) (0.02)
(51,000) SJM Holdings Limited (2,964) (0.00) (500) Cosmos Pharmaceutical Corporation (2,459) (0.00)
(1,000) Sun Hung Kai Properties Limited (108) (0.00) (1,700) Credit Saison Company Limited (5,115) (0.00)
45,500 WH Group Limited (993) (0.00) (800) Cyberdyne Inc (753) (0.00)
2,000 Wharf Holdings Limited (1,352) (0.00) 1,000 Dai Nippon Printing Company Limited (7) (0.00)
70,000 Xinyi Glass Holdings Limited (3,072) (0.00) (2,300) Daifuku Company Limited (7,901) (0.01)
(64,090) (0.05) (400) Dai-ichi Life Insurance Company Limited (61) (0.00)
7,000 Daiichi Sankyo Company Limited (1,868) (0.00)
IrelandIrelandIrelandIreland 100 Daiichikosho Company Limited (5) (0.00)
(497) Adient Plc (2,685) (0.00) (500) Daiwa House Industry Company Limited (469) (0.00)
(698) Alkermes Plc (5,168) (0.00) 2,000 Daiwa Securities Group Inc (735) (0.00)
(20) Allegion Plc (13) (0.00) (1,900) Dentsu Inc (5,624) (0.00)
768 DCC Plc (2,046) (0.00) (1,000) DIP Corporation (450) (0.00)
(7,584) Experian Plc (7,051) (0.01) (14,500) DMG Mori Company Limited (29,533) (0.02)
(65,461) Greencore Group Plc (3,284) (0.00) (3,700) Don Quijote Holdings Company Limited (14,523) (0.01)
39,426 Henderson Group Plc (3,940) (0.00) (400) East Japan Railway Company (3,934) (0.00)
204 Icon Plc (237) (0.00) (1,300) Ebara Corporation (2,097) (0.00)
42 Jazz Pharmaceuticals Plc (117) (0.00) (500) Eisai Company Limited (1,136) (0.00)
928 Medtronic Plc (7,773) (0.01) (2,700) Electric Power Development Company Limited (6,179) (0.00)
(574) Shire Plc (783) (0.00) (900) Ezaki Glico Company Limited (1,248) (0.00)
(33,097) (0.03) (1,100) FamilyMart UNY Holdings Company Limited (10,312) (0.01)
(400) Fast Retailing Company Limited (18,300) (0.01)
Isle of ManIsle of ManIsle of ManIsle of Man (2,900) Fuji Media Holdings Inc (5,664) (0.00)
(6,806) Paysafe Group Plc (666) (0.00) (4,200) Fuji Oil Company Limited (7,412) (0.01)
2,184 Playtech Plc (753) (0.00) 400 Fujifilm Holdings Corporation (116) (0.00)
(1,419) (0.00) (12,400) Fujikura Limited (538) (0.00)
(3,000) Fujitsu Limited (1,266) (0.00)
IsraelIsraelIsraelIsrael 5,000 Fukuoka Financial Group Inc (153) (0.00)
308 Caesarstone Sdot-Yam Limited (30) (0.00) (5,700) GMO Internet Inc (2,235) (0.00)
(739) Cyberark Software Limited (514) (0.00) (4,900) GMO Payment Gateway Inc (21,051) (0.02)
604 Mellanox Technologies Limited (987) (0.00) 15,600 GungHo Online Entertainment Inc (1,301) (0.00)
(1,792) Mobileye NV (3,134) (0.00) 4,900 Gurunavi Inc (8,772) (0.01)
378 Taro Pharmaceutical Industries Limited (1,344) (0.00) (6,400) H I S Company Limited (9,112) (0.01)
(912) Wix.Com Limited (1,765) (0.00) (7,200) H2O Retailing Corporation (15,853) (0.01)
(7,774) (0.01) (3,500) Hachijuni Bank Limited (4,990) (0.00)
200 Hamamatsu Photonics KK (73) (0.00)
ItalyItalyItalyItaly 100 Hankyu Hanshin Holdings Inc (24) (0.00)
(1,354) Anima Holding SpA (203) (0.00) 100 Haseko Corporation (38) (0.00)
108 Atlantia SpA (26) (0.00) (4,100) Hazama Ando Corporation (652) (0.00)
(7,054) Azimut Holding SpA (13,313) (0.01) (300) Hikari Tsushin Inc (2,831) (0.00)
(2,234) Banca Generali SpA (6,608) (0.01) (2,000) Hiroshima Bank Limited (2,074) (0.00)
(24,208) Banca Popolare dell'Emilia Romagna SC (39,773) (0.03) (1,900) Hitachi Capital Corporation (12,977) (0.01)
(23) Brembo SpA (162) (0.00) (16,000) Hitachi Limited (13,313) (0.01)
(4,422) Buzzi Unicem SpA (16,060) (0.01) (12,400) Hitachi Zosen Corporation (4,994) (0.00)
(9,013) Davide Campari-Milano SpA (2,809) (0.00) (9,500) Hokkaido Electric Power Company Inc (7,185) (0.01)
(917) Enel SpA (365) (0.00) (10,800) Hokuriku Electric Power Company (10,338) (0.01)
(3,678) Eni SpA (8,878) (0.01) (2,000) Horiba Limited (7,436) (0.01)
(142) Ferrari NV (1,316) (0.00) (7,200) Hulic Company Limited (1,794) (0.00)
(39,265) Intesa Sanpaolo SpA (17,152) (0.01) 42,000 IHI Corporation (79) (0.00)
(955) Luxottica Group SpA (6,701) (0.01) 100 Iida Group Holdings Company Limited (13) (0.00)
(11,837) Moncler SpA (13,608) (0.01) (11,900) Inpex Corporation (19,964) (0.02)
1,908 Recordati SpA (1,718) (0.00) (11,400) Isetan Mitsukoshi Holdings Limited (15,658) (0.01)
(5,078) Salvatore Ferragamo SpA (6,369) (0.01) 100 IT Holdings Corporation (107) (0.00)
(36,205) Telecom Italia SpA (4,415) (0.00) 700 ITOCHU Corporation (27) (0.00)
(16,088) Terna SpA (6,538) (0.01) (600) Izumi Company Limited (2,704) (0.00)
(25,418) UniCredit SpA (18,439) (0.01) (8,000) J Front Retailing Company Limited (14,042) (0.01)
(8,044) Yoox Net-A-Porter Group SpA (4,274) (0.00) 200 JAFCO Company Limited (542) (0.00)
(168,727) (0.13) (300) Japan Airlines Company Limited (972) (0.00)
237

Man Funds VI PlcSchedule of Investments as at 31 December 2016 (continued)Man AHL Multi Strategy Alternative (continued)
Financial liabilities at fair value through profit or loss (continued)Financial liabilities at fair value through profit or loss (continued)Financial liabilities at fair value through profit or loss (continued)Financial liabilities at fair value through profit or loss (continued)
Fair Fair Fair Fair % of% of% of% of Fair Fair Fair Fair % of% of% of% of
Value Value Value Value NetNetNetNet Value Value Value Value NetNetNetNet
Nominal Nominal Nominal Nominal DescriptionDescriptionDescriptionDescription US$ US$ US$ US$ AssetsAssetsAssetsAssets Nominal Nominal Nominal Nominal DescriptionDescriptionDescriptionDescription US$ US$ US$ US$ AssetsAssetsAssetsAssets
Contracts for difference (continued)Contracts for difference (continued)Contracts for difference (continued)Contracts for difference (continued) Contracts for difference (continued)Contracts for difference (continued)Contracts for difference (continued)Contracts for difference (continued)
Japan (continued)Japan (continued)Japan (continued)Japan (continued) Japan (continued)Japan (continued)Japan (continued)Japan (continued)
12,500 Japan Display Inc (2,105) (0.00) 3,000 OJI Holdings Corporation (174) (0.00)
300 Japan Exchange Group Inc (162) (0.00) (1,300) Oki Electric Industry Company Limited (2,899) (0.00)
(4,900) Japan Petroleum Exploration Company Limited (12,378) (0.01) (5,100) Olympus Corporation (13,891) (0.01)
(400) Japan Tobacco Inc (133) (0.00) (1,100) Open House Company Limited (4,764) (0.00)
(8,800) JFE Holdings Inc (16,048) (0.01) (200) Oracle Corporation Japan (154) (0.00)
(2,800) JGC Corporation (1,462) (0.00) (29,800) Orient Corporation (3,577) (0.00)
(2,200) Kagome Company Limited (5,684) (0.00) (300) Oriental Land Company Limited (1,508) (0.00)
(2,700) Kakaku.com Inc (2,503) (0.00) (300) Otsuka Corporation (58) (0.00)
1,000 Kamigumi Company Limited (80) (0.00) (300) Otsuka Holdings Company Limited (1,501) (0.00)
(2,000) Kaneka Corporation (79) (0.00) (8,800) Panasonic Corporation (12,876) (0.01)
(100) Kansai Electric Power Company Inc (364) (0.00) 20,000 Penta-Ocean Construction Company (2,056) (0.00)
(1,100) Kansai Paint Company Limited (788) (0.00) (900) Peptidream Inc (13,694) (0.01)
(300) Kao Corporation (396) (0.00) (4,400) Pigeon Corporation (6,073) (0.00)
(21,000) Kawasaki Heavy Industries Limited (9,767) (0.01) (600) Pola Orbis Holdings Inc (3,237) (0.00)
(200) KDDI Corporation (59) (0.00) 100 Recruit Holdings Company Limited (18) (0.00)
(8,000) Keio Corporation (6,184) (0.00) (700) Relo Group Inc (5,822) (0.00)
(1,500) Keisei Electric Railway Company (4,545) (0.00) 12,200 Rengo Company Limited (1,451) (0.00)
10,700 Kenedix Inc (1,772) (0.00) (3,200) Resorttrust Inc (3,735) (0.00)
(400) Kewpie Corporation (586) (0.00) (11,700) Ricoh Company Limited (9,209) (0.01)
(100) Keyence Corporation (1,233) (0.00) (400) Rohm Company Limited (1,009) (0.00)
(1,000) Kikkoman Corporation (2,152) (0.00) (5,800) Rohto Pharmaceutical Company Limited (5,806) (0.00)
(9,000) Kintetsu Group Holdings Company Limited (2,061) (0.00) (400) Ryohin Keikaku Company Limited (5,502) (0.00)
(600) Kirin Holdings Company Limited (412) (0.00) 1,900 Saizeriya Company Limited (329) (0.00)
(13,700) Kobe Steel Limited (19,166) (0.02) 1,000 Sankyu Inc (139) (0.00)
(300) Konami Holdings Corporation (18) (0.00) 200 Sanrio Company Limited (59) (0.00)
(2,300) Konica Minolta Inc (3,057) (0.00) (1,900) Santen Pharmaceutical Company Limited (401) (0.00)
(1,300) Kose Corporation (6,164) (0.00) (400) Sawai Pharmaceutical Company Limited (57) (0.00)
(4,600) K's Holdings Corporation (9,465) (0.01) (300) SCSK Corporation (223) (0.00)
(3,300) Kubota Corporation (2,527) (0.00) (6,100) Seibu Holdings Inc (10,197) (0.01)
(1,600) Kusuri No Aoki Holdings Company (1,743) (0.00) (4,900) Sekisui House Limited (10,906) (0.01)
(3,200) Kyoritsu Maintenance Company Limited (12,929) (0.01) (1,000) Seven and I Holdings Company Limited (251) (0.00)
(3,000) Kyushu Electric Power Company Inc (7,877) (0.01) (7,500) Seven Bank Limited (491) (0.00)
100 Kyushu Financial Group Inc (34) (0.00) (93,000) Sharp Corporation (57,833) (0.05)
(6,300) Kyushu Railway Company (2,907) (0.00) (10,900) Shikoku Electric Power Company Inc (17,950) (0.01)
(2,000) Lion Corporation (355) (0.00) (1,000) Shimadzu Corporation (825) (0.00)
(100) Mabuchi Motor Company Limited (884) (0.00) 100 Shimamura Company Limited (192) (0.00)
16,000 Maeda Corporation (4,814) (0.00) (400) Shimano Inc (7,365) (0.01)
(100) Maruha Nichiro Corporation (27) (0.00) 2,000 Shimizu Corporation (402) (0.00)
(11,800) Marui Group Company Limited (30,978) (0.02) (400) Shionogi and Company Limited (691) (0.00)
(3,800) McDonald's Holdings Company Japan (1,994) (0.00) (1,200) Ship Healthcare Holdings Inc (448) (0.00)
800 Megmilk Snow Brand Company Limited (1,981) (0.00) (5,100) Shiseido Company Limited (9,238) (0.01)
(300) MEIJI Holdings Company Limited (584) (0.00) (1,000) Shizuoka Bank Limited (478) (0.00)
(2,700) Minebea Company Limited (2,207) (0.00) (1,700) Showa Denko K K (5,593) (0.00)
(4,000) Mitsubishi Estate Company Limited (11,839) (0.01) 3,000 Skylark Company Limited (1,210) (0.00)
(24,000) Mitsubishi Heavy Industries Limited (16,524) (0.01) 100 SMC Corporation (2,446) (0.00)
(5,000) Mitsubishi Logistics Corporation (3,889) (0.00) (2,300) Softbank Group Corporation (26,844) (0.02)
(11,900) Mitsubishi Motors Corporation (6,932) (0.01) 100 Sompo Japan Nipponkoa Holdings Inc (10) (0.00)
(1,000) Mitsubishi UFJ Financial Group (1,697) (0.00) 1,200 Sony Corporation (210) (0.00)
(1,600) Mitsubishi UFJ Lease & Finance Company Limited (1,264) (0.00) (100) Sosei Group Corporation (649) (0.00)
(900) Mitsui and Company Limited (2,075) (0.00) (2,000) Sotetsu Holdings Inc (1,245) (0.00)
(89,000) Mitsui Engineering and Shipbuilding Company Limited (22,081) (0.02) (300) Square Enix Holdings Company Limited (7) (0.00)
(3,000) Mitsui Fudosan Company Limited (13,138) (0.01) (1,400) Sugi Holdings Company Limited (3,424) (0.00)
(41,000) Mitsui Mining and Smelting Company Limited (16,874) (0.01) (4,600) Sumco Corporation (23,353) (0.02)
(29,000) Mitsui Osk Lines Limited (25,846) (0.02) (6,000) Sumitomo Chemical Company Limited (3,267) (0.00)
700 Miura Company Limited (190) (0.00) (8,000) Sumitomo Metal Mining Company Limited (1,669) (0.00)
(7,500) Mizuho Financial Group Inc (2,878) (0.00) (2,000) Sumitomo Realty & Development Company Limited (9,312) (0.01)
(1,000) Morinaga Milk Industry Company Limited (824) (0.00) (1,300) Suntory Beverage & Food Limited (2,419) (0.00)
400 Ms&Ad Insurance Group Holdin (139) (0.00) (300) Sysmex Corporation (68) (0.00)
(300) Murata Manufacturing Company Limited (2,351) (0.00) (4,700) Tadano Limited (4,297) (0.00)
3,000 Nabtesco Corporation (3,706) (0.00) (8,000) Taiheiyo Cement Corporation (5,740) (0.00)
(24,000) Nachi-Fujikoshi Corporation (30,757) (0.02) 300 Taisho Pharmaceutical Holdings Company Limited (935) (0.00)
(11,000) Nankai Electric Railway Company (8,519) (0.01) (6,300) Taiyo Nippon Sanso Corporation (15,147) (0.01)
(11,000) Next Company Limited (2,080) (0.00) (10,600) Taiyo Yuden Company Limited (29,834) (0.02)
(2,600) NGK Spark Plug Company Limited (18,768) (0.01) (5,500) Takara Bio Inc (5,450) (0.00)
300 Nichi-Iko Pharmaceutical Company (56) (0.00) (1,100) Takara Holdings Inc (328) (0.00)
(300) Nihon Kohden Corporation (280) (0.00) (9,000) Takashimaya Company Limited (8,957) (0.01)
(100) Nihon M&A Center Inc (7) (0.00) (3,500) Takeda Pharmaceutical Company Limited (2,871) (0.00)
(100) Nintendo Company Limited (150) (0.00) (2,000) TDK Corporation (15,475) (0.01)
1,000 Nippo Corporation (143) (0.00) 100 TechnoPro Holdings Inc (18) (0.00)
100 Nippon Paint Holdings Company Limited (34) (0.00) (2,200) THK Company Limited (2,314) (0.00)
(1,500) Nippon Shinyaku Company Limited (5,209) (0.00) (3,000) Tobu Railway Company Limited (1,957) (0.00)
(8,000) Nippon Suisan Kaisha Limited (4,940) (0.00) 3,000 Toda Corporation (249) (0.00)
200 Nippon Television Network Corporation (10) (0.00) 200 Toho Company Limited (34) (0.00)
(73,000) Nippon Yusen KK (11,666) (0.01) (1,900) Tohoku Electric Power Company Inc (3,407) (0.00)
(9,700) Nipro Corporation (747) (0.00) (700) Tokai Rika Company Limited (2,106) (0.00)
(12,000) Nishi-Nippon Railroad Company Limited (5,269) (0.00) 6,000 Tokuyama Corporation (50) (0.00)
(5,800) Nissan Motor Company Limited (9,059) (0.01) (25,300) Tokyo Electric Power Company Inc (8,309) (0.01)
(1,100) Nisshin Seifun Group Inc (1,216) (0.00) (900) Tokyo Ohka Kogyo Company Limited (501) (0.00)
200 Nisshin Steel Company Limited (20) (0.00) (2,600) Tokyo Tatemono Company Limited (8,120) (0.01)
(11,000) Nisshinbo Holdings Inc (1,859) (0.00) (5,000) Tokyu Corporation (3,934) (0.00)
15,900 Nissin Electric Company Limited (16,110) (0.01) (4,800) Tokyu Fudosan Holdings Corporation (6,276) (0.00)
(400) Nissin Foods Holdings Company Limited (1,490) (0.00) (2,100) Topcon Corporation (3,697) (0.00)
(300) Nitori Holdings Company Limited (2,345) (0.00) 1,000 Toppan Printing Company Limited (176) (0.00)
200 Nitto Denko Corporation (178) (0.00) (400) TOTO Limited (354) (0.00)
(4,100) Nomura Real Estate Holdings (9,831) (0.01) (300) Toyo Seikan Group Holdings Limited (989) (0.00)
(9,000) NTN Corporation (6,576) (0.01) (100) Toyo Suisan Kaisha Limited (198) (0.00)
(200) NTT Urban Development Corporation (207) (0.00) (6,800) Toyo Tire & Rubber Company Limited (8,397) (0.01)
(1,200) OBIC Company Limited (650) (0.00) (11,000) Toyobo Company Limited (294) (0.00)
(3,200) Odakyu Electric Railway Company (2,277) (0.00) (200) Toyota Industries Corporation (1,010) (0.00)
238

Man Funds VI PlcSchedule of Investments as at 31 December 2016 (continued)Man AHL Multi Strategy Alternative (continued)
Financial liabilities at fair value through profit or loss (continued)Financial liabilities at fair value through profit or loss (continued)Financial liabilities at fair value through profit or loss (continued)Financial liabilities at fair value through profit or loss (continued)
Fair Fair Fair Fair % of% of% of% of Fair Fair Fair Fair % of% of% of% of
Value Value Value Value NetNetNetNet Value Value Value Value NetNetNetNet
Nominal Nominal Nominal Nominal DescriptionDescriptionDescriptionDescription US$ US$ US$ US$ AssetsAssetsAssetsAssets Nominal Nominal Nominal Nominal DescriptionDescriptionDescriptionDescription US$ US$ US$ US$ AssetsAssetsAssetsAssets
Contracts for difference (continued)Contracts for difference (continued)Contracts for difference (continued)Contracts for difference (continued) Contracts for difference (continued)Contracts for difference (continued)Contracts for difference (continued)Contracts for difference (continued)
Japan (continued)Japan (continued)Japan (continued)Japan (continued) Norway (continued)Norway (continued)Norway (continued)Norway (continued)
(28,000) UACJ Corporation (3,786) (0.00) (3,548) Yara International ASA (9,728) (0.01)
(800) Unicharm Corporation (1,072) (0.00) (46,611) (0.04)
(5,300) United Arrows Limited (21,422) (0.02)
200 Uss Company Limited (8) (0.00) PortugalPortugalPortugalPortugal
(900) West Japan Railway Company (7,264) (0.01) 23,665 EDP Energias De Portugal SA (852) (0.00)
(17,500) Yahoo Japan Corporation (2,506) (0.00) (4,181) Galp Energia SGPS SA (7,756) (0.01)
(21,600) Yamada Denki Company Limited (19,278) (0.02) 448 Jeronimo Martins SGPS SA (1,566) (0.00)
(100) Yamaha Motor Company Limited (985) (0.00) (10,174) (0.01)
400 Yamato Holdings Company Limited (114) (0.00)
(100) Yamazaki Baking Company Limited (272) (0.00) RussiaRussiaRussiaRussia
(1,600) Yaskawa Electric Corporation (2,621) (0.00) (516) Polymetal International Plc (12) 0.00
(2,200) Yukult Honsha Company Limited (10,542) (0.01)
1,200 Zenkoku Hosho Company Limited (2,434) (0.00) SingaporeSingaporeSingaporeSingapore
(300) Zensho Holdings Company Limited (201) (0.00) (64) Broadcom Limited (617) (0.00)
(1,438,227) (1.12) (1,500) Capitaland Limited (28) (0.00)
(1,800) City Developments Limited (111) (0.00)
JerseyJerseyJerseyJersey 15,900 Genting Singapore Plc (654) (0.00)
(5,736) Centamin Plc (3,334) (0.00) (17,900) Global Logistic Properties Limited (2,926) (0.00)
(1,175) Randgold Resources Limited (140) (0.00) (5,300) Keppel Corporation Limited (1,408) (0.00)
(3,474) (0.00) (54,000) SembCorporation Industries Limited (7,512) (0.01)
4,200 Singapore Airlines Limited (3,234) (0.00)
LuxembourgLuxembourgLuxembourgLuxembourg (600) Singapore Exchange Limited (35) (0.00)
47,044 ArcelorMittal (32,756) (0.03) 3,900 Singapore Press Holdings Limited (452) (0.00)
(2,584) Millicom International Cellular SA (1,359) (0.00) 8,500 Singapore Tech Engineering (216) (0.00)
(9,063) SES (1,327) (0.00) (17,193) (0.01)
(3,369) Tenaris SA (8,501) (0.01)
(43,943) (0.03) South AfricaSouth AfricaSouth AfricaSouth Africa
4,061 Mediclinic International Plc (771) (0.00)
MacauMacauMacauMacau
(16,800) MGM China Holdings Limited (7,441) (0.01) South KoreaSouth KoreaSouth KoreaSouth Korea
6,000 Sands China Limited (649) (0.00) (328) Cheil Worldwide Inc (18) (0.00)
(62,800) Wynn Macau Limited (386) (0.00) (76) CJ Corporation (747) (0.00)
(8,476) (0.01) 848 Dongbu Insurance Company Limited (4,773) (0.00)
5 Doosan Corporation (27) (0.00)
MexicoMexicoMexicoMexico (188) E-Mart Company Limited (3,389) (0.00)
(2,575) Fresnillo Plc (2,253) (0.00) 4,198 Grand Korea Leisure Company Limited (7,217) (0.01)
(403) GS Holdings Corporation (1,280) (0.00)
NetherlandsNetherlandsNetherlandsNetherlands (1,390) GS Retail Company Limited (934) (0.00)
(910) ABN AMRO Group NV (788) (0.00) (24) Hanon Systems (1,065) (0.00)
(21,120) Aegon NV (6,964) (0.01) (417) Hanssem Company Limited (11,270) (0.01)
57 AerCap Holdings NV (86) (0.00) (643) Hanwha Chemical Corporation (272) (0.00)
(3,837) Akzo Nobel NV (7,353) (0.01) 2,439 Hanwha Corporation (2,811) (0.00)
(17,356) Altice NV (47,749) (0.04) 1,929 Hyundai Development Company (1,679) (0.00)
(1,231) ASML Holding NV (5,946) (0.00) 145 Hyundai Elevator Company Limited (253) (0.00)
(3,897) Boskalis Westminster (13,366) (0.01) 30 Hyundai Engineering & Construction Company Limited (14) (0.00)
(245) Cimpress NV (1,518) (0.00) 356 Hyundai Glovis Company Limited (1,197) (0.00)
13,586 Delta Lloyd Nv (1,640) (0.00) (939) Hyundai Mipo Dockyard Company Limited (1,641) (0.00)
(28) Exor NV (115) (0.00) (256) Hyundai Motor Company (2,365) (0.00)
90 Franks International NV (43) (0.00) (71) Hyundai Wia Corporation (193) (0.00)
5,676 Fugro NV (3,126) (0.00) 107 Industrial Bank of Korea (32) (0.00)
(973) Gemalto NV (5,824) (0.00) 2,454 Kangwon Land Inc (4,278) (0.00)
(37) Heineken Holding NV (51) (0.00) 71 KEPCO Plant Service & Engineering Company Limited (46) (0.00)
(351) Heineken NV (216) (0.00) 1,974 Korea Electric Power Corporation (14,113) (0.01)
(142) Interxion Holding NV (160) (0.00) 42 Korea Zinc Company Limited (95) (0.00)
(209) Koninklijke Ahold Delhaize NV (5) (0.00) 2,482 Korean Air Lines Company Limited (5,751) (0.00)
(18,312) Koninklijke BAM Groep NV (9,599) (0.01) 344 KT&G Corporation (3,962) (0.00)
(4,849) Koninklijke DSM NV (6,250) (0.00) (298) Kumho Petrochemical Company Limited (2,683) (0.00)
(7,967) Koninklijke KPN NV (19,031) (0.01) 440 LG Corporation (1,276) (0.00)
(13,481) Koninklijke Philips NV (23,096) (0.02) (531) LG Display Company Limited (1,687) (0.00)
(381) Koninklijke Vopak NV (10,560) (0.01) (100) LG Household & Health Care Limited (1,992) (0.00)
25 Nxp Semiconductors NV (4) (0.00) (409) LG Innotek Company Limited (3,215) (0.00)
(7,888) OCI NV (25,806) (0.02) 2,602 LG Uplus Corporation (459) (0.00)
(1,550) Patheon NV (2,597) (0.00) (504) Lotte Shopping Company Limited (2,880) (0.00)
9,718 PostNL NV (2,994) (0.00) 1,056 Meritz Securities Company Limited (39) (0.00)
(28) Qiagen NV (37) (0.00) 444 NH Investment & Securities Company Limited (93) (0.00)
(162) Randstad Holding NV (582) (0.00) 45 Posco Daewoo Corporation (23) (0.00)
(5,098) Royal Dutch Shell Plc (17,184) (0.01) 118 Samsung C&T Corporation (2,835) (0.00)
(17,032) SBM Offshore NV (33,837) (0.03) (1,984) Samsung Electro-Mechanics Company Limited (5,432) (0.00)
(619) Sensata Technologies Holding NV (1,258) (0.00) 238 Samsung Fire and Marine Insurance Company Limited (2,663) (0.00)
(42,397) Steinhoff International Holdings NV (3,061) (0.00) (920) Samsung SDI Company Limited (12,318) (0.01)
(18,633) Tomtom NV (10,940) (0.01) 132 Samsung Securities Company Limited (77) (0.00)
(1,440) Wolters Kluwer NV (9,230) (0.01) 6 SK C&C Company Limited (40) (0.00)
(3,224) Wright Medical Group NV (1,915) (0.00) 467 SK Innovation Company Limited (1,868) (0.00)
(1,263) Yandex NV (520) (0.00) (24) SK Materials Company Limited (55) (0.00)
(273,451) (0.21) (538) Yuhan Corporation (1,638) (0.00)
(110,695) (0.09)
New ZealandNew ZealandNew ZealandNew Zealand
6,090 Contact Energy Limited (577) (0.00) SpainSpainSpainSpain
2,113 Fisher & Paykel Healthcare NPV (1,257) (0.00) (8,028) Abertis Infraestructuras SA (5,922) (0.00)
(1,834) (0.00) (1,473) Acciona SA (6,958) (0.01)
(4,566) Acerinox SA (3,780) (0.00)
NorwayNorwayNorwayNorway (361) ACS Actividades Construction y Servicios (2) (0.00)
(2,574) DNB ASA (237) (0.00) (1,034) Aena SA (1,983) (0.00)
2,144 Gjensidige Forsikring ASA (2,019) (0.00) (2,452) Amadeus IT Holding SA (3,350) (0.00)
(2,568) Leroy Seafood Group ASA (16,109) (0.01) (984) Atlantica Yield Plc (358) (0.00)
(2,426) Orkla ASA (632) (0.00) (7,661) Atresmedia Corporation de Medios de Comunicacion SA (8,583) (0.01)
(3,148) Statoil ASA (8,301) (0.01) (7,419) Banco Bilbao Vizcaya Argentaria SA (6,066) (0.00)
(5,525) Storebrand ASA (5,964) (0.00) (37,995) Banco de Sabadell SA (3,637) (0.00)
10,849 Telenor ASA (3,621) (0.00) 68,297 Banco Popular Espanol SA (6,622) (0.01)
239

Man Funds VI PlcSchedule of Investments as at 31 December 2016 (continued)Man AHL Multi Strategy Alternative (continued)
Financial liabilities at fair value through profit or loss (continued)Financial liabilities at fair value through profit or loss (continued)Financial liabilities at fair value through profit or loss (continued)Financial liabilities at fair value through profit or loss (continued)
Fair Fair Fair Fair % of% of% of% of Fair Fair Fair Fair % of% of% of% of
Value Value Value Value NetNetNetNet Value Value Value Value NetNetNetNet
Nominal Nominal Nominal Nominal DescriptionDescriptionDescriptionDescription US$ US$ US$ US$ AssetsAssetsAssetsAssets Nominal Nominal Nominal Nominal DescriptionDescriptionDescriptionDescription US$ US$ US$ US$ AssetsAssetsAssetsAssets
Contracts for difference (continued)Contracts for difference (continued)Contracts for difference (continued)Contracts for difference (continued) Contracts for difference (continued)Contracts for difference (continued)Contracts for difference (continued)Contracts for difference (continued)
Spain (continued)Spain (continued)Spain (continued)Spain (continued) Switzerland (continued)Switzerland (continued)Switzerland (continued)Switzerland (continued)
(19,235) Banco Santander SA (17,671) (0.01) (1,661) Swatch Group AG (20,783) (0.02)
(912) Caixabank (443) (0.00) 763 Swiss Prime Site (547) (0.00)
(5,200) Distribuidora Internacional De Alimentacion SA (2,014) (0.00) (1,360) Swiss Re AG (3,107) (0.00)
(5,169) Enagas (2,139) (0.00) (149) Swisscom AG (1,758) (0.00)
(13,957) Endesa SA (521) (0.00) (1,299) Temenos Group AG (2,691) (0.00)
1,399 Gamesa Corporation Tecnologica SA (5,984) (0.00) 6,283 UBS Group AG (4,517) (0.00)
240 Gas Natural SDG SA (101) (0.00) (9,929) Weatherford International Plc (2,700) (0.00)
(84) Grifols SA (74) (0.00) (170,202) (0.13)
(16,025) Iberdrola SA (11,124) (0.01)
15 Indra Sistemas SA (20) (0.00) TaiwanTaiwanTaiwanTaiwan
(7,112) Industria de Diseno Textil SA (1,961) (0.00) 44,000 Advanced Semiconductor Engineering (3,161) (0.00)
(14,304) Inmobiliaria Colonial SA (2,305) (0.00) 2,000 Advantech Company Limited (29) (0.00)
(8,588) Mapfre SA (210) (0.00) 8,000 Asustek Computer Inc (1,396) (0.00)
(9,281) Melia Hotels International SA (80) (0.00) (139,000) Au Optronics Corporation (666) (0.00)
4,375 Red Electrica Corporation SA (5,417) (0.00) 4,000 Catcher Technology Company Limited (1,726) (0.00)
(57,467) Sacyr Vallehermoso SA (12,271) (0.01) 35,000 Cheng Shin Rubber Industry Company Limited (5,125) (0.00)
12,813 Telefonica SA (1,577) (0.00) 149,000 China Development Financial (19) (0.00)
(111,173) (0.09) (59,000) Compal Electronics Inc (787) (0.00)
2,000 Delta Electronics Inc (520) (0.00)
SwedenSwedenSwedenSweden 16,000 Far EasTone Telecommunications Company Limited (296) (0.00)
(4,365) Alfa Laval AB (5,552) (0.00) 1,000 Formosa Petrochemical Corporation (48) (0.00)
48 Assa Abloy AB (26) (0.00) 16,000 Foxconn Technology Company Limited (2,255) (0.00)
4,083 Axfood AB (2,757) (0.00) (9,000) Fubon Financial Holding Company Limited (1,555) (0.00)
13,619 Betsson AB (95) (0.00) (171,000) Innolux Display Corporation (3,272) (0.00)
15,324 Boliden AB (25,974) (0.02) 110,000 Inventec Corporation (5,271) (0.00)
(14) Castellum AB (4) (0.00) 13,000 MediaTek (5,181) (0.00)
(1,040) Electrolux AB (2,220) (0.00) 52,000 Mega Financial Holding Company Limited (495) (0.00)
(3,454) Elekta AB (828) (0.00) 32,000 Micro-Star International Company (2,929) (0.00)
40,267 Fingerprint Cards (16,326) (0.01) 25,000 Novatek Microelectronics Corporation (3,213) (0.00)
289 Hennes and Mauritz AB (2,329) (0.00) 1,000 Pegatron Corporation (160) (0.00)
1,408 Hexagon AB (2,982) (0.00) (1,000) Pou Chen Corporation (31) (0.00)
(244) ICA Gruppen AB (146) (0.00) (6,000) Powertech Technology Inc (439) (0.00)
2,416 Investment Ab Kinnevik (2,009) (0.00) 1,000 President Chain Store Corporation (438) (0.00)
(716) Investor AB (1,956) (0.00) 7,000 Quanta Computer Inc (726) (0.00)
(13,703) Lundin Petroleum AB (57,962) (0.05) 18,000 Realtek Semiconductor Corporation (1,476) (0.00)
(106) Modern Times Group MTG AB (609) (0.00) (46,000) Shin Kong Financial Holding Company Limited (1,411) (0.00)
(11,287) Nordea Bank AB (5,920) (0.00) 53,000 Taiwan Cement (1,927) (0.00)
(212) Securitas AB (229) (0.00) 5,000 Taiwan Mobile Company Limited (720) (0.00)
(11,046) Skandinaviska Enskilda Banken (4,818) (0.00) 21,000 Tong Yang Industry Company Limited (3,798) (0.00)
(16,786) SKF AB (637) (0.00) 10,000 Uni-President Enterprises Company (2,475) (0.00)
25,620 SSAB AB (5,902) (0.00) (74,000) Yuanta Financial Holding Company Limited (2,320) (0.00)
(6,098) Svenska Cellulosa AB SCA (4,717) (0.00) 1,000 Zhen Ding Technology Holding Limited (150) (0.00)
27 Svenska Handelsbanken AB (3) (0.00) (54,015) (0.04)
(3,154) Swedbank AB (2,257) (0.00)
1,078 Swedish Match AB (3,177) (0.00) United KingdomUnited KingdomUnited KingdomUnited Kingdom
(16,946) Swedish Orphan Biovitrum AB (13,331) (0.01) 32,775 Aberdeen Asset Management Plc (8,844) (0.01)
(31,257) Tele2 AB (6,747) (0.00) (3,041) Admiral Group Plc (4,558) (0.00)
5,648 Telefonaktiebolaget LM Ericsson (251) (0.00) (21,788) Aggreko Plc (2,918) (0.00)
(46,959) Teliasonera AB (9,245) (0.01) 1,978 Amec Plc (1,302) (0.00)
11,177 Volvo AB (1,542) (0.00) (6,308) Anglo American Plc (30,581) (0.02)
(180,551) (0.13) (32,309) Antofagasta Plc (40,214) (0.03)
29 Aon Plc (15) (0.00)
SwitzerlandSwitzerlandSwitzerlandSwitzerland (28,394) Ashtead Group Plc (20,739) (0.02)
(6,566) ABB Limited (2,375) (0.00) (2,538) ASOS Plc (13,361) (0.01)
(1,711) Aryzta AG (1,623) (0.00) (4,845) Associated British Foods Plc (5,577) (0.00)
(2,513) BB Biotech AG (2,017) (0.00) (3,181) AstraZeneca Plc (6,144) (0.00)
(26) Chocoladefabriken Lindt and Spruengli AG (2,135) (0.00) 625 Atlassian Corporation Plc (1,069) (0.00)
(3,450) Cie Financiere Richemont SA (3,733) (0.00) (6,437) Auto Trader Group Plc (1,527) (0.00)
(11,740) Clariant AG (11,261) (0.01) (8,368) B&M European Value Retail SA (3,336) (0.00)
533 Coca-Cola HBC AG (159) (0.00) 2,833 Babcock International Group Plc (2,030) (0.00)
(12,307) Credit Suisse Group AG (21,634) (0.02) 4,256 BAE Systems Plc (953) (0.00)
(1,173) Dufry AG (5,019) (0.00) 2,832 Barclays Plc (98) (0.00)
22 EMS-Chemie Holding AG (199) (0.00) 51,597 Barratt Developments Plc (2,498) (0.00)
(2) Flughafen Zuerich (23) (0.00) (9,642) BBA Aviation Plc (3,835) (0.00)
4 Galenica AG (100) (0.00) (909) Bellway Plc (759) (0.00)
891 Garmin Limited (2,162) (0.00) 143 Berkeley Group Holdings Plc (2) (0.00)
(738) Geberit AG (7,842) (0.01) (49,844) Boohoo.Com Plc (4,516) (0.00)
191 Georg Fischer Limited (85) (0.00) (6,133) BP Plc (4,147) (0.00)
18 Givaudan (8,357) (0.01) (1,443) British American Tobacco Plc (2,312) (0.00)
70,211 Glencore International Plc (5,657) (0.00) (1,869) BT Group Plc (109) (0.00)
(2,465) IWG Plc (507) (0.00) 1,595 Bunzl Plc (3,652) (0.00)
(292) Julius Baer Group Limited (1,382) (0.00) (12,773) Capita Group Plc (1,460) (0.00)
536 Kuehne + Nagel International AG (1,397) (0.00) (48,052) Capital & Counties Properties Plc (9,482) (0.01)
(5,533) LafargeHolcim Limited (7,665) (0.01) (11,091) Carillion Plc (1,089) (0.00)
(1,454) Logitech International SA (1,155) (0.00) (124,959) Centrica Plc (36,254) (0.03)
235 Lonza Group AG (713) (0.00) (10,202) CNH Industrial NV (18,275) (0.01)
(409) Luxoft Holding Inc (773) (0.00) (78,690) Cobham Plc (4,435) (0.00)
1,405 Nestle SA (2,041) (0.00) (12,058) Compass Group Plc (19,415) (0.02)
(3,490) Novartis AG (23,150) (0.02) 189 Croda International Plc (99) (0.00)
151 Partners Group Holding AG (3,097) (0.00) (1,328) Diageo Plc (2,351) (0.00)
(576) PSP Swiss Property AG (642) (0.00) (1,232) Dialog Semiconductor Plc (5,834) (0.00)
489 Roche Holding AG (656) (0.00) (31,447) Direct Line Insurance Group Plc (5,916) (0.00)
1,836 Schindler Holding (4,101) (0.00) (32,041) easyJet Plc (7,550) (0.01)
(168) SGS SA (7,750) (0.01) (27,321) G4S Plc (8,324) (0.01)
(6) SIKA FIN I (74) (0.00) (3,523) GKN Plc (1,547) (0.00)
(292) Sonova Holding AG (358) (0.00) 331 Halma Plc (274) (0.00)
(1,468) STMicroelectronics NV (1,983) (0.00) (205) Hargreaves Lansdown Plc (134) (0.00)
(87) Straumann Holding AG (2,267) (0.00) (11,374) Hikma Pharmaceuticals Plc (7,320) (0.01)
13 Sunrise Communications Group (7) (0.00) 24,748 Howden Joinery Group Plc (8,652) (0.01)
240

Man Funds VI PlcSchedule of Investments as at 31 December 2016 (continued)Man AHL Multi Strategy Alternative (continued)
Financial liabilities at fair value through profit or loss (continued)Financial liabilities at fair value through profit or loss (continued)Financial liabilities at fair value through profit or loss (continued)Financial liabilities at fair value through profit or loss (continued)
Fair Fair Fair Fair % of% of% of% of Fair Fair Fair Fair % of% of% of% of
Value Value Value Value NetNetNetNet Value Value Value Value NetNetNetNet
Nominal Nominal Nominal Nominal DescriptionDescriptionDescriptionDescription US$ US$ US$ US$ AssetsAssetsAssetsAssets Nominal Nominal Nominal Nominal DescriptionDescriptionDescriptionDescription US$ US$ US$ US$ AssetsAssetsAssetsAssets
Contracts for difference (continued)Contracts for difference (continued)Contracts for difference (continued)Contracts for difference (continued) Contracts for difference (continued)Contracts for difference (continued)Contracts for difference (continued)Contracts for difference (continued)
United Kingdom (continued)United Kingdom (continued)United Kingdom (continued)United Kingdom (continued) United States (continued)United States (continued)United States (continued)United States (continued)
17,684 HSBC Holdings Plc (3,214) (0.00) 1,154 Aflac Inc (1,595) (0.00)
28,544 IG Group Holdings Plc (43,726) (0.03) (175) AGCO Corporation (1,513) (0.00)
8,992 IMI Plc (1,725) (0.00) 414 Agilent Technologies Inc (533) (0.00)
(3,544) Imperial Tobacco Group Plc (6,923) (0.01) (1,824) Air Lease Corporation (9,675) (0.01)
47,335 Indivior Plc (12,020) (0.01) 34 Air Methods Corporation (9) (0.00)
(2,921) Informa Plc (2,287) (0.00) (1,882) Aircastle Limited (1,075) (0.00)
(16,985) Inmarsat Plc (4,668) (0.00) (2,404) AK Steel Holding Corporation (10,351) (0.01)
(2,622) Intercontinental Hotels (6,831) (0.01) (624) Alexander and Baldwin Inc (4,033) (0.00)
(16,098) International Consolidated Airlines Group SA (41,361) (0.03) (42) Align Technology Inc (375) (0.00)
463 International Game Technology (721) (0.00) (4,431) Allegheny Technologies Inc (3,939) (0.00)
(4,055) Intertek Group Plc (13,358) (0.01) 29 Allergan Plc (313) (0.00)
(9,974) Investec Plc (6,279) (0.00) (22) Alliance Data Systems Corporation (4) (0.00)
(1,068) ITV Plc (101) (0.00) (509) Alliant Energy Corporation (823) (0.00)
203 Johnson Matthey Plc (11,913) (0.01) 1,939 Allscripts Healthcare Solutions (1,610) (0.00)
(23,925) Just Eat Plc (6,807) (0.01) 2 Alphabet Inc (23) (0.00)
7,867 Kingfisher Plc (4,437) (0.00) (117) Altria Group Inc (475) (0.00)
(77) Liberty Global Plc (134) (0.00) 79 Ambarella Inc (357) (0.00)
(231) Liberty Global Plc Lilac-Class C Shares (265) (0.00) 830 Amdocs Limited (521) (0.00)
1,406 Meggitt Plc (20) (0.00) (326) Amedisys Inc (353) (0.00)
(28,923) Melrose Industries Plc (7,478) (0.01) (159) AMERCO (5,305) (0.00)
(6,753) Merlin Entertainments Plc (43) (0.00) (2) Ameren Corporation (126) (0.00)
865 Michael Kors Holdings Limited (3,729) (0.00) (15) American Airlines Group Inc (94) (0.00)
(442) Microfocus International Plc (4,344) (0.00) 1,386 American Eagle Outfitters (2,901) (0.00)
(1,897) Mondi Plc (1,955) (0.00) (101) American Electric Power Company Inc (328) (0.00)
(3,309) Next Plc (4,493) (0.00) (2,290) American Equity Invt Life Hl (13,694) (0.01)
185 Noble Corporation Plc (11) (0.00) (469) American States Water Company (2,777) (0.00)
(12,584) Ocado Group Plc (1,525) (0.00) (45) American Water Works Company Inc (34) (0.00)
(7,957) Old Mutual Plc (1,991) (0.00) 1,033 AmerisourceBergen Corporation (2,900) (0.00)
(19,534) Pearson Plc (5,965) (0.00) 301 Amgen Inc (2,956) (0.00)
(4,720) Pennon Group Plc (2,084) (0.00) (230) Amkor Technology Inc (453) (0.00)
93 Pentair Plc (181) (0.00) (319) AMN Healthcare Services Inc (1,856) (0.00)
(2,276) Persimmon Plc (1,969) (0.00) (453) Amtrust Financial Services (1,263) (0.00)
14,302 Petrofac Limited (174) (0.00) (356) Anadarko Petroleum Corporation (4,853) (0.00)
(613) Prudential Plc (1,606) (0.00) 48 AO Smith Corporation (25) (0.00)
493 Reckitt Benckiser Group Plc (2,550) (0.00) (4) Apache Corporation (15) (0.00)
(10,355) RELX Plc (11,810) (0.01) 3,641 Apollo Investment Corporation (576) (0.00)
(2,780) Rentokil Initial Plc (326) (0.00) 402 Aptargroup Inc (823) (0.00)
276 Rightmove Plc (90) (0.00) (36) Aqua America Inc (21) (0.00)
(12,141) Rio Tinto Plc (16,361) (0.01) 697 Archer-Daniels-Midland Company (565) (0.00)
(16,674) Rolls-Royce Holdings Plc (662) (0.00) (1,187) Arconic Inc (1,213) (0.00)
(25,989) Rotork Plc (8,745) (0.01) (4,660) Ariad Pharmaceuticals Inc (8,012) (0.01)
(69,510) Royal Bank of Scotland Group Plc (29,540) (0.02) (27) Arista Networks Inc (398) (0.00)
50,717 Royal Mail Plc (11,599) (0.01) (952) Armstrong World Industries Inc (783) (0.00)
(14,727) RPC Group Plc (14,612) (0.01) (214) Asbury Automotive Group Inc (1,630) (0.00)
(6,756) RSA Insurance Group Plc (4,368) (0.00) (7,148) Ascena Retail Group Inc (6,402) (0.01)
3,886 Sage Group Plc (3,488) (0.00) 297 Ashland Global Holdings Inc (1,048) (0.00)
(1,647) J Sainsbury Plc (122) (0.00) (120) Associated Banc-Corporation (686) (0.00)
(1,952) Schroders Plc (6,421) (0.01) (38) Athenahealth Inc (138) (0.00)
(660) Severn Trent Plc (1,141) (0.00) (251) Atmos Energy Corporation (275) (0.00)
(4,717) Smith & Nephew Plc (806) (0.00) (531) Autodesk Inc (5,329) (0.00)
12,106 Smiths Group Plc (4,207) (0.00) 375 Avangrid Inc (2,436) (0.00)
(23,877) Sports Direct International (1,340) (0.00) 925 Avery Dennison Corporation (3,224) (0.00)
(3,100) SSE Plc (1,760) (0.00) (146) Avis Budget Group Inc (642) (0.00)
(3,036) St James'S Place Plc (2,802) (0.00) (17,737) Avon Products Inc (1,698) (0.00)
(17,658) Standard Chartered Plc (3,558) (0.00) 28 Axalta Coating Systems Limited (19) (0.00)
(4,047) Standard Life Plc (1,088) (0.00) (1,586) B&G Foods Inc (1,114) (0.00)
(34) Steris Plc (63) (0.00) (547) BanCorporationsouth Inc (4,089) (0.00)
3,212 Subsea 7 SA (522) (0.00) (376) Bank of The Ozarks (5,481) (0.00)
(7,685) Tate and Lyle Plc (3,427) (0.00) (81) BankUnited Inc (644) (0.00)
(31,241) Thomas Cook Group Plc (7,427) (0.01) 1,117 Baxter International Inc (3,374) (0.00)
(4,411) Travis Perkins Plc (5,022) (0.00) (951) Beacon Roofing Supply Inc (1,123) (0.00)
(83,329) Tullow Oil Plc (39,721) (0.03) 325 Becton Dickinson and Company (1,088) (0.00)
(371) UBM Plc (134) (0.00) 712 Bed Bath & Beyond Inc (1,055) (0.00)
2,345 Unilever NV (6,897) (0.01) (106) Belden Inc (543) (0.00)
(11,105) Weir Group Plc (26,972) (0.02) 1,103 Bemis Company (2,462) (0.00)
(2,102) Whitbread Plc (9,114) (0.01) 69 Best Buy Company Inc (43) (0.00)
38,087 William Hill Plc (4,859) (0.00) (12) BGC Partners Inc (21) (0.00)
(8,820) WM Morrison Supermarkets Plc (679) (0.00) 57 Big Lots Inc (108) (0.00)
(2,090) Worldpay Group Plc (109) (0.00) 52 Biogen Inc (89) (0.00)
(14,818) WPP Plc (19,247) (0.02) (97) Biomarin Pharmaceutical Inc (55) (0.00)
(759,434) (0.59) (31) Bio-Rad Laboratories Inc (473) (0.00)
70 Bio-Techne Corporation (451) (0.00)
United StatesUnited StatesUnited StatesUnited States (729) Black Hills Corporation (2,079) (0.00)
540 Abbott Laboratories (1,112) (0.00) (624) Blackbaud Inc (245) (0.00)
581 AbbVie Inc (236) (0.00) 2,744 Bloomin Brands Inc (1,321) (0.00)
137 Abercrombie & Fitch Company (416) (0.00) (322) Blue Buffalo Pet Products In (491) (0.00)
(40) Abiomed Inc (305) (0.00) (878) Bluebird Bio Inc (6,994) (0.01)
40 ABM Industries Inc (91) (0.00) (639) BofI Holding Inc (6,511) (0.01)
(2,109) Acadia Pharmaceuticals Inc (7,381) (0.01) (58) BOK Financial Corporation (892) (0.00)
219 Activision Blizzard Inc (689) (0.00) (45) Borgwarner Inc (187) (0.00)
(879) Actuant Corporation-Class A Shares (2,736) (0.00) 2 Boston Beer Company Inc (21) (0.00)
(99) Acxiom Corporation (15) (0.00) 512 Boston Scientific Corporation (1,019) (0.00)
16 Adobe Systems Inc (52) (0.00) (351) Boyd Gaming Corporation (346) (0.00)
(199) Advance Auto Parts Inc (4,479) (0.00) (119) Bright Horizons Family Solutions Inc (254) (0.00)
411 Advanced Drainage Systems Inc (293) (0.00) 1,419 Brinker International Inc (1,293) (0.00)
(6,226) Advanced Micro Devices (26,573) (0.02) (208) Brinks Company (558) (0.00)
(787) AdvancePierre Foods Holdings (2,228) (0.00) (13) Bristol-Myers Squibb Company (406) (0.00)
(188) AECOM (1,905) (0.00) 49 Broadridge Financial Solutions Inc (93) (0.00)
(204) Affiliated Managers Group Inc (134) (0.00) (170) Brookdale Senior Living Inc (48) (0.00)
241

Man Funds VI PlcSchedule of Investments as at 31 December 2016 (continued)Man AHL Multi Strategy Alternative (continued)
Financial liabilities at fair value through profit or loss (continued)Financial liabilities at fair value through profit or loss (continued)Financial liabilities at fair value through profit or loss (continued)Financial liabilities at fair value through profit or loss (continued)
Fair Fair Fair Fair % of% of% of% of Fair Fair Fair Fair % of% of% of% of
Value Value Value Value NetNetNetNet Value Value Value Value NetNetNetNet
Nominal Nominal Nominal Nominal DescriptionDescriptionDescriptionDescription US$ US$ US$ US$ AssetsAssetsAssetsAssets Nominal Nominal Nominal Nominal DescriptionDescriptionDescriptionDescription US$ US$ US$ US$ AssetsAssetsAssetsAssets
Contracts for difference (continued)Contracts for difference (continued)Contracts for difference (continued)Contracts for difference (continued) Contracts for difference (continued)Contracts for difference (continued)Contracts for difference (continued)Contracts for difference (continued)
United States (continued)United States (continued)United States (continued)United States (continued) United States (continued)United States (continued)United States (continued)United States (continued)
526 Brown-Forman Corporation (874) (0.00) 298 Dentsply Sirona Inc (1,062) (0.00)
918 Bruker Corporation (1,145) (0.00) (441) Devon Energy Corporation (4,234) (0.00)
113 Buckle Inc (301) (0.00) 236 Diamond Offshore Drilling (50) (0.00)
(143) Buffalo Wild Wings Inc (2,107) (0.00) (65) Diamondback Energy Inc (500) (0.00)
(123) Builders FirstSource Inc (139) (0.00) 285 Dicks Sporting Goods Inc (1,224) (0.00)
(718) Bunge Limited (5,728) (0.00) (2,534) Diebold Inc (2,008) (0.00)
32 Burlington Stores Inc (314) (0.00) 844 Dillards Inc (2,289) (0.00)
1,848 CA Inc (1,504) (0.00) 550 Dineequity Inc (2,808) (0.00)
(3) Cable One Inc (136) (0.00) 220 Discovery Communications (171) (0.00)
(584) Cabot Oil and Gas Corporation (722) (0.00) (126) Dish Network Corporation (321) (0.00)
(11) CACI International Inc (14) (0.00) 1,640 Dolby Laboratories Inc (5,819) (0.00)
42 Cadence Design Systems Inc (17) (0.00) 99 Dollar General Corporation (86) (0.00)
(535) CalAtlantic Group Inc (558) (0.00) (206) Dollar Tree Inc (75) (0.00)
(798) California Water Service Group (1,753) (0.00) (418) Dominion Resources Inc (2,010) (0.00)
(11) Callon Petroleum (137) (0.00) 48 Domino's Pizza Inc (143) (0.00)
(2,214) Callon Petroleum (1,898) (0.00) (9) Dorman Products Inc (151) (0.00)
(4) Cambrex Corporation (11) (0.00) (37) Dover Corporation (277) (0.00)
(49) Cantel Medical Corporation (415) (0.00) 167 DR Horton Inc (111) (0.00)
(95) Capital One Financial Corporation (1,816) (0.00) 3 Dr Pepper Snapple Group Inc (21) (0.00)
1,120 Cardinal Health Inc (6,193) (0.00) 18 DST Systems Inc (206) (0.00)
(675) CarMax Inc (7,802) (0.01) 141 DSW Inc (64) (0.00)
(1,287) Carrizo Oil and Gas Inc (1,753) (0.00) (8) DTE Energy Company (52) (0.00)
57 Carters Inc (613) (0.00) (36) Duke Energy Corporation (127) (0.00)
(8) Caseys General Stores Inc (41) (0.00) 45 Dun & Bradstreet Corporation (496) (0.00)
(410) Catalent Inc (1,284) (0.00) (340) E*TRADE Financial Corporation (3,506) (0.00)
(227) Cathay General BanCorporation (1,468) (0.00) 403 Eaton Vance Corporation (223) (0.00)
(1,127) Cavium Inc (10,641) (0.01) 1,316 eBay Inc (609) (0.00)
(1,128) CBRE Group Inc (4,081) (0.00) 207 Ecolab Inc (17) (0.00)
69 CBS Corporation (58) (0.00) 96 Edison International (166) (0.00)
(506) CEB Inc (4,570) (0.00) 36 Edwards Lifesciences Corporation (371) (0.00)
44 Celgene Corporation (164) (0.00) (279) El Paso Electric Company (788) (0.00)
825 Centurylink Inc (1,377) (0.00) 155 Electronic Arts Inc (400) (0.00)
370 Cerner Corporation (3,850) (0.00) 31 Electronics For Imaging (170) (0.00)
(1,875) CF Industries Holdings Inc (13,174) (0.01) 138 Eli Lilly & Company (486) (0.00)
91 Charles River Laboratories International Inc (805) (0.00) (858) Emergent Biosolutions Inc (2,192) (0.00)
(562) Charles Schwab Corporation (5,053) (0.00) (403) Energen Corporation (4,477) (0.00)
(171) Charter Communications Inc (6,375) (0.01) (73) Energizer Holdings Inc (285) (0.00)
(286) Cheniere Energy Inc (439) (0.00) (50) EnLink Midstream LLC (147) (0.00)
(4,911) Chesapeake Energy Corporation (6,565) (0.01) (39) Entergy Corporation (212) (0.00)
(4) Chevron Corporation (45) (0.00) (160) Envestnet Inc (3) (0.00)
654 Chico's FAS Inc (457) (0.00) (64) Envision Healthcare Corporation (164) (0.00)
17 Childrens Place Inc (75) (0.00) (14) EOG Resources Inc (111) (0.00)
71 Church & Dwight Company Inc (365) (0.00) (66) Epam Systems Inc (88) (0.00)
(488) Ciena Corporation (2,481) (0.00) (32) EQT Corporation (15) (0.00)
(12) Cimarex Energy Company (131) (0.00) 135 Estee Lauder Companies Inc (1,453) (0.00)
292 Cisco Systems Inc (279) (0.00) (140) Esterline Technologies Corporation (3,757) (0.00)
(190) Citizens Financial Group (2,320) (0.00) (151) Etsy Inc (89) (0.00)
(229) Clayton Williams Energy Inc (4,731) (0.00) (91) Eversource Energy (272) (0.00)
(1,002) Clean Harbors Inc (8,484) (0.01) (1,577) EW Scripps Company (7,568) (0.01)
(157) Clorox Company (643) (0.00) (2,566) Exelixis Inc (4,271) (0.00)
158 CME Group Inc (390) (0.00) 252 Express Inc (415) (0.00)
(361) CMS Energy Corporation (250) (0.00) 1,244 Express Scripts Holding Company (3,163) (0.00)
(449) CNO Financial Group Inc (1,584) (0.00) (80) Facebook Inc (26) (0.00)
33 Coca-Cola Company (99) (0.00) (2,532) Fairmount Santrol Holdings (8,632) (0.01)
(660) Cogent Communications Holdings Inc (3,246) (0.00) (428) Fastenal Company (3,110) (0.00)
(103) Colfax Corporation (653) (0.00) 581 Federated Investors Inc (1,491) (0.00)
103 Colgate-Palmolive Company (656) (0.00) (41) FedEx Corporation (180) (0.00)
(28) Columbia Sportswear Company (22) (0.00) (2,616) FibroGen Inc (8,433) (0.01)
(17) Comcast Corporation (33) (0.00) (795) Financial Engines Inc (7,289) (0.01)
(232) Comerica Inc (5,239) (0.00) 82 Finisar Corporation (3) (0.00)
(378) Compass Minerals International Inc (2,321) (0.00) 723 First American Financial (1,999) (0.00)
(381) Computer Sciences Corporation (1,206) (0.00) (158) First Cash Financial Services Inc (89) (0.00)
(1,373) Comscore Inc (2,739) (0.00) (2,062) First Data Corporation (3,815) (0.00)
(5) Conagra Foods Inc (15) (0.00) (89) First Horizon National Corporation (306) (0.00)
(126) Concho Resources Inc (1,194) (0.00) (399) First Midwest BanCorporation Inc (2,882) (0.00)
(412) CONMED Corporation (1,550) (0.00) (160) First Republic Bank (2,467) (0.00)
(238) ConocoPhillips (2,102) (0.00) 155 FirstEnergy Corporation (309) (0.00)
(98) Consolidated Edison Inc (281) (0.00) (1,021) Five Below Inc (1,031) (0.00)
(23) Continental Resources Inc (158) (0.00) (46) Flowers Foods Inc (53) (0.00)
1,522 Convergys Corporation (4,447) (0.00) (240) Flowserve Corporation (1,221) (0.00)
92 Cooper Companies Inc (102) (0.00) (1,404) FNB Corporation (5,281) (0.00)
1,005 CoreLogic Inc (1,839) (0.00) 1,807 FNF Group (2,972) (0.00)
(1,633) Core-Mark Holding Company Inc (12,518) (0.01) 24 Foot Locker Inc (62) (0.00)
(1,331) Cornerstone Ondemand Inc (3,729) (0.00) 571 Ford Motor Company (80) (0.00)
17 Costco Wholesale Corporation (32) (0.00) (24) Fortinet Inc (10) (0.00)
(4,539) Covanta Holding Corporation (3,353) (0.00) 445 Fortune Brands Home and Security Inc (1,319) (0.00)
(12) CR Bard Inc (105) (0.00) 14 Forward Air Corporation (3) (0.00)
654 Crown Holdings Inc (518) (0.00) 235 Franklin Electric Company Inc (75) (0.00)
(26) Cullen/Frost Bankers Inc (376) (0.00) (5,301) Freeport-McMoRan Inc (7,381) (0.01)
(142) CVB Financial Corporation (1,080) (0.00) (624) Frontier Communications Corporation (81) (0.00)
(61) CVR Energy Inc (789) (0.00) 508 Gamestop Corporation (490) (0.00)
(2,659) Cypress Semiconductor Corporation (3,348) (0.00) (3,032) Gannett Company Inc (1,872) (0.00)
669 Danaher Corporation (617) (0.00) 1,206 Gap Inc (2,482) (0.00)
(459) Dave & Buster's Entertainment Inc (7,524) (0.01) (587) General Motors Company (2,233) (0.00)
451 DaVita HealthCare Partners Inc (2,028) (0.00) 45 Genesco Inc (180) (0.00)
(1,251) Dean Foods Company (3,235) (0.00) (299) Genesee and Wyoming Inc (1,157) (0.00)
(39) Deckers Outdoor Corporation (92) (0.00) (719) Gentherm Inc (281) (0.00)
(19) Deere and Company (360) (0.00) 274 Genuine Parts Company (447) (0.00)
(29) Dell Technologies Inc (199) (0.00) (624) G-III Apparel Group Limited (794) (0.00)
242

Man Funds VI PlcSchedule of Investments as at 31 December 2016 (continued)Man AHL Multi Strategy Alternative (continued)
Financial liabilities at fair value through profit or loss (continued)Financial liabilities at fair value through profit or loss (continued)Financial liabilities at fair value through profit or loss (continued)Financial liabilities at fair value through profit or loss (continued)
Fair Fair Fair Fair % of% of% of% of Fair Fair Fair Fair % of% of% of% of
Value Value Value Value NetNetNetNet Value Value Value Value NetNetNetNet
Nominal Nominal Nominal Nominal DescriptionDescriptionDescriptionDescription US$ US$ US$ US$ AssetsAssetsAssetsAssets Nominal Nominal Nominal Nominal DescriptionDescriptionDescriptionDescription US$ US$ US$ US$ AssetsAssetsAssetsAssets
Contracts for difference (continued)Contracts for difference (continued)Contracts for difference (continued)Contracts for difference (continued) Contracts for difference (continued)Contracts for difference (continued)Contracts for difference (continued)Contracts for difference (continued)
United States (continued)United States (continued)United States (continued)United States (continued) United States (continued)United States (continued)United States (continued)United States (continued)
703 Gilead Sciences Inc (4,051) (0.00) (472) KLX Inc (5,427) (0.00)
1,245 GNC Holdings Inc (5,974) (0.00) (486) Knight Transportation Inc (2,593) (0.00)
(512) Godaddy Inc (70) (0.00) (1,148) Knowles Corporation (2,916) (0.00)
1 Goldman Sachs Group Inc (1) (0.00) 640 Kohl'S Corporation (837) (0.00)
(19) Goodyear Tire and Rubber Company (90) (0.00) (2,600) Korn Ferry International (20,408) (0.02)
(9) Graham Holdings Company (430) (0.00) (79) Kraft Heinz Company (340) (0.00)
(262) Grand Canyon Education Inc (4,678) (0.00) (852) Kroger Company (1,871) (0.00)
(471) Granite Construction Inc (3,587) (0.00) (390) La Quinta Holdings Inc (838) (0.00)
2,422 Graphic Packaging Holding Company (1,273) (0.00) 230 Laboratory Corporation of America Holdings (834) (0.00)
758 Great Plains Energy Inc (641) (0.00) (52) Laclede Group Inc (45) (0.00)
(69) Great Western BanCorporation Inc (596) (0.00) (978) Lamb Weston Holdings (2,957) (0.00)
(37) Group 1 Automotive Inc (754) (0.00) (32) Lancaster Colony Corporation (111) (0.00)
(687) Grubhub Inc (2,472) (0.00) (2,182) Laredo Petroleum Inc (4,476) (0.00)
12 Guess? Inc (42) (0.00) 567 Las Vegas Sands Corporation (1,918) (0.00)
(94) Haemonetics Corporation (638) (0.00) (3) Legg Mason Inc (4) (0.00)
(151) Hain Celestial Group Inc (155) (0.00) 22 Leggett & Platt Inc (94) (0.00)
(335) Halliburton Company (2,687) (0.00) (326) LendingClub Corporation (123) (0.00)
(824) Halozyme Therapeutics Inc (147) (0.00) (134) Lennar Corporation (96) (0.00)
(9) Halyard Health Inc (28) (0.00) (396) Level 3 Communications Inc (3,116) (0.00)
266 Hasbro Inc (565) (0.00) 1,812 Lexicon Pharmaceuticals Inc (2,212) (0.00)
796 HCA Holdings Inc (1,349) (0.00) 31 Liberty Broadband Corporation (21) (0.00)
(14) HD Supply Holdings Inc (138) (0.00) (219) Liberty Broadband (1,350) (0.00)
(575) Healthcare Services Group (575) (0.00) 183 Liberty Interactive Corporation (371) (0.00)
(403) Healthequity Inc (3,262) (0.00) 167 Liberty Interactive Corporation QVC Group (96) (0.00)
60 HealthSouth Corporation (13) (0.00) (17) Liberty Media Corporation (1) (0.00)
(1,065) Heartland Express Inc (1,776) (0.00) (199) Liberty Media Corporation (292) (0.00)
176 Henry Schein Inc (2,414) (0.00) 15 Liberty Sirius Group (84) (0.00)
363 Hertz Global Holdings (1,981) (0.00) 119 LifePoint Health Inc (42) (0.00)
(712) Hess Corporation (8,557) (0.01) (269) Ligand Pharmaceuticals Inc (560) (0.00)
2,177 Hewlett Packard Enterprise Company (1,346) (0.00) 170 Lions Gate Entertainment Corporation (95) (0.00)
(10) Hexcel Corporation (90) (0.00) (250) Lithia Motors Inc (3,607) (0.00)
(528) HFF Inc (2,128) (0.00) (186) LogMeIn Inc (5,151) (0.00)
6 Hill-Rom Holdings Inc (29) (0.00) 208 Louisiana-Pacific Corporation (52) (0.00)
(264) Hilton Worldwide Holdings Inc (1,220) (0.00) 327 Lowes Companies Inc (896) (0.00)
1,879 HMS Holdings (1,553) (0.00) (155) Lpl Financial Holdings Inc (2,239) (0.00)
(282) Hollyfrontier Corporation (1,796) (0.00) 3 Lumentum Holdings (9) (0.00)
(183) Hope Bancorp Inc (1,126) (0.00) (676) Macom Technology Solutions Holdings (3,767) (0.00)
313 Hormel Foods Corporation (709) (0.00) (37) Macquarie Infrastructure Corporation (261) (0.00)
1,107 Houghton Mifflin Harcourt Company (471) (0.00) 994 Macys Inc (2,095) (0.00)
(248) Howard Hughes Corporation (619) (0.00) (64) Madison Square Garden Company (149) (0.00)
600 HP Inc (12) (0.00) 804 Mallinckrodt Plc (6,973) (0.01)
(1,972) HRG Group Inc (801) (0.00) (2,263) Marathon Oil Corporation (6,617) (0.01)
679 HSN Inc (937) (0.00) (58) Marriott International (896) (0.00)
(15) Hub Group Inc (28) (0.00) 30 Marsh & Mclennan Companies (27) (0.00)
(1,953) Huntington Bancshares Inc (7,210) (0.01) 494 Masco Corporation (190) (0.00)
1,149 Huron Consulting Group Inc (3,399) (0.00) (17) Masimo Corporation (103) (0.00)
(202) IBERIABANK Corporation (4,619) (0.00) (64) Mastec Inc (1,024) (0.00)
(27) ICU Medical Inc (225) (0.00) (1,023) Matador Resources Company (1,700) (0.00)
(35) IDEXX Laboratories Inc (382) (0.00) 25 Matson Inc (21) (0.00)
143 Impax Laboratories Inc (7) (0.00) 1,222 Maxim Integrated Products Inc (990) (0.00)
(154) Imperva Inc (132) (0.00) (119) MAXIMUS Inc (534) (0.00)
(10) INC Research Holdings Inc (81) (0.00) (291) MB Financial Inc (2,198) (0.00)
(259) Incyte Corporation (3,817) (0.00) (224) MBIA Inc (569) (0.00)
(5,573) Infinera Corporation (2,119) (0.00) 110 McCormick and Company Inc (523) (0.00)
(451) Ingevity Corporation (4,532) (0.00) 556 McKesson Corporation (11,635) (0.01)
181 Ingredion Inc (379) (0.00) (884) MDC Holdings Inc (2,397) (0.00)
132 Innospec Inc (208) (0.00) 16 Mead Johnson Nutrition Company (252) (0.00)
(545) Inphi Corporation (1,974) (0.00) (91) Medidata Solutions Inc (207) (0.00)
150 Insperity Inc (91) (0.00) 173 MEDNAX Inc (9) (0.00)
(1,683) Insulet Corporation (4,954) (0.00) 702 Merck and Company Inc (740) (0.00)
(44) Integra Lifesciences Holding (335) (0.00) (1,643) Meritage Homes Corporation (3,239) (0.00)
(707) Interactive Brokers Group Inc (1,048) (0.00) (1) Mettler-Toledo International Inc (26) (0.00)
(483) InterActiveCorporation (6,232) (0.00) (655) MGIC Investment Corporation (2,349) (0.00)
344 International Flavors and Fragrances Inc (1,913) (0.00) (2,053) MGM Resorts International (6,380) (0.01)
194 Interpublic Group Of Companies Inc (68) (0.00) 410 Michaels Companies Inc (1,821) (0.00)
(31) Interval Leisure Group Inc (53) (0.00) 105 Microchip Technology Inc (140) (0.00)
(433) Invesco Limited (388) (0.00) (2,885) Micron Technology Inc (20,628) (0.02)
(1,137) Ionis Pharmaceuticals Inc (20,016) (0.02) (627) Microsemi Corporation (8,628) (0.01)
(40) iRobot Corporation (11) (0.00) (14) MicroStrategy Inc (104) (0.00)
(2,658) Ironwood Pharmaceuticals Inc (3,784) (0.00) (55) Middleby Corporation (509) (0.00)
(286) ITT Inc (1,690) (0.00) (937) Mobile Mini Inc (2,569) (0.00)
614 Jabil Circuit Inc (237) (0.00) (32) Mohawk Industries Inc (100) (0.00)
158 Jacobs Engineering Group Inc (131) (0.00) (141) Molina Healthcare Inc (194) (0.00)
(66) JB Hunt Transport Services Inc (1,049) (0.00) (286) Mondelez International Inc (346) (0.00)
(471) JetBlue Airways Corporation (2,520) (0.00) (20) Monro Muffler Brake Inc (72) (0.00)
199 JM Smucker Company (1,776) (0.00) (574) Monster Beverage Corporation (565) (0.00)
(75) John Bean Technologies Corporation (1,080) (0.00) 139 Moodys Corporation (991) (0.00)
354 Johnson and Johnson (110) (0.00) 26 Morningstar Inc (188) (0.00)
(7) Jones Lang LaSalle Inc (41) (0.00) (526) Mosaic Company (1,059) (0.00)
27 Kansas City Southern (8) (0.00) 285 MSCI Inc (1,004) (0.00)
(410) Kar Auction Services Inc (571) (0.00) (355) MSG Networks Inc (10) (0.00)
(3,582) Kate SpAde and Company (5,525) (0.00) (385) Murphy Oil Corporation (1,952) (0.00)
(1,609) KBR Inc (3,904) (0.00) 89 Murphy USA Inc (1,227) (0.00)
132 Kellogg Company (83) (0.00) (55) Mylan NV (36) (0.00)
(54) Kennametal Inc (147) (0.00) 1,102 Myriad Genetics Inc (656) (0.00)
(675) KeyCorporation (3,879) (0.00) (238) Nasdaq Inc (121) (0.00)
(4) Kimberly-Clark Corporation (5) (0.00) (522) National Beverage Corporation (891) (0.00)
453 Kinder Morgan Inc (140) (0.00) (259) National Fuel Gas Company (253) (0.00)
(197) Kirby Corporation (1,971) (0.00) (458) Nationstar Mortgage Holdings (2,392) (0.00)
243

Man Funds VI PlcSchedule of Investments as at 31 December 2016 (continued)Man AHL Multi Strategy Alternative (continued)
Financial liabilities at fair value through profit or loss (continued)Financial liabilities at fair value through profit or loss (continued)Financial liabilities at fair value through profit or loss (continued)Financial liabilities at fair value through profit or loss (continued)
Fair Fair Fair Fair % of% of% of% of Fair Fair Fair Fair % of% of% of% of
Value Value Value Value NetNetNetNet Value Value Value Value NetNetNetNet
Nominal Nominal Nominal Nominal DescriptionDescriptionDescriptionDescription US$ US$ US$ US$ AssetsAssetsAssetsAssets Nominal Nominal Nominal Nominal DescriptionDescriptionDescriptionDescription US$ US$ US$ US$ AssetsAssetsAssetsAssets
Contracts for difference (continued)Contracts for difference (continued)Contracts for difference (continued)Contracts for difference (continued) Contracts for difference (continued)Contracts for difference (continued)Contracts for difference (continued)Contracts for difference (continued)
United States (continued)United States (continued)United States (continued)United States (continued) United States (continued)United States (continued)United States (continued)United States (continued)
866 Natus Medical Inc (1,518) (0.00) (1,076) QEP Resources Inc (1,453) (0.00)
(1,515) Navistar International Corporation (11,959) (0.01) 196 Qorvo Inc (332) (0.00)
(114) Neogen Corporation (810) (0.00) (14) Quintiles Transnational Holdings Inc (37) (0.00)
(474) Netflix Inc (12,402) (0.01) 675 R.R.Donnelley & Sons Company (630) (0.00)
130 NETGEAR Inc (246) (0.00) 277 Ralph Lauren Corporation (2,396) (0.00)
(1,137) New Jersey Resources Corporation (2,700) (0.00) (173) Raymond James Financial Inc (2,726) (0.00)
(200) New York Community BanCorporation (925) (0.00) 60 Raytheon Company (65) (0.00)
71 New York Times Company (19) (0.00) (984) Realogy Holdings Corporation (383) (0.00)
(55) Newfield Exploration Company (127) (0.00) 63 Red Hat Inc (235) (0.00)
377 Newmont Mining Corporation (1,672) (0.00) 703 Regal Entertainment Group (801) (0.00)
(125) Nexstar Broadcasting Group Inc (1,748) (0.00) (10) Regeneron Pharmaceuticals Inc (41) (0.00)
175 NextEra Energy Inc (898) (0.00) (18) ResMed Inc (62) (0.00)
710 Nielsen Holdings Plc (4,466) (0.00) (1,356) Restoration Hardware Holdings Inc (626) (0.00)
(195) NiSource Inc (67) (0.00) (519) Rexnord Corporation (627) (0.00)
(32) Noble Energy Inc (75) (0.00) (556) Reynolds American Inc (1,015) (0.00)
750 Nordstrom Inc (3,644) (0.00) 15 RLI Corporation (78) (0.00)
582 Northwest Natural Gas Company (259) (0.00) (33) Rollins Inc (102) (0.00)
(132) Northwestern Corporation (317) (0.00) (30) Roper Technologies Inc (67) (0.00)
(2,033) Norwegian Cruise Line Holdings Limited (10,410) (0.01) (560) Royal Caribbean Cruises Limited (6,221) (0.00)
300 Now Inc (69) (0.00) 535 Royal Gold Inc (3,149) (0.00)
47 Nu Skin Enterprises Inc (467) (0.00) (340) RSP Permian Inc (2,439) (0.00)
(142) Nuvasive Inc (619) (0.00) (755) Ryder System Inc (6,655) (0.01)
(77) NVIDIA Corporation (396) (0.00) 178 S&P Global Inc (2,635) (0.00)
(663) NxStage Medical Inc (1,445) (0.00) (1,210) Sabre Corporation (339) (0.00)
(1,975) Oasis Petroleum Inc (11,125) (0.01) (1,240) Sage Therapeutics Inc (9,959) (0.01)
233 Occidental Petroleum Corporation (507) (0.00) (22) Sally Beauty Holdings Inc (17) (0.00)
(323) Office Depot Inc (739) (0.00) (981) Santander Consumer USA Holdings Inc (2,817) (0.00)
(2) OGE Energy Corporation (2) (0.00) (183) SCANA Corporation (661) (0.00)
(72) Old Dominion Freight Line Inc (1,149) (0.00) 67 Scripps Networks Inter (27) (0.00)
(802) Old National BanCorporation (3,583) (0.00) 532 Sealed Air Corporation (339) (0.00)
(453) Olin Corporation (315) (0.00) (2,248) Seaworld Entertainment Inc (12,573) (0.01)
(534) Ollies Bargain Outlet Holdings (1,016) (0.00) (1,264) Select Medical Holdings Corporation (582) (0.00)
57 Omnicom Group Inc (40) (0.00) (634) SemGroup Corporation (6,215) (0.00)
(403) On Assignment Inc (3,443) (0.00) (42) Sempra Energy (124) (0.00)
(15) ONE Gas Inc (79) (0.00) (241) ServiceMaster Global Holdings Inc (564) (0.00)
(1,004) OneMain Holdings Inc (1,431) (0.00) (782) Servicenow Inc (332) (0.00)
893 Oracle Corporation (1,862) (0.00) (1,227) Shenandoah Telecom Company (1,088) (0.00)
(475) Orbital Atk Inc (5,777) (0.00) 73 Sherwin-Williams Company (211) (0.00)
(5) O'Reilly Automotive Inc (73) (0.00) 23 Shutterfly Inc (30) (0.00)
(363) OSI Systems Inc (3,156) (0.00) 229 Shutterstock Inc (1,233) (0.00)
176 Owens Corning (265) (0.00) (217) Signature Bank (6,517) (0.01)
711 Owens-Illinois Inc (743) (0.00) (1,815) Sims Metal Management Limited (4,391) (0.00)
(391) P G & E Corporation (263) (0.00) 42 Sinclair Broadcast Group Inc (929) (0.00)
(153) PACCAR Inc (885) (0.00) (1,442) Skechers U.S.A. Inc (2,824) (0.00)
(249) Pacwest BanCorporation (3,359) (0.00) (789) SkyWest Inc (5,151) (0.00)
50 Panera Bread Company (290) (0.00) 339 Skyworks Solutions Inc (333) (0.00)
44 Papa John's International Inc (34) (0.00) (495) SLM Corporation (2,315) (0.00)
97 PAREXEL International Corporation (171) (0.00) (1,505) SM Energy Company (3,919) (0.00)
(1,192) Parsley Energy Inc (2,391) (0.00) 2,364 Smith & Wesson Holding Corporation (3,526) (0.00)
206 Patterson Companies Inc (93) (0.00) (1,445) Snyders-Lance Inc (4,041) (0.00)
(628) Paycom Software Inc (3,565) (0.00) 199 Sonic Corporation (917) (0.00)
16 PayPal Holdings Inc (15) (0.00) (882) South Jersey Industries (3,999) (0.00)
(116) PBF Energy Inc (253) (0.00) (730) Southern Company (148) (0.00)
(264) PDC Energy Inc (4,498) (0.00) (242) Southern Copper Corporation (407) (0.00)
(2,844) Penn National Gaming Inc (1,394) (0.00) (187) Southwestern Energy Company (221) (0.00)
(105) Penske Automotive Group Inc (1,134) (0.00) (171) SpArk Therapeutics Inc (286) (0.00)
(79) Penumbra Inc (118) (0.00) 178 Spectrum Brands Holdings Inc (1,722) (0.00)
(397) Peoples United Financial (1,430) (0.00) (689) Spirit Airlines Inc (11,859) (0.01)
292 PepsiCo Inc (634) (0.00) (5,014) Sprint Corporation (10,335) (0.01)
255 PerkinElmer Inc (415) (0.00) 45 Sprouts Farmers Market Inc (70) (0.00)
1,256 Pfizer Inc (1,176) (0.00) (4,941) Square Inc (8,582) (0.01)
(54) Philip Morris International Inc (177) (0.00) (213) Stamps.Com Inc (6,544) (0.01)
1,607 Pilgrim's Pride Corporation (4,654) (0.00) 326 Stanley Black & Decker Inc (1,044) (0.00)
(132) Pinnacle Financial Partners (2,134) (0.00) 82 Staples Inc (407) (0.00)
(544) Pinnacle Foods Inc (1,880) (0.00) 263 Starbucks Corporation (215) (0.00)
(202) Pinnacle West Capital Corporation (831) (0.00) (11) Stericycle Inc (38) (0.00)
(92) Pioneer Natural Resources Company (1,494) (0.00) (3) Sterling BanCorporation (20) (0.00)
705 Pitney Bowes Inc (320) (0.00) 244 Steven Madden Limited (559) (0.00)
(7,704) Platform Specialty Products Corporation (10,144) (0.01) (546) Stifel Financial Corporation (7,355) (0.01)
(1,281) Pnm Resources Inc (3,048) (0.00) (27) Stryker Corporation (155) (0.00)
(64) Polaris Industries Inc (35) (0.00) (983) Summit Materials Inc (639) (0.00)
(134) Portland General Electric Company (291) (0.00) (166) Super Micro Computer Inc (975) (0.00)
(2,271) Portola Pharmaceuticals Inc (6,992) (0.01) 42 Superior Energy Services Inc (80) (0.00)
(513) Post Holdings Inc (1,007) (0.00) 799 SUPERVALU Inc (257) (0.00)
211 PPG Industries Inc (1,484) (0.00) (24) Surgical Care Affiliates Inc (75) (0.00)
266 PPL Corporation (227) (0.00) (116) SVB Financial Group (7,550) (0.01)
(489) PRA Group Inc (4,120) (0.00) 951 Swift Transportation Company (317) (0.00)
(41) PRA Health Sciences Inc (125) (0.00) 144 Synaptics Inc (377) (0.00)
74 Praxair Inc (52) (0.00) 33 Synchrony Financial (15) (0.00)
2,222 Premier Inc (2,026) (0.00) 21 Synopsys Inc (13) (0.00)
(8) Prestige Brands Holdings Inc (31) (0.00) (709) Tahoe Resources Inc (55) (0.00)
(7) Priceline Group Inc (262) (0.00) (131) Take-Two Interactive Software Inc (394) (0.00)
(187) Pricesmart Inc (62) (0.00) (32) Targa Resources Corporation (550) (0.00)
249 Procter and Gamble Company (706) (0.00) 830 Target Corporation (645) (0.00)
(805) Proofpoint Inc (4,494) (0.00) (13) TASER International Inc (5) (0.00)
(6) Proto Labs Inc (37) (0.00) 91 Tech Data Corporation (106) (0.00)
(503) PTC Inc (179) (0.00) 1,366 Tegna Inc (382) (0.00)
(289) Public Service Enterprise Group Inc (581) (0.00) 200 Teleflex Inc (648) (0.00)
326 PVH Corporation (4,024) (0.00) (736) Telephone and Data Systems Inc (708) (0.00)
244

Man Funds VI PlcSchedule of Investments as at 31 December 2016 (continued)Man AHL Multi Strategy Alternative (continued)
Financial liabilities at fair value through profit or loss (continued)Financial liabilities at fair value through profit or loss (continued)Financial liabilities at fair value through profit or loss (continued)Financial liabilities at fair value through profit or loss (continued)
Fair Fair Fair Fair % of% of% of% of Fair Fair Fair Fair % of% of% of% of
Value Value Value Value NetNetNetNet Value Value Value Value NetNetNetNet
Nominal Nominal Nominal Nominal DescriptionDescriptionDescriptionDescription US$ US$ US$ US$ AssetsAssetsAssetsAssets Nominal Nominal Nominal Nominal DescriptionDescriptionDescriptionDescription US$ US$ US$ US$ AssetsAssetsAssetsAssets
Contracts for difference (continued)Contracts for difference (continued)Contracts for difference (continued)Contracts for difference (continued) Contracts for difference (continued)Contracts for difference (continued)Contracts for difference (continued)Contracts for difference (continued)
United States (continued)United States (continued)United States (continued)United States (continued) United States (continued)United States (continued)United States (continued)United States (continued)
(398) Tempur Sealy International Inc (4,037) (0.00) 3,922 Xerox Corporation (2,359) (0.00)
1,093 Teradata Corporation (1,342) (0.00) (1,118) XPO Logistics Inc (9,466) (0.01)
(212) Terex Corporation (2,099) (0.00) (1,669) Yelp Inc (7,076) (0.01)
(458) Tesaro Inc (13,583) (0.01) 1,096 Yum China Holdings Inc (1,611) (0.00)
(323) Tesla Motors Inc (3,791) (0.00) (1,005) Zayo Group Holdings Inc (2,820) (0.00)
(208) Texas Capital Bancshares Inc (6,259) (0.00) (196) Zebra Technologies Corporation (5,049) (0.00)
5 Texas Roadhouse Inc (4) (0.00) (747) Zeltiq Aesthetics Inc (5,559) (0.00)
(116) Textron Inc (1,105) (0.00) (1,924) Zillow Group Inc (4,395) (0.00)
(7,275) Therapeuticsmd Inc (620) (0.00) 36 Zimmer Biomet Holdings Inc (853) (0.00)
91 Thermo Fisher Scientific Inc (945) (0.00) (18) Zions BanCorporation (113) (0.00)
158 Tiffany & Co (581) (0.00) (51) Zoetis Inc (163) (0.00)
(106) Time Inc (543) (0.00) (1,399,159) (1.11)
(622) TiVo Corporation (50) (0.00)
218 TJX Companies Inc (519) (0.00) Total contracts for differenceTotal contracts for differenceTotal contracts for differenceTotal contracts for difference (6,236,295) (4.88)
(354) T-Mobile US Inc (3,456) (0.00)
(783) Toll Brothers Inc (1,527) (0.00) Futures ContractsFutures ContractsFutures ContractsFutures Contracts
(239) Tractor Supply Company (2,185) (0.00) AustraliaAustraliaAustraliaAustralia
(45) TransDigm Group Inc (470) (0.00) 96 90 Day Bank Bill Futures June 2017 (1,398) (0.00)
1,207 Travelport Worldwide Limited (257) (0.00)
(88) TreeHouse Foods Inc (462) (0.00) CanadaCanadaCanadaCanada
102 Trex Company Inc (143) (0.00) 139 Bank Acceptance Futures March 2018 (7,681) (0.01)
(4,430) TRI Pointe Group Inc (2,410) (0.00) 250 Bank Acceptance Future September 2017 (5,807) (0.00)
(340) TriNet Group Inc (1,759) (0.00) (13,488) (0.01)
(4) Triumph Group Inc (5) (0.00)
(72) Trustmark Corporation (946) (0.00) ChinaChinaChinaChina
372 Tupperware Brands Corporation (2,656) (0.00) 192 FTSE China A50 Index Futures January 2017 (751) (0.00)
(290) Johnson Controls International (JCI) (177) (0.00)
1,138 Tyson Foods Inc (4,807) (0.00) GermanyGermanyGermanyGermany
(57) Ulta Salon Cosmetics & Fragrance Inc (1,216) (0.00) 19 EURO BTP Futures March 2017 (674) (0.00)
(805) Ultragenyx Pharmaceutical In (4,103) (0.00) (1) Euro BUXL 30 Year Bond Futures March 2017 (2,742) (0.00)
(225) United Bankshares Inc (1,958) (0.00) (1) VSTOXX Mini Index Futures February 2017 (11) 0.00
(31) United Natural Foods Inc (349) (0.00) (3,427) (0.00)
(1,229) United States Steel Corporation (16,978) (0.01)
(579) Universal Display Corporation (2,480) (0.00) Hong KongHong KongHong KongHong Kong
362 Universal Health Services Inc (5,512) (0.00) (44) Hang Seng Index Futures January 2017 (41,512) (0.03)
56 Urban Outfitters Inc (221) (0.00) (8) H-Shares Index Futures January 2017 (6,984) (0.01)
(760) US Foods Holding Corporation (2,833) (0.00) (48,496) (0.04)
(358) US Silica Holdings Inc (4,399) (0.00)
19 USANA Health Sciences Inc (135) (0.00) JapanJapanJapanJapan
(482) Valley National BanCorporation (1,127) (0.00) (49) Japan 10 Years Bond OSE Futures March 2017 (123,376) (0.10)
(15) Vantiv Inc (50) (0.00) 6 Nikkei 225 OSE Index Futures March 2017 (6,087) (0.00)
12 Varian Medical Systems Inc (64) (0.00) (129,463) (0.10)
107 VCA Inc (399) (0.00)
(1,797) Vector Group Limited (2,879) (0.00) SingaporeSingaporeSingaporeSingapore
(104) Veeva Systems Inc (255) (0.00) 148 MSCI Singapore Index Futures January 2017 (18,736) (0.01)
(506) Verint Systems Inc (41) (0.00) (671) SGX Nifty 50 Index Futures January 2017 (197,472) (0.15)
401 VeriSign Inc (1,373) (0.00) (216,208) (0.17)
23 Verisk Analytics Inc (19) (0.00)
7 Verizon Communications Inc (2) (0.00) SwedenSwedenSwedenSweden
160 Viacom Inc (68) (0.00) 168 OMXS 30 Index Futures January 2017 (36,509) (0.03)
(307) Viavi Solutions Inc (302) (0.00)
(24) Visa Inc (1) (0.00) SwitzerlandSwitzerlandSwitzerlandSwitzerland
156 Vista Outdoor Inc (350) (0.00) (55) Swiss Market Index Futures March 2017 (63,413) (0.05)
(333) Voya Financial Inc (4,077) (0.00)
(57) Vulcan Materials Company (432) (0.00) ThailandThailandThailandThailand
801 VWR Corporation (2,914) (0.00) (150) SET50 Index Futures March 2017 (13,952) (0.01)
(4) WABCO Holdings Inc (5) (0.00)
(546) Waddell & Reed Financial (1,911) (0.00) United KingdomUnited KingdomUnited KingdomUnited Kingdom
284 Wageworks Inc (133) (0.00) (59) Long Gilt Futures March 2017 (30,428) (0.02)
32 Walgreens Boots Alliance Inc (39) (0.00)
1,134 Wal-Mart Stores Inc (1,558) (0.00) United StatesUnited StatesUnited StatesUnited States
23 Walt Disney Company (19) (0.00) 21 90 Day Euro$ Futures December 2018 (2,575) (0.00)
119 Waters Corporation (1,488) (0.00) 137 90 Day Euro$ Futures June 2017 (12,038) (0.01)
47 Watts Water Technologies Inc (122) (0.00) 5 90 Day Euro$ Futures June 2020 (1,388) (0.00)
(46) Wayfair Inc (64) (0.00) 36 90 Day Euro$ Futures March 2018 (3,363) (0.00)
(285) WD-40 Company (2,662) (0.00) 7 90 Day Euro$ Futures September 2019 (1,263) (0.00)
250 WEC Energy Group Inc (534) (0.00) 2 Mini MSCI EAFE Index Futures March 2017 (1,060) (0.00)
(192) Wells Fargo and Company (1,963) (0.00) 3 Mini MSCI Emerging Market Index Futures March 2017 (2,290) (0.00)
(1,907) Werner Enterprises Inc (6,530) (0.01) 74 Nasdaq 100 E-Mini Index Futures March 2017 (90,017) (0.07)
(120) Wesco International Inc (983) (0.00) 36 Russell 2000 Mini Index Futures March 2017 (27,565) (0.02)
(48) West Pharmaceutical Services Inc (468) (0.00) 53 S&P500 EMini Index Futures March 2017 (52,458) (0.04)
(157) Western Alliance BanCorporation (2,203) (0.00) (313) United States 10 Years Note CBT Futures March 2017 (83,101) (0.06)
(300) Western Digital Corporation (5,258) (0.01) (39) United States 5 Years Note CBT Futures March 2017 (33,219) (0.03)
(53) Western Refining Inc (470) (0.00) (310,337) (0.24)
(177) Westlake Chemical Corporation (290) (0.00)
(464) WEX Inc (3,542) (0.00) Total futures contractsTotal futures contractsTotal futures contractsTotal futures contracts (867,870) (0.68)
(527) WGL Holdings Inc (7,289) (0.01)
46 Whirlpool Corporation (103) (0.00) OptionsOptionsOptionsOptions
(1,727) Whiting Petroleum Corporation (5,000) (0.01) AustraliaAustraliaAustraliaAustralia
(131) Whole Foods Market Inc (731) (0.00) (4) Call on 5,525 AS51 Index 19 January 2017 (4,808) (0.00)
90 Wiley (John) & Sons (53) (0.00) (3) Call on 5,550 AS51 Index 19 January 2017 (3,132) (0.00)
(13) Williams Companies Inc (65) (0.00) (4) Call on 5,575 AS51 Index 19 January 2017 (3,571) (0.00)
310 Williams-Sonoma Inc (873) (0.00) (4) Call on 5,600 AS51 Index 19 January 2017 (3,001) (0.00)
(3,565) WisdomTree Investments Inc (7,052) (0.01) (5) Call on 5,625 AS51 Index 19 January 2017 (3,085) (0.00)
15 World Fuel Services Corporation (8) (0.00) (4) Call on 5,650 AS51 Index 19 January 2017 (1,984) (0.00)
1,429 Worthington Industries (1,917) (0.00) (4) Call on 5,675 AS51 Index 19 January 2017 (1,558) (0.00)
(2,418) WPX Energy Inc (8,520) (0.01) (5) Call on 5,700 AS51 Index 19 January 2017 (1,488) (0.00)
260 WR Grace and Company (1,606) (0.00) (9) Call on 5,725 AS51 Index 19 January 2017 (2,001) (0.00)
(335) Xcel Energy Inc (410) (0.00) (13) Call on 5,750 AS51 Index 19 January 2017 (2,109) (0.00)
245

Man Funds VI PlcSchedule of Investments as at 31 December 2016 (continued)Man AHL Multi Strategy Alternative (continued)
Financial liabilities at fair value through profit or loss (continued)Financial liabilities at fair value through profit or loss (continued)Financial liabilities at fair value through profit or loss (continued)Financial liabilities at fair value through profit or loss (continued)
Fair Fair Fair Fair % of% of% of% of Fair Fair Fair Fair % of% of% of% of
Value Value Value Value NetNetNetNet Value Value Value Value NetNetNetNet
Nominal Nominal Nominal Nominal DescriptionDescriptionDescriptionDescription US$ US$ US$ US$ AssetsAssetsAssetsAssets Nominal Nominal Nominal Nominal DescriptionDescriptionDescriptionDescription US$ US$ US$ US$ AssetsAssetsAssetsAssets
Options (continued)Options (continued)Options (continued)Options (continued) Options (continued)Options (continued)Options (continued)Options (continued)
Australia (continued)Australia (continued)Australia (continued)Australia (continued) European Union (continued)European Union (continued)European Union (continued)European Union (continued)
(10) Call on 5,775 AS51 Index 19 January 2017 (1,159) (0.00) (300,000) EUR PUT/GBP CALL K=0.8256 13 January 2017 (118) (0.00)
(10) Call on 5,800 AS51 Index 19 January 2017 (818) (0.00) (100,000) EUR PUT/GBP CALL K=0.8259 04 January 2017 (53) (0.00)
(4) Put on 5,225 AS51 Index 19 January 2017 (133) (0.00) (1,000,000) EUR PUT/GBP CALL K=0.8259 19 January 2017 (907) (0.00)
(5) Put on 5,275 AS51 Index 19 January 2017 (196) (0.00) (600,000) EUR PUT/GBP CALL K=0.8265 13 January 2017 (261) (0.00)
(4) Put on 5,300 AS51 Index 19 January 2017 (171) (0.00) (300,000) EUR PUT/GBP CALL K=0.8272 11 January 2017 (114) (0.00)
(9) Put on 5,325 AS51 Index 19 January 2017 (417) (0.00) (1,000,000) EUR PUT/GBP CALL K=0.8281 19 January 2017 (1,118) (0.00)
(5) Put on 5,350 AS51 Index 19 January 2017 (257) (0.00) (300,000) EUR PUT/GBP CALL K=0.8288 05 January 2017 (126) (0.00)
(5) Put on 5,375 AS51 Index 19 January 2017 (282) (0.00) (900,000) EUR PUT/GBP CALL K=0.8329 26 January 2017 (2,521) (0.00)
(8) Put on 5,400 AS51 Index 19 January 2017 (504) (0.00) (800,000) EUR PUT/GBP CALL K=0.8344 10 January 2017 (528) (0.00)
(5) Put on 5,425 AS51 Index 19 January 2017 (358) (0.00) (100,000) EUR PUT/GBP CALL K=0.834 03 January 2017 (69) (0.00)
(6) Put on 5,450 AS51 Index 19 January 2017 (478) (0.00) (300,000) EUR PUT/GBP CALL K=0.8363 05 January 2017 (194) (0.00)
(9) Put on 5,475 AS51 Index 19 January 2017 (841) (0.00) (400,000) EUR PUT/GBP CALL K=0.8391 03 January 2017 (349) (0.00)
(5) Put on 5,500 AS51 Index 19 January 2017 (547) (0.00) (100,000) EUR PUT/GBP CALL K=0.8391 03 January 2017 (87) (0.00)
(4) Put on 5,550 AS51 Index 19 January 2017 (611) (0.00) (600,000) EUR PUT/JPY CALL K=116.39 04 January 2017 (93) (0.00)
(33,509) (0.03) (300,000) EUR PUT/JPY CALL K=116.51 04 January 2017 (53) (0.00)
(200,000) EUR PUT/JPY CALL K=117.36 04 January 2017 (70) (0.00)
European UnionEuropean UnionEuropean UnionEuropean Union (100,000) EUR PUT/JPY CALL K=118.16 04 January 2017 (42) (0.00)
(200,000) EUR CALL/GBP PUT K=0.853 17 January 2017 (1,838) (0.00) (500,000) EUR PUT/JPY CALL K=119.57 26 January 2017 (1,868) (0.00)
(600,000) EUR CALL/GBP PUT K=0.8557 19 January 2017 (4,982) (0.00) (100,000) EUR PUT/JPY CALL K=120.04 19 January 2017 (296) (0.00)
(300,000) EUR CALL/GBP PUT K=0.8569 13 January 2017 (1,767) (0.00) (500,000) EUR PUT/JPY CALL K=120.08 19 January 2017 (1,510) (0.00)
(500,000) EUR CALL/GBP PUT K=0.857 18 January 2017 (3,619) (0.00) (600,000) EUR PUT/JPY CALL K=120.48 26 January 2017 (3,193) (0.00)
(1,000,000) EUR CALL/GBP PUT K=0.8583 19 January 2017 (6,941) (0.01) (200,000) EUR PUT/NOK CALL K=8.8242 13 January 2017 (62) (0.00)
(1,000,000) EUR CALL/GBP PUT K=0.858 19 January 2017 (7,089) (0.01) (200,000) EUR PUT/NOK CALL K=8.8359 13 January 2017 (65) (0.00)
(300,000) EUR CALL/GBP PUT K=0.8589 11 January 2017 (1,278) (0.00) (200,000) EUR PUT/NOK CALL K=8.8443 05 January 2017 (52) (0.00)
(600,000) EUR CALL/GBP PUT K=0.8593 13 January 2017 (2,865) (0.00) (200,000) EUR PUT/NOK CALL K=8.8454 04 January 2017 (59) (0.00)
(300,000) EUR CALL/GBP PUT K=0.8615 05 January 2017 (456) (0.00) (200,000) EUR PUT/NOK CALL K=8.8569 11 January 2017 (69) (0.00)
(100,000) EUR CALL/GBP PUT K=0.8653 04 January 2017 (153) (0.00) (200,000) EUR PUT/NOK CALL K=8.8684 03 January 2017 (65) (0.00)
(900,000) EUR CALL/GBP PUT K=0.8657 26 January 2017 (5,022) (0.00) (200,000) EUR PUT/NOK CALL K=8.8735 13 January 2017 (76) (0.00)
(800,000) EUR CALL/GBP PUT K=0.8675 10 January 2017 (1,186) (0.00) (200,000) EUR PUT/NOK CALL K=8.8747 17 January 2017 (119) (0.00)
(300,000) EUR CALL/GBP PUT K=0.8693 05 January 2017 (327) (0.00) (200,000) EUR PUT/NOK CALL K=8.8769 05 January 2017 (58) (0.00)
(100,000) EUR CALL/GBP PUT K=0.8694 03 January 2017 (83) (0.00) (200,000) EUR PUT/NOK CALL K=8.879 05 January 2017 (58) (0.00)
(100,000) EUR CALL/GBP PUT K=0.8744 03 January 2017 (69) (0.00) (200,000) EUR PUT/NOK CALL K=8.9022 10 January 2017 (81) (0.00)
(400,000) EUR CALL/GBP PUT K=0.8758 03 January 2017 (268) (0.00) (200,000) EUR PUT/NOK CALL K=8.9065 03 January 2017 (76) (0.00)
(600,000) EUR CALL/JPY PUT K=122.19 04 January 2017 (5,524) (0.00) (200,000) EUR PUT/NOK CALL K=8.9093 03 January 2017 (78) (0.00)
(300,000) EUR CALL/JPY PUT K=122.21 04 January 2017 (2,723) (0.00) (200,000) EUR PUT/NOK CALL K=8.9206 19 January 2017 (263) (0.00)
(200,000) EUR CALL/JPY PUT K=123.27 04 January 2017 (721) (0.00) (200,000) EUR PUT/NOK CALL K=8.9215 19 January 2017 (266) (0.00)
(100,000) EUR CALL/JPY PUT K=124.39 04 January 2017 (128) (0.00) (200,000) EUR PUT/NOK CALL K=8.9278 19 January 2017 (286) (0.00)
(500,000) EUR CALL/JPY PUT K=124.81 26 January 2017 (3,346) (0.00) (200,000) EUR PUT/NOK CALL K=8.928 03 January 2017 (91) (0.00)
(500,000) EUR CALL/JPY PUT K=125.06 19 January 2017 (2,148) (0.00) (200,000) EUR PUT/NOK CALL K=8.9302 03 January 2017 (93) (0.00)
(100,000) EUR CALL/JPY PUT K=125.33 19 January 2017 (374) (0.00) (200,000) EUR PUT/NOK CALL K=8.9306 03 January 2017 (94) (0.00)
(600,000) EUR CALL/JPY PUT K=125.55 26 January 2017 (2,952) (0.00) (200,000) EUR PUT/NOK CALL K=8.9495 03 January 2017 (109) (0.00)
(200,000) EUR CALL/NOK PUT K=9.1036 13 January 2017 (963) (0.00) (200,000) EUR PUT/NOK CALL K=8.9627 03 January 2017 (119) (0.00)
(200,000) EUR CALL/NOK PUT K=9.1132 13 January 2017 (875) (0.00) (100,000) EUR PUT/NOK CALL K=8.9746 18 January 2017 (231) (0.00)
(200,000) EUR CALL/NOK PUT K=9.1329 13 January 2017 (715) (0.00) (200,000) EUR PUT/NOK CALL K=8.9808 26 January 2017 (698) (0.00)
(200,000) EUR CALL/NOK PUT K=9.1341 17 January 2017 (843) (0.00) (100,000) EUR PUT/SEK CALL K=9.5358 19 January 2017 (408) (0.00)
(200,000) EUR CALL/NOK PUT K=9.137 11 January 2017 (572) (0.00) (200,000) EUR PUT/SEK CALL K=9.571 11 January 2017 (836) (0.00)
(200,000) EUR CALL/NOK PUT K=9.1475 05 January 2017 (240) (0.00) (200,000) EUR PUT/SEK CALL K=9.5876 13 January 2017 (1,119) (0.00)
(200,000) EUR CALL/NOK PUT K=9.1608 04 January 2017 (185) (0.00) (200,000) EUR PUT/SEK CALL K=9.5932 19 January 2017 (1,414) (0.00)
(200,000) EUR CALL/NOK PUT K=9.1625 05 January 2017 (181) (0.00) (200,000) EUR PUT/SEK CALL K=9.6022 13 January 2017 (1,303) (0.00)
(200,000) EUR CALL/NOK PUT K=9.1669 19 January 2017 (709) (0.00) (200,000) EUR PUT/SEK CALL K=9.6179 03 January 2017 (1,043) (0.00)
(200,000) EUR CALL/NOK PUT K=9.1723 05 January 2017 (162) (0.00) (200,000) EUR PUT/SEK CALL K=9.6233 03 January 2017 (1,134) (0.00)
(200,000) EUR CALL/NOK PUT K=9.1778 03 January 2017 (195) (0.00) (200,000) EUR PUT/SEK CALL K=9.6246 13 January 2017 (1,618) (0.00)
(200,000) EUR CALL/NOK PUT K=9.1856 19 January 2017 (600) (0.00) (200,000) EUR PUT/SEK CALL K=9.626 17 January 2017 (1,767) (0.00)
(200,000) EUR CALL/NOK PUT K=9.1885 19 January 2017 (584) (0.00) (200,000) EUR PUT/SEK CALL K=9.6278 10 January 2017 (1,529) (0.00)
(200,000) EUR CALL/NOK PUT K=9.196 10 January 2017 (231) (0.00) (200,000) EUR PUT/SEK CALL K=9.6313 03 January 2017 (1,274) (0.00)
(200,000) EUR CALL/NOK PUT K=9.225 03 January 2017 (99) (0.00) (200,000) EUR PUT/SEK CALL K=9.6416 04 January 2017 (1,519) (0.00)
(200,000) EUR CALL/NOK PUT K=9.2314 03 January 2017 (93) (0.00) (200,000) EUR PUT/SEK CALL K=9.6477 03 January 2017 (1,595) (0.00)
(200,000) EUR CALL/NOK PUT K=9.2361 03 January 2017 (89) (0.00) (200,000) EUR PUT/SEK CALL K=9.6509 03 January 2017 (1,665) (0.00)
(100,000) EUR CALL/NOK PUT K=9.2435 18 January 2017 (158) (0.00) (200,000) EUR PUT/SEK CALL K=9.652 19 January 2017 (2,251) (0.00)
(200,000) EUR CALL/NOK PUT K=9.2452 03 January 2017 (83) (0.00) (200,000) EUR PUT/SEK CALL K=9.6578 04 January 2017 (1,825) (0.00)
(200,000) EUR CALL/NOK PUT K=9.2468 03 January 2017 (82) (0.00) (200,000) EUR PUT/SEK CALL K=9.6583 03 January 2017 (1,827) (0.00)
(200,000) EUR CALL/NOK PUT K=9.254 26 January 2017 (493) (0.00) (200,000) EUR PUT/SEK CALL K=9.6598 03 January 2017 (1,860) (0.00)
(200,000) EUR CALL/NOK PUT K=9.2577 03 January 2017 (76) (0.00) (200,000) EUR PUT/SEK CALL K=9.6717 04 January 2017 (2,130) (0.00)
(200,000) EUR CALL/NOK PUT K=9.2804 03 January 2017 (69) (0.00) (200,000) EUR PUT/SEK CALL K=9.6725 03 January 2017 (2,138) (0.00)
(100,000) EUR CALL/SEK PUT K=9.7749 19 January 2017 (96) (0.00) (200,000) EUR PUT/SEK CALL K=9.6759 18 January 2017 (2,606) (0.00)
(200,000) EUR CALL/SEK PUT K=9.8375 11 January 2017 (52) (0.00) (200,000) EUR PUT/SEK CALL K=9.6949 04 January 2017 (2,639) (0.00)
(200,000) EUR CALL/SEK PUT K=9.8492 19 January 2017 (91) (0.00) (117,926) (0.09)
(200,000) EUR CALL/SEK PUT K=9.8601 13 January 2017 (50) (0.00)
(200,000) EUR CALL/SEK PUT K=9.8684 13 January 2017 (47) (0.00) GermanyGermanyGermanyGermany
(200,000) EUR CALL/SEK PUT K=9.8721 13 January 2017 (46) (0.00) (2) Call on 11,750 DAX Index 17 March 2017 (2,311) (0.00)
(200,000) EUR CALL/SEK PUT K=9.8794 17 January 2017 (62) (0.00) (1) Call on 11,800 DAX Index 17 March 2017 (1,046) (0.00)
(200,000) EUR CALL/SEK PUT K=9.8931 03 January 2017 (12) (0.00) (2) Call on 11,850 DAX Index 17 March 2017 (1,888) (0.00)
(200,000) EUR CALL/SEK PUT K=9.897 10 January 2017 (40) (0.00) (1) Call on 11,900 DAX Index 17 March 2017 (847) (0.00)
(200,000) EUR CALL/SEK PUT K=9.8996 04 January 2017 (26) (0.00) (3) Call on 12,000 DAX Index 17 March 2017 (2,025) (0.00)
(200,000) EUR CALL/SEK PUT K=9.9059 03 January 2017 (9) (0.00) (1) Call on 12,150 DAX Index 17 March 2017 (465) (0.00)
(200,000) EUR CALL/SEK PUT K=9.9126 03 January 2017 (8) (0.00) (1) Call on 12,250 DAX Index 17 March 2017 (357) (0.00)
(200,000) EUR CALL/SEK PUT K=9.9176 19 January 2017 (59) (0.00) (1) Call on 12,300 DAX Index 17 March 2017 (311) (0.00)
(200,000) EUR CALL/SEK PUT K=9.9324 03 January 2017 (5) (0.00) (1) Call on 133.25 EURO-BOBL 27 January 2017 (574) (0.00)
(200,000) EUR CALL/SEK PUT K=9.9326 04 January 2017 (16) (0.00) (3) Call on 133.50 EURO-BOBL 27 January 2017 (1,186) (0.00)
(200,000) EUR CALL/SEK PUT K=9.9338 03 January 2017 (5) (0.00) (18) Call on 133.75 EURO-BOBL 27 January 2017 (4,650) (0.00)
(200,000) EUR CALL/SEK PUT K=9.937 18 January 2017 (49) (0.00) (2) Call on 134.25 EURO-BOBL 27 January 2017 (158) (0.00)
(200,000) EUR CALL/SEK PUT K=9.9428 03 January 2017 (5) (0.00) (34) Call on 163.50 EURO-BUND 27 January 2017 (49,847) (0.04)
(200,000) EUR CALL/SEK PUT K=9.9587 03 January 2017 (5) (0.00) (20) Call on 164 EURO-BUND 27 January 2017 (22,994) (0.02)
(200,000) EUR CALL/SEK PUT K=9.9633 03 January 2017 (5) (0.00) (38) Call on 164.50 EURO-BUND 27 January 2017 (32,866) (0.03)
(200,000) EUR CALL/SEK PUT K=9.967 04 January 2017 (9) (0.00) (18) Call on 165 EURO-BUND 27 January 2017 (11,391) (0.01)
(200,000) EUR CALL/SEK PUT K=9.9683 04 January 2017 (8) (0.00) (11) Call on 3,275 SX5E Index 20 January 2017 (6,416) (0.01)
(200,000) EUR PUT/GBP CALL K=0.821 17 January 2017 (83) (0.00) (16) Call on 3,300 SX5E Index 20 January 2017 (7,071) (0.01)
(600,000) EUR PUT/GBP CALL K=0.8224 19 January 2017 (390) (0.00) (28) Call on 3,325 SX5E Index 20 January 2017 (9,067) (0.01)
(500,000) EUR PUT/GBP CALL K=0.8247 18 January 2017 (354) (0.00) (24) Call on 3,350 SX5E Index 20 January 2017 (5,493) (0.00)
246

Man Funds VI PlcSchedule of Investments as at 31 December 2016 (continued)Man AHL Multi Strategy Alternative (continued)
Financial liabilities at fair value through profit or loss (continued)Financial liabilities at fair value through profit or loss (continued)Financial liabilities at fair value through profit or loss (continued)Financial liabilities at fair value through profit or loss (continued)
Fair Fair Fair Fair % of% of% of% of Fair Fair Fair Fair % of% of% of% of
Value Value Value Value NetNetNetNet Value Value Value Value NetNetNetNet
Nominal Nominal Nominal Nominal DescriptionDescriptionDescriptionDescription US$ US$ US$ US$ AssetsAssetsAssetsAssets Nominal Nominal Nominal Nominal DescriptionDescriptionDescriptionDescription US$ US$ US$ US$ AssetsAssetsAssetsAssets
Options (continued)Options (continued)Options (continued)Options (continued) Options (continued)Options (continued)Options (continued)Options (continued)
Germany (continued)Germany (continued)Germany (continued)Germany (continued) Taiwan (continued)Taiwan (continued)Taiwan (continued)Taiwan (continued)
(20) Call on 3,375 SX5E Index 20 January 2017 (3,101) (0.00) (17) Put on 9,100 TWSE Index 18 January 2017 (1,042) (0.00)
(34) Call on 3,400 SX5E Index 20 January 2017 (3,479) (0.00) (15) Put on 9,200 TWSE Index 18 January 2017 (1,582) (0.00)
(1) Put on 10,350 DAX Index 17 March 2017 (530) (0.00) (13) Put on 9,300 TWSE Index 18 January 2017 (2,239) (0.00)
(1) Put on 10,400 DAX Index 17 March 2017 (561) (0.00) (9,974) (0.01)
(3) Put on 10,450 DAX Index 17 March 2017 (1,778) (0.00)
(1) Put on 10,500 DAX Index 17 March 2017 (627) (0.00) United KingdomUnited KingdomUnited KingdomUnited Kingdom
(2) Put on 10,550 DAX Index 17 March 2017 (1,325) (0.00) (3) Call on 6,975 UKX Index 17 March 2017 (8,118) (0.01)
(1) Put on 10,600 DAX Index 17 March 2017 (701) (0.00) (1) Call on 7,025 UKX Index 17 March 2017 (2,317) (0.00)
(1) Put on 10,650 DAX Index 17 March 2017 (741) (0.00) (3) Call on 7,050 UKX Index 17 March 2017 (6,395) (0.01)
(2) Put on 10,750 DAX Index 17 March 2017 (1,660) (0.00) (5) Call on 7,075 UKX Index 17 March 2017 (9,793) (0.01)
(3) Put on 132 EURO-BOBL 27 January 2017 (63) (0.00) (5) Call on 7,100 UKX Index 17 March 2017 (8,928) (0.01)
(1) Put on 132.25 EURO-BOBL 27 January 2017 (32) (0.00) (3) Call on 7,150 UKX Index 17 March 2017 (4,411) (0.00)
(18) Put on 132.50 EURO-BOBL 27 January 2017 (854) (0.00) (2) Call on 7,200 UKX Index 17 March 2017 (2,385) (0.00)
(4) Put on 132.75 EURO-BOBL 27 January 2017 (295) (0.00) (5) Call on 7,250 UKX Index 17 March 2017 (4,757) (0.00)
(4) Put on 133 EURO-BOBL 27 January 2017 (443) (0.00) (7) Call on 7,300 UKX Index 17 March 2017 (5,190) (0.00)
(38) Put on 158 EURO-BUND 27 January 2017 (1,202) (0.00) (5) Call on 7,350 UKX Index 17 March 2017 (2,811) (0.00)
(34) Put on 158.50 EURO-BUND 27 January 2017 (1,434) (0.00) (5) Call on 7,400 UKX Index 17 March 2017 (2,101) (0.00)
(20) Put on 160 EURO-BUND 27 January 2017 (2,531) (0.00) (2) Call on 71.25 UKX Index 17 March 2017 (3,250) (0.00)
(18) Put on 160.50 EURO-BUND 27 January 2017 (3,038) (0.00) (1) Put on 6,300 UKX Index 17 March 2017 (389) (0.00)
(16) Put on 3,075 SX5E Index 20 January 2017 (1,046) (0.00) (5) Put on 6,350 UKX Index 17 March 2017 (2,162) (0.00)
(11) Put on 3,100 SX5E Index 20 January 2017 (917) (0.00) (7) Put on 6,375 UKX Index 17 March 2017 (3,200) (0.00)
(31) Put on 3,125 SX5E Index 20 January 2017 (3,302) (0.00) (5) Put on 6,400 UKX Index 17 March 2017 (2,410) (0.00)
(20) Put on 3,150 SX5E Index 20 January 2017 (2,742) (0.00) (4) Put on 6,425 UKX Index 17 March 2017 (2,026) (0.00)
(19) Put on 3,175 SX5E Index 20 January 2017 (3,387) (0.00) (5) Put on 6,475 UKX Index 17 March 2017 (2,842) (0.00)
(18) Put on 3,200 SX5E Index 20 January 2017 (4,139) (0.00) (3) Put on 6,480 UKX Index 17 March 2017 (1,724) (0.00)
(15) Put on 3,225 SX5E Index 20 January 2017 (4,430) (0.00) (4) Put on 6,500 UKX Index 17 March 2017 (2,397) (0.00)
(15) Put on 3,250 SX5E Index 20 January 2017 (5,648) (0.00) (2) Put on 6,550 UKX Index 17 March 2017 (1,335) (0.00)
(210,969) (0.16) (5) Put on 6,600 UKX Index 17 March 2017 (3,738) (0.00)
(5) Put on 6,725 UKX Index 17 March 2017 (4,943) (0.00)
Hong KongHong KongHong KongHong Kong (3) Put on 6,850 UKX Index 17 March 2017 (3,966) (0.00)
(3) Call on 10,200 HSCEI Index 26 January 2017 (213) (0.00) (3) Put on 6,950 UKX Index 17 March 2017 (5,041) (0.00)
(3) Call on 10,400 HSCEI Index 26 January 2017 (77) (0.00) (2) Put on 64.50 UKX Index 17 March 2017 (1,075) (0.00)
(1) Call on 23,200 HSI Index 26 January 2017 (168) (0.00) (97,704) (0.08)
(4) Call on 23,400 HSI Index 26 January 2017 (335) (0.00)
(3) Put on 9,200 HSCEI Index 26 January 2017 (2,534) (0.00) United StatesUnited StatesUnited StatesUnited States
(3) Put on 9,400 HSCEI Index 26 January 2017 (4,102) (0.00) (147,560) AUD CALL/USD PUT K=0.7378 19 January 2017 (455) (0.00)
(7,429) (0.01) (148,400) AUD CALL/USD PUT K=0.742 19 January 2017 (297) (0.00)
(974,480) AUD CALL/USD PUT K=0.7496 18 January 2017 (919) (0.00)
JapanJapanJapanJapan (978,770) AUD CALL/USD PUT K=0.7529 17 January 2017 (672) (0.00)
(1) Call on 18,625 NKY Index 13 January 2017 (5,144) (0.00) (984,750) AUD CALL/USD PUT K=0.7575 03 January 2017 (45) (0.00)
(2) Call on 18,750 NKY Index 13 January 2017 (8,574) (0.01) (76,110) AUD CALL/USD PUT K=0.7611 03 January 2017 (4) (0.00)
(1) Call on 18,875 NKY Index 13 January 2017 (3,472) (0.00) (990,340) AUD CALL/USD PUT K=0.7618 03 January 2017 (46) (0.00)
(2) Call on 19,000 NKY Index 13 January 2017 (5,487) (0.00) (915,360) AUD CALL/USD PUT K=0.7628 13 January 2017 (358) (0.00)
(2) Call on 19,125 NKY Index 13 January 2017 (4,115) (0.00) (142,020) AUD PUT/USD CALL K=0.7101 19 January 2017 (551) (0.00)
(1) Call on 19,250 NKY Index 13 January 2017 (1,500) (0.00) (142,380) AUD PUT/USD CALL K=0.7119 19 January 2017 (631) (0.00)
(3) Call on 19,500 NKY Index 13 January 2017 (2,186) (0.00) (935,220) AUD PUT/USD CALL K=0.7194 18 January 2017 (6,674) (0.01)
(3) Call on 19,625 NKY Index 13 January 2017 (1,415) (0.00) (940,940) AUD PUT/USD CALL K=0.7238 17 January 2017 (8,707) (0.01)
(3) Put on 16,875 NKY Index 13 January 2017 (257) (0.00) (945,230) AUD PUT/USD CALL K=0.7271 03 January 2017 (5,292) (0.00)
(3) Put on 17,000 NKY Index 13 January 2017 (309) (0.00) (72,980) AUD PUT/USD CALL K=0.7298 03 January 2017 (625) (0.00)
(1) Put on 17,250 NKY Index 13 January 2017 (137) (0.00) (882,360) AUD PUT/USD CALL K=0.7353 13 January 2017 (15,738) (0.01)
(1) Put on 17,375 NKY Index 13 January 2017 (154) (0.00) (949,000) AUD PUT/USD CALL K=0.73 03 January 2017 (8,383) (0.01)
(2) Put on 17,500 NKY Index 13 January 2017 (377) (0.00) (2) Call on 1.08 EURO FX Currency 03 March 2017 (2,225) (0.00)
(1) Put on 17,625 NKY Index 13 January 2017 (231) (0.00) (29) Call on 117.75 United States 5 Years Futures 27 January 2017 (10,422) (0.01)
(2) Put on 18,125 NKY Index 13 January 2017 (943) (0.00) (6) Call on 118.25 United States 5 Years Futures 27 January 2017 (984) (0.00)
(1) Put on 18,500 NKY Index 13 January 2017 (815) (0.00) (49) Call on 118.50 United States 5 Years Futures 27 January 2017 (5,359) (0.00)
(35,116) (0.03) (61) Call on 118.75 United States 5 Years Futures 27 January 2017 (4,289) (0.00)
(71) Call on 119 United States 5 Years Futures 27 January 2017 (2,773) (0.00)
South KoreaSouth KoreaSouth KoreaSouth Korea (5) Call on 123.50 United States 10 Years Futures 27 January 2017 (5,781) (0.00)
(1) Call on 250 KOSPI2 Index 12 January 2017 (4,057) (0.00) (4) Call on 124 United States 10 Years Futures 27 January 2017 (3,313) (0.00)
(4) Call on 252.50 KOSPI2 Index 12 January 2017 (12,138) (0.01) (11) Call on 124.50 United States 10 Years Futures 27 January 2017 (6,188) (0.00)
(6) Call on 255 KOSPI2 Index 12 January 2017 (12,792) (0.01) (14) Call on 125 United States 10 Years Futures 27 January 2017 (5,031) (0.00)
(7) Call on 257.50 KOSPI2 Index 12 January 2017 (9,360) (0.01) (20) Call on 125.50 United States 10 Years Futures 27 January 2017 (4,688) (0.00)
(13) Call on 260 KOSPI2 Index 12 January 2017 (9,364) (0.01) (25) Call on 126 United States 10 Years Futures 27 January 2017 (3,516) (0.00)
(18) Call on 262.50 KOSPI2 Index 12 January 2017 (5,812) (0.00) (37) Call on 127 United States 10 Years Futures 27 January 2017 (2,313) (0.00)
(19) Call on 265 KOSPI2 Index 12 January 2017 (2,281) (0.00) (4) Call on 149 United States Bond Futures 27 January 2017 (10,625) (0.01)
(10) Call on 267.50 KOSPI2 Index 12 January 2017 (373) (0.00) (3) Call on 150 United States Bond Futures 27 January 2017 (6,094) (0.00)
(10) Put on 235 KOSPI2 Index 12 January 2017 (124) (0.00) (5) Call on 151 United States Bond Futures 27 January 2017 (7,500) (0.01)
(9) Put on 237.50 KOSPI2 Index 12 January 2017 (149) (0.00) (8) Call on 152 United States Bond Futures 27 January 2017 (8,625) (0.01)
(7) Put on 240 KOSPI2 Index 12 January 2017 (145) (0.00) (9) Call on 153 United States Bond Futures 27 January 2017 (6,750) (0.01)
(12) Put on 245 KOSPI2 Index 12 January 2017 (497) (0.00) (3) Call on 154 United States Bond Futures 27 January 2017 (1,500) (0.00)
(19) Put on 247.50 KOSPI2 Index 12 January 2017 (1,180) (0.00) (5) Call on 155 United States Bond Futures 27 January 2017 (1,719) (0.00)
(15) Put on 250 KOSPI2 Index 12 January 2017 (1,490) (0.00) (16) Call on 2,250 S&P E-mini Index 20 January 2017 (13,600) (0.01)
(12) Put on 252.50 KOSPI2 Index 12 January 2017 (1,987) (0.00) (14) Call on 2,255 S&P E-mini Index 20 January 2017 (10,150) (0.01)
(8) Put on 255 KOSPI2 Index 12 January 2017 (2,418) (0.00) (9) Call on 2,260 S&P E-mini Index 20 January 2017 (5,625) (0.00)
(5) Put on 257.50 KOSPI2 Index 12 January 2017 (2,691) (0.00) (3) Call on 2,310 S&P E-mini Index 20 January 2017 (270) (0.00)
(6) Put on 42.50 KOSPI2 Index 12 January 2017 (174) (0.00) (1) Call on 4,900 NDX Index 20 January 2017 (4,850) (0.00)
(67,032) (0.05) (1) Call on 4,925 NDX Index 20 January 2017 (3,567) (0.00)
(1) Call on 4,950 NDX Index 20 January 2017 (2,670) (0.00)
TaiwanTaiwanTaiwanTaiwan (1) Call on 4,975 NDX Index 20 January 2017 (2,040) (0.00)
(6) Call on 9,300 TWSE Index 18 January 2017 (689) (0.00) (1) Call on 5,000 NDX Index 20 January 2017 (1,225) (0.00)
(27) Call on 9,400 TWSE Index 18 January 2017 (1,508) (0.00) (1) Call on 5,025 NDX Index 20 January 2017 (950) (0.00)
(32) Call on 9,500 TWSE Index 18 January 2017 (745) (0.00) (1) Call on 5,050 NDX Index 20 January 2017 (570) (0.00)
(42) Call on 9,600 TWSE Index 18 January 2017 (371) (0.00) (1) Call on 5,075 NDX Index 20 January 2017 (360) (0.00)
(25) Call on 9,700 TWSE Index 18 January 2017 (74) (0.00) (1) Call on 5,100 NDX Index 20 January 2017 (257) (0.00)
(15) Call on 9,800 TWSE Index 18 January 2017 (26) (0.00) (1) Call on 5,125 NDX Index 20 January 2017 (130) (0.00)
(11) Put on 8,700 TWSE Index 18 January 2017 (92) (0.00) (2) Call on 5,150 NDX Index 20 January 2017 (210) (0.00)
(28) Put on 8,800 TWSE Index 18 January 2017 (378) (0.00) (324,420) EUR CALL/USD PUT K=1.0814 13 January 2017 (473) (0.00)
(24) Put on 8,900 TWSE Index 18 January 2017 (521) (0.00) (216,360) EUR CALL/USD PUT K=1.0818 11 January 2017 (241) (0.00)
(19) Put on 9,000 TWSE Index 18 January 2017 (707) (0.00) (324,570) EUR CALL/USD PUT K=1.0819 13 January 2017 (455) (0.00)
247
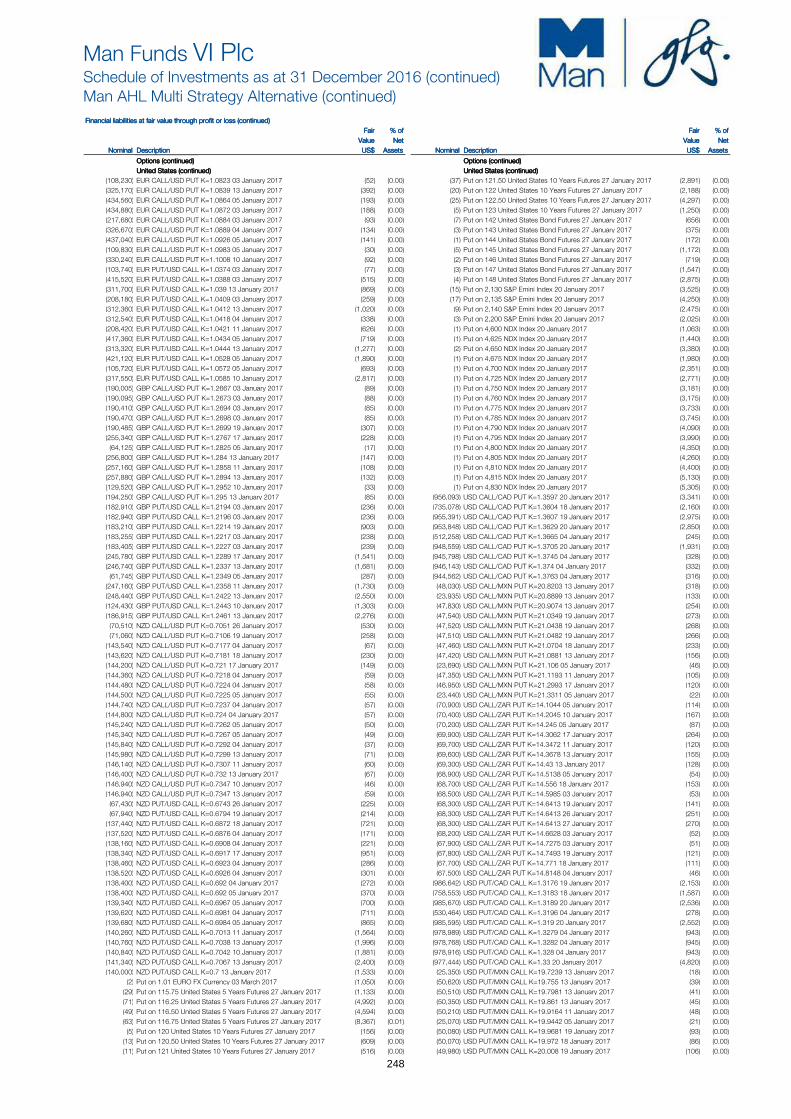
Man Funds VI PlcSchedule of Investments as at 31 December 2016 (continued)Man AHL Multi Strategy Alternative (continued)
Financial liabilities at fair value through profit or loss (continued)Financial liabilities at fair value through profit or loss (continued)Financial liabilities at fair value through profit or loss (continued)Financial liabilities at fair value through profit or loss (continued)
Fair Fair Fair Fair % of% of% of% of Fair Fair Fair Fair % of% of% of% of
Value Value Value Value NetNetNetNet Value Value Value Value NetNetNetNet
Nominal Nominal Nominal Nominal DescriptionDescriptionDescriptionDescription US$ US$ US$ US$ AssetsAssetsAssetsAssets Nominal Nominal Nominal Nominal DescriptionDescriptionDescriptionDescription US$ US$ US$ US$ AssetsAssetsAssetsAssets
Options (continued)Options (continued)Options (continued)Options (continued) Options (continued)Options (continued)Options (continued)Options (continued)
United States (continued)United States (continued)United States (continued)United States (continued) United States (continued)United States (continued)United States (continued)United States (continued)
(108,230) EUR CALL/USD PUT K=1.0823 03 January 2017 (52) (0.00) (37) Put on 121.50 United States 10 Years Futures 27 January 2017 (2,891) (0.00)
(325,170) EUR CALL/USD PUT K=1.0839 13 January 2017 (392) (0.00) (20) Put on 122 United States 10 Years Futures 27 January 2017 (2,188) (0.00)
(434,560) EUR CALL/USD PUT K=1.0864 05 January 2017 (193) (0.00) (25) Put on 122.50 United States 10 Years Futures 27 January 2017 (4,297) (0.00)
(434,880) EUR CALL/USD PUT K=1.0872 03 January 2017 (188) (0.00) (5) Put on 123 United States 10 Years Futures 27 January 2017 (1,250) (0.00)
(217,680) EUR CALL/USD PUT K=1.0884 03 January 2017 (93) (0.00) (7) Put on 142 United States Bond Futures 27 January 2017 (656) (0.00)
(326,670) EUR CALL/USD PUT K=1.0889 04 January 2017 (134) (0.00) (3) Put on 143 United States Bond Futures 27 January 2017 (375) (0.00)
(437,040) EUR CALL/USD PUT K=1.0926 05 January 2017 (141) (0.00) (1) Put on 144 United States Bond Futures 27 January 2017 (172) (0.00)
(109,830) EUR CALL/USD PUT K=1.0983 05 January 2017 (30) (0.00) (5) Put on 145 United States Bond Futures 27 January 2017 (1,172) (0.00)
(330,240) EUR CALL/USD PUT K=1.1008 10 January 2017 (92) (0.00) (2) Put on 146 United States Bond Futures 27 January 2017 (719) (0.00)
(103,740) EUR PUT/USD CALL K=1.0374 03 January 2017 (77) (0.00) (3) Put on 147 United States Bond Futures 27 January 2017 (1,547) (0.00)
(415,520) EUR PUT/USD CALL K=1.0388 03 January 2017 (515) (0.00) (4) Put on 148 United States Bond Futures 27 January 2017 (2,875) (0.00)
(311,700) EUR PUT/USD CALL K=1.039 13 January 2017 (869) (0.00) (15) Put on 2,130 S&P Emini Index 20 January 2017 (3,525) (0.00)
(208,180) EUR PUT/USD CALL K=1.0409 03 January 2017 (259) (0.00) (17) Put on 2,135 S&P Emini Index 20 January 2017 (4,250) (0.00)
(312,360) EUR PUT/USD CALL K=1.0412 13 January 2017 (1,020) (0.00) (9) Put on 2,140 S&P Emini Index 20 January 2017 (2,475) (0.00)
(312,540) EUR PUT/USD CALL K=1.0418 04 January 2017 (338) (0.00) (3) Put on 2,200 S&P Emini Index 20 January 2017 (2,025) (0.00)
(208,420) EUR PUT/USD CALL K=1.0421 11 January 2017 (626) (0.00) (1) Put on 4,600 NDX Index 20 January 2017 (1,063) (0.00)
(417,360) EUR PUT/USD CALL K=1.0434 05 January 2017 (719) (0.00) (1) Put on 4,625 NDX Index 20 January 2017 (1,440) (0.00)
(313,320) EUR PUT/USD CALL K=1.0444 13 January 2017 (1,277) (0.00) (2) Put on 4,650 NDX Index 20 January 2017 (3,380) (0.00)
(421,120) EUR PUT/USD CALL K=1.0528 05 January 2017 (1,890) (0.00) (1) Put on 4,675 NDX Index 20 January 2017 (1,980) (0.00)
(105,720) EUR PUT/USD CALL K=1.0572 05 January 2017 (693) (0.00) (1) Put on 4,700 NDX Index 20 January 2017 (2,351) (0.00)
(317,550) EUR PUT/USD CALL K=1.0585 10 January 2017 (2,817) (0.00) (1) Put on 4,725 NDX Index 20 January 2017 (2,771) (0.00)
(190,005) GBP CALL/USD PUT K=1.2667 03 January 2017 (89) (0.00) (1) Put on 4,750 NDX Index 20 January 2017 (3,181) (0.00)
(190,095) GBP CALL/USD PUT K=1.2673 03 January 2017 (88) (0.00) (1) Put on 4,760 NDX Index 20 January 2017 (3,175) (0.00)
(190,410) GBP CALL/USD PUT K=1.2694 03 January 2017 (85) (0.00) (1) Put on 4,775 NDX Index 20 January 2017 (3,733) (0.00)
(190,470) GBP CALL/USD PUT K=1.2698 03 January 2017 (85) (0.00) (1) Put on 4,785 NDX Index 20 January 2017 (3,745) (0.00)
(190,485) GBP CALL/USD PUT K=1.2699 19 January 2017 (307) (0.00) (1) Put on 4,790 NDX Index 20 January 2017 (4,090) (0.00)
(255,340) GBP CALL/USD PUT K=1.2767 17 January 2017 (228) (0.00) (1) Put on 4,795 NDX Index 20 January 2017 (3,990) (0.00)
(64,125) GBP CALL/USD PUT K=1.2825 05 January 2017 (17) (0.00) (1) Put on 4,800 NDX Index 20 January 2017 (4,350) (0.00)
(256,800) GBP CALL/USD PUT K=1.284 13 January 2017 (147) (0.00) (1) Put on 4,805 NDX Index 20 January 2017 (4,260) (0.00)
(257,160) GBP CALL/USD PUT K=1.2858 11 January 2017 (108) (0.00) (1) Put on 4,810 NDX Index 20 January 2017 (4,400) (0.00)
(257,880) GBP CALL/USD PUT K=1.2894 13 January 2017 (132) (0.00) (1) Put on 4,815 NDX Index 20 January 2017 (5,130) (0.00)
(129,520) GBP CALL/USD PUT K=1.2952 10 January 2017 (33) (0.00) (1) Put on 4,830 NDX Index 20 January 2017 (5,305) (0.00)
(194,250) GBP CALL/USD PUT K=1.295 13 January 2017 (85) (0.00) (956,093) USD CALL/CAD PUT K=1.3597 20 January 2017 (3,341) (0.00)
(182,910) GBP PUT/USD CALL K=1.2194 03 January 2017 (236) (0.00) (735,078) USD CALL/CAD PUT K=1.3604 18 January 2017 (2,160) (0.00)
(182,940) GBP PUT/USD CALL K=1.2196 03 January 2017 (236) (0.00) (955,391) USD CALL/CAD PUT K=1.3607 19 January 2017 (2,975) (0.00)
(183,210) GBP PUT/USD CALL K=1.2214 19 January 2017 (903) (0.00) (953,848) USD CALL/CAD PUT K=1.3629 20 January 2017 (2,850) (0.00)
(183,255) GBP PUT/USD CALL K=1.2217 03 January 2017 (238) (0.00) (512,258) USD CALL/CAD PUT K=1.3665 04 January 2017 (245) (0.00)
(183,405) GBP PUT/USD CALL K=1.2227 03 January 2017 (239) (0.00) (948,559) USD CALL/CAD PUT K=1.3705 20 January 2017 (1,931) (0.00)
(245,780) GBP PUT/USD CALL K=1.2289 17 January 2017 (1,541) (0.00) (945,798) USD CALL/CAD PUT K=1.3745 04 January 2017 (328) (0.00)
(246,740) GBP PUT/USD CALL K=1.2337 13 January 2017 (1,681) (0.00) (946,143) USD CALL/CAD PUT K=1.374 04 January 2017 (332) (0.00)
(61,745) GBP PUT/USD CALL K=1.2349 05 January 2017 (287) (0.00) (944,562) USD CALL/CAD PUT K=1.3763 04 January 2017 (316) (0.00)
(247,160) GBP PUT/USD CALL K=1.2358 11 January 2017 (1,730) (0.00) (48,030) USD CALL/MXN PUT K=20.8203 13 January 2017 (318) (0.00)
(248,440) GBP PUT/USD CALL K=1.2422 13 January 2017 (2,550) (0.00) (23,935) USD CALL/MXN PUT K=20.8899 13 January 2017 (133) (0.00)
(124,430) GBP PUT/USD CALL K=1.2443 10 January 2017 (1,303) (0.00) (47,830) USD CALL/MXN PUT K=20.9074 13 January 2017 (254) (0.00)
(186,915) GBP PUT/USD CALL K=1.2461 13 January 2017 (2,276) (0.00) (47,540) USD CALL/MXN PUT K=21.0349 19 January 2017 (273) (0.00)
(70,510) NZD CALL/USD PUT K=0.7051 26 January 2017 (530) (0.00) (47,520) USD CALL/MXN PUT K=21.0438 19 January 2017 (268) (0.00)
(71,060) NZD CALL/USD PUT K=0.7106 19 January 2017 (258) (0.00) (47,510) USD CALL/MXN PUT K=21.0482 19 January 2017 (266) (0.00)
(143,540) NZD CALL/USD PUT K=0.7177 04 January 2017 (67) (0.00) (47,460) USD CALL/MXN PUT K=21.0704 18 January 2017 (233) (0.00)
(143,620) NZD CALL/USD PUT K=0.7181 18 January 2017 (230) (0.00) (47,420) USD CALL/MXN PUT K=21.0881 13 January 2017 (156) (0.00)
(144,200) NZD CALL/USD PUT K=0.721 17 January 2017 (149) (0.00) (23,690) USD CALL/MXN PUT K=21.106 05 January 2017 (46) (0.00)
(144,360) NZD CALL/USD PUT K=0.7218 04 January 2017 (59) (0.00) (47,350) USD CALL/MXN PUT K=21.1193 11 January 2017 (105) (0.00)
(144,480) NZD CALL/USD PUT K=0.7224 04 January 2017 (58) (0.00) (46,950) USD CALL/MXN PUT K=21.2993 17 January 2017 (120) (0.00)
(144,500) NZD CALL/USD PUT K=0.7225 05 January 2017 (55) (0.00) (23,440) USD CALL/MXN PUT K=21.3311 05 January 2017 (22) (0.00)
(144,740) NZD CALL/USD PUT K=0.7237 04 January 2017 (57) (0.00) (70,900) USD CALL/ZAR PUT K=14.1044 05 January 2017 (114) (0.00)
(144,800) NZD CALL/USD PUT K=0.724 04 January 2017 (57) (0.00) (70,400) USD CALL/ZAR PUT K=14.2045 10 January 2017 (167) (0.00)
(145,240) NZD CALL/USD PUT K=0.7262 05 January 2017 (50) (0.00) (70,200) USD CALL/ZAR PUT K=14.245 05 January 2017 (87) (0.00)
(145,340) NZD CALL/USD PUT K=0.7267 05 January 2017 (49) (0.00) (69,900) USD CALL/ZAR PUT K=14.3062 17 January 2017 (264) (0.00)
(145,840) NZD CALL/USD PUT K=0.7292 04 January 2017 (37) (0.00) (69,700) USD CALL/ZAR PUT K=14.3472 11 January 2017 (120) (0.00)
(145,980) NZD CALL/USD PUT K=0.7299 13 January 2017 (71) (0.00) (69,600) USD CALL/ZAR PUT K=14.3678 13 January 2017 (155) (0.00)
(146,140) NZD CALL/USD PUT K=0.7307 11 January 2017 (60) (0.00) (69,300) USD CALL/ZAR PUT K=14.43 13 January 2017 (128) (0.00)
(146,400) NZD CALL/USD PUT K=0.732 13 January 2017 (67) (0.00) (68,900) USD CALL/ZAR PUT K=14.5138 05 January 2017 (54) (0.00)
(146,940) NZD CALL/USD PUT K=0.7347 10 January 2017 (46) (0.00) (68,700) USD CALL/ZAR PUT K=14.556 18 January 2017 (153) (0.00)
(146,940) NZD CALL/USD PUT K=0.7347 13 January 2017 (59) (0.00) (68,500) USD CALL/ZAR PUT K=14.5985 03 January 2017 (53) (0.00)
(67,430) NZD PUT/USD CALL K=0.6743 26 January 2017 (225) (0.00) (68,300) USD CALL/ZAR PUT K=14.6413 19 January 2017 (141) (0.00)
(67,940) NZD PUT/USD CALL K=0.6794 19 January 2017 (214) (0.00) (68,300) USD CALL/ZAR PUT K=14.6413 26 January 2017 (251) (0.00)
(137,440) NZD PUT/USD CALL K=0.6872 18 January 2017 (721) (0.00) (68,300) USD CALL/ZAR PUT K=14.6413 27 January 2017 (270) (0.00)
(137,520) NZD PUT/USD CALL K=0.6876 04 January 2017 (171) (0.00) (68,200) USD CALL/ZAR PUT K=14.6628 03 January 2017 (52) (0.00)
(138,160) NZD PUT/USD CALL K=0.6908 04 January 2017 (221) (0.00) (67,900) USD CALL/ZAR PUT K=14.7275 03 January 2017 (51) (0.00)
(138,340) NZD PUT/USD CALL K=0.6917 17 January 2017 (951) (0.00) (67,800) USD CALL/ZAR PUT K=14.7493 19 January 2017 (121) (0.00)
(138,460) NZD PUT/USD CALL K=0.6923 04 January 2017 (286) (0.00) (67,700) USD CALL/ZAR PUT K=14.771 18 January 2017 (111) (0.00)
(138,520) NZD PUT/USD CALL K=0.6926 04 January 2017 (301) (0.00) (67,500) USD CALL/ZAR PUT K=14.8148 04 January 2017 (46) (0.00)
(138,400) NZD PUT/USD CALL K=0.692 04 January 2017 (272) (0.00) (986,642) USD PUT/CAD CALL K=1.3176 19 January 2017 (2,153) (0.00)
(138,400) NZD PUT/USD CALL K=0.692 05 January 2017 (370) (0.00) (758,553) USD PUT/CAD CALL K=1.3183 18 January 2017 (1,587) (0.00)
(139,340) NZD PUT/USD CALL K=0.6967 05 January 2017 (700) (0.00) (985,670) USD PUT/CAD CALL K=1.3189 20 January 2017 (2,536) (0.00)
(139,620) NZD PUT/USD CALL K=0.6981 04 January 2017 (711) (0.00) (530,464) USD PUT/CAD CALL K=1.3196 04 January 2017 (278) (0.00)
(139,680) NZD PUT/USD CALL K=0.6984 05 January 2017 (865) (0.00) (985,595) USD PUT/CAD CALL K=1.319 20 January 2017 (2,552) (0.00)
(140,260) NZD PUT/USD CALL K=0.7013 11 January 2017 (1,564) (0.00) (978,989) USD PUT/CAD CALL K=1.3279 04 January 2017 (943) (0.00)
(140,760) NZD PUT/USD CALL K=0.7038 13 January 2017 (1,996) (0.00) (978,768) USD PUT/CAD CALL K=1.3282 04 January 2017 (945) (0.00)
(140,840) NZD PUT/USD CALL K=0.7042 10 January 2017 (1,881) (0.00) (978,916) USD PUT/CAD CALL K=1.328 04 January 2017 (943) (0.00)
(141,340) NZD PUT/USD CALL K=0.7067 13 January 2017 (2,400) (0.00) (977,444) USD PUT/CAD CALL K=1.33 20 January 2017 (4,820) (0.00)
(140,000) NZD PUT/USD CALL K=0.7 13 January 2017 (1,533) (0.00) (25,350) USD PUT/MXN CALL K=19.7239 13 January 2017 (18) (0.00)
(2) Put on 1.01 EURO FX Currency 03 March 2017 (1,050) (0.00) (50,620) USD PUT/MXN CALL K=19.755 13 January 2017 (39) (0.00)
(29) Put on 115.75 United States 5 Years Futures 27 January 2017 (1,133) (0.00) (50,510) USD PUT/MXN CALL K=19.7981 13 January 2017 (41) (0.00)
(71) Put on 116.25 United States 5 Years Futures 27 January 2017 (4,992) (0.00) (50,350) USD PUT/MXN CALL K=19.861 13 January 2017 (45) (0.00)
(49) Put on 116.50 United States 5 Years Futures 27 January 2017 (4,594) (0.00) (50,210) USD PUT/MXN CALL K=19.9164 11 January 2017 (48) (0.00)
(63) Put on 116.75 United States 5 Years Futures 27 January 2017 (8,367) (0.01) (25,070) USD PUT/MXN CALL K=19.9442 05 January 2017 (21) (0.00)
(5) Put on 120 United States 10 Years Futures 27 January 2017 (156) (0.00) (50,080) USD PUT/MXN CALL K=19.9681 19 January 2017 (93) (0.00)
(13) Put on 120.50 United States 10 Years Futures 27 January 2017 (609) (0.00) (50,070) USD PUT/MXN CALL K=19.972 18 January 2017 (86) (0.00)
(11) Put on 121 United States 10 Years Futures 27 January 2017 (516) (0.00) (49,980) USD PUT/MXN CALL K=20.008 19 January 2017 (106) (0.00)
248
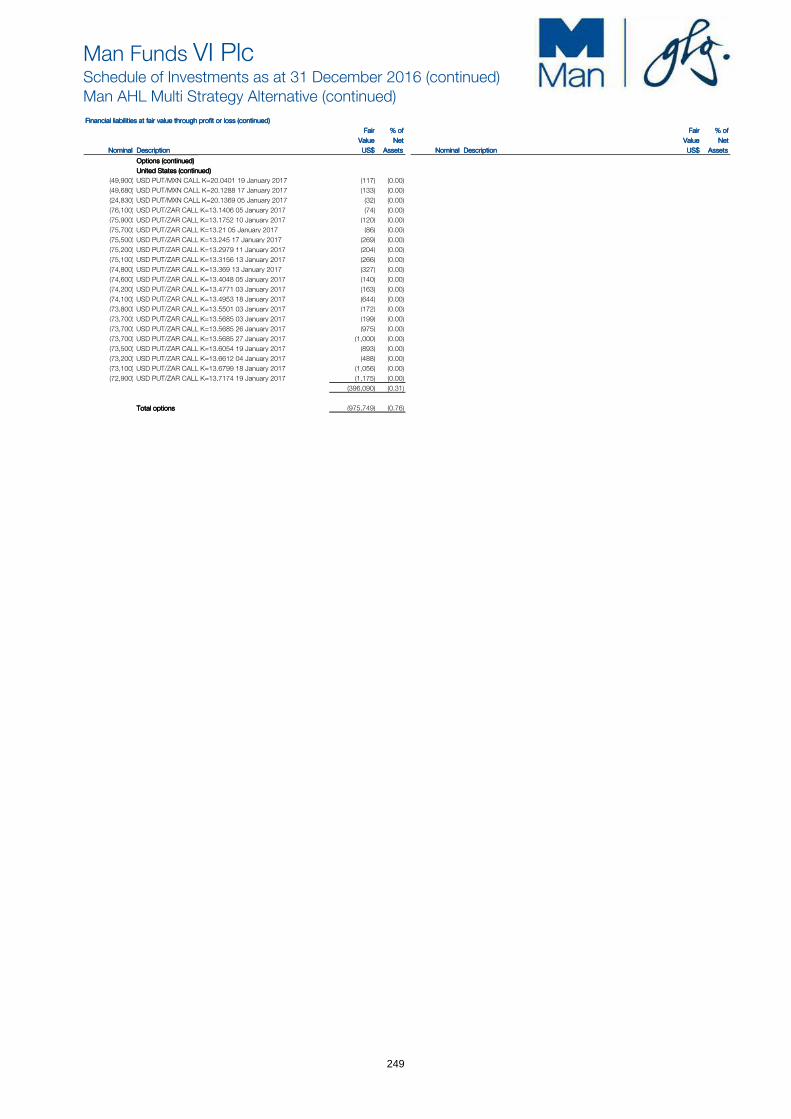
Man Funds VI PlcSchedule of Investments as at 31 December 2016 (continued)Man AHL Multi Strategy Alternative (continued)
Financial liabilities at fair value through profit or loss (continued)Financial liabilities at fair value through profit or loss (continued)Financial liabilities at fair value through profit or loss (continued)Financial liabilities at fair value through profit or loss (continued)
Fair Fair Fair Fair % of% of% of% of Fair Fair Fair Fair % of% of% of% of
Value Value Value Value NetNetNetNet Value Value Value Value NetNetNetNet
Nominal Nominal Nominal Nominal DescriptionDescriptionDescriptionDescription US$ US$ US$ US$ AssetsAssetsAssetsAssets Nominal Nominal Nominal Nominal DescriptionDescriptionDescriptionDescription US$ US$ US$ US$ AssetsAssetsAssetsAssets
Options (continued)Options (continued)Options (continued)Options (continued)
United States (continued)United States (continued)United States (continued)United States (continued)
(49,900) USD PUT/MXN CALL K=20.0401 19 January 2017 (117) (0.00)
(49,680) USD PUT/MXN CALL K=20.1288 17 January 2017 (133) (0.00)
(24,830) USD PUT/MXN CALL K=20.1369 05 January 2017 (32) (0.00)
(76,100) USD PUT/ZAR CALL K=13.1406 05 January 2017 (74) (0.00)
(75,900) USD PUT/ZAR CALL K=13.1752 10 January 2017 (120) (0.00)
(75,700) USD PUT/ZAR CALL K=13.21 05 January 2017 (86) (0.00)
(75,500) USD PUT/ZAR CALL K=13.245 17 January 2017 (269) (0.00)
(75,200) USD PUT/ZAR CALL K=13.2979 11 January 2017 (204) (0.00)
(75,100) USD PUT/ZAR CALL K=13.3156 13 January 2017 (266) (0.00)
(74,800) USD PUT/ZAR CALL K=13.369 13 January 2017 (327) (0.00)
(74,600) USD PUT/ZAR CALL K=13.4048 05 January 2017 (140) (0.00)
(74,200) USD PUT/ZAR CALL K=13.4771 03 January 2017 (163) (0.00)
(74,100) USD PUT/ZAR CALL K=13.4953 18 January 2017 (644) (0.00)
(73,800) USD PUT/ZAR CALL K=13.5501 03 January 2017 (172) (0.00)
(73,700) USD PUT/ZAR CALL K=13.5685 03 January 2017 (199) (0.00)
(73,700) USD PUT/ZAR CALL K=13.5685 26 January 2017 (975) (0.00)
(73,700) USD PUT/ZAR CALL K=13.5685 27 January 2017 (1,000) (0.00)
(73,500) USD PUT/ZAR CALL K=13.6054 19 January 2017 (893) (0.00)
(73,200) USD PUT/ZAR CALL K=13.6612 04 January 2017 (488) (0.00)
(73,100) USD PUT/ZAR CALL K=13.6799 18 January 2017 (1,056) (0.00)
(72,900) USD PUT/ZAR CALL K=13.7174 19 January 2017 (1,175) (0.00)
(396,090) (0.31)
Total optionsTotal optionsTotal optionsTotal options (975,749) (0.76)
249
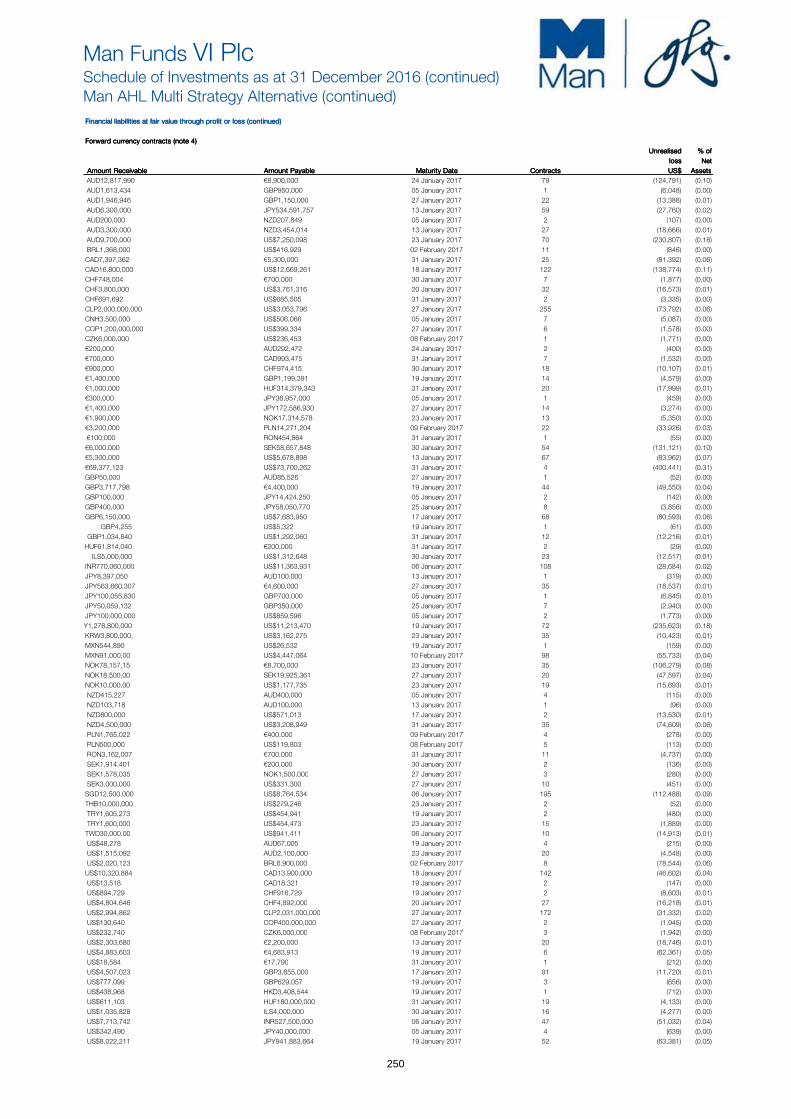
Man Funds VI PlcSchedule of Investments as at 31 December 2016 (continued)Man AHL Multi Strategy Alternative (continued)
Financial liabilities at fair value through profit or loss (continued)Financial liabilities at fair value through profit or loss (continued)Financial liabilities at fair value through profit or loss (continued)Financial liabilities at fair value through profit or loss (continued)
Forward currency contracts (note 4)Forward currency contracts (note 4)Forward currency contracts (note 4)Forward currency contracts (note 4)
Unrealised Unrealised Unrealised Unrealised % of% of% of% of
loss loss loss loss Net Net Net Net
Amount ReceivableAmount ReceivableAmount ReceivableAmount Receivable Amount PayableAmount PayableAmount PayableAmount Payable Maturity DateMaturity DateMaturity DateMaturity Date ContractsContractsContractsContracts US$ US$ US$ US$ AssetsAssetsAssetsAssets
AUD12,817,990 €8,900,000 24 January 2017 79 (124,791) (0.10)
AUD1,613,434 GBP950,000 05 January 2017 1 (6,048) (0.00)
AUD1,946,946 GBP1,150,000 27 January 2017 22 (13,388) (0.01)
AUD6,300,000 JPY534,591,757 13 January 2017 59 (27,760) (0.02)
AUD200,000 NZD207,849 05 January 2017 2 (107) (0.00)
AUD3,300,000 NZD3,454,014 13 January 2017 27 (18,666) (0.01)
AUD9,700,000 US$7,250,098 23 January 2017 70 (230,807) (0.18)
BRL1,368,000 US$416,929 02 February 2017 11 (846) (0.00)
CAD7,397,362 €5,300,000 31 January 2017 25 (81,392) (0.06)
CAD16,800,000 US$12,669,261 18 January 2017 122 (138,774) (0.11)
CHF748,004 €700,000 30 January 2017 7 (1,877) (0.00)
CHF3,800,000 US$3,761,316 20 January 2017 32 (16,573) (0.01)
CHF691,692 US$685,505 31 January 2017 2 (3,335) (0.00)
CLP2,000,000,000 US$3,053,796 27 January 2017 255 (73,792) (0.06)
CNH3,500,000 US$506,066 05 January 2017 7 (5,087) (0.00)
COP1,200,000,000 US$399,334 27 January 2017 6 (1,578) (0.00)
CZK6,000,000 US$236,453 08 February 2017 1 (1,771) (0.00)
€200,000 AUD292,472 24 January 2017 2 (400) (0.00)
€700,000 CAD993,475 31 January 2017 7 (1,532) (0.00)
€900,000 CHF974,415 30 January 2017 18 (10,107) (0.01)
€1,400,000 GBP1,199,391 19 January 2017 14 (4,579) (0.00)
€1,000,000 HUF314,379,343 31 January 2017 20 (17,999) (0.01)
€300,000 JPY36,957,000 05 January 2017 1 (459) (0.00)
€1,400,000 JPY172,586,930 27 January 2017 14 (3,274) (0.00)
€1,900,000 NOK17,314,578 23 January 2017 13 (5,350) (0.00)
€3,200,000 PLN14,271,204 09 February 2017 22 (33,926) (0.03)
€100,000 RON454,864 31 January 2017 1 (55) (0.00)
€6,000,000 SEK58,657,848 30 January 2017 54 (131,121) (0.10)
€5,300,000 US$5,678,898 13 January 2017 67 (83,962) (0.07)
€69,377,123 US$73,700,262 31 January 2017 4 (400,441) (0.31)
GBP50,000 AUD85,526 27 January 2017 1 (52) (0.00)
GBP3,717,798 €4,400,000 19 January 2017 44 (49,550) (0.04)
GBP100,000 JPY14,424,250 05 January 2017 2 (142) (0.00)
GBP400,000 JPY58,050,770 25 January 2017 8 (3,856) (0.00)
GBP6,150,000 US$7,683,950 17 January 2017 68 (80,593) (0.06)
GBP4,255 US$5,322 19 January 2017 1 (61) (0.00)
GBP1,034,840 US$1,292,060 31 January 2017 12 (12,216) (0.01)
HUF61,814,040 €200,000 31 January 2017 2 (29) (0.00)
ILS5,000,000 US$1,312,648 30 January 2017 23 (12,517) (0.01)
INR770,060,000 US$11,363,931 06 January 2017 108 (28,684) (0.02)
JPY8,397,050 AUD100,000 13 January 2017 1 (319) (0.00)
JPY563,660,307 €4,600,000 27 January 2017 35 (18,537) (0.01)
JPY100,055,830 GBP700,000 05 January 2017 1 (6,845) (0.01)
JPY50,059,132 GBP350,000 25 January 2017 7 (2,940) (0.00)
JPY100,000,000 US$859,596 05 January 2017 2 (1,773) (0.00)
JPY1,278,800,000 US$11,213,470 19 January 2017 72 (235,623) (0.18)
KRW3,800,000, US$3,162,275 23 January 2017 35 (10,423) (0.01)
MXN544,890 US$26,532 19 January 2017 1 (159) (0.00)
MXN91,000,00 US$4,447,064 10 February 2017 98 (55,733) (0.04)
NOK78,157,15 €8,700,000 23 January 2017 35 (106,279) (0.08)
NOK18,500,00 SEK19,925,361 27 January 2017 20 (47,597) (0.04)
NOK10,000,00 US$1,177,735 23 January 2017 19 (15,693) (0.01)
NZD415,227 AUD400,000 05 January 2017 4 (115) (0.00)
NZD103,718 AUD100,000 13 January 2017 1 (96) (0.00)
NZD800,000 US$571,013 17 January 2017 2 (13,530) (0.01)
NZD4,500,000 US$3,208,949 31 January 2017 35 (74,609) (0.06)
PLN1,765,022 €400,000 09 February 2017 4 (278) (0.00)
PLN500,000 US$119,803 08 February 2017 5 (113) (0.00)
RON3,162,007 €700,000 31 January 2017 11 (4,737) (0.00)
SEK1,914,401 €200,000 30 January 2017 2 (136) (0.00)
SEK1,578,035 NOK1,500,000 27 January 2017 3 (280) (0.00)
SEK3,000,000 US$331,300 27 January 2017 10 (451) (0.00)
SGD12,500,000 US$8,764,534 06 January 2017 195 (112,488) (0.09)
THB10,000,000 US$279,246 23 January 2017 2 (52) (0.00)
TRY1,605,273 US$454,941 19 January 2017 2 (480) (0.00)
TRY1,600,000 US$454,473 23 January 2017 15 (1,889) (0.00)
TWD30,000,00 US$941,411 06 January 2017 10 (14,913) (0.01)
US$48,278 AUD67,005 19 January 2017 4 (215) (0.00)
US$1,515,092 AUD2,100,000 23 January 2017 20 (4,548) (0.00)
US$2,020,123 BRL6,900,000 02 February 2017 8 (78,544) (0.06)
US$10,320,884 CAD13,900,000 18 January 2017 142 (46,602) (0.04)
US$13,518 CAD18,321 19 January 2017 2 (147) (0.00)
US$894,729 CHF916,729 19 January 2017 2 (8,603) (0.01)
US$4,804,646 CHF4,892,000 20 January 2017 27 (16,218) (0.01)
US$2,994,862 CLP2,031,000,000 27 January 2017 172 (31,332) (0.02)
US$130,640 COP400,000,000 27 January 2017 2 (1,945) (0.00)
US$232,740 CZK6,000,000 08 February 2017 3 (1,942) (0.00)
US$2,303,680 €2,200,000 13 January 2017 20 (18,746) (0.01)
US$4,883,603 €4,683,913 19 January 2017 6 (62,361) (0.05)
US$18,584 €17,790 31 January 2017 1 (212) (0.00)
US$4,507,023 GBP3,655,000 17 January 2017 91 (11,720) (0.01)
US$777,099 GBP629,057 19 January 2017 3 (656) (0.00)
US$438,968 HKD3,408,544 19 January 2017 1 (712) (0.00)
US$611,103 HUF180,000,000 31 January 2017 19 (4,133) (0.00)
US$1,035,828 ILS4,000,000 30 January 2017 16 (4,277) (0.00)
US$7,713,742 INR527,500,000 06 January 2017 47 (51,032) (0.04)
US$342,490 JPY40,000,000 05 January 2017 4 (639) (0.00)
US$8,022,211 JPY941,883,664 19 January 2017 52 (63,381) (0.05)
250

Man Funds VI PlcSchedule of Investments as at 31 December 2016 (continued)Man AHL Multi Strategy Alternative (continued)
Financial liabilities at fair value through profit or loss (continued)Financial liabilities at fair value through profit or loss (continued)Financial liabilities at fair value through profit or loss (continued)Financial liabilities at fair value through profit or loss (continued)
Forward currency contracts (note 4)* (continued)Forward currency contracts (note 4)* (continued)Forward currency contracts (note 4)* (continued)Forward currency contracts (note 4)* (continued)
Unrealised Unrealised Unrealised Unrealised % of% of% of% of
loss loss loss loss Net Net Net Net
Amount ReceivableAmount ReceivableAmount ReceivableAmount Receivable Amount PayableAmount PayableAmount PayableAmount Payable Maturity DateMaturity DateMaturity DateMaturity Date ContractsContractsContractsContracts US$ US$ US$ US$ AssetsAssetsAssetsAssets
US$1,821,473 KRW2,200,000,000 23 January 2017 12 (3,284) (0.00)
US$4,548,306 MXN94,819,000 10 February 2017 59 (27,317) (0.03)
US$25,154 NOK218,072 19 January 2017 4 (186) (0.00)
US$1,383,352 NOK12,000,000 23 January 2017 19 (11,098) (0.02)
US$1,393,041 NZD2,000,000 05 January 2017 4 (1,250) (0.00)
US$5,806 NZD8,420 19 January 2017 2 (61) (0.00)
US$1,450,439 NZD2,100,000 31 January 2017 21 (12,253) (0.02)
US$512,131 PEN1,750,000 27 January 2017 10 (7,924) (0.01)
US$1,546,945 PHP77,500,000 18 January 2017 14 (13,110) (0.02)
US$9,246 PLN39,092 19 January 2017 3 (115) (0.00)
US$1,447,774 PLN6,112,000 08 February 2017 21 (15,324) (0.02)
US$25,220 SEK230,912 19 January 2017 4 (234) (0.00)
US$3,685,066 SEK34,000,000 27 January 2017 34 (64,554) (0.06)
US$72,424 SEK663,721 31 January 2017 4 (790) (0.00)
US$1,589,201 SGD2,300,000 06 January 2017 20 (2,776) (0.00)
US$26,061 SGD37,733 19 January 2017 1 (55) (0.00)
US$1,114,627 THB40,000,000 23 January 2017 5 (2,149) (0.00)
US$645,685 TRY2,300,000 23 January 2017 11 (4,905) (0.00)
US$2,140,385 ZAR30,000,000 25 January 2017 54 (42,182) (0.04)
ZAR56,663,000 US$4,144,764 25 January 2017 135 (22,405) (0.03)
Total unrealised loss on forward currency contractsTotal unrealised loss on forward currency contractsTotal unrealised loss on forward currency contractsTotal unrealised loss on forward currency contracts (2,993,522) (2.33)
Total financial liabilities at fair value through profit or loss - tradingTotal financial liabilities at fair value through profit or loss - tradingTotal financial liabilities at fair value through profit or loss - tradingTotal financial liabilities at fair value through profit or loss - trading (11,073,436) (8.65)
Total financial assets at fair value through profit or loss - tradingTotal financial assets at fair value through profit or loss - tradingTotal financial assets at fair value through profit or loss - tradingTotal financial assets at fair value through profit or loss - trading 52,814,358 41.25
Total financial liabilities at fair value through profit or loss - tradingTotal financial liabilities at fair value through profit or loss - tradingTotal financial liabilities at fair value through profit or loss - tradingTotal financial liabilities at fair value through profit or loss - trading (11,073,436) (8.65)
Other net assetsOther net assetsOther net assetsOther net assets 86,293,291 67.40
Net Assets Attributable to Holders of Redeembale Participating SharesNet Assets Attributable to Holders of Redeembale Participating SharesNet Assets Attributable to Holders of Redeembale Participating SharesNet Assets Attributable to Holders of Redeembale Participating Shares 128,034,213 100.00
*The forward currency contracts are held with the Bank of New York Mellon, Brussels
ClassificationClassificationClassificationClassification
(a) Exchange traded derivative instruments
(b) OTC financial derivative instruments
All other investments held at the year end are transferable securities listed on an official stock exchange
% of % of % of % of
Analysis of Total AssetsAnalysis of Total AssetsAnalysis of Total AssetsAnalysis of Total Assets TotalTotalTotalTotal
Transferable securities listed on an official stock exchange AssetsAssetsAssetsAssets
Exchange traded financial derivative instruments described in classification (a) above 1.70
Transferable securities as described in # above 27.57
OTC financial derivative instruments described in classification (b) above 7.6
Other current assets 63.13
100.00
251

Man Funds VI PlcSchedule of Investments as at 31 December 2016 (continued)Man AHL Target Risk
Financial assets at fair value through profit or lossFinancial assets at fair value through profit or lossFinancial assets at fair value through profit or lossFinancial assets at fair value through profit or loss
Fair Fair Fair Fair % of% of% of% of Fair Fair Fair Fair % of% of% of% of
Value Value Value Value NetNetNetNet Value Value Value Value NetNetNetNet
Nominal Nominal Nominal Nominal DescriptionDescriptionDescriptionDescription US$ US$ US$ US$ AssetsAssetsAssetsAssets Nominal Nominal Nominal Nominal DescriptionDescriptionDescriptionDescription US$ US$ US$ US$ AssetsAssetsAssetsAssets
Credit default swaps (b)Credit default swaps (b)Credit default swaps (b)Credit default swaps (b) Government bonds (continued)Government bonds (continued)Government bonds (continued)Government bonds (continued)
EuropeEuropeEuropeEurope United KingdomUnited KingdomUnited KingdomUnited Kingdom
(10,000,000) ITraxx Europe 26VI 5 Years 100 0bps 20 December 2021 _CS 144,082 0.51 4,369,400 United Kingdom Gilt Inflation Linked 0.125% 22/03/2024 # 6,365,209 22.49
(2,000,000) ITRAXX XOVERS 26V1 5 Years 500 0bps 20 Dec 2021 _CS 200,486 0.71
344,568 1.22 United StatesUnited StatesUnited StatesUnited States
100,000 United States Treasury Bill 0% 02/02/2017 # 99,965 0.35
United StatesUnited StatesUnited StatesUnited States 100,000 United States Treasury Bill 0% 05/01/2017 # 99,998 0.35
(4,000,000) NAHYS 27V1 5 Years 500 0bps 20 December 2021 _JP 247,338 (0.87) 100,000 United States Treasury Bill 0% 12/01/2017 # 99,990 0.35
(10,000,000) NAIGS 27V1 5 Years 100 0bps 20 December 2021 _JP 151,136 0.53 100,000 United States Treasury Bill 0% 19/01/2017 # 99,982 0.35
398,474 1.4 100,000 United States Treasury Bill 0% 26/01/2017 # 99,973 0.35
400,000 United States Treasury Bill 0% 09/02/2017 # 399,821 1.41
Total credit default swapsTotal credit default swapsTotal credit default swapsTotal credit default swaps 743,042 2.62 3,059,520 United States Treasury Inflation Indexed Bonds 0.13%
15/04/2021 # 3,078,881 10.88
Future contracts (a)Future contracts (a)Future contracts (a)Future contracts (a) 4,071,840 United States Treasury Inflation Indexed Bonds 0.13%
AustraliaAustraliaAustraliaAustralia 15/07/2024 # 4,001,617 14.14
2 SPI 200 Future March 2017 4,164 0.01 7,980,227 28.18
FranceFranceFranceFrance Total government bondsTotal government bondsTotal government bondsTotal government bonds 20,923,557 73.92
9 CAC40 10 Euro Future January 2017 7,879 0.03
Total return swaps (b)Total return swaps (b)Total return swaps (b)Total return swaps (b)
GermanyGermanyGermanyGermany United StatesUnited StatesUnited StatesUnited States
2 DAX Index Future March 2017 5,313 0.02 31,000 BBG Commex AG & LvCap 10,993 0.04
1 Euro BUXL 30 Years Bond Future March 2017 2,911 0.01
18 Euro Stoxx 50 March 2017 10,579 0.04 Total total return swapsTotal total return swapsTotal total return swapsTotal total return swaps 10,993 0.04
18 Euro-BOBL Future March 2017 24,492 0.09
6 Euro-BTP Future March 2017 9,356 0.03
15 Euro-BUND Future March 2017 37,591 0.13
8 Euro-OAT Future March 2017 10,326 0.04
100,568 0.36
Hong KongHong KongHong KongHong Kong
2 Hang Seng Index Future January 2017 4,914 0.02
3 H-Shares Index Future January 2017 4,044 0.01
8,958 0.03
ItalyItalyItalyItaly
3 FTSE/MIB Index Future March 2017 6,091 0.02
JapanJapanJapanJapan
3 Japan 10 Years Bond OSE March 2017 4,334 0.02
3 TOPIX Index Future March 2017 8,617 0.03
12,951 0.05
NetherlandsNetherlandsNetherlandsNetherlands
4 Amsterdam Index Future January 2017 6,710 0.02
SingaporeSingaporeSingaporeSingapore
7 MSCI SING IX ETS January 2017 24 0.00
11 Nikkei 225 (SGX) March 2017 20,183 0.07
1 SGX Nifty 50 January 2017 230 0.00
20,437 0.07
South KoreaSouth KoreaSouth KoreaSouth Korea
3 Korea 3 Years Bond Future March 2017 273 0.00
4 KOSPI2 Index Future March 2017 11,074 0.04
11,347 0.04
SpainSpainSpainSpain
2 IBEX 35 Index Future January 2017 1,591 0.01
SwitzerlandSwitzerlandSwitzerlandSwitzerland
4 Swiss Market Index Future March 2017 4,959 0.02
TaiwanTaiwanTaiwanTaiwan
4 MSCI Taiwan Index January 2017 1,380 0.00
TurkeyTurkeyTurkeyTurkey
33 BIST 30 Future February 2017 305 0.00
United KingdomUnited KingdomUnited KingdomUnited Kingdom
34 FTSE 100 Index Future March 2017 61,628 0.22
37 Long Gilt Future March 2017 100,273 0.35
161,901 0.57
Total future contractsTotal future contractsTotal future contractsTotal future contracts 349,241 1.23
Government bondsGovernment bondsGovernment bondsGovernment bonds
FranceFranceFranceFrance
2,554,550 France Government Bond OAT 0.25% 25/07/2024 # 2,958,989 10.46
GermanyGermanyGermanyGermany
3,124,620 Deutsche Bundesrepublik Inflation Linked Bond 0.10%
15/04/2023 # 3,619,132 12.79
252

Man Funds VI PlcSchedule of Investments as at 31 December 2016 (continued)Man AHL Target Risk (continued)
Financial assets at fair value through profit or loss (continued)Financial assets at fair value through profit or loss (continued)Financial assets at fair value through profit or loss (continued)Financial assets at fair value through profit or loss (continued)
Forward currency contracts (note 4) (b)Forward currency contracts (note 4) (b)Forward currency contracts (note 4) (b)Forward currency contracts (note 4) (b)
Unrealised Unrealised Unrealised Unrealised % of% of% of% of Unrealised Unrealised Unrealised Unrealised
gain gain gain gain Net Net Net Net
Amount ReceivableAmount ReceivableAmount ReceivableAmount Receivable Amount PayableAmount PayableAmount PayableAmount Payable Maturity DateMaturity DateMaturity DateMaturity Date ContractsContractsContractsContracts US$US$US$US$ US$US$US$US$
CHF18,721 US$18,275 19 January 2017 2 171 0.00
€62,319 US$65,299 19 January 2017 1 507 0.00
GBP3,700 US$4,541 31 January 2017 1 35 0.00
JPY3,028,706 US$25,855 19 January 2017 1 145 0.00
KRW1,574,203, US$1,304,228 19 January 2017 1 1,848 0.01
KRW4,868 AUD6,680 19 January 2017 1 34 0.00
SEK9,366 US$1,018 31 January 2017 2 16 0.00
US$5,796,159 GBP4,680,437 19 January 2017 1 9,354 0.03
US$2,956 KRW3,557,000 19 January 2017 1 5 0.00
Total unrealised gain on forward currency contractsTotal unrealised gain on forward currency contractsTotal unrealised gain on forward currency contractsTotal unrealised gain on forward currency contracts 12,115 0.04
Total financial assets at fair value through profit or loss - tradingTotal financial assets at fair value through profit or loss - tradingTotal financial assets at fair value through profit or loss - tradingTotal financial assets at fair value through profit or loss - trading 22,038,948 77.85
253

Man Funds VI PlcSchedule of Investments as at 31 December 2016 (continued)Man AHL Target Risk (continued)
Financial liabilities at fair value through profit or lossFinancial liabilities at fair value through profit or lossFinancial liabilities at fair value through profit or lossFinancial liabilities at fair value through profit or loss
Fair Fair Fair Fair % of% of% of% of
Value Value Value Value NetNetNetNet
Nominal Nominal Nominal Nominal DescriptionDescriptionDescriptionDescription US$ US$ US$ US$ AssetsAssetsAssetsAssets
Future contracts Future contracts Future contracts Future contracts
CanadaCanadaCanadaCanada
3 Canada 10 Years Bond Future March 2017 (3,244) (0.01)
6 S&P/TSX 60 IX Future March 2017 (403) (0.00)
(3,647) (0.01)
ChinaChinaChinaChina
2 FTSE China A50 January 2017 (95) (0.00)
South AfricaSouth AfricaSouth AfricaSouth Africa
4 FTSE/JSE TOP 40 March 2017 (1,378) (0.00)
SwedenSwedenSwedenSweden
7 OMXS30 Index Future January 2016 (1,757) (0.01)
United StatesUnited StatesUnited StatesUnited States
16 NASDAQ 100 E-mini March 2017 (3,337) (0.01)
23 S&P 500 E-mini Future March 2017 (18,495) (0.07)
15 US 10 Years Note CBT March 2017 (11,367) (0.04)
4 US 2 Years Note CBT March 2017 (438) (0.00)
11 US 5 Years Note CBT March 2017 (1,719) (0.01)
7 US Long Bond CBT March 2017 (10,719) (0.04)
4 US Ultra Bond CBT March 2017 (8,344) (0.03)
(54,419) (0.20)
Total future contractsTotal future contractsTotal future contractsTotal future contracts (61,296) (0.22)
254

Man Funds VI PlcSchedule of Investments as at 31 December 2016 (continued)Man AHL Target Risk (continued)
Financial liabilities at fair value through profit or loss (continued)Financial liabilities at fair value through profit or loss (continued)Financial liabilities at fair value through profit or loss (continued)Financial liabilities at fair value through profit or loss (continued)
Forward currency contracts (note 4)Forward currency contracts (note 4)Forward currency contracts (note 4)Forward currency contracts (note 4)
Unrealised Unrealised Unrealised Unrealised % of% of% of% of
loss loss loss loss Net Net Net Net
Amount ReceivableAmount ReceivableAmount ReceivableAmount Receivable Amount PayableAmount PayableAmount PayableAmount Payable Maturity DateMaturity DateMaturity DateMaturity Date ContractsContractsContractsContracts US$US$US$US$ AssetsAssetsAssetsAssets
€1,962 US$2,082 31 January 2017 6 (11) (0.00)
GBP17,857 US$22,312 19 January 2017 1 (234) (0.00)
GBP346,361 US$432,605 31 January 2017 5 (4,242) (0.01)
SEK269 US$30 31 January 2017 4 - (0.00)
SEK7,372,086 €7,065,795 19 January 2017 5 (89,020) (0.31)
TRY5,611 US$1,591 19 January 2017 1 (3) (0.00)
US$854,241 GBP692,719 19 January 2017 2 (2,224) (0.01)
US$18,017 HKD139,900 19 January 2017 1 (29) (0.00)
US$9,400 JPY1,101,024 19 January 2017 1 (52) (0.00)
US$319 SEK2,977 19 January 2017 2 (9) (0.00)
US$1,528 SGD2,212 19 January 2017 1 (3) (0.00)
US$3,214 ZAR45,174 19 January 2017 1 (77) (0.00)
Total unrealised loss on forward currency contractsTotal unrealised loss on forward currency contractsTotal unrealised loss on forward currency contractsTotal unrealised loss on forward currency contracts (95,904) (0.33)
Total financial liabilities at fair value through profit or loss - tradingTotal financial liabilities at fair value through profit or loss - tradingTotal financial liabilities at fair value through profit or loss - tradingTotal financial liabilities at fair value through profit or loss - trading (157,200) (0.55)
Total financial assets at fair value through profit or loss - tradingTotal financial assets at fair value through profit or loss - tradingTotal financial assets at fair value through profit or loss - tradingTotal financial assets at fair value through profit or loss - trading 22,038,948 77.85
Total financial liabilities at fair value through profit or loss - tradingTotal financial liabilities at fair value through profit or loss - tradingTotal financial liabilities at fair value through profit or loss - tradingTotal financial liabilities at fair value through profit or loss - trading (157,200) (0.55)
Other net assetsOther net assetsOther net assetsOther net assets 6,415,229 22.70
Net Assets Attributable to Holders of Redeemable Participating Shares Net Assets Attributable to Holders of Redeemable Participating Shares Net Assets Attributable to Holders of Redeemable Participating Shares Net Assets Attributable to Holders of Redeemable Participating Shares 28,296,977 100.00
Classifications : Classifications : Classifications : Classifications :
(a) Exchange traded derivative instruments
(b) OTC financial derivatives instruments
#Transferable securities other than those listed on an official stock exchange or dealt on another regulated market
All other investments held at the year end are transferable securities listed on an official stock exchange
% of Total% of Total% of Total% of Total
Analysis of Total Assets Analysis of Total Assets Analysis of Total Assets Analysis of Total Assets AssetsAssetsAssetsAssets Exchange traded financial derivative instruments described in classification (a) above 1.17
OTC financial derivative instruments described in classification (b) above 2.57 Transferable Securities as described in # above 70.06
Other current assets 26.20
100.00
255
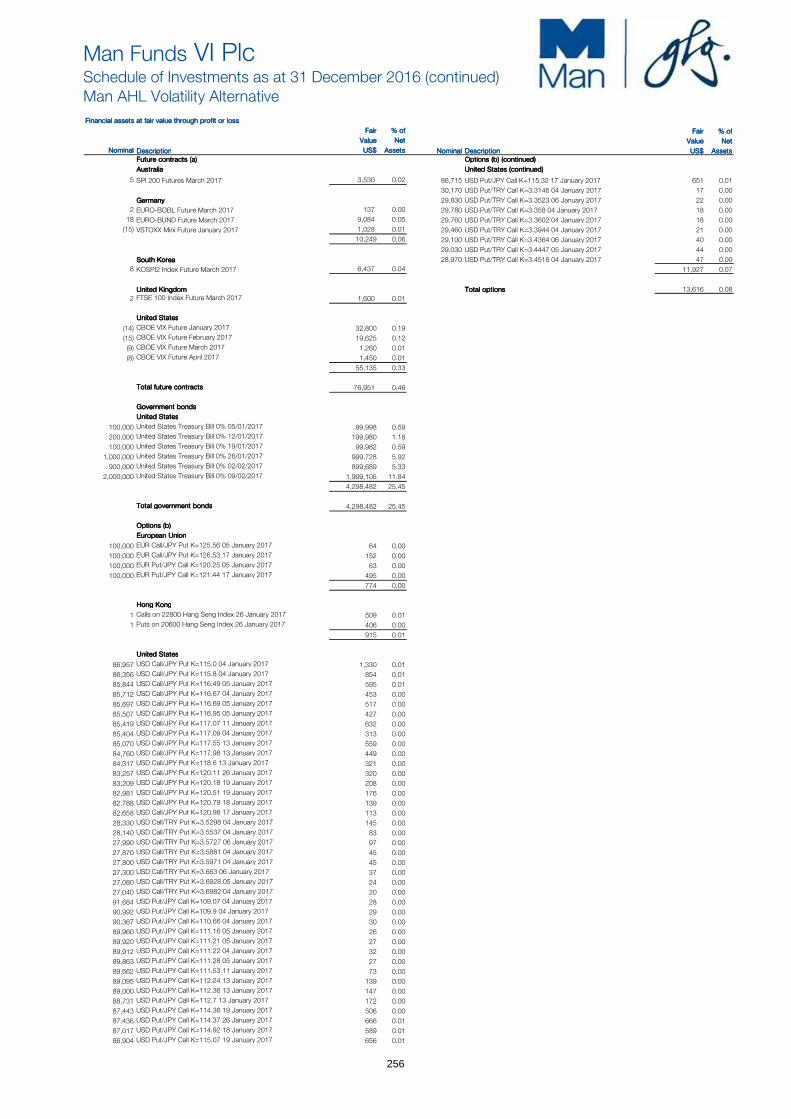
Man Funds VI PlcSchedule of Investments as at 31 December 2016 (continued)Man AHL Volatility Alternative
Financial assets at fair value through profit or lossFinancial assets at fair value through profit or lossFinancial assets at fair value through profit or lossFinancial assets at fair value through profit or loss
Fair Fair Fair Fair % of% of% of% of Fair Fair Fair Fair % of% of% of% of
Value Value Value Value NetNetNetNet Value Value Value Value NetNetNetNet
Nominal Nominal Nominal Nominal DescriptionDescriptionDescriptionDescription US$ US$ US$ US$ AssetsAssetsAssetsAssets Nominal Nominal Nominal Nominal DescriptionDescriptionDescriptionDescription US$ US$ US$ US$ AssetsAssetsAssetsAssetsFuture contracts (a)Future contracts (a)Future contracts (a)Future contracts (a) Options (b) (continued)Options (b) (continued)Options (b) (continued)Options (b) (continued)
AustraliaAustraliaAustraliaAustralia United States (continued)United States (continued)United States (continued)United States (continued)
5 SPI 200 Futures March 2017 3,530 0.02 86,715 USD Put/JPY Call K=115.32 17 January 2017 651 0.01
30,170 USD Put/TRY Call K=3.3146 04 January 2017 17 0.00
GermanyGermanyGermanyGermany 29,830 USD Put/TRY Call K=3.3523 06 January 2017 22 0.00
2 EURO-BOBL Future March 2017 137 0.00 29,780 USD Put/TRY Call K=3.358 04 January 2017 18 0.00
18 EURO-BUND Future March 2017 9,084 0.05 29,760 USD Put/TRY Call K=3.3602 04 January 2017 18 0.00
(15) VSTOXX Mini Future January 2017 1,028 0.01 29,460 USD Put/TRY Call K=3.3944 04 January 2017 21 0.00
10,249 0.06 29,100 USD Put/TRY Call K=3.4364 06 January 2017 40 0.00
29,030 USD Put/TRY Call K=3.4447 05 January 2017 44 0.00
South KoreaSouth KoreaSouth KoreaSouth Korea 28,970 USD Put/TRY Call K=3.4518 04 January 2017 47 0.00
8 KOSPI2 Index Future March 2017 6,437 0.04 11,927 0.07
United KingdomUnited KingdomUnited KingdomUnited Kingdom Total optionsTotal optionsTotal optionsTotal options 13,616 0.08
2 FTSE 100 Index Future March 2017 1,600 0.01
United StatesUnited StatesUnited StatesUnited States
(14) CBOE VIX Future January 2017 32,800 0.19
(15) CBOE VIX Future February 2017 19,625 0.12
(9) CBOE VIX Future March 2017 1,260 0.01
(8) CBOE VIX Future April 2017 1,450 0.01
55,135 0.33
Total future contractsTotal future contractsTotal future contractsTotal future contracts 76,951 0.46
Government bondsGovernment bondsGovernment bondsGovernment bonds
United StatesUnited StatesUnited StatesUnited States
100,000 United States Treasury Bill 0% 05/01/2017 99,998 0.59
200,000 United States Treasury Bill 0% 12/01/2017 199,980 1.18
100,000 United States Treasury Bill 0% 19/01/2017 99,982 0.59
1,000,000 United States Treasury Bill 0% 26/01/2017 999,728 5.92
900,000 United States Treasury Bill 0% 02/02/2017 899,689 5.33
2,000,000 United States Treasury Bill 0% 09/02/2017 1,999,105 11.84
4,298,482 25.45
Total government bondsTotal government bondsTotal government bondsTotal government bonds 4,298,482 25.45
Options (b)Options (b)Options (b)Options (b)
European UnionEuropean UnionEuropean UnionEuropean Union
100,000 EUR Call/JPY Put K=125.56 05 January 2017 64 0.00
100,000 EUR Call/JPY Put K=126.53 17 January 2017 152 0.00
100,000 EUR Put/JPY Call K=120.25 05 January 2017 63 0.00
100,000 EUR Put/JPY Call K=121.44 17 January 2017 495 0.00
774 0.00
Hong KongHong KongHong KongHong Kong
1 Calls on 22800 Hang Seng Index 26 January 2017 509 0.01
1 Puts on 20600 Hang Seng Index 26 January 2017 406 0.00
915 0.01
United StatesUnited StatesUnited StatesUnited States
86,957 USD Call/JPY Put K=115.0 04 January 2017 1,330 0.01
86,356 USD Call/JPY Put K=115.8 04 January 2017 854 0.01
85,844 USD Call/JPY Put K=116.49 05 January 2017 595 0.01
85,712 USD Call/JPY Put K=116.67 04 January 2017 453 0.00
85,697 USD Call/JPY Put K=116.69 05 January 2017 517 0.00
85,507 USD Call/JPY Put K=116.95 05 January 2017 427 0.00
85,419 USD Call/JPY Put K=117.07 11 January 2017 632 0.00
85,404 USD Call/JPY Put K=117.09 04 January 2017 313 0.00
85,070 USD Call/JPY Put K=117.55 13 January 2017 559 0.00
84,760 USD Call/JPY Put K=117.98 13 January 2017 449 0.00
84,317 USD Call/JPY Put K=118.6 13 January 2017 321 0.00
83,257 USD Call/JPY Put K=120.11 26 January 2017 320 0.00
83,209 USD Call/JPY Put K=120.18 19 January 2017 208 0.00
82,981 USD Call/JPY Put K=120.51 19 January 2017 176 0.00
82,788 USD Call/JPY Put K=120.79 18 January 2017 139 0.00
82,658 USD Call/JPY Put K=120.98 17 January 2017 113 0.00
28,330 USD Call/TRY Put K=3.5298 04 January 2017 145 0.00
28,140 USD Call/TRY Put K=3.5537 04 January 2017 83 0.00
27,990 USD Call/TRY Put K=3.5727 06 January 2017 97 0.00
27,870 USD Call/TRY Put K=3.5881 04 January 2017 45 0.00
27,800 USD Call/TRY Put K=3.5971 04 January 2017 45 0.00
27,300 USD Call/TRY Put K=3.663 06 January 2017 37 0.00
27,080 USD Call/TRY Put K=3.6928 05 January 2017 24 0.00
27,040 USD Call/TRY Put K=3.6982 04 January 2017 20 0.00
91,684 USD Put/JPY Call K=109.07 04 January 2017 28 0.00
90,992 USD Put/JPY Call K=109.9 04 January 2017 29 0.00
90,367 USD Put/JPY Call K=110.66 04 January 2017 30 0.00
89,960 USD Put/JPY Call K=111.16 05 January 2017 26 0.00
89,920 USD Put/JPY Call K=111.21 05 January 2017 27 0.00
89,912 USD Put/JPY Call K=111.22 04 January 2017 32 0.00
89,863 USD Put/JPY Call K=111.28 05 January 2017 27 0.00
89,662 USD Put/JPY Call K=111.53 11 January 2017 73 0.00
89,095 USD Put/JPY Call K=112.24 13 January 2017 139 0.00
89,000 USD Put/JPY Call K=112.36 13 January 2017 147 0.00
88,731 USD Put/JPY Call K=112.7 13 January 2017 172 0.00
87,443 USD Put/JPY Call K=114.36 19 January 2017 506 0.00
87,436 USD Put/JPY Call K=114.37 26 January 2017 666 0.01
87,017 USD Put/JPY Call K=114.92 18 January 2017 589 0.01
86,904 USD Put/JPY Call K=115.07 19 January 2017 656 0.01
256

Man Funds VI PlcSchedule of Investments as at 31 December 2016 (continued)Man AHL Volatility Alternative (continued)
Financial assets at fair value through profit or loss (continued)Financial assets at fair value through profit or loss (continued)Financial assets at fair value through profit or loss (continued)Financial assets at fair value through profit or loss (continued)
Forward currency contracts (note 4) (b)Forward currency contracts (note 4) (b)Forward currency contracts (note 4) (b)Forward currency contracts (note 4) (b)
Unrealised Unrealised Unrealised Unrealised % of% of% of% of Unrealised Unrealised Unrealised Unrealised
gain gain gain gain Net Net Net Net
Amount ReceivableAmount ReceivableAmount ReceivableAmount Receivable Amount PayableAmount PayableAmount PayableAmount Payable Maturity DateMaturity DateMaturity DateMaturity Date ContractsContractsContractsContracts US$ US$ US$ US$ AssetsAssetsAssetsAssets
€200,000 JPY24,578,120 05 January 2017 1 207 0.00
€2,262,575 US$2,367,085 19 January 2017 8 22,075 0.13
GBP3,775 US$4,637 19 January 2017 2 30 0.00
JPY16,780,670 US$142,821 19 January 2017 4 1,232 0.01
KRW3,396,000 US$2,814 19 January 2017 1 4 0.00
NOK12,304 US$1,414 19 January 2017 3 16 0.00
SEK155,390 US$16,941 19 January 2017 2 188 0.00
US$1,230,914 AUD1,700,000 05 January 2017 1 162 0.00
US$100,126 AUD138,277 19 January 2017 1 53 0.00
US$127,714 €120,000 31 January 2017 1 929 0.01
US$26,267 GBP21,038 19 January 2017 3 257 0.00
US$2,743 JPY318,810 19 January 2017 1 6 0.00
US$562,639 KRW657,446,243 19 January 2017 2 17,173 0.10
Total unrealised gain on forward currency contractsTotal unrealised gain on forward currency contractsTotal unrealised gain on forward currency contractsTotal unrealised gain on forward currency contracts 42,332 0.25
Total financial assets at fair value through profit or loss - tradingTotal financial assets at fair value through profit or loss - tradingTotal financial assets at fair value through profit or loss - tradingTotal financial assets at fair value through profit or loss - trading 4,431,381 26.24
257

Man Funds VI PlcSchedule of Investments as at 31 December 2016 (continued)Man AHL Volatility Alternative (continued)
Financial liabilities at fair value through profit or lossFinancial liabilities at fair value through profit or lossFinancial liabilities at fair value through profit or lossFinancial liabilities at fair value through profit or loss
Fair Fair Fair Fair % of% of% of% of Fair Fair Fair Fair % of% of% of% of
Value Value Value Value NetNetNetNet Value Value Value Value NetNetNetNet
Nominal Nominal Nominal Nominal DescriptionDescriptionDescriptionDescription US$ US$ US$ US$ AssetsAssetsAssetsAssets Nominal Nominal Nominal Nominal DescriptionDescriptionDescriptionDescription US$ US$ US$ US$ AssetsAssetsAssetsAssets
Future contractsFuture contractsFuture contractsFuture contracts Options (continued)Options (continued)Options (continued)Options (continued)
GermanyGermanyGermanyGermany European Union (continued)European Union (continued)European Union (continued)European Union (continued)
(1) EURO STOXX 50 March 2017 (222) (0.00) (100,000) EUR Call/NOK Put K=9.254 26 January 2017 (246) (0.00)
(100,000) EUR Call/NOK Put K=9.2577 03 January 2017 (38) (0.00)
Hong KongHong KongHong KongHong Kong (100,000) EUR Call/NOK Put K=9.2804 03 January 2017 (35) (0.00)
(1) H-SHARES Index Future January 2017 (677) (0.00) (100,000) EUR Call/SEK Put K=9.8375 11 January 2017 (26) (0.00)
(100,000) EUR Call/SEK Put K=9.8492 19 January 2017 (45) (0.00)
JapanJapanJapanJapan (100,000) EUR Call/SEK Put K=9.8601 13 January 2017 (25) (0.00)
2 NIKKEI 225 March 2017 (6,259) (0.04) (100,000) EUR Call/SEK Put K=9.8684 13 January 2017 (24) (0.00)
(100,000) EUR Call/SEK Put K=9.8721 13 January 2017 (23) (0.00)
TaiwanTaiwanTaiwanTaiwan (100,000) EUR Call/SEK Put K=9.8794 17 January 2017 (31) (0.00)
(2) TAIEX Future January 2017 (1,930) (0.01) (100,000) EUR Call/SEK Put K=9.8931 03 January 2017 (6) (0.00)
(100,000) EUR Call/SEK Put K=9.897 10 January 2017 (20) (0.00)
United StatesUnited StatesUnited StatesUnited States (100,000) EUR Call/SEK Put K=9.8996 04 January 2017 (13) (0.00)7 S&P500 E-mini Future March 2017 (6,208) (0.04) (100,000) EUR Call/SEK Put K=9.9059 03 January 2017 (5) (0.00)
(1) US 10 Years Note March 2017 (1,375) (0.01) (100,000) EUR Call/SEK Put K=9.9126 03 January 2017 (4) (0.00)(9) US 5 Years Note March 2017 (7,695) (0.05) (100,000) EUR Call/SEK Put K=9.9176 19 January 2017 (30) (0.00)2 US Long Bond March 2017 (438) (0.00) (100,000) EUR Call/SEK Put K=9.9324 03 January 2017 (3) (0.00)
(15,716) (0.10) (100,000) EUR Call/SEK Put K=9.9326 04 January 2017 (8) (0.00)
(100,000) EUR Call/SEK Put K=9.9338 03 January 2017 (3) (0.00)
Total future contracts Total future contracts Total future contracts Total future contracts (24,804) (0.15) (100,000) EUR Call/SEK Put K=9.937 18 January 2017 (25) (0.00)
(100,000) EUR Call/SEK Put K=9.9428 03 January 2017 (3) (0.00)
OptionsOptionsOptionsOptions (100,000) EUR Call/SEK Put K=9.9587 03 January 2017 (3) (0.00)
AustraliaAustraliaAustraliaAustralia (100,000) EUR Call/SEK Put K=9.9633 03 January 2017 (3) (0.00)(2) Calls on 5525 AS51 Index 19 January 2017 (2,404) (0.01) (100,000) EUR Call/SEK Put K=9.967 04 January 2017 (4) (0.00)(1) Calls on 5550 AS51 Index 19 January 2017 (1,044) (0.01) (100,000) EUR Call/SEK Put K=9.9683 04 January 2017 (4) (0.00)(2) Calls on 5575 AS51 Index 19 January 2017 (1,786) (0.01) (100,000) EUR Put/GBP Call K=0.821 17 January 2017 (42) (0.00)(2) Calls on 5600 AS51 Index 19 January 2017 (1,500) (0.01) (200,000) EUR Put/GBP Call K=0.8224 19 January 2017 (130) (0.00)(2) Calls on 5625 AS51 Index 19 January 2017 (1,234) (0.01) (200,000) EUR Put/GBP Call K=0.8247 18 January 2017 (142) (0.00)(2) Calls on 5650 AS51 Index 19 January 2017 (992) (0.01) (100,000) EUR Put/GBP Call K=0.8256 13 January 2017 (39) (0.00)(2) Calls on 5675 AS51 Index 19 January 2017 (779) (0.01) (100,000) EUR Put/GBP Call K=0.8259 04 January 2017 (53) (0.00)(2) Calls on 5700 AS51 Index 19 January 2017 (595) (0.00) (400,000) EUR Put/GBP Call K=0.8259 19 January 2017 (363) (0.00)(4) Calls on 5725 AS51 Index 19 January 2017 (889) (0.01) (200,000) EUR Put/GBP Call K=0.8265 13 January 2017 (87) (0.00)(6) Calls on 5750 AS51 Index 19 January 2017 (973) (0.01) (100,000) EUR Put/GBP Call K=0.8272 11 January 2017 (38) (0.00)(5) Calls on 5775 AS51 Index 19 January 2017 (579) (0.00) (400,000) EUR Put/GBP Call K=0.8281 19 January 2017 (447) (0.00)(5) Calls on 5800 AS51 Index 19 January 2017 (409) (0.00) (100,000) EUR Put/GBP Call K=0.8288 05 January 2017 (42) (0.00)(2) Puts on 5225 AS51 Index 19 January 2017 (67) (0.00) (300,000) EUR Put/GBP Call K=0.8329 26 January 2017 (840) (0.01)(2) Puts on 5275 AS51 Index 19 January 2017 (78) (0.00) (300,000) EUR Put/GBP Call K=0.8344 10 January 2017 (198) (0.00)(2) Puts on 5300 AS51 Index 19 January 2017 (85) (0.00) (100,000) EUR Put/GBP Call K=0.8363 05 January 2017 (65) (0.00)(4) Puts on 5325 AS51 Index 19 January 2017 (185) (0.00) (200,000) EUR Put/GBP Call K=0.8391 03 January 2017 (174) (0.00)(2) Puts on 5350 AS51 Index 19 January 2017 (103) (0.00) (200,000) EUR Put/JPY Call K=116.39 04 January 2017 (31) (0.00)(2) Puts on 5375 AS51 Index 19 January 2017 (113) (0.00) (100,000) EUR Put/JPY Call K=116.51 04 January 2017 (18) (0.00)(3) Puts on 5400 AS51 Index 19 January 2017 (189) (0.00) (100,000) EUR Put/JPY Call K=117.36 04 January 2017 (35) (0.00)(2) Puts on 5425 AS51 Index 19 January 2017 (143) (0.00) (200,000) EUR Put/JPY Call K=119.57 26 January 2017 (747) (0.00)(3) Puts on 5450 AS51 Index 19 January 2017 (239) (0.00) (200,000) EUR Put/JPY Call K=120.08 19 January 2017 (604) (0.00)(4) Puts on 5475 AS51 Index 19 January 2017 (374) (0.00) (200,000) EUR Put/JPY Call K=120.48 26 January 2017 (1,064) (0.01)(2) Puts on 5500 AS51 Index 19 January 2017 (219) (0.00) (100,000) EUR Put/NOK Call K=8.8242 13 January 2017 (31) (0.00)(2) Puts on 5550 AS51 Index 19 January 2017 (306) (0.00) (100,000) EUR Put/NOK Call K=8.8359 13 January 2017 (32) (0.00)
(15,285) (0.09) (100,000) EUR Put/NOK Call K=8.8443 05 January 2017 (26) (0.00)
(100,000) EUR Put/NOK Call K=8.8454 04 January 2017 (30) (0.00)
European UnionEuropean UnionEuropean UnionEuropean Union (100,000) EUR Put/NOK Call K=8.8569 11 January 2017 (35) (0.00)(100,000) EUR Call/GBP Put K=0.853 17 January 2017 (919) (0.01) (100,000) EUR Put/NOK Call K=8.8684 03 January 2017 (33) (0.00)(200,000) EUR Call/GBP Put K=0.8557 19 January 2017 (1,661) (0.01) (100,000) EUR Put/NOK Call K=8.8735 13 January 2017 (38) (0.00)(100,000) EUR Call/GBP Put K=0.8569 13 January 2017 (589) (0.00) (100,000) EUR Put/NOK Call K=8.8747 17 January 2017 (59) (0.00)(200,000) EUR Call/GBP Put K=0.857 18 January 2017 (1,448) (0.01) (100,000) EUR Put/NOK Call K=8.8769 05 January 2017 (29) (0.00)(400,000) EUR Call/GBP Put K=0.858 19 January 2017 (2,836) (0.02) (100,000) EUR Put/NOK Call K=8.879 05 January 2017 (29) (0.00)(400,000) EUR Call/GBP Put K=0.8583 19 January 2017 (2,777) (0.02) (100,000) EUR Put/NOK Call K=8.9022 10 January 2017 (41) (0.00)(100,000) EUR Call/GBP Put K=0.8589 11 January 2017 (426) (0.00) (100,000) EUR Put/NOK Call K=8.9065 03 January 2017 (38) (0.00)(200,000) EUR Call/GBP Put K=0.8593 13 January 2017 (955) (0.01) (100,000) EUR Put/NOK Call K=8.9093 03 January 2017 (39) (0.00)(100,000) EUR Call/GBP Put K=0.8615 05 January 2017 (152) (0.00) (100,000) EUR Put/NOK Call K=8.9206 19 January 2017 (131) (0.00)(100,000) EUR Call/GBP Put K=0.8653 04 January 2017 (153) (0.00) (100,000) EUR Put/NOK Call K=8.9215 19 January 2017 (133) (0.00)(300,000) EUR Call/GBP Put K=0.8657 26 January 2017 (1,674) (0.01) (100,000) EUR Put/NOK Call K=8.9278 19 January 2017 (143) (0.00)(300,000) EUR Call/GBP Put K=0.8675 10 January 2017 (445) (0.00) (100,000) EUR Put/NOK Call K=8.928 03 January 2017 (46) (0.00)(100,000) EUR Call/GBP Put K=0.8693 05 January 2017 (109) (0.00) (100,000) EUR Put/NOK Call K=8.9302 03 January 2017 (47) (0.00)(200,000) EUR Call/GBP Put K=0.8758 03 January 2017 (134) (0.00) (100,000) EUR Put/NOK Call K=8.9306 03 January 2017 (47) (0.00)(200,000) EUR Call/JPY Put K=122.19 04 January 2017 (1,841) (0.01) (100,000) EUR Put/NOK Call K=8.9495 03 January 2017 (54) (0.00)(100,000) EUR Call/JPY Put K=122.21 04 January 2017 (908) (0.01) (100,000) EUR Put/NOK Call K=8.9627 03 January 2017 (59) (0.00)(100,000) EUR Call/JPY Put K=123.27 04 January 2017 (361) (0.00) (100,000) EUR Put/NOK Call K=8.9808 26 January 2017 (349) (0.00)(200,000) EUR Call/JPY Put K=124.81 26 January 2017 (1,338) (0.01) (100,000) EUR Put/SEK Call K=9.571 11 January 2017 (418) (0.00)(200,000) EUR Call/JPY Put K=125.06 19 January 2017 (859) (0.01) (100,000) EUR Put/SEK Call K=9.5876 13 January 2017 (560) (0.00)(200,000) EUR Call/JPY Put K=125.55 26 January 2017 (984) (0.01) (100,000) EUR Put/SEK Call K=9.5932 19 January 2017 (707) (0.01)(100,000) EUR Call/NOK Put K=9.1036 13 January 2017 (482) (0.00) (100,000) EUR Put/SEK Call K=9.6022 13 January 2017 (652) (0.01)(100,000) EUR Call/NOK Put K=9.1132 13 January 2017 (438) (0.00) (100,000) EUR Put/SEK Call K=9.6179 03 January 2017 (522) (0.00)(100,000) EUR Call/NOK Put K=9.1329 13 January 2017 (357) (0.00) (100,000) EUR Put/SEK Call K=9.6233 03 January 2017 (567) (0.00)(100,000) EUR Call/NOK Put K=9.1341 17 January 2017 (422) (0.00) (100,000) EUR Put/SEK Call K=9.6246 13 January 2017 (809) (0.01)(100,000) EUR Call/NOK Put K=9.137 11 January 2017 (286) (0.00) (100,000) EUR Put/SEK Call K=9.626 17 January 2017 (883) (0.01)(100,000) EUR Call/NOK Put K=9.1475 05 January 2017 (120) (0.00) (100,000) EUR Put/SEK Call K=9.6278 10 January 2017 (765) (0.01)(100,000) EUR Call/NOK Put K=9.1608 04 January 2017 (92) (0.00) (100,000) EUR Put/SEK Call K=9.6313 03 January 2017 (637) (0.00)(100,000) EUR Call/NOK Put K=9.1625 05 January 2017 (90) (0.00) (100,000) EUR Put/SEK Call K=9.6416 04 January 2017 (759) (0.00)(100,000) EUR Call/NOK Put K=9.1669 19 January 2017 (354) (0.00) (100,000) EUR Put/SEK Call K=9.6477 03 January 2017 (798) (0.00)(100,000) EUR Call/NOK Put K=9.1723 05 January 2017 (81) (0.00) (100,000) EUR Put/SEK Call K=9.6509 03 January 2017 (833) (0.00)(100,000) EUR Call/NOK Put K=9.1778 03 January 2017 (97) (0.00) (100,000) EUR Put/SEK Call K=9.652 19 January 2017 (1,126) (0.01)(100,000) EUR Call/NOK Put K=9.1856 19 January 2017 (300) (0.00) (100,000) EUR Put/SEK Call K=9.6578 04 January 2017 (913) (0.01)(100,000) EUR Call/NOK Put K=9.1885 19 January 2017 (292) (0.00) (100,000) EUR Put/SEK Call K=9.6583 03 January 2017 (914) (0.01)(100,000) EUR Call/NOK Put K=9.196 10 January 2017 (116) (0.00) (100,000) EUR Put/SEK Call K=9.6598 03 January 2017 (930) (0.01)(100,000) EUR Call/NOK Put K=9.225 03 January 2017 (50) (0.00) (100,000) EUR Put/SEK Call K=9.6717 04 January 2017 (1,065) (0.01)(100,000) EUR Call/NOK Put K=9.2314 03 January 2017 (47) (0.00) (100,000) EUR Put/SEK Call K=9.6725 03 January 2017 (1,069) (0.01)(100,000) EUR Call/NOK Put K=9.2361 03 January 2017 (45) (0.00) (100,000) EUR Put/SEK Call K=9.6759 18 January 2017 (1,303) (0.01)(100,000) EUR Call/NOK Put K=9.2452 03 January 2017 (41) (0.00) (100,000) EUR Put/SEK Call K=9.6949 04 January 2017 (1,319) (0.01)(100,000) EUR Call/NOK Put K=9.2468 03 January 2017 (41) (0.00) (49,124) (0.29)
258

Man Funds VI PlcSchedule of Investments as at 31 December 2016 (continued)Man AHL Volatility Alternative (continued)
Financial liabilities at fair value through profit or loss (continued)Financial liabilities at fair value through profit or loss (continued)Financial liabilities at fair value through profit or loss (continued)Financial liabilities at fair value through profit or loss (continued)
Fair Fair Fair Fair % of% of% of% of Fair Fair Fair Fair % of% of% of% of
Value Value Value Value NetNetNetNet Value Value Value Value NetNetNetNet
Nominal Nominal Nominal Nominal DescriptionDescriptionDescriptionDescription US$ US$ US$ US$ AssetsAssetsAssetsAssets Nominal Nominal Nominal Nominal DescriptionDescriptionDescriptionDescription US$ US$ US$ US$ AssetsAssetsAssetsAssets
Options (continued)Options (continued)Options (continued)Options (continued) Options (continued)Options (continued)Options (continued)Options (continued)
GermanyGermanyGermanyGermany Taiwan (continued)Taiwan (continued)Taiwan (continued)Taiwan (continued)(1) Call on 133.5 EURO-BOBL Options 27 January 2017 (396) (0.00) (14) Calls on 9500 TWSE Index 18 January 2017 (326) (0.00)(7) Call on 133.75 EURO-BOBL Options 27 January 2017 (1,809) (0.01) (18) Calls on 9600 TWSE Index 18 January 2017 (159) (0.00)(1) Call on 134.25 EURO-BOBL Options 27 January 2017 (79) (0.00) (11) Calls on 9700 TWSE Index 18 January 2017 (32) (0.00)
(12) Call on 163.5 EURO-BUND Options 27 January 2017 (17,593) (0.10) (7) Calls on 9800 TWSE Index 18 January 2017 (12) (0.00)(7) Call on 164 EURO-BUND Options 27 January 2017 (8,048) (0.05) (5) Puts on 8700 TWSE Index 18 January 2017 (42) (0.00)
(14) Call on 164.5 EURO-BUND Options 27 January 2017 (12,109) (0.07) (12) Puts on 8800 TWSE Index 18 January 2017 (162) (0.00)(7) Call on 165 EURO-BUND Options 27 January 2017 (4,430) (0.03) (10) Puts on 8900 TWSE Index 18 January 2017 (217) (0.00)(1) Calls on 11750 DAX Index 17 March 2017 (1,155) (0.01) (8) Puts on 9000 TWSE Index 18 January 2017 (298) (0.00)(1) Calls on 11800 DAX Index 17 March 2017 (1,046) (0.01) (7) Puts on 9100 TWSE Index 18 January 2017 (429) (0.00)(1) Calls on 11850 DAX Index 17 March 2017 (944) (0.01) (6) Puts on 9200 TWSE Index 18 January 2017 (633) (0.01)(1) Calls on 11900 DAX Index 17 March 2017 (847) (0.01) (6) Puts on 9300 TWSE Index 18 January 2017 (1,033) (0.01)(1) Calls on 12000 DAX Index 17 March 2017 (675) (0.00) (4,357) (0.03)(5) Calls on 3275 SX5E Index 20 January 2017 (2,916) (0.02)(7) Calls on 3300 SX5E Index 20 January 2017 (3,094) (0.02) United KingdomUnited KingdomUnited KingdomUnited Kingdom
(12) Calls on 3325 SX5E Index 20 January 2017 (3,886) (0.02) (1) Calls on 6975 UKX Index 17 March 2017 (2,706) (0.02)(11) Calls on 3350 SX5E Index 20 January 2017 (2,518) (0.01) (1) Calls on 7050 UKX Index 17 March 2017 (2,132) (0.01)
(9) Calls on 3375 SX5E Index 20 January 2017 (1,395) (0.01) (2) Calls on 7075 UKX Index 17 March 2017 (3,917) (0.02)(15) Calls on 3400 SX5E Index 20 January 2017 (1,535) (0.01) (1) Calls on 71.25 UKX Index 17 March 2017 (1,625) (0.01)
(1) Put on 132 EURO-BOBL Options 27 January 2017 (21) (0.00) (2) Calls on 7100 UKX Index 17 March 2017 (3,571) (0.02)(7) Put on 132.5 EURO-BOBL Options 27 January 2017 (332) (0.00) (1) Calls on 7150 UKX Index 17 March 2017 (1,470) (0.01)(2) Put on 132.75 EURO-BOBL Options 27 January 2017 (148) (0.00) (1) Calls on 7200 UKX Index 17 March 2017 (1,192) (0.01)(1) Put on 133 EURO-BOBL Options 27 January 2017 (111) (0.00) (2) Calls on 7250 UKX Index 17 March 2017 (1,903) (0.01)
(14) Put on 158 EURO-BUND Options 27 January 2017 (443) (0.00) (3) Calls on 7300 UKX Index 17 March 2017 (2,224) (0.01)(12) Put on 158.5 EURO-BUND Options 27 January 2017 (506) (0.00) (2) Calls on 7350 UKX Index 17 March 2017 (1,124) (0.01)
(7) Put on 160 EURO-BUND Options 27 January 2017 (886) (0.01) (2) Calls on 7400 UKX Index 17 March 2017 (840) (0.01)(7) Put on 160.5 EURO-BUND Options 27 January 2017 (1,181) (0.01) (2) Puts on 6350 UKX Index 17 March 2017 (865) (0.01)(1) Puts on 10450 DAX Index 17 March 2017 (593) (0.00) (3) Puts on 6375 UKX Index 17 March 2017 (1,372) (0.01)(1) Puts on 10500 DAX Index 17 March 2017 (627) (0.00) (1) Puts on 64.5 UKX Index 17 March 2017 (538) (0.00)(1) Puts on 10550 DAX Index 17 March 2017 (662) (0.00) (2) Puts on 6400 UKX Index 17 March 2017 (964) (0.01)(1) Puts on 10600 DAX Index 17 March 2017 (701) (0.01) (2) Puts on 6425 UKX Index 17 March 2017 (1,013) (0.01)(1) Puts on 10750 DAX Index 17 March 2017 (830) (0.01) (2) Puts on 6475 UKX Index 17 March 2017 (1,137) (0.01)(7) Puts on 3075 SX5E Index 20 January 2017 (458) (0.00) (1) Puts on 6480 UKX Index 17 March 2017 (575) (0.00)(5) Puts on 3100 SX5E Index 20 January 2017 (417) (0.00) (2) Puts on 6500 UKX Index 17 March 2017 (1,199) (0.01)
(14) Puts on 3125 SX5E Index 20 January 2017 (1,491) (0.01) (1) Puts on 6550 UKX Index 17 March 2017 (667) (0.00)(9) Puts on 3150 SX5E Index 20 January 2017 (1,234) (0.01) (2) Puts on 6600 UKX Index 17 March 2017 (1,495) (0.01)(8) Puts on 3175 SX5E Index 20 January 2017 (1,426) (0.01) (2) Puts on 6725 UKX Index 17 March 2017 (1,977) (0.01)(8) Puts on 3200 SX5E Index 20 January 2017 (1,840) (0.01) (1) Puts on 6850 UKX Index 17 March 2017 (1,322) (0.01)(7) Puts on 3225 SX5E Index 20 January 2017 (2,067) (0.01) (1) Puts on 6950 UKX Index 17 March 2017 (1,680) (0.01)(6) Puts on 3250 SX5E Index 20 January 2017 (2,259) (0.01) (37,508) (0.22)
(82,708) (0.49)
United StatesUnited StatesUnited StatesUnited States
Hong KongHong KongHong KongHong Kong (73,780) AUD Call/USD Put K=0.7378 19 January 2017 (227) (0.00)(1) Calls on 10200 HSCEI Index 26 January 2017 (71) (0.00) (74,200) AUD Call/USD Put K=0.742 19 January 2017 (148) (0.00)(1) Calls on 10400 HSCEI Index 26 January 2017 (26) (0.00) (374,800) AUD Call/USD Put K=0.7496 18 January 2017 (353) (0.00)(2) Calls on 23400 HSI Index 26 January 2017 (168) (0.00) (376,450) AUD Call/USD Put K=0.7529 17 January 2017 (259) (0.00)(1) Puts on 9200 HSCEI Index 26 January 2017 (845) (0.00) (378,750) AUD Call/USD Put K=0.7575 03 January 2017 (17) (0.00)(1) Puts on 9400 HSCEI Index 26 January 2017 (1,367) (0.01) (380,900) AUD Call/USD Put K=0.7618 03 January 2017 (18) (0.00)
(2,477) (0.01) (305,120) AUD Call/USD Put K=0.7628 13 January 2017 (119) (0.00)
(71,010) AUD Put/USD Call K=0.7101 19 January 2017 (276) (0.00)
JapanJapanJapanJapan (71,190) AUD Put/USD Call K=0.7119 19 January 2017 (315) (0.00)(1) Calls on 18750 NKY Index 13 January 2017 (4,287) (0.03) (359,700) AUD Put/USD Call K=0.7194 18 January 2017 (2,567) (0.02)(1) Calls on 19000 NKY Index 13 January 2017 (2,744) (0.02) (361,900) AUD Put/USD Call K=0.7238 17 January 2017 (3,349) (0.02)(1) Calls on 19125 NKY Index 13 January 2017 (2,058) (0.01) (363,550) AUD Put/USD Call K=0.7271 03 January 2017 (2,036) (0.01)(1) Calls on 19250 NKY Index 13 January 2017 (1,500) (0.01) (365,000) AUD Put/USD Call K=0.73 03 January 2017 (3,224) (0.02)(1) Calls on 19500 NKY Index 13 January 2017 (729) (0.01) (294,120) AUD Put/USD Call K=0.7353 13 January 2017 (5,246) (0.03)(1) Calls on 19625 NKY Index 13 January 2017 (472) (0.00) (1) Call on 1.08 EURO FX Currency Options 03 March 2017 (1,113) (0.01)(1) Puts on 16875 NKY Index 13 January 2017 (86) (0.00) (11) Call on 117.75 US 5Year Future Options 27 January 2017 (3,953) (0.02)(1) Puts on 17000 NKY Index 13 January 2017 (103) (0.00) (18) Call on 118.5 US 5Year Future Options 27 January 2017 (1,969) (0.01)(1) Puts on 17250 NKY Index 13 January 2017 (137) (0.00) (22) Call on 118.75 US 5Year Future Options 27 January 2017 (1,547) (0.01)(1) Puts on 17375 NKY Index 13 January 2017 (154) (0.00) (26) Call on 119 US 5Year Future Options 27 January 2017 (1,016) (0.01)(1) Puts on 17500 NKY Index 13 January 2017 (189) (0.00) (2) Call on 123.5 US 10Year Future Options 27 January 2017 (2,313) (0.01)(1) Puts on 18125 NKY Index 13 January 2017 (472) (0.00) (1) Call on 124 US 10Year Future Options 27 January 2017 (828) (0.00)
(12,931) (0.08) (4) Call on 124.5 US 10Year Future Options 27 January 2017 (2,250) (0.01)
(5) Call on 125 US 10Year Future Options 27 January 2017 (1,797) (0.01)
South KoreaSouth KoreaSouth KoreaSouth Korea (7) Call on 125.5 US 10Year Future Options 27 January 2017 (1,641) (0.01)(1) Calls on 250 KOSPI2 Index 12 January 2017 (4,057) (0.02) (9) Call on 126 US 10Year Future Options 27 January 2017 (1,266) (0.01)(2) Calls on 252.5 KOSPI2 Index 12 January 2017 (6,069) (0.04) (13) Call on 127 US 10Year Future Options 27 January 2017 (813) (0.01)(3) Calls on 255 KOSPI2 Index 12 January 2017 (6,396) (0.04) (2) Call on 149 US BOND Future Options 27 January 2017 (5,313) (0.03)(3) Calls on 257.5 KOSPI2 Index 12 January 2017 (4,011) (0.02) (1) Call on 150 US BOND Future Options 27 January 2017 (2,031) (0.01)(6) Calls on 260 KOSPI2 Index 12 January 2017 (4,322) (0.03) (2) Call on 151 US BOND Future Options 27 January 2017 (3,000) (0.02)(8) Calls on 262.5 KOSPI2 Index 12 January 2017 (2,583) (0.02) (3) Call on 152 US BOND Future Options 27 January 2017 (3,234) (0.02)(8) Calls on 265 KOSPI2 Index 12 January 2017 (960) (0.01) (3) Call on 153 US BOND Future Options 27 January 2017 (2,250) (0.01)(4) Calls on 267.5 KOSPI2 Index 12 January 2017 (149) (0.00) (1) Call on 154 US BOND Future Options 27 January 2017 (500) (0.01)(4) Puts on 235 KOSPI2 Index 12 January 2017 (50) (0.00) (2) Call on 155 US BOND Future Options 27 January 2017 (688) (0.01)(4) Puts on 237.5 KOSPI2 Index 12 January 2017 (66) (0.00) (7) Call on 2250 S&P E-mini 20 January 2017 (5,950) (0.04)(3) Puts on 240 KOSPI2 Index 12 January 2017 (62) (0.00) (7) Call on 2255 S&P E-mini 20 January 2017 (5,075) (0.03)(3) Puts on 242.5 KOSPI2 Index 12 January 2017 (87) (0.00) (4) Call on 2260 S&P E-mini 20 January 2017 (2,500) (0.01)(5) Puts on 245 KOSPI2 Index 12 January 2017 (207) (0.00) (108,140) EUR Call/USD Put K=1.0814 13 January 2017 (158) (0.00)(8) Puts on 247.5 KOSPI2 Index 12 January 2017 (497) (0.00) (108,180) EUR Call/USD Put K=1.0818 11 January 2017 (120) (0.00)(7) Puts on 250 KOSPI2 Index 12 January 2017 (695) (0.00) (108,190) EUR Call/USD Put K=1.0819 13 January 2017 (152) (0.00)(5) Puts on 252.5 KOSPI2 Index 12 January 2017 (828) (0.00) (108,390) EUR Call/USD Put K=1.0839 13 January 2017 (131) (0.00)(4) Puts on 255 KOSPI2 Index 12 January 2017 (1,209) (0.01) (217,280) EUR Call/USD Put K=1.0864 05 January 2017 (96) (0.00)(2) Puts on 257.5 KOSPI2 Index 12 January 2017 (1,076) (0.01) (108,720) EUR Call/USD Put K=1.0872 03 January 2017 (47) (0.00)
(33,324) (0.20) (108,840) EUR Call/USD Put K=1.0884 03 January 2017 (46) (0.00)
(108,890) EUR Call/USD Put K=1.0889 04 January 2017 (45) (0.00)
TaiwanTaiwanTaiwanTaiwan (109,260) EUR Call/USD Put K=1.0926 05 January 2017 (35) (0.00)(3) Calls on 9300 TWSE Index 18 January 2017 (344) (0.00) (109,830) EUR Call/USD Put K=1.0983 05 January 2017 (30) (0.00)
(12) Calls on 9400 TWSE Index 18 January 2017 (670) (0.01) (110,080) EUR Call/USD Put K=1.1008 10 January 2017 (31) (0.00)
259
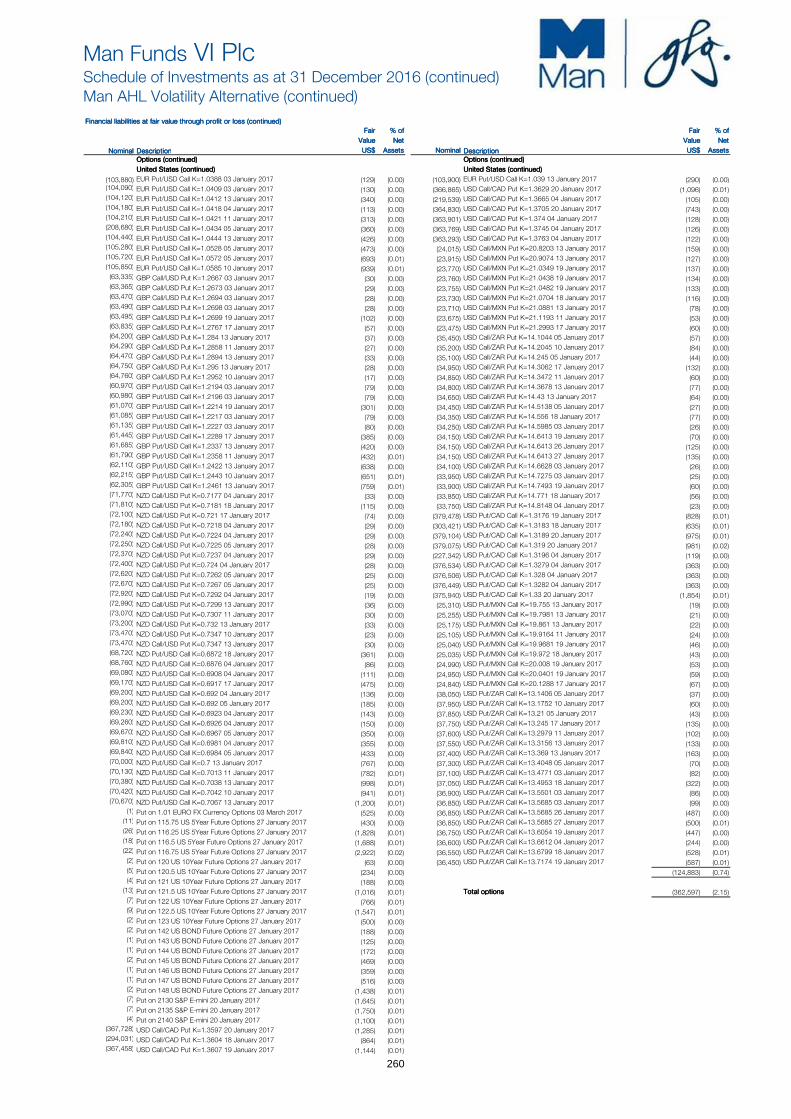
Man Funds VI PlcSchedule of Investments as at 31 December 2016 (continued)Man AHL Volatility Alternative (continued)
Financial liabilities at fair value through profit or loss (continued)Financial liabilities at fair value through profit or loss (continued)Financial liabilities at fair value through profit or loss (continued)Financial liabilities at fair value through profit or loss (continued)
Fair Fair Fair Fair % of% of% of% of Fair Fair Fair Fair % of% of% of% of
Value Value Value Value NetNetNetNet Value Value Value Value NetNetNetNet
Nominal Nominal Nominal Nominal DescriptionDescriptionDescriptionDescription US$ US$ US$ US$ AssetsAssetsAssetsAssets Nominal Nominal Nominal Nominal DescriptionDescriptionDescriptionDescription US$ US$ US$ US$ AssetsAssetsAssetsAssets
Options (continued)Options (continued)Options (continued)Options (continued) Options (continued)Options (continued)Options (continued)Options (continued)
United States (continued)United States (continued)United States (continued)United States (continued) United States (continued)United States (continued)United States (continued)United States (continued)
(103,880) EUR Put/USD Call K=1.0388 03 January 2017 (129) (0.00) (103,900) EUR Put/USD Call K=1.039 13 January 2017 (290) (0.00) (104,090) EUR Put/USD Call K=1.0409 03 January 2017 (130) (0.00) (366,865) USD Call/CAD Put K=1.3629 20 January 2017 (1,096) (0.01)(104,120) EUR Put/USD Call K=1.0412 13 January 2017 (340) (0.00) (219,539) USD Call/CAD Put K=1.3665 04 January 2017 (105) (0.00)(104,180) EUR Put/USD Call K=1.0418 04 January 2017 (113) (0.00) (364,830) USD Call/CAD Put K=1.3705 20 January 2017 (743) (0.00)(104,210) EUR Put/USD Call K=1.0421 11 January 2017 (313) (0.00) (363,901) USD Call/CAD Put K=1.374 04 January 2017 (128) (0.00)(208,680) EUR Put/USD Call K=1.0434 05 January 2017 (360) (0.00) (363,769) USD Call/CAD Put K=1.3745 04 January 2017 (126) (0.00)(104,440) EUR Put/USD Call K=1.0444 13 January 2017 (426) (0.00) (363,293) USD Call/CAD Put K=1.3763 04 January 2017 (122) (0.00)(105,280) EUR Put/USD Call K=1.0528 05 January 2017 (473) (0.00) (24,015) USD Call/MXN Put K=20.8203 13 January 2017 (159) (0.00)(105,720) EUR Put/USD Call K=1.0572 05 January 2017 (693) (0.01) (23,915) USD Call/MXN Put K=20.9074 13 January 2017 (127) (0.00)(105,850) EUR Put/USD Call K=1.0585 10 January 2017 (939) (0.01) (23,770) USD Call/MXN Put K=21.0349 19 January 2017 (137) (0.00)
(63,335) GBP Call/USD Put K=1.2667 03 January 2017 (30) (0.00) (23,760) USD Call/MXN Put K=21.0438 19 January 2017 (134) (0.00)(63,365) GBP Call/USD Put K=1.2673 03 January 2017 (29) (0.00) (23,755) USD Call/MXN Put K=21.0482 19 January 2017 (133) (0.00)(63,470) GBP Call/USD Put K=1.2694 03 January 2017 (28) (0.00) (23,730) USD Call/MXN Put K=21.0704 18 January 2017 (116) (0.00)(63,490) GBP Call/USD Put K=1.2698 03 January 2017 (28) (0.00) (23,710) USD Call/MXN Put K=21.0881 13 January 2017 (78) (0.00)(63,495) GBP Call/USD Put K=1.2699 19 January 2017 (102) (0.00) (23,675) USD Call/MXN Put K=21.1193 11 January 2017 (53) (0.00)(63,835) GBP Call/USD Put K=1.2767 17 January 2017 (57) (0.00) (23,475) USD Call/MXN Put K=21.2993 17 January 2017 (60) (0.00)(64,200) GBP Call/USD Put K=1.284 13 January 2017 (37) (0.00) (35,450) USD Call/ZAR Put K=14.1044 05 January 2017 (57) (0.00)(64,290) GBP Call/USD Put K=1.2858 11 January 2017 (27) (0.00) (35,200) USD Call/ZAR Put K=14.2045 10 January 2017 (84) (0.00)(64,470) GBP Call/USD Put K=1.2894 13 January 2017 (33) (0.00) (35,100) USD Call/ZAR Put K=14.245 05 January 2017 (44) (0.00)(64,750) GBP Call/USD Put K=1.295 13 January 2017 (28) (0.00) (34,950) USD Call/ZAR Put K=14.3062 17 January 2017 (132) (0.00)(64,760) GBP Call/USD Put K=1.2952 10 January 2017 (17) (0.00) (34,850) USD Call/ZAR Put K=14.3472 11 January 2017 (60) (0.00)(60,970) GBP Put/USD Call K=1.2194 03 January 2017 (79) (0.00) (34,800) USD Call/ZAR Put K=14.3678 13 January 2017 (77) (0.00)(60,980) GBP Put/USD Call K=1.2196 03 January 2017 (79) (0.00) (34,650) USD Call/ZAR Put K=14.43 13 January 2017 (64) (0.00)(61,070) GBP Put/USD Call K=1.2214 19 January 2017 (301) (0.00) (34,450) USD Call/ZAR Put K=14.5138 05 January 2017 (27) (0.00)(61,085) GBP Put/USD Call K=1.2217 03 January 2017 (79) (0.00) (34,350) USD Call/ZAR Put K=14.556 18 January 2017 (77) (0.00)(61,135) GBP Put/USD Call K=1.2227 03 January 2017 (80) (0.00) (34,250) USD Call/ZAR Put K=14.5985 03 January 2017 (26) (0.00)(61,445) GBP Put/USD Call K=1.2289 17 January 2017 (385) (0.00) (34,150) USD Call/ZAR Put K=14.6413 19 January 2017 (70) (0.00)(61,685) GBP Put/USD Call K=1.2337 13 January 2017 (420) (0.00) (34,150) USD Call/ZAR Put K=14.6413 26 January 2017 (125) (0.00)(61,790) GBP Put/USD Call K=1.2358 11 January 2017 (432) (0.01) (34,150) USD Call/ZAR Put K=14.6413 27 January 2017 (135) (0.00)(62,110) GBP Put/USD Call K=1.2422 13 January 2017 (638) (0.00) (34,100) USD Call/ZAR Put K=14.6628 03 January 2017 (26) (0.00)(62,215) GBP Put/USD Call K=1.2443 10 January 2017 (651) (0.01) (33,950) USD Call/ZAR Put K=14.7275 03 January 2017 (25) (0.00)(62,305) GBP Put/USD Call K=1.2461 13 January 2017 (759) (0.01) (33,900) USD Call/ZAR Put K=14.7493 19 January 2017 (60) (0.00)(71,770) NZD Call/USD Put K=0.7177 04 January 2017 (33) (0.00) (33,850) USD Call/ZAR Put K=14.771 18 January 2017 (56) (0.00)(71,810) NZD Call/USD Put K=0.7181 18 January 2017 (115) (0.00) (33,750) USD Call/ZAR Put K=14.8148 04 January 2017 (23) (0.00)(72,100) NZD Call/USD Put K=0.721 17 January 2017 (74) (0.00) (379,478) USD Put/CAD Call K=1.3176 19 January 2017 (828) (0.01)(72,180) NZD Call/USD Put K=0.7218 04 January 2017 (29) (0.00) (303,421) USD Put/CAD Call K=1.3183 18 January 2017 (635) (0.01)(72,240) NZD Call/USD Put K=0.7224 04 January 2017 (29) (0.00) (379,104) USD Put/CAD Call K=1.3189 20 January 2017 (975) (0.01)(72,250) NZD Call/USD Put K=0.7225 05 January 2017 (28) (0.00) (379,075) USD Put/CAD Call K=1.319 20 January 2017 (981) (0.02)(72,370) NZD Call/USD Put K=0.7237 04 January 2017 (29) (0.00) (227,342) USD Put/CAD Call K=1.3196 04 January 2017 (119) (0.00)(72,400) NZD Call/USD Put K=0.724 04 January 2017 (28) (0.00) (376,534) USD Put/CAD Call K=1.3279 04 January 2017 (363) (0.00)(72,620) NZD Call/USD Put K=0.7262 05 January 2017 (25) (0.00) (376,506) USD Put/CAD Call K=1.328 04 January 2017 (363) (0.00)(72,670) NZD Call/USD Put K=0.7267 05 January 2017 (25) (0.00) (376,449) USD Put/CAD Call K=1.3282 04 January 2017 (363) (0.00)(72,920) NZD Call/USD Put K=0.7292 04 January 2017 (19) (0.00) (375,940) USD Put/CAD Call K=1.33 20 January 2017 (1,854) (0.01)(72,990) NZD Call/USD Put K=0.7299 13 January 2017 (36) (0.00) (25,310) USD Put/MXN Call K=19.755 13 January 2017 (19) (0.00)(73,070) NZD Call/USD Put K=0.7307 11 January 2017 (30) (0.00) (25,255) USD Put/MXN Call K=19.7981 13 January 2017 (21) (0.00)(73,200) NZD Call/USD Put K=0.732 13 January 2017 (33) (0.00) (25,175) USD Put/MXN Call K=19.861 13 January 2017 (22) (0.00)(73,470) NZD Call/USD Put K=0.7347 10 January 2017 (23) (0.00) (25,105) USD Put/MXN Call K=19.9164 11 January 2017 (24) (0.00)(73,470) NZD Call/USD Put K=0.7347 13 January 2017 (30) (0.00) (25,040) USD Put/MXN Call K=19.9681 19 January 2017 (46) (0.00)(68,720) NZD Put/USD Call K=0.6872 18 January 2017 (361) (0.00) (25,035) USD Put/MXN Call K=19.972 18 January 2017 (43) (0.00)(68,760) NZD Put/USD Call K=0.6876 04 January 2017 (86) (0.00) (24,990) USD Put/MXN Call K=20.008 19 January 2017 (53) (0.00)(69,080) NZD Put/USD Call K=0.6908 04 January 2017 (111) (0.00) (24,950) USD Put/MXN Call K=20.0401 19 January 2017 (59) (0.00)(69,170) NZD Put/USD Call K=0.6917 17 January 2017 (475) (0.00) (24,840) USD Put/MXN Call K=20.1288 17 January 2017 (67) (0.00)(69,200) NZD Put/USD Call K=0.692 04 January 2017 (136) (0.00) (38,050) USD Put/ZAR Call K=13.1406 05 January 2017 (37) (0.00)(69,200) NZD Put/USD Call K=0.692 05 January 2017 (185) (0.00) (37,950) USD Put/ZAR Call K=13.1752 10 January 2017 (60) (0.00)(69,230) NZD Put/USD Call K=0.6923 04 January 2017 (143) (0.00) (37,850) USD Put/ZAR Call K=13.21 05 January 2017 (43) (0.00)(69,260) NZD Put/USD Call K=0.6926 04 January 2017 (150) (0.00) (37,750) USD Put/ZAR Call K=13.245 17 January 2017 (135) (0.00)(69,670) NZD Put/USD Call K=0.6967 05 January 2017 (350) (0.00) (37,600) USD Put/ZAR Call K=13.2979 11 January 2017 (102) (0.00)(69,810) NZD Put/USD Call K=0.6981 04 January 2017 (355) (0.00) (37,550) USD Put/ZAR Call K=13.3156 13 January 2017 (133) (0.00)(69,840) NZD Put/USD Call K=0.6984 05 January 2017 (433) (0.00) (37,400) USD Put/ZAR Call K=13.369 13 January 2017 (163) (0.00)(70,000) NZD Put/USD Call K=0.7 13 January 2017 (767) (0.00) (37,300) USD Put/ZAR Call K=13.4048 05 January 2017 (70) (0.00)(70,130) NZD Put/USD Call K=0.7013 11 January 2017 (782) (0.01) (37,100) USD Put/ZAR Call K=13.4771 03 January 2017 (82) (0.00)(70,380) NZD Put/USD Call K=0.7038 13 January 2017 (998) (0.01) (37,050) USD Put/ZAR Call K=13.4953 18 January 2017 (322) (0.00)(70,420) NZD Put/USD Call K=0.7042 10 January 2017 (941) (0.01) (36,900) USD Put/ZAR Call K=13.5501 03 January 2017 (86) (0.00)(70,670) NZD Put/USD Call K=0.7067 13 January 2017 (1,200) (0.01) (36,850) USD Put/ZAR Call K=13.5685 03 January 2017 (99) (0.00)
(1) Put on 1.01 EURO FX Currency Options 03 March 2017 (525) (0.00) (36,850) USD Put/ZAR Call K=13.5685 26 January 2017 (487) (0.00)(11) Put on 115.75 US 5Year Future Options 27 January 2017 (430) (0.00) (36,850) USD Put/ZAR Call K=13.5685 27 January 2017 (500) (0.01)(26) Put on 116.25 US 5Year Future Options 27 January 2017 (1,828) (0.01) (36,750) USD Put/ZAR Call K=13.6054 19 January 2017 (447) (0.00)(18) Put on 116.5 US 5Year Future Options 27 January 2017 (1,688) (0.01) (36,600) USD Put/ZAR Call K=13.6612 04 January 2017 (244) (0.00)(22) Put on 116.75 US 5Year Future Options 27 January 2017 (2,922) (0.02) (36,550) USD Put/ZAR Call K=13.6799 18 January 2017 (528) (0.01)
(2) Put on 120 US 10Year Future Options 27 January 2017 (63) (0.00) (36,450) USD Put/ZAR Call K=13.7174 19 January 2017 (587) (0.01)(5) Put on 120.5 US 10Year Future Options 27 January 2017 (234) (0.00) (124,883) (0.74)(4) Put on 121 US 10Year Future Options 27 January 2017 (188) (0.00)
(13) Put on 121.5 US 10Year Future Options 27 January 2017 (1,016) (0.01) Total optionsTotal optionsTotal optionsTotal options (362,597) (2.15)(7) Put on 122 US 10Year Future Options 27 January 2017 (766) (0.01)(9) Put on 122.5 US 10Year Future Options 27 January 2017 (1,547) (0.01)(2) Put on 123 US 10Year Future Options 27 January 2017 (500) (0.00)(2) Put on 142 US BOND Future Options 27 January 2017 (188) (0.00)(1) Put on 143 US BOND Future Options 27 January 2017 (125) (0.00)(1) Put on 144 US BOND Future Options 27 January 2017 (172) (0.00)(2) Put on 145 US BOND Future Options 27 January 2017 (469) (0.00)(1) Put on 146 US BOND Future Options 27 January 2017 (359) (0.00)(1) Put on 147 US BOND Future Options 27 January 2017 (516) (0.00)(2) Put on 148 US BOND Future Options 27 January 2017 (1,438) (0.01)(7) Put on 2130 S&P E-mini 20 January 2017 (1,645) (0.01)(7) Put on 2135 S&P E-mini 20 January 2017 (1,750) (0.01)(4) Put on 2140 S&P E-mini 20 January 2017 (1,100) (0.01)
(367,728) USD Call/CAD Put K=1.3597 20 January 2017 (1,285) (0.01)(294,031) USD Call/CAD Put K=1.3604 18 January 2017 (864) (0.01)(367,458) USD Call/CAD Put K=1.3607 19 January 2017 (1,144) (0.01)
260

Man Funds VI PlcSchedule of Investments as at 31 December 2016 (continued)Man AHL Volatility Alternative (continued)
Financial liabilities at fair value through profit or loss (continued)Financial liabilities at fair value through profit or loss (continued)Financial liabilities at fair value through profit or loss (continued)Financial liabilities at fair value through profit or loss (continued)
Forward currency contracts (note 4)Forward currency contracts (note 4)Forward currency contracts (note 4)Forward currency contracts (note 4)
Unrealised Unrealised Unrealised Unrealised % of% of% of% of
loss loss loss loss Net Net Net Net
Amount ReceivableAmount ReceivableAmount ReceivableAmount Receivable Amount PayableAmount PayableAmount PayableAmount Payable Maturity DateMaturity DateMaturity DateMaturity Date ContractsContractsContractsContracts US$ US$ US$ US$ AssetsAssetsAssetsAssets
AUD83,679 US$60,983 19 January 2017 1 (424) (0.00)
€100,000 JPY12,319,000 05 January 2017 1 (153) (0.00)
€1,722,306 US$1,829,606 31 January 2017 1 (9,918) (0.06)
GBP401 US$501 19 January 2017 1 (6) (0.00)
JPY40,000,000 US$343,799 05 January 2017 1 (670) (0.01)
KRW328,120,995 US$274,463 19 January 2017 1 (2,230) (0.01)
TRY1,600,000 US$453,166 19 January 2017 1 (197) (0.00)
US$2,524,549 €2,423,213 19 January 2017 3 (34,235) (0.20)
US$1,008 GBP821 19 January 2017 2 (7) (0.00)
US$188,929 HKD1,466,449 19 January 2017 2 (233) (0.00)
US$177,990 JPY20,897,474 19 January 2017 5 (1,404) (0.01)
US$4,594 NOK39,810 19 January 2017 5 (32) (0.00)
US$557,199 NZD800,000 05 January 2017 1 (517) (0.00)
US$9,868 SEK90,349 19 January 2017 6 (92) (0.00)
US$452,732 TRY1,600,000 19 January 2017 1 (237) (0.00)
Total unrealised loss on forward currency contractsTotal unrealised loss on forward currency contractsTotal unrealised loss on forward currency contractsTotal unrealised loss on forward currency contracts (50,355) (0.29)
Total financial liabilities at fair value through profit or loss - tradingTotal financial liabilities at fair value through profit or loss - tradingTotal financial liabilities at fair value through profit or loss - tradingTotal financial liabilities at fair value through profit or loss - trading (437,756) (2.59)
Total financial assets at fair value through profit or loss - tradingTotal financial assets at fair value through profit or loss - tradingTotal financial assets at fair value through profit or loss - tradingTotal financial assets at fair value through profit or loss - trading 4,431,381 26.24
Total financial liabilities at fair value through profit or loss - tradingTotal financial liabilities at fair value through profit or loss - tradingTotal financial liabilities at fair value through profit or loss - tradingTotal financial liabilities at fair value through profit or loss - trading (437,756) (2.59)
Other net assetsOther net assetsOther net assetsOther net assets 12,893,864 76.35
Net Assets Attributable to Holders of Redeembale Participating SharesNet Assets Attributable to Holders of Redeembale Participating SharesNet Assets Attributable to Holders of Redeembale Participating SharesNet Assets Attributable to Holders of Redeembale Participating Shares 16,887,489 100.00
*The forward currency contracts are held with the Bank of New York Mellon, Brussels
ClassificationClassificationClassificationClassification
(a) Exchange traded derivative instruments
(b) OTC financial derivative instruments
All other investments held at the year end are transferable securities listed on an official stock exchange
% of Total% of Total% of Total% of Total
Analysis of Total AssetsAnalysis of Total AssetsAnalysis of Total AssetsAnalysis of Total Assets Assets Assets Assets Assets
Transferable securities listed on an official stock exchange 24.37
Exchange traded financial derivative instruments described in classification (a) above 0.44
OTC financial derivative instruments described in classification (b) above 0.32
Other current assets 74.87
100.00
261

Man Funds VI PlcSchedule of Investments as at 31 December 2016 (continued)Man GLG European Mid-Cap Equity Alternative
Financial assets at fair value through profit or loss Fair % of Fair % of
Value Net Value Net
Nominal Description € Assets Nominal Description € AssetsContracts for difference (b) Equities (continued)Belgium Italy
(380,333) bpost SA 405,352 0.12 521,394 Amplifon SpA 4,718,616 1.42655,716 Moncler SpA 10,838,985 3.26
France 314,581 Prysmian SpA 7,675,776 2.31 66,415 Alten 708,953 0.21 23,233,377 6.99 462,773 Altran Technologies SA 456,184 0.14 121,135 Arkema SA 1,652,339 0.50 Luxembourg
501,152 Elior Group SA 1,190,005 0.36 461,542 ArcelorMittal 3,238,179 0.97(315,133) Klepierre SA 621,069 0.19
131,496 Maisons Du Monde SA 14,889 0.00 Netherlands
169,763 Rubis SCA 900,632 0.27 426,822 Aalberts Industries NV 13,154,654 3.96 184,705 Teleperformance 2,029,920 0.61 706,127 ABN AMRO Group NV 14,863,973 4.47
7,573,991 2.28 159,935 IMCD Group NV 6,475,768 1.952,697,635 ING Groep NV 36,067,380 10.86
Germany 70,561,775 21.24(1,300,000) Commerzbank AG 1,199,900 0.36
288,153 Drillisch AG 772,286 0.23 Total equities 280,450,967 84.42(115,864) Fielmann AG 376,291 0.11(158,622) GEA Group AG 342,107 0.10 Option (b)
(73,351) Norma Group SE 301,725 0.09 Germany
(748,795) RWE AG 1,602,421 0.49 904 Put on 2900 Sx5E 17 March 2017 215,152 0.06(390,220) Vonovia SE 302,421 0.09
4,897,151 1.47 Total option 215,152 0.06
Ireland Preferred stock
649,436 C&C Group Plc 115,930 0.04 Germany
122,747 DCC Plc 251,997 0.08 185,000 Volkswagen AG 24,669,750 7.43367,927 0.12
Total preferred stock 24,669,750 7.43Luxembourg
(461,542) ArcelorMittal 311,079 0.09
Netherlands
(706,127) ABN AMRO Group NV 222,430 0.07(2,697,635) ING Groep NV 606,968 0.18
829,398 0.25
Spain
(2,082,196) Distribuidora Internacional De Alimentacion Sa 1,190,026 0.36
Sweden
(625,149) Getinge AB 925,425 0.28(398,918) ICA Gruppen AB 274,354 0.08160,859 Nobia AB 67,658 0.02
(315,133) Swedish Match AB 237,232 0.07229,211 Thule Group AB 122,954 0.04
1,627,623 0.49
United Kingdom
1,147,582 Ascential Plc 215,642 0.071,153,525 Booker Group Plc 23,219 0.01
948,000 Cineworld Group Plc 192,586 0.06816,112 Dominos Pizza United Kingdom & Ireland Plc 100,186 0.03
1,524,630 Equiniti Group Plc 309,414 0.09(2,217,359) Halfords Group Plc 139,293 0.041,833,060 Informa Plc 819,371 0.251,393,559 RPC Group Plc 3,090,195 0.93
663,215 UBM Plc 340,428 0.105,230,334 1.58
Total contracts for difference 22,432,881 6.76
EquitiesDenmark
71,785 Nkt Holding A/S 4,816,552 1.4556,017 Pandora A/S 6,961,148 2.10
11,777,700 3.55
Germany
575,444 Brenntag AG 30,383,443 9.151,300,000 Commerzbank AG 9,419,800 2.84
206,079 CTS Eventim AG & Company KGaA 6,172,066 1.86457,915 Deutsche Post AG 14,302,975 4.31228,921 Deutsche Telekom AG 3,744,003 1.13
76,168 E.ON SE 510,326 0.15604,508 Fresenius SE and Company KGaA 44,890,764 13.51748,965 Infineon Technologies AG 12,365,412 3.72
95,602 Merck KGaA 9,478,938 2.8520,424 Muenchener Rueckversicherungs-Gesellschaft
AG In Muenchen 3,669,172 1.10748,795 RWE AG 8,847,013 2.66
91,456 Scout24 AG 3,093,500 0.93342,439 United Internet AG 12,702,775 3.82390,220 Vonovia SE 12,059,749 3.64
171,639,936 51.67
262
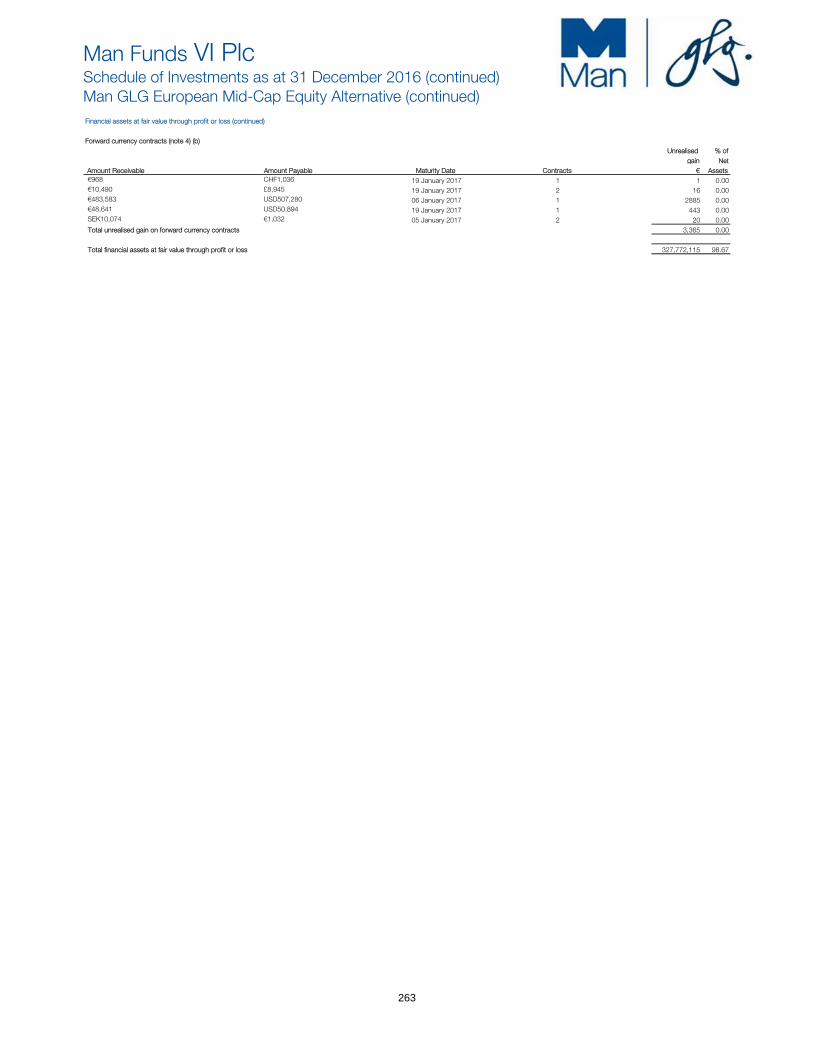
Man Funds VI PlcSchedule of Investments as at 31 December 2016 (continued)Man GLG European Mid-Cap Equity Alternative (continued)Financial assets at fair value through profit or loss (continued)
Forward currency contracts (note 4) (b)Unrealised % of
gain Net
Amount Receivable Amount Payable Maturity Date Contracts € Assets€968 CHF1,036 19 January 2017 1 1 0.00€10,490 £8,945 19 January 2017 2 16 0.00€483,583 USD507,280 06 January 2017 1 2885 0.00€48,641 USD50,894 19 January 2017 1 443 0.00SEK10,074 €1,032 05 January 2017 2 20 0.00Total unrealised gain on forward currency contracts 3,365 0.00
Total financial assets at fair value through profit or loss 327,772,115 98.67
263

Man Funds VI PlcSchedule of Investments as at 31 December 2016 (continued)Man GLG European Mid-Cap Equity Alternative (continued)
Financial liabilities at fair value through profit or loss Fair % of
Value Net
Nominal Description € AssetsContracts for DifferenceDenmark
380,677 ISS A/S (362,309) (0.11)(66,414) Scandinavian Tobacco Group A (65,770) (0.02)
(428,079) (0.13)
Finland
(135,663) Wartsila OYJ (488,916) (0.15)
France
156 Kaufman & Broad S.A. (329) (0.00) 71,087 Nexity (52,282) (0.02)
(133,742) Spie SA (335,816) (0.10)(388,427) (0.12)
Germany
(279,176) Brenntag AG_CSFB (978,512) (0.29)(457,915) Deutsche Post AG (1,664,521) (0.50)(228,921) Deutsche Telekom AG (458,987) (0.14)
(76,168) E.ON AG (42,654) (0.01)(274,096) Fraport AG Frankfurt Airport Services Worldwide (1,251,129) (0.38)(604,508) Fresenius SE and Company KGaA (3,300,614) (0.99)(748,965) Infineon Technologies AG (104,855) (0.03)
(95,602) Merck KGaA (473,230) (0.14)(335,774) Metro AG (1,373,952) (0.41)
(20,424) Muenchener Rueckver AG-Reg (116,417) (0.04)(185,000) Volkswagen AG (1,924,000) (0.59)
(11,688,871) (3.52)
Ireland153,477 Smurfit Kappa Group Plc (8,734) (0.00)
Netherlands
(204,286) Boskalis Westminster (205,242) (0.06)
Norway
(256,608) Marine Harvest (263,423) (0.08)
Sweden
(457,624) Alfa Laval AB (823,009) (0.25)(1,334,182) Husqvarna AB (662,741) (0.20)
(1,485,750) (0.45)
Switzerland
(84,790) DKSH Holding AG (328,090) (0.10)(39,560) Panalpina Welttransport Holding AG (476,509) (0.14)
(804,599) (0.24)
United Kingdom
(2,660,177) AA Plc (395,568) (0.12)(683,710) DS Smith Plc (174,393) (0.05)902,488 Howden Joinery Group Plc (881,490) (0.27)
(1,805,682) Marks & Spencer Group Plc (251,003) (0.08)(922,078) Pearson Plc (283,140) (0.09)
(1,679) Russell UK MID 150 (81,710) (0.02)(483,337) Victrex Plc (2,046,817) (0.61)(159,835) Whitbread Plc (191,720) (0.06)
(4,305,841) (1.30)
Total contracts for difference (20,067,882) (6.05)
264

Man Funds VI PlcSchedule of Investments as at 31 December 2016 (continued)Man GLG European Mid-Cap Equity Alternative (continued)Financial liabilities at fair value through profit or loss (continued)
Forward currency contracts (note 4)Unrealised % of
loss Net
Amount Receivable Amount Payable Maturity Date Contracts € AssetsCHF1,262,837 €1,182,093 06 January 2017 2 (4,045) (0.00) €10,335,171 DKK76,839,176 19 January 2017 4 (186) (0.00) £9,727,080 €11,574,763 06 January 2017 2 (182,382) (0.05)USD33,924,045 €32,506,496 06 January 2017 4 (360,145) (0.11)Total unrealised loss on forward currency contracts (546,758) (0.16)
Total financial liabilities at fair value through profit or loss - trading (20,614,640) (6.21)
Total financial assets at fair value through profit or loss - trading 327,772,115 98.67
Total financial liabilities at fair value through profit or loss - trading (20,614,640) (6.21)
Other net assets 25,020,369 7.54
Net Assets Attributable to Holders of Redeemable Participating Shares 332,177,844 100.00
* The forward currency contracts are held with The Bank of New York Mellon, Brussels
Classifications:(a) Exchange traded derivative instruments(b) OTC financial derivative instrumentsAll other investments held at the year end are transferable securities listed on an official stock exchange
TotalAnalysis of Total Assets AssetsTransferable securities listed on an official stock exchange 83.20OTC financial derivative instruments described in classification (b) above 6.18Other current assets 10.62
100.00
Analysis of Total Assets rather than Net Assets is required under UCITS Notice 8.2 appendix B.
265

Man Funds VI PlcSchedule of Investments as at 31 December 2016 (continued)Man Numeric Market Neutral AlternativeFinancial assets at fair value through profit or loss
Fair % of Value Net
Nominal Description US$ AssetsContracts for difference (b)Finland
(64,983) Cramo OYJ 4,529 0.00
Germany(100,809) Hannover Rueck SE 201,916 0.12
(42,232) Hochtief AG 36,785 0.02 (82,136) Rheinmetall AG 232,816 0.14 (70,060) Siltronic AG 110,606 0.07
582,123 0.35
Switzerland(18,728) Lonza Group AG 106,276 0.06
(3,297) Schindler Holding AG 8,005 0.00 114,281 0.06
United States1,523,747 MS Numeric Market Neutral 3,688,237 2.18
Total contracts for difference 4,389,170 2.59
EquitiesFinland
64,983 Cramo OYJ 1,630,586 0.96 192,668 Sanoma OYJ 1,675,521 0.99
3,306,107 1.95
Germany120,820 Aareal Bank AG 4,557,709 2.68
73,727 Aurubis AG 4,261,444 2.51 33,470 Bechtle AG 3,488,591 2.06
129,244 Carl Zeiss Meditec AG 4,771,204 2.82 160,371 Covestro AG 11,025,283 6.51 163,293 Freenet AG 4,608,963 2.72 100,809 Hannover Rueck SE 10,930,548 6.45 104,257 Hella KGaA Hueck & Company 3,941,698 2.33
42,232 HOCHTIEF (India) Private Lmited 5,926,606 3.50 110,382 KION Group AG 6,154,247 3.63
29,621 Nemetschek SE 1,726,474 1.02 264,798 Osram Licht AG 13,915,908 8.21
82,136 Rheinmetall AG 5,535,845 3.27 201,010 RHOEN-KLINIKUM AG 5,440,313 3.21
70,060 Siltronic AG 3,253,262 1.92 269,213 Suedzucker AG 6,442,880 3.80 288,024 Tag Immobilien AG 3,815,644 2.25 271,084 Talanx AG 9,083,864 5.36
108,880,483 64.25
Hungary55,376 Wizz Air Holdings Plc 1,225,498 0.72
Luxembourg105,143 Aperam SA 4,820,250 2.85 145,470 RTL Group SA 10,698,986 6.31
15,519,236 9.16
Netherlands121,189 ASM International NV 5,449,780 3.22 880,854 PostNL NV 3,801,798 2.24
9,251,578 5.46
Sweden265,808 NCC AB 6,595,021 3.90 237,665 Nordea Bank AB 2,651,567 1.56
9,246,588 5.46
Switzerland8,499 Flughafen Zuerich AG 1,579,634 0.94
186 Kuehne + Nagel International AG 24,633 0.01 18,728 Lonza Group AG 3,248,631 1.92
3,297 Schindler Holding AG 582,615 0.34 49,372 Sunrise Communications Group AG 3,254,710 1.92
8,690,223 5.13
Total equities 156,119,713 92.13
Preferred stockGermany
380,036 Schaeffler AG 5,633,848 3.32
Total preferred stock 5,633,848 3.32
266
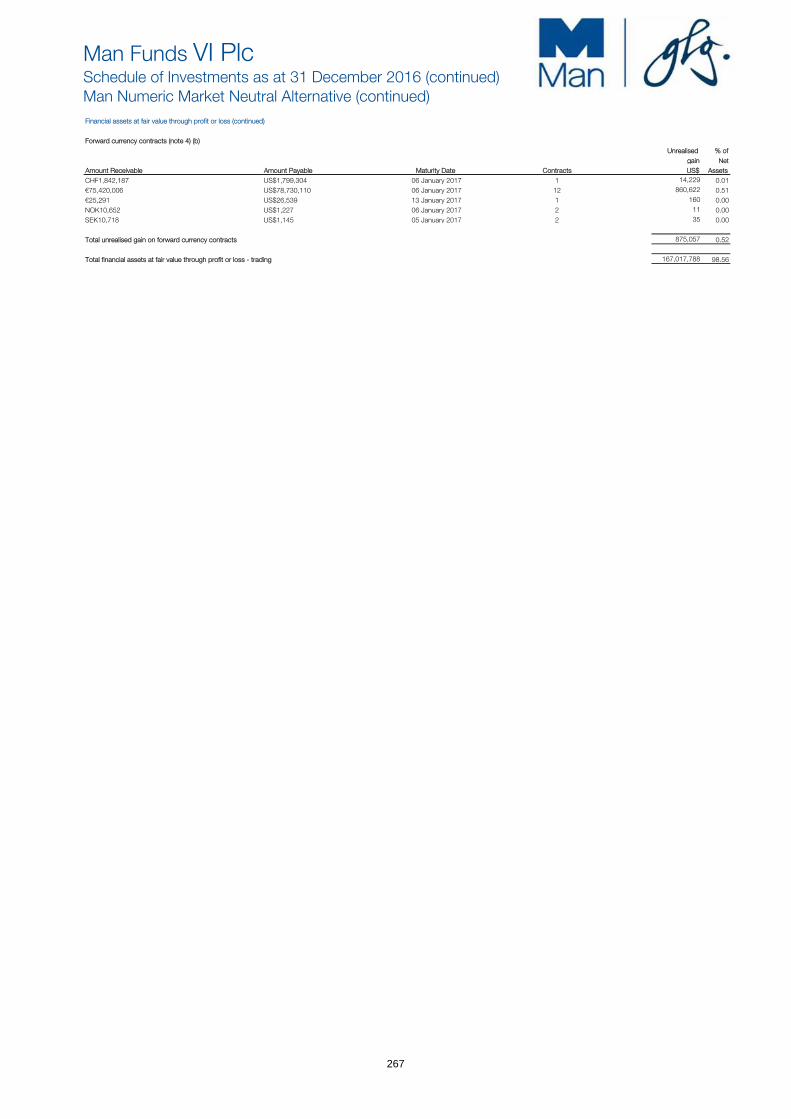
Man Funds VI PlcSchedule of Investments as at 31 December 2016 (continued)Man Numeric Market Neutral Alternative (continued)Financial assets at fair value through profit or loss (continued)
Forward currency contracts (note 4) (b)Unrealised % of
gain Net
Amount Receivable Amount Payable Maturity Date Contracts US$ AssetsCHF1,842,187 US$1,799,304 06 January 2017 1 14,229 0.01 €75,420,006 US$78,730,110 06 January 2017 12 860,622 0.51 €25,291 US$26,539 13 January 2017 1 160 0.00 NOK10,652 US$1,227 06 January 2017 2 11 0.00 SEK10,718 US$1,145 05 January 2017 2 35 0.00
Total unrealised gain on forward currency contracts 875,057 0.52
Total financial assets at fair value through profit or loss - trading 167,017,788 98.56
267

Man Funds VI PlcSchedule of Investments as at 31 December 2016 (continued)Man Numeric Market Neutral Alternative (continued)Financial liabilities at fair value through profit or loss
Fair % of Value Net
Nominal Description US$ AssetsContracts for differenceFinland
(192,668) Sanoma OYJ (80,885) (0.05)
Germany(120,820) Aareal Bank AG (281,889) (0.17)
(73,727) Aurubis AG (195,347) (0.11)(33,470) Bechtle AG (229,681) (0.14)
(129,244) Carl Zeiss Meditec AG (119,158) (0.07)(160,371) Covestro AG (385,364) (0.23)(163,293) Freenet AG (286,518) (0.17)(104,257) Hella KGaA Hueck & Company (187,654) (0.11)(110,382) KION Group AG (25,721) (0.02)
(29,621) Nemetschek SE (41,466) (0.02)(264,798) Osram Licht AG (328,566) (0.19)(201,010) Rhoen-Klinikum AG (105,987) (0.06)(380,036) Schaeffler AG (62,862) (0.04)(269,213) Suedzucker AG (357,159) (0.21)(288,024) Tag Immobilien AG (223,390) (0.13)(271,084) Talanx AG (383,310) (0.23)
(3,214,072) (1.90)
Hungary(55,376) Wizz Air Holdings Plc (83,756) (0.05)
Luxembourg(105,143) Aperam SA (32,841) (0.02)(145,470) RTL Group (187,455) (0.11)
(220,296) (0.13)
Netherlands(121,189) ASM International NV (291,117) (0.17)(880,854) Postnl NV (144,845) (0.09)
(435,962) (0.26)
Sweden(265,808) NCC AB (249,253) (0.15)(237,665) Nordea Bank AB (155,443) (0.09)
(404,696) (0.24)
Switzerland(8,499) Flughafen Zuerich AG (122,043) (0.07)
(186) Kuehne + Nagel International AG (939) (0.00) (49,372) Sunrise Communications Group AG (223,530) (0.13)
(346,512) (0.20)
Total contracts for difference (4,786,179) (2.83)
268
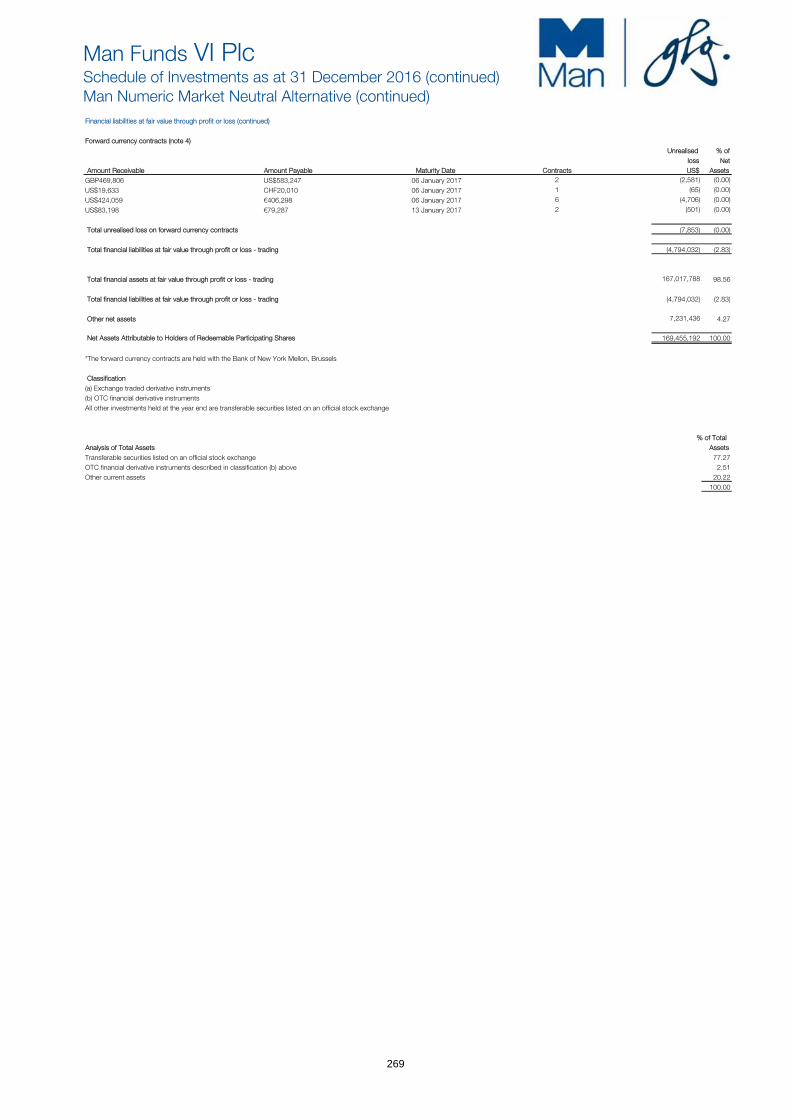
Man Funds VI PlcSchedule of Investments as at 31 December 2016 (continued)Man Numeric Market Neutral Alternative (continued)Financial liabilities at fair value through profit or loss (continued)
Forward currency contracts (note 4)Unrealised % of
loss Net
Amount Receivable Amount Payable Maturity Date Contracts US$ AssetsGBP469,806 US$583,247 06 January 2017 2 (2,581) (0.00)
US$19,633 CHF20,010 06 January 2017 1 (65) (0.00)
US$424,059 €406,298 06 January 2017 6 (4,706) (0.00)
US$83,198 €79,287 13 January 2017 2 (501) (0.00)
Total unrealised loss on forward currency contracts (7,853) (0.00)
Total financial liabilities at fair value through profit or loss - trading (4,794,032) (2.83)
Total financial assets at fair value through profit or loss - trading 167,017,788 98.56
Total financial liabilities at fair value through profit or loss - trading (4,794,032) (2.83)
Other net assets 7,231,436 4.27
Net Assets Attributable to Holders of Redeemable Participating Shares 169,455,192 100.00
*The forward currency contracts are held with the Bank of New York Mellon, Brussels
Classification(a) Exchange traded derivative instruments(b) OTC financial derivative instrumentsAll other investments held at the year end are transferable securities listed on an official stock exchange
% of TotalAnalysis of Total Assets Assets Transferable securities listed on an official stock exchange 77.27 OTC financial derivative instruments described in classification (b) above 2.51 Other current assets 20.22
100.00
269
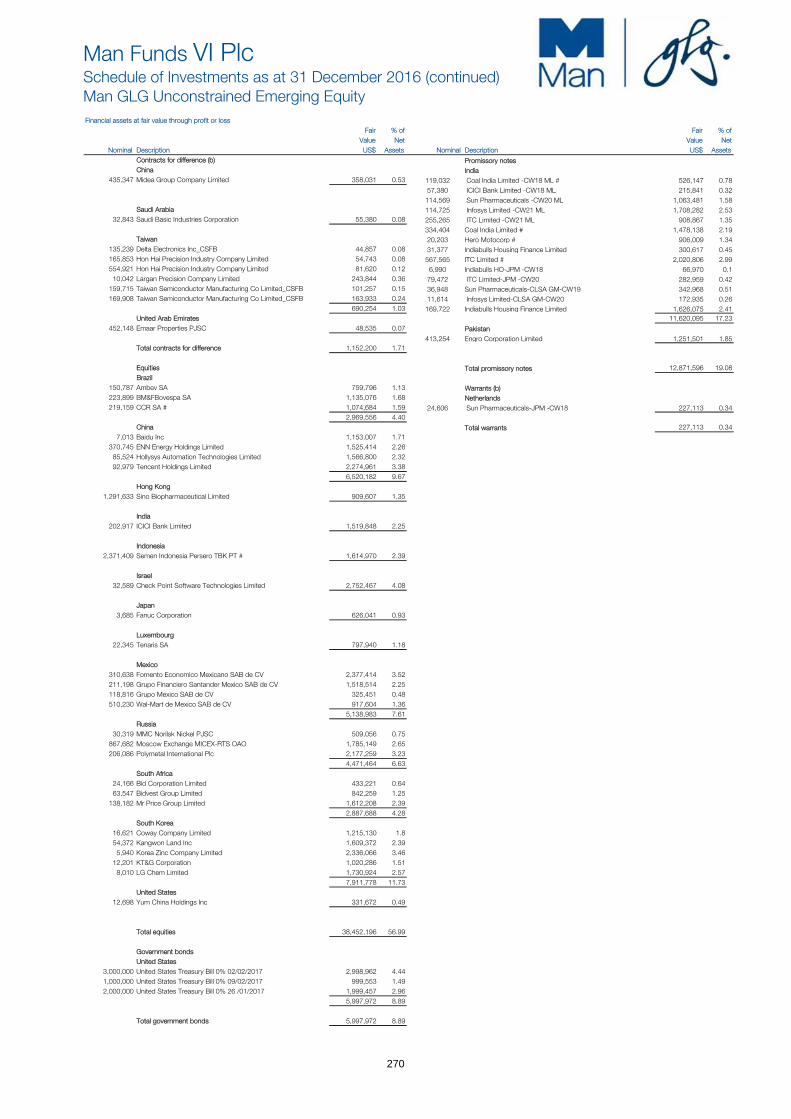
Man Funds VI PlcSchedule of Investments as at 31 December 2016 (continued)Man GLG Unconstrained Emerging EquityFinancial assets at fair value through profit or loss
Fair % of Fair % of Value Net Value Net
Nominal Description US$ Assets Nominal Description US$ AssetsContracts for difference (b) Promissory notesChina India
435,347 Midea Group Company Limited 358,031 0.53 119,032 Coal India Limited -CW18 ML # 526,147 0.7857,380 ICICI Bank Limited -CW18 ML 215,841 0.32
114,569 Sun Pharmaceuticals -CW20 ML 1,063,481 1.58Saudi Arabia 114,725 Infosys Limited -CW21 ML 1,708,282 2.53
32,843 Saudi Basic Industries Corporation 55,380 0.08 255,265 ITC Limited -CW21 ML 908,867 1.35334,404 Coal India Limited # 1,478,138 2.19
Taiwan 20,203 Hero Motocorp # 906,009 1.34135,239 Delta Electronics Inc_CSFB 44,857 0.08 31,377 Indiabulls Housing Finance Limited 300,617 0.45165,853 Hon Hai Precision Industry Company Limited 54,743 0.08 567,565 ITC Limited # 2,020,806 2.99554,921 Hon Hai Precision Industry Company Limited 81,620 0.12 6,990 Indiabulls HO-JPM -CW18 66,970 0.1
10,042 Largan Precision Company Limited 243,844 0.36 79,472 ITC Limited-JPM -CW20 282,959 0.42159,715 Taiwan Semiconductor Manufacturing Co Limited_CSFB 101,257 0.15 36,948 Sun Pharmaceuticals-CLSA GM-CW19 342,968 0.51169,908 Taiwan Semiconductor Manufacturing Co Limited_CSFB 163,933 0.24 11,614 Infosys Limited-CLSA GM-CW20 172,935 0.26
690,254 1.03 169,722 Indiabulls Housing Finance Limited 1,626,075 2.41United Arab Emirates 11,620,095 17.23
452,148 Emaar Properties PJSC 48,535 0.07 Pakistan413,254 Engro Corporation Limited 1,251,501 1.85
Total contracts for difference 1,152,200 1.71
Equities Total promissory notes 12,871,596 19.08 Brazil
150,787 Ambev SA 759,796 1.13 Warrants (b)223,899 BM&FBovespa SA 1,135,076 1.68 Netherlands219,159 CCR SA # 1,074,684 1.59 24,606 Sun Pharmaceuticals-JPM -CW18 227,113 0.34
2,969,556 4.40 China Total warrants 227,113 0.34
7,013 Baidu Inc 1,153,007 1.71370,745 ENN Energy Holdings Limited 1,525,414 2.26
85,524 Hollysys Automation Technologies Limited 1,566,800 2.3292,979 Tencent Holdings Limited 2,274,961 3.38
6,520,182 9.67 Hong Kong
1,291,633 Sino Biopharmaceutical Limited 909,607 1.35
India202,917 ICICI Bank Limited 1,519,848 2.25
Indonesia2,371,409 Semen Indonesia Persero TBK PT # 1,614,970 2.39
Israel32,589 Check Point Software Technologies Limited 2,752,467 4.08
Japan3,685 Fanuc Corporation 626,041 0.93
Luxembourg22,345 Tenaris SA 797,940 1.18
Mexico310,638 Fomento Economico Mexicano SAB de CV 2,377,414 3.52211,198 Grupo Financiero Santander Mexico SAB de CV 1,518,514 2.25118,816 Grupo Mexico SAB de CV 325,451 0.48510,230 Wal-Mart de Mexico SAB de CV 917,604 1.36
5,138,983 7.61 Russia
30,319 MMC Norilsk Nickel PJSC 509,056 0.75867,682 Moscow Exchange MICEX-RTS OAO 1,785,149 2.65206,086 Polymetal International Plc 2,177,259 3.23
4,471,464 6.63 South Africa
24,166 Bid Corporation Limited 433,221 0.6463,547 Bidvest Group Limited 842,259 1.25
138,182 Mr Price Group Limited 1,612,208 2.392,887,688 4.28
South Korea16,621 Coway Company Limited 1,215,130 1.854,372 Kangwon Land Inc 1,609,372 2.39
5,940 Korea Zinc Company Limited 2,336,066 3.4612,201 KT&G Corporation 1,020,286 1.51
8,010 LG Chem Limited 1,730,924 2.577,911,778 11.73
United States12,698 Yum China Holdings Inc 331,672 0.49
Total equities 38,452,196 56.99
Government bondsUnited States
3,000,000 United States Treasury Bill 0% 02/02/2017 2,998,962 4.441,000,000 United States Treasury Bill 0% 09/02/2017 999,553 1.492,000,000 United States Treasury Bill 0% 26 /01/2017 1,999,457 2.96
5,997,972 8.89
Total government bonds 5,997,972 8.89
270
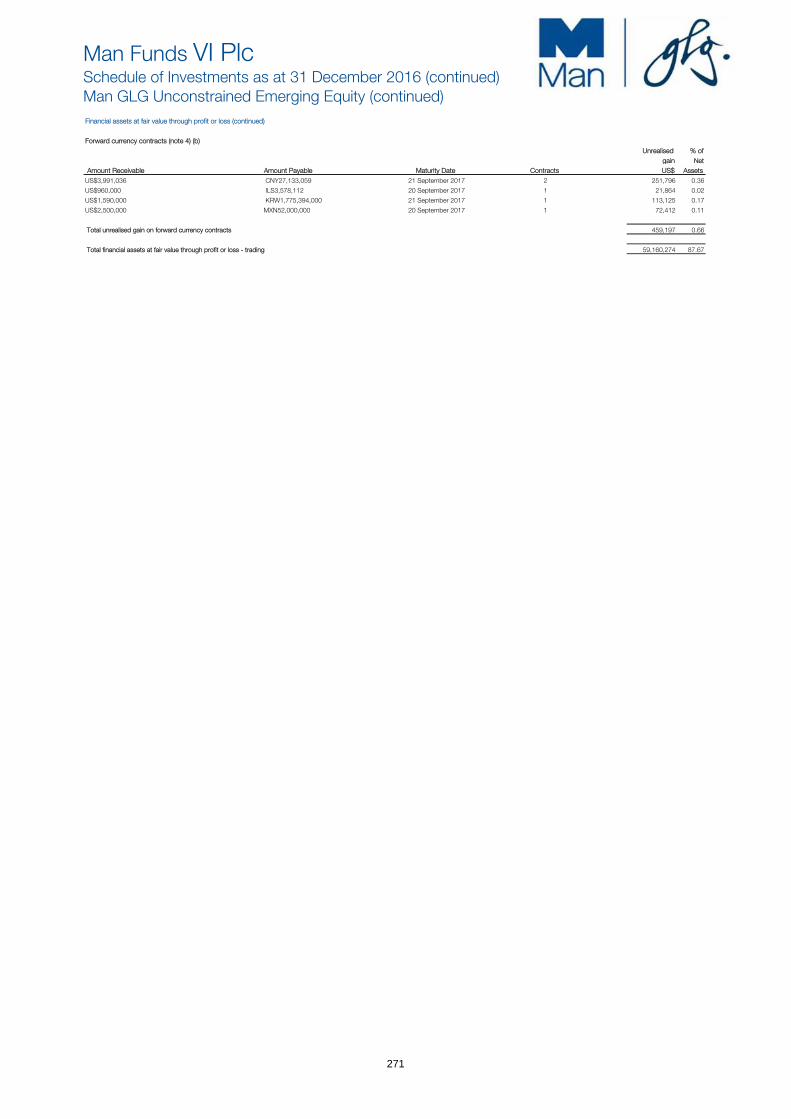
Man Funds VI PlcSchedule of Investments as at 31 December 2016 (continued)Man GLG Unconstrained Emerging Equity (continued)Financial assets at fair value through profit or loss (continued)
Forward currency contracts (note 4) (b) Unrealised % of
gain Net
Amount Receivable Amount Payable Maturity Date Contracts US$ AssetsUS$3,991,036 CNY27,133,059 21 September 2017 2 251,796 0.36
US$960,000 ILS3,578,112 20 September 2017 1 21,864 0.02
US$1,590,000 KRW1,775,394,000 21 September 2017 1 113,125 0.17
US$2,500,000 MXN52,000,000 20 September 2017 1 72,412 0.11
Total unrealised gain on forward currency contracts 459,197 0.66
Total financial assets at fair value through profit or loss - trading 59,160,274 87.67
271

Man Funds VI PlcSchedule of Investments as at 31 December 2016 (continued)Man GLG Unconstrained Emerging Equity (continued)Financial liabilities at fair value through profit or loss
Fair % of Value Net
Nominal Description US$ AssetsContracts for difference (b)China
336,903 Shanghai International Airlines (80,952) (0.12)783,471 Zhengzhou Yutong Bus Company (187,224) (0.28)
(268,176) (0.40)Taiwan
174,003 Delta Electronics Inc_CSFB (1,298) (0.00)
Total contracts for difference (269,474) (0.40)
272
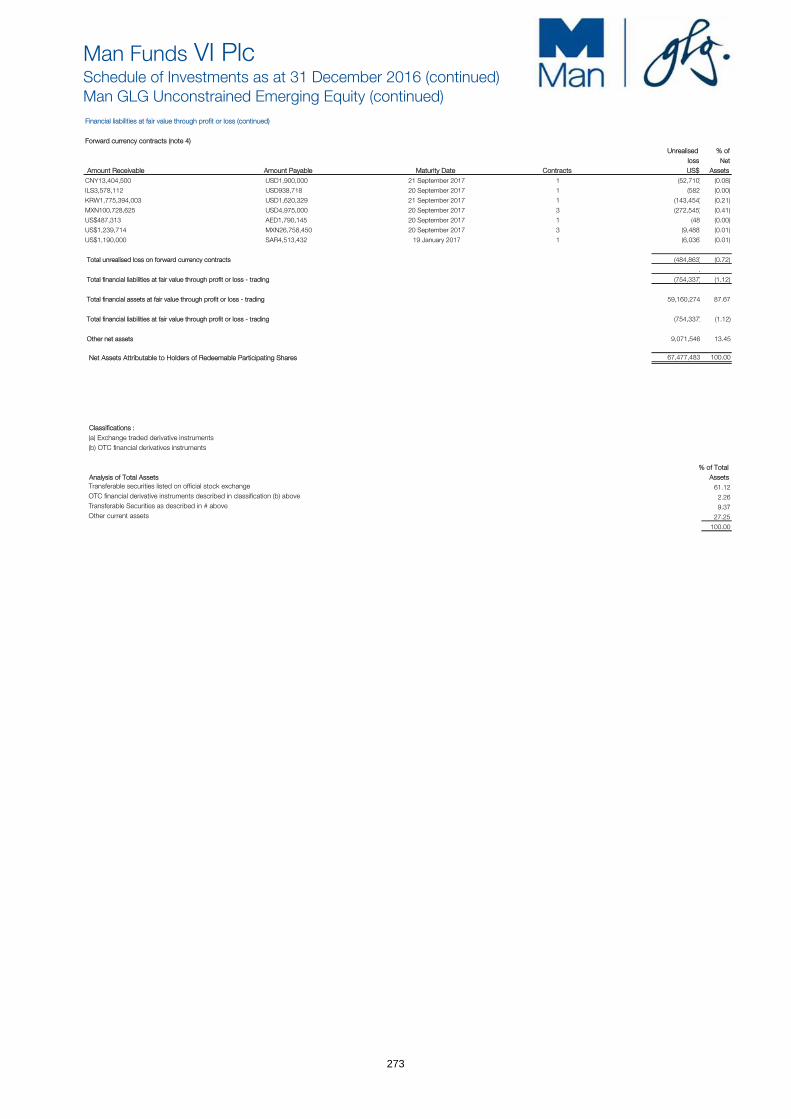
Man Funds VI PlcSchedule of Investments as at 31 December 2016 (continued)Man GLG Unconstrained Emerging Equity (continued)Financial liabilities at fair value through profit or loss (continued)
Forward currency contracts (note 4)Unrealised % of
loss Net
Amount Receivable Amount Payable Maturity Date Contracts US$ AssetsCNY13,404,500 USD1,900,000 21 September 2017 1 (52,710) (0.08)
ILS3,578,112 USD938,718 20 September 2017 1 (582) (0.00)
KRW1,775,394,003 USD1,620,329 21 September 2017 1 (143,454) (0.21)
MXN100,728,625 USD4,975,000 20 September 2017 3 (272,545) (0.41)
US$487,313 AED1,790,145 20 September 2017 1 (48) (0.00)
US$1,239,714 MXN26,758,450 20 September 2017 3 (9,488) (0.01)
US$1,190,000 SAR4,513,432 19 January 2017 1 (6,036) (0.01)
Total unrealised loss on forward currency contracts (484,863) (0.72)
.
Total financial liabilities at fair value through profit or loss - trading (754,337) (1.12)
Total financial assets at fair value through profit or loss - trading 59,160,274 87.67
Total financial liabilities at fair value through profit or loss - trading (754,337) (1.12)
Other net assets 9,071,546 13.45
Net Assets Attributable to Holders of Redeemable Participating Shares 67,477,483 100.00
Classifications : (a) Exchange traded derivative instruments (b) OTC financial derivatives instruments
% of Total Analysis of Total Assets Assets Transferable securities listed on official stock exchange 61.12 OTC financial derivative instruments described in classification (b) above 2.26
Transferable Securities as described in # above 9.37 Other current assets 27.25
100.00
273

Man Funds VI PlcSchedule of Investments as at 31 December 2016 (continued)Man GLG Global Emerging Markets Debt Total ReturnFinancial assets at fair value through profit or loss
Fair % of Fair % of Value Net Value Net
Nominal Description US$ Assets Nominal Description US$ AssetsCorporate bonds Government bonds (continued)Brazil Indonesia
4,000,000 Itau Unibanco Holding SA 2.85% 26/05/2018 # 4,015,000 0.77 18,935,000 Indonesia Government International Bond 11.625%04/03/2019 # 22,698,331 4.34
Cayman Islands 10,100,000 Indonesia Government International Bond 5.875% 2,500,000 Petrobras International Finance Co 3.5% 06/02/2017 # 2,502,050 0.48 13/03/2020 # 11,046,875 2.12 9,750,000 Petrobras International Finance Co 5.875% 01/03/2018 # 10,018,125 1.92 33,745,206 6.46
12,520,175 2.40 Mexico 3,843,600 Mexican Bonos 5.75% 05/03/2026 # 16,582,527 3.18
Chile 2,750,000 Itau CorpBanca 3.125% 15/01/2018 # 2,777,335 0.53 Pakistan
4,225,000 Pakistan Government International Bond 7.25% China 15/04/2019 # 4,479,915 0.86
3,000,000 CNPC General Capital Limited 1.95% 16/04/2018 # 2,991,000 0.57 5,000,000 CNPC General Capital Limited 1.95% 25/11/2017 # 5,002,151 0.96 South Africa 200,000 CNPC General Capital Limited 2.75% 19/04/2017 # 200,558 0.04 22,950,000 Republic of South Africa 6.875% 27/05/2019 # 24,872,063 4.76 1,400,000 Sinopec Group Overseas Development 2016 Limited 1.75% 1,400,000 South Africa Government International Bond 5.5%
29/09/2019 # 1,377,838 0.26 09/03/2020 # 1,485,750 0.28
9,571,547 1.83 26,357,813 5.04 Turkey
Colombia 6,425,000 Turkey Government International Bond 6.75% 3,000,000 Banco Davivienda SA 2.95% 29/01/2018 # 3,021,255 0.58 03/04/2018 # 6,722,156 1.29
7,500,000 Turkey Government International Bond 7% 11/03/2019 # 7,987,500 1.53
Hong Kong 6,400,000 Turkey Government International Bond 7.5% 07/11/2019 # 6,976,000 1.34 2,800,000 CNOOC Finance 2013 Limited 1.75% 09/05/2018 # 2,786,210 0.53 26,650,000 Turkey Government International Bond 7.5% 14/07/2017 # 27,415,388 5.24
49,101,044 9.40 Israel United States
4,000,000 Israel Electric Corporation Limited 5.625% 21/06/2018 # 4,172,200 0.80 4,500,000 United States Treasury Bill 0% 05/01/2017 # 4,499,899 0.86 4,500,000 United States Treasury Bill 0% 12/01/2017 # 4,499,550 0.86
Mexico 4,500,000 United States Treasury Bill 0% 02/02/2017 # 4,498,443 0.86 11,325,000 Petroleos Mexicanos 3.5% 18/07/2018 # 11,438,250 2.19 5,400,000 United States Treasury Bill 0% 09/02/2017 # 5,397,585 1.03 3,600,000 Petroleos Mexicanos 3.5% 23/07/2020 # 3,541,500 0.68 4,500,000 United States Treasury Bill 0% 19/01/2017 # 4,499,180 0.86 2,500,000 Petroleos Mexicanos 5.5% 21/01/2021 # 2,587,500 0.50 4,500,000 United States Treasury Bill 0% 26/01/2017 # 4,498,778 0.86 9,200,000 Petroleos Mexicanos 5.75% 01/03/2018 # 9,533,500 1.83 9,100,000 United States Treasury Note 0.75% 15/07/2019 # 8,969,543 1.72 3,000,000 Petroleos Mexicanos 6.375% 04/02/2021 # 3,195,000 0.61 2,200,000 United States Treasury Note 0.875% 15/09/2019 # 2,171,898 0.42 350,000 Petroleos Mexicanos 6.5% 13/03/2027 # 362,250 0.07 3,500,000 United States Treasury Note 1.125% 30/06/2021 # 3,387,617 0.65 3,400,000 Petroleos Mexicanos 8% 03/05/2019 # 3,748,840 0.71 105,400,000 United States Treasury Note 1.75% 30/11/2021 # 104,601,266 20.03
34,406,840 6.59 5,900,000 United States Treasury Note 2% 15/11/2026 # 5,670,914 1.09
152,694,673 29.24 Netherlands
12,985,000 Majapahit Holding BV 7.25% 28/06/2017 # 13,309,625 2.55 Total government bonds 361,686,765 69.25 2,000,000 Petrobras Global Finance BV 7.875% 15/03/2019 # 2,152,500 0.41
15,462,125 2.96
United Arab Emirates 2,300,000 ICICI Bank Limited 4.7% 21/02/2018 # 2,357,029 0.45
Virgin Islands (British) 8,190,000 Sinopec Capital 2013 Limited 1.875% 24/04/2018 # 8,162,154 1.56 2,700,000 Sinopec Group Overseas Development 2013 Limited 2.5%
17/10/2018 # 2,717,781 0.52 10,879,935 2.08
Total corporate bonds 101,969,651 19.52
Credit default swaps United States
6,250,000 Lebanese Republic 100bps 20 December 2019 576,649 0.11 2,700,000 Lebanese Republic 100bps 20 December 2021 462,961 0.09 7,725,000 Lebanese Republic 100bps 20 June 2021_Barclays 1,174,111 0.22 4,800,000 Lebanese Republic 500bps 20 June 2021_Barclays 729,545 0.14 3,750,000 Republic Of Kazakhstan 100bps 20 Decr 2021_Barclays 107,761 0.02 8,700,000 Republic Of Kazakhstan 100bps 20 December 2021_Citi 250,006 0.05 6,500,000 Republic Of Kazakhstan 100bps 20 December 2021_JP 186,786 0.04 (16,200,000) Republic Of Philippines 100bps 20 Dec 2019_Barclays 164,665 0.03 9,000,000 Russian Federation 100bps 20 December 2021_JP 332,187 0.06 14,500,000 Russian Federation 100bps 20 June 2021_Barclays 381,176 0.07 (7,000,000) United Mexican States 100bps 20 December 2019 5,616 0.00 (14,500,000) United Mexican States 100bps 20 June 2017 40,686 0.01 (9,100,000) United Mexican States 100bps 20 June 2019_HSBC 29,370 0.01
4,441,519 0.85
Total credit default swaps 4,441,519 0.85
Government bondsBrazil
3,800,000 Banco Nacional de Desenvolvimento Economico e Social 6.369% 16/06/2018 # 3,985,250 0.76
90,473,000 Brazil Notas do Tesouro Nacional Serie F 0% 01/01/2021 # 26,748,993 5.12 30,734,243 5.88
Colombia 35,725,000 Colombia Government International Bond 7.375%
18/03/2019 # 39,744,063 7.61
Dominican Republic 7,575,000 Dominican Republic International Bond 7.5% 06/05/2021 # 8,247,281 1.58
274
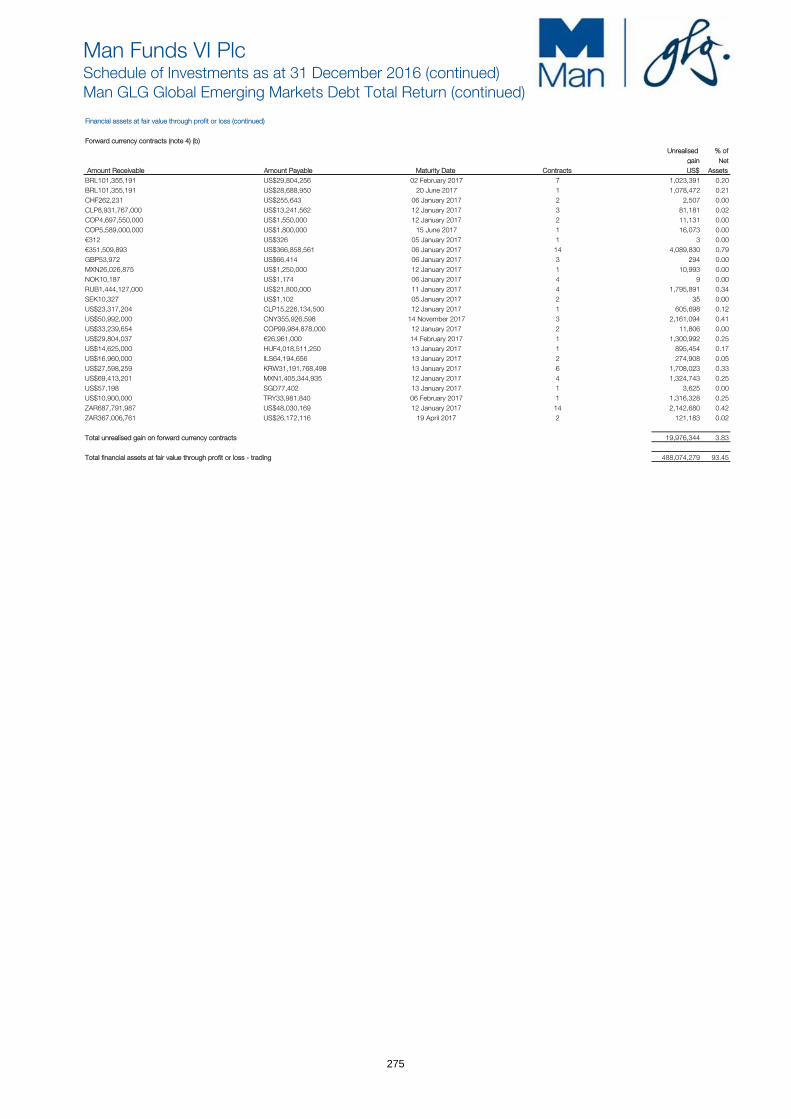
Man Funds VI PlcSchedule of Investments as at 31 December 2016 (continued)Man GLG Global Emerging Markets Debt Total Return (continued)
Financial assets at fair value through profit or loss (continued)
Forward currency contracts (note 4) (b)Unrealised % of
gain Net
Amount Receivable Amount Payable Maturity Date Contracts US$ AssetsBRL101,355,191 US$29,804,256 02 February 2017 7 1,023,391 0.20 BRL101,355,191 US$28,688,950 20 June 2017 1 1,078,472 0.21 CHF262,231 US$255,643 06 January 2017 2 2,507 0.00 CLP8,931,767,000 US$13,241,562 12 January 2017 3 81,181 0.02 COP4,697,550,000 US$1,550,000 12 January 2017 2 11,131 0.00 COP5,589,000,000 US$1,800,000 15 June 2017 1 16,073 0.00 €312 US$326 05 January 2017 1 3 0.00 €351,509,893 US$366,858,561 06 January 2017 14 4,089,830 0.79 GBP53,972 US$66,414 06 January 2017 3 294 0.00 MXN26,026,875 US$1,250,000 12 January 2017 1 10,993 0.00 NOK10,187 US$1,174 06 January 2017 4 9 0.00 RUB1,444,127,000 US$21,800,000 11 January 2017 4 1,795,891 0.34 SEK10,327 US$1,102 05 January 2017 2 35 0.00 US$23,317,204 CLP15,226,134,500 12 January 2017 1 605,698 0.12 US$50,992,000 CNY355,926,598 14 November 2017 3 2,161,094 0.41 US$33,239,654 COP99,984,878,000 12 January 2017 2 11,806 0.00 US$29,804,037 €26,961,000 14 February 2017 1 1,300,992 0.25 US$14,625,000 HUF4,018,511,250 13 January 2017 1 895,454 0.17 US$16,960,000 ILS64,194,656 13 January 2017 2 274,908 0.05 US$27,598,259 KRW31,191,768,498 13 January 2017 6 1,708,023 0.33 US$69,413,201 MXN1,405,344,935 12 January 2017 4 1,324,743 0.25 US$57,198 SGD77,402 13 January 2017 1 3,625 0.00 US$10,900,000 TRY33,981,840 06 February 2017 1 1,316,328 0.25 ZAR687,791,987 US$48,030,169 12 January 2017 14 2,142,680 0.42 ZAR367,006,761 US$26,172,116 19 April 2017 2 121,183 0.02
Total unrealised gain on forward currency contracts 19,976,344 3.83
Total financial assets at fair value through profit or loss - trading 488,074,279 93.45
275
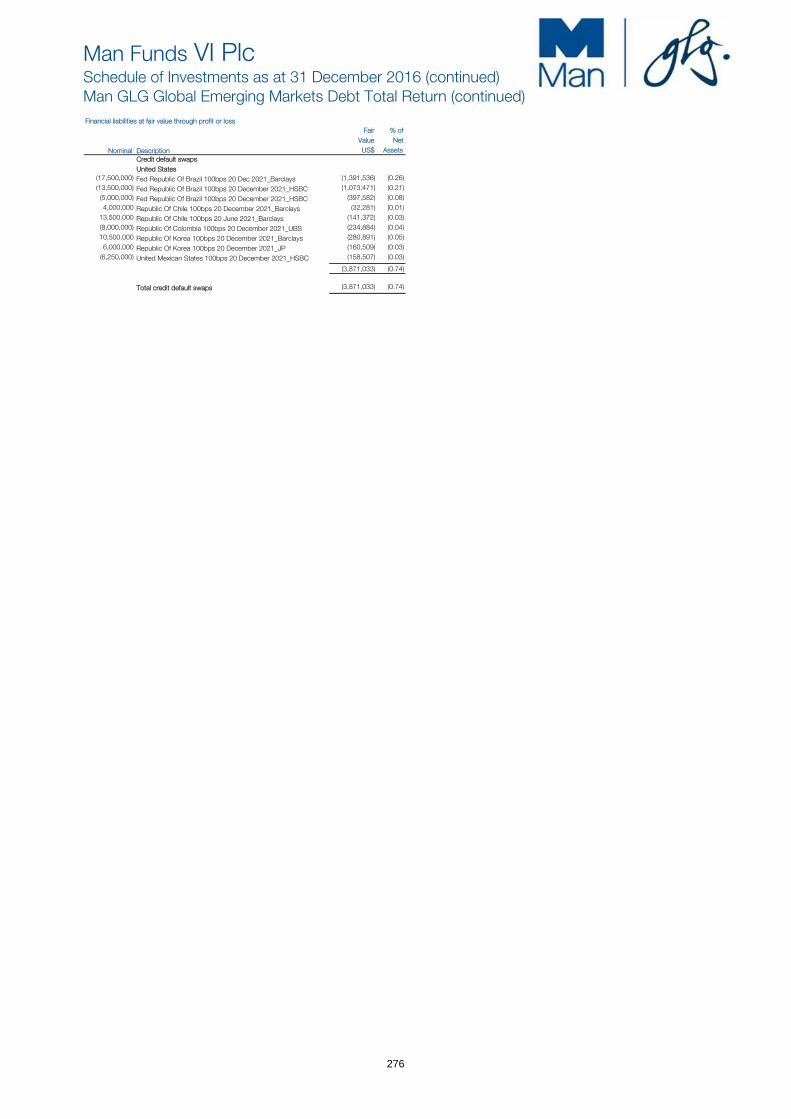
Man Funds VI PlcSchedule of Investments as at 31 December 2016 (continued)Man GLG Global Emerging Markets Debt Total Return (continued)Financial liabilities at fair value through profit or loss
Fair % of Value Net
Nominal Description US$ AssetsCredit default swapsUnited States
(17,500,000) Fed Republic Of Brazil 100bps 20 Dec 2021_Barclays (1,391,536) (0.26) (13,500,000) Fed Republic Of Brazil 100bps 20 December 2021_HSBC (1,073,471) (0.21) (5,000,000) Fed Republic Of Brazil 100bps 20 December 2021_HSBC (397,582) (0.08) 4,000,000 Republic Of Chile 100bps 20 December 2021_Barclays (32,281) (0.01) 13,500,000 Republic Of Chile 100bps 20 June 2021_Barclays (141,372) (0.03) (8,000,000) Republic Of Colombia 100bps 20 December 2021_UBS (234,884) (0.04) 10,500,000 Republic Of Korea 100bps 20 December 2021_Barclays (280,891) (0.05) 6,000,000 Republic Of Korea 100bps 20 December 2021_JP (160,509) (0.03) (6,250,000) United Mexican States 100bps 20 December 2021_HSBC (158,507) (0.03)
(3,871,033) (0.74)
Total credit default swaps (3,871,033) (0.74)
276
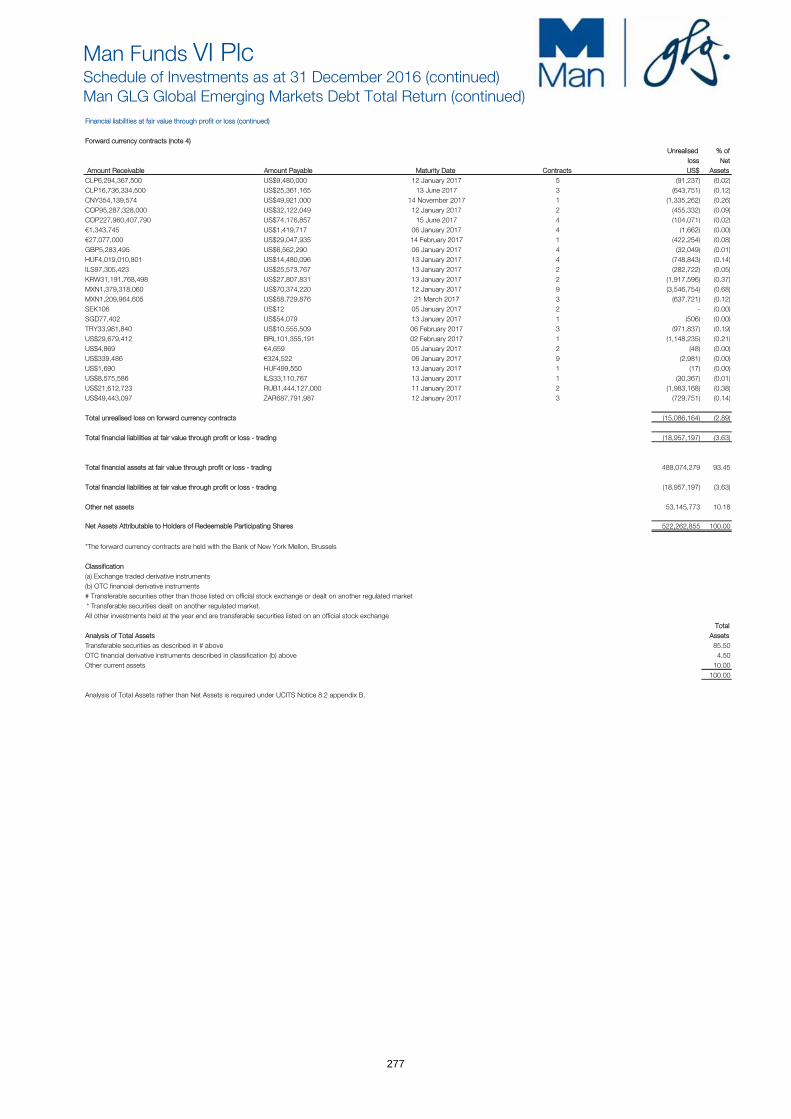
Man Funds VI PlcSchedule of Investments as at 31 December 2016 (continued)Man GLG Global Emerging Markets Debt Total Return (continued)Financial liabilities at fair value through profit or loss (continued)
Forward currency contracts (note 4)Unrealised % of
loss Net
Amount Receivable Amount Payable Maturity Date Contracts US$ AssetsCLP6,294,367,500 US$9,480,000 12 January 2017 5 (91,237) (0.02)CLP16,736,334,500 US$25,361,165 13 June 2017 3 (643,751) (0.12)CNY354,139,574 US$49,921,000 14 November 2017 1 (1,335,262) (0.26)COP95,287,328,000 US$32,122,049 12 January 2017 2 (455,332) (0.09)COP227,960,407,790 US$74,176,857 15 June 2017 4 (104,071) (0.02)€1,343,745 US$1,419,717 06 January 2017 4 (1,662) (0.00) €27,077,000 US$29,047,935 14 February 2017 1 (422,254) (0.08)GBP5,283,495 US$6,562,290 06 January 2017 4 (32,049) (0.01)HUF4,019,010,801 US$14,480,096 13 January 2017 4 (748,843) (0.14)ILS97,305,423 US$25,573,767 13 January 2017 2 (282,722) (0.05)KRW31,191,768,498 US$27,807,831 13 January 2017 2 (1,917,596) (0.37)MXN1,379,318,060 US$70,374,220 12 January 2017 9 (3,546,754) (0.68)MXN1,209,964,605 US$58,729,876 21 March 2017 3 (637,721) (0.12)SEK106 US$12 05 January 2017 2 - (0.00) SGD77,402 US$54,079 13 January 2017 1 (506) (0.00) TRY33,981,840 US$10,555,509 06 February 2017 3 (971,837) (0.19)US$29,679,412 BRL101,355,191 02 February 2017 1 (1,148,235) (0.21)US$4,869 €4,659 05 January 2017 2 (48) (0.00) US$339,486 €324,522 06 January 2017 9 (2,981) (0.00) US$1,690 HUF499,550 13 January 2017 1 (17) (0.00) US$8,575,586 ILS33,110,767 13 January 2017 1 (30,367) (0.01)US$21,612,723 RUB1,444,127,000 11 January 2017 2 (1,983,168) (0.38)US$49,443,097 ZAR687,791,987 12 January 2017 3 (729,751) (0.14)
Total unrealised loss on forward currency contracts (15,086,164) (2.89)
Total financial liabilities at fair value through profit or loss - trading (18,957,197) (3.63)
Total financial assets at fair value through profit or loss - trading 488,074,279 93.45
Total financial liabilities at fair value through profit or loss - trading (18,957,197) (3.63)
Other net assets 53,145,773 10.18
Net Assets Attributable to Holders of Redeemable Participating Shares 522,262,855 100.00
*The forward currency contracts are held with the Bank of New York Mellon, Brussels
Classification(a) Exchange traded derivative instruments(b) OTC financial derivative instruments# Transferable securities other than those listed on official stock exchange or dealt on another regulated market* Transferable securities dealt on another regulated market.All other investments held at the year end are transferable securities listed on an official stock exchange
TotalAnalysis of Total Assets Assets
Transferable securities as described in # above 85.50OTC financial derivative instruments described in classification (b) above 4.50Other current assets 10.00
100.00
Analysis of Total Assets rather than Net Assets is required under UCITS Notice 8.2 appendix B.
277

Man Funds VI Plc
Man GLG European Alpha Alternative Man GLG European Alpha Alternative Man GLG European Alpha Alternative Man GLG European Alpha Alternative
Statement of Significant PurchasesStatement of Significant PurchasesStatement of Significant PurchasesStatement of Significant PurchasesFor the year ended 31 December 2016For the year ended 31 December 2016For the year ended 31 December 2016For the year ended 31 December 2016
SecuritySecuritySecuritySecurity Nominal Nominal Nominal Nominal Cost Cost Cost Cost
€€€€
ING Groep NV 11,985,771 133,856,539
Continental AG 658,259 116,920,141
E.ON SE 14,445,092 102,773,688
Bayer AG 1,060,724 98,771,788
Fielmann AG 1,336,285 88,543,454
SAP SE 1,123,403 86,725,092
Fresenius SE & Company KGaA 1,283,696 82,690,054
Delhaize Group SA 771,444 74,189,785
Koninklijke DSM NV 1,124,722 65,102,126
Linde AG 515,691 64,619,031
KBC Groep NV 1,254,381 62,919,398
RELX NV 3,737,672 56,474,610
Infineon Technologies AG 3,988,676 52,476,363
Beiersdorf AG 552,609 45,744,251
Akzo Nobel NV 604,833 37,053,603
Unilever NV 901,985 36,412,481
NN Group NV 1,225,000 35,683,500
Nokia OYJ 6,271,836 31,432,167
Merck KGaA 350,000 28,840,000
Koninklijke Philips NV 1,183,479 28,558,939
Statement of Significant SalesStatement of Significant SalesStatement of Significant SalesStatement of Significant SalesFor the year ended 31 December 2016For the year ended 31 December 2016For the year ended 31 December 2016For the year ended 31 December 2016
SecuritySecuritySecuritySecurity Nominal Nominal Nominal Nominal Proceeds Proceeds Proceeds Proceeds
€€€€
Bayer AG (1,442,241) (140,435,827)
Fresenius SE & Company KGaA (2,043,072) (134,084,498)
Continental AG (658,259) (119,647,025)
SAP SE (1,553,917) (117,329,187)
E.ON SE (13,874,973) (101,722,308)
Fielmann AG (1,336,285) (88,101,270)
ING Groep NV (7,729,180) (83,441,311)
Koninklijke Ahold Delhaize NV (3,775,829) (78,978,950)
Linde AG (544,358) (70,621,484)
KBC Groep NV (1,254,381) (67,857,829)
Koninklijke DSM NV (1,108,582) (63,886,236)
RELX NV (3,737,672) (56,968,498)
Daimler AG (772,121) (46,881,543)
BASF SE (681,858) (45,582,207)
Beiersdorf AG (552,609) (45,485,261)
Royal Dutch Shell Plc (1,980,016) (41,758,478)
Infineon Technologies AG (3,014,154) (39,597,530)
Unilever NV (990,968) (39,440,288)
Akzo Nobel NV (604,833) (36,803,409)
NN Group NV (1,225,000) (35,059,500)
The Statement of Significant Purchases and Sales reflects the aggregate purchases of a security exceeding one percent of the total value
of purchases and aggregate disposals greater than one percent of total value of the sales for the year. At minimum the largest 20
purchases and 20 sales must be given or all purchases and sales if less than 20.
(unaudited)
(unaudited)
278

Man Funds VI Plc
Man GLG Alpha Select Alternative Man GLG Alpha Select Alternative Man GLG Alpha Select Alternative Man GLG Alpha Select Alternative
Statement of Significant PurchasesStatement of Significant PurchasesStatement of Significant PurchasesStatement of Significant PurchasesFor the year ended 31 December 2016For the year ended 31 December 2016For the year ended 31 December 2016For the year ended 31 December 2016
SecuritySecuritySecuritySecurity Nominal Nominal Nominal Nominal Cost Cost Cost Cost
£ £ £ £
United Kingdom Treasury Bill 0% 04/04/2016 25,000,000 24,992,925
United Kingdom Treasury Bill 0% 18/04/2016 22,000,000 21,996,963
United Kingdom Treasury Bill 0% 12/12/2016 21,000,000 20,996,692
United Kingdom Treasury Bill 0% 08/02/2016 20,000,000 19,996,686
United Kingdom Treasury Bill 0% 07/11/2016 20,000,000 19,994,410
United Kingdom Treasury Bill 0% 06/06/2016 18,000,000 17,990,339
United Kingdom Treasury Bill 0% 20/02/2017 17,000,000 16,999,110
United Kingdom Treasury Bill 0% 03/07/2016 17,000,000 16,994,199
United Kingdom Treasury Bill 0% 30/01/2017 16,000,000 15,995,011
United Kingdom Treasury Bill 0% 15/02/2016 16,000,000 15,994,536
United Kingdom Treasury Bill 0% 27/06/2016 14,000,000 13,994,042
United Kingdom Treasury Bill 0% 01/02/2016 13,000,000 12,997,530
United Kingdom Treasury Bill 0% 15/08/2016 13,000,000 12,995,433
United Kingdom Treasury Bill 0% 25/07/2016 11,100,000 11,093,880
United Kingdom Treasury Bill 0% 01/08/2016 11,000,000 10,995,338
United Kingdom Treasury Bill 0% 18/07/2016 11,000,000 10,995,319
United Kingdom Treasury Bill 0% 31/10/2016 11,000,000 10,991,779
United Kingdom Treasury Bill 0% 25/01/2016 10,000,000 9,998,810
United Kingdom Treasury Bill 0% 22/08/2016 10,000,000 9,997,900
United Kingdom Treasury Bill 0% 29/03/2016 10,000,000 9,996,982
Statement of Significant SalesStatement of Significant SalesStatement of Significant SalesStatement of Significant SalesFor the year ended 31 December 2016For the year ended 31 December 2016For the year ended 31 December 2016For the year ended 31 December 2016
SecuritySecuritySecuritySecurity Nominal Nominal Nominal Nominal Proceeds Proceeds Proceeds Proceeds
£ £ £ £
Hochtief AG (140,854) (8,918,437)
Fresenius SE & Company KGaA (150,000) (6,967,112)
Metro AG (225,000) (4,709,898)
Refresco Group NV (360,000) (4,324,085)
USG People NV (326,381) (4,168,795)
RELX NV (172,416) (2,263,455)
BP Plc (102,327) (2,255,894)
MicroFocus International Plc 10,581,844 (1,883,449)
Wolters Kluwer NV (63,478) (1,558,664)
Conviviality Plc (479,827) (971,850)
Signet Jewelers Limited (11,031) (854,369)
Wolseley Plc 14,563,579 (714,455)
Ibstock Plc (333,268) (704,195)
Melrose Industries Plc 285,506 (668,950)
Midwich Group Plc (252,120) (591,829)
Royal Dutch Shell Plc (13,300) (561,449)
Trinity Mirror Plc (339,653) (533,867)
NewRiver Retail Limited (155,254) (533,179)
Micro Focus International Plc (34,071) (523,818)
Watkin Jones Plc (426,508) (486,075)
The Statement of Significant Purchases and Sales reflects the aggregate purchases of a security exceeding one percent of the total value
of purchases and aggregate disposals greater than one percent of total value of the sales for the year. At minimum the largest 20
purchases and 20 sales must be given or all purchases and sales if less than 20.
(unaudited)
(unaudited)
279

Man Funds VI Plc
Man GLG European Equity Alternative Man GLG European Equity Alternative Man GLG European Equity Alternative Man GLG European Equity Alternative
Statement of Significant PurchasesStatement of Significant PurchasesStatement of Significant PurchasesStatement of Significant PurchasesFor the year ended 31 December 2016For the year ended 31 December 2016For the year ended 31 December 2016For the year ended 31 December 2016
SecuritySecuritySecuritySecurity Nominal Nominal Nominal Nominal Cost Cost Cost Cost
€ € € €
Fiat Chrysler Automobiles NV 14,415,723 93,490,911
Energy Select Sector SPDR Fund 1,723,053 90,142,153
General Motors Company 2,803,893 79,397,988
Fielmann AG 1,104,524 75,285,108
SAP SE 708,622 54,979,564
Halliburton Company 1,429,203 52,456,709
Pandora A/S 431,758 49,632,181
Akzo Nobel NV 794,474 49,417,902
Schlumberger Limited 625,687 44,379,839
Bayer AG 425,157 41,467,850
ING Groep NV 3,060,400 39,667,849
Brenntag AG 824,039 36,971,340
NIKE Inc 712,448 36,144,758
BP PLC ADR 1,216,577 35,023,758
Facebook Inc 333,652 33,747,286
Wal-Mart Stores Inc 529,861 33,721,480
Fresenius SE & Co KGaA 481,709 31,259,973
iShares MSCI Emerging Markets ETF 1,057,093 31,152,257
Dollar Tree Inc 409,315 30,993,005
Alibaba Group Holding Limited ADR 372,294 30,788,127
Statement of Significant SalesStatement of Significant SalesStatement of Significant SalesStatement of Significant SalesFor the year ended 31 December 2016For the year ended 31 December 2016For the year ended 31 December 2016For the year ended 31 December 2016
SecuritySecuritySecuritySecurity Nominal Nominal Nominal Nominal Proceeds Proceeds Proceeds Proceeds
€ € € €
Fiat Chrysler Automobiles NV (14,699,237) (94,475,799)
Energy Select Sector SPDR Fund (1,744,832) (93,012,617)
Fielmann AG (1,104,524) (77,491,914)
General Motors Company (2,442,095) (68,481,909)
Halliburton Company (1,674,877) (60,881,294)
Schlumberger Limited (783,190) (54,625,142)
Pandora A/S (430,708) (50,940,028)
Akzo Nobel NV (838,364) (48,445,044)
Royal Dutch Shell Plc (1,936,615) (39,328,446)
ABN AMRO Group NV (2,169,879) (39,278,853)
ING Groep NV (6,085,604) (71,275,629)
Fresenius SE & Co KGaA (481,709) (34,101,793)
Bayer AG (355,024) (33,817,139)
Dollar Tree Inc (449,481) (33,707,507)
Shire PLC ADR (208,309) (32,966,103)
Wal-Mart Stores Inc (500,059) (32,324,210)
Baker Hughes Inc (759,092) (32,031,974)
iShares MSCI Emerging Markets ETF (1,068,294) (31,646,457)
Nike Inc (619,911) (30,442,309)
Macy's Inc (893,120) (30,429,464)
The Statement of Significant Purchases and Sales reflects the aggregate purchases of a security exceeding one percent of the total value
of purchases and aggregate disposals greater than one percent of total value of the sales for the year. At minimum the largest 20
purchases and 20 sales must be given or all purchases and sales if less than 20.
(unaudited)
(unaudited)
280
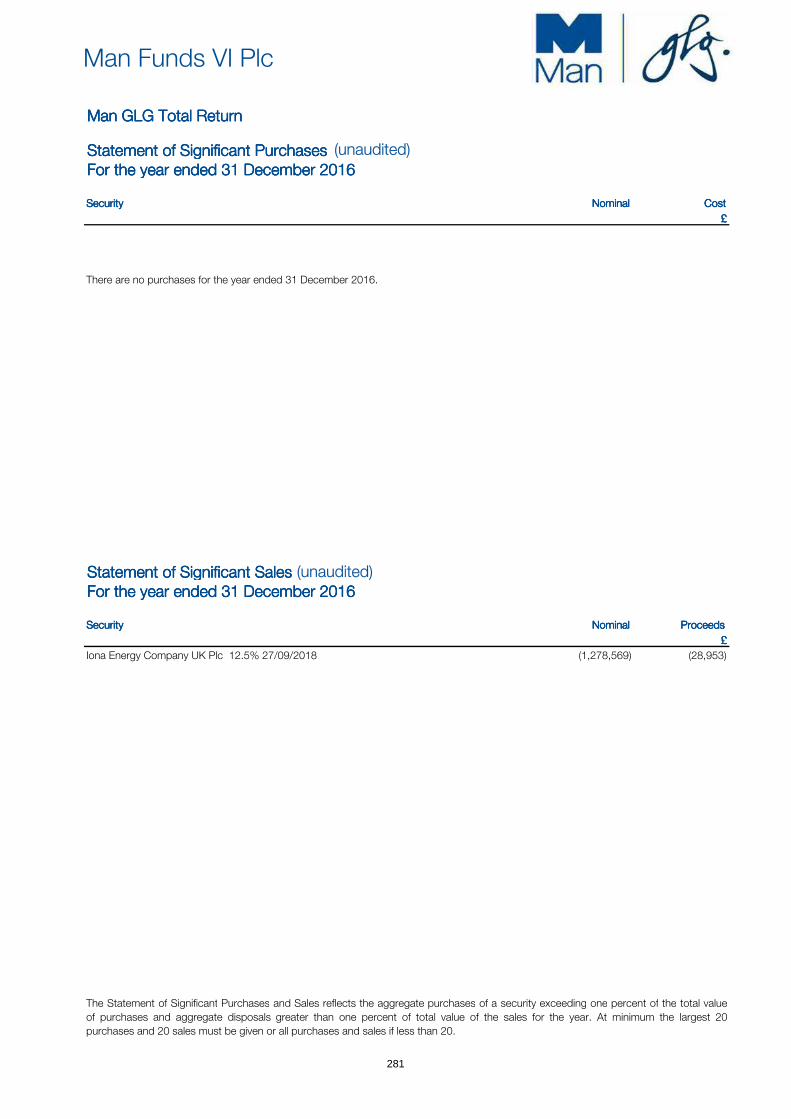
Man Funds VI Plc
Man GLG Total Return Man GLG Total Return Man GLG Total Return Man GLG Total Return
Statement of Significant PurchasesStatement of Significant PurchasesStatement of Significant PurchasesStatement of Significant PurchasesFor the year ended 31 December 2016For the year ended 31 December 2016For the year ended 31 December 2016For the year ended 31 December 2016
SecuritySecuritySecuritySecurity Nominal Nominal Nominal Nominal Cost Cost Cost Cost
£ £ £ £
There are no purchases for the year ended 31 December 2016.
Statement of Significant SalesStatement of Significant SalesStatement of Significant SalesStatement of Significant SalesFor the year ended 31 December 2016For the year ended 31 December 2016For the year ended 31 December 2016For the year ended 31 December 2016
SecuritySecuritySecuritySecurity Nominal Nominal Nominal Nominal Proceeds Proceeds Proceeds Proceeds
£ £ £ £
Iona Energy Company UK Plc 12.5% 27/09/2018 (1,278,569) (28,953)
The Statement of Significant Purchases and Sales reflects the aggregate purchases of a security exceeding one percent of the total value
of purchases and aggregate disposals greater than one percent of total value of the sales for the year. At minimum the largest 20
purchases and 20 sales must be given or all purchases and sales if less than 20.
(unaudited)
(unaudited)
281
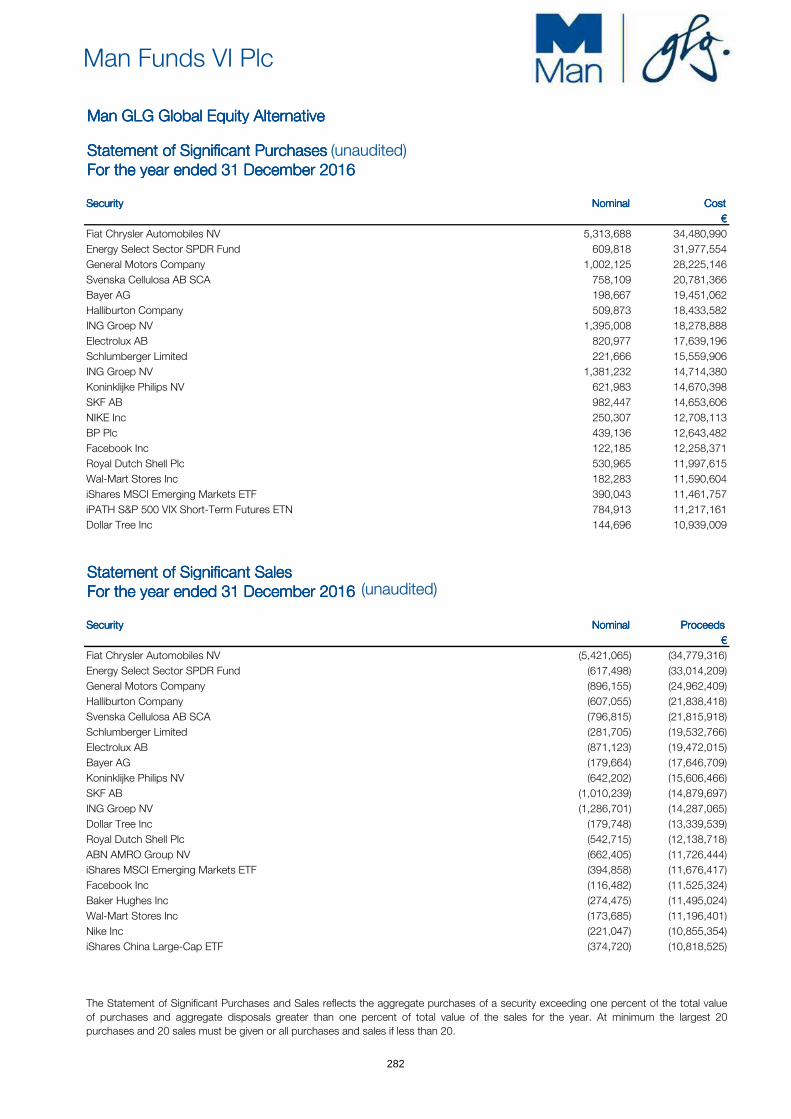
Man Funds VI Plc
Man GLG Global Equity Alternative Man GLG Global Equity Alternative Man GLG Global Equity Alternative Man GLG Global Equity Alternative
Statement of Significant PurchasesStatement of Significant PurchasesStatement of Significant PurchasesStatement of Significant PurchasesFor the year ended 31 December 2016For the year ended 31 December 2016For the year ended 31 December 2016For the year ended 31 December 2016
SecuritySecuritySecuritySecurity Nominal Nominal Nominal Nominal Cost Cost Cost Cost
€ € € €
Fiat Chrysler Automobiles NV 5,313,688 34,480,990
Energy Select Sector SPDR Fund 609,818 31,977,554
General Motors Company 1,002,125 28,225,146
Svenska Cellulosa AB SCA 758,109 20,781,366
Bayer AG 198,667 19,451,062
Halliburton Company 509,873 18,433,582
ING Groep NV 1,395,008 18,278,888
Electrolux AB 820,977 17,639,196
Schlumberger Limited 221,666 15,559,906
ING Groep NV 1,381,232 14,714,380
Koninklijke Philips NV 621,983 14,670,398
SKF AB 982,447 14,653,606
NIKE Inc 250,307 12,708,113
BP Plc 439,136 12,643,482
Facebook Inc 122,185 12,258,371
Royal Dutch Shell Plc 530,965 11,997,615
Wal-Mart Stores Inc 182,283 11,590,604
iShares MSCI Emerging Markets ETF 390,043 11,461,757
iPATH S&P 500 VIX Short-Term Futures ETN 784,913 11,217,161
Dollar Tree Inc 144,696 10,939,009
Statement of Significant SalesStatement of Significant SalesStatement of Significant SalesStatement of Significant SalesFor the year ended 31 December 2016For the year ended 31 December 2016For the year ended 31 December 2016For the year ended 31 December 2016
SecuritySecuritySecuritySecurity Nominal Nominal Nominal Nominal Proceeds Proceeds Proceeds Proceeds
€ € € €
Fiat Chrysler Automobiles NV (5,421,065) (34,779,316)
Energy Select Sector SPDR Fund (617,498) (33,014,209)
General Motors Company (896,155) (24,962,409)
Halliburton Company (607,055) (21,838,418)
Svenska Cellulosa AB SCA (796,815) (21,815,918)
Schlumberger Limited (281,705) (19,532,766)
Electrolux AB (871,123) (19,472,015)
Bayer AG (179,664) (17,646,709)
Koninklijke Philips NV (642,202) (15,606,466)
SKF AB (1,010,239) (14,879,697)
ING Groep NV (1,286,701) (14,287,065)
Dollar Tree Inc (179,748) (13,339,539)
Royal Dutch Shell Plc (542,715) (12,138,718)
ABN AMRO Group NV (662,405) (11,726,444)
iShares MSCI Emerging Markets ETF (394,858) (11,676,417)
Facebook Inc (116,482) (11,525,324)
Baker Hughes Inc (274,475) (11,495,024)
Wal-Mart Stores Inc (173,685) (11,196,401)
Nike Inc (221,047) (10,855,354)
iShares China Large-Cap ETF (374,720) (10,818,525)
The Statement of Significant Purchases and Sales reflects the aggregate purchases of a security exceeding one percent of the total value
of purchases and aggregate disposals greater than one percent of total value of the sales for the year. At minimum the largest 20
purchases and 20 sales must be given or all purchases and sales if less than 20.
(unaudited)
(unaudited)
282
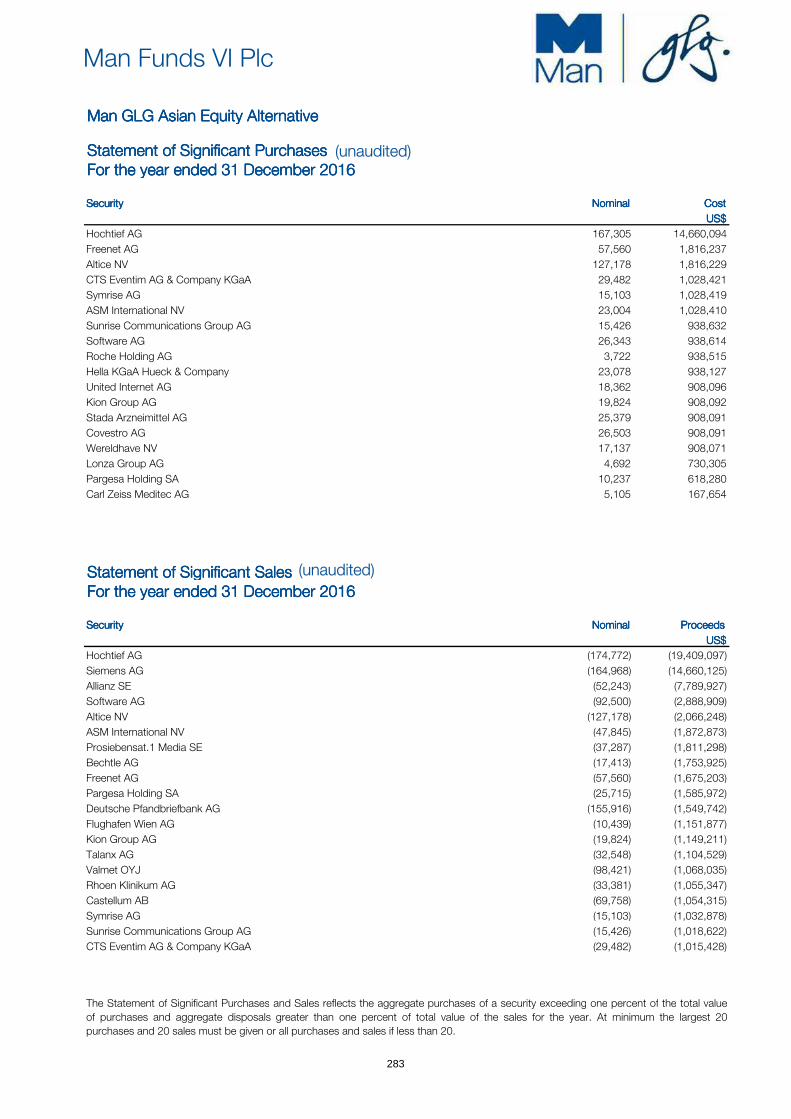
Man Funds VI Plc
Man GLG Asian Equity Alternative Man GLG Asian Equity Alternative Man GLG Asian Equity Alternative Man GLG Asian Equity Alternative
Statement of Significant PurchasesStatement of Significant PurchasesStatement of Significant PurchasesStatement of Significant PurchasesFor the year ended 31 December 2016For the year ended 31 December 2016For the year ended 31 December 2016For the year ended 31 December 2016
SecuritySecuritySecuritySecurity Nominal Nominal Nominal Nominal Cost Cost Cost Cost
US$ US$ US$ US$
Hochtief AG 167,305 14,660,094
Freenet AG 57,560 1,816,237
Altice NV 127,178 1,816,229
CTS Eventim AG & Company KGaA 29,482 1,028,421
Symrise AG 15,103 1,028,419
ASM International NV 23,004 1,028,410
Sunrise Communications Group AG 15,426 938,632
Software AG 26,343 938,614
Roche Holding AG 3,722 938,515
Hella KGaA Hueck & Company 23,078 938,127
United Internet AG 18,362 908,096
Kion Group AG 19,824 908,092
Stada Arzneimittel AG 25,379 908,091
Covestro AG 26,503 908,091
Wereldhave NV 17,137 908,071
Lonza Group AG 4,692 730,305
Pargesa Holding SA 10,237 618,280
Carl Zeiss Meditec AG 5,105 167,654
Statement of Significant SalesStatement of Significant SalesStatement of Significant SalesStatement of Significant SalesFor the year ended 31 December 2016For the year ended 31 December 2016For the year ended 31 December 2016For the year ended 31 December 2016
SecuritySecuritySecuritySecurity Nominal Nominal Nominal Nominal Proceeds Proceeds Proceeds Proceeds
US$ US$ US$ US$
Hochtief AG (174,772) (19,409,097)
Siemens AG (164,968) (14,660,125)
Allianz SE (52,243) (7,789,927)
Software AG (92,500) (2,888,909)
Altice NV (127,178) (2,066,248)
ASM International NV (47,845) (1,872,873)
Prosiebensat.1 Media SE (37,287) (1,811,298)
Bechtle AG (17,413) (1,753,925)
Freenet AG (57,560) (1,675,203)
Pargesa Holding SA (25,715) (1,585,972)
Deutsche Pfandbriefbank AG (155,916) (1,549,742)
Flughafen Wien AG (10,439) (1,151,877)
Kion Group AG (19,824) (1,149,211)
Talanx AG (32,548) (1,104,529)
Valmet OYJ (98,421) (1,068,035)
Rhoen Klinikum AG (33,381) (1,055,347)
Castellum AB (69,758) (1,054,315)
Symrise AG (15,103) (1,032,878)
Sunrise Communications Group AG (15,426) (1,018,622)
CTS Eventim AG & Company KGaA (29,482) (1,015,428)
The Statement of Significant Purchases and Sales reflects the aggregate purchases of a security exceeding one percent of the total value
of purchases and aggregate disposals greater than one percent of total value of the sales for the year. At minimum the largest 20
purchases and 20 sales must be given or all purchases and sales if less than 20.
(unaudited)
(unaudited)
283
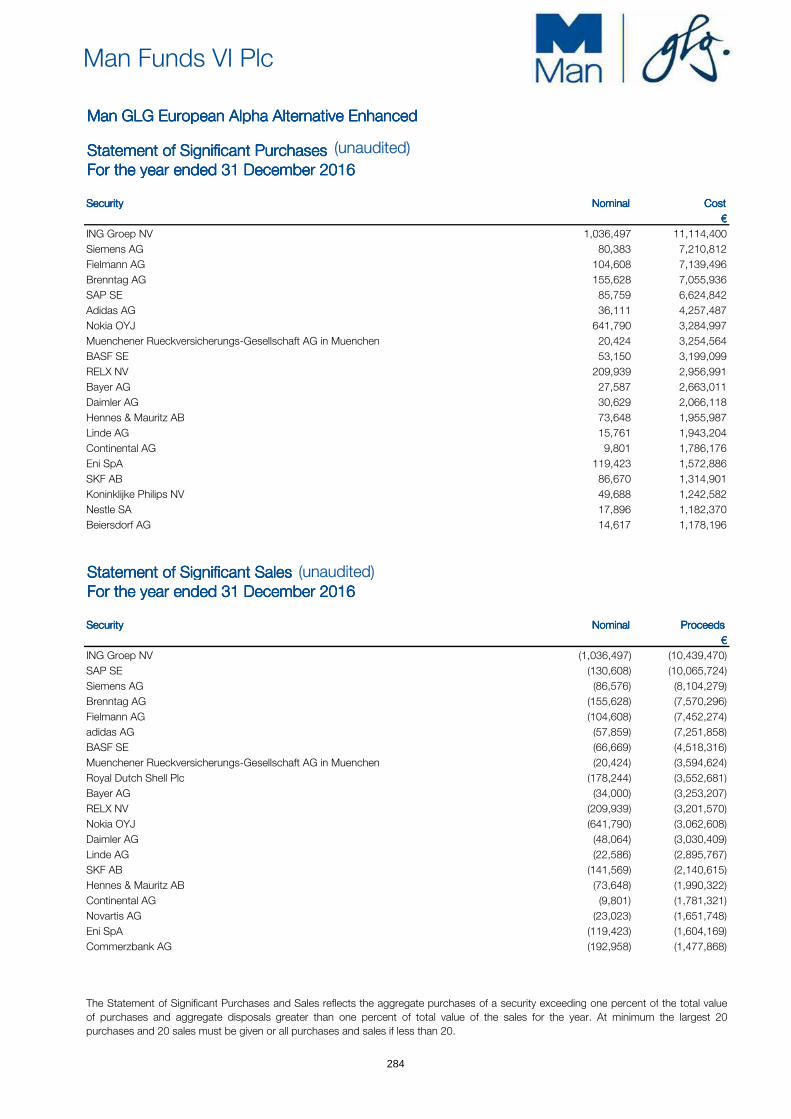
Man Funds VI Plc
Man GLG European Alpha Alternative Enhanced Man GLG European Alpha Alternative Enhanced Man GLG European Alpha Alternative Enhanced Man GLG European Alpha Alternative Enhanced
Statement of Significant PurchasesStatement of Significant PurchasesStatement of Significant PurchasesStatement of Significant PurchasesFor the year ended 31 December 2016For the year ended 31 December 2016For the year ended 31 December 2016For the year ended 31 December 2016
SecuritySecuritySecuritySecurity Nominal Nominal Nominal Nominal Cost Cost Cost Cost
€ € € €
ING Groep NV 1,036,497 11,114,400
Siemens AG 80,383 7,210,812
Fielmann AG 104,608 7,139,496
Brenntag AG 155,628 7,055,936
SAP SE 85,759 6,624,842
Adidas AG 36,111 4,257,487
Nokia OYJ 641,790 3,284,997
Muenchener Rueckversicherungs-Gesellschaft AG in Muenchen 20,424 3,254,564
BASF SE 53,150 3,199,099
RELX NV 209,939 2,956,991
Bayer AG 27,587 2,663,011
Daimler AG 30,629 2,066,118
Hennes & Mauritz AB 73,648 1,955,987
Linde AG 15,761 1,943,204
Continental AG 9,801 1,786,176
Eni SpA 119,423 1,572,886
SKF AB 86,670 1,314,901
Koninklijke Philips NV 49,688 1,242,582
Nestle SA 17,896 1,182,370
Beiersdorf AG 14,617 1,178,196
Statement of Significant SalesStatement of Significant SalesStatement of Significant SalesStatement of Significant SalesFor the year ended 31 December 2016For the year ended 31 December 2016For the year ended 31 December 2016For the year ended 31 December 2016
SecuritySecuritySecuritySecurity Nominal Nominal Nominal Nominal Proceeds Proceeds Proceeds Proceeds
€ € € €
ING Groep NV (1,036,497) (10,439,470)
SAP SE (130,608) (10,065,724)
Siemens AG (86,576) (8,104,279)
Brenntag AG (155,628) (7,570,296)
Fielmann AG (104,608) (7,452,274)
adidas AG (57,859) (7,251,858)
BASF SE (66,669) (4,518,316)
Muenchener Rueckversicherungs-Gesellschaft AG in Muenchen (20,424) (3,594,624)
Royal Dutch Shell Plc (178,244) (3,552,681)
Bayer AG (34,000) (3,253,207)
RELX NV (209,939) (3,201,570)
Nokia OYJ (641,790) (3,062,608)
Daimler AG (48,064) (3,030,409)
Linde AG (22,586) (2,895,767)
SKF AB (141,569) (2,140,615)
Hennes & Mauritz AB (73,648) (1,990,322)
Continental AG (9,801) (1,781,321)
Novartis AG (23,023) (1,651,748)
Eni SpA (119,423) (1,604,169)
Commerzbank AG (192,958) (1,477,868)
The Statement of Significant Purchases and Sales reflects the aggregate purchases of a security exceeding one percent of the total value
of purchases and aggregate disposals greater than one percent of total value of the sales for the year. At minimum the largest 20
purchases and 20 sales must be given or all purchases and sales if less than 20.
(unaudited)
(unaudited)
284
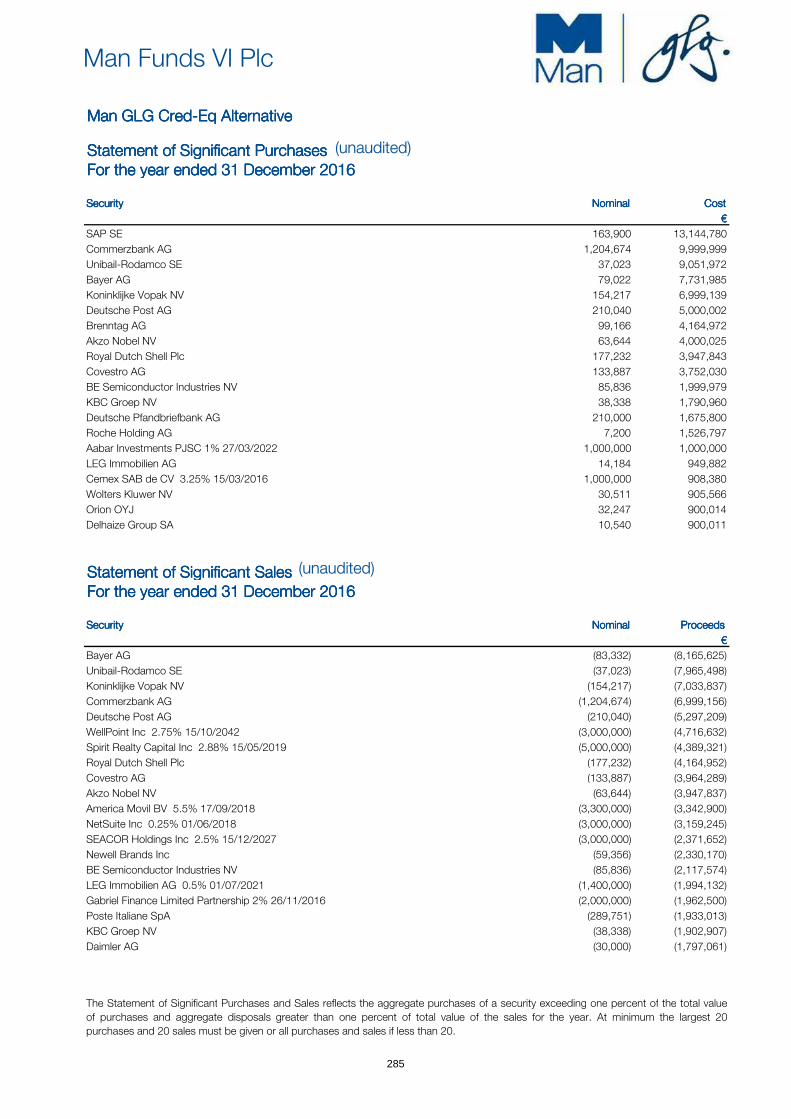
Man Funds VI Plc
Man GLG Cred-Eq Alternative Man GLG Cred-Eq Alternative Man GLG Cred-Eq Alternative Man GLG Cred-Eq Alternative
Statement of Significant PurchasesStatement of Significant PurchasesStatement of Significant PurchasesStatement of Significant PurchasesFor the year ended 31 December 2016For the year ended 31 December 2016For the year ended 31 December 2016For the year ended 31 December 2016
SecuritySecuritySecuritySecurity Nominal Nominal Nominal Nominal Cost Cost Cost Cost
€ € € €
SAP SE 163,900 13,144,780
Commerzbank AG 1,204,674 9,999,999
Unibail-Rodamco SE 37,023 9,051,972
Bayer AG 79,022 7,731,985
Koninklijke Vopak NV 154,217 6,999,139
Deutsche Post AG 210,040 5,000,002
Brenntag AG 99,166 4,164,972
Akzo Nobel NV 63,644 4,000,025
Royal Dutch Shell Plc 177,232 3,947,843
Covestro AG 133,887 3,752,030
BE Semiconductor Industries NV 85,836 1,999,979
KBC Groep NV 38,338 1,790,960
Deutsche Pfandbriefbank AG 210,000 1,675,800
Roche Holding AG 7,200 1,526,797
Aabar Investments PJSC 1% 27/03/2022 1,000,000 1,000,000
LEG Immobilien AG 14,184 949,882
Cemex SAB de CV 3.25% 15/03/2016 1,000,000 908,380
Wolters Kluwer NV 30,511 905,566
Orion OYJ 32,247 900,014
Delhaize Group SA 10,540 900,011
Statement of Significant SalesStatement of Significant SalesStatement of Significant SalesStatement of Significant SalesFor the year ended 31 December 2016For the year ended 31 December 2016For the year ended 31 December 2016For the year ended 31 December 2016
SecuritySecuritySecuritySecurity Nominal Nominal Nominal Nominal Proceeds Proceeds Proceeds Proceeds
€ € € €
Bayer AG (83,332) (8,165,625)
Unibail-Rodamco SE (37,023) (7,965,498)
Koninklijke Vopak NV (154,217) (7,033,837)
Commerzbank AG (1,204,674) (6,999,156)
Deutsche Post AG (210,040) (5,297,209)
WellPoint Inc 2.75% 15/10/2042 (3,000,000) (4,716,632)
Spirit Realty Capital Inc 2.88% 15/05/2019 (5,000,000) (4,389,321)
Royal Dutch Shell Plc (177,232) (4,164,952)
Covestro AG (133,887) (3,964,289)
Akzo Nobel NV (63,644) (3,947,837)
America Movil BV 5.5% 17/09/2018 (3,300,000) (3,342,900)
NetSuite Inc 0.25% 01/06/2018 (3,000,000) (3,159,245)
SEACOR Holdings Inc 2.5% 15/12/2027 (3,000,000) (2,371,652)
Newell Brands Inc (59,356) (2,330,170)
BE Semiconductor Industries NV (85,836) (2,117,574)
LEG Immobilien AG 0.5% 01/07/2021 (1,400,000) (1,994,132)
Gabriel Finance Limited Partnership 2% 26/11/2016 (2,000,000) (1,962,500)
Poste Italiane SpA (289,751) (1,933,013)
KBC Groep NV (38,338) (1,902,907)
Daimler AG (30,000) (1,797,061)
The Statement of Significant Purchases and Sales reflects the aggregate purchases of a security exceeding one percent of the total value
of purchases and aggregate disposals greater than one percent of total value of the sales for the year. At minimum the largest 20
purchases and 20 sales must be given or all purchases and sales if less than 20.
(unaudited)
(unaudited)
285
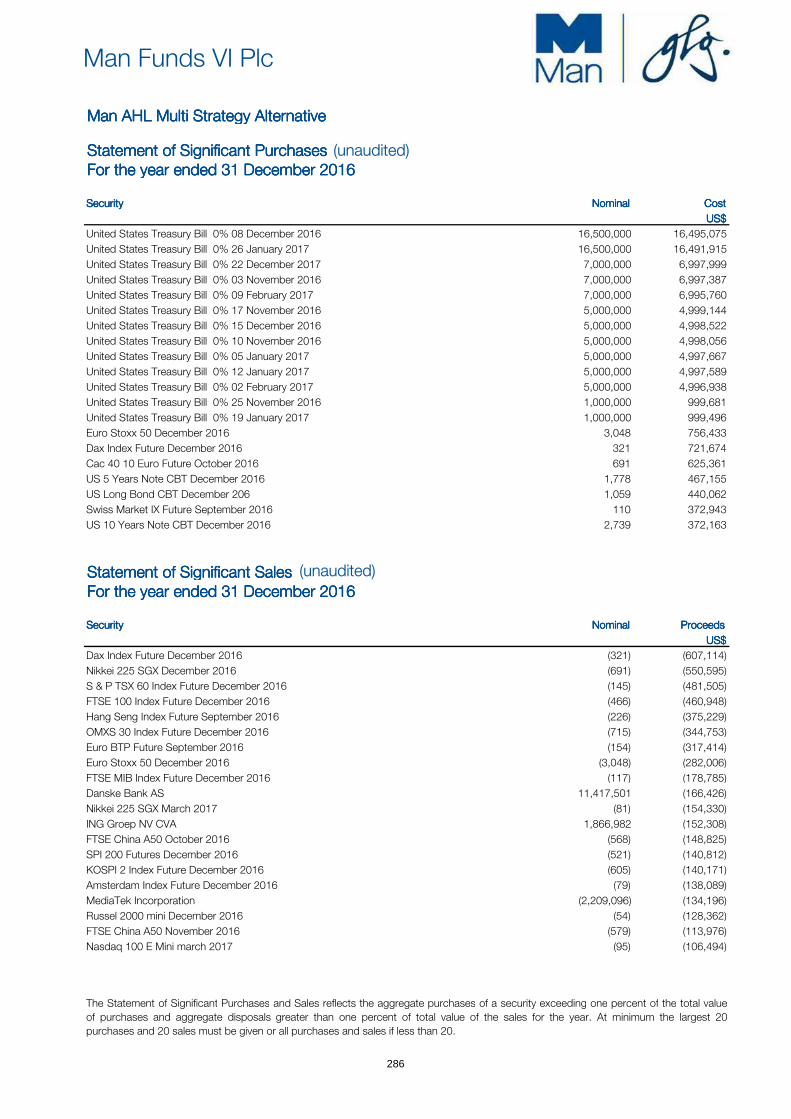
Man Funds VI Plc
Man AHL Multi Strategy Alternative Man AHL Multi Strategy Alternative Man AHL Multi Strategy Alternative Man AHL Multi Strategy Alternative
Statement of Significant PurchasesStatement of Significant PurchasesStatement of Significant PurchasesStatement of Significant PurchasesFor the year ended 31 December 2016For the year ended 31 December 2016For the year ended 31 December 2016For the year ended 31 December 2016
SecuritySecuritySecuritySecurity Nominal Nominal Nominal Nominal Cost Cost Cost Cost
US$ US$ US$ US$
United States Treasury Bill 0% 08 December 2016 16,500,000 16,495,075
United States Treasury Bill 0% 26 January 2017 16,500,000 16,491,915
United States Treasury Bill 0% 22 December 2017 7,000,000 6,997,999
United States Treasury Bill 0% 03 November 2016 7,000,000 6,997,387
United States Treasury Bill 0% 09 February 2017 7,000,000 6,995,760
United States Treasury Bill 0% 17 November 2016 5,000,000 4,999,144
United States Treasury Bill 0% 15 December 2016 5,000,000 4,998,522
United States Treasury Bill 0% 10 November 2016 5,000,000 4,998,056
United States Treasury Bill 0% 05 January 2017 5,000,000 4,997,667
United States Treasury Bill 0% 12 January 2017 5,000,000 4,997,589
United States Treasury Bill 0% 02 February 2017 5,000,000 4,996,938
United States Treasury Bill 0% 25 November 2016 1,000,000 999,681
United States Treasury Bill 0% 19 January 2017 1,000,000 999,496
Euro Stoxx 50 December 2016 3,048 756,433
Dax Index Future December 2016 321 721,674
Cac 40 10 Euro Future October 2016 691 625,361
US 5 Years Note CBT December 2016 1,778 467,155
US Long Bond CBT December 206 1,059 440,062
Swiss Market IX Future September 2016 110 372,943
US 10 Years Note CBT December 2016 2,739 372,163
Statement of Significant SalesStatement of Significant SalesStatement of Significant SalesStatement of Significant SalesFor the year ended 31 December 2016For the year ended 31 December 2016For the year ended 31 December 2016For the year ended 31 December 2016
SecuritySecuritySecuritySecurity Nominal Nominal Nominal Nominal Proceeds Proceeds Proceeds Proceeds
US$ US$ US$ US$
Dax Index Future December 2016 (321) (607,114)
Nikkei 225 SGX December 2016 (691) (550,595)
S & P TSX 60 Index Future December 2016 (145) (481,505)
FTSE 100 Index Future December 2016 (466) (460,948)
Hang Seng Index Future September 2016 (226) (375,229)
OMXS 30 Index Future December 2016 (715) (344,753)
Euro BTP Future September 2016 (154) (317,414)
Euro Stoxx 50 December 2016 (3,048) (282,006)
FTSE MIB Index Future December 2016 (117) (178,785)
Danske Bank AS 11,417,501 (166,426)
Nikkei 225 SGX March 2017 (81) (154,330)
ING Groep NV CVA 1,866,982 (152,308)
FTSE China A50 October 2016 (568) (148,825)
SPI 200 Futures December 2016 (521) (140,812)
KOSPI 2 Index Future December 2016 (605) (140,171)
Amsterdam Index Future December 2016 (79) (138,089)
MediaTek Incorporation (2,209,096) (134,196)
Russel 2000 mini December 2016 (54) (128,362)
FTSE China A50 November 2016 (579) (113,976)
Nasdaq 100 E Mini march 2017 (95) (106,494)
The Statement of Significant Purchases and Sales reflects the aggregate purchases of a security exceeding one percent of the total value
of purchases and aggregate disposals greater than one percent of total value of the sales for the year. At minimum the largest 20
purchases and 20 sales must be given or all purchases and sales if less than 20.
(unaudited)
(unaudited)
286
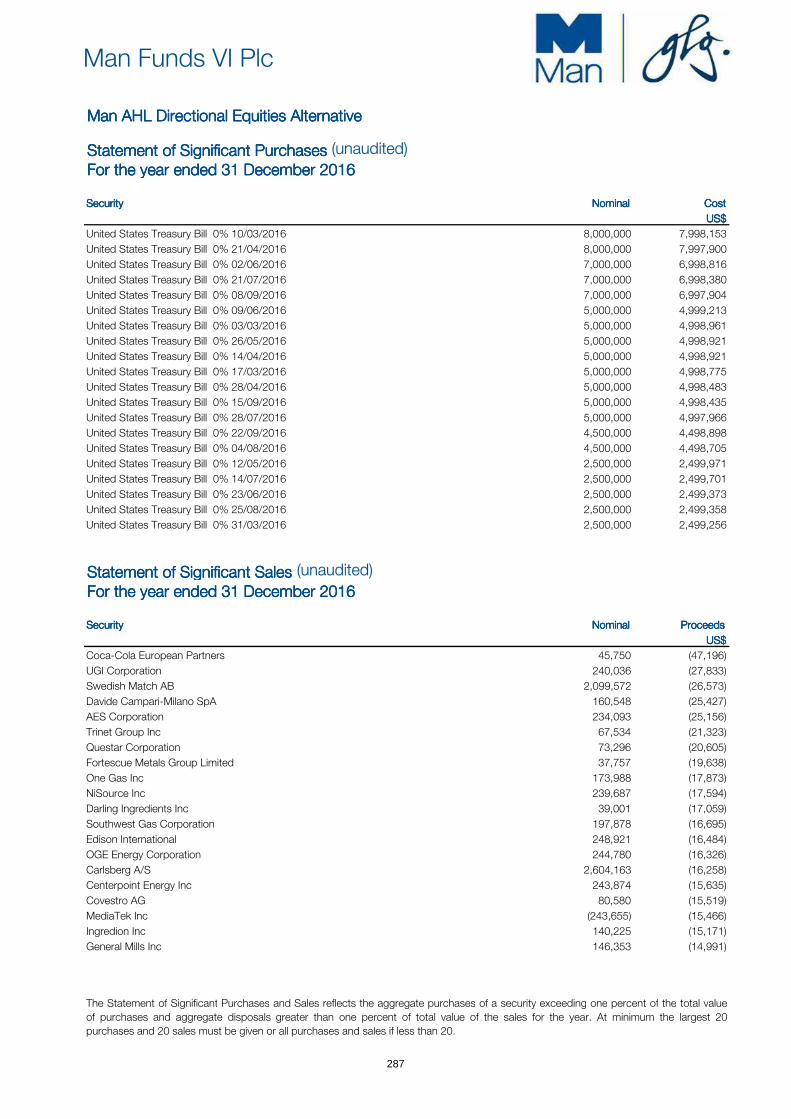
Man Funds VI Plc
Man AHL Directional Equities Alternative Man AHL Directional Equities Alternative Man AHL Directional Equities Alternative Man AHL Directional Equities Alternative
Statement of Significant PurchasesStatement of Significant PurchasesStatement of Significant PurchasesStatement of Significant PurchasesFor the year ended 31 December 2016For the year ended 31 December 2016For the year ended 31 December 2016For the year ended 31 December 2016
SecuritySecuritySecuritySecurity Nominal Nominal Nominal Nominal Cost Cost Cost Cost
US$ US$ US$ US$
United States Treasury Bill 0% 10/03/2016 8,000,000 7,998,153
United States Treasury Bill 0% 21/04/2016 8,000,000 7,997,900
United States Treasury Bill 0% 02/06/2016 7,000,000 6,998,816
United States Treasury Bill 0% 21/07/2016 7,000,000 6,998,380
United States Treasury Bill 0% 08/09/2016 7,000,000 6,997,904
United States Treasury Bill 0% 09/06/2016 5,000,000 4,999,213
United States Treasury Bill 0% 03/03/2016 5,000,000 4,998,961
United States Treasury Bill 0% 26/05/2016 5,000,000 4,998,921
United States Treasury Bill 0% 14/04/2016 5,000,000 4,998,921
United States Treasury Bill 0% 17/03/2016 5,000,000 4,998,775
United States Treasury Bill 0% 28/04/2016 5,000,000 4,998,483
United States Treasury Bill 0% 15/09/2016 5,000,000 4,998,435
United States Treasury Bill 0% 28/07/2016 5,000,000 4,997,966
United States Treasury Bill 0% 22/09/2016 4,500,000 4,498,898
United States Treasury Bill 0% 04/08/2016 4,500,000 4,498,705
United States Treasury Bill 0% 12/05/2016 2,500,000 2,499,971
United States Treasury Bill 0% 14/07/2016 2,500,000 2,499,701
United States Treasury Bill 0% 23/06/2016 2,500,000 2,499,373
United States Treasury Bill 0% 25/08/2016 2,500,000 2,499,358
United States Treasury Bill 0% 31/03/2016 2,500,000 2,499,256
Statement of Significant SalesStatement of Significant SalesStatement of Significant SalesStatement of Significant SalesFor the year ended 31 December 2016For the year ended 31 December 2016For the year ended 31 December 2016For the year ended 31 December 2016
SecuritySecuritySecuritySecurity Nominal Nominal Nominal Nominal Proceeds Proceeds Proceeds Proceeds
US$ US$ US$ US$
Coca-Cola European Partners 45,750 (47,196)
UGI Corporation 240,036 (27,833)
Swedish Match AB 2,099,572 (26,573)
Davide Campari-Milano SpA 160,548 (25,427)
AES Corporation 234,093 (25,156)
Trinet Group Inc 67,534 (21,323)
Questar Corporation 73,296 (20,605)
Fortescue Metals Group Limited 37,757 (19,638)
One Gas Inc 173,988 (17,873)
NiSource Inc 239,687 (17,594)
Darling Ingredients Inc 39,001 (17,059)
Southwest Gas Corporation 197,878 (16,695)
Edison International 248,921 (16,484)
OGE Energy Corporation 244,780 (16,326)
Carlsberg A/S 2,604,163 (16,258)
Centerpoint Energy Inc 243,874 (15,635)
Covestro AG 80,580 (15,519)
MediaTek Inc (243,655) (15,466)
Ingredion Inc 140,225 (15,171)
General Mills Inc 146,353 (14,991)
The Statement of Significant Purchases and Sales reflects the aggregate purchases of a security exceeding one percent of the total value
of purchases and aggregate disposals greater than one percent of total value of the sales for the year. At minimum the largest 20
purchases and 20 sales must be given or all purchases and sales if less than 20.
(unaudited)
(unaudited)
287

Man Funds VI Plc
Man AHL TargetRisk Man AHL TargetRisk Man AHL TargetRisk Man AHL TargetRisk
Statement of Significant PurchasesStatement of Significant PurchasesStatement of Significant PurchasesStatement of Significant PurchasesFor the year ended 31 December 2016For the year ended 31 December 2016For the year ended 31 December 2016For the year ended 31 December 2016
SecuritySecuritySecuritySecurity Nominal Nominal Nominal Nominal Cost Cost Cost Cost
US$ US$ US$ US$
United Kingdom Gilt Inflation Linked 0.125% 22 March 2024 10,854,560 16,322,846
United States Treasury Inflation Indexed Bonds 0.125% 15/07/2024 14,150,590 14,249,644
Deutsche Bundesrepublik Inflation Linked Bond 0.1% 15/04/2023 7,229,130 8,724,340
United States Treasury Inflation Indexed Bonds 0.125% 15/04/2019 7,160,770 7,278,745
France Government Bond OAT 0.25% 25/07/2024 5,572,940 6,842,080
United States Treasury Bill 0% 10/11/2016 5,000,000 4,998,056
United States Treasury Inflation Indexed Bonds 0.125% 15/04/2021 3,057,570 3,077,635
United States Treasury Bill 0% 12/05/2016 2,000,000 1,999,977
United States Treasury Bill 0% 19/05/2016 2,000,000 1,999,650
United States Treasury Bill 0% 03/03/2016 2,000,000 1,999,584
United States Treasury Bill 0% 26/05/2016 2,000,000 1,999,568
United States Treasury Bill 0% 14/04/2016 2,000,000 1,999,568
United States Treasury Bill 0% 23/06/2016 2,000,000 1,999,498
United States Treasury Bill 0% 05/05/2016 2,000,000 1,999,487
United States Treasury Bill 0% 08/12/2016 2,000,000 1,999,473
United States Treasury Bill 0% 07/07/2016 2,000,000 1,999,428
United States Treasury Bill 0% 31/03/2016 2,000,000 1,999,405
United States Treasury Bill 0% 07/04/2016 1,500,000 1,499,598
United States Treasury Bill 0% 14/07/2016 1,000,000 999,880
United States Treasury Bill 0% 09/06/2016 1,000,000 999,843
Statement of Significant SalesStatement of Significant SalesStatement of Significant SalesStatement of Significant SalesFor the year ended 31 December 2016For the year ended 31 December 2016For the year ended 31 December 2016For the year ended 31 December 2016
SecuritySecuritySecuritySecurity Nominal Nominal Nominal Nominal Proceeds Proceeds Proceeds Proceeds
US$ US$ US$ US$
United Kingdom Gilt Inflation Linked 0.125% 22 March 2024 (8,701,200) (12,801,260)
United States Treasury Inflation Indexed Bonds 0.125% 15/07/2024 (12,167,930) (12,200,281)
United States Treasury Inflation Indexed Bonds 0.125% 15/04/2019 (8,231,680) (8,331,855)
Deutsche Bundesrepublik Inflation Linked Bond 0.1% 15/04/2023 (6,211,180) (7,452,997)
France Government Bond OAT 0.25% 25/07/2024 (4,063,810) (4,956,434)
United States Treasury Bill 0% 10/11/2016 (4,500,000) (4,499,064)
United States Treasury Bill 0% 08/12/2016 (1,900,000) (1,899,582)
United States Treasury Bill 0% 26/05/2016 (1,000,000) (999,994)
United States Treasury Bill 0% 23/06/2016 (1,000,000) (999,811)
United States Treasury Bill 0% 07/07/2016 (1,000,000) (999,731)
BBG Commex AG&LV Cap 17,212,379 (451,396)
United States Treasury Bill 0% 15/12/2016 (400,000) (399,905)
Long Gilt Future September 2016 (57) (378,321)
FTSE 100 Index Future September 2016 (71) (376,951)
Long Gilt Future March 2016 (22) (151,697)
US Long Bond CBT September 2016 (18) (128,734)
US Ultra Bond CBT September 2016 (11) (125,695)
FTSE 100 Index Future December 2016 (76) (114,161)
S&P500 E-mini Future December 2016 (51) (113,835)
US Long Bond CBT March 2016 (9) (94,680)
The Statement of Significant Purchases and Sales reflects the aggregate purchases of a security exceeding one percent of the total value
of purchases and aggregate disposals greater than one percent of total value of the sales for the year. At minimum the largest 20
purchases and 20 sales must be given or all purchases and sales if less than 20.
(unaudited)
(unaudited)
288

Man Funds VI Plc
Man AHL Volatility Alternative Man AHL Volatility Alternative Man AHL Volatility Alternative Man AHL Volatility Alternative
Statement of Significant PurchasesStatement of Significant PurchasesStatement of Significant PurchasesStatement of Significant PurchasesFor the year ended 31 December 2016For the year ended 31 December 2016For the year ended 31 December 2016For the year ended 31 December 2016
SecuritySecuritySecuritySecurity Nominal Nominal Nominal Nominal Cost Cost Cost Cost
US$ US$ US$ US$
United States Treasury Bill 0% 10/03/2016 10,000,000 9,997,736
United States Treasury Bill 0% 02/06/2016 6,000,000 5,998,985
United States Treasury Bill 0% 03/03/2016 6,000,000 5,998,624
United States Treasury Bill 0% 21/07/2016 6,000,000 5,998,612
United States Treasury Bill 0% 21/04/2016 6,000,000 5,998,470
United States Treasury Bill 0% 28/01/2016 5,000,000 4,999,486
United States Treasury Bill 0% 17/03/2016 5,000,000 4,999,135
United States Treasury Bill 0% 24/03/2016 3,100,000 3,099,394
United States Treasury Bill 0% 16/06/2016 3,000,000 2,999,545
United States Treasury Bill 0% 18/02/2016 3,000,000 2,999,478
United States Treasury Bill 0% 05/05/2016 3,000,000 2,999,230
United States Treasury Bill 0% 11/08/2016 3,000,000 2,999,020
United States Treasury Bill 0% 06/10/2016 3,000,000 2,998,927
United States Treasury Bill 0% 28/04/2016 2,500,000 2,499,242
United States Treasury Bill 0% 09/06/2016 2,000,000 1,999,685
United States Treasury Bill 0% 17/11/2016 2,000,000 1,999,658
United States Treasury Bill 0% 22/09/2016 2,000,000 1,999,510
United States Treasury Bill 0% 04/08/2016 2,000,000 1,999,424
United States Treasury Bill 0% 22/12/2016 2,000,000 1,999,291
United States Treasury Bill 0% 09/02/2017 2,000,000 1,998,789
Statement of Significant SalesStatement of Significant SalesStatement of Significant SalesStatement of Significant SalesFor the year ended 31 December 2016For the year ended 31 December 2016For the year ended 31 December 2016For the year ended 31 December 2016
SecuritySecuritySecuritySecurity Nominal Nominal Nominal Nominal Proceeds Proceeds Proceeds Proceeds
US$ US$ US$ US$
United States Treasury Bill 0% 18/02/2016 (6,500,000) (6,499,923)
United States Treasury Bill 0% 10/03/2016 (6,500,000) (6,498,962)
United States Treasury Bill 0% 03/03/2016 (5,500,000) (5,499,364)
United States Treasury Bill 0% 21/07/2016 (5,000,000) (4,999,074)
United States Treasury Bill 0% 25/02/2016 (4,500,000) (4,499,741)
United States Treasury Bill 0% 17/11/2016 (1,800,000) (1,799,412)
United States Treasury Bill 0% 17/03/2016 (1,500,000) (1,499,700)
United States Treasury Bill 0% 08/12/2016 (500,000) (499,891)
Hang Seng Index Future February 2016 (57) (166,112)
EURO STOXX 50 December 2016 (451) (135,239)
Nasdaq 100 E-mini September 2016 (92) (129,595)
CBOE VIX FUTURE February 2016 (66) (114,050)
EURO-BUND Future September 2016 (216) (104,202)
NIKKEI 225 (OSE) December 2016 (116) (90,183)
Hang Seng Index Future July 2016 (33) (83,702)
DAX Index Future December 2016 (37) (82,802)
H-Shares Index Future February 2016 (55) (70,517)
BP Currency Future March 2016 (137) (69,113)
Calls on 2900 SX5E Index 18 March 2016 (27) (48,813)
Calls on 3950 NDX Index Call 18 March 2016 (1) (47,581)
The Statement of Significant Purchases and Sales reflects the aggregate purchases of a security exceeding one percent of the total value
of purchases and aggregate disposals greater than one percent of total value of the sales for the year. At minimum the largest 20
purchases and 20 sales must be given or all purchases and sales if less than 20.
(unaudited)
(unaudited)
289

Man Funds VI Plc
Man GLG European Mid-Cap Equity Alternative Man GLG European Mid-Cap Equity Alternative Man GLG European Mid-Cap Equity Alternative Man GLG European Mid-Cap Equity Alternative
Statement of Significant PurchasesStatement of Significant PurchasesStatement of Significant PurchasesStatement of Significant PurchasesFor the year ended 31 December 2016For the year ended 31 December 2016For the year ended 31 December 2016For the year ended 31 December 2016
SecuritySecuritySecuritySecurity Nominal Nominal Nominal Nominal Cost Cost Cost Cost
€ € € €
ING Groep NV 4,522,453 56,674,353
Brenntag AG 925,588 42,659,553
Fresenius SE & Company KGaA 604,508 39,999,954
Akzo Nobel NV 630,260 39,893,036
SAP SE 461,742 35,915,313
Volkswagen AG 185,229 22,351,992
Continental AG 127,422 21,863,340
Royal Dutch Shell Plc 939,648 20,930,659
Daimler AG 256,753 19,984,675
Bayer AG 204,002 19,080,725
Deutsche Bank AG 1,148,964 17,004,667
Koninklijke KPN NV 5,710,135 16,902,000
Beiersdorf AG 200,316 16,880,964
United Internet AG 396,171 16,105,060
Aalberts Industries NV 531,363 15,747,592
ABN AMRO Group NV 706,127 15,086,403
Allianz SE 112,809 14,223,168
Cargotec OYJ 334,380 12,834,657
Pandora A/S 110,317 12,750,141
Deutsche Post AG 459,751 12,675,482
Statement of Significant SalesStatement of Significant SalesStatement of Significant SalesStatement of Significant SalesFor the year ended 31 December 2016For the year ended 31 December 2016For the year ended 31 December 2016For the year ended 31 December 2016
SecuritySecuritySecuritySecurity Nominal Nominal Nominal Nominal Proceeds Proceeds Proceeds Proceeds
€ € € €
Akzo Nobel NV (630,260) (38,772,594)
SAP SE (461,742) (37,808,250)
Daimler AG (513,453) (36,773,270)
Koninklijke DSM NV (541,509) (28,244,377)
Continental AG (127,422) (23,340,922)
Royal Dutch Shell Plc (939,648) (22,081,728)
ING Groep NV (1,824,818) (20,930,662)
Brenntag AG (414,931) (20,224,376)
Bayer AG (204,002) (20,124,700)
Allianz SE (112,809) (17,484,077)
Beiersdorf AG (200,316) (16,927,412)
Koninklijke KPN NV (5,710,135) (16,677,152)
BASF SE (215,567) (15,160,514)
Cargotec OYJ (400,609) (14,608,201)
Deutsche Bank AG (1,148,964) (13,293,513)
Lanxess AG (201,123) (11,464,011)
ISS A/S (290,285) (9,665,652)
Heineken NV (137,779) (9,497,106)
Drillisch AG (231,652) (8,895,092)
Schaeffler AG (577,000) (7,897,148)
The Statement of Significant Purchases and Sales reflects the aggregate purchases of a security exceeding one percent of the total value
of purchases and aggregate disposals greater than one percent of total value of the sales for the year. At minimum the largest 20
purchases and 20 sales must be given or all purchases and sales if less than 20.
(unaudited)
(unaudited)
290

Man Funds VI Plc
Man Numeric Market Neutral Alternative Man Numeric Market Neutral Alternative Man Numeric Market Neutral Alternative Man Numeric Market Neutral Alternative
Statement of Significant PurchasesStatement of Significant PurchasesStatement of Significant PurchasesStatement of Significant PurchasesFor the year ended 31 December 2016For the year ended 31 December 2016For the year ended 31 December 2016For the year ended 31 December 2016
SecuritySecuritySecuritySecurity Nominal Nominal Nominal Nominal Cost Cost Cost Cost
US$ US$ US$ US$
OSRAM Licht AG 342,885 18,006,853
Covestro AG 309,059 17,784,193
Hannover Rueck SE 149,524 15,892,704
Suedzucker AG 690,419 14,493,326
HOCHTIEF AG 102,756 13,411,660
RTL Group SA 154,693 11,361,792
Talanx AG 351,721 11,150,100
Rheinmetall AG 159,248 10,962,772
Freenet AG 389,401 10,788,085
RHOEN-KLINIKUM AG 348,391 9,902,166
Kion Group AG 159,862 8,779,685
NCC AB 335,551 8,721,786
Aperam SA 187,117 8,014,955
Evonik Industries AG 270,605 7,667,433
Henkel AG & Company KGaA 63,871 7,219,326
Aurubis AG 132,519 7,141,057
Stada Arzneimittel AG 133,415 7,065,392
Aareal Bank AG 184,476 6,858,559
Sunrise Communications Group AG 108,551 6,645,633
Straumann Holding AG 19,514 6,645,432
Statement of Significant SalesStatement of Significant SalesStatement of Significant SalesStatement of Significant SalesFor the year ended 31 December 2016For the year ended 31 December 2016For the year ended 31 December 2016For the year ended 31 December 2016
SecuritySecuritySecuritySecurity Nominal Nominal Nominal Nominal Proceeds Proceeds Proceeds Proceeds
US$ US$ US$ US$
Suedzucker AG (421,206) (9,770,076)
HOCHTIEF AG (75,085) (9,593,195)
Straumann Holding AG (26,463) (9,569,217)
Kion Group AG (150,863) (8,330,286)
Stada Arzneimittel AG (151,780) (8,130,725)
Evonik Industries AG (270,605) (7,843,460)
Covestro AG (148,688) (7,779,609)
Software AG (185,116) (6,891,761)
Deutsche Telekom AG (382,008) (6,704,157)
Danske Bank A/S (222,735) (6,557,944)
Henkel AG & Company KGaA (63,871) (6,374,568)
Rheinmetall AG (89,529) (6,297,182)
Freenet AG (226,108) (6,274,546)
Pandora A/S (46,586) (6,196,997)
Hannover Rueck SE (48,715) (5,560,662)
Sunrise Communications Group AG (83,636) (5,554,335)
Castellum AB (362,558) (5,151,907)
CTS Eventim AG & Company KGaA (155,699) (5,129,729)
Diebold Nixdorf AG (96,745) (5,048,560)
KBC Groep NV (87,824) (5,033,812)
The Statement of Significant Purchases and Sales reflects the aggregate purchases of a security exceeding one percent of the total value
of purchases and aggregate disposals greater than one percent of total value of the sales for the year. At minimum the largest 20
purchases and 20 sales must be given or all purchases and sales if less than 20.
(unaudited)
(unaudited)
291

Man Funds VI Plc
Man GLG Unconstrained Emerging Equity Man GLG Unconstrained Emerging Equity Man GLG Unconstrained Emerging Equity Man GLG Unconstrained Emerging Equity
Statement of Significant PurchasesStatement of Significant PurchasesStatement of Significant PurchasesStatement of Significant PurchasesFor the year ended 31 December 2016For the year ended 31 December 2016For the year ended 31 December 2016For the year ended 31 December 2016
SecuritySecuritySecuritySecurity Nominal Nominal Nominal Nominal Cost Cost Cost Cost
US$ US$ US$ US$
United States Treasury Bill 0% 13/10/2016 5,500,000 5,497,861
United States Treasury Bill 0% 08/12/2016 4,000,000 3,998,787
United States Treasury Bill 0% 14/07/2016 3,000,000 2,999,402
United States Treasury Bill 0% 25/08/2016 3,000,000 2,999,230
United States Treasury Bill 0% 15/12/2016 3,000,000 2,999,113
United States Treasury Bill 0% 20/10/2016 3,000,000 2,999,020
United States Treasury Bill 0% 02/02/2017 3,000,000 2,998,163
Moscow Exchange MICEX 1,495,197 2,748,865
Korea Zinc Company Limited 6,359 2,603,914
Indiabulls Housing Finance Limited 214,095 2,203,168
Polymetal International Plc 206,086 2,066,207
Grupo Financiero Santander Mexico SAB de CV 248,504 2,020,807
United States Treasury Bill 0% 18/02/2016 2,000,000 1,999,852
United States Treasury Bill 0% 26/05/2016 2,000,000 1,999,751
United States Treasury Bill 0% 17/03/2016 2,000,000 1,999,603
United States Treasury Bill 0% 28/04/2016 2,000,000 1,999,393
United States Treasury Bill 0% 26/01/2017 2,000,000 1,999,020
Hollysys Automation Technologies Limited 92,411 1,819,528
Fomento Economico Mexicano SAB de CV 209,459 1,788,911
Kangwon Land Inc 54,372 1,788,109
Statement of Significant SalesStatement of Significant SalesStatement of Significant SalesStatement of Significant SalesFor the year ended 31 December 2016For the year ended 31 December 2016For the year ended 31 December 2016For the year ended 31 December 2016
SecuritySecuritySecuritySecurity Nominal Nominal Nominal Nominal Proceeds Proceeds Proceeds Proceeds
US$ US$ US$ US$
BM&FBovespa SA (482,057) (2,182,557)
Infosys Technologies (109,001) (1,641,414)
Zhuzhou CRRC Times Electric Company (312,655) (1,598,234)
British American Tobacco Plc (27,336) (1,563,785)
MMC Norilsk Nickel PJSC (83,709) (1,327,090)
Moscow Exchange MICEX-RTS OAO (627,515) (1,258,309)
Indiabulls Housing Finance Limited (93,709) (1,153,872)
FANUC Corporation (6,618) (1,117,018)
Tencent Holdings Limited (41,616) (1,034,607)
Woolworths Holdings Limited (195,177) (1,009,636)
Korea KOSPI 200 Index (4,500,000) (1,001,620)
United States Treasury Bill 0% 15/12/16 (1,000,000) (999,965)
United States Treasury Bill 0% 08/12/16 (1,000,000) (999,904)
Grupo Mexico SAB de CV (349,818) (923,409)
PAX Global Technology Limited (1,443,105) (885,358)
Yum! Brands Inc (11,722) (726,041)
Check Point Software Technologies Limited (8,458) (703,997)
Moscow Exchange MICEX-RTS CFD 372,124 (703,475)
ICICI Bank Limited (85,767) (687,605)
Taro Pharmaceutical Industries Limited (6,207) (631,093)
The Statement of Significant Purchases and Sales reflects the aggregate purchases of a security exceeding one percent of the total value
of purchases and aggregate disposals greater than one percent of total value of the sales for the year. At minimum the largest 20
purchases and 20 sales must be given or all purchases and sales if less than 20.
(unaudited)
(unaudited)
292

Man Funds VI Plc
Man GLG Global Emerging Markets Debt Total Return Man GLG Global Emerging Markets Debt Total Return Man GLG Global Emerging Markets Debt Total Return Man GLG Global Emerging Markets Debt Total Return
Statement of Significant PurchasesStatement of Significant PurchasesStatement of Significant PurchasesStatement of Significant PurchasesFor the year ended 31 December 2016For the year ended 31 December 2016For the year ended 31 December 2016For the year ended 31 December 2016
SecuritySecuritySecuritySecurity Nominal Nominal Nominal Nominal Cost Cost Cost Cost
US$ US$ US$ US$
United States Treasury Note 1.75% 30/11/2021 105,400,000 103,798,953
Colombia Government International Bond 7.375% 18/03/2019 35,725,000 40,673,700
Republic of South Africa 6.875% 27/05/2019 28,450,000 31,554,538
United States Treasury Bill 0% 05/01/2017 28,500,000 28,488,126
United States Treasury Bill 0% 02/02/2017 28,500,000 28,482,911
United States Treasury Bill 0% 15/12/2016 28,000,000 27,991,724
United States Treasury Bill 0% 20/10/2016 28,000,000 27,990,373
Turkey Government International Bond 7.5% 14/07/2017 26,650,000 27,656,250
United States Treasury Bill 0% 08/12/2016 27,000,000 26,991,810
United States Treasury Bill 0% 26/01/2017 26,500,000 26,487,295
Turkey Government International Bond 7.5% 07/11/2019 22,900,000 26,076,810
United States Treasury Bill 0% 12/01/2017 25,500,000 25,491,013
Brazil Notas do Tesouro Nacional Serie F 0% 01/01/2021 90,473,000 25,315,227
United States Treasury Bill 0% 19/01/2017 24,500,000 24,488,272
United States Treasury Bill 0% 10/11/2016 24,000,000 23,990,667
Indonesia Government International Bond 11.625% 04/03/2019 18,935,000 23,375,519
United States Treasury Bill 0% 18/08/2016 22,500,000 22,493,963
United States Treasury Bill 0% 13/10/2016 22,500,000 22,491,250
United States Treasury Bill 0% 25/11/2016 20,000,000 19,993,611
Petroleos Mexicanos 3.5% 18/07/2018 19,450,000 19,621,175
Statement of Significant SalesStatement of Significant SalesStatement of Significant SalesStatement of Significant SalesFor the year ended 31 December 2016For the year ended 31 December 2016For the year ended 31 December 2016For the year ended 31 December 2016
SecuritySecuritySecuritySecurity Nominal Nominal Nominal Nominal Proceeds Proceeds Proceeds Proceeds
US$ US$ US$ US$
United States Treasury Bill 0% 05/01/2017 (24,000,000) (23,993,189)
United States Treasury Bill 0% 02/02/2017 (24,000,000) (23,986,950)
United States Treasury Bill 0% 26/01/2017 (22,000,000) (21,990,363)
United States Treasury Bill 0% 12/01/2017 (21,000,000) (20,993,630)
United States Treasury Bill 0% 19/01/2017 (20,000,000) (19,992,250)
Turkey Government International Bond 7.5% 07/11/2019 (16,500,000) (18,634,688)
United States Treasury Bill 0% 15/12/2016 (14,000,000) (13,999,318)
United States Treasury Note/Bond 0.875% 15/09/2019 (14,000,000) (13,766,484)
United States Treasury Bill 0% 22/12/2016 (13,000,000) (12,996,873)
Argentine Republic Government International Bond 6.25% 22/04/2019 (10,475,000) (11,221,100)
Turkey Government International Bond 6.75% 03/04/2018 (8,920,000) (9,562,240)
Majapahit Holding BV 7.75% 20/01/2020 (7,300,000) (8,471,650)
Petroleos Mexicanos 3.5% 18/07/2018 (8,125,000) (8,183,475)
Republic of South Africa 6.875% 27/05/2019 (5,500,000) (6,180,625)
United States Treasury Bill 0% 08/12/2016 (5,000,000) (4,999,521)
Nigeria Government International Bond 5.125% 12/07/2018 (4,200,000) (4,221,000)
Dominican Republic International Bond 7.5% 06/05/2021 (2,900,000) (3,239,300)
Petrobras Global Finance BV 3% 15/01/2019 (3,325,000) (3,201,975)
South Africa Government International Bond 5.5% 03/09/2020 (2,400,000) (2,625,000)
United States Treasury Bill 0% 04/08/2016 (2,000,000) (1,999,536)
The Statement of Significant Purchases and Sales reflects the aggregate purchases of a security exceeding one percent of the total value
of purchases and aggregate disposals greater than one percent of total value of the sales for the year. At minimum the largest 20
purchases and 20 sales must be given or all purchases and sales if less than 20.
(unaudited)
(unaudited)
293

Man Funds VI plc Supplementary information (unaudited) For the year ended 31 December 2016
294
Report of Directors’ Remuneration (Unaudited)
The directors of the Fund who are also employees of Man Group plc and companies within its group structure (‘‘Man Group’’) do not receive any remuneration in respect of their services as directors of the Fund. The other directors receive fixed remuneration in respect of their services which is set at a level determined by the Board as a whole and which is not performance related. This is detailed in note 9 of these financial statements. None of the directors are currently in receipt of variable remuneration in respect of their services as directors of the Fund and none of the directors are currently in receipt of a pension from the Fund. The Fund has appointed Man Asset Management (Ireland) Limited as its UCITS management company. As such, the provisions of Article 14b of Directive 2009/65/EC in relation to remuneration are not applicable to the Fund. However, they do apply to Man Asset Management (Ireland) Limited, which has adopted a remuneration policy to ensure compliance.

Man Funds VI plc Unaudited reporting requirement in respect of the Securities Financing Transactions Regulation For the year ended 31 December 2016
295
The Investment Manager may, on behalf of each sub-fund and subject to the conditions and within the limits laid down by the Financial Conduct Authority and the Prospectus, employ techniques and instruments relating to transferable securities, including investments in OTC Financial Derivative Instruments (‘‘FDI’’) provided that such techniques and instruments are used for efficient portfolio management purposes or to provide protection against exchange risk or for direct investment purposes, where applicable.
The sub-funds engaged in securities lending activity during the year for the purposes of efficient portfolio management, and invested in total return swaps, repos or reverse repos.
Securities Lending
All securities lending transactions entered into by the sub-funds are subject to a written legal agreement between the sub- funds and the Lending Agent, which is the Bank of New York Mellon, London Branch, and separately between the Lending Agent and the approved borrowing counterparty. Collateral received in exchange for securities lent is delivered to an account in the name of the Depositary on behalf of the sub-fund. Collateral received is segregated from the assets belonging to the sub-fund’s Depositary or the Lending Agent.
The total income earned from securities lending transactions is split between the relevant sub-fund and the securities lending agent. The sub-fund receives at least 80% while the securities lending agent receives up to 20% of such income with all operational costs borne out of the securities lending agent’s share. Income received during the year by each sub-fund from securities lending transactions is disclosed in other income in the statement of comprehensive income included as part of the financial statements.
The following table details the value of securities on loan, the maturity tenor of which is always open, as they are recallable or terminable on a daily basis. Additionally there is an analysis of the maturity tenor of the associated collateral received as at 31 December 2016 based on the respective transaction contractual maturity date, split between counterparty borrower, with the country of incorporation of the counterparty shown in brackets:
Man GLG European Alpha Alternative
Total value of Less than 31 to 90 91 to 365More than
365 Total
securities on loan 1 day days days days Open Collateral
US$’000 US$’000 US$’000 US$’000 US$’000 US$’000 US$’000
UBS AG (Incorporated in the United Kingdom)
Equities - 290 - - - 290
290 - 290 - - - 290
Counterparty borrower and collateral type
290

Man Funds VI plc Unaudited reporting requirement in respect of the Securities Financing Transactions Regulation (continued) For the year ended 31 December 2016
296
Securities Lending (continued)
Man GLG European Equity Alternative
Total value of Less than 31 to 90 91 to 365 365 Total
securities 1 day days days days Open Collateral
on loanUS$’000 US$’000 US$’000 US$’000 US$’000 US$’000 US$’000
BNP ParibasCollateral Received: USD Cash 4 - - - - 4 Equities - 1,587 - - - 1,587 BNP Paribas Prime Brokerage, Inc.Collateral Received: USD Cash 5 - - - - 5 BNP Paribas ArbitrageEquities - 208 - - - 208 Bank of New York MellonCollateral Received: USD CashCredit Suisse Securities (Europe) Limited (Incorporated in the United Kingdom)
Collateral Received: EUR Cash
Equities - 250 - - - 250 Credit Suisse Securities (USA) LLC (Incorporated in the United States)
Collateral Received: USD Cash
ING Financial Markets LLC (Incorporated in the United States)
Collateral Received: USD Cash
Morgan Stanley & Co. LLC (Incorporated in the United States)
Collateral Received: USD Cash
Merrill Lynch InternationalEquities - 3,307 - - - 3,307 Natixis Securities America LLC (Incorporated in the United States)
Collateral Received: USD Cash
Pershing LLC (Incorporated in the United States)
Collateral Received: USD Cash
RBC Capital Markets, LLC (Incorporated in the United States)
Collateral Received: USD Cash
RBC Dominion Securities Inc (Incorporated in the United States)
Collateral Received: USD Cash
SG Americas Securities, LLC (Incorporated in the United States)
Collateral Received: USD Cash
Scotia Capital (USA) INC (Incorporated in the United States)
Collateral Received: USD Cash
Societe Generale (Incorporated in the United Kingdom)Equities - 8,844 - - - 8,844
UBS AG (Incorporated in the United Kingdom)
Collateral Received: USD Cash 559 - - - - 559 Equities - 3,522 - - - 3,522 Exchange Traded Funds - 3,715 - - - 3,715
40,318 19,332 21,433 - - - 40,765
4
1,869 1,919 - - - - 1,919
Counterparty borrower and collateral type
1,600
2,353
9,018 9,205 - - - - 9,205
2,353 - - - -
1,875
38 39 - - - - 39
1,816 1,875 - - - -
295
261 267 - - - - 267
277 295 - - - -
- - - 501
31
1,824
490
7,780
1,924 - - -
29 31 - - - -
- 353
3,307
8,844
2,607
344 353 - - -
208
- 1,924
501 -

Man Funds VI plc Unaudited reporting requirement in respect of the Securities Financing Transactions Regulation (continued) For the year ended 31 December 2016
297
Securities Lending (continued) Man GLG Global Equity Alternative
Total value of Less than 31 to 90 91 to 365More than
365 Total
securities on loan 1 day days days days Open Collateral
US$’000 US$’000 US$’000 US$’000 US$’000 US$’000 US$’000
BNP Paribas (Incorporated in the United Kingdom)EquitiesBarclays Capital Inc. (Incorporated in the United States)Collateral Received: USD Cash 41 - - - - 41 Equities - 695 - - - 695
Bank of New York Mellon
Collateral Received: USD CashCredit Suisse Securities (Europe) Limited (Incorporated in the United Kingdom)
Equities
Credit Suisse Securities (USA) LLC (Incorporated in the United States)
Collateral Received: USD Cash 1,709 - - - - 1,709
Equities - 41 - - - 41
Industrial And Commercial Bank Of China
Collateral Received: USD Cash
ING Financial Markets LLC (Incorporated in the United States)
Collateral Received: USD Cash
ING Bank NV
Corporate Bonds
J.P. Morgan Securities LLC (Incorporated in the United States)Collateral Received: USD Cash 1,938 - - - - 1,938 Exchange Traded Funds - 374 - - - 374 Equities - 615 - - - 615 JP Morgan Securities, Plc. (Incorporated in the United Kingdom)
Collateral Received: USD Cash 884 - - - - 884
Equities - 1,222 - - - 1,222
Merrill Lynch International (Incorporated in the United Kingdom)
Equities
Pershing LLC (Incorporated in the United States)
Collateral Received: USD Cash
RBC Dominion Securities Inc (Incorporated in the United States)
Collateral Received: USD Cash
UBS AG (Incorporated in the United Kingdom)
Collateral Received: USD Cash 564 - - - - 564
Exchange Traded Funds - 1,234 - - - 1,234
Equities - 1,201 - - - 1,201
Wells Fargo Securities LLC
Collateral Received: USD Cash
14,316 5,878 8,722 - - - 14,880
280
Counterparty borrower and collateral type
192
735
17
31
55
47 48 48 - - - -
113
59 59 - - - -
-
418
32
427 -
- - 159
2,755
- - 17
280
1,713
2,755 - 2,755 - -
154
17 - -
1,935
159 - -
2,885
2,986
113
- -
- 113
192 192 - - - -
- - - 427
32 - - - -
- 280 -
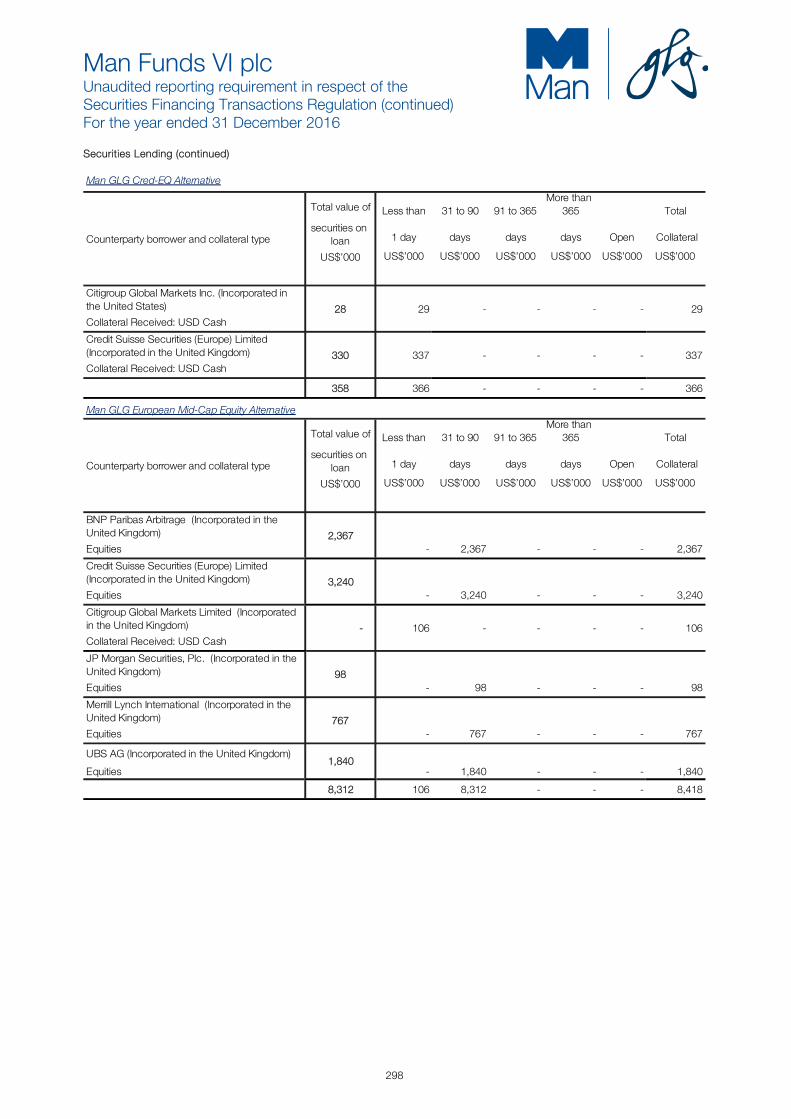
Man Funds VI plc Unaudited reporting requirement in respect of the Securities Financing Transactions Regulation (continued) For the year ended 31 December 2016
298
Securities Lending (continued)
Man GLG Cred-EQ Alternative
Total value of Less than 31 to 90 91 to 365More than
365 Total
securities on loan 1 day days days days Open Collateral
US$’000 US$’000 US$’000 US$’000 US$’000 US$’000 US$’000
Citigroup Global Markets Inc. (Incorporated in the United States)
Collateral Received: USD Cash
Credit Suisse Securities (Europe) Limited (Incorporated in the United Kingdom)
Collateral Received: USD Cash
358 366 - - - - 366
Counterparty borrower and collateral type
330
28
337
29
- - - - 337
- - - - 29
Man GLG European Mid-Cap Equity Alternative
Total value of Less than 31 to 90 91 to 365More than
365 Total
securities on loan 1 day days days days Open Collateral
US$’000 US$’000 US$’000 US$’000 US$’000 US$’000 US$’000
BNP Paribas Arbitrage (Incorporated in the United Kingdom)
Equities - 2,367 - - - 2,367
Credit Suisse Securities (Europe) Limited (Incorporated in the United Kingdom)
Equities - 3,240 - - - 3,240
Citigroup Global Markets Limited (Incorporated in the United Kingdom)
Collateral Received: USD Cash
JP Morgan Securities, Plc. (Incorporated in the United Kingdom)
Equities - 98 - - - 98
Merrill Lynch International (Incorporated in the United Kingdom)
Equities - 767 - - - 767
UBS AG (Incorporated in the United Kingdom)
Equities - 1,840 - - - 1,840
8,312 106 8,312 - - - 8,418
767
- 106 - - - - 106
98
3,240
1,840
Counterparty borrower and collateral type
2,367

Man Funds VI plc Unaudited reporting requirement in respect of the Securities Financing Transactions Regulation (continued) For the year ended 31 December 2016
299
Securities Lending (continued)
Man GLG Unconstrained Emerging Equity
Total value of Less than 31 to 90 91 to 365More than
365 Total
securities on loan 1 day days days days Open Collateral
US$’000 US$’000 US$’000 US$’000 US$’000 US$’000 US$’000
Bank of New York Mellon (Incorporated in the United States)
Collateral Received: USD Cash
Citigroup Global Markets Inc. (Incorporated in the United States)
Collateral Received: USD Cash 1,020 - - - - 1,020
Government Bonds - 2,999 - - - 2,999
Credit Suisse Securities (Europe) Limited (Incorporated in the United Kingdom)
Equities
4,960 1,750 3,249 - - - 4,999
Counterparty borrower and collateral type
712 730
- 250
3,998
- - - - 730
250 - 250 - -
The total value of securities on loan as a proportion of the sub-funds' Net Asset Value as at the balance sheet date is as per below:
Market Value % of Net Assets
Man GLG European Alpha Alternative 290,267 0.20%
Man GLG European Equity Alternative 40,306,785 5.94%
Man GLG Global Equity Alternative 14,316,817 7.57%
Man GLG Cred-Eq Alternative 357,536 0.78%
Man GLG European Mid-Cap Equity Alternative 8,312,423 2.50%
Man GLG Unconstrained Emerging Equity 4,960,820 7.35%
The total value of securities on loan as a proportion of the sub-funds’ total lendable assets, as at the balance sheet date, is as per below:
Fund Market Value on Loan % of Net Assets
Man GLG European Alpha Alternative €4,455,305 3.07%
Man GLG European Equity Alternative €42,015,552 6.19%
Man GLG Global Equity Alternative €14,901,621 7.88%
Man GLG Cred-Eq Alternative €786,869 1.71%
Man GLG European Mid-Cap Equity Alternative €7,744,443 2.33%
Man GLG Unconstrained Emerging Equity US$4,787,203 7.09%
Total lendable assets represent the aggregate value of assets types forming part of the sub-funds’ securities lending programme.

Man Funds VI plc Unaudited reporting requirement in respect of the Securities Financing Transactions Regulation (continued) For the year ended 31 December 2016
300
Securities Lending (continued)
Net income earned by the sub-funds from securities lending activity during the year and fees paid to the securities lending agent were:
Income earned Fees paid
Man GLG European Equity Alternative €312,767 €62,796
Man GLG European Alpha Alternative €49,418 €3,372
Man GLG Alpha Select Alternative £248 £3
Man GLG European Alpha Alternative Enhanced €1,534 -
Man GLG Global Equity Alternative €112,980 €25,829
Man GLG Cred-EQ Alternative €4,812 -
Man GLG European Mid-Cap Equity Alternative €13,071 €84
Man GLG Unconstrained Emerging Equity US$17,075 US$1,308
The following table lists all of the issuers by value of non-cash collateral received by the sub-funds by way of title transfer collateral arrangement across securities lending transactions as at the balance sheet date:
Non-cash collateral issuer Value % of the net assetsMan GLG European Alpha Alternative €
UBS AG 290,267 0.20%
Man GLG Alpha Select Alternative £
BNP Paribas 1,586,597 1.39%BNP Paribas Arbitrage 208,269 0.18%Credit Suisse Securities (Europe) Limited 373,912 0.33%Merrill Lynch International 3,307,482 2.90%Societe Generale 8,844,346 7.76%UBS AG 7,237,080 6.35%
Man GLG European Mid-Cap Equity Alternative €
BNP Paribas Arbitrage 2,366,693 0.71%Credit Suisse Securities (Europe) Limited 3,239,993 0.98%JP Morgan Securities, Plc. 98,300 0.03%Merrill Lynch International 767,193 0.23%UBS AG 1,840,244 0.55%
Man GLG Global Equity Alternative €
BNP Paribas 191,437 0.10%Barclays Capital Inc. 695,464 0.37%Credit Suisse Securities (Europe) Limited 280,058 0.15%Credit Suisse Securities (USA) LLC 40,918 0.02%ING Bank NV 2,755,382 1.46%J.P. Morgan Securities LLC 988,328 0.52%JP Morgan Securities, Plc. 1,221,566 0.65%Merrill Lynch International 112,946 0.06%UBS AG 2,434,453 1.29%
Man GLG Unconstrained Emerging Equity US$
Citigroup Global Markets Inc. 2,998,830 4.44%Credit Suisse Securities (Europe) Limited 250,110 0.37%

Man Funds VI plc Unaudited reporting requirement in respect of the Securities Financing Transactions Regulation (continued) For the year ended 31 December 2016
301
Securities Lending (continued)
As at the balance sheet date, all of the cash collateral received in respect of securities lending transactions, was re-invested in repos managed by various counterparties as per below:
Market Value % of Net Assets
Man GLG European Equity Alternative €19,336,894 2.85%
Man GLG Global Equity Alternative €5,880,677 3.11%
Man GLG Cred-Eq Alternative €972,834 2.12%
Man GLG European Mid-Cap Equity Alternative €106,108 0.03%
Man GLG Unconstrained Emerging Equity US$1,750,426 2.59%
Non-cash collateral received by way of title transfer collateral arrangement in relation to securities lending transactions and OTC derivative transactions, cannot be sold, re-invested or pledged.
Income earned by the sub-funds from the reinvestment of cash collateral in repos, net of any interest payable to the relevant counterparty, for the year ended 31 December 2016 is disclosed in the table below and is presented within other income in the statement of comprehensive income:
Man GLG European Alpha Alternative €54,447
Man GLG Alpha Select Alternative £240
Man GLG European Equity Alternative €333,850
Man GLG Global Equity Alternative €119,581
Man GLG European Alpha Alternative Enhanced €1,999
Man GLG Cred-Eq Alternative €4,864
Man GLG European Mid-Cap Equity Alternative €14,511
Man GLG Unconstrained Emerging Equity US$17,666
All of the non-cash collateral received by the sub-funds was held by BNY Mellon, London Branch on a tri party settlement basis as at 31 December 2016.
100% of cash collateral is maintained in a segregated account with the custodian. 100% of non-cash collateral is maintained in pooled accounts
Portfolio Swaps
OTC derivative transactions are entered into by the sub-funds under an International Swaps and Derivatives Associations, Inc. Master Agreement (‘‘ISDA Master Agreement’’) or similar agreement. An ISDA Master Agreement is a bilateral agreement between the sub-funds and a counterparty that governs OTC derivative transactions (including total return swaps and portfolio swaps) entered into by the parties. All OTC derivative transactions entered under an ISDA Master agreement are netted together for collateral purposes therefore any collateral disclosures provided below/elsewhere in the report are in respect of all OTC derivative transactions entered into by the sub-funds under the ISDA Master agreement, not just portfolio swaps.
The collateral figures provided on the next page relate to collateral held to support specific SFTRs, other cash held at brokers to support SFTRs, and other derivative transactions held at brokers where SFTRs are transacted.
The following table details the value of portfolio swaps as a proportion of the sub-fund’s net asset value, as at 31 December 2016:
Portfolio swaps
% of net assetsMan GLG European Alpha Alternative -1.86%Man GLG Alpha Select Alternative 0.97%Man GLG European Equity Alternative -0.98%Man GLG Global Equity Alternative -0.95%Man GLG Cred-Eq Alternative -2.98%Man AHL Multi Strategy Alternative 0.98%Man AHL TargetRisk 0.04%Man GLG European Mid-Cap Equity Alternative 0.71%Man Numeric Market Neutral Alternative -0.23%Man GLG Unconstrained Emerging Equity 1.31%

Man Funds VI plc Unaudited reporting requirement in respect of the Securities Financing Transactions Regulation (continued) For the year ended 31 December 2016
302
Portfolio Swaps (continued)
All returns and costs from securities borrowing from OTC transactions were accrued to the sub-funds and were not subject to any returns sharing arrangements with the Fund’s Investment Manager or any other third parties.
The following table details the value of portfolio swaps, analysed by counterparty as at 31 December 2016:
CounterpartyCounterparty's country of establishment
Portfolio Swap Market value
Man GLG European Alpha Alternative €
Citibank N.A. United Kingdom (2,806)
Credit Suisse Securities (Europe) Limited United Kingdom (2,670,942)
Goldman Sachs International United Kingdom (19,240)
Man GLG Alpha Select Alternative £
Credit Suisse Securities Europe Limited United Kingdom 1,107,029
Man GLG European Equity Alternative €
Bank of America Merrill Lynch United Kingdom (254,672)
Citibank N.A. United Kingdom 151,690
Credit Suisse Securities Europe Limited United Kingdom (7,475,101)
Goldman Sachs International United Kingdom 1,072,391
HSBC Bank Plc United Kingdom 226,012
JP Morgan Securities Plc United Kingdom 578,709
Morgan Stanley & Fund International Plc United Kingdom (1,295,569)
UBS AG United Kingdom 312,573
Societe Generale United Kingdom 2,621
Man GLG Global Equity Alternative €
Bank of America Merrill Lynch United Kingdom (103,890)
Citibank N.A. United Kingdom 57,394
Credit Suisse Securities Europe Limited United Kingdom (1,206,953)
Goldman Sachs International United Kingdom 152,467
HSBC Bank Plc United Kingdom (76,130)
JP Morgan Securities Plc United Kingdom 150,530
Morgan Stanley & Fund International Plc United Kingdom (852,989)
UBS AG United Kingdom 84,330
Societe Generale United Kingdom 915
Man GLG Cred-Eq Alternative €
Credit Suisse Securities Europe Limited United Kingdom (645,215)
Morgan Stanley & Fund International Plc United Kingdom (723,418)
Man AHL Multi Strategy Alternative US$
Credit Suisse Securities Europe Limited United Kingdom 1,017,975
Morgan Stanley & Fund International Plc United Kingdom 232,508
Man GLG European Mid-Cap Equity Alternative €
Bank of New York Mellon United Kingdom (362,309)
HSBC Bank Plc United Kingdom 1,116,037
Goldman Sachs International United Kingdom 7,306,221
Credit Suisse Securities Europe Limited United Kingdom (5,694,950)
Man Numeric Market Neutral Alternative US$
Morgan Stanley & Fund International Plc United Kingdom (397,009)
Man GLG Unconstrained Emerging Equity US$
Credit Suisse Securities Europe Limited United Kingdom 200,857
Morgan Stanley & Fund International Plc United Kingdom 681,869
All portfolio swaps have an open maturity tenor as they are recallable or terminable on a daily basis.

Man Funds VI plc Unaudited reporting requirement in respect of the Securities Financing Transactions Regulation (continued) For the year ended 31 December 2016
303
Collateral
The sub-funds engage in activity which may require collateral to be provided to a counterparty (‘‘collateral posted’’).
Counterparty Currency Collateral posted Man GLG European Alpha Alternative €
Bank of New York Mellon EUR 130,001 Credit Suisse Securities Europe Limited EUR 10,557,515 Goldman Sachs International EUR 2,920,000 Morgan Stanley & Co. International Plc EUR 206,347
Man GLG Alpha Select Alternative £Bank of New York Mellon GBP 6,453 Bank of America Merrill Lynch GBP 1,945 Bank of America Merrill Lynch USD 4,188 Morgan Stanley & Co. International Plc USD 1,225 Morgan Stanley & Co. International Plc GBP 108,130
Man GLG European Equity Alternative €Societe Generale EUR 490,000 Bank of New York Mellon EUR 321 Macquarie Group EUR 36,059 UBS AG EUR 352,774 Bank of America Merrill Lynch EUR 188,984 Citibank N.A. EUR 2,500,402 Credit Suisse Securities Europe Limited EUR 7,911,811 JP Morgan Securities Plc EUR 9,537,070 HSBC Bank Plc EUR 10,089,847 Goldman Sachs International EUR 25,893,943
Man GLG Global Equity Alternative €Bank of New York Mellon EUR 1,330,472 Credit Suisse Securities Europe Limited EUR 2,319,922 HSBC Bank Plc EUR 3,431,438 JP Morgan Securities Plc EUR 3,228,829 Bank of America Merrill Lynch EUR 729,583 Citibank N.A. EUR 901,332 Goldman Sachs International EUR 6,301,229 Societe Generale EUR 160,000 Goldman Sachs International USD 18,962 Macquarie Group EUR 16,276 Bank of America Merrill Lynch EUR 543,742 Morgan Stanley & Co. International Plc AUD 4,360 Morgan Stanley & Co. International Plc CAD 2,392 Morgan Stanley & Co. International Plc DKK 106,741 Morgan Stanley & Co. International Plc EUR 4,726,281 Morgan Stanley & Co. International Plc HKD 256,081 Morgan Stanley & Co. International Plc JPY 86,780 Morgan Stanley & Co. International Plc PLN 36,261 Morgan Stanley & Co. International Plc SEK 13,706 Morgan Stanley & Co. International Plc CHF 690,315 Morgan Stanley & Co. International Plc GBP 228,998 Morgan Stanley & Co. International Plc USD 51,705
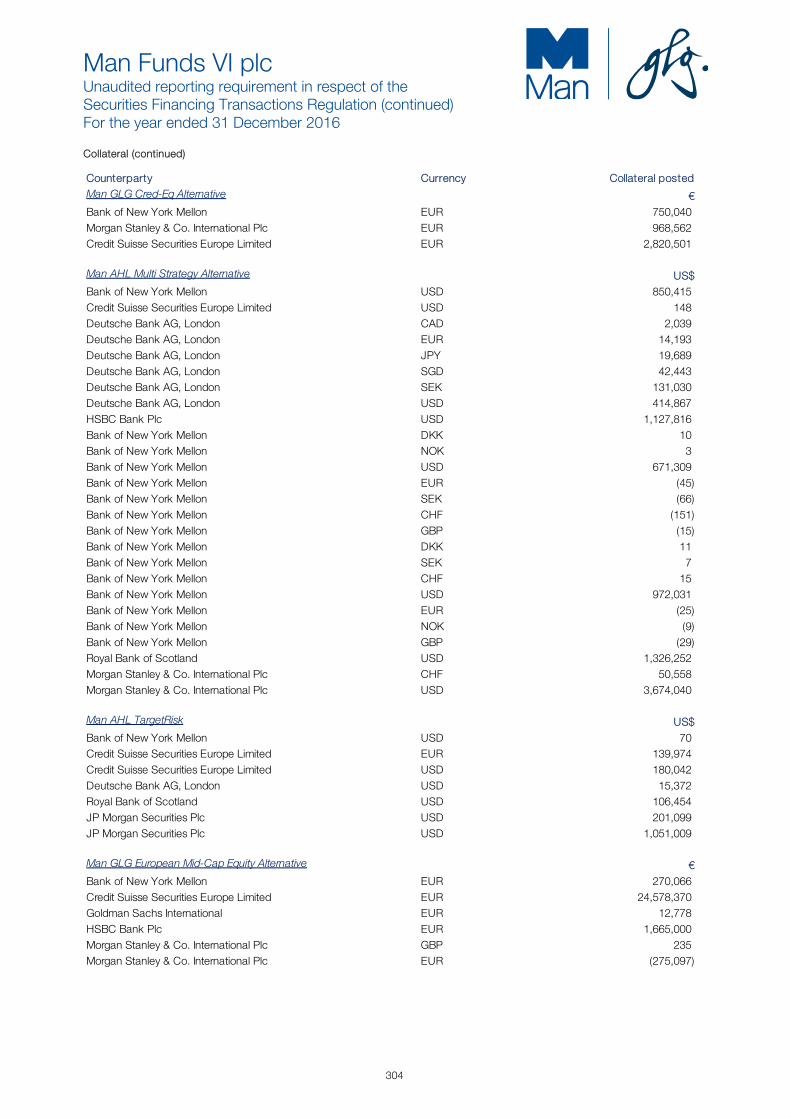
Man Funds VI plc Unaudited reporting requirement in respect of the Securities Financing Transactions Regulation (continued) For the year ended 31 December 2016
304
Collateral (continued)
Counterparty Currency Collateral posted Man GLG Cred-Eq Alternative €Bank of New York Mellon EUR 750,040 Morgan Stanley & Co. International Plc EUR 968,562 Credit Suisse Securities Europe Limited EUR 2,820,501
Man AHL Multi Strategy Alternative US$Bank of New York Mellon USD 850,415 Credit Suisse Securities Europe Limited USD 148 Deutsche Bank AG, London CAD 2,039 Deutsche Bank AG, London EUR 14,193 Deutsche Bank AG, London JPY 19,689 Deutsche Bank AG, London SGD 42,443 Deutsche Bank AG, London SEK 131,030 Deutsche Bank AG, London USD 414,867 HSBC Bank Plc USD 1,127,816 Bank of New York Mellon DKK 10 Bank of New York Mellon NOK 3 Bank of New York Mellon USD 671,309 Bank of New York Mellon EUR (45) Bank of New York Mellon SEK (66) Bank of New York Mellon CHF (151) Bank of New York Mellon GBP (15) Bank of New York Mellon DKK 11 Bank of New York Mellon SEK 7 Bank of New York Mellon CHF 15 Bank of New York Mellon USD 972,031 Bank of New York Mellon EUR (25) Bank of New York Mellon NOK (9) Bank of New York Mellon GBP (29) Royal Bank of Scotland USD 1,326,252 Morgan Stanley & Co. International Plc CHF 50,558 Morgan Stanley & Co. International Plc USD 3,674,040
Man AHL TargetRisk US$Bank of New York Mellon USD 70 Credit Suisse Securities Europe Limited EUR 139,974 Credit Suisse Securities Europe Limited USD 180,042 Deutsche Bank AG, London USD 15,372 Royal Bank of Scotland USD 106,454 JP Morgan Securities Plc USD 201,099 JP Morgan Securities Plc USD 1,051,009
Man GLG European Mid-Cap Equity Alternative €Bank of New York Mellon EUR 270,066 Credit Suisse Securities Europe Limited EUR 24,578,370 Goldman Sachs International EUR 12,778 HSBC Bank Plc EUR 1,665,000 Morgan Stanley & Co. International Plc GBP 235 Morgan Stanley & Co. International Plc EUR (275,097)

Man Funds VI plc Unaudited reporting requirement in respect of the Securities Financing Transactions Regulation (continued) For the year ended 31 December 2016
305
Collateral (continued)
Counterparty Currency Collateral posted Man Numeric Market Neutral Alternative US$Bank of New York Mellon USD 1,300,000 Morgan Stanley & Co. International Plc USD 2,750,894
Man GLG Unconstrained Emerging Equity US$Bank of New York Mellon USD 192,213 Credit Suisse Securities Europe Limited USD 548 Morgan Stanley & Co. International Plc USD 11,187,396
* Cash collateral for the portfolio swaps are included in the main PB account cash balance which has been provided
All cash posted as collateral has an open maturity tenor as it is not subject to a contractual maturity date.