
Malware Detection by Analysing Encrypted Network Tra c ...
16
Malware Detection by Analysing Encrypted Network Traffic with Neural Networks Paul Prasse 1 , Luk´ aˇ s Machlica 2 , Tom´ aˇ s Pevn´ y 2 , Jiˇ r´ ı Havelka 2 , and Tobias Scheffer 1 1 University of Potsdam, Department of Computer Science, Potsdam, Germany {prasse, scheffer}@cs.uni-potsdam.de 2 Cisco R&D, Prague, Czech Republic {lumachli, tpevny, jhavelka}@cisco.com Abstract. We study the problem of detecting malware on client com- puters based on the analysis of HTTPS traffic. Here, malware has to be detected based on the host address, timestamps, and data volume infor- mation of the computer’s network traffic. We develop a scalable protocol that allows us to collect network flows of known malicious and benign ap- plications as training data and derive a malware-detection method based on a neural embedding of domain names and a long short-term memory network that processes network flows. We study the method’s ability to detect new malware in a large-scale empirical study. 1 Introduction Malware violates users’ privacy, harvests passwords, can encrypt users’ files for ransom, is used to commit click-fraud, and to promote political agendas by popularizing specific content in social media [1]. Several different types of analysis are being used to detect malware. The analysis of an organization’s network traffic complements decentralized antivirus software that runs on client computers. It allows organizations to en- force a security policy consistently throughout an entire network and to minimize the management overhead. This approach makes it possible to encapsulate mal- ware detection into network devices or cloud services. Network-traffic analysis can help to detect polymorphic malware [2] as well as new and as-yet unknown malware based on network-traffic patterns [3, 4]. When the URL string of HTTP requests is not encrypted, one can extract a wide range of features from it on which the detection of malicious traffic can be based [5]. However, the analysis of the HTTP payload can easily be prevented by using the encrypted HTTPS protocol. Google, Facebook, LinkedIn, and many other popular sites encrypt their network traffic by default. In June 2016, an estimated 45% (and growing) fraction of all browser page loads use HTTPS [6]. In order to continue to have an impact, traffic analysis has to work with HTTPS traffic. On the application layer, HTTPS uses the HTTP protocol, but all messages are encrypted via the Transport Layer Security (TLS) protocol or its predecessor,
Transcript of Malware Detection by Analysing Encrypted Network Tra c ...
Malware Detection by Analysing EncryptedNetwork Traffic with Neural Networks
Paul Prasse1, Lukas Machlica2, Tomas Pevny2,Jirı Havelka2, and Tobias Scheffer1
1 University of Potsdam, Department of Computer Science, Potsdam, Germany{prasse, scheffer}@cs.uni-potsdam.de
2 Cisco R&D, Prague, Czech Republic{lumachli, tpevny, jhavelka}@cisco.com
Abstract. We study the problem of detecting malware on client com-puters based on the analysis of HTTPS traffic. Here, malware has to bedetected based on the host address, timestamps, and data volume infor-mation of the computer’s network traffic. We develop a scalable protocolthat allows us to collect network flows of known malicious and benign ap-plications as training data and derive a malware-detection method basedon a neural embedding of domain names and a long short-term memorynetwork that processes network flows. We study the method’s ability todetect new malware in a large-scale empirical study.
1 Introduction
Malware violates users’ privacy, harvests passwords, can encrypt users’ files forransom, is used to commit click-fraud, and to promote political agendas bypopularizing specific content in social media [1]. Several different types of analysisare being used to detect malware.
The analysis of an organization’s network traffic complements decentralizedantivirus software that runs on client computers. It allows organizations to en-force a security policy consistently throughout an entire network and to minimizethe management overhead. This approach makes it possible to encapsulate mal-ware detection into network devices or cloud services. Network-traffic analysiscan help to detect polymorphic malware [2] as well as new and as-yet unknownmalware based on network-traffic patterns [3, 4].
When the URL string of HTTP requests is not encrypted, one can extract awide range of features from it on which the detection of malicious traffic can bebased [5]. However, the analysis of the HTTP payload can easily be prevented byusing the encrypted HTTPS protocol. Google, Facebook, LinkedIn, and manyother popular sites encrypt their network traffic by default. In June 2016, anestimated 45% (and growing) fraction of all browser page loads use HTTPS [6].In order to continue to have an impact, traffic analysis has to work with HTTPStraffic.
On the application layer, HTTPS uses the HTTP protocol, but all messagesare encrypted via the Transport Layer Security (TLS) protocol or its predecessor,

the Secure Sockets Layer (SSL) protocol. An observer can see the client and hostIP addresses and ports, and the timestamps and data volume of packets. Networkdevices aggregate TCP/IP packets exchanged between a pair of IP addresses andports into a network flow for which address, timing, and data-volume informationare saved to a log file. Most of the time, an observer can also see the unencryptedhost domain name; we will discuss the underlying mechanisms in Section 3. TheHTTP payload, including the HTTP header fields and the URL, are encrypted.Therefore, malware detection has to be based on properties of the host-domainnames that a client contacts, and on statistical patterns in the timing and data-volumes of the sequence of network flows from and to that client. We will pursuethis goal in this paper.
In order to extract features from the domain name, we explore a low-dimensional neural embedding [7] of the domain-name string. As a baseline,we will study manually-engineered domain features [5]. In order to model statis-tical patterns in the sequence of network flows, we will employ long short-termmemory (LSTM) networks [8]. LSTMs are a neural model for sequential datathat account for long-term dependencies in information sequences. As referencemethod, we will explore random forests.
The effectiveness of any machine-learning approach crucially depends on theavailability of large amounts of labeled training data. However, obtaining ground-truth class labels for HTTPS traffic is a difficult problem—when the HTTPpayload is encrypted, one generally cannot determine whether it originates frommalware by analyzing the network traffic in isolation. We will make use of a VPNclient that is able to observe the executable files that use the network interfaceto send TCP/IP packets. We deploy this VPN client to a large number of clientcomputers. This allows us to observe the associations between executable filesand network flows on a large number of client computers. We use antivirus toolsto determine, in retrospect, which network flows in our training and evaluationdata originate from malware.
This paper is organized as follows. Section 2 discusses related work. Sec-tion 3 describes our application environment and our data collection. Section4 describes the problem setting and Section 5 describes our method. Section 6presents experiments; Section 7 concludes.
2 Related Work
Prior work on the analysis of HTTP logs [9] has addressed the problems of identi-fying command-and-control servers [10], unsupervised detection of malware [11],and supervised detection of malware using domain blacklists as labels [12, 5].HTTP log files contain the full URL string, from which a wide array of informa-tive features can be extracted [5]. In addition, each HTTP log file entry corre-sponds to a single HTTP request which also makes the timing and data volumeinformation more informative than in the case of HTTPS, where the networkingequipment cannot identify the boundaries between requests that pass throughthe same TLS/SSL tunnel.
Prior work on HTTPS logs has aimed at identifying the application layer pro-tocol [13–15], identifying applications that are hosted by web servers [16], andidentifying servers that are contacted by malware [17]. Some methods processthe complete sequence of TCP packets which is not usually recorded by avail-able network devices. Lokoc et al. [17] use similar features to the ones that weuse—that can easily be recorded for HTTPS traffic—and a similar method forgenerating labeled data based on a multitude of antivirus tools. However, theyfocus on the problem of identifying servers that are contacted by malware.
Prior work on neural networks for network-flow analysis [18] has worked withlabels for client computers (infected and not infected)—which leads to a multi-instance learning problem. By contrast, our operating environment allows us toobserve the association between flows and executable files. Prasse et al. [19] haveexplored HTTPS analysis using random forests in a preliminary report. We havepresented some of the results of this paper to a computer-security audience in aprior workshop paper [20].
LSTM networks [8] are widely used for translation, speech recognition andother natural-language processing tasks. Their ability to process sequential inputand to account for long-term dependencies makes them appealing for the analysisof network flows. In computer security, their use has previously been exploredfor intrusion detection [21].
3 Operating Environment
This section describes our application and data-collection environment. In or-der to protect all computers of an organization, a Cloud Web Security (CWS)service provides an interface between the organization’s private network andthe internet. Client computers establish a VPN connection to the CWS service.The service enforces the organization’s security policy; it can block HTTP andHTTPS requests based on the host domain and on the organization’s acceptable-use policy. The CWS service can issue warnings when it has detected malwareon a client. Since administrators have to process the malware warnings, theproportion of false alarms among all issued warnings has to be small.
The CWS service aggregates all TCP/IP packets between a single client com-puter, client port, host IP address, and host port that result from a single HTTPrequest or from the TLS/SSL tunnel of an HTTPS request into a network flow.This information is available for network devices that support the IPFIX [22]and NetFlow [23] formats. For each network flow, a line is written into the log filethat includes data volume, timestamp, domain name, and duration information.For unencrypted HTTP traffic, this line also contains the full URL string. ForHTTPS traffic, it includes the domain name—if that name can be observed viaone of the following mechanisms.
Clients that use the Server Name Indication protocol extension (SNI) pub-lish the unencrypted host-domain name when they establish the connection. SNIis widely used because it is necessary to verify certificates of servers that hostmultiple domains, as most web servers do. When the network uses a transparent

DNS proxy [24], this server caches DNS request-response pairs and can map IPaddresses to previously resolved domain names. To further improve the avail-ability of host-domain names the CWS could—but does not currently—employpassive DNS replication [25] and build a look-up table of observed DNS request-response pairs. The resulting sequence of log-file lines serves as input to themalware-detection model.
3.1 Data Collection
Since the proportion of HTTP versus HTTPS traffic declines continuously, wewant to study malware detection in encrypted traffic. In our data collection, wetherefore discard the URLs of HTTP requests from the log files, which leaves usonly with information that would still be visible if all traffic were encrypted.
In order to obtain training and evaluation data, we have to label networktraffic by whether it originated from malicious or benign applications. The CWSservice can be configured to inspect HTTPS connections, provided that the ser-vice’s root certificate has been installed as a trusted certificate on all clientcomputers. This allows the CWS service to act as a man-in-the-middle betweenclient and host, where it can decrypt, inspect, and re-encrypt HTTPS requests.This inspection can only be carried out for a small proportion of clients; we relyon it to collect training data. However, the deployed malware-detection modelonly uses observable features of HTTPS traffic and therefore does not requirethis interception. The VPN client that runs on the client computer has access tothe process table and the network interface. The VPN client identifies applica-tions by means of a SHA hash code of their executable file, and can be configuredto communicate the association between HTTP/HTTPS traffic and applicationsto the CWS server. This allows us to augment all network flows of clients thatoperate with this configuration with a hash key of the application that has sentand received the network traffic. It also allows us to observe host-domain nameseven when SNI and transparent DNS proxy servers are not used. We configureall VPN clients of a number of participating organizations accordingly.
We label the traffic in retrospect, after the malware status of the files has beenestablished by signature-based antivirus tools. Virustotal.com is a web servicethat allows users to upload executable files or hash keys of executable files. Thefiles are run through 60 antivirus solutions, and the results of this analysis arereturned. We upload the hash keys of all executable files that have generatedHTTP/HTTPS traffic to Virustotal; we label files as benign when the hash isknown—that is, when the file has been run through the scanning tools—andnone of the 60 scanning tools recognize the file as malicious. When three ormore tools recognize the file as malicious, we label it as malicious. When onlyone or two virus scanners recognize the file as a virus, we consider the malwarestatus of the file uncertain; we do not use uncertain files for training and skipthem during evaluation. In order to limit its memory use, Virustotal removeshashes of benign files from its database after some time. Therefore, we label allfiles whose hashes are unknown to Virustotal as benign. We then label all traffic

that has been generated by malicious executables as malicious, and all traffic ofbenign files as benign.
We collect three different data sets; we will refer to them as current data,future data, and an independent set of training data for domain-name features,based on the roles which these data sets will play in our experiments. The currentdata contains the complete HTTP and HTTPS traffic of 171 small to largecomputer networks that use the Cisco AnyConnect Secure Mobility Solutionfor a period of 5 days in July 2016. This data set contains 44,348,879 flowsof 133,437 distinct clients. The future data contains the complete HTTP andHTTPS traffic of 169 small to large different computer networks that use theCisco AnyConnect Secure Mobility Solution for a period of 8 days in September2016. The data set contains 149,005,149 flows of 177,738 distinct clients. Thetraining data for domain-name features contains the HTTPS traffic of 21 smallto large computer networks, collected over 14 days between February and April2016. All data sets have been anonymized—information about organizationsand user names have been replaced by random keys—and full URLs of HTTPrequests have been removed.
3.2 Quantitative Analysis of the Data
We query the malware status of all observed hash keys in the current and futuredata sets from Virustotal after the collection of the respective data set has beencompleted, and reiterate the queries to Virustotal in February 2017. We studythe stability of this labeling procedure. Table 1 shows that over this period offive months for the future data and seven months for the current data, 10% of allpreviously uncertain files (classified as malware by one or two antivirus tools)change their status to benign, while 3.5% change their status to malicious. Fromall initially unknown files, 2.3% become known as benign while 0.2% becomeknown as malicious. From the files initially labeled as benign, 1.5% becomeuncertain and only 0.07% become known as malicious. Likewise, only 0.16%of all initially malicious files change their label to benign. We use the labelsobtained in February 2017 in the following. We can conclude that once a filehas been labeled as benign or malicious by at least 3 antivirus tools, it is veryunlikely that this classification will later be reversed.
The current data contains 20,130 unique hashes, 350,220 malicious and43,150,605 benign flows; the future data 27,263 unique hashes, 955,037 mali-cious and 142,592,850 benign flows. Table 2 enumerates the types and frequencyof different types of malware families, according to the public classification ofantivirus vendors. A large proportion of malware files is classified as potentiallyunwanted applications (PUAs). PUAs are usually bundled to freeware or share-ware applications; depending on how a distributor chooses to employ these pro-grams, they can change the browser settings and starting page, install tools barsand browser extensions, display advertisements, and can also reveal passwordsto the attacker. They typically cannot be uninstalled without a virus removaltool or detailed technical background knowledge.
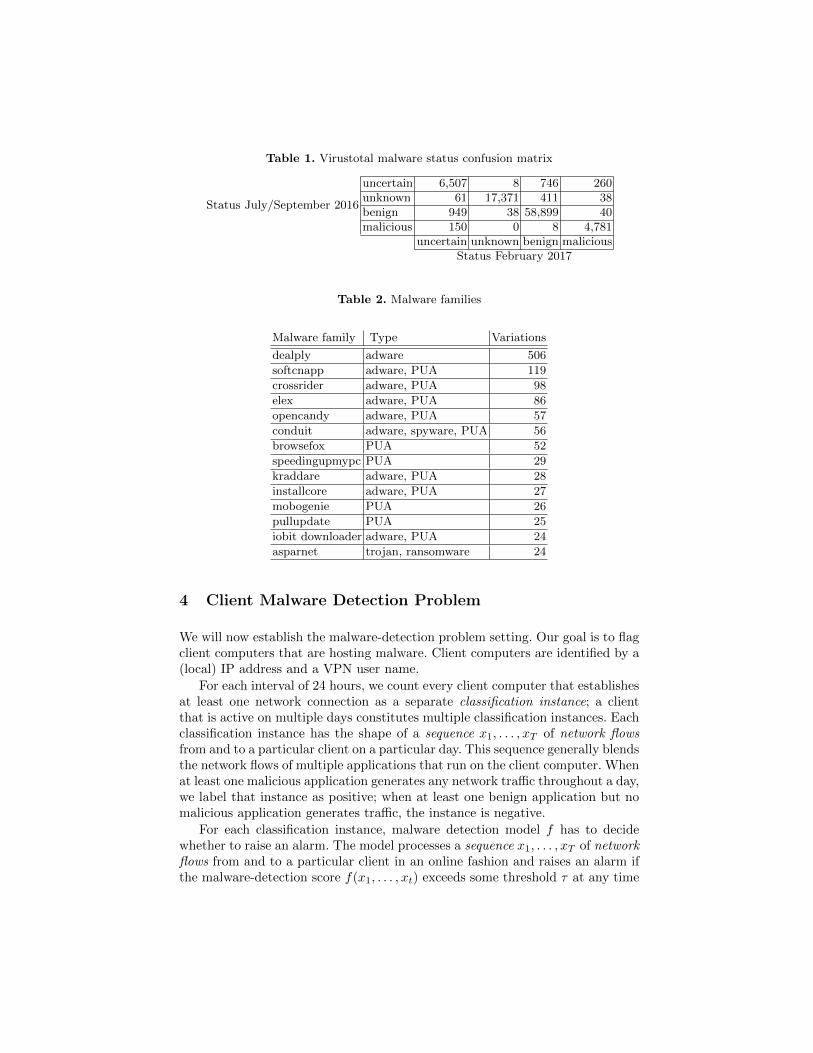
Table 1. Virustotal malware status confusion matrix
Status July/September 2016
uncertain 6,507 8 746 260unknown 61 17,371 411 38benign 949 38 58,899 40malicious 150 0 8 4,781
uncertain unknown benign maliciousStatus February 2017
Table 2. Malware families
Malware family Type Variations
dealply adware 506
softcnapp adware, PUA 119
crossrider adware, PUA 98
elex adware, PUA 86
opencandy adware, PUA 57
conduit adware, spyware, PUA 56
browsefox PUA 52
speedingupmypc PUA 29
kraddare adware, PUA 28
installcore adware, PUA 27
mobogenie PUA 26
pullupdate PUA 25
iobit downloader adware, PUA 24
asparnet trojan, ransomware 24
4 Client Malware Detection Problem
We will now establish the malware-detection problem setting. Our goal is to flagclient computers that are hosting malware. Client computers are identified by a(local) IP address and a VPN user name.
For each interval of 24 hours, we count every client computer that establishesat least one network connection as a separate classification instance; a clientthat is active on multiple days constitutes multiple classification instances. Eachclassification instance has the shape of a sequence x1, . . . , xT of network flowsfrom and to a particular client on a particular day. This sequence generally blendsthe network flows of multiple applications that run on the client computer. Whenat least one malicious application generates any network traffic throughout a day,we label that instance as positive; when at least one benign application but nomalicious application generates traffic, the instance is negative.
For each classification instance, malware detection model f has to decidewhether to raise an alarm. The model processes a sequence x1, . . . , xT of networkflows from and to a particular client in an online fashion and raises an alarm ifthe malware-detection score f(x1, . . . , xt) exceeds some threshold τ at any time
t during the day; in this case, the instance counts as a (true or false) positive.In each 24-hour interval, model f with threshold τ will detect some proportionof malware-infected clients, and may raise some false alarms. The trade-off be-tween the number of detections and false alarms can be controlled by adjustingthreshold τ . Increasing the threshold decreases the number of detections as wellas the number of false alarms.
We will measure precision-recall curves because they are most directly linkedto the merit of a malware detection method from an application point of view.However, since precision recall curves are not invariant in the class ratio, we willadditionally use ROC curves to compare the performance of classifiers on datasets with varying class ratios.
We will measure the following performance indicators.
1. Recall R = nTP
nTP+nFNis the proportion of malicious instances that have been
detected, relative to all (detected and undetected) malicious instances.2. Precision P = nTP
nTP+nFPis the proportion of malicious instances that have
been detected, relative to all (malicious and benign) instances that have beenflagged. Note that the absolute number of false alarms equals (1− P ) timesthe absolute number of alarms; a high precision implies that the number offalse alarms is small and the detection method is practical.
3. The recall at a specific precision, R@x%P , quantifies the proportion of ma-licious instances that are detected when the threshold is adjusted such thatat most 1− x% of all alarms are false alarms.
4. The precision-recall curve of decision function f shows the possible trade-offsthat can be achieved by varying decision threshold τ . The precision recallcurve of a fixed decision function will deteriorate if the class ratio shiftsfurther toward the negative class.
5. The false-positive rate RFP = nFP
nFP+nTNis the proportion of benign software
that is classified as malicious. Note that the absolute number of alarms equalsRFP times the number of benign instances. Since the number of benigninstances is typically huge, a seemingly small false-positive rate does notnecessarily imply that a detection method is practical.
6. The ROC curve displays the possible tradeoffs between false-positive rate andrecall that can be achieved by varying decision threshold τ . It is invariant inthe class ratio but it conveys no information about the proportion of alarmsthat are in fact false alarms. To visualize the decision function behavior forsmall false-positive rates, we use a logarithmic x-axis.
7. The time to detection measures the interval from the first network flow sentby a malicious application on a given day to its detection.
Note the difference between precision and the false-positive rate—the risk thata benign file is mistakenly classified as malware. For instance, at a false-positiverate of 10%, the expected number of false alarms equals 10% of the number ofbenign instances; hence, false alarms would by far outnumber actual malwaredetections. By contrast, at a precision of 90%, only 10% of all alarms would befalse alarms.
aaa
...
exa
...
zzz
...
...
com
...
zzz
...
...
...
aaa
e x a m p l e . c o m
0 1 0 0 1 0
averaging layer
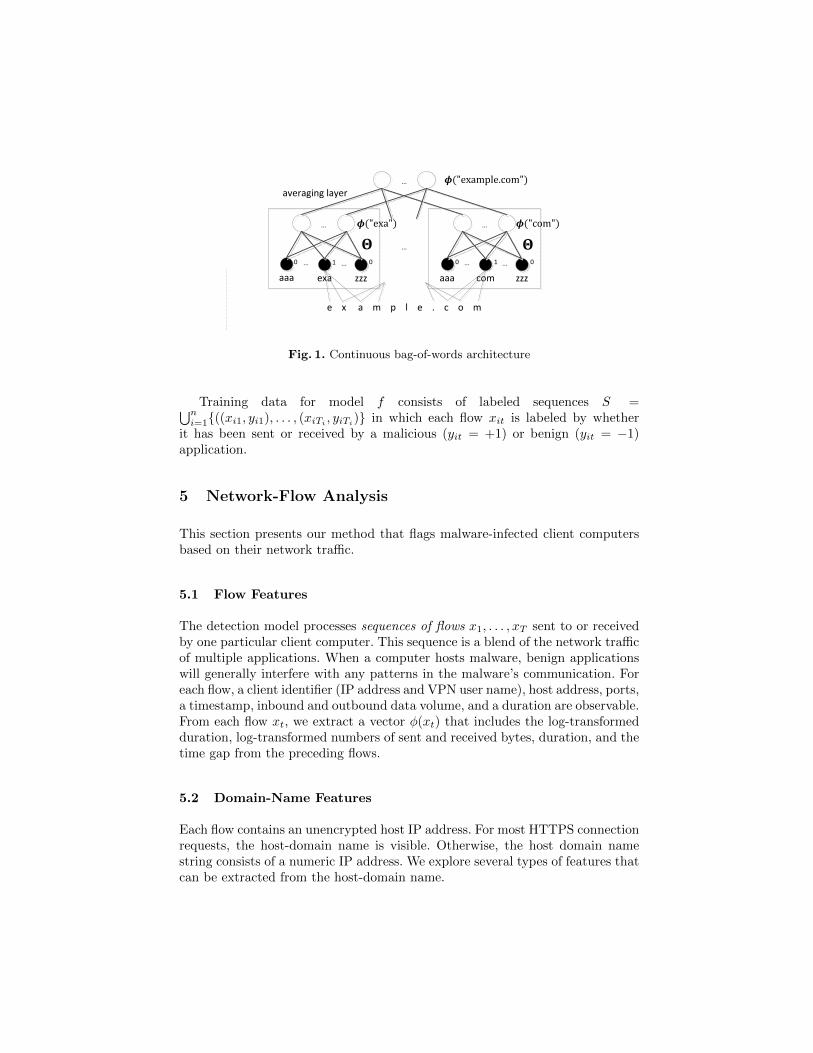
Fig. 1. Continuous bag-of-words architecture
Training data for model f consists of labeled sequences S =⋃ni=1{((xi1, yi1), . . . , (xiTi
, yiTi)} in which each flow xit is labeled by whether
it has been sent or received by a malicious (yit = +1) or benign (yit = −1)application.
5 Network-Flow Analysis
This section presents our method that flags malware-infected client computersbased on their network traffic.
5.1 Flow Features
The detection model processes sequences of flows x1, . . . , xT sent to or receivedby one particular client computer. This sequence is a blend of the network trafficof multiple applications. When a computer hosts malware, benign applicationswill generally interfere with any patterns in the malware’s communication. Foreach flow, a client identifier (IP address and VPN user name), host address, ports,a timestamp, inbound and outbound data volume, and a duration are observable.From each flow xt, we extract a vector φ(xt) that includes the log-transformedduration, log-transformed numbers of sent and received bytes, duration, and thetime gap from the preceding flows.
5.2 Domain-Name Features
Each flow contains an unencrypted host IP address. For most HTTPS connectionrequests, the host-domain name is visible. Otherwise, the host domain namestring consists of a numeric IP address. We explore several types of features thatcan be extracted from the host-domain name.

Engineered features Franc et al. [12] develop a comprehensive set of 60 fea-tures of URL strings for malware detection in unencrypted HTTP traffic—here,the entire URL is visible to third parties. Their features include the ratio ofvowel changes, the maximum occurrence ratio of individual characters for thedomain and subdomain, the maximum length of substrings without vowels, thepresence of non-base-64 characters, the ratio of non-letter characters, and manyother characteristics. We extract the vector of these engineered domain-namefeatures for all domains.
Character n-gram features Character n-gram features decompose the do-main string into sets of overlapping substrings; for instance, “example.com” iscomposed of the 3-grams “exa”, “xam”, “amp”, . . . , “.co”, and “com”. Thenumber of n-grams that occur in URLs grows almost exponentially in n; in ourdata, there are 1,583 character 2-grams, 54,436 character 3-grams, and 1,243,285character 4-grams. If we added all character 3-gram features to the feature repre-sentation φ(xt) of a flow, then the total number of features of an entire sequenceof T flows would impose a heavy computational burden, and cause overfitting ofthe malware-detection model. In our experiments, we therefore explore character2-gram features.
Neural domain-name features We condense the character n-grams by meansof a neural embedding. Neural language models [7] derive low-dimensional,continuous-state representations of words which have the property that wordswhich tend to appear in similar contexts have similar representations. Here,“words” are the overlapping character n-grams that constitute a domain name.We apply neural embeddings with the goal of finding a representation such thatsubstrings that tend to co-occur in URL strings have a similar representation.
We use the continuous bag-of-words architecture illustrated in Figure 1. Theinput to the network consists of character n-grams that are one-hot coded as abinary vector in which each dimension represents an n-gram; Figure 1 illustratesthe case of n = 3. The input layer is fully connected to a hidden layer; we findthat 100 hidden units give the best experimental results. The same weight matrixis applied to all input character n-grams. The activation of the hidden units isthe vector-space representation of the input n-gram of characters. In order toinfer the vector-space representation of an entire domain-name, an “averaginglayer” averages the hidden-unit activations of all its character n-grams.
Neural language models are trained to complete an initial part of a sentence,which forces the network to find a vector-space representation that allows to“guess” a word’s context from its vector-space representation. The “natural”reading order of a domain string is from the right to the left, because the domainends with the most general part and starts with the most specific subdomain.Therefore, we use the preceding character n-gram, one-hot coded, as trainingtarget.
We train the neural language model using all domain names in our trainingdata for domain-name features, and the 500,000 domains that have the highest

web traffic according to alexa.com. For each URL and each position of the slidingwindow, we perform a back-propagation update step using the character n-gramthat immediately precedes the input window as prediction target. We use theword2vec software package [26].
5.3 Client Classifier
We develop a client classifier based on long-short term memory networks(LSTMs) and, as reference method, a classifier based on random forests. LSTMsprocess input sequences iteratively. Each LSTM unit has a memory cell whichallows it to store results of inferences; the unit may refer to this memory cell inlater time steps. This allows LSTMs to account for long-term dependencies insequential input.
Both classifiers split each client’s traffic into sequences of 10 flows—for theLSTM, a fixed upper-bound on the sequence length is not necessary in theory,but it allows for more efficient training. In preliminary experiments, we haveobserved the performance of both LSTMs and random forests to deterioratewith longer sequences. After 10 flows x1, . . . , x10 have been observed for a client,the sequence is processed by the neural network. The feature representation ofeach flow (duration, bytes sent and received, and the neural host domain-namerepresentation) is processed sequentially by a layer of 32 LSTM units. Afterprocessing the input sequence, the LSTM layer passes its output to a layer of128 cells with ReLU activation function, which is connected to two softmax cellswhose activation represents the decision-function scores of the classes maliciousand benign. The softmax layer is trained with 50% dropout regularization.
During training, the target label for a sequence of 10 flows is positive if atleast one of the 10 flows originates from a malicious application. At applicationtime, the overall decision-function value f(x1, . . . , xT ) for the client’s full trafficover a 24-hour interval that is compared against threshold τ is the maximumactivation of the positive output cell over all adjacent sequences of 10 flows.
For the random-forest classifier, the feature representation of 10 flows isstacked into a feature vector Φ(x1, . . . , x10) = [φ(x1) . . . φ(x10)]> which servesas input to the random-forest classifier. At training time, the target label ofa sequence is positive if at least one flow originates from a malicious applica-tion, and at application time the decision-function value of the random forest ismaximized over all 10-flow sequences.
6 Experiments
We will first study the capability of the neural domain-name features to dis-criminate between benign and malicious domains. We will then explore the con-tribution of different types of features to malware detection, and the relativeperformance of LSTMs versus random forests. We will study the classifiers’ abil-ity to detect malware in current and future data, and will investigate how thisperformance varies across known and unknown malware families.

Table 3. Domain classification and feature types
Feature type R@70%P R@80%P R@90%P
neural 0.84 0.79 0.73
char 2-grams 0.83 0.76 0.62
engineered 0.68 0.36 0.0
neural+engineered 0.75 0.64 0.24
6.1 Classification of Host Domains
In our first experiment, we investigate the types of domain-name features withrespect to their ability to distinguish between domains that are contacted bybenign and domains that are contacted by malicious applications. In this ex-periment, domains serve as classification instances; all domains that are con-tacted more often by malicious than by benign software are positive instances,and all other domains are negative instances. In our training data for domainfeatures, there are 860,268 negative (benign) and 1,927 positive (malicious)domains. A total of 3,490 domains are contacted by both malware and be-nign applications; many of them are likely used for malicious purposes (e.g.,“https://r8—sn-4g57km7e.googlevideo.com/”, “https://s.xp1.ru4.com”), whileothers are standard services (“maps.google.com”, “public-api.wordpress.com”).Malware frequently sends requests to legitimate services and uses URL forward-ing techniques to reach the actual recipient domain. For 90,445 of the domains,only the IP address string is available.
We infer engineered domain-name features, character 2-grams, and thevector-space representation of each domain string using the neural languagemodel, as described in Section 5.2. We use 75% of the domains for training and25% of the domains for testing; no domain is in both the training and the testdata. We train a random forest classifier to discriminate positive from negativeinstances. Table 3 shows precision-recall trade-offs for the different set of fea-ture types. We find that a parameter combination of n = 6 (input character6-grams), m = 4 (during training, the vector-space representation of 4 adjacentcharacter 6-grams is averaged) and k = 100 (the vector-space representation ofa domain name has 100 dimensions) works best. Comparing the neural domainfeatures to the raw character 2-gram and the 60 engineered features in Table 3,we find that the neural features outperform both baselines. A combination ofneural and engineered features performs worse than the neural features alone,which indicates that the engineered features inflate the feature space while notadding a substantial amount of additional information.
In order to analyze the domain-name classifier in depth, we look at domain-names that achieve the highest and lowest score from the random-forest classifierthat uses the neural domain features. We find that a wide range of domains re-ceive a decision-function value of 0 (confidently benign). These lowest-scoringdomains include small and mid-size enterprises, blogs on various topics, univer-sity department homepages, games websites, a number of Google subdomains,

0.0 0.2 0.4 0.6 0.8 1.0Recall
0.0
0.2
0.4
0.6
0.8
1.0
Pre
cisi
on
LSTM [n+f]
RF [n+f]
LSTM [f]
RF [f]
LSTM [n]
RF [n]
Fig. 2. Precision-recall curve for malware detection on current data. Error bars indicatestandard errors.
governmental agencies; sites that can perhaps best be described as “randomweb sites”. Table 4 shows the highest-scoring domains. They include numericIP addresses, cloud services, subdomains of the YouTube and Facebook contentdelivery networks, and domains that do not host visible content and have mostlikely been registered for malicious purposes. Based on these findings, we con-tinue to study the neural domain-name features and exclude the engineered andcharacter 2-gram features from the following experiments.
Table 4. Domain-names most confidently classified as malicious
https://52.84.0.111/https://139.150.3.78/https://uswj208.appspot.com/https://ci-e2f452ea1b-50fe9b43.http.atlas.cdn.yimg.com/https://pub47.bravenet.comhttps://service6.vb-xl.net/https://sp-autoupdate.conduit-services.comhttps://external-yyz1-1.xx.fbcdn.net/https://doc-14-28-apps-viewer.googleusercontent.com/https://239-trouter-weu-c.drip.trouter.io
6.2 Client Malware Detection
Learning methods and feature types. We will first report on experimentsin which we conduct 10-fold cross validation on the current data; we split thedata into partitions with disjoint sets of users. We tune the parameters of therandom forest using a grid search in an inner loop of two-fold cross validationon the training part of the data. The number of LSTM units is optimized in the

0.0 0.2 0.4 0.6 0.8 1.0
Recall
0.0
0.2
0.4
0.6
0.8
1.0
Pre
cisi
on
LSTM current data
LSTM future data
(a) Precision-recall curves.
10-6 10-5 10-4 10-3 10-2 10-1 100
False Positive Rate
0.0
0.2
0.4
0.6
0.8
1.0
Tru
e P
osi
tive R
ate
(b) ROC curves (log-scale for FP).
Fig. 3. Comparison between performance on current and on future data.
first fold of the 10-fold cross validation on the training part of the data and fixedfor the remaining folds.
Figure 2 compares the precision-recall curves of LSTMs and random forestsusing neural domain-name, flow, and combined features. We conclude thatLSTMs outperform random forests for this problem, and that the combination ofneural domain-name features and numeric flow features outperforms either set offeatures. We therefore exclude random forests from the remaining experiments.
Evolution of malware. We will now explore whether a model that has beentrained on the current data is able to detect malware in the future data. We trainthe LSTM on the entire current data and evaluate it on the entire future data.The number of LSTM units is left fixed. We compare the resulting model to theLSTM trained by 10-fold cross validation on the current data. Figure 3 comparesprecision-recall and ROC curves. Since the future data contains a smaller ratioof malicious instances—the prevalence of malware changes over time and overcompanies—the difference between the precision-recall curves is not necessarilydue to a deterioration of the decision function. But a comparison of the ROCcurves shows that the decision function does deteriorate to a small extent in thetwo months that separate the training and test data.
Malware families. We will now study the detection performance on specificmalware families, on previously unseen malware, and on malware that does notcontact any previously known domain. We use an LSTM that has been trainedon all current data. We evaluate its performance on specific subsets of malwarein the future data. In each experiment, each user who is hosting a maliciousapplication from a selected malware family that has sent at least one networkflow within a 24-hours interval counts as a positive test instance, and each userwho has run at least one benign application with at least one network flow but nomalicious application within a 24-hours interval counts as negative classificationinstance. Test users who are hosting malware of different families are skipped.
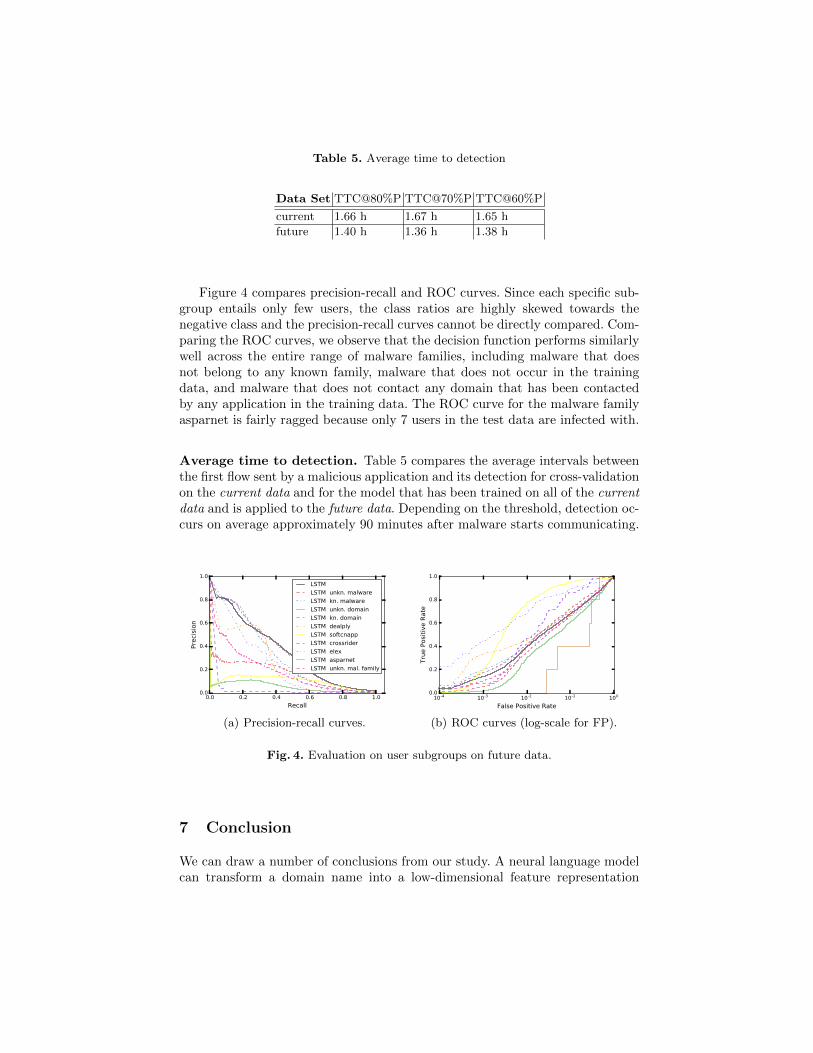
Table 5. Average time to detection
Data Set TTC@80%P TTC@70%P TTC@60%P
current 1.66 h 1.67 h 1.65 h
future 1.40 h 1.36 h 1.38 h
Figure 4 compares precision-recall and ROC curves. Since each specific sub-group entails only few users, the class ratios are highly skewed towards thenegative class and the precision-recall curves cannot be directly compared. Com-paring the ROC curves, we observe that the decision function performs similarlywell across the entire range of malware families, including malware that doesnot belong to any known family, malware that does not occur in the trainingdata, and malware that does not contact any domain that has been contactedby any application in the training data. The ROC curve for the malware familyasparnet is fairly ragged because only 7 users in the test data are infected with.
Average time to detection. Table 5 compares the average intervals betweenthe first flow sent by a malicious application and its detection for cross-validationon the current data and for the model that has been trained on all of the currentdata and is applied to the future data. Depending on the threshold, detection oc-curs on average approximately 90 minutes after malware starts communicating.
0.0 0.2 0.4 0.6 0.8 1.0
Recall
0.0
0.2
0.4
0.6
0.8
1.0
Pre
cisi
on
LSTM
LSTM unkn. malware
LSTM kn. malware
LSTM unkn. domain
LSTM kn. domain
LSTM dealply
LSTM softcnapp
LSTM crossrider
LSTM elex
LSTM asparnet
LSTM unkn. mal. family
(a) Precision-recall curves.
10-4 10-3 10-2 10-1 100
False Positive Rate
0.0
0.2
0.4
0.6
0.8
1.0
Tru
e P
osi
tive R
ate
(b) ROC curves (log-scale for FP).
Fig. 4. Evaluation on user subgroups on future data.
7 Conclusion
We can draw a number of conclusions from our study. A neural language modelcan transform a domain name into a low-dimensional feature representation

that provides more information about whether the site is malicious than a set ofcarefully engineered features of domain-name characteristics. Our experimentalsetting allows us to collect large volumes of malicious and benign network trafficfor model training and evaluation. The VPN client records the hash key of theexecutable file that has generated each flow, and by using VirusTotal we are ableto determine, in retrospect, which flows originate from malware.
We have developed and studied a malware-detection model based on LSTMsthat uses only observable aspects of HTTPS traffic. We conclude that the LSTM-based model outperforms random forests, and that the combination of neuraldomain-name features and numeric flow features outperforms either of these fea-ture sets. This mechanism is able to identify a substantial proportion of malwarein traffic that was recorded two months after the training data were recorded,including previously unseen malware. Its average time to detection is approx-imately 90 minutes after the first HTTPS request; its performance is uniformover many different malware families, including previously unknown malware. Itcomplements signature-based and other behavior-based malware detection.
Acknowledgment.
We would like to thank Virustotal.com for their kind support.
References
1. Kogan, R.: Bedep trojan malware spread by the angler exploit kit gets politi-cal. Spider Labs Blog (2015) https://www.trustwave.com/Resources/SpiderLabs-Blog/Bedep-trojan-malware-spread-by-the-Angler-exploit-kit-gets-political/.
2. Karim, M.E., Walenstein, A., Lakhotia, A., Parida, L.: Malware phylogeny gener-ation using permutations of code. Journal in Computer Virology 1 (2005) 13–23
3. Gu, G., Zhang, J., Lee, W.: Botsniffer: Detecting botnet command and controlchannels in network traffic. In: Proceedings of the Annual Network and DistributedSystem Security Symposium. (2008)
4. Perdisci, R., Lee, W., Feamster, N.: Behavioral clustering of HTTP-based malwareand signature generation using malicious network traces. In: Proceedings of theUSENIX Conference on Networked Systems Design and Implementation. (2010)
5. Bartos, K., Sofka, M.: Robust representation for domain adaptation in networksecurity. In: Proceedings of the European conference on Machine Learning andKnowledge Discovery in Databases. (2015)
6. Aas, J.: Progress towards 100% HTTPS. Let’s Encrypt (2016)7. Bengio, Y., Ducharme, R., Vincent, P., Jauvin, C.: A neural probabilistic language
model. Journal of Machine Learning Research 3 (2003) 1137–11558. Hochreiter, S., Schmidhuber, J.: Long short-term memory. Neural Computation 9
(1997) 1735–17809. Nguyen, T., Armitage, G.: A survey of techniques for internet traffic classification
using machine learning. IEEE Communications Surveys, Tutorials 10 (2008) 56–7610. Nelms, T., Perdisci, R., Ahamad, M.: Execscent: Mining for new c&c domains
in live networks with adaptive control protocol templates. In: Proceedings of theUSENIX Security Symposium. (2013)
11. Kohout, J., Pevny, T.: Unsupervised detection of malware in persistent web traffic.In: Proceedings of the IEEE International Conference on Acoustics, Speech andSignal Processing. (2015)
12. Franc, V., Sofka, M., Bartos, K.: Learning detector of malicious network trafficfrom weak labels. In: Machine Learning and Knowledge Discovery in Databases.Springer (2015) 85–99
13. Wright, C.V., Monrose, F., Masson, G.M.: On inferring application protocol be-haviors in encrypted network traffic. Journal of Machine Learning Research 7(2006) 2745–2769
14. Crotti, M., Dusi, M., Gringoli, F., Salgarelli, L.: Traffic classification through simplestatistical fingerprinting. ACM SIGCOMM Computer Communication Review 37(2007) 5–16
15. Dusi, M., Crotti, M., Gringoli, F., Salgarelli, L.: Tunnel hunter: Detectingapplication-layer tunnels with statistical fingerprinting. Computer Networks 53(2009) 81–97
16. Kohout, J., Pevny, T.: Automatic discovery of web servers hosting similar applica-tions. In: Proceedings of the IFIP/IEEE International Symposium on IntegratedNetwork Management. (2015)
17. Lokoc, J., Kohout, J., Cech, P., Skopal, T., Pevny, T.: k-NN classification ofmalware in HTTPS traffic using the metric space approach. In: Intelligence andSecurity Informatics. Springer (2016)
18. Pevny, T., Somol, P.: Discriminative models for multi-instance problems with treestructure. In: Proceedings of the International Workshop on Artificial Intelligencefor Computer Security. (2016)
19. Prasse, P., Gruben, G., Machlika, L., Pevny, T., Sofka, M., Scheffer, T.: Malwaredetection by HTTPS traffic analysis. Technical report. urn: urn:nbn:de:kobv:517-opus4-100942 (2017)
20. Prasse, P., Machlica, L., Pevny, T., Havelka, J., Scheffer, T.: Malware detection byanalysing network traffic with neural networks. In: Proceedings of the Workshopon Traffic Measurements for Cybersecurity at the IEEE Symposium on Securityand Privacy. (2017)
21. Staudemeyer, R., Omlin, C.: Evaluating performance of long short-term memoryrecurrent neural networks on intrusion detection data. In: Proceedings of theSouth African Institute for Computer Scientists and Information TechnologistsConference. (2013)
22. Claise, B., Trammell, B., Aitken, P.: Specification of the IP flow infor-mation export (IPFIX) protocol for the exchange of flow information (2013)https://tools.ietf.org/html/rfc7011.
23. Cisco Systems: Cisco IOS netflow, http://www.cisco.com/c/en/us/products/ios-nx-os-software/ios-netflow/index.html (2016)
24. Blum, S.B., Lueker, J.: Transparent proxy server (2001) US Patent 6,182,141.25. Weimer, F.: Passive DNS replication. In: Proceedings of the FIRST Conference
on Computer Security Incidents. (2005) 9826. Mikolov, T., Sutskever, I., Chen, K., Corrado, G., Dean, J.: Distributed represen-
tations of words and phrases and their compositionality. In: Advances in NeuralInformation Processing Systems. (2013)


![ASEC REPORT - AhnLabjp.ahnlab.com/global/upload/download/asecreport/ASEC...ASEC REPORT 50 | MALWARE TREND 7the files of various format types in [Figure 1-8] are encrypted, and the](https://static.fdocuments.us/doc/165x107/5f0a73d77e708231d42bb472/asec-report-asec-report-50-malware-trend-7the-files-of-various-format-types.jpg)