MALAYSIA - ASIA CONSTasiaconst.com/past_conference/conference/20th/Malaysia.pdf · Export and...
75
20 th AsiaConstruct Conference Hong Kong 13 & 14 November 2014 Country Report MALAYSIA Jointly prepared by Sariah Abd. Karib Noridah Shaffii Che Saliza Che Soh Nur Ima Zainol Abidin Business Division, Corporate and Business Sector Construction Industry Development Board (CIDB) Malaysia Level 34, Menara Dato’ Onn Putra World Trade Centre (PWTC) No. 45, Jalan Tun Ismail 50480 Kuala Lumpur Malaysia [email protected] September 2014
Transcript of MALAYSIA - ASIA CONSTasiaconst.com/past_conference/conference/20th/Malaysia.pdf · Export and...

20th AsiaConstruct Conference
Hong Kong 13 & 14 November 2014
Country Report
MALAYSIA
Jointly prepared by
Sariah Abd. Karib Noridah Shaffii
Che Saliza Che Soh Nur Ima Zainol Abidin
Business Division, Corporate and Business Sector
Construction Industry Development Board (CIDB) Malaysia Level 34, Menara Dato’ Onn
Putra World Trade Centre (PWTC) No. 45, Jalan Tun Ismail
50480 Kuala Lumpur Malaysia
September 2014
20th AsiaConstruct Conference, Hong Kong
Malaysia Country Report 2
CONTENT
EXECUTIVE SUMMARY
MACROECONOMIC REVIEW
Overview of the National Economy
OVERVIEW OF THE CONSTRUCTION INDUSTRY IN 2013
Construction Project Review
Construction Cost
Export and Import of Construction Works
CONSTRUCTION INDUSTRY OUTLOOK IN 2014
20th AsiaConstruct Conference, Hong Kong
Malaysia Country Report 3
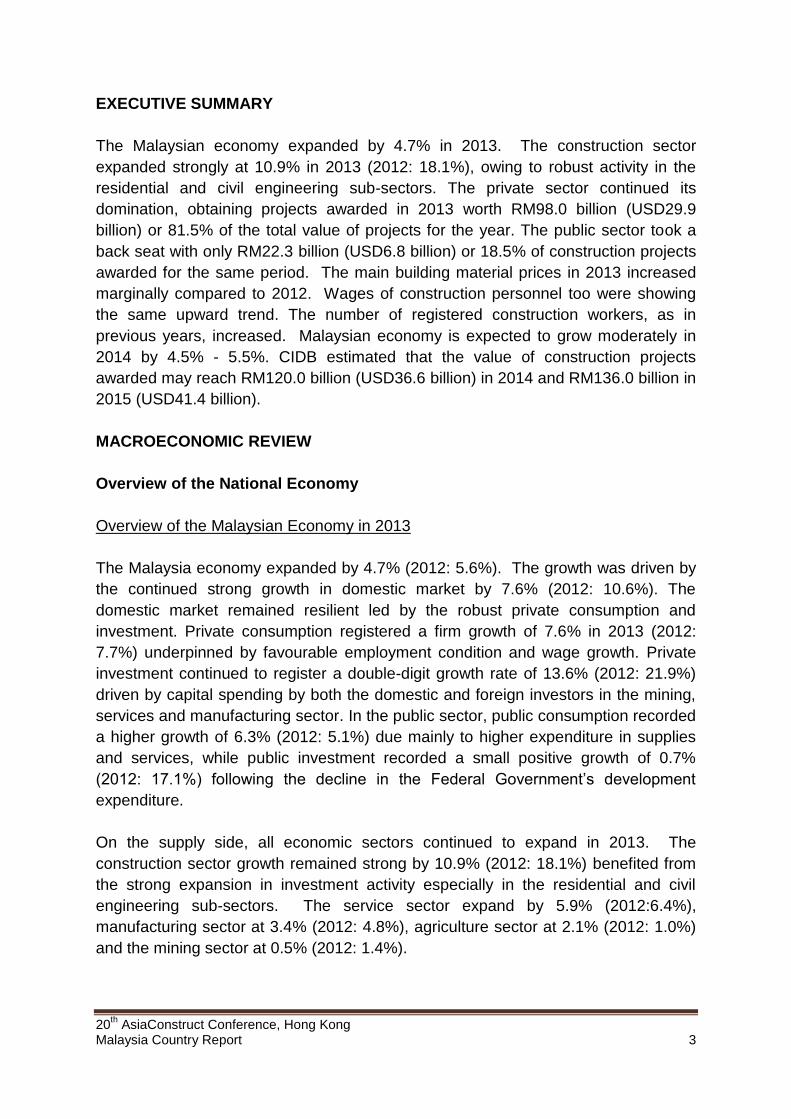
EXECUTIVE SUMMARY
The Malaysian economy expanded by 4.7% in 2013. The construction sector
expanded strongly at 10.9% in 2013 (2012: 18.1%), owing to robust activity in the
residential and civil engineering sub-sectors. The private sector continued its
domination, obtaining projects awarded in 2013 worth RM98.0 billion (USD29.9
billion) or 81.5% of the total value of projects for the year. The public sector took a
back seat with only RM22.3 billion (USD6.8 billion) or 18.5% of construction projects
awarded for the same period. The main building material prices in 2013 increased
marginally compared to 2012. Wages of construction personnel too were showing
the same upward trend. The number of registered construction workers, as in
previous years, increased. Malaysian economy is expected to grow moderately in
2014 by 4.5% - 5.5%. CIDB estimated that the value of construction projects
awarded may reach RM120.0 billion (USD36.6 billion) in 2014 and RM136.0 billion in
2015 (USD41.4 billion).
MACROECONOMIC REVIEW
Overview of the National Economy
Overview of the Malaysian Economy in 2013
The Malaysia economy expanded by 4.7% (2012: 5.6%). The growth was driven by
the continued strong growth in domestic market by 7.6% (2012: 10.6%). The
domestic market remained resilient led by the robust private consumption and
investment. Private consumption registered a firm growth of 7.6% in 2013 (2012:
7.7%) underpinned by favourable employment condition and wage growth. Private
investment continued to register a double-digit growth rate of 13.6% (2012: 21.9%)
driven by capital spending by both the domestic and foreign investors in the mining,
services and manufacturing sector. In the public sector, public consumption recorded
a higher growth of 6.3% (2012: 5.1%) due mainly to higher expenditure in supplies
and services, while public investment recorded a small positive growth of 0.7%
(2012: 17.1%) following the decline in the Federal Government’s development
expenditure.
On the supply side, all economic sectors continued to expand in 2013. The
construction sector growth remained strong by 10.9% (2012: 18.1%) benefited from
the strong expansion in investment activity especially in the residential and civil
engineering sub-sectors. The service sector expand by 5.9% (2012:6.4%),
manufacturing sector at 3.4% (2012: 4.8%), agriculture sector at 2.1% (2012: 1.0%)
and the mining sector at 0.5% (2012: 1.4%).

20th AsiaConstruct Conference, Hong Kong
Malaysia Country Report 4
Expansion in Malaysia economic activity across all sector in 2013 supported the
demand for labour. Employment recorded a strong growth with an addition of 4.8%
(2012: 3.6%) with a net addition of 613,000 jobs. The employment rate remained low
at 3.1% (2012: 3.0%).
The inflation rate remained modest at 2.1% 2013 (2012: 1.6%). The main contributor
to inflation were food and non-alcoholic beverages; transport; house, water,
electricity gas and other fuel categories. The Monetary Policy Committee (MPC)
maintained the Overnight Policy Rate (OPR) at 3.0% throughout 2013 and base
lending rate (BLR) of commercial banks remained at 6.5%. The Ringgit ended the
year at RM3.28 against the US Dollar, depreciated by 6.8%. Ringgit depreciated
amid increased global financial market volatility
Table 2.1 Malaysian Macroeconomic Overview
2011 2012 2013
GDP growth by economic activity at 2005 chained price (RM million)
Agriculture 54,253 54,782 55,913
Mining 62,565 63,432 63,767
Manufacturing 178,237 186,748 193,006
Construction 22,464 26,531 29,422
Services 385,179 409,976 433,998
Real GDP 711,351 751,471 786,696
GDP growth by economic activity at 2005 chained price (%)
Agriculture 5.8 1.0 2.1
Mining -5.5 1.4 0.5
Manufacturing 4.7 4.8 3.4
Construction 4.7 18.1 10.9
Services 7.0 6.4 5.9
Real GDP Growth 5.1 5.6 4.7
Demographic Indicator
Population (million persons) 29.1 29.5 29.9
Labour force (million persons) 12.7 13.1 13.8
Unemployment rate (%) 3.1 3.0 3.1
Financial Indicator
Inflation rate (%) 3.2 1.6 2.1
Short term interest rate 2.99 2.97 3.97
- 3 months (%)
Long term interest rate 3.22 3.15 4.15
- 12 months (%)
Exchange rate at end of period (RM against USD) RM3.18 RM3.06 RM3.28
Source: Central Bank of Malaysia Annual Report 2013.

20th AsiaConstruct Conference, Hong Kong
Malaysia Country Report 5
Review of the Malaysian Economy in the First Half of 2014
The Malaysian economy grow stronger by 6.3% in the first half of 2014 (1Q 2014:
6.2%; 2Q 2014: 6.4%). Overall, growth was supported by higher exports and
continued strength in private domestic demand. On the supply side, growth for
major economic sectors remained strong. The construction sectors growth strong at
14.3% in the first half of 2014 after the exceptionally strong growth in the first quarter
at 18.9% (2Q 2014: 9.9%). The services sector registered a growth of 6.3% in the
first half of 2014 (1Q 2014: 6.6%; 2Q 2014: 6.0%), the manufacturing sector
expanded at 7.1% (1Q 2014: 6.8%; 2Q 2014: 7.3%), the agriculture sector grow at
4.6% (1Q 2014: 2.3%; 2Q 2014: 7.1%) and the mining sector grow slightly at 0.6%
(1Q 2014: -0.8%; 2Q 2014: 2.1%).
OVERVIEW OF THE CONSTRUCTION INDUSTRY
Construction Project Review in 2013
The Construction Industry Development Board (CIDB) Malaysia recorded 7,621
projects worth RM120.4 billion (USD36.7 billion) (2012: 7,781 projects; RM125.2
billion, USD40.9 billion) of new construction projects awarded in 2013. This figure is
likely to increase as more projects awarded in 2013 gets reported to CIDB. The
private and public sectors contribution of 81.5% and 18.5% respectively from the
total value. Private sector projects value showed a decrease by 8.1% to RM98.0
billion (USD29.9 billion) and the public sector projects showed rose by 20.6% to
RM22.3 billion (USD6.8 billion). As the economy continued to grow, more private
investment activities took place and developers embarked on new construction
projects. This is in line with the government’s aim to push the private sector as the
main driver of the economy. In terms of numbers, private sector secured 5,795
projects compared to 1,826 public sector’s projects.
Major contribution to Malaysian construction projects came from the implementation
of 4 mega non-residential and infrastructure projects each costing more than RM1.0
billion amounting to RM11.4 billion as follows:
1. Liquefied natural gas (LNG) plant in Sarawak worth RM5.7 billion (USD1.7
billion)
Award date : 7 March 2013; Expected completion date : 7 December 2015
2. Onshore Gas Terminal in Terengganu worth RM2.3 billion (USD698 million)
Award date : 15 January 2013; Expected completion date: 31 July 2016

20th AsiaConstruct Conference, Hong Kong
Malaysia Country Report 6
3. 1071.43MW Gas Fired Independent Power Plant in Pulau Pinang worth
RM2.2 billion (USD686 million)
Award date : 3 April 2013; Expected completion date: 1 January 2016
4. Duta Ulu Kelang Expressway (DUKE) Phase 2 in Kuala Lumpur worth
RM1.4 billion (USD427 million)
Award date : 14 May 2013; Expected completion date : 15 May 2016
In 2013, non-residential projects registered a value of RM50.4 billion (USD165.4
billion), followed by residential projects at RM35.9 billion (USD11.0 billion),
infrastructure projects at RM25.1 billion (USD82.4 billion), and social amenity
projects at RM8.9 billion (USD2.7 billion). The project value had clearly been
boosted by the non-residential projects (41.9%) and led by the private sector with
a share of 39.1% due to the high-value projects awarded under the sub-category
of industrial and commercial. Meanwhile, infrastructure projects tendered
decreased by 43.3% in 2013, mainly because of reduction in infrastructure
projects by the private sector.

20th AsiaConstruct Conference, Hong Kong
Malaysia Country Report 7
Table 3.1 Value and Number of Construction Projects by Sector and Type
Sector and Type of Project Value (RM million)
2011 2012 2013 1H 2014
Total Private Sector 78,045.66 106,684.10 98,049.82 30,946.68
Residential 23,701.16 31,424.18 33,870.25 12,181.65
Non-Residential 34,537.51 37,172.02 47,110.24 12,390.70
Social Amenity 2,765.78 3,636.14 3,199.39 1,255.69
Infrastructure 17,041.21 34,451.76 13,869.94 5,118.64
Total Public Sector 23,492.22 18,506.18 22,326.89 8,071.62
Residential 908.83 1,647.26 2,049.04 1,001.61
Non-Residential 2,780.02 3,363.56 3,318.78 1,257.98
Social Amenity 4,207.12 3,660.94 5,706.12 972.51
Infrastructure 15,596.25 9,834.42 11,252.95 4,839.52
Grand Total 101,537.88 125,190.28 120,376.71 39,018.30
Sector and Type of Project Number
2011 2012 2013 1H 2014
Total Private Sector 5,747 5,822 5,795 1,814
Residential 2,116 2,044 2,028 640
Non-Residential 2,352 2,419 2,537 738
Social Amenity 264 236 211 76
Infrastructure 1,015 1,123 1,019 360
Total Public Sector 1,948 1,959 1,826 389
Residential 141 202 131 51
Non-Residential 260 316 322 92
Social Amenity 580 677 450 100
Infrastructure 967 764 923 146
Grand Total 7,695 7,781 7,621 2,203
Note : As at 30 June 2014
Source : CIDB Malaysia
Contractor Registration
The number of contractors registered in CIDB in 2013 decrease by 4.0% to 67,028
(2012: 69,799 contractors). Total registration of low grade contractors G1 to G3 in
2013 registered at 78.4% (2012: 79.4%) was greater than the high grade contractors
due to less restrictive conditions of registration and lesser capacity requirement. The
number of registered low grade contractors decreased by 5.1% in 2013. The
number of medium grade contractors of G4 and G5 accounted for 12.9% of total
registered contractors in 2013. The number of high grade contractors of G6 and G7
was 10.3% of the total registered contractors in 2013. Their registration increased
by 1.3% in 2013 compared to 2012. This was due to the contractors’ growing

20th AsiaConstruct Conference, Hong Kong
Malaysia Country Report 8
capability and increased opportunities in construction. The number of registered
foreign contractors in 2013 showed a significant change compared to 2012.
Table 3.2 Contractors Registered by Registration Grade
Grade Bidding Limit 2011 2012 2013 1H 2014
G1 Not exceeding RM200,000 32,752 36,399 34,485 34,292
G2 Not exceeding RM500,000 8,187 8,665 9,269 9,782
G3 Not exceeding RM1,000,000 10,437 10,351 8,825 8,726
G4 Not exceeding RM3,000,000 2,686 2,922 3,038 2,997
G5 Not exceeding RM5,000,000 3,817 4,317 4,130 4,048
G6 Not exceeding RM10,000,000 1,398 1,692 1,594 1,522
G7 Unlimited 4,573 5,144 5,332 5,331
Foreign Unlimited 244 309 355 346
Total 64,094 69,799 67,028 67,044
Source: CIDB Malaysia
Construction Personnel
A total of 1,858 architects and 975 quantity surveyors were registered as a
professional consultant. As in the previous years, the registration of consultants was
balanced and did not greatly vary. However, a total of 321,870 construction
personnel were registered in 2013, an increase about 87.4% compared to 2012. This
strong increment in the registration of personnel is a result of CIDB’s enforcement
activity both at site and through reminder letters.
Table 3.3 Local Professional Consultants Registered by Type
Type of
Professional Consultant 2011 2012 2013
Architect 1 1,782 1,844 1,858
Quantity Surveyor2 888 930 975
Engineer2 6,841 N.A N.A
Source :1 Board of Architects Malaysia 2 Board of Quantity Surveyors Malaysia
Note : N.A – Not Available

20th AsiaConstruct Conference, Hong Kong
Malaysia Country Report 9
Table 3.4 Registered Construction Personnel by Type
Category of Worker 2012 2013
Local Foreign Local Foreign
General worker 59,614 29,390 76,354 71,607
Construction worker 26,960 1,356 53,611 4,050
Skilled construction worker 13,685 566 18,857 426
Manager and site assistant manager 14,083 484 19,509 838
Construction supervisor 16,424 304 21,547 178
Administrative personnel 38,141 791 53,788 1,105
Total 168,907 32,891 243,666 78,204
Source : CIDB Malaysia
Construction Productivity
Value-added per employee in the construction sector rose by 2.5% (2012: 15.0%) to
RM23,373.00 per worker in 2013. The decline in productivity growth compared to
2012 indicates that some on-site construction practices and tasks still require a
high degree of labour input and that the sector has been relatively slow at
adopting mechanisation, automation and other advanced methods of
construction.
Table 3.5 Value-Added Per Employee
2011 2012 2013
Construction Sector Value- Added
(RM million) 22,464 26,531 29,422
Construction Sector Employee
(‘000 persons) 1,133.6 1,163.7 1,258.8
Value-Added Per Employee (RM) 19,817 22,799 23,373
Source : Central Bank of Malaysia Annual Report 2013
Construction Cost
Tender Price Index
Building construction tender price indices showed an overall increase compared to
the base year in 1980. In 1H 2013, tender price index showed a decrease of 3.3%
compared to 2H 2012 (429.3 point). In 2H 2013, the index added 22.1 points to
make the tender price index rose to 437.4 points. The tender price index will
continue to rise in line with the rising prices of building materials.

20th AsiaConstruct Conference, Hong Kong
Malaysia Country Report 10
Table 3.6 Building Construction Tender Price Indices (1980 = 100)
Period Tender Price Indices
2011 1H 408.49
2H 411.36
2012 1H 420.49
2H 429.32
2013 1H 415.24
2H 437.35
Source : Average Cost per Square Meter for Building Works by Public Works Department
Average Price of Major Construction Material
Overall, the average price for major building materials in 2013 slightly increase
compared to 2012 prices. The price of cement, aggregate, sand and brick increase
of about 0.3% to 3.3%. In contrast, prices for other building materials such steel bars
(mild steel round bars and high tensile deformed bars), ready mixed concrete and
BRC 10A declines by 4.8% to 1.1% compared to year 2012.
Table 3.7 Average Prices of Major Construction Materials (RM)
Category of Material Unit 2011 2012 2013
Cement 5 kg Bag 16.46 16.75 17.19
Aggregate Tonne 36.65 37.71 39.14
Sand Tonne 26.83 28.55 28.79
Steel Bar Tonne 2,579.14 2,572.18 2,549.13
Ready Mixed Concrete m³ 268.86 268.61 252.27
BRC A10 m² 19.51 18.45 17.57
Brick Unit 0.36 0.35 0.37
Source : CIDB Malaysia
Construction Industry Wage Rates
Construction General Worker Wage Rates
Average daily wage rates for all categories of local skilled construction workers
increases ranging from 0.1% to 16.0%. The highest wage rate earn by local skilled
worker who works as a plumber-reticulation (RM126.33 per day, USD38.52 per day),
carpenter – joinery (RM121.17 per day, USD39.74 per day) and roofer (RM1,117.75
per day, USD386.22 per day). Average daily wage rates for most categories of
foreign skilled construction workers increases ranging from 0.1% to 9.4%. The

20th AsiaConstruct Conference, Hong Kong
Malaysia Country Report 11
highest wage rate earn by foreign skilled worker who works as a plumber-reticulation
(RM109.67 per day, USD33.44 per day), steel structure fabricator (RM107.75 per
day, USD32.85 per day) and general welder (RM105.06 per day, USD32.03 per
day).
Table 3.8 Average Daily Wage Rate for Construction Worker (RM per day)
Category of Worker
Minimum /
Maximum
Wage
Local Worker Foreign Worker
Skilled Semi-Skilled Skilled Semi-Skilled
2012 2013 2012 2013 2012 2013 2012 2013
General Construction
Worker - Building
Minimum 42.23 46.00 - - 36.38 39.80 - -
Maximum 71.39 73.53 - - 59.75 61.97 - -
Concreter Minimum 64.28 72.65 61.75 59.28 58.87 61.20 48.38 51.55
Maximum 95.80 107.10 97.30 88.02 92.43 94.15 75.00 76.89
Barbender Minimum 71.31 79.81 64.57 60.18 60.95 64.56 46.05 49.39
Maximum 95.36 106.75 93.72 85.28 85.61 89.33 71.19 74.58
Carpenter-Formwork Minimum 71.91 82.69 72.03 65.46 66.10 69.12 56.13 59.71
Maximum 101.28 112.67 100.06 91.61 91.89 94.86 81.19 84.42
Bricklayer Minimum 67.20 74.14 54.89 53.89 56.49 56.78 42.62 44.82
Maximum 93.69 105.41 88.78 83.83 85.57 88.03 66.46 70.09
Roofer Minimum 76.51 83.84 71.93 68.77 69.89 71.62 53.85 55.60
Maximum 107.78 117.75 100.19 91.92 98.08 100.89 80.56 82.11
Carpenter - Joinery Minimum 80.25 88.19 76.32 70.99 73.59 74.25 56.91 59.24
Maximum 111.61 121.17 108.31 100.11 103.72 105.53 87.14 89.44
Steel Structure Fabricator Minimum 74.33 86.24 78.12 73.37 73.07 77.32 58.52 61.69
Maximum 110.78 120.31 107.78 101.00 106.11 107.75 85.93 88.49
General Welder Minimum 68.81 78.85 74.28 68.46 69.37 72.69 57.38 59.66
Maximum 104.81 116.28 106.01 96.82 104.17 105.06 85.76 88.44
Plumber - Building &
Sanitary
Minimum 72.11 81.51 67.04 63.91 64.53 66.86 49.09 51.89
Maximum 103.25 116.64 98.44 92.67 95.22 99.94 78.86 81.92
Plumber - Reticulation Minimum 75.54 84.86 77.56 74.88 70.51 74.66 60.35 63.54
Maximum 113.36 126.33 116.92 107.31 108.58 109.67 91.81 92.95
Building Wiring Installer Minimum - - 82.16 83.74 - - 69.23 72.01
Maximum - - 115.75 114.22 - - 105.97 107.28
Electrical Wireman PW2
(RM Monthly)
Minimum 1,797.06 1,836.89 - - 1,343.63 1,370.13 - -
Maximum 3,005.73 3,009.62 - - 2,432.39 2,433.78 - -
Electrical Wireman PW4
(RM Monthly)
Minimum 2,441.89 2,487.56 - - 1,759.71 1,843.71 - -
Maximum 3,609.61 3,619.33 - - 2,909.74 2,948.63 - -
Scaffolder - Prefabricated Minimum 71.88 80.51 65.12 61.37 62.38 65.31 51.68 54.07
Maximum 101.03 109.50 101.73 92.53 97.34 97.31 83.97 85.36
Scaffolder - Tubular Minimum 68.06 78.91 64.57 63.66 63.72 67.27 50.88 52.69
Maximum 94.92 109.11 95.58 88.31 95.53 95.50 78.47 78.61
Plasterer Minimum 70.88 80.84 66.72 62.33 58.83 64.13 44.55 47.99
Maximum 98.16 108.13 97.47 91.28 91.89 91.75 80.86 82.92
Tiller Minimum 76.66 87.81 69.42 65.24 67.42 70.56 50.83 54.10
Maximum 106.42 117.73 104.06 94.69 96.97 99.86 84.11 84.67
Painter - Building Minimum 65.91 73.30 60.82 57.40 59.39 60.67 46.43 48.57
Maximum 97.54 106.76 93.31 85.44 89.56 90.78 72.08 74.31

20th AsiaConstruct Conference, Hong Kong
Malaysia Country Report 12
Category of Worker
Minimum /
Maximum
Wage
Local Worker Foreign Worker
Skilled Semi-Skilled Skilled Semi-Skilled
2012 2013 2012 2013 2012 2013 2012 2013
General Construction
Worker - Civil
Minimum 52.03 57.52 - - 44.97 47.86 - -
Maximum 80.11 84.56 - - 71.06 71.78 - -
Source : CIDB Malaysia
Construction Machine Operator Wage Rates
Average daily wage rates for most categories of local skilled machine operator
increases ranging from 0.3% to 5.7%. The highest wage rate earn by local machine
operator who operates tower crane (RM141.05 per day, USD43.00 per day), mobile
crane (RM127.24 per day, USD38.79 per day) and crawler crane (RM126.50 per
day, USD38.57 per day). Average daily wage rates for most categories of foreign
skilled machine operator increases ranging from 0.2% to 6.0%. The highest wage
rate earn by foreign machine operator who operates tower crane (RM114.46 per
day, USD34.90 per day), mobile crane (RM106.42 per day, USD32.45 per day) and
crawler crane (RM104.56 per day, USD31.88 per day).

20th AsiaConstruct Conference, Hong Kong
Malaysia Country Report 13
Table 3.10 Average Daily Wage Rates for Construction Machinery Operator (RM
per day)
Category of Operator
Minimum /
Maximum
Wage
Local Worker Foreign Worker
Skilled Semi-Skilled Skilled Semi-Skilled
2012 2013 2012 2013 2012 2013 2012 2013
Excavator Minimum 72.22 72.67 - - 53.03 55.17 - -
Maximum 106.94 110.25 - - 90.56 92.69 - -
Pile Rigger Minimum 67.93 70.82 49.81 52.06 54.65 56.71 42.16 43.43
Maximum 103.31 104.11 81.44 82.92 87.07 91.62 69.58 71.75
Off Road Truck Minimum 65.88 68.47 49.44 50.86 53.35 55.60 40.13 42.48
Maximum 97.72 98.00 77.03 82.00 83.16 86.63 67.36 71.92
Backhoe Loader Minimum 66.36 68.00 - - 50.39 51.36 - -
Maximum 100.13 103.44 - - 81.53 86.42 - -
Roller Minimum 59.90 61.65 48.72 50.14 51.56 53.65 38.43 44.11
Maximum 104.39 105.36 76.94 77.92 85.25 85.39 65.91 73.46
Roller / Compactor Minimum 64.58 65.55 48.34 51.42 53.01 55.32 40.60 46.65
Maximum 102.07 102.52 79.31 81.44 86.42 89.72 70.77 76.69
Scraper
Minimum 68.02 69.36 50.92 55.81 57.67 59.50 44.20 49.64
Maximum 101.81 101.78 78.25 81.33 87.06 88.11 73.89 79.25
Motor Grader Minimum 66.39 68.12 - - 52.87 54.93 - -
Maximum 104.31 107.94 - - 90.30 90.77 - -
Wheel Loader Minimum 62.84 64.72 48.11 51.00 53.36 55.67 41.53 43.89
Maximum 106.64 107.28 82.11 83.14 87.82 91.67 70.62 71.93
Paver Minimum 68.04 70.98 53.39 55.13 58.27 59.74 43.63 46.16
Maximum 105.42 106.39 81.10 84.94 87.65 91.33 72.11 75.75
Mobile Crane Minimum 84.12 86.87 61.52 65.23 71.05 72.27 50.55 52.69
Maximum 128.68 127.24 96.47 98.03 104.70 106.42 78.61 79.75
Crawler Crane Minimum 84.53 89.31 63.44 64.57 69.85 73.22 52.02 53.33
Maximum 125.20 126.50 90.83 94.92 101.50 104.56 78.25 80.33
Tower Crane Minimum 88.97 91.36 67.56 68.95 72.99 74.83 52.96 54.63
Maximum 140.66 141.05 101.03 102.67 113.48 114.46 84.03 87.17
Forklift Minimum 66.47 68.22 48.99 50.21 52.08 53.47 38.94 41.08
Maximum 94.65 96.79 75.17 75.97 80.55 82.14 64.64 66.19
Slinger / Dogger Minimum 61.53 64.08 47.61 48.61 50.81 52.22 37.95 41.84
Maximum 100.50 99.63 76.22 77.36 82.06 84.61 66.92 69.14
Source : CIDB Malaysia
IBS Installer Wage Rates

20th AsiaConstruct Conference, Hong Kong
Malaysia Country Report 14
IBS installer in Malaysia comprises of only local workers. In 2013, average daily
wage rates for most categories of IBS installer decrease ranging from 4.1% to 0.2%.
The highest wage rate earn by skilled worker who install IBS precast concrete
(RM150.67 per day) and IBS lightweight panel (RM137.00 per day, 41.77 per day).
Average daily wage rates for most categories of semi-skilled IBS installer increases
ranging from 0.8% to 14.1%. The highest wage rate earn by semi-skilled worker
who install IBS lightweight panel (RM110.00 per day, USD33.54 per day) and IBS
precast concrete (RM109.67 per day, USD33.45 per day).
Table 3.9 Average Daily Wage Rate for Local IBS Installer (RM per day)
Category of IBS Installer
Minimum /
Maximum
Wage
Skilled Semi-Skilled
2012 2013 2012 2013
IBS Precast Concrete Minimum 85.17 81.67 65.17 65.67
Maximum 151.17 150.67 100.50 109.67
IBS Lightweight Panel Minimum 80.33 78.33 63.33 64.00
Maximum 130.67 137.00 97.67 110.00
Lightweight Block wall Minimum 71.00 69.67 55.00 57.33
Maximum 98.17 111.67 74.50 85.00
System Formwork Minimum 68.50 67.33 54.33 54.00
Maximum 107.83 113.33 87.33 94.00
Roof Truss (Timber) Minimum 69.33 66.67 54.33 55.00
Maximum 97.33 107.33 76.67 82.00
Roof Truss
(Light Gauge Steel)
Minimum 69.17 69.00 53.17 54.67
Maximum 105.67 115.33 76.67 87.33
Source : CIDB Malaysia
Export and Import of Construction Work
In 2013, Malaysian contractors managed to secure 16 foreign projects worth RM2.7
billion (USD823 million) and most of the projects came from Middle East countries.
The largest construction projects undertaken by Malaysian companies in foreign
countries were the Bahrain Affordable Housing Project (RM1.2 billion, USD380.0
million) and Submarine Mains (Stage 4 Phase 2) and Submarine Pipelines in Hong
Kong (RM848.8 million, USD265.8 million).
Comparatively, a total of 66 foreign contractors from 16 countries secured 124
construction projects in Malaysia worth RM14.8 billion (USD4.5 billion). Contractors
from Singapore (16 contractors, 33 projects) and Japan (12 contractors, 27 projects)
are the most involved. Among the largest construction projects awarded to foreign
contractors in 2013 are The Liquefied Natural Gas (LNG) Plant in Sarawak (RM5.7
20th AsiaConstruct Conference, Hong Kong
Malaysia Country Report 15
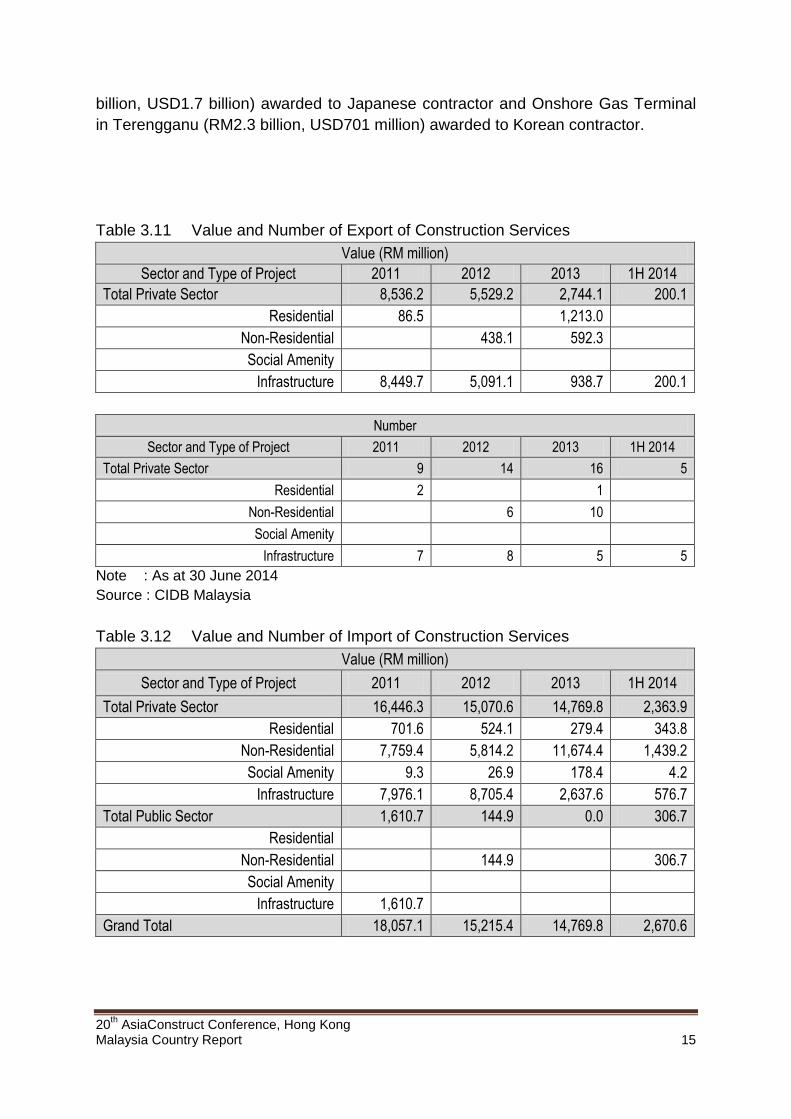
billion, USD1.7 billion) awarded to Japanese contractor and Onshore Gas Terminal
in Terengganu (RM2.3 billion, USD701 million) awarded to Korean contractor.
Table 3.11 Value and Number of Export of Construction Services
Value (RM million)
Sector and Type of Project 2011 2012 2013 1H 2014
Total Private Sector 8,536.2 5,529.2 2,744.1 200.1
Residential 86.5 1,213.0
Non-Residential 438.1 592.3
Social Amenity
Infrastructure 8,449.7 5,091.1 938.7 200.1
Number
Sector and Type of Project 2011 2012 2013 1H 2014
Total Private Sector 9 14 16 5
Residential 2 1
Non-Residential 6 10
Social Amenity
Infrastructure 7 8 5 5
Note : As at 30 June 2014
Source : CIDB Malaysia
Table 3.12 Value and Number of Import of Construction Services
Value (RM million)
Sector and Type of Project 2011 2012 2013 1H 2014
Total Private Sector 16,446.3 15,070.6 14,769.8 2,363.9
Residential 701.6 524.1 279.4 343.8
Non-Residential 7,759.4 5,814.2 11,674.4 1,439.2
Social Amenity 9.3 26.9 178.4 4.2
Infrastructure 7,976.1 8,705.4 2,637.6 576.7
Total Public Sector 1,610.7 144.9 0.0 306.7
Residential
Non-Residential 144.9 306.7
Social Amenity
Infrastructure 1,610.7
Grand Total 18,057.1 15,215.4 14,769.8 2,670.6

20th AsiaConstruct Conference, Hong Kong
Malaysia Country Report 16
Number
Sector and Type of Project 2011 2012 2013 1H 2014
Total Private Sector 118 148 124 31
Residential 7 12 15 5
Non-Residential 88 103 77 21
Social Amenity 3 5 2 1
Infrastructure 20 28 30 4
Total Public Sector 6 1 0 1
Residential
Non-Residential 1 1
Social Amenity
Infrastructure 6
Grand Total 124 149 124 32
Note : As at 30 June 2014
Source : CIDB Malaysia
Table 3.13 5 Major Project Secured by Malaysian Contractors in Foreign Market in
2013
Country Type of Project Value (RM million)
1. Bahrain Residential 1,213.0
2. Hong Kong Infrastructure 848.9
3. UAE Non-Residential 325.0
4. Sri Lanka Infrastructure 56.9
5. Singapore Non-Residential 49.6
Note : As at 30 June 2014
Source : CIDB Malaysia
Table 3.14 5 Major Projects Secured by Foreign Contractors in Malaysia in 2013
Country Type of Project Value (RM million)
1. Japan Non-Residential 5,739.9
2. Korea Non-Residential 2,291.2
3. China Non-Residential 880.3
4. China Infrastructure 739.4
5. Korea Non-Residential 399.0
Note : As at 30 June 2014
Source : CIDB Malaysia

20th AsiaConstruct Conference, Hong Kong
Malaysia Country Report 17
CONSTRUCTION INDUSTRY OUTLOOK FOR 2014
In 2014, the Malaysia economy is expected to remain on a steady growth by 4.5% to
5.5% and the construction sector at 10.0%. Construction sector will continue to
benefit from the development of sustainable economy and high physical projects in
preparation to achieve Vision 2020, which left about 6 years. Malaysia has a strong
economic fundamentals and political stability aims to become the center of business,
investment, tourism and location of the world's major livable cities. To achieve this,
Malaysia needs more quality economic infrastructure development. Implementation
of Entry Point Project (EPP), 10MP and the development of economic corridors
provinces will be more vibrant and revitalise the real estate market. Development of
government projects will be driven by the implementation of communications
services, utilities and high value of transportation projects. Thus, value for new
construction projects for 2014 is expected to be at RM120.0 billion (USD36.6 billion)
and in 2015, the value will reach RM136.0 billion (USD41.5 billion).

20th AsiaConstruct Conference
Hong Kong 13 & 14 November 2014
Theme Paper
Meeting Construction Industry Resources Requirements
THE MALAYSIA WAY
Jointly prepared by
Sariah Abd. Karib Noridah Shaffii
Che Saliza Che Soh Nur Ima Zainol Abidin
Business Division, Corporate and Business Sector
Construction Industry Development Board (CIDB) Malaysia Level 34, Menara Dato’ Onn
Putra World Trade Centre (PWTC) No. 45, Jalan Tun Ismail
50480 Kuala Lumpur Malaysia
August 2014

20th AsiaConstruct Conference, Hong Kong
Malaysia Theme Paper 2
CONTENT
INTRODUCTION CONSTRUCTION MATERIALS
Material Prices Materials Demand and Supply Materials Quality
CONSTRUCTION WORKER
Foreign Workers Skilled Workers Worker’s Safety
Workers Demand and Supply CONSTRUCTION TECHNOLOGY, MACHINERY AND EQUIPMENT
Industrialised Building System (IBS) Machineries and Equipments
CASH FLOW IN CONSTRUCTION SUMMARY

20th AsiaConstruct Conference, Hong Kong
Malaysia Theme Paper 3
INTRODUCTION The Malaysia economy registered a growth of 4.7% in 2013 (2012: 5.6%), driven by the continued strong growth in the domestic demand. All economic sectors are seen to register positive growth with construction sector’s growth remaining strong at 10.9% (2012: 18.1%). Construction output in 2013 rose by 13% to RM90.9 billion (USD27.7 billion) (2012: RM80.7 billion, USD26.4 billion). All types of construction activity showed a positive increase in output compared to 2012 anchored mainly by the implementation of civil engineering projects in 2013 (36%; RM32.3 billion, USD9.9 billion) followed by non-residential sub-sector (32%; RM29.3 billion, USD8.9 billion), residential sub-sector (28%; RM25.0 billion, USD7.6 billion), and special trade sub-sector (5%; RM4.3 billion, USD1.3 billion). Eventhough the construction sector contribution to the GDP in Malaysia is relatively small, averaging 3.5% (2011 untill 2013), the construction sector has always played an important role in creating downstream demand through backward linkages and upstream demand through forward linkages. Any investment by other economic sectors will create demand for construction works as construction is a demand driven sector. In terms of the number and value of new construction projects awarded in 2013, the Construction Industry Development Board (CIDB) Malaysia recorded 7,621 projects worth RM120.4 billion (USD36.7 billion) (2012: 7,781 projects; RM125.2 billion, USD40.9 billion). This figure is likely to increase as more projects awarded in 2013 gets reported to CIDB. The private sector has been the main engine of growth for construction with value of projects awarded ranging from 55% in 2009 to 85% in 2012. Similarly in terms of value, 82% of new projects in 2013 were private sector projects. For the first half of 2014, the Malaysia economy registered a growth of 6.3%, underpinned by higher exports and continued strength in private domestic demand. All economic sectors are seen to register positive growth with construction sector’s growth remaining strong at 14.3%. Table 1 Malaysia Gross Domestic Product by Key Economic Sectors
Sector GDP Growth (%) Contribution (%)
2012 2013 1H2014 2012 2013 1H2014
Agriculture 1.0 2.1 4.6 7.3 7.1 6.8
Mining and Quarrying 1.4 0.5 0.6 8.4 8.1 8.0
Services 6.4 5.9 6.3 54.6 55.2 54.9
Manufacturing 4.8 3.4 7.1 24.9 24.5 24.8
Construction 18.1 10.9 14.3 3.5 3.7 4.0
GDP 5.6 4.7 6.3 - - - Note : At Constant 2005 Price Source : Monthly Bulletin Statistics, Central Bank of Malaysia
Going forward, the Malaysia construction sector is expected to continue to benefit from the sustainable growth of the country’s economy and the high contribution of the private sector in the implementation of many new construction projects. More construction projects mean a higher demand on key construction resources such as

20th AsiaConstruct Conference, Hong Kong
Malaysia Theme Paper 4
construction workers; construction materials; construction machinery and equipment, in particular at the construction stage of the value chain. In order to continue leveraging on domestic opportunities, there is a need to adopt a holistic approach in reviewing those factors that impact the resource requirements for construction such as availability of construction materials at competitive prices and availability of sufficient and skilled workforce.
Under the Construction Industry Development Board (CIDB) Act 1994, Act 520 (Amended 2011), the CIDB Malaysia, a statutory body, is to undertake 14 functions related to the construction industry. Out of these, 8 functions under Section 4 (1) are concerned with meeting resources requirements for the Malaysian construction industry in terms of business environment, quality assurance, standards, training, registration, accreditation and technologies as follows:
(a) To promote and stimulate the development, improvement and expansion of the construction industry;
(f) To promote and encourage quality assurance in the construction industry;
(g) To regulate the conformance of standards for construction workmanship and materials;
(i) To provide, promote, review and coordinate training in the construction industry;
(j) To register and accredit contractors, to impose any conditions of registration and accreditation of the contractors and to revoke, suspend or reinstate the registration and accreditation;
(k) To register, accredit and certify construction personnel and to revoke, suspend or reinstate the registration, accreditation and certification of such construction personnel;
(l) To regulate the implementation of quality and safe construction works; (m) To regulate the implementation of Industrialised Building System in the
construction industry.
According to a research undertaken by CIDB in 2012, it was found that typically construction costs is contributed by the cost of 3 major resources that are construction materials (64%), construction worker (20%) and machineries and equipment (3%) assuming overheads and profit margin of 13%. Thus this report is a review of the challenges faced by the Malaysia construction industry and the various approaches taken by CIDB through the powers under the relevant 8 functions of Act 520 Section 4 (1) in meeting the construction resources requirements for the 3 major resources according to their importance in terms of their contribution to construction costs. CONSTRUCTION MATERIALS It is a matter of fact that construction materials represent a major expense in implementing construction projects. In Malaysia, ensuring material prices stability; equilibrium between demand and supply of materials; and conformance of materials to quality standards are among the biggest challenges faced by the Malaysian construction industry pertaining to material resources.

20th AsiaConstruct Conference, Hong Kong
Malaysia Theme Paper 5
Material Prices In many cases, sudden and unexpected increases in construction material prices can have a dire effect on the implementation of construction projects particularly during the construction phase. In ensuring material prices stability, Malaysia had implemented some measures like controlling the price for steel bars and cement under the Price Control Act 1946. Nevertheless, due to world demand for cement and steel, the industry could not sustain selling at the controlled ceiling prices and there was a price hike in steel and cement prices in early 2007. For steel, the price hike then was further compounded by the difficulty in obtaining smaller sizes steel bars. Chart 1 shows the average price increases of both these materials indicating the highest prices recorded was in July 2008 when steel prices had increased by about 103% (from average of RM1,938.00 to RM3,942.00 per tonne, USD560.00 to USD1,211.00 per tonne) and prices of cement bags had increased by 35% (from RM11.00 to RM15.00 per bag, USD3.20 to USD4.60 per bag). Prices of other materials only increased at marginal rate. There were 2 main factors that led to the price increase. Firstly, the steel price increase was mainly due to the increase in the price of crude oil in the international market that led to the increase in the cost of raw materials (scrap metal) worldwide. Secondly, the high demand of steel bars and cement both domestically and globally. Domestically, the high demand was due to many construction projects being implemented concurrently has also led to a price increase of these materials. Chart 1 Trend of Steel and Cement Price Indices
March 2007 to September 2008 in Malaysia
Note : Base year January 2007 Source : CIDB Malaysia
MSRB
HTDB
Diesel (Industry)
Cement

20th AsiaConstruct Conference, Hong Kong
Malaysia Theme Paper 6
This has led to the increase in construction costs above the agreed contract price, eroding profit margins of contractors. The margin erosion had caused contractors to reject contract offers, and many contractors at that time in 2008 were either unable to complete their construction works or severe delays in completion were seen. Revision of Construction Material Ceiling Price In mitigating the erratic movement of steel and cement prices, the government reacted in progressively increasing the ceiling price of steel thrice by as much as 45% (16 April, 9 June and 1 December 2007) and cement price twice by as much as 10% (16 December 2006 and 13 April 2007). The last ceiling price of steel which took effect on 1 December 2007, was RM2,225.00 to RM2,569.00 per tonne (USD655.00 to USD757.00 per tonne) depending on size and grade. The last ceiling price of cement stood at RM197.50 to RM352.00 per tonne (USD57.00 to USD102.00 per tonne). However, the government’s approach in stabilising the prices of steel and cement price through this approach was ineffective as both materials continued to be sold above the ceiling price resulting in the industry requesting for the steel and cement market to be fully liberalised to allow prices to be determined by market forces. Liberalisation of Steel and Cement Market Responding to the industry request, the government decided to remove the price control for steel in May 2008 and cement in June 2008 followed by liberalising the industry for both materials. The first stage of liberalisation involved giving exemption of import duty on steel products and removal of approved permits provided the imported steel complies to both domestic and international quality standard recognised by CIDB. As for cement, the government reduced the import duty from 50% to 10% for non-ASEAN countries and maintaining 5% for ASEAN countries. The second stage of liberalisation took place in November 2008. The steel and cement market was fully liberalised with full duty exemption to all importers. For steel, the number of steel products liberalised expanded from 3 to 57 of the Customs Tariff Code. Out of 57, only 15 products were identified for use in the construction industry. In ensuring quality assurance, the CIDB Certificate of Approval is a prerequisite for the importation of steel and cement. Hence, under ASEAN Free Trade Area (AFTA), full liberalisation for these two materials achieved in 2008 is much earlier than initially scheduled in 2015. At the time of writing this report in 2014, the prices of steel and cement in Malaysia is continuously determined by market forces. Strengthening the Mechanism for Price Fluctuation Reimbursement
In complementing other mitigating measures to cushion the impact of the materials price increase in 2007, the government also took measures to review the special provisions on reimbursing contractors for material price fluctuations for government projects. For building works, price variation calculation is allowed for 14 types of materials based on the changes of cost indices and steel unit price. For civil
20th AsiaConstruct Conference, Hong Kong
Malaysia Theme Paper 7
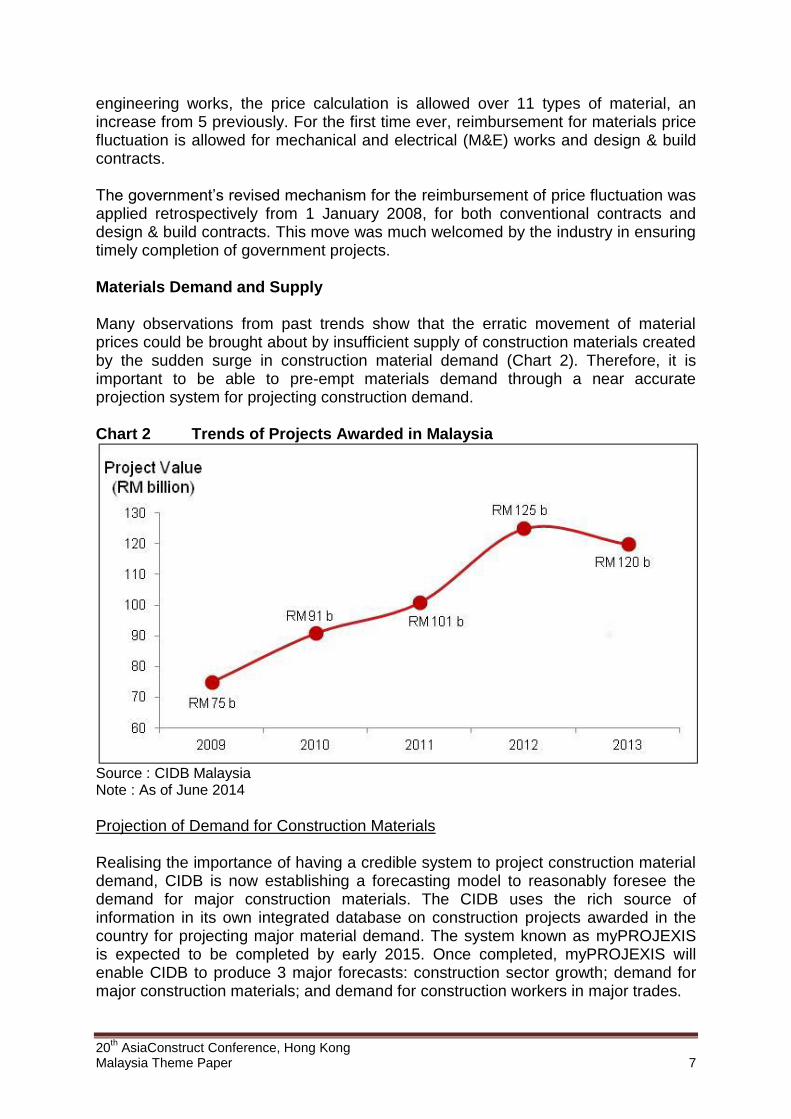
engineering works, the price calculation is allowed over 11 types of material, an increase from 5 previously. For the first time ever, reimbursement for materials price fluctuation is allowed for mechanical and electrical (M&E) works and design & build contracts. The government’s revised mechanism for the reimbursement of price fluctuation was applied retrospectively from 1 January 2008, for both conventional contracts and design & build contracts. This move was much welcomed by the industry in ensuring timely completion of government projects. Materials Demand and Supply Many observations from past trends show that the erratic movement of material prices could be brought about by insufficient supply of construction materials created by the sudden surge in construction material demand (Chart 2). Therefore, it is important to be able to pre-empt materials demand through a near accurate projection system for projecting construction demand. Chart 2 Trends of Projects Awarded in Malaysia
Source : CIDB Malaysia Note : As of June 2014
Projection of Demand for Construction Materials Realising the importance of having a credible system to project construction material demand, CIDB is now establishing a forecasting model to reasonably foresee the demand for major construction materials. The CIDB uses the rich source of information in its own integrated database on construction projects awarded in the country for projecting major material demand. The system known as myPROJEXIS is expected to be completed by early 2015. Once completed, myPROJEXIS will enable CIDB to produce 3 major forecasts: construction sector growth; demand for major construction materials; and demand for construction workers in major trades.

20th AsiaConstruct Conference, Hong Kong
Malaysia Theme Paper 8
Materials Quality Ensuring the conformance to quality standards of construction materials is another big challenge pertaining to material resources in Malaysia. In assuring the quality of locally manufactured materials used in construction projects, CIDB is empowered under Section 4(1)(g) Act 520, to regulate the conformance of standards for selected construction materials listed under the relevant schedule. In assuring the quality of imported construction materials used in the country, conformance to the relevant Malaysia Standards (MS) is a compulsory requirement. The power in executing this is derived from the Customs Act 1967.
Controlling Quality for Locally Manufactured Materials
For locally manufactured construction materials, CIDB is empowered under Act 520 (Amended 2011) to issue the Product Certification Licence (PCL) to manufacturers that comply with the requirements of the relevant MS in the manufacturing of building materials. Initially 18 types of construction materials is proposed to be regulated under this requirement. The implementation of this regulatory power is expected to come into force in 2014. Controlling Quality for Imported Materials
In enforcing the requirements of the relevant MS on imported construction materials, CIDB is the agency responsible under the Customs Directive (Prohibited Imports) of the Customs Act 1967 to issue the Certificate of Approval (COA) to importers. The COA will only be issued by CIDB for imported materials that conform to stringent quality requirements under the relevant MS. The CIDB’s role in regulating imported construction material was further expanded in 2013 to include products related to both the construction industry and the oil & gas industry which was previously regulated by the Standard and Industrial Research Institute of Malaysia (SIRIM). The latest development in 2014 requires all building materials to obtain the Product Certification or positive Full Type Test Report (FTTR) from the country of origin before the products are exported into Malaysia. CONSTRUCTION WORKER Construction worker is a very important resource in the implementation of construction projects. The various categories of workers includes general worker; skilled worker; site supervisor and workers in the managerial level such as safety managers and project managers. From a research undertaken by CIDB in 2012, the costs of employing construction workers contributes about 20% of total construction cost. Issues and challenges faced pertaining to construction workers such as over dependency on foreign workers; lack of skills; workers safety; and equilibrium between demand and supply of workers will impact the productivity of the construction industry and the quality of workmanship of construction works.

20th AsiaConstruct Conference, Hong Kong
Malaysia Theme Paper 9
Foreign Workers In Malaysia, the construction sector is over dependent on foreign workers. This is evident by their high number at construction sites representing about 55% of the total number of workers (CIDB study in 2010). In Peninsular Malaysia, about 434,300 foreign construction workers from various nationalities such as Indonesia, Bangladesh, Myanmar, Pakistan and Nepal are registered with the Immigration Department of Malaysia (Table 2) recording the second highest compared to the other sectors at 19.3%. The actual number of foreign workers engaged in construction could possibly be higher if illegal foreign workers are taken into account. Table 2 Number of Foreign Workers Registered with Malaysia Immigration Department in Peninsular Malaysia untill 31 December 2013
Nationality Construction Domestic
Help Manufacturing Services Plantation Agriculture Total
Bangladesh 113,322 91 127,855 44,891 18,541 18,150 322,750
India 9,210 877 5,859 60,634 23,130 24,307 124,017
Indonesia 244,144 121,107 147,940 53,028 357,076 98,360 1,021,655
Myanmar 22,938 108 102,869 24,831 3,689 7,012 161,447
Nepal 11,533 84 296,997 52,456 7,355 17,041 385,466
Pakistan 16,142 56 4,152 4,623 8,398 17,291 50,662
Philipina 5,958 35,945 4,824 4,798 10,981 6,620 69,126
Thailand 1,085 348 378 11,590 693 2,950 17,044
Vietnam 4,881 1,028 44,477 1,877 168 559 52,990
Others 2,029 10,292 16,421 10,593 1,580 1,192 45,165
Total 434,300 169,936 751,772 269,321 431,611 193,482 2,250,322
Source : Immigration Department of Malaysia Note : Others country include China, Cambodia, Laos and Sri Lanka
Contractors resort to foreign workers due to their resilience, mobility and willingness to accept lower wages. Moreover, contractor’s preference to use conventional method of construction involving wet trades like bricklaying and plastering is not attractive to the local workforce due to the 3D (Dirty, Difficult, Dangerous) syndrome thus causing contractors to resort to foreign workers. Continued dependence on foreign workers especially the illegal workers has brought about social, economic and security issues in the country. Therefore, the government has devised strategies in preventing the continuous inflow of illegal foreign workers by placing stringent criteria for the importation of foreign workers and implementing the Comprehensive Settlement Program on Illegal Immigrants (6P Program). Importation of Foreign Construction Workers Acknowledging the dependency of the construction industry towards foreign construction workers, the government had established the Construction Labour Exchange Centre Berhad (CLAB). CLAB is a non-profit oriented organisation

20th AsiaConstruct Conference, Hong Kong
Malaysia Theme Paper 10
established by the CIDB in 2003. Its main function is to manage the distribution of foreign construction workers to contractors in a quick and efficient manner by accepting foreign workers with valid permit from contractors who no longer need them; distributing the foreign workers to contractors who are in need of them; and managing the flow of foreign workers from source countries in meeting the demand of foreign workers in the country. The construction company has an option whether to use the CLAB service or otherwise in sourcing foreign construction workers. Initially in 2006, CLAB’s role in managing the application of foreign workers was limited to 50 workers per company. In 2009, this figure was later increased to 100 workers per company. Between 31 March 2005 and 31 December 2013, CLAB had re-distributed about 41,953 construction foreign workers to 4,062 construction companies. The government continues to tighten the procedure for importing foreign construction workers. Effective 1 January 2014, all applications for foreign workers must first have prior approval from the OSC of MOHA (One Stop Centre of Ministry of Home Affair). In assisting the OSC, an officer from CIDB is positioned at MOHA to help filter and identify the appropriate number of foreign construction workers to be approved. Comprehensive Settlement Program on Illegal Immigrants In 2011, the government implemented a new strategy in cutting down the number of illegal immigrants through the Comprehensive Settlement Program on Illegal Immigrants or for short, 6P Amnesty Program. This program is aimed at strengthening the management of foreign nationals within the country, controlling the entry of new foreign workers into the country, facilitating the management of economic activity involving foreign workers and controlling the growth of crime in Malaysia. The 6P program comprises registration, legalisation, amnesty, supervision, enforcement and deportation. The 6P program had shown a positive result when more than 2.3 million foreign nationals voluntarily registered. Of these, 1.3 million are illegal workers and the remaining 1.0 million are legal workers. This total does not include those who did not sign up, domestic helper and refugees in Sabah and Sarawak. From this registration process (11 July to 31 August 2011), it was found that for several countries the number of illegal workers exceeds that of legal workers. The highest number of illegal workers was from Indonesia with a total of 640,609 compared to 405,312 legal workers, followed by Bangladesh with 267,803 illegal workers compared to 132,897 legal workers. However, the number of legal foreign workers from Nepal is high at 221,617 compared to 33,437 illegal workers. Skilled Worker The implementation of construction projects using skilled construction workers would certainly enhance the productivity of the construction industry and the quality of workmanship. However in Malaysia, foreign construction workers that enter the country are mostly unskilled workers. In order to migrate to more productive technologies and efficient method of construction, the CIDB is empowered to firstly accredit the skills of foreign workers and secondly, to enhance the skill of local

20th AsiaConstruct Conference, Hong Kong
Malaysia Theme Paper 11
construction workers through training, accreditation and certification under Section 4(1)(k) Act 520. Training for Construction Worker In fulfilling the objective of enhancing skills of construction workers, CIDB has established 6 training centres known as the Malaysia Construction Academy or Akademi Binaan Malaysia (ABM). Over and above this, CIDB has also accredited 40 private training centres. All these training centres provide skills training to both existing construction personnel and new workers. Besides providing training, these training centres also undertake the exercise of accreditation and certification of construction workers. Over time with training, accreditation and certification, it is expected that the overall quality of workmanship and productivity of the construction industry will be enhanced, site accidents reduced and most importantly the supply of skilled construction workers improved. Offering construction training modules in 60 trades, in 2013 the ABM produces 22,864 trained construction workers; 21,879 in skill trades; 842 in supervisory and; 143 in management (Table 3). The number of construction workers trained increases annually. Training at ABM focuses on high end specialised trades that is market driven such as scaffold erection; welding; wireman; chargeman; fitting/insulation; blasting and painting; non destructive testing; crane operation and; plant operation which has the potential to raise the trainees’ employability towards earning high income. In enhancing the quality of training, CIDB continuously upgrades its training facilities by providing it with the latest equipment and machineries such as simulator machines for welding and crane operations. At the same time, CIDB continues to collaborate with the industry and selected training institutes to plan and implement new training schemes. Table 3 Number of Trained Construction Personnel
Training Area Year
2012 2013
Skill 15,330 21,879
Supervisor 525 842
Management 145 143
Total 16,000 22,864
Source : CIDB Malaysia
A recent Memorandum of Understanding (MoU) between Malaysia (CIDB) and Indonesia (Indonesian Construction Development Authority) signed on 31 March 2014 was for Malaysia to provide skills training programs and certification to Indonesian construction workers who are legally employed in the Malaysia construction sector. Initially, Indonesian construction workers will be trained in 4 skill trades (bricklaying and plastering; plastering and tiling; carpentry, barbending and concreting; and building decorative painting). By the end of 2014, 700 Indonesia construction workers are expected to be trained in these skill trades.

20th AsiaConstruct Conference, Hong Kong
Malaysia Theme Paper 12
Accreditation of Skilled Workers Quality issues in construction workmanship are known to be caused by workers who are unskilled and incompetent. Prior to the amendment of the CIDB Act, the number of accredited and certified skilled local and foreign construction workers is not encouraging. Realising that accreditation can be an important tool in improving the number of skilled and competent construction workers, the CIDB Act 520 (Amended 2011) has incorporated requirements for mandatory accreditation and certification of construction personnel covering semi and skilled workers, site supervisors and project managers both local and foreign. 62 trades have been identified for the accreditation and certification of skilled construction workers and construction site supervisors. Gradually, only skilled construction workers will be allowed to perform skilled works at construction sites, thus fulfilling the government’s aspiration to raise the quality of workmanship in construction projects. Apart from the 62 trades that have been identified, the CIDB encourages skilled workers in other trades to be accredited. For this exercise, the Certificate of Skill Competency or Sijil Kecekapan Kemahiran (SKK) will be issued to local workers and the Testimonial of Skilled Foreign Worker or Perakuan Kemahiran Pekerja Asing (PKPA) will be issued if they are foreign workers. In 2013, a total of 9,961 construction workers were accredited by the CIDB (Table 4). Of these, 95% were local workers while the rest were foreign workers. Table 4 Number of Accredited Construction Workers
Construction Workers Year
2012 2013
Local 9,434 9,486
Foreign 1,365 475
Total 10,799 9,961
Source : CIDB Malaysia
Worker’s Safety
Under Section 4(1)(k) Act 520, it is mandatory for all construction personnel in the country to be registered with CIDB. In order to be registered as a construction personnel, they are firstly required under the CIDB Green Card Program to undergo the course on Safety Induction for Construction Workers (SICW). This course is part of CIDB’s effort to inculcate awareness among the workers on the safety and health aspects at work. Secondly, after completing the SICW course, the construction personnel is eligible to apply to register as a construction worker. Once the application is approved, the said worker is given a green card.
Green Card Holders
It is compulsory for contractors to only engage registered construction workers who hold a green card. All registered construction personnel who hold a green card is automatically covered by a special Insurance Scheme that insures the construction personnel against hospital charges due to accident; permanent disability due to

20th AsiaConstruct Conference, Hong Kong
Malaysia Theme Paper 13
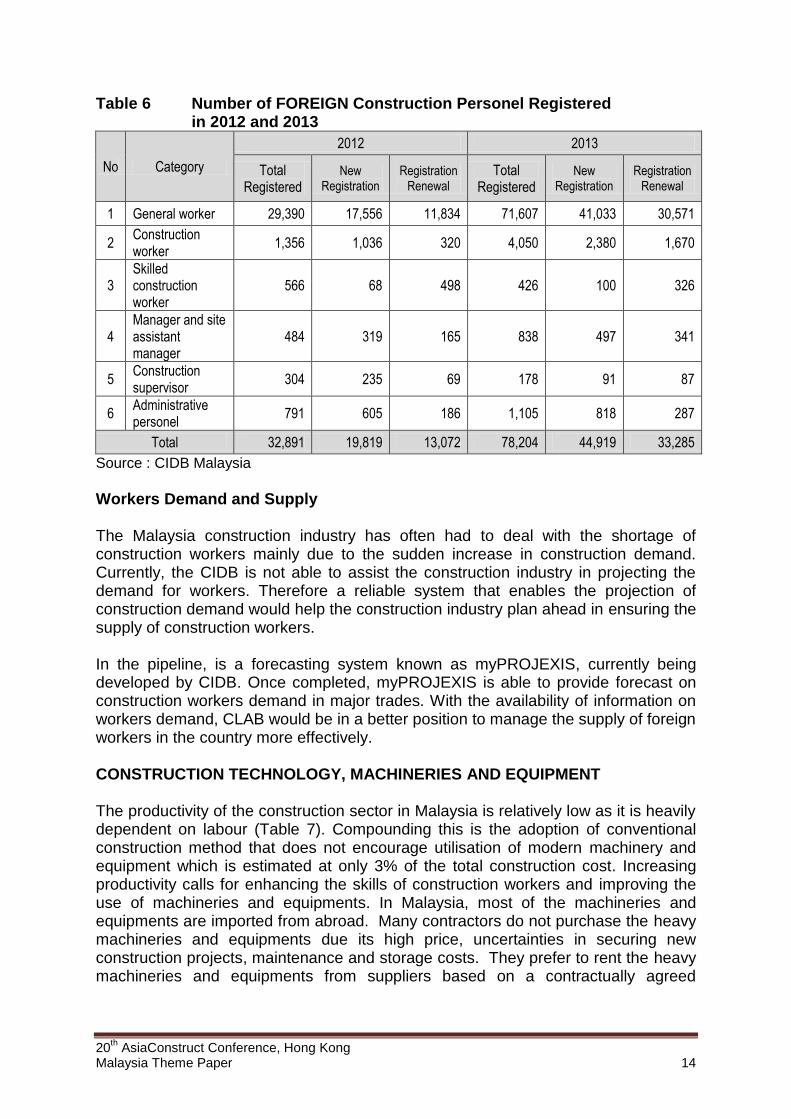
illness and accident; death due to illness and accident; and funeral expenses. While inculcating safety practice at construction sites is forefront under the Green Card Program, through the registration process, CIDB is able to monitor the number of workers employed in the construction sector. For local construction personnel, the green card is valid up to 5 years. For foreign construction personnel, the green card validity is according to their respective work permit validity. In 2013, the number of local worker with valid registration was 243,666 (2012: 168,906). This number includes 96,745 new registration and 146,921 renewal (Table 5). The number of new registration and renewal showed a significant increase by 32% and 54% respectively. Foreign workers registration in 2013 increased significantly by 138% to 78,204 (2012: 32,891). Out of this number, new registration increased by 127% and renewal increased by 155%. This strong increment in the registration through the Green Card Program is a result of CIDB’s enforcement activity both at site and through reminder letters. Compared to registration of foreign construction workers under the Immigration Department of Malaysia (434,300 persons), the number of foreign construction worker registered with the CIDB remained low (78,204 persons) (Table 6). This difference could be attributed to the unwillingness of employers to register their foreign workers under the Green Card Program in view of the mobility of those foreign workers to move from one employer to another. Table 5 Number of LOCAL Construction Personel Registered in 2012 and 2013
No Category
2012 2013
Total Registered
New Registration
Registration Renewal
Total Registered
New Registration
Registration Renewal
1 General worker 59,614 33,702 25,912 76,354 41,010 35,344
2 Construction worker
26,960 14,017 12,943 53,611 27,722 25,889
3 Skilled construction worker
13,685 659 13,026 18,857 594 18,263
4 Manager and site assistant manager
14,083 3,119 10,964 19,509 2,608 16,901
5 Construction supervisor
16,424 3,054 13,370 21,547 2,081 19,466
6 Administrative personel
38,141 18,668 19,473 53,788 22,730 31,058
Total 168,906 73,218 95,688 243,666 96,745 146,921
Source : CIDB Malaysia
20th AsiaConstruct Conference, Hong Kong
Malaysia Theme Paper 14
Table 6 Number of FOREIGN Construction Personel Registered in 2012 and 2013
No Category
2012 2013
Total Registered
New Registration
Registration Renewal
Total Registered
New Registration
Registration Renewal
1 General worker 29,390 17,556 11,834 71,607 41,033 30,571
2 Construction worker
1,356 1,036 320 4,050 2,380 1,670
3 Skilled construction worker
566 68 498 426 100 326
4 Manager and site assistant manager
484 319 165 838 497 341
5 Construction supervisor
304 235 69 178 91 87
6 Administrative personel
791 605 186 1,105 818 287
Total 32,891 19,819 13,072 78,204 44,919 33,285
Source : CIDB Malaysia
Workers Demand and Supply The Malaysia construction industry has often had to deal with the shortage of construction workers mainly due to the sudden increase in construction demand. Currently, the CIDB is not able to assist the construction industry in projecting the demand for workers. Therefore a reliable system that enables the projection of construction demand would help the construction industry plan ahead in ensuring the supply of construction workers. In the pipeline, is a forecasting system known as myPROJEXIS, currently being developed by CIDB. Once completed, myPROJEXIS is able to provide forecast on construction workers demand in major trades. With the availability of information on workers demand, CLAB would be in a better position to manage the supply of foreign workers in the country more effectively. CONSTRUCTION TECHNOLOGY, MACHINERIES AND EQUIPMENT The productivity of the construction sector in Malaysia is relatively low as it is heavily dependent on labour (Table 7). Compounding this is the adoption of conventional construction method that does not encourage utilisation of modern machinery and equipment which is estimated at only 3% of the total construction cost. Increasing productivity calls for enhancing the skills of construction workers and improving the use of machineries and equipments. In Malaysia, most of the machineries and equipments are imported from abroad. Many contractors do not purchase the heavy machineries and equipments due its high price, uncertainties in securing new construction projects, maintenance and storage costs. They prefer to rent the heavy machineries and equipments from suppliers based on a contractually agreed

20th AsiaConstruct Conference, Hong Kong
Malaysia Theme Paper 15
duration. Nevertheless, contractors are more likely to purchase cheaper and smaller machineries and equipments that are easily stored and maintained. Table 7 Value-Added Per Employee
Economic Sector 2012 2013
RM USD RM USD
Agriculture 34,202 11,184 32,625 9,983
Mining and Quarrying 786,998 257,348 725,449 221,988
Services 53,597 17,526 53,944 16,507
Manufacturing 83,822 27,410 86,538 26,481
Construction 22,799 7,455 23,373 7,152
Source: Central Bank of Malaysia Annual Report 2013
A key factor that limits the enhancement of productivity is the limited technology adoption, both in terms of technology used in advanced construction methods and modern machineries and equipment used throughout the construction process. Therefore, the government is aggressively encouraging the practice of using modern technique such as IBS with intensive machinery and heavy equipment utilisation. Industrialised Building System (IBS) IBS is a construction technique in which components are manufactured in a controlled environment (on or off site), transported, positioned and assembled on site. Migrating to IBS is expected to improve the overall performance of the industry in terms of faster completion and better quality of works through mechanisation, automation and modernisation. With higher utilisation of machineries and equipments and lesser dependency on workers, productivity will be increased. Furthermore, manufacturing the components under controlled condition will ensure higher quality of construction and reduction of waste materials. In addition, it will enhance safety level in the construction sector. The major challenge in the adoption of IBS is the resistance to change by the industry and the abundance of cheap workers. Industry’s reluctance also stems from the high capital cost, high transport cost and the assumption by designers that IBS limits their design creativity. A study conducted in 2012 in identifying utilisation of IBS found that only 46% of the 400 private projects in Klang Valley has adopted IBS. The adoption of IBS for projects outside the Klang Valley is believed to be lower than this. In encouraging the adoption of IBS, the government has formulated policies and introduced incentive schemes. Incentives, Policies And Regulations on Industrialised Building System (IBS) Adoption of IBS which has been introduced since the beginning of 2000 improved significantly when the government issued Treasury Circular Year 2008, which mandates the use of IBS for government projects and IBS score of not less than 70% effective on 31 October 2008. Exceptions are given to only for projects worth less than RM10 million and are located in remote areas and renovation works not

20th AsiaConstruct Conference, Hong Kong
Malaysia Theme Paper 16
involving the construction of new buildings. As a result, between October 2008 and September 2013, a total of 1,422 government projects with a value of RM36.1 billion had adopted IBS. Based on a study conducted by CIDB in 2010, 85 completed projects using IBS showed a decrease by 47% in the number of foreign workers at construction sites. In encouraging the manufacture of IBS components, CIDB had taken the initiative to register IBS products, manufacturers, contractors, installers and consultants. As of April 2014, CIDB has registered 429 IBS products, 170 IBS manufacturers and 8,298 IBS specialised contractor and accredit 7,473 Lightweight Blockwall Installer, 7,363 Roof Truss Installer, 1,501 Precast Concrete Installer, 187 Panel Leightweight Installer, 176 in Steel Structure Erection & Fabrication and 62 in Aluminium Fabrication Framework as well as 37 IBS consultants. Various measures have been taken and will continue to be taken to enhance the uptake of IBS effectively. Among the measures that have been implemented are:
i. Establishment of IBS Roadmap (2003 – 2010) as a blueprint to industrialise the construction sector which was reviewed to IBS Roadmap (2011 – 2015) to emphasize on commercial issues.
ii. Formation of IBS Centre in 2007 as a referral centre. iii. Exemption from levy payment through the federal budget 2005 on
housing projects with a minimum IBS score of 50%. iv. Introducing refund incentives for purchasing IBS components mould
through the federal budget 2006. v. Enhancing awareness on IBS in highlighting the advantages of modern
technology, and introduction to newer and more sophisticated machineries and construction equipment through 3 international conference and exhibition, 179 national seminars and road shows throughout the country.
vi. Introducing IBS Catalogue System in June 2013 as a reference for designing and preparing more efficient and cost-effective building plans.
vii. Implementing 7 types of training based on ABM modules on IBS such as aluminium framework fabrication; steel structure erection and fabrication; precast concrete installer; lightweight panel installer; lightweight block wall installer; roof truss installer (steel); and roof truss installer (timber). Between January 2007 and September 2013, a total of 81,184 participants have attended the course.
Machineries and Equipments In Malaysia, the government imposes import duty and sales tax on machineries and equipments that are imported from abroad such as bulldozers, rollers, piling and special purpose truck. The import duty and sales tax are considered relatively high, ranging from 10% to 30% whencompared to that imposed by other ASEAN countries such as Thailand, Indonesia, Philippines, Vietnam and Singapore.

20th AsiaConstruct Conference, Hong Kong
Malaysia Theme Paper 17
Reduction of Import Duties and Sales Tax At the end of 2012, CIDB had suggested that the government reduce the import duty and sales tax on heavy machineries used in construction. Following that, at the end of 2013, CIDB submitted a proposal to the government on the implementation of IBS stressing on the importance of using heavy machineries. In this proposal, the same earlier suggestion was again brought up that is to reduce the rate of import duty and sales tax on heavy machineries in the construction industry as an incentive to encourage the use of IBS. In the short term, reduction in duties and taxes on heavy machineries will promote the use of newer and modern machineries that is safer and more productive; accelerating the construction process; ensuring the quality of construction; and reducing dependency on foreign workers. In the long term, the positive outcome of the reduction in duties and taxes can be felt when more local machine operators are trained and the machinery maintenance industry becomes mature. It could also lead to ancillary industries such as services business and after sales support to be established. CASH FLOW IN CONSTRUCTION Getting cash to flow during the implementation of construction projects is crucial in ensuring that the contractors are always in a healthy position to finance the project. Cash flow problems if left unaddressed can impede national growth as construction is the key sector which supports all other economic sectors. This is through the provision of physical building and infrastructure in meeting the private sector business objectives and the government’s socio economic activities. Any problems that affect the smooth implementation of construction projects including payment problems will impact wealth creation hence the enhancement of quality of life and standard of living of the people. On a larger scale, such problems will also affect the industry’s economic contribution to the nation. As such, a new Act of Parliament, the Construction Industry Payment and Adjudication Act (CIPAA) was enacted in 2012. In ensuring the smooth implementation of CIPAA, 2 specialist construction courts have also been established. Construction Industry Payment and Adjudication Act (CIPAA) (Act 746) CIPAA introduces statutory adjudication as a dispute resolution mechanism that provides for the recovery of payment to an aggrieved party, upon the conclusion of the adjudication process. An aggrieved party may be accorded a host of other remedies such as a right to reduce the rate of work progress or to suspend work or even to secure direct payment from the principal. Besides construction contracts, the CIPAA also applies to supplies contracts and professional consultancy services. Much of construction works is subcontracted and the complexity of this multilayered sub-contracting is compounded by the fact that most appointments of these sub contractors are done using incomplete terms of payment or orally, without terms of payment. It is a known fact that all construction participants, as long as they are on the receiving end of the payment spectrum, may have experienced payment problems such as non-payment, late payment or under payment. Therefore,
20th AsiaConstruct Conference, Hong Kong
Malaysia Theme Paper 18
Malaysia enacted the CIPAA to address payment related disputes towards enhancing cash flow during project implementation. CIPAA came into force on 15 April 2014. Establishment of Specialist Construction Court In getting construction justice delivered effectively and efficiently including under CIPAA, 2 specialist construction courts were established by the Malaysia Judiciary in April 2013 one each in Kuala Lumpur and Shah Alam. The establishment of the construction courts completes the 3 main pillars of construction justice that includes arbitration, adjudication and litigation. The 2 construction courts deal with cases involving building and construction disputes; engineering disputes; claims by and against engineers, architects, surveyors, accountants and other specialist advisers; claims relating to the quality of goods sold or hired and work done, materials supplied or services rendered; claims relating to the environment including pollution cases. As of June 2014, 164 cases have been filed in the Construction Court located in the Kuala Lumpur Court while 41 cases have been filed in Shah Alam. Of the 41 cases in Shah Alam, 20 cases are still pending, while 60 cases are pending in the Construction Court in Kuala Lumpur. Moving forward, the CIDB is now tracking and analysing cases brought to the construction courts to establish the common causes of disputes within the construction industry. This would form the basis in formulating future policies for improving the construction industry. SUMMARY As Malaysia continues to progress towards a developed economy, the construction industry continues to be an integral part of the Malaysian economy. Moreover, the construction industry benefits a wide range of stakeholders that stand to gain from a robust and healthy construction industry. The government has taken significant approach in meeting the Malaysian construction resource requirements towards institutionalising a more productive industry and ensuring that spending on construction is geared towards productivity and quality through greater use of technology; access to highly skill workers and quality materials; and conducive business environment. In line with the effort to further drive industry changes, CIDB has amended the Act 520 to broaden its mandate to include the setting of standards; registration of construction personnel; training; accreditation and certification; company quality assessment; and health, safety and environment. Next in the pipeline, is the Construction Industry Master Plan II (CIMP) 2016 – 2020 which is being developed by CIDB in collaboration with key ministries, government agencies and various organisations representing the construction industry. The CIMP attempts a significant leap to deliver a step change in industry performance and truly transform the Malaysia construction industry.

Meeting Construction Industry
Resource Requirements
20th AsiaConstruct Conference
13 – 14 November 2014
Hong Kong
Che Saliza Che Soh
Business Division
Construction Industry Development Board
CIDB Malaysia

2
Construction Resources
Materials
Manpower
Methods
Machinery
Money

3
Construction Scenario

4
5.1% 5.6% 4.7%
6.3% 5.8%
1.0%
2.1%
4.6%
-5.5%
1.4%
0.5% 0.6%
4.7% 4.8%
3.4%
7.1% 4.7%
18.1%
10.9%
14.3%
7.0% 6.4% 5.9% 6.3%
2011 2012 2013 1H 2014
National GDP Agriculture Mining Manufacturing Construction Services
Note : At constant price 2005 Source : Central Bank of Malaysia
GDP Growth by
Major Economic Activity

5
17.3%
10.3%
4.2%
-8.4%
-14.0% -11.8%
18.6%
10.8%
15.1%
21.1%
16.2%
10.6%
-24.0%
-4.4%
2.3% 1.8%
-1.5% -0.5%
8.5%
4.4%
6.2%
11.4%
4.7%
18.1%
10.9%
80 81 82 83 84 85 86 87 88 89 90 91 92 93 94 95 96 97 98 99 00 01 02 03 04 05 06 07 08 09 10 11 12 13
National GDP
Construction GDP
Base year :
1980 - 1999 : 1978=100
2000 - 2004 : 2000=100
2005 - 2014 : 2005=100
2011 2012 2013 2014
Q1 Q2 1H Annual
(f)
National GDP (%) 5.1% 5.6% 4.7% 6.2% 6.4% 6.3% 5.5% -6.0%
Construction Sector GDP (%)
4.7% 18.1% 10.9% 18.9% 9.9% 14.3% 12.7%
GDP Growth
Source : Central Bank of Malaysia
6
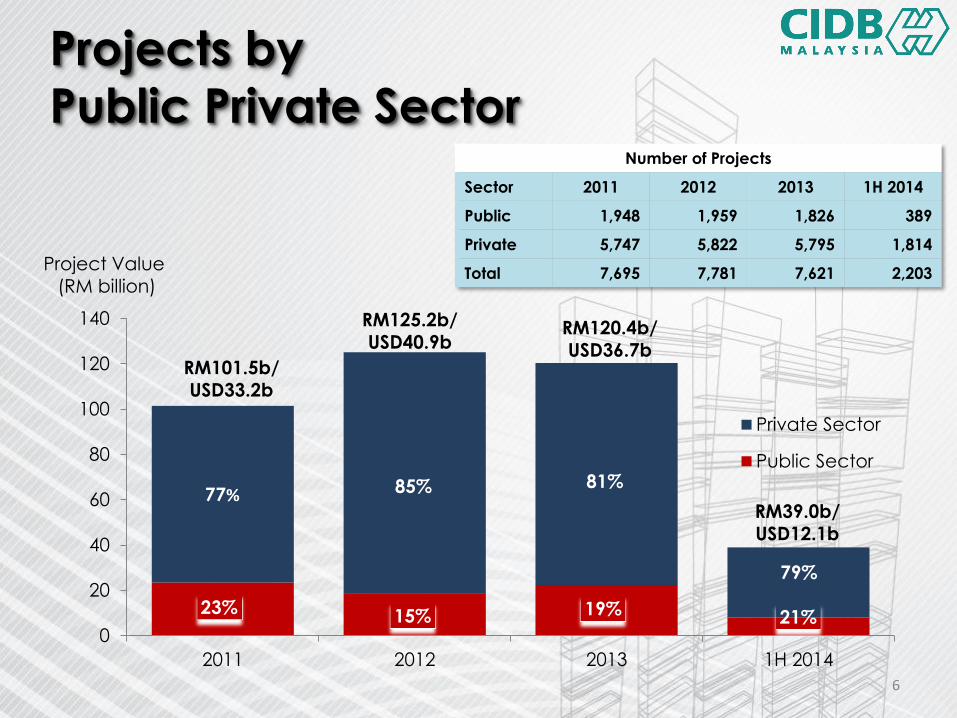
Projects by
Public Private Sector
23% 15% 19% 21%
77% 85% 81%
79%
0
20
40
60
80
100
120
140
2011 2012 2013 1H 2014
Private Sector
Public Sector
Project Value (RM billion)
RM101.5b/ USD33.2b
RM125.2b/
USD40.9b RM120.4b/
USD36.7b
RM39.0b/ USD12.1b
Number of Projects
Sector 2011 2012 2013 1H 2014
Public 1,948 1,959 1,826 389
Private 5,747 5,822 5,795 1,814
Total 7,695 7,781 7,621 2,203

7
Projects by Category Number of Projects
Category 2011 2012 2013 1H 2014
Residential 2,257 2,246 2,159 691
Non-Residential 2,612 2,735 2,859 830
Social Amenity 844 913 661 176
Infrastructure 1,982 1,887 1,942 506
Total 7,685 7,781 7,621 2,203
24% 26% 30%
34%
37%
32%
42%
35%
7%
6%
7%
6%
32%
35% 21%
26%
0
20
40
60
80
100
120
140
2011 2012 2013 1H 2014
Project Value
[RM billion]
Infrastructure
Social Amenities
Non-Residential
Residential
RM101.5b/ USD33.2b
RM125.2b/ USD40.9b
RM86 b
RM120.4b/
USD36.7b
RM39.0b/ USD12.1b

• advisory • regulatory • facilitative
8
CIDB Act 1994, ACT 520
(Amended 2011)
concerned with meeting resources
requirement 8
functions
6 functions

Note : Based on CIDB’s study in 2012
Materials, Manpower and Machinery
Contribution

10
Construction Materials
• Mater ia l Pr ices • Mater ia ls Demand And Supply
• Mater ia ls Qual i ty

11
Construction Materials
Weightage for Building Works
Note : Based on CIDB’s study in 2012.
Excludes the overhead and profit margin from the cost of goods and construction workers.

80
100
120
140
160
180
200
220
Jan
'07
Fe
b
Ma
r
Ap
r
Ma
y
Jun
Jul
Au
g
Se
p
Oct
No
v
De
c
Jan
'08
Fe
b
Ma
r
Ap
r
Ma
y
Jun
Jul
Au
g
Se
p
Oct
No
v
De
c
Jan
'09
Fe
b
Ma
r
Ap
r
Ma
y
Jun
Jul
Au
g
Index (%)
Sand
CementDiesel
(retail)
Ready Mixed
Concrete
BitumenHTDB
steel bar
MSRB -
steel bar
Clay Brick
Diesel
(industry)
Aggregate
Trend of Materials Price Indices
12
Crude oil price hike in the
international market (Q2)
Sub-prime and credit
crisis in US (Q3)
Factors Effects
Property market slowed down (Q3)
Construction plotted -1.6 % growth (Q4)
Export dropped (Q4)
Commodity price dropped (Q4)

13
Measures to Mitigate
Materials Price Increase in 2008
VOP
Adjustment of variation
of price in building cost
during construction for
compensation of price
movement
Liberalisation
The steel and cement
market fully liberalised
with full duty
exemption to all
importers
Stabilising the prices of
steel and cement by
progressively increased
the ceiling price
Ceiling Price
Revision
2007
2008
2008

14
Trends of Current Materials Price
230.00
240.00
250.00
260.00
270.00
280.00
290.00
300.00
310.00
320.00
0.00
5.00
10.00
15.00
20.00
25.00
30.00
35.00
40.00
45.00
Jan.
2012
Mar May Jul. Sep. Nov. Jan.
2013
Mar May Jul. Sep. Nov.
Cement/bag Aggregate/tonne Sand/tonne
BRC A10/m² Bricks/100 unit Ready-mixed Concrete/m³
Round bars/100kg
Price for Cement, BRC
A10, Aggregate, Bricks
and Sand
(RM)
Price for Round Bar and
Ready-mixed Concrete
(RM)

15
Projection of Materials Demand
myPROJEXIS system is a tool that enable CIDB to forecast:
• the value of work done/ construction sector growth;
• the demand for major construction materials consumed in construction; and
• demand for construction workers in major trades

16
Control Measures on Quality of
Locally Manufactured Materials
Product Certification Licence
(PCL)
Given to manufacturer who
comply with the
requirements of the relevant
Malaysia Standard in the manufacturing of building
materials
18 types of construction materials regulated

Certificate of Approval
(COA)
Issued to imported materials
that conform to stringent quality requirements under
the relevant Malaysia
Standards
17
Control Measures on Quality of
Imported Materials
Procedure to Import
Construction
Products

18
Construction Worker
• Fore ign Workers • Sk i l led Workers • Safety & Health

19
Construction Workers Weightage
for Building Works
Note : Based on CIDB’s study in 2012.
Excludes the overhead and profit margin from the cost of goods and construction workers.

20
434,300 registered with
Immigration
Department of
Malaysia
19.3% compared with
other sectors
55% Based on CIDB
study in 2010
Foreign Construction Workers
56%
26%
5%
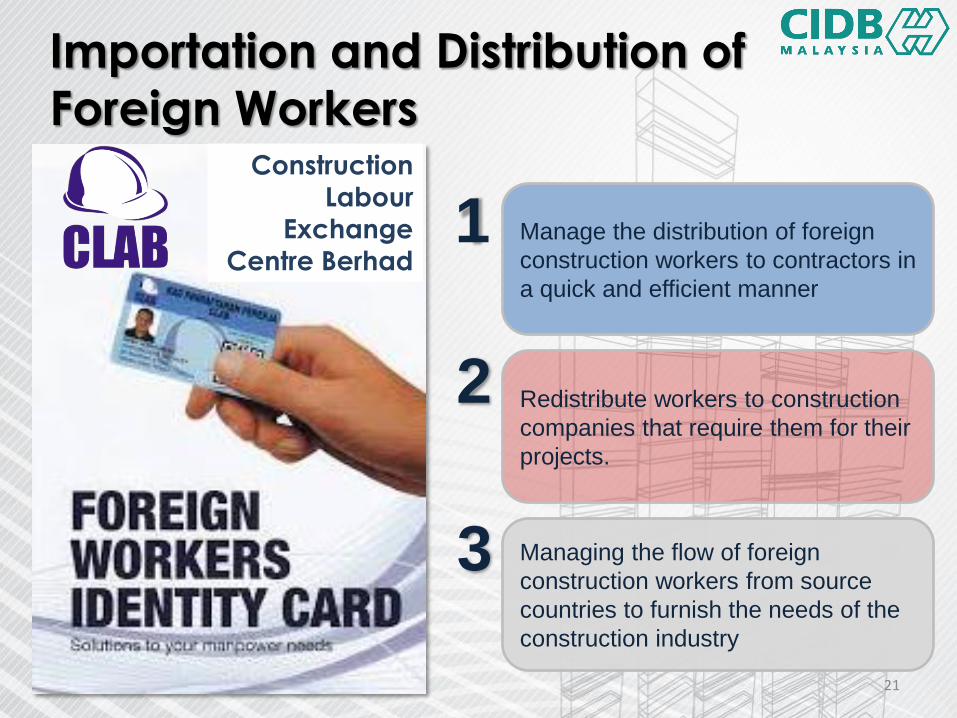
21
Importation and Distribution of
Foreign Workers Construction
Labour Exchange
Centre Berhad 1
2
3
Manage the distribution of foreign
construction workers to contractors in
a quick and efficient manner
Redistribute workers to construction
companies that require them for their
projects.
Managing the flow of foreign
construction workers from source
countries to furnish the needs of the
construction industry

22
Skilled Workers
Training Centers
Centre of Excellence for Oil And Gas Services Training
- East Malaysia
Sabah
Centre of Excellence for Infrastructure Sustainable Development
- East Malaysia
Sarawak
Centre of Excellence for Oil
& Gas Services Training - East Region
Terengganu
Centre of Excellence for Mechanical and Electrical Services
Training - North Region
Kedah
Johor
Centre of Excellence for Welding and Fabrication Technology Training - South Region
Centre of Excellence for
Latest Technology in Construction
- Central Region
Kuala Lumpur
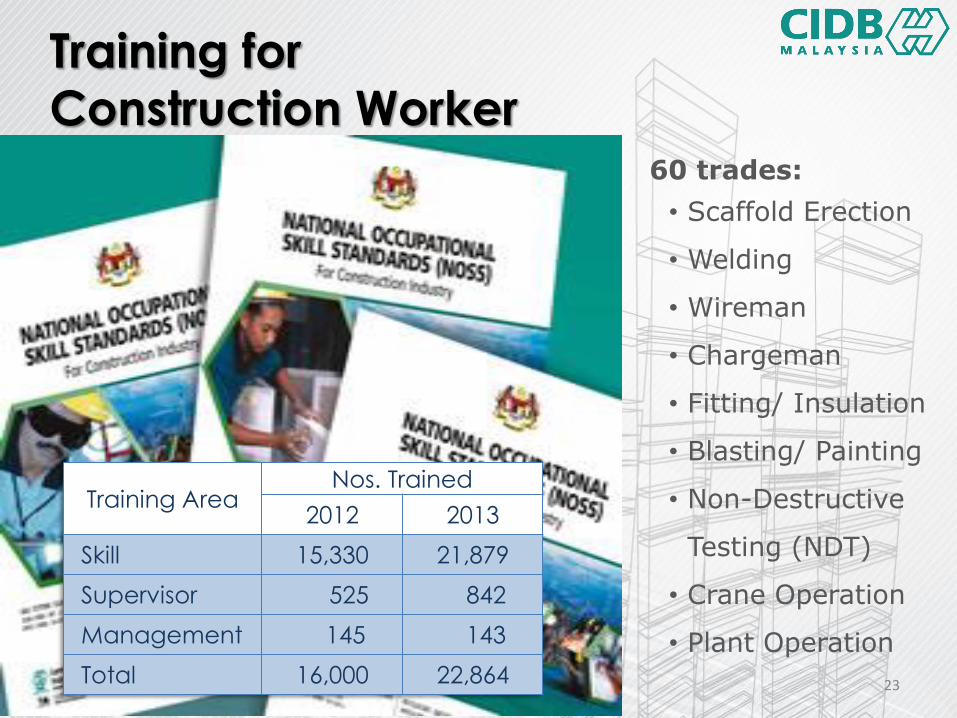
23
Training for
Construction Worker
60 trades:
• Scaffold Erection
• Welding
• Wireman
• Chargeman
• Fitting/ Insulation
• Blasting/ Painting
• Non-Destructive
Testing (NDT)
• Crane Operation
• Plant Operation
Training Area Nos. Trained
2012 2013
Skill 15,330 21,879
Supervisor 525 842
Management 145 143
Total 16,000 22,864
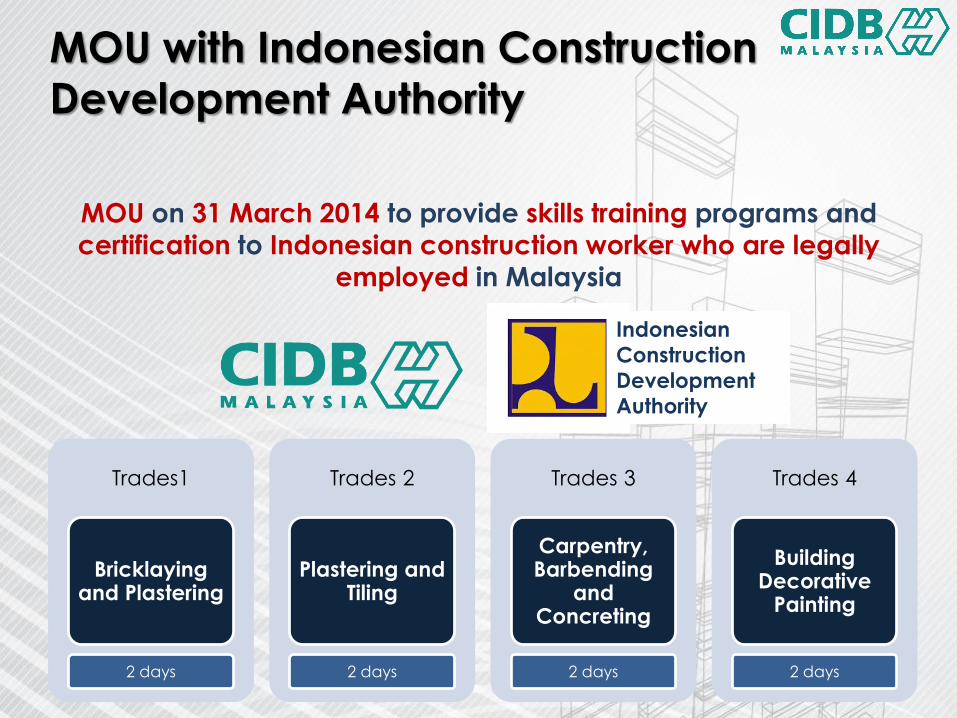
24
MOU with Indonesian Construction
Development Authority
MOU on 31 March 2014 to provide skills training programs and certification to Indonesian construction worker who are legally
employed in Malaysia
Trades1
Bricklaying and Plastering
2 days
Trades 2
Plastering and Tiling
2 days
Trades 3
Carpentry, Barbending
and Concreting
2 days
Trades 4
Building Decorative
Painting
2 days
Indonesian
Construction
Development
Authority

25
Accreditation of Skilled Workers
Construction
Workers
Nos. Accredited
2012 2013
Local Workers 9,434 9,486
Foreign Workers 1,365 475
Total 10,799 9,961
62 trades identified for
accreditation and
certification
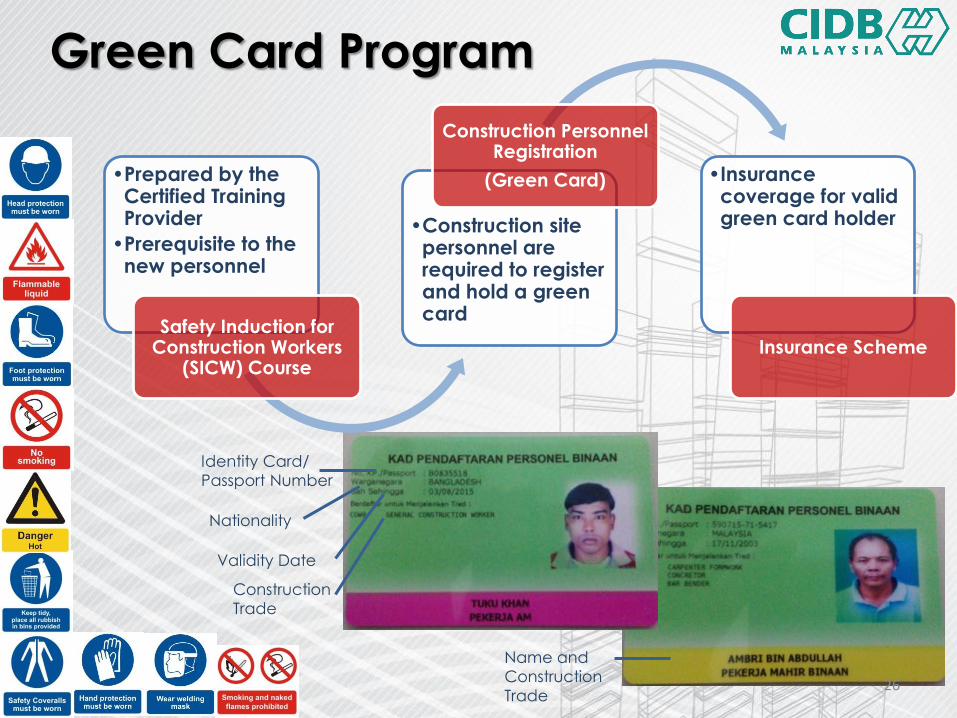
26
Green Card Program
•Prepared by the Certified Training Provider
•Prerequisite to the new personnel
Safety Induction for Construction Workers
(SICW) Course
•Construction site personnel are required to register and hold a green card
Construction Personnel Registration
(Green Card) •Insurance coverage for valid green card holder
Insurance Scheme
Identity Card/
Passport Number
Validity Date
Construction
Trade
Name and
Construction
Trade
Nationality

27
myPROJEXIS system is a tool that enable CIDB to forecast:
• the value of work done/ construction sector growth;
• the demand for major construction materials consumed in construction; and
• demand for construction workers in major trades
Projection of Worker’s Demand

28
Method and Machinery
• Industr ia l i sed Bui ld ing Systems ( IBS) • Heav y Machiner ies & Equipment
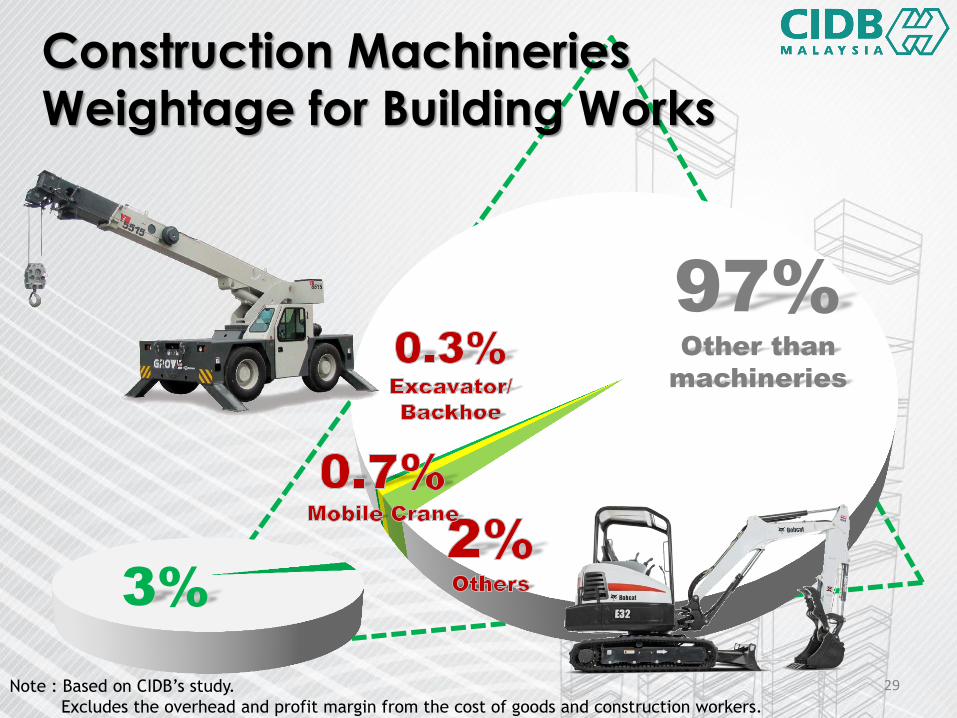
29
Construction Machineries
Weightage for Building Works
3%
Note : Based on CIDB’s study.
Excludes the overhead and profit margin from the cost of goods and construction workers.
97% Other than
machineries
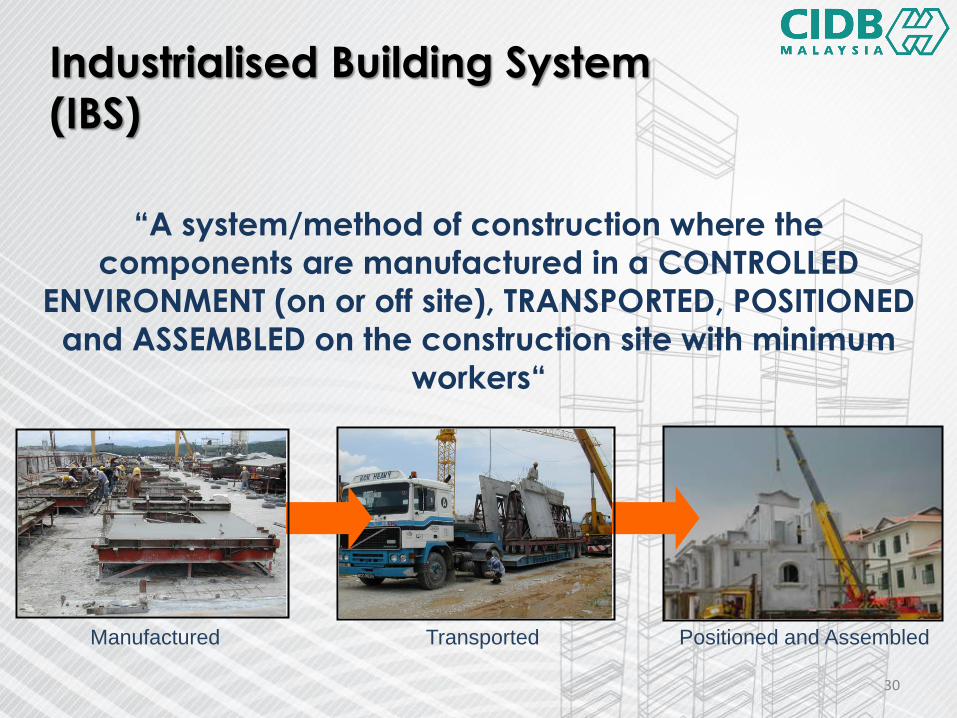
30
Industrialised Building System
(IBS)
Manufactured Transported Positioned and Assembled
“A system/method of construction where the
components are manufactured in a CONTROLLED
ENVIRONMENT (on or off site), TRANSPORTED, POSITIONED
and ASSEMBLED on the construction site with minimum
workers“

31
Incentives, Policies, Regulation
and Measures on IBS
Treasury Circular 2008
Registration IBS Products, Manufactures,
Contractors, Installers & Consultants
IBS Roadmaps
IBS Centre
Exemption On Levy Payment
Incentives For Purchasing IBS
Components Mould To Manufacturer
International Conference, Exhibition, Seminars & Road Shows
IBS Catalogue System
Training Module

32
Machineries and Equipments
Import Duty and Sales Tax
2011 Data

33
Machineries and Equipments
Import Duty & Sales Tax Reduction

34
Money @ Cash Flow

35
Essential Element in Project
Implementation
Cash flow is the LIFE BLOOD of the construction industry

36
Purpose of
Construction Industry Payment
and Adjudication Act (CIPAA) Act 746
1
2
3
To facilitate regular and timely payment
To provide a mechanism for speedy dispute resolution through adjudication
To provide remedies for the recovery of payment in the construction industry

The CIPAA Journey
2011
2010
2009
2008
2007
2006
2005
2004
2003
Reading at Parliament
Briefing to AG and more consultations
Approval in Principle from Cabinet
Cabinet Paper
Roadshows and Awareness
Key Recommendation on CIPAA in CIMP
Conference and Industry Consultations
Forums
Initial discussions
2012 Gazetted
15th April 2014
Enforced

38
Specialist Construction Court
Kuala Lumpur
Shah Alam

39
Way Forward
CIDB Act 1994
ACT 520
(Amended 2011)
Construction Industry
Master Plan II
(2016-2020)

www.cidb.gov.my