Making the Canned Tomato Paste Production Greenceur-ws.org/Vol-2030/HAICTA_2017_paper87.pdf ·...
13
759 Making the Canned Tomato Paste Production Green Dimitrios Folinas, Panayotis Karayannakidis, Dimitrios Aidonis Department of Logistics, Technological Educational Institute of Central Macedonia Kanellopoulou 2, GR-60100, Greece (*) [email protected], [email protected], [email protected] (*) Corresponding author Abstract: The main objective of this paper is to propose a systematic approach for measuring the environmental performance of supply chains in the food sector and specifically in canned tomato paste production based on Lean thinking techniques so as to identify sources of waste in the selected supply chain. Keywords: Food Supply Chain; canned tomato paste; Lean thinking; Value Stream Mapping; Green Supply Chain. 1 Introduction Lean thinking tools have recorded significant successes resulting in a worldwide and across sectors recognition including both products and services. Some of the available and known tools used are: Takt Time, Kaizen, Statistical Process Control, Poka-Yoke, 5S, Value Stream Mapping (VSM), Total Quality Management, Kanban, and Jidoka, among many others. In the literature there is a number of research initiatives that propose the deployment of lean methods and tools in the agrifood sector aiming to reduce the environmental emissions. For example, Simons and Mason (2002) examined the emission characteristics of a generic food supply chain which includes both transportation and cold storage, while Venkat and Wakeland (2006) investigated the environmental performance of lean supply chains using carbon dioxide emissions as the key performance indicator. Tanco et al. (2013) discussed the applicability of lean manufacturing’s body of knowledge to a seasonal food industry and Folinas et al. (2014) propose an approach for measuring the environmental performance of a supply chain in the food sector based on lean thinking techniques so as to identify sources of waste. In the recent years a number of researches have focused on the application of Value Stream Mapping, which is one of the lean think techniques for supporting the greening efforts. The proposed approach aims at determining waste, in terms of measuring the non value-added time of production and logistics processes, as well as water and energy usage across organizational boundaries. United States Environmental Protection Agency (USEPA) when at 2007 first introduced the Environmental Value Stream Mapping (EVSM)
Transcript of Making the Canned Tomato Paste Production Greenceur-ws.org/Vol-2030/HAICTA_2017_paper87.pdf ·...
759
Making the Canned Tomato Paste Production Green
Dimitrios Folinas, Panayotis Karayannakidis, Dimitrios Aidonis
Department of Logistics, Technological Educational Institute of Central Macedonia Kanellopoulou 2, GR-60100, Greece
(*) [email protected], [email protected], [email protected] (*) Corresponding author
Abstract: The main objective of this paper is to propose a systematic approach for measuring the environmental performance of supply chains in the food sector and specifically in canned tomato paste production based on Lean thinking techniques so as to identify sources of waste in the selected supply chain.
Keywords: Food Supply Chain; canned tomato paste; Lean thinking; Value Stream Mapping; Green Supply Chain.
1 Introduction
Lean thinking tools have recorded significant successes resulting in a worldwide and across sectors recognition including both products and services. Some of the available and known tools used are: Takt Time, Kaizen, Statistical Process Control, Poka-Yoke, 5S, Value Stream Mapping (VSM), Total Quality Management, Kanban, and Jidoka, among many others. In the literature there is a number of research initiatives that propose the deployment of lean methods and tools in the agrifood sector aiming to reduce the environmental emissions. For example, Simons and Mason (2002) examined the emission characteristics of a generic food supply chain which includes both transportation and cold storage, while Venkat and Wakeland (2006) investigated the environmental performance of lean supply chains using carbon dioxide emissions as the key performance indicator. Tanco et al. (2013) discussed the applicability of lean manufacturing’s body of knowledge to a seasonal food industry and Folinas et al. (2014) propose an approach for measuring the environmental performance of a supply chain in the food sector based on lean thinking techniques so as to identify sources of waste. In the recent years a number of researches have focused on the application of Value Stream Mapping, which is one of the lean think techniques for supporting the greening efforts. The proposed approach aims at determining waste, in terms of measuring the non value-added time of production and logistics processes, as well as water and energy usage across organizational boundaries. United States Environmental Protection Agency (USEPA) when at 2007 first introduced the Environmental Value Stream Mapping (EVSM)
760
method, which has all the characteristics of its parent -Value Stream Mapping- but additionally environmental issues and the usage of material or energy.
This study introduces the application of the VSM tool so as to determine the waste that have environmental impact in a specific agrifood supply chain; the production of the canned tomato paste. The main objective of this paper is to propose a four-step approach for measuring the environmental performance of supply chains in the food sector based on Lean thinking techniques so as to identify sources of waste in the selected supply chain.
2 Deployment of VSM in Canned Tomato Paste Production
In this study we propose the use of Value Stream Mapping (VSM) diagrams to develop visual representations of the canned tomato paste production. First, the Current State Map (CSM) is developed to represent the production “as-is” in order to identify the highest sources of waste (non-value added activity) in the value stream of the examined process, as well as, to develop an implementation plan for lean techniques with the development of the Future State Map (FSM).
We are following a four-step process based on relative studies (Rother and Shook, 2003; Lasa, Laburu and Vila, 2008; Belokar, Kumar and Kharb (2012): • Step 1: Selection of agrifood supply chain processes to be value-streamed. • Step 2: Development of the Current State Map (CSM) of the selected processes in
the agrifood supply chain. • Step 3: Development of the Future State Map (FSM). • Step 4: Development of the Action Plan (AP). Step 1: Selection of agrifood supply chain processes to be value-streamed A typical process for the production of canned tomato paste is illustrated in Figure 1 (SuperPro Designer, version 9.0; Intelligen, Inc., Scotch Plains, NJ, USA was used, to document, model and simulate the examined canned tomato paste production line) and consists of the following stages:
A typical process for the production of tomato paste is depicted in Fig. 1. Initially, the tomato fruits are placed in wooden crates with 17-20 kg capacity and then transferred to the tomato processing plants by lorries.Upon arrival, the fruits are weighed and then samples are taken from each load to ensure the quality is suitable for processing; thisbasically determines the price of the tomato fruits. Once tomatoes are introduced in the production lines, they are washed with water. Washing is carried out at two stages: during the first washing the foreign materials like insects, leaves and soil are being removed, while during the second washing any chemical residuals (i.e. pesticides) are removed. After washing, the tomato fruits are subjected to screening, which is performed manually under specific lighting conditions and aims at removing the fruits that are not suitable for further processing. Following screening, the tomatoes are crushed and transferred with a pump to a heat exchanger. The temperature of the pulp is kept at 92 oC and aims at the deactivation of enzymes. The heated pulp is then subjected to refining, where the peels along with fibers and seeds are removed. Then, the pulp is transferred with a centrifugal pump to an evaporator in order to increase the solids’ content. Evaporation is carried out until a

761
30 Brix tomato paste is produced. The condensed tomato paste is then sterilized at 108 oC for 1.5 min and cooled at 35 oC. Aseptic bags are filled with the sterilized tomato paste, the bags are then sealed and placed in cartons. The final product is stored for 10 months, which allows the content of the bag to reach equilibrium.
For the production of tomato paste, the most energy and water consuming stages are the initial stages of tomato fruit washing, essentially carried out in two stages, as well as the stages of hot break and evaporation. In order to decrease water usage, water recycling is proposed after the first stage of washing as well as the second wash, as described in the flow chart, and reuse it during the initial washing step.
Regarding the concentration of the tomato paste, a three-way evaporator is used which employs the steam produced by the first and second stages of evaporation to heat the concentrated tomato paste in the second and third stages, respectively. Therefore, the steam produced is almost fully utilized to concentrate the tomato paste with the exception of the condensate produced by the evaporator, which exhibits a temperature of about 50 oC. This water may be used to raise the temperature of tomatoes prior or after crushing, therefore decreasing the energy requirements prior to preheating. However, it is necessary to insulate the tanks and pipelines in order to reduce energy losses due to temperature differences with the environment. Finally, the peels and fibers produced during refining can be used as animal feeds, creating an extra revenue for the tomato processing industry.

762
Fig. 1. Flow chart for the production of tomato paste using hot break (SuperPro Designer v. 9.0; Intelligen Inc., Scotch Plains, NJ, USA).
Based on the above description of the canned tomato paste production the following discrete processes are identified: tomato reception, hydrotransport (first washing), second washing, screening, pulping, pre-heating, refining, holding, evaporation, holding, sterilizing/cooling, packaging and storage. But, are all these processes potentially waste sources?
In order to identify the processes to be value-streamed the following six criteria are applied (Folinas, Kelemis and Manikas, 2011):

763
1. Processes that require significant amounts of inputs / resources, such as pounds of materials used, pounds of hazardous materials used, gallons of water used, gallons of water consumed, watts of energy used, etc.
2. Processes that emit significant amounts of outputs, such as pounds of solid waste generated, pounds of hazardous waste generated, pounds of air pollution emitted, etc.
3. Processes requiring environmental permits or reporting to environmental agencies, and
4. Processes that include special pollution control equipment and/or specialized infrastructure.
5. Processes that potentially affect the environmental consciousness and sensitiveness of the producers.
6. Processes that potentially affect the environmental consciousness and sensitiveness of the consumers. Based on the proposed six criteria we used both primary and secondary data
analysis to evaluate the level of the environmental impact of the processes that were emerged by the description of the canned tomato paste production. These approaches were applied in one of the biggest canned production company in Northern Greece that follows the typical production of the targeting product (The main facts and assumptions are presented in the Appendix – Table 3). First, a number of interviews were arranged with key persons in the Production and Quality Assurance departments. Respondents took into account the effects, causes and environmental impact of the seven wastes as depicted in Table 1 and evaluated the processes using four values: Not significant, Low, Medium and High (significance). Data extracted from both departments and referred to the production line of the last 3 years were collected and analyzed. A number of reports were created and given to employees / respondents to make a more reliable evaluation. Table 1 presents and evaluates the processes that were identified with the above criteria according to the responses (modes values are presented).
Table 1. Identifying the processes to be value-streamed
Criteria Process
Inputs / resources
Outputs Agencies
Equipment need
Producers consciousness
Consumers consciousness
Reception M M M H L L First Washing M L L L L L Second Washing M H L L L L Screening M M M L L M Pulping L M L L L L Pre-heating M M M M M M Refining M M L L L L Holding L M L L L L Evaporation H H H H M M Holding L L L L L L Sterilizing/cooling M M M H M M Packaging M M M M M M Storage L L L L L L
764
According to the above findings all the above processes were selected for the development of current and future stream maps (Steps 2 and 3). Step 2: Development of the Current State Map (CSM) of the selected processes. In order to develop the CSM of the examined product, a number of calculations were made in every process that was identified in the previous step. In general, through this step both qualitative and quantitative data were collected for the identification of waste. The data were categorized into two groups: 1) General information including the following issues: cycle time, change over time and up time, processing time for each of the production and logistics tasks performed, reliability of equipment used and availability of such materials as packaging, average waiting time for each order, number of operators, etc., and specific information, which according to www.greensuppliers.gov (n.d.) include the following: pounds of materials used, pounds of hazardous materials used, gallons of water used, gallons of water consumed, watts of energy used (watt-hour per pound of output), BTUS of energy used, pounds of solid waste generated, pounds of hazardous waste generated, pounds of air pollution emitted and gallons of wastewater treated. This study was focused on the environmental aspects of the targeted procedure and was referred to litres of water and energy used (electricity and steam).
Since, the production is already automated no further improvement of the total process time could be achieved. Additionally, since the last 5 years the company have successfully used the make-to-order policy there hasn’t been any stock remaining. The company receives the orders from June to August and produces in September the required quantities. Much effort has been applied in practice by cooperatively working with the tomato producers so as to establish a smooth deliver procedure.
Therefore the study focuses on CO2 emissions and water usage. First, regarding the water usage there are two stages where there is significant water consumption: washing for removing foreign materials (leaves, insects, etc.) and then to remove any residual chemicals from the tomato fruits. In both cases a fixed and predefined quantity of water based on the needs and it is estimated straightforwardly and in an ad-hoc basis. Manufacturer maintained and used a specialized instrument for filtering the water in the above two stages so as to clean the shop-floor areas.
Second, regarding the energy the following table presents the steam and electricity usage.

765
Table 2. Estimating water and energy used
Electricity used (kWh/per production line)
Steam used (% of the total use)
Reception - - First and Second Washing (P-2)/(P-5)
5280 -
Screening (P-8) 5280 - Pulping/Pre-heating (P-10)/(P-12)
19800 30.94
Refining (P-13) 145200 - Holding (P-14) 7260 - Evaporation - 63.39 Holding (P-19) 7260 - Sterilizing/cooling - 5.67 Packaging (P-22)/P-23) 11880 - Storage - -
Figure 2 in the Appendix presents the Current State Map (created with MS Visio).
In the bottom of the map there are three lines that represent: 1) Total lead time and value added time, 2) Amount (litres) of water used (top line) and amount (litres) of water needed (bottom line) per day and per process, 3) kWh’s of energy used (top line) and kWh’s of energy needed (bottom line) per day and per process: for measuring energy consumption a power measuring device (the power consumption of a machine for machining a part or a batch over a particular time in 24 hours) and a data logger were used. Since the examined production process is fully automated and especially from Storage to Packaging, Total Lead Time and Valued Added Time are not considerably different.
Therefore, and based to Table 2, Inventory, Transportation and motion waste, as well as, the Waiting waste are not critical. Furthermore, according to the historical data maintained by the Quality Control company’s department, the Defect level (caused by scrap rate, design error, machine setup, wrong process production and quality protocol assessment) is very low (~0.5% per lot) so this waste is also not critical.
In contrast, there are two processes that have significant environmental impact in terms of water and energy used: Peeling and subsequent washing and pasteurizing. Based on the above the Current State Map (CSM) is created for the examined production process as depicted in the Appendix (Figure 1).
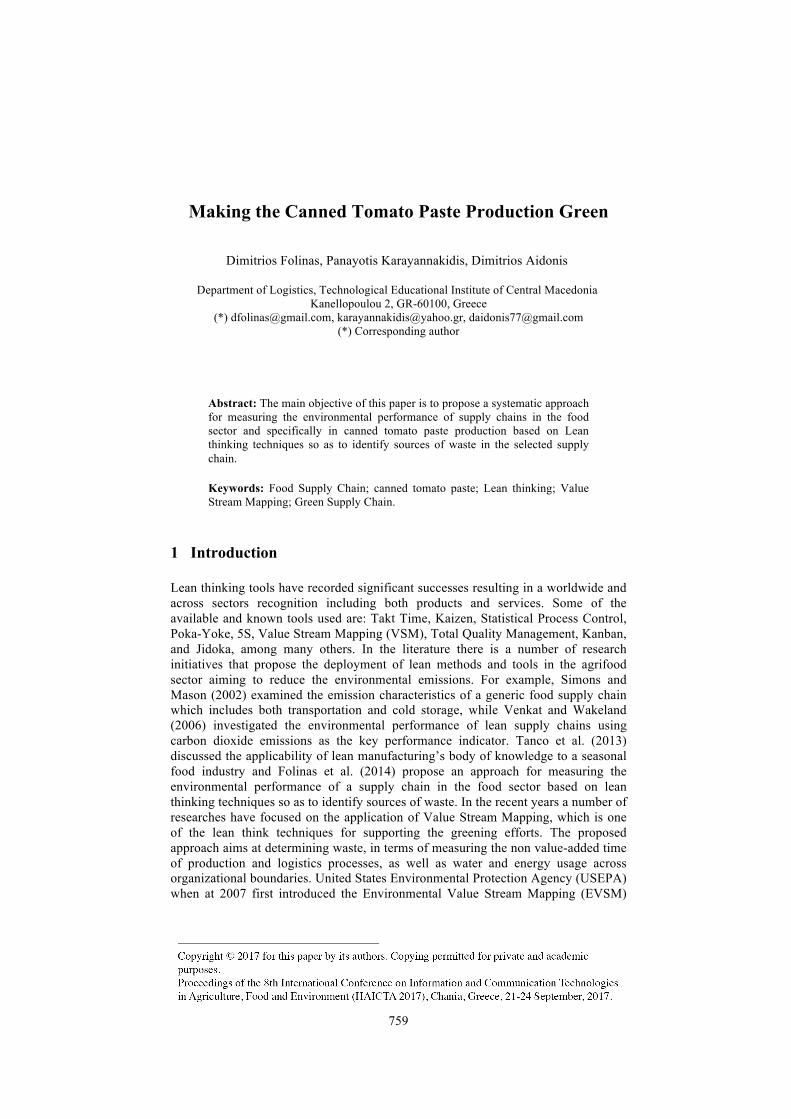
Step 3: Development of the Future State Map. The main objective of this step is the identification of processes with main environmental, health, and safety opportunities on the CSM. But most of all, this step includes the identification of the appropriate practices, technologies and tools in order to minimize waste. According to the findings of the previous step, authors and the two managers of the manufacturer have focused on one waste (S-121), which includes fibres, peels and tomato seeds and three processing steps as follows: the initial stages of tomato fruit washing, essentially carried out in two stages, as well as the stages of hot break and
766
evaporation. Based on the above, the following practices were proposed (Figure 3 in the Appendix).
Among the various stages of a typical production line of canned tomato paste, hot break and evaporation are the most energy consuming. The steam condensate produced by process P-16 along with the steam produced by the evaporator may be used to pre-heat the tomatoes, thus partially covering the energy requirements of the tomato paste production line. Another point to be made is that most of the holding tanks and piping, in the tomato paste canning industries in Greece, are lacking insulation and this is of significant importance for minimizing the energy losses, especially in the stages where heating and cooling are involved. Finally, the by-products generated after refining (P-13).
Step 4: Development of the Action Plan (AP). This step involved the design or drafting of an action plan based on the Future State Map that was created at the previous step. An AP in general includes the following information: 1) First, information regarding the project of the application of the suggested improvements, such as the title and description of the action, its goals and objectives, the responsible process managers / supervisors and the timeframe / scheduling, and 2) Second, information regarding the examined business (production and logistics) processes, such as the title, description, status (not started, in progress, completed), impact, and priority. Table 5 (Action Plan Management of actions) in the Appendix presents the above information.
3 Discussion - Conclusions
This paper provides a perspective of the application of the Lean thinking tools to support the green supply chain and logistics management initiatives. Authors argue that the VSM analysis can be an effective and efficient tool for a number of improvements not only for the identification of the wastes but for the determination of the greening of the agrifood supply chain. It suggests a systematic (four-step) approach that consists of specific tasks and activities. A number of to-do (improvement) practices are proposed. Each of the improvement activities aimed at either eliminating non-value adding steps in order to reduce on the length of the value stream which subsequently would contribute to the reduction of the total process, lead and customer query cycle times and consequently the energy consumption and water usage. The proposed systematic approach was deployed in the canned tomato paste production. After the deployment of the Action Plan (AP) the following achievements have been realized: • Insulation of piping and vessels, where heating or cooling is involved can further
reduce steam consumption and therefore energy usage. • The steam condensate produced during evaporation along with the steam
produced can be used to partially cover the energy requirements during the pre-heating process.
• Finally, the wastes (peels, fibres and tomato seeds) that derive after refining can be used for animal feed.
767
Considering the findings that were observed following the implementation of the pilot project at the examined company, the research project provided viable evidence that these Lean techniques and principles have a positive impact on and that VSM was a workable technique in the production and logistics operations. There are also many challenges that need to be considered for future study regarding the examined sector. Introducing global supply chain management into the green and lean equation increases the potential conflict between the green and lean initiatives. So as companies begin to implement lean and green strategies in supply chains, especially large and complex global supply chains, manufacturers need to explore the overlaps and synergies between quality-based lean and environmentally based ‘green’ initiatives, and understand the various trade-offs required to balance possible points of conflict. Finally, there is a need to evaluate and possibly improve this tool, based on practice and the applicability in other sectors as well.
References
1. Belokar, M., Kumar, V. and Kharb, S. (2012) An Application of Value Stream Mapping In Automotive Industry: A Case Study. International Journal of Innovative Technology and Exploring Engineering, 1, p.152-7.
2. EPA (2007) The Lean and Energy Toolkit. Energy’, 2007;56. 3. Folinas, D., Aidonis D., Triantafillou D., Malindretos G., (2013) Exploring the
greening of the food supply chain with lean thinking techniques, 6th International Conference on Information and Communication Technologies in Agriculture, Food and Environment (HAICTA 2013), Corfu, September 19-22, 2013, Corfu Island, Greece.
4. Folinas, D., Aidonis D., Voulgarakis N., Triantafillou D., (2013) Applying lean thinking techniques in the agrifood supply chain, 1st Logistics International Conference Belgrade, Serbia 28 - 30 November 2013.
5. Lasa, I.S., Laburu, C.O. and Vila, R. de C. (2008) An evaluation of the value stream mapping tool. Business Process Management Journal, 14, p.39-52.
6. Rother, M. and Shook, J. (2003) Learning to see. Cambridge: Lean Enterprise Institute.
7. Simons, D., Mason, R. and Cardiff, U. (2003) Lean and green: doing more with less. ECR Journal, 3, p.84-91.
8. Tanco, M., Santos, J., Rodriguez, J. and Reich, J. (2013) Applying lean techniques to nougat fabrication: a seasonal case study. The International Journal of Advanced Manufacturing Technology, 68, p.1639-54.
9. Venkat, K. and Wakeland, W. (2006) Is Lean Necessarily Green? Proceedings of the 50th Annual Meeting of the ISSS, ISSS 2006 Papers.

768
Appendix Table 3. Facts and assumptions: • Focus on canned tomato paste production • There is no IT system for designing and managing the materials in the production line • Start/End of canned tomato paste production: July – End of September / Working hours: 23 h Approximately 10,500 cans/production
line/h are produced. Each can weighs 1 kg • Factory operates: 60 days x 23 h/day = 1380 h • Assuming that all engines have an average performance of 80% • Reception: 45 lorries / 21 tn on a daily basis / packaging materials are procured from local producers • 90% of the total orders are exported / no problems associated with over-production Processing step Number of
employees Processing time (min/tn)
Installed capacity
Energy consumption (per tn) Oil and electricity
Scrap (%)
Reception 4 10-15΄ - - N/A First washing 3 1΄ 4 kW - Soil, leaves, insects Second washing 3 1.5΄ 4 kW - N/A Screening 4 2΄ 4 kW - Ν/Α Pulping 1 2.5΄ 15 kW motor - N/A Pre-heating 1 1.5΄ - 30.94% of steam consumed N/A Refining 1 1΄ 4 Kw - Peels, fibers etc. Holding 0 6΄ - - N/A Evaporation 1 5΄ - 63.39 of steam consumed N/A Holding 0 10΄ - - N/A Sterilizing/cooling 1 1.5΄ - 5.67 of steam consumed N/A Packaging 2 1΄ 6,4 kW - N/A Storage 1 - - - N/A Total

769
Tomato Reception
Empl.: 4Time: 10-15'
Hydro-transport
Empl.: 3Time: 1'
Second washing
Empl.: 3Time: 1,5'
Screening
Empl.: 4Time: 2'
Pulping
Empl.: 1Time: 2,5'
Pre-heating
Empl.: 1Time:1,5'
Refining
Empl.: 1lTime: 1'
Holding
Empl.: -Time: 6'
Evapo-ration
Empl.: 1Time: 5'
Holding
Empl.: -Time: 10'
Sterilizing /cooling
Empl.: 1Time: 11,5'
Packaging
Empl.: 2Time: 1'
Storage
Empl.: 1Time: 0
Electricity used
Electricity neededTotal Electricity used (kwh/per production line)
FarmersCustomers /
retailers
Production Schedule
700 tn / month(via 25 tn silo vehicles)
Receipt
~1000 tn / monthVia lorries
Final product Warehouse
Daily s
ched
ule
Steam used
Steam needed
Total Electricity needed (kwh/per production line)
Total Steam used (% of the total use)Total Steam needed (% of the total use)
Make to order practicesOrder-by-Order(Pure Pull philosophy)
5,280 kWh 5,280 kWh[19,800kWh]
145,200 kWh
19,800kWh
7,200kWh
7,200kWh
11,880kWh
30,94% [30,94%] 60,39% 5,67%
2,600 kWh 2,600 kWh 82,600 kWh 6,000 kWh 2,500 kWh2500 kWh
Fig. 1. Current State Map

770
Tomato Reception
Empl.: 4Time: 10-15'
Hydro-transport
Empl.: 3Time: 1'
Second washing
Empl.: 3Time: 1,5'
Screening
Empl.: 4Time: 2'
Pulping
Empl.: 1Time: 2,5'
Pre-heating
Empl.: 1Time:1,5'
Refining
Empl.: 1lTime: 1'
Holding
Empl.: -Time: 6'
Evapo-ration
Empl.: 1Time: 5'
Holding
Empl.: -Time: 10'
Sterilizing /cooling
Empl.: 1Time: 11,5'
Packaging
Empl.: 2Time: 1'
Storage
Empl.: 1Time: 0
Electricity used
Electricity neededTotal Electricity used (kwh/per production line)
FarmersCustomers /
retailers
Production Schedule
700 tn / month(via 25 tn silo vehicles)
Receipt
~1000 tn / monthVia lorries
Final product Warehouse
Daily s
ched
ule
Steam used
Steam needed
Total Electricity needed (kwh/per production line)
Total Steam used (% of the total use)Total Steam needed (% of the total use)
Make to order practicesOrder-by-Order(Pure Pull philosophy)
5,280 kWh 5,280 kWh[19,800kWh]
145,200 kWh
19,800kWh
7,200kWh
7,200kWh
11,880kWh
30,94% [30,94%] 60,39% 5,67%
2,600 kWh 2,600 kWh 82,600 kWh 6,000 kWh 2,500 kWh2500 kWh
Recycling of water
Recycling of water
Utilization
Insulation
Insulation
Fig. 2. Future State Map

771
Table 4. Action Plan Management of actions
Title / Area Description Action Impact
L=Low M=Medium H=High
Priority 1=Low 2=Medium 3=High
Supervisor Time scheduling
Status N=not started I=in progress C=completed
Production 1st and 2ndWashing Recycling of water recovered after the first washing and hydrotransport
L 1 Production Manager
C
Production Refining Utilization of peels, fibers and tomato seeds for animal feed
M 2 Production Manager
I
Production Evaporation Utilization of steam and steam condensate in the pre-heating process to minimize the energy requirements and develop and energy efficiency production line
H 3 Production manager
I
Production First holding Insulation of holding tank and piping H 3 Production Manager
C
Production Second holding Insulation of holding tank and piping H 3 Production manager
C