Making the Board Smile with HPE Business Value Dashboard · Making the Board Smile with ... Making...
17
1 Making the Board Smile with HPE Business Value Dashboard A new real time editorial that helps IT Operations become a more strategic business partner March 2016 In this issue 3 Making the Board Smile with HPE Business Value Dashboard 11 I&O Leaders Must Gain Influence With Business Leaders by Reporting on Business Value 17 About Hewlett Packard Enterprise
Transcript of Making the Board Smile with HPE Business Value Dashboard · Making the Board Smile with ... Making...
1
Making the Board Smile with HPE Business Value Dashboard A new real time editorial that helps IT Operations become a more strategic business partner
March 2016
In this issue
3 Making the Board Smile with HPE Business Value Dashboard
11 I&O Leaders Must Gain Influence With Business Leaders by Reporting on Business Value
17 About Hewlett Packard Enterprise
2
In this issue
Making the Board Smile with HPE Business Value Dashboard 3
Introduction 3
Why you need a real time editorial 4
So what can be done and who can provide it? 4
What is needed to build a Business Value Dashboard 5
Which data should be chosen 8
Making it real 8
What does HPE provide 9
Getting Started with the HPE Business Value Dashboard 10
I&O Leaders Must Gain Influence With Business Leaders by Reporting on Business Value 11
Deploy or Plan to Deploy I&O BVDs to Better Frame and Communicate I&O’s Value to Business Leaders 13
I&O Leaders Must Report Both Business-Related and Operational Metrics to the CIO 14
Map the I&O Metrics to Business Value With the I&O BVM 14
Designate an I&O Finance Person Reporting to I&O Management Who Is Also Engaged With Finance Personnel From the Business 15
About Hewlett Packard Enterprise 17
Contact us 17

3
Making the Board Smile with HPE Business Value Dashboard
IntroductionHeadline news. Read all about it.
News in black and white print? How many of us stare at our tablets
and various screens to get the news.
We devour it real time, love it when the kids, parents, friends send us
the latest.
It’s life today. Except in IT operations
Let’s face it how hard can it be to actually see what’s happening now.
IT Service performance slipping badly? You can’t possibly depend on
users calling you to find that out.
Is IT cloudy? Well service measurements are a vital way to either see if
you’re delivering what you promised or you’re receiving what the SLA
you purchased said you would. If that doesn’t happen, well you’re only
as good as your weakest link!
In fact today more and more entities are exploiting Hybrid cloud
technologies so both of these aspects affect them.
As far as we can remember, IT operations teams have used some form
of reporting tool. At the same time line of business managers and
CIOs have been provided with various forms of executive reports.
But they have their limits and it’s really too late if they tell you what
happened in the last crash, or that an abnormal number of your
customers just shifted to a competitor. That’s yesterday’s news.
As in our private lives, we need to know faster, “live” what’s happening
now. Even better learn what is going to happen soon which predictive
analysis can tell you.
Just as black and white printed news isn’t the norm anymore, the way
IT provides “news” has to evolve.
4
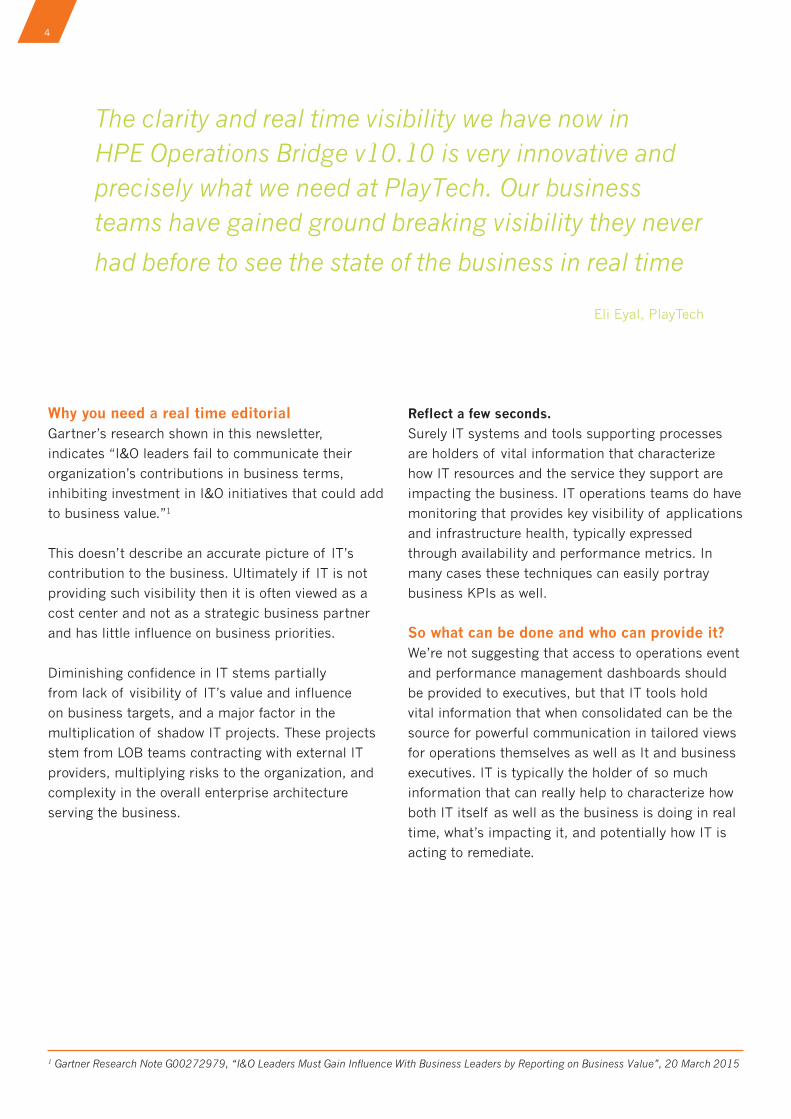
Why you need a real time editorialGartner’s research shown in this newsletter,
indicates “I&O leaders fail to communicate their
organization’s contributions in business terms,
inhibiting investment in I&O initiatives that could add
to business value.”1
This doesn’t describe an accurate picture of IT’s
contribution to the business. Ultimately if IT is not
providing such visibility then it is often viewed as a
cost center and not as a strategic business partner
and has little influence on business priorities.
Diminishing confidence in IT stems partially
from lack of visibility of IT’s value and influence
on business targets, and a major factor in the
multiplication of shadow IT projects. These projects
stem from LOB teams contracting with external IT
providers, multiplying risks to the organization, and
complexity in the overall enterprise architecture
serving the business.
Reflect a few seconds.
Surely IT systems and tools supporting processes
are holders of vital information that characterize
how IT resources and the service they support are
impacting the business. IT operations teams do have
monitoring that provides key visibility of applications
and infrastructure health, typically expressed
through availability and performance metrics. In
many cases these techniques can easily portray
business KPIs as well.
So what can be done and who can provide it?We’re not suggesting that access to operations event
and performance management dashboards should
be provided to executives, but that IT tools hold
vital information that when consolidated can be the
source for powerful communication in tailored views
for operations themselves as well as It and business
executives. IT is typically the holder of so much
information that can really help to characterize how
both IT itself as well as the business is doing in real
time, what’s impacting it, and potentially how IT is
acting to remediate.
1 Gartner Research Note G00272979, “I&O Leaders Must Gain Influence With Business Leaders by Reporting on Business Value”, 20 March 2015
The clarity and real time visibility we have now in HPE Operations Bridge v10.10 is very innovative and precisely what we need at PlayTech. Our business teams have gained ground breaking visibility they never
had before to see the state of the business in real time
Eli Eyal, PlayTech
5
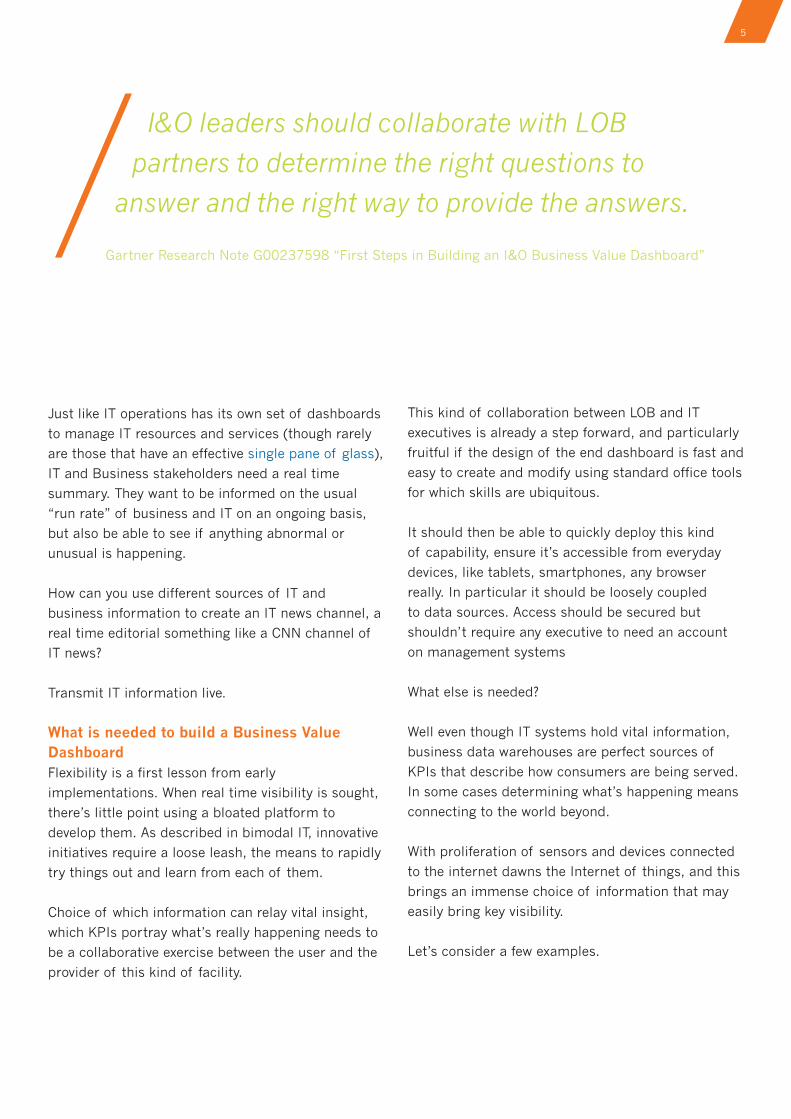
Just like IT operations has its own set of dashboards
to manage IT resources and services (though rarely
are those that have an effective single pane of glass),
IT and Business stakeholders need a real time
summary. They want to be informed on the usual
“run rate” of business and IT on an ongoing basis,
but also be able to see if anything abnormal or
unusual is happening.
How can you use different sources of IT and
business information to create an IT news channel, a
real time editorial something like a CNN channel of
IT news?
Transmit IT information live.
What is needed to build a Business Value DashboardFlexibility is a first lesson from early
implementations. When real time visibility is sought,
there’s little point using a bloated platform to
develop them. As described in bimodal IT, innovative
initiatives require a loose leash, the means to rapidly
try things out and learn from each of them.
Choice of which information can relay vital insight,
which KPIs portray what’s really happening needs to
be a collaborative exercise between the user and the
provider of this kind of facility.
This kind of collaboration between LOB and IT
executives is already a step forward, and particularly
fruitful if the design of the end dashboard is fast and
easy to create and modify using standard office tools
for which skills are ubiquitous.
It should then be able to quickly deploy this kind
of capability, ensure it’s accessible from everyday
devices, like tablets, smartphones, any browser
really. In particular it should be loosely coupled
to data sources. Access should be secured but
shouldn’t require any executive to need an account
on management systems
What else is needed?
Well even though IT systems hold vital information,
business data warehouses are perfect sources of
KPIs that describe how consumers are being served.
In some cases determining what’s happening means
connecting to the world beyond.
With proliferation of sensors and devices connected
to the internet dawns the Internet of things, and this
brings an immense choice of information that may
easily bring key visibility.
Let’s consider a few examples.
I&O leaders should collaborate with LOB
partners to determine the right questions to
answer and the right way to provide the answers.
Gartner Research Note G00237598 “First Steps in Building an I&O Business Value Dashboard”
6
Source: Hewlett Packard Enterprise (HPE) | France
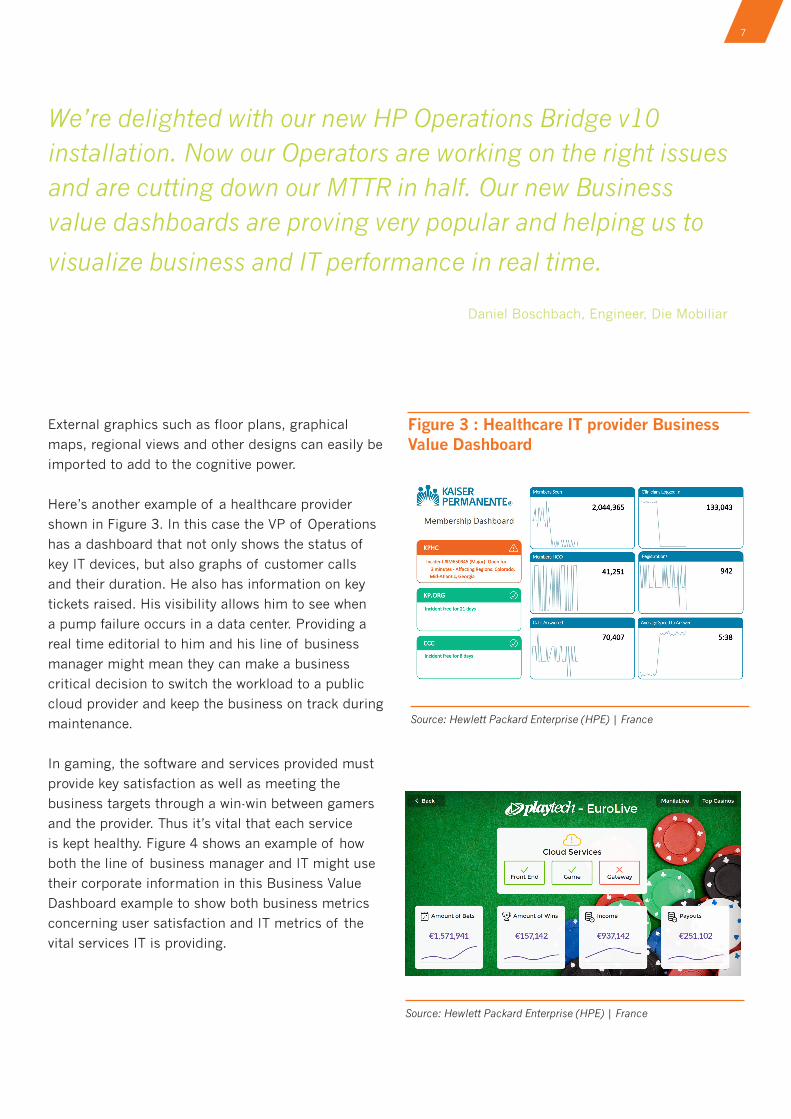
Figure 2. FSI Executive Business Value Dashboard with live TV channel
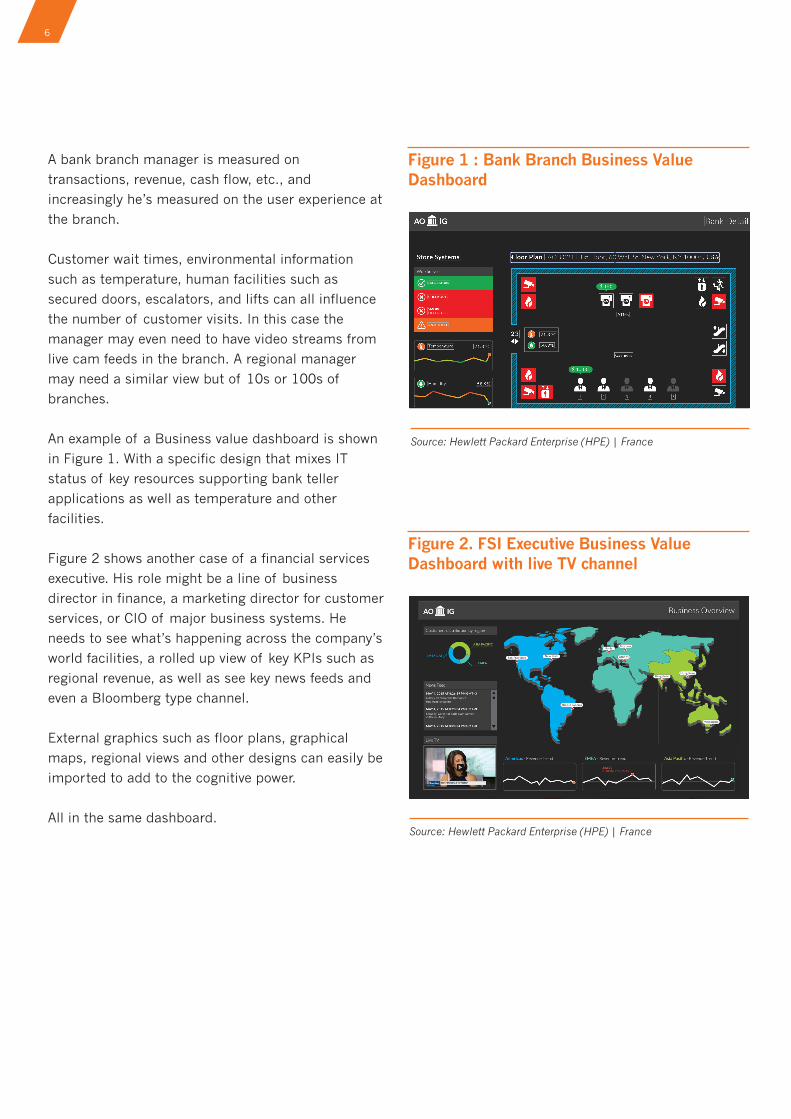
A bank branch manager is measured on
transactions, revenue, cash flow, etc., and
increasingly he’s measured on the user experience at
the branch.
Customer wait times, environmental information
such as temperature, human facilities such as
secured doors, escalators, and lifts can all influence
the number of customer visits. In this case the
manager may even need to have video streams from
live cam feeds in the branch. A regional manager
may need a similar view but of 10s or 100s of
branches.
An example of a Business value dashboard is shown
in Figure 1. With a specific design that mixes IT
status of key resources supporting bank teller
applications as well as temperature and other
facilities.
Figure 2 shows another case of a financial services
executive. His role might be a line of business
director in finance, a marketing director for customer
services, or CIO of major business systems. He
needs to see what’s happening across the company’s
world facilities, a rolled up view of key KPIs such as
regional revenue, as well as see key news feeds and
even a Bloomberg type channel.
External graphics such as floor plans, graphical
maps, regional views and other designs can easily be
imported to add to the cognitive power.
All in the same dashboard.
Source: Hewlett Packard Enterprise (HPE) | France
Figure 1 : Bank Branch Business Value Dashboard
7
Source: Hewlett Packard Enterprise (HPE) | France
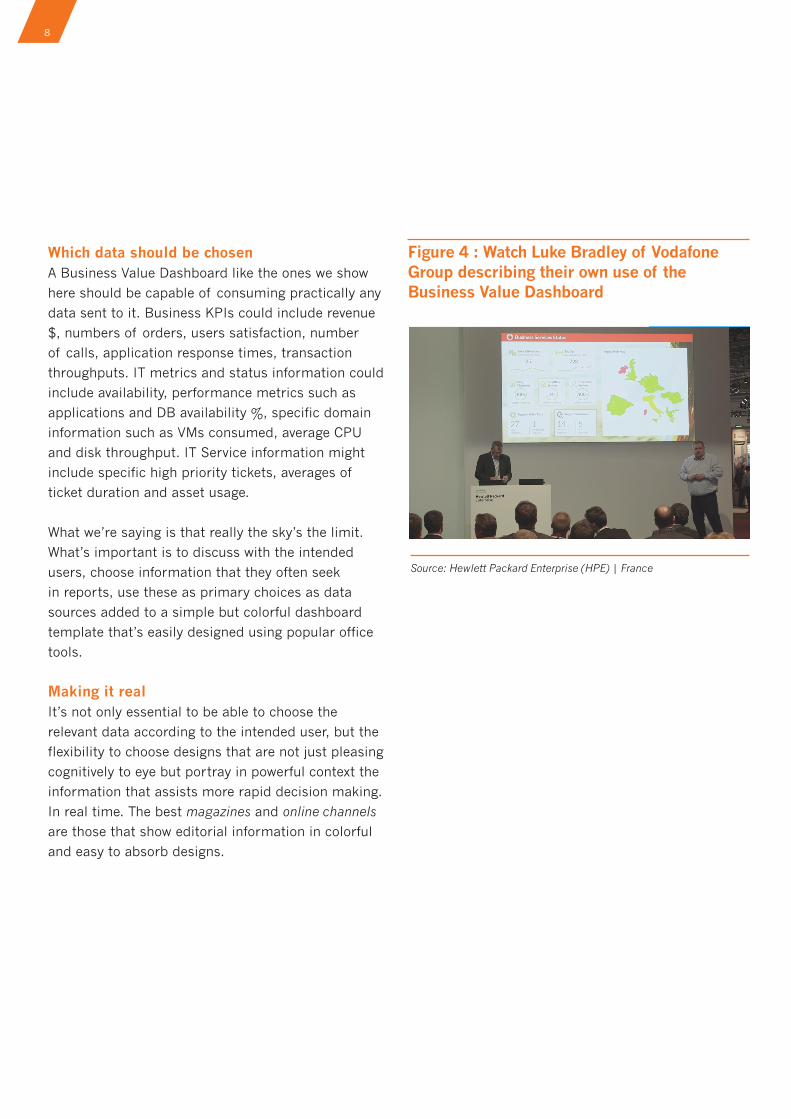
Figure 3 : Healthcare IT provider Business Value Dashboard
Source: Hewlett Packard Enterprise (HPE) | France
External graphics such as floor plans, graphical
maps, regional views and other designs can easily be
imported to add to the cognitive power.
Here’s another example of a healthcare provider
shown in Figure 3. In this case the VP of Operations
has a dashboard that not only shows the status of
key IT devices, but also graphs of customer calls
and their duration. He also has information on key
tickets raised. His visibility allows him to see when
a pump failure occurs in a data center. Providing a
real time editorial to him and his line of business
manager might mean they can make a business
critical decision to switch the workload to a public
cloud provider and keep the business on track during
maintenance.
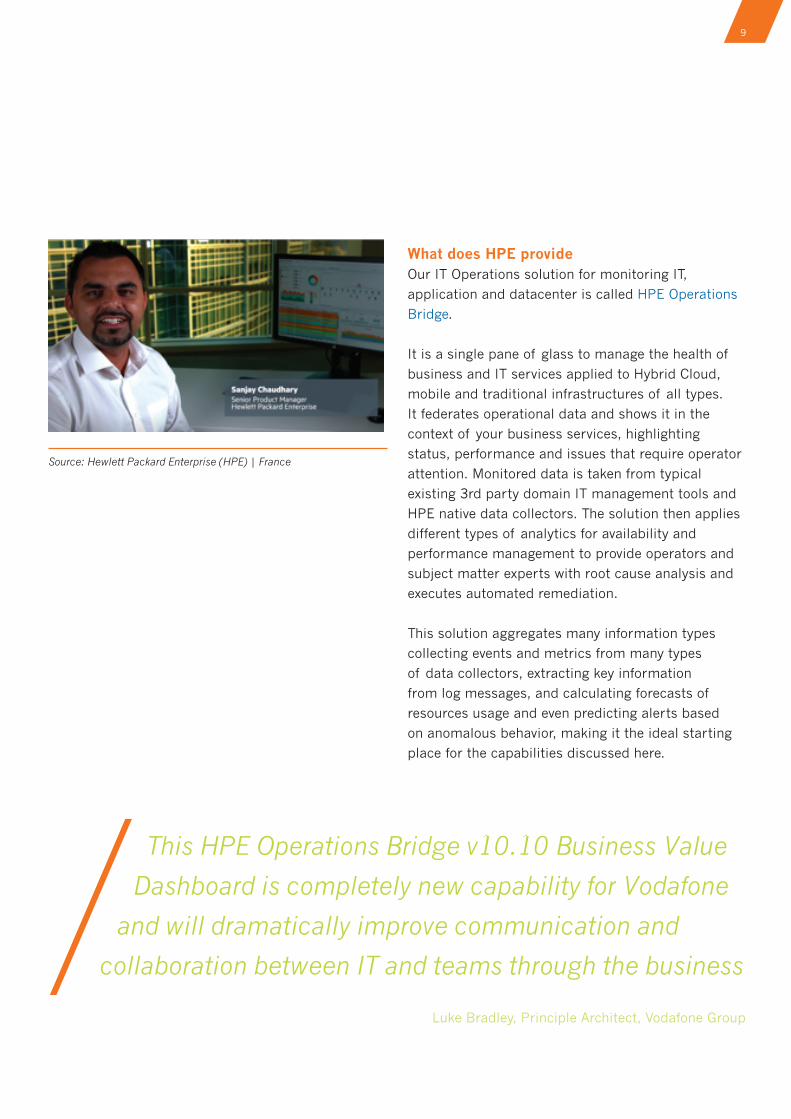
In gaming, the software and services provided must
provide key satisfaction as well as meeting the
business targets through a win-win between gamers
and the provider. Thus it’s vital that each service
is kept healthy. Figure 4 shows an example of how
both the line of business manager and IT might use
their corporate information in this Business Value
Dashboard example to show both business metrics
concerning user satisfaction and IT metrics of the
vital services IT is providing.
We’re delighted with our new HP Operations Bridge v10 installation. Now our Operators are working on the right issues and are cutting down our MTTR in half. Our new Business value dashboards are proving very popular and helping us to
visualize business and IT performance in real time.
Daniel Boschbach, Engineer, Die Mobiliar
8
Which data should be chosenA Business Value Dashboard like the ones we show
here should be capable of consuming practically any
data sent to it. Business KPIs could include revenue
$, numbers of orders, users satisfaction, number
of calls, application response times, transaction
throughputs. IT metrics and status information could
include availability, performance metrics such as
applications and DB availability %, specific domain
information such as VMs consumed, average CPU
and disk throughput. IT Service information might
include specific high priority tickets, averages of
ticket duration and asset usage.
What we’re saying is that really the sky’s the limit.
What’s important is to discuss with the intended
users, choose information that they often seek
in reports, use these as primary choices as data
sources added to a simple but colorful dashboard
template that’s easily designed using popular office
tools.
Making it realIt’s not only essential to be able to choose the
relevant data according to the intended user, but the
flexibility to choose designs that are not just pleasing
cognitively to eye but portray in powerful context the
information that assists more rapid decision making.
In real time. The best magazines and online channels
are those that show editorial information in colorful
and easy to absorb designs.
Source: Hewlett Packard Enterprise (HPE) | France
Figure 4 : Watch Luke Bradley of Vodafone Group describing their own use of the Business Value Dashboard
9
What does HPE provideOur IT Operations solution for monitoring IT,
application and datacenter is called HPE Operations
Bridge.
It is a single pane of glass to manage the health of
business and IT services applied to Hybrid Cloud,
mobile and traditional infrastructures of all types.
It federates operational data and shows it in the
context of your business services, highlighting
status, performance and issues that require operator
attention. Monitored data is taken from typical
existing 3rd party domain IT management tools and
HPE native data collectors. The solution then applies
different types of analytics for availability and
performance management to provide operators and
subject matter experts with root cause analysis and
executes automated remediation.
This solution aggregates many information types
collecting events and metrics from many types
of data collectors, extracting key information
from log messages, and calculating forecasts of
resources usage and even predicting alerts based
on anomalous behavior, making it the ideal starting
place for the capabilities discussed here.
Source: Hewlett Packard Enterprise (HPE) | France
This HPE Operations Bridge v10.10 Business Value
Dashboard is completely new capability for Vodafone
and will dramatically improve communication and
collaboration between IT and teams through the business
Luke Bradley, Principle Architect, Vodafone Group
10
Source: Hewlett Packard Enterprise (HPE) | France
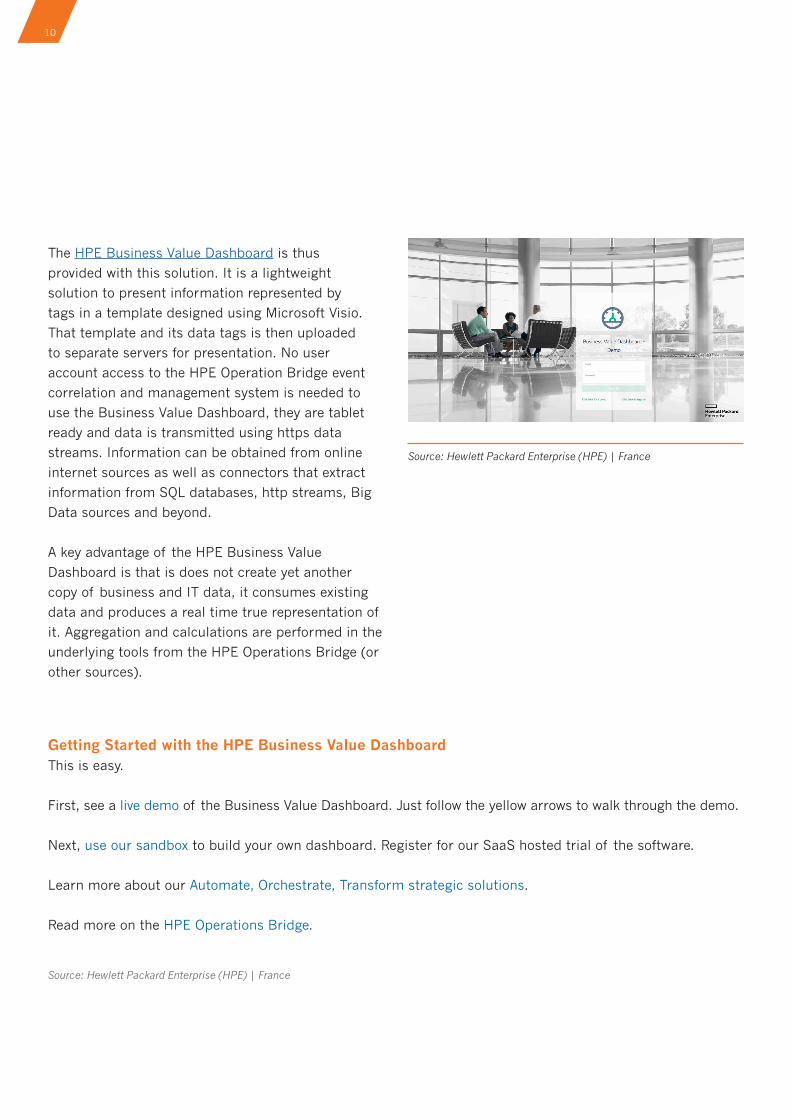
The HPE Business Value Dashboard is thus
provided with this solution. It is a lightweight
solution to present information represented by
tags in a template designed using Microsoft Visio.
That template and its data tags is then uploaded
to separate servers for presentation. No user
account access to the HPE Operation Bridge event
correlation and management system is needed to
use the Business Value Dashboard, they are tablet
ready and data is transmitted using https data
streams. Information can be obtained from online
internet sources as well as connectors that extract
information from SQL databases, http streams, Big
Data sources and beyond.
A key advantage of the HPE Business Value
Dashboard is that is does not create yet another
copy of business and IT data, it consumes existing
data and produces a real time true representation of
it. Aggregation and calculations are performed in the
underlying tools from the HPE Operations Bridge (or
other sources).
Getting Started with the HPE Business Value DashboardThis is easy.
First, see a live demo of the Business Value Dashboard. Just follow the yellow arrows to walk through the demo.
Next, use our sandbox to build your own dashboard. Register for our SaaS hosted trial of the software.
Learn more about our Automate, Orchestrate, Transform strategic solutions.
Read more on the HPE Operations Bridge.
Source: Hewlett Packard Enterprise (HPE) | France
11
Linking what I&O does with how business leaders
perceive its added value remains elusive. By
reporting on business value, I&O leaders can bridge
this gap and refine the perception of IT from cost
center to valued business partner.
Key Challenges ■ I&O is often viewed as a cost center and not as a
strategic business partner.
■ I&O leaders fail to communicate their
organization’s contributions in business terms,
inhibiting investment in I&O initiatives that could
add to business value.
■ I&O has little influence on business decisions.
■ I&O leaders focus on the cost of IT, because I&O
is viewed as a cost center, rather than the value
provided to the enterprise.
Recommendations ■ Deploy I&O business value dashboards (BVDs)
to better frame and communicate I&O’s value to
business leaders.
■ Report business-related metrics, in addition to
operational metrics, to the CIO and the business.
■ Map I&O metrics to the business metrics they
impact using the I&O business value map (BVM).
■ Designate an I&O finance person reporting to
I&O management.
Research From Gartner:
I&O Leaders Must Gain Influence With Business Leaders by Reporting on Business Value
12
Linking what I&O does with how business leaders
perceive its added value remains elusive. By
reporting on business value, I&O leaders can bridge
this gap and refine the perception of IT from cost
center to valued business partner.
Key Challenges ■ I&O is often viewed as a cost center and not as a
strategic business partner.
■ I&O leaders fail to communicate their
organization’s contributions in business terms,
inhibiting investment in I&O initiatives that could
add to business value.
■ I&O has little influence on business decisions.
■ I&O leaders focus on the cost of IT, because I&O
is viewed as a cost center, rather than the value
provided to the enterprise.
Recommendations ■ Deploy I&O business value dashboards (BVDs)
to better frame and communicate I&O’s value to
business leaders.
■ Report business-related metrics, in addition to
operational metrics, to the CIO and the business.
■ Map I&O metrics to the business metrics they
impact using the I&O business value map (BVM).
■ Designate an I&O finance person reporting to
I&O management.
Strategic Planning Assumption ■ By 2017, 25% of mature I&O organizations
(where the ITScore for I&O is three or higher)
will invest in discrete BVD tools as the primary
means of communicating to the business, up
from the midteens today.
IntroductionInfrastructure and operations (I&O) continues to
command most of the total IT budget. That puts this
group in a unique position to impact the dialogue
between IT and business leaders. In our 2014
survey of more than 2,800 CIOs, 73% indicated
they use financial value as an IT performance
metric.1 However, according to the more than 2,000
responses to our I&O ITScore query, only 11%
of organizations are in a position to make value
statements regarding I&O performance. This creates
an interesting conundrum for I&O leaders. The
CIO needs to convey value to business leaders but
currently lacks the ability to do so in the business’s
language. This contributes to the perception of IT in
general, and I&O in particular, of making operational
— but not strategic — contributions. If the status
quo is maintained, I&O will fail to be viewed as a
strategic partner to the business and will continue
to be viewed as the organization that just “keeps the
lights on.” Changing the nature of the conversation
will allow IT, and therefore I&O, to have greater
influence at senior management levels.
13
AnalysisThe dialogue between IT and the business remains
suboptimal — most IT staff simply do not have
the skills to speak the same language as business
leaders. Most CIOs would like to use financial
value as an IT performance metric, but very few
possess the organizational maturity to make
value statements regarding I&O’s performance.2
Because of I&O’s dominance over the IT budget,
it must provide what the CIO needs to bridge that
communication gap, thereby leading the transition
from support organization to valued business
partner. This research outlines four steps to bridge
that gap through the reporting of business value and
other best practices.
Deploy or Plan to Deploy I&O BVDs to Better Frame and Communicate I&O’s Value to Business LeadersI&O leaders have a significant opportunity to build
the credibility of IT and the CIO as contributors to
business success. However, the CIO and I&O leaders
often do not demonstrate their business, financial
and performance management competencies. The
result is that I&O continues to be viewed as a cost
center and does not help raise the maturity and
reputation of IT. This view of the demonstrated
competencies can start to shift if I&O leaders can
communicate department results in more business-
centric language that will then enable the CIO to
convey how I&O contributes to business objectives.
An examination of survey and ITScore Maturity
Assessment data yields some very interesting
findings relative to the perception of CIOs within
business organizations. Some of these findings deal
with how the CIO is perceived by the organization’s
business leaders.3
Findings from the survey include:
■ 50% of CIOs report their enterprises “never
or rarely” manage to be explicit about leading
performance measures, making them unable to
articulate the vision for achieving strategic goals.
■ 60% of CIOs report they regularly present
the IT organization’s priorities to the chief
executive (access) to ensure consistency with
business objectives, but 49% report they have
little to no formal capability for ensuring their
plans are consistent with business expectations
(influence).
I&O leaders lack influence because CIOs do not
have significant influence over business decisions.
As discussed in a recent Gartner report, a dearth of
business, financial and performance management
competencies is the greatest inhibiting factor for CIO
influence and credibility.
I&O BVDs have the potential to bridge the gap
between I&O and business leaders. By taking the
appropriately aligned operational metrics with which
I&O leaders are familiar (and that are reported to
the CIO) and translating them to relevant business-
centric metrics, the message of IT as a business
partner can be better articulated. Moreover, through
the process, the CIO and I&O leaders build a better
understanding and competency in business, financial
and performance management.
Gartner has produced specific research regarding
I&O BVDs. Guidance is helpful and initial steps
are important. In addition, several vendors have
established products in this particular area and
address various capabilities helpful in establishing a
BVD.
14
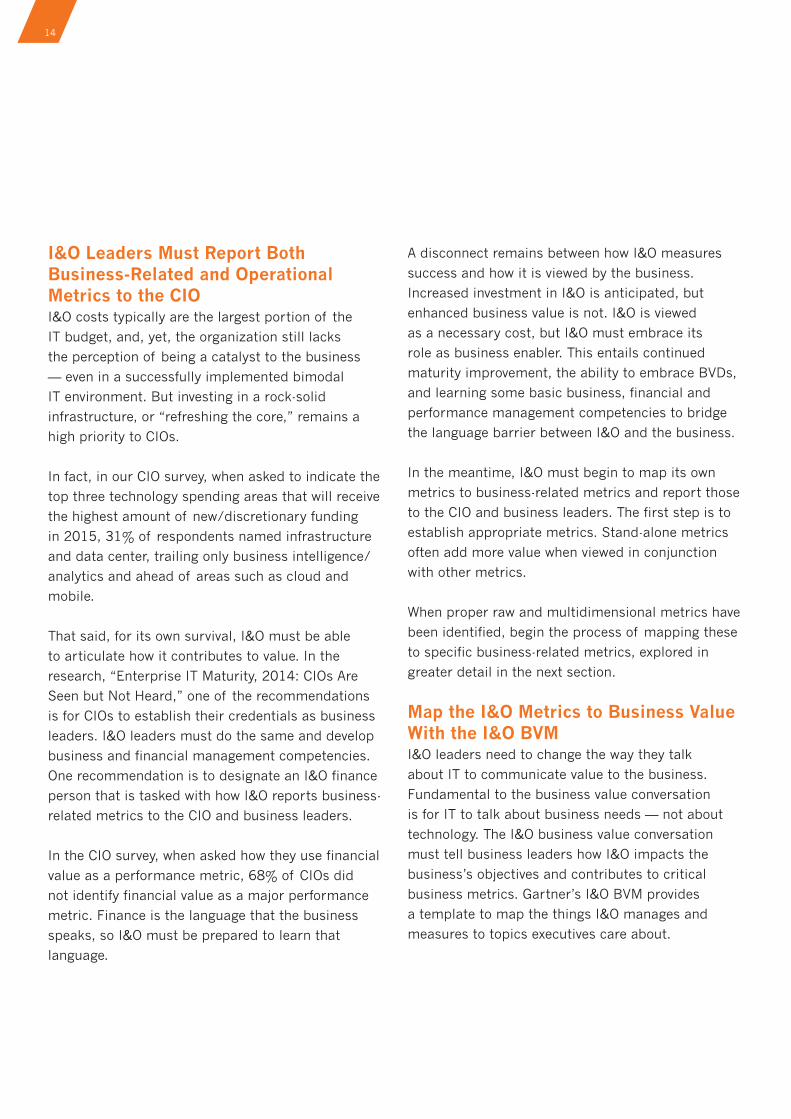
I&O Leaders Must Report Both Business-Related and Operational Metrics to the CIOI&O costs typically are the largest portion of the
IT budget, and, yet, the organization still lacks
the perception of being a catalyst to the business
— even in a successfully implemented bimodal
IT environment. But investing in a rock-solid
infrastructure, or “refreshing the core,” remains a
high priority to CIOs.
In fact, in our CIO survey, when asked to indicate the
top three technology spending areas that will receive
the highest amount of new/discretionary funding
in 2015, 31% of respondents named infrastructure
and data center, trailing only business intelligence/
analytics and ahead of areas such as cloud and
mobile.
That said, for its own survival, I&O must be able
to articulate how it contributes to value. In the
research, “Enterprise IT Maturity, 2014: CIOs Are
Seen but Not Heard,” one of the recommendations
is for CIOs to establish their credentials as business
leaders. I&O leaders must do the same and develop
business and financial management competencies.
One recommendation is to designate an I&O finance
person that is tasked with how I&O reports business-
related metrics to the CIO and business leaders.
In the CIO survey, when asked how they use financial
value as a performance metric, 68% of CIOs did
not identify financial value as a major performance
metric. Finance is the language that the business
speaks, so I&O must be prepared to learn that
language.
A disconnect remains between how I&O measures
success and how it is viewed by the business.
Increased investment in I&O is anticipated, but
enhanced business value is not. I&O is viewed
as a necessary cost, but I&O must embrace its
role as business enabler. This entails continued
maturity improvement, the ability to embrace BVDs,
and learning some basic business, financial and
performance management competencies to bridge
the language barrier between I&O and the business.
In the meantime, I&O must begin to map its own
metrics to business-related metrics and report those
to the CIO and business leaders. The first step is to
establish appropriate metrics. Stand-alone metrics
often add more value when viewed in conjunction
with other metrics.
When proper raw and multidimensional metrics have
been identified, begin the process of mapping these
to specific business-related metrics, explored in
greater detail in the next section.
Map the I&O Metrics to Business Value With the I&O BVMI&O leaders need to change the way they talk
about IT to communicate value to the business.
Fundamental to the business value conversation
is for IT to talk about business needs — not about
technology. The I&O business value conversation
must tell business leaders how I&O impacts the
business’s objectives and contributes to critical
business metrics. Gartner’s I&O BVM provides
a template to map the things I&O manages and
measures to topics executives care about.
15
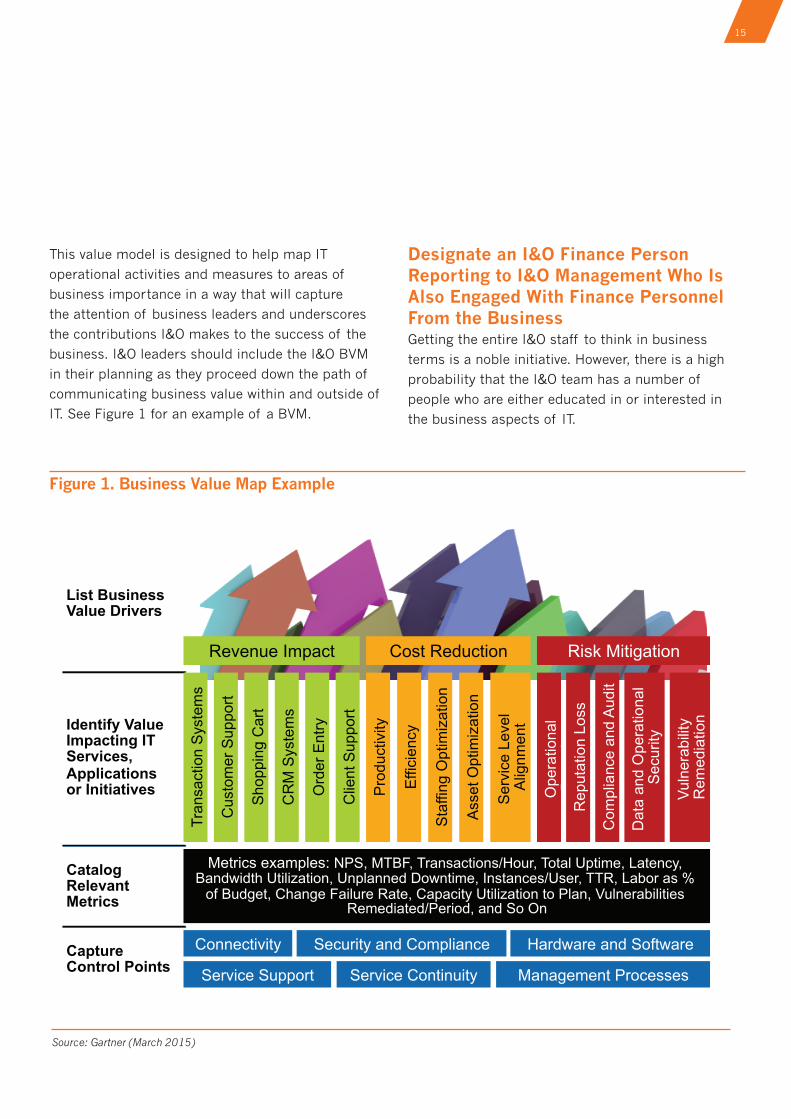
This value model is designed to help map IT
operational activities and measures to areas of
business importance in a way that will capture
the attention of business leaders and underscores
the contributions I&O makes to the success of the
business. I&O leaders should include the I&O BVM
in their planning as they proceed down the path of
communicating business value within and outside of
IT. See Figure 1 for an example of a BVM.
Designate an I&O Finance Person Reporting to I&O Management Who Is Also Engaged With Finance Personnel From the BusinessGetting the entire I&O staff to think in business
terms is a noble initiative. However, there is a high
probability that the I&O team has a number of
people who are either educated in or interested in
the business aspects of IT.
0
List Business Value Drivers
Identify Value Impacting IT Services, Applications or Initiatives
Metrics examples: NPS, MTBF, Transactions/Hour, Total Uptime, Latency, Bandwidth Utilization, Unplanned Downtime, Instances/User, TTR, Labor as %
of Budget, Change Failure Rate, Capacity Utilization to Plan, Vulnerabilities Remediated/Period, and So On
Catalog Relevant Metrics
Capture Control Points
Connectivity
troppuS ecivreS Management Processes
Hardware and Software Security and Compliance
Service Continuity
tcapmI euneveR
Tran
sact
ion
Sys
tem
s
Ord
er E
ntry
traC gnippoh
S CR
M S
yste
ms
troppuS re
motsuC
troppuS tneil
C
Cost Reduction
Pro
duct
ivity
Effi
cien
cy
Sta
ffing
Opt
imiz
atio
n
Ass
et O
ptim
izat
ion
Ser
vice
Lev
el
tnemngil
A
Risk Mitigation
Vuln
erab
ility
R
emed
iatio
n
Ope
ratio
nal
Dow
ntim
e R
eput
atio
n Lo
ss
tiduA dna ecnailp
moC D
ata
and
Ope
ratio
nal
Sec
urity
Source: Gartner (March 2015)
Figure 1. Business Value Map Example
There needs to be a point person on the I&O team
for this initiative. Not only do metrics with business-
related value need to be defined and/or identified,
this can only be done effectively in communication
with the lines of business themselves.
Potential candidates for this role could be
those involved in existing business relationship
management efforts or, conceivably, business
analysts from outside of IT to build the internal
talent base.
Specific responsibilities of this role might include:
■ Establishing regular communications with
internal business customers.
■ Guiding the I&O team in determining appropriate
metrics.
■ Verifying that I&O metrics align with business-
related metrics.
■ Testing the assumptions that lead to business
value (for example, does an hour of downtime
really cost that amount of money?).
■ Evangelizing the needs of the business, as
measured by how the business leaders are
measured, to I&O.
Evidence1 Gartner’s 2014 Annual CIO Survey, which
included 2,810 CIO respondents from 84
countries, representing $12.1 trillion in revenues
and $397 billion in IT spend.
2 Gartner’s 4Q14 ITScore for I&O, which included
2,289 respondents; 89% indicated they were
below level three, the level at which maturity is
sufficient to relate to business value.
3 “Enterprise IT Maturity, 2014: CIOs Are Seen but
Not Heard,” survey data collected from more than
2,800 CIOs and research of Gartner’s ITScore
data between 2010 and 2014.
Source: Gartner Research G00272979, Gary Spivak, Jeffrey M. Brooks, Robert Naegle, 20 March 2015
17
Making the Board Smile with HPE Business Value Dashboard is published by Hewlett Packard Enterprise (HPE) | France. Editorial content supplied by Hewlett Packard Enterprise (HPE) | France is independent of Gartner analysis. All Gartner research is used with Gartner’s permission, and was originally published as part of Gartner’s syndicated research service available to all entitled Gartner clients. © 2016 Gartner, Inc. and/or its affiliates. All rights reserved. The use of Gartner research in this publication does not indicate Gartner’s endorsement of Hewlett Packard Enterprise (HPE) | France’s products and/or strategies. Reproduction or distribution of this publication in any form without Gartner’s prior written permission is forbidden. The information contained herein has been obtained from sources believed to be reliable. Gartner disclaims all warranties as to the accuracy, completeness or adequacy of such information. The opinions expressed herein are subject to change without notice. Although Gartner research may include a discussion of related legal issues, Gartner does not provide legal advice or services and its research should not be construed or used as such. Gartner is a public company, and its shareholders may include firms and funds that have financial interests in entities covered in Gartner research. Gartner’s Board of Directors may include senior managers of these firms or funds. Gartner research is produced independently by its research organization without input or influence from these firms, funds or their managers. For further information on the independence and integrity of Gartner research, see “Guiding Principles on Independence and Objectivity” on its website.
Contact us
For more information contact us at
About Hewlett Packard Enterprise
Hewlett Packard Enterprise is an industry leading
technology company that enables customers
to go further, faster. With the industry’s most
comprehensive portfolio, spanning the cloud to
the data center to workplace applications, our
technology and services help customers around the
world make IT more efficient, more productive and
more secure.
For HPE Operations Bridge see
hpe.com/software/opsbridge.
For HPE Business Value Dashboard see
hpe.com/software/bvd.
For HPE Operations Analytics see
hpe.com/software/opsanalytics.
For our ITOM management solutions please see
hpe.com/software/itom.
See also our Blog channel here.