MAKING SENSE OF THE PRODUCTIVITY … SENSE OF THE PRODUCTIVITY SLOWDOWN: NEXT STEPS Dan Andrews...
22
MAKING SENSE OF THE PRODUCTIVITY SLOWDOWN: NEXT STEPS Dan Andrews Senior Economist Structural Policy Analysis Division Economics Department, OECD Making Sense of the Productivity Slowdown Peterson Institute for International Economics Washington D.C. | 16 November 2015
Transcript of MAKING SENSE OF THE PRODUCTIVITY … SENSE OF THE PRODUCTIVITY SLOWDOWN: NEXT STEPS Dan Andrews...

MAKING SENSE OF THE
PRODUCTIVITY SLOWDOWN:
NEXT STEPS
Dan AndrewsSenior EconomistStructural Policy Analysis DivisionEconomics Department, OECD
Making Sense of the Productivity Slowdown
Peterson Institute for International Economics
Washington D.C. | 16 November 2015

• Taking a granular approach, is it because:
1. Slowing growth at the global productivity frontier?
2. Stalling diffusion: slowing productivity convergence to the global frontier?
3. Rising resource misallocation?
• Debate has generally centred on #1 but we know little about global frontier firms.
– More likely to be: larger, profitable, MNE, patent (slide A1) + they come from various countries (slide A2).
• OECD research also shows:
– More scope for policy to influence #2 and #3, than #1
– Misallocation (#3) hinders diffusion (#2)
Why did productivity growth slow,
even before the crisis?
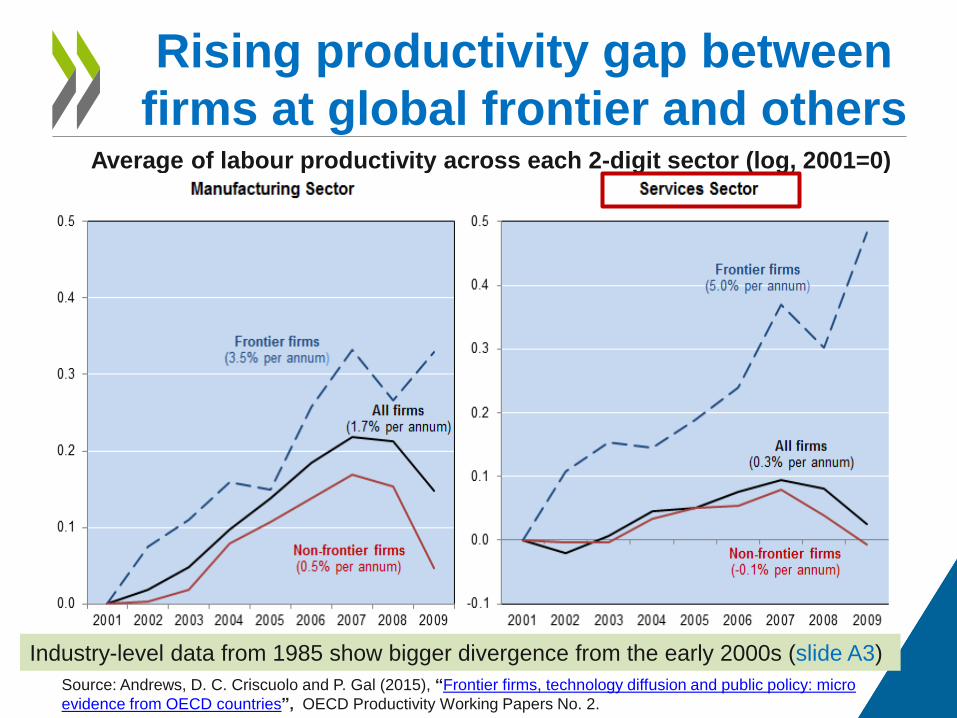
Rising productivity gap between
firms at global frontier and othersAverage of labour productivity across each 2-digit sector (log, 2001=0)
Source: Andrews, D. C. Criscuolo and P. Gal (2015), “Frontier firms, technology diffusion and public policy: micro
evidence from OECD countries”, OECD Productivity Working Papers No. 2.
Industry-level data from 1985 show bigger divergence from the early 2000s (slide A3)

• Three possible technological explanations:
– Technological diffusion slowed down
– “Winner takes all” dynamics
– Replication and diffusion of the magic bundle has
become more difficult
• Robustness – not driven by:
– Productivity measure: LP, TFP (slide A4)
– Frontier definition: Top 50, 100, 5% (slide A5)
– One particular industry (slide A6) or survival bias
(slide A7)
Possible explanations for this
divergence
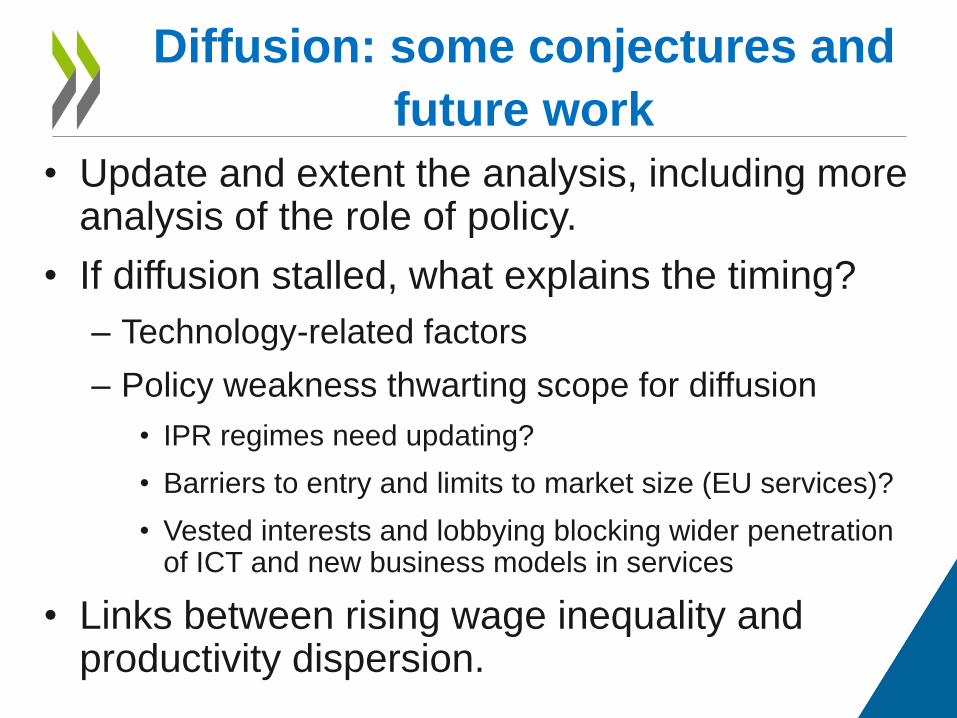
• Update and extent the analysis, including more analysis of the role of policy.
• If diffusion stalled, what explains the timing?
– Technology-related factors
– Policy weakness thwarting scope for diffusion
• IPR regimes need updating?
• Barriers to entry and limits to market size (EU services)?
• Vested interests and lobbying blocking wider penetration of ICT and new business models in services
• Links between rising wage inequality and productivity dispersion.
Diffusion: some conjectures and
future work
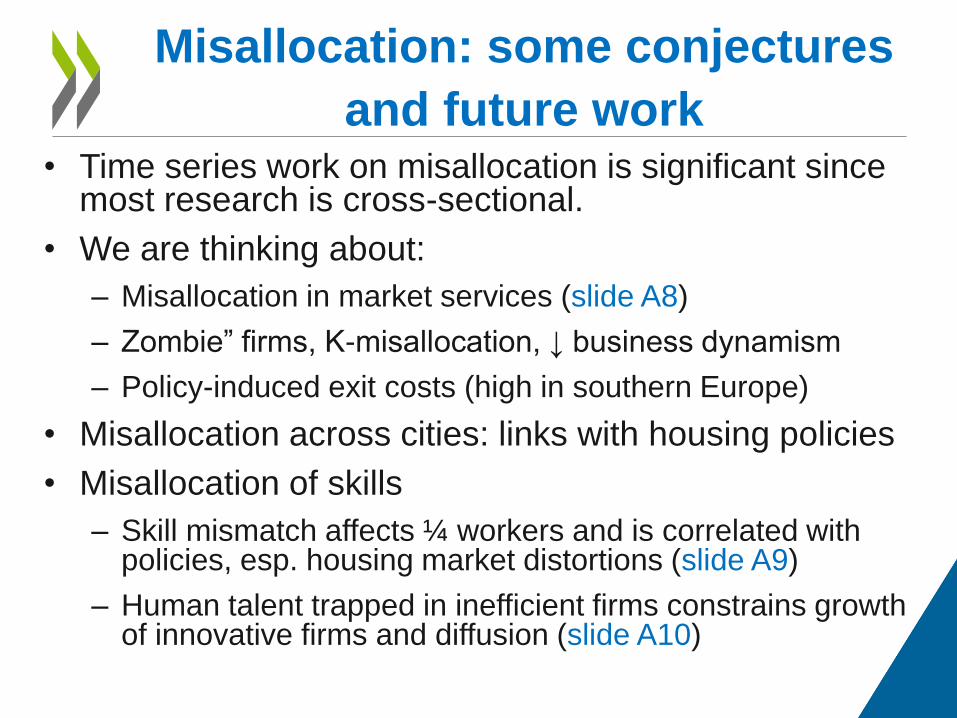
• Time series work on misallocation is significant since most research is cross-sectional.
• We are thinking about:
– Misallocation in market services (slide A8)
– Zombie” firms, K-misallocation, ↓ business dynamism
– Policy-induced exit costs (high in southern Europe)
• Misallocation across cities: links with housing policies
• Misallocation of skills
– Skill mismatch affects ¼ workers and is correlated with policies, esp. housing market distortions (slide A9)
– Human talent trapped in inefficient firms constrains growth of innovative firms and diffusion (slide A10)
Misallocation: some conjectures
and future work

Productivity gains from reducing skill
mismatch to the best practice level
Differences in skill mismatch can account for one-fifth ofthe labour productivity gap between Italy and the US.
Source: Adalet McGowan, M and D. Andrews (2015), “Labour market mismatch and labour productivity:
evidence from PIAAC data ” OECD Economics Department Working Paper, No. 1209.

The OECD new
book: out now!
Available at:
http://www.oecd.org/economy/the
-future-of-productivity.htm
Book + 5 page policy note +
technical papers + videos and ppt
Authors:
Müge Adalet McGowan
Dan Andrews
Chiara Criscuolo
Giuseppe Nicoletti
• Adalet McGowan, M., D. Andrews, C. Criscuolo and G. Nicoletti (2015), The Future of Productivity
• Adalet McGowan, M. and D. Andrews (2015a), “Labour Market Mismatch and Labour Productivity: Evidence from PIAAC Data”
• Adalet McGowan, M. and D. Andrews (2015b), “Skill Mismatch and Public Policy in OECD Countries”
• Andrews, D. and F. Cingano (2012), "Public policy and resource allocation: Evidence from firms in OECD countries"
• Andrews, D., C. Criscuolo and P. Gal (2015), “Frontier Firms, Technology Diffusion and Public Policy: Micro Evidence from OECD Countries”
• Andrews, D., C. Criscuolo and C. Menon (2014), "Do resources flow to patenting firms? Cross-country evidence from firm level data"
• Calvino, F., C. Criscuolo and C. Menon (2015), “Cross-country Evidence of Start-Up Dynamics”
• Criscuolo, C., P. Gal and C. Menon (2014), “The Dynamics of Employment Growth: New Evidence from 18 Countries”,
• Saia, A., D. Andrews and S. Albrizio (2015), “Public Policy and Spillovers From the Global Productivity Frontier: Industry Level Evidence”,
The following reports and papers
detail the results:

Spares
A1-A3. Characteristics of the global frontier
A4-A7. Frontier robustness
A8-A12. More on misallocation, including skills
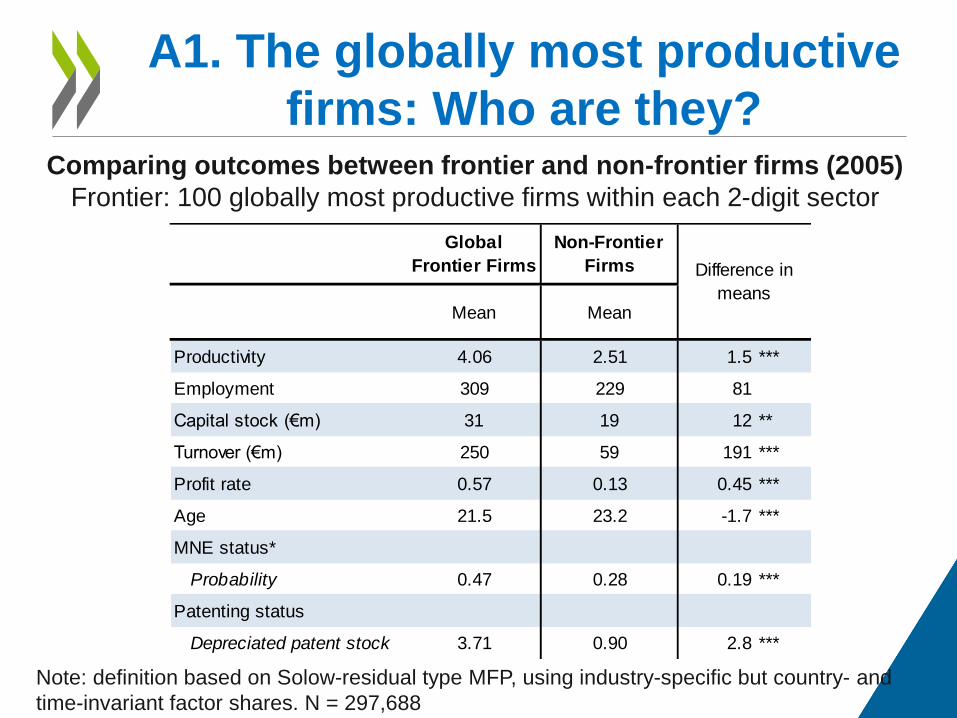
A1. The globally most productive
firms: Who are they?
Mean Mean
Productivity 4.06 2.51 1.5 ***
Employment 309 229 81
Capital stock (€m) 31 19 12 **
Turnover (€m) 250 59 191 ***
Profit rate 0.57 0.13 0.45 ***
Age 21.5 23.2 -1.7 ***
MNE status*
Probability 0.47 0.28 0.19 ***
Patenting status
Depreciated patent stock 3.71 0.90 2.8 ***
Global
Frontier Firms
Non-Frontier
Firms Difference in
means
Comparing outcomes between frontier and non-frontier firms (2005)
Frontier: 100 globally most productive firms within each 2-digit sector
Note: definition based on Solow-residual type MFP, using industry-specific but country- and
time-invariant factor shares. N = 297,688

A2. The globally most productive
firms: Coming from various countries
Source: Andrews, D. C. Criscuolo and P. Gal (2015), “Frontier firms, technology diffusion and public policy: micro
evidence from OECD countries”, OECD Productivity Working Paper No. 2.

A3. Industry-level data show bigger
divergence from early 2000sUnweighted average of TFP in the non-farm business sector; index 1985=0
Source: OECD calculations based on Bourles et al (2013) dataset.
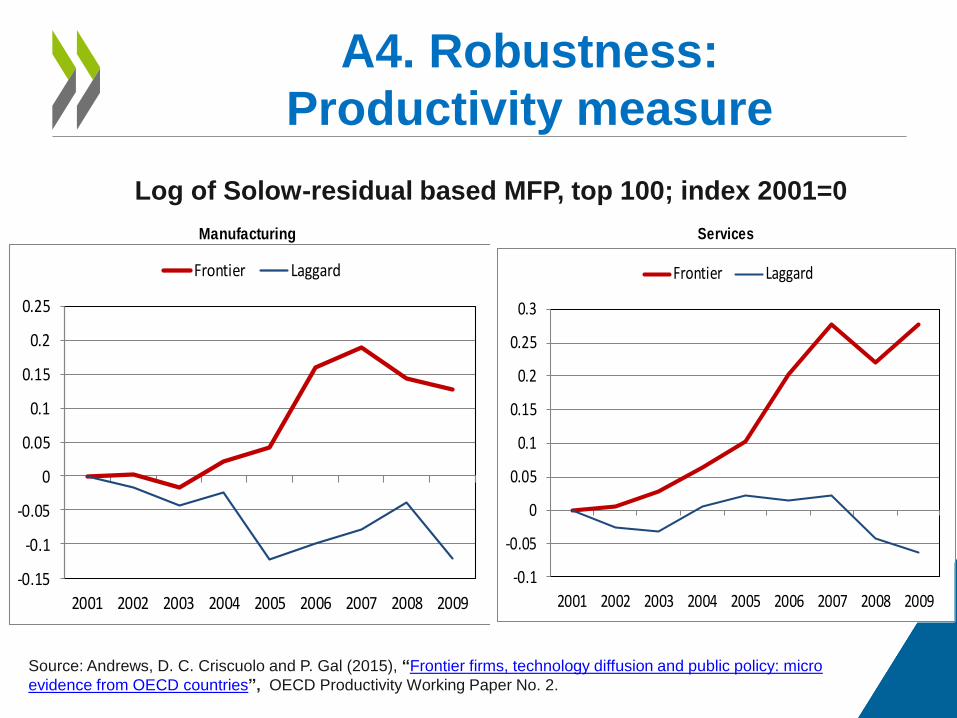
A4. Robustness:
Productivity measure
Log of Solow-residual based MFP, top 100; index 2001=0
Manufacturing
-0.15
-0.1
-0.05
0
0.05
0.1
0.15
0.2
0.25
2001 2002 2003 2004 2005 2006 2007 2008 2009
Frontier Laggard
Services
-0.1
-0.05
0
0.05
0.1
0.15
0.2
0.25
0.3
2001 2002 2003 2004 2005 2006 2007 2008 2009
Frontier Laggard
Source: Andrews, D. C. Criscuolo and P. Gal (2015), “Frontier firms, technology diffusion and public policy: micro
evidence from OECD countries”, OECD Productivity Working Paper No. 2.
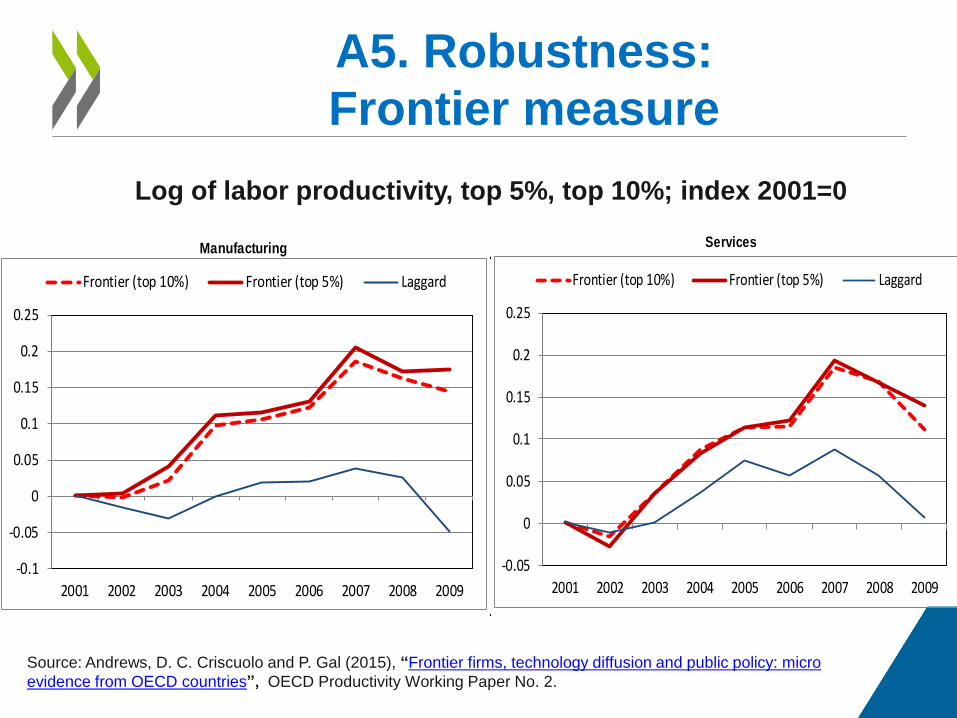
A5. Robustness:
Frontier measure
Log of labor productivity, top 5%, top 10%; index 2001=0
Manufacturing
-0.1
-0.05
0
0.05
0.1
0.15
0.2
0.25
2001 2002 2003 2004 2005 2006 2007 2008 2009
Frontier (top 10%) Frontier (top 5%) Laggard
Services
-0.05
0
0.05
0.1
0.15
0.2
0.25
2001 2002 2003 2004 2005 2006 2007 2008 2009
Frontier (top 10%) Frontier (top 5%) Laggard
Source: Andrews, D. C. Criscuolo and P. Gal (2015), “Frontier firms, technology diffusion and public policy: micro
evidence from OECD countries”, OECD Productivity Working Paper No. 2.

A6. Robustness:
By Industry and ICT intensityLog of labor productivity; index 2001=0
ICT_Using_Manufacturing ICT_Producing_Manufacturing Non_ICT_Manufacturing
-0.20
-0.10
0.00
0.10
0.20
0.30
0.40
0.50
0.60
2001
2002
2003
2004
2005
2006
2007
2008
2009
Laggard Frontier
-0.20
-0.10
0.00
0.10
0.20
0.30
0.40
0.50
0.60
2001
2002
2003
2004
2005
2006
2007
2008
2009
Laggard Frontier
-0.20
-0.10
0.00
0.10
0.20
0.30
0.40
0.50
0.60
2001
2002
2003
2004
2005
2006
2007
2008
2009
Laggard Frontier
ICT Using Services ICT Producing Services Non ICT Services
-0.20
-0.10
0.00
0.10
0.20
0.30
0.40
0.50
0.60
2001
2002
2003
2004
2005
2006
2007
2008
2009
Laggard Frontier
-0.20
-0.10
0.00
0.10
0.20
0.30
0.40
0.50
0.60
2001
2002
2003
2004
2005
2006
2007
2008
2009
Laggard Frontier
-0.20
-0.10
0.00
0.10
0.20
0.30
0.40
0.50
0.60
2001
2002
2003
2004
2005
2006
2007
2008
2009
Laggard Frontier

A7. Robustness:
Surviving firms onlyLog of labor productivity, top 100; index 2001=0
Balanced sample, both on and off the frontier
Manufacturing
0
0.05
0.1
0.15
0.2
0.25
0.3
2001 2002 2003 2004 2005 2006 2007 2008 2009
Frontier Laggard
Services
-0.05
0
0.05
0.1
0.15
0.2
0.25
2001 2002 2003 2004 2005 2006 2007 2008 2009
Frontier Laggard
Source: Andrews, D. C. Criscuolo and P. Gal (2015), “Frontier firms, technology diffusion and public policy: micro
evidence from OECD countries”, OECD Productivity Working Paper No. 2.

A8. Misallocation, big time!
Andrews, D. and F. Cingano (2014), “Public Policy and Resource Allocation: Evidence from Firms in
OECD Countries”, Economic Policy, No. 29(78), pp. 253-296.
Contribution of the allocation of employment across firms
to the level of labour productivity; per cent
Europe does a poor job at channelling resources to more productive firms, esp. in market services

A9. Skill misallocation is policy-
inducedThe probability of skill mismatch and public policies
Source: Adalet McGowan, M and D. Andrews (2015), “Skill mismatch and public policy in OECD countries”
OECD Economics Department Working Paper, No. 1210.
Entry and Exit Labour mobility Education
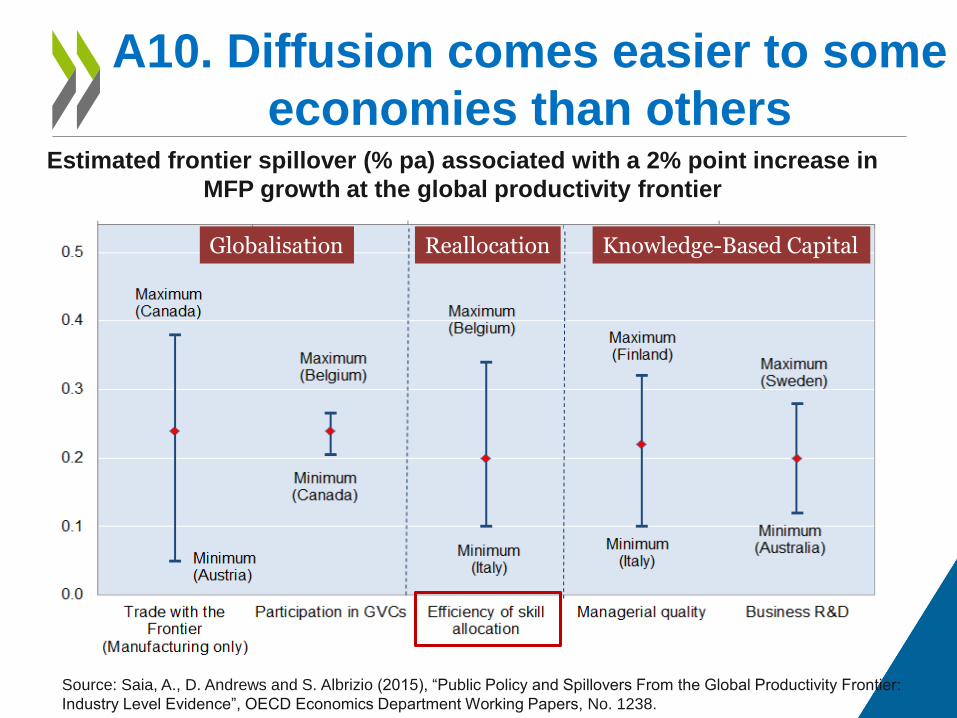
A10. Diffusion comes easier to some
economies than othersEstimated frontier spillover (% pa) associated with a 2% point increase in
MFP growth at the global productivity frontier
Source: Saia, A., D. Andrews and S. Albrizio (2015), “Public Policy and Spillovers From the Global Productivity Frontier:
Industry Level Evidence”, OECD Economics Department Working Papers, No. 1238.
Globalisation Reallocation Knowledge-Based Capital

A11. Skill mismatch: combining self-
assessment with skill proficiencyUse micro-data from OECD Survey of Adult Skills (PIAAC) to:
1. Create a quantitative scale of the skills required to perform
the job for each occupation using the literacy scores of
well-matched workers – those who neither feel they have
the skills to perform a more demanding job nor require
further training to perform their current job satisfactorily.
2. Use this scale to identify min and max threshold values
(e.g., based on the 10th and 90th percentile), which bounds
what it is to be a well-matched worker.
3. Workers with scores lower (higher) than this min (max)
threshold in their occupation are under (over) skilled.

A12. Over-skilling is more prevalent
than under-skilling Percentage of workers with skill mismatch
On average, over-skilling is ~2½ times more likely than under-skilling