THE FIGHT AGAINST TERRORISM. WHAT WAS PRESIDENT BUSH’S POLICY?
Upload
alice-popeCategory
view
215download
1
Making Sense of President Bush’s New Advanced Energy Initiative
Kelly Sims Gallagher, Ph.D.Energy Technology Innovation ProjectFebruary 23, 2006(updated 2/28/06)
Outline
Introduction The announcement The actual budget numbers in charts Assessing the budget Conclusion
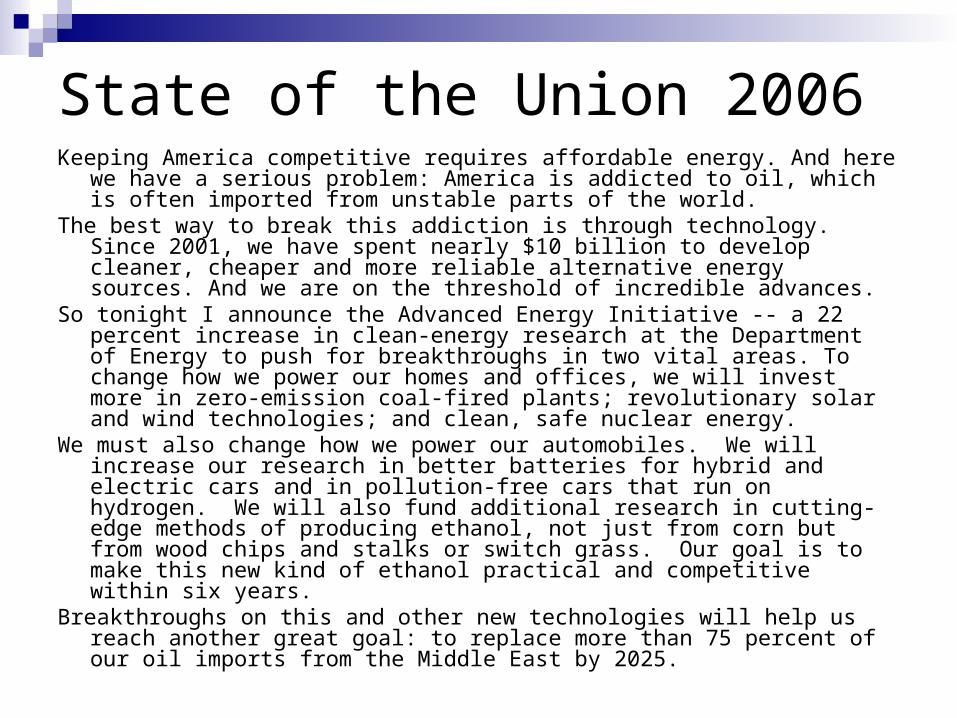
State of the Union 2006Keeping America competitive requires affordable energy. And here we have a
serious problem: America is addicted to oil, which is often imported from unstable parts of the world.
The best way to break this addiction is through technology. Since 2001, we have spent nearly $10 billion to develop cleaner, cheaper and more reliable alternative energy sources. And we are on the threshold of incredible advances.
So tonight I announce the Advanced Energy Initiative -- a 22 percent increase in clean-energy research at the Department of Energy to push for breakthroughs in two vital areas. To change how we power our homes and offices, we will invest more in zero-emission coal-fired plants; revolutionary solar and wind technologies; and clean, safe nuclear energy.
We must also change how we power our automobiles. We will increase our research in better batteries for hybrid and electric cars and in pollution-free cars that run on hydrogen. We will also fund additional research in cutting-edge methods of producing ethanol, not just from corn but from wood chips and stalks or switch grass. Our goal is to make this new kind of ethanol practical and competitive within six years.
Breakthroughs on this and other new technologies will help us reach another great goal: to replace more than 75 percent of our oil imports from the Middle East by 2025.
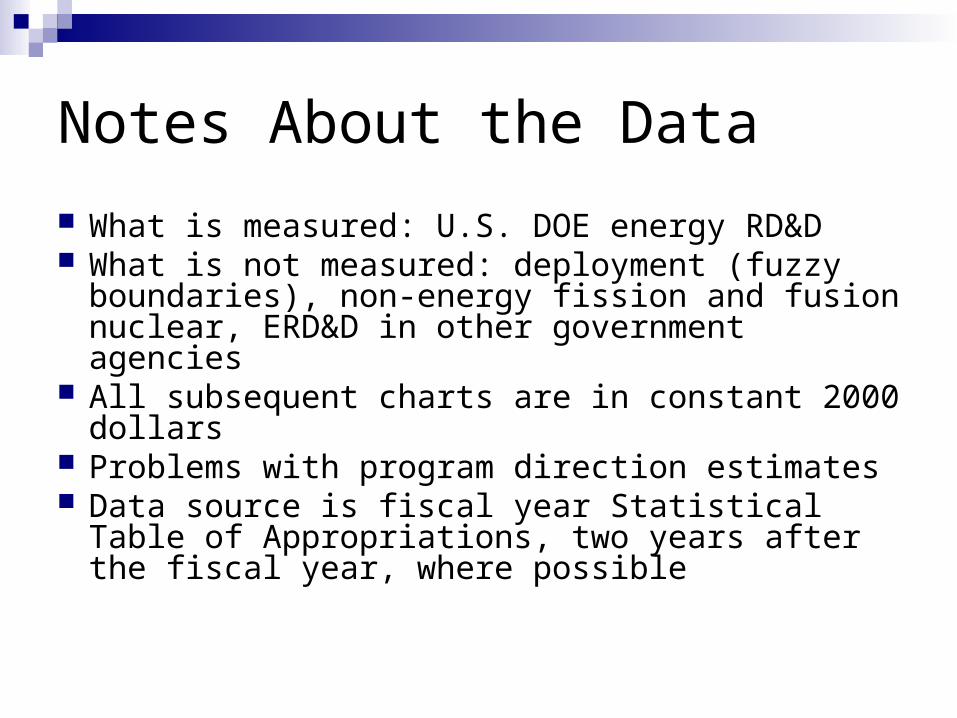
Notes About the Data
What is measured: U.S. DOE energy RD&D What is not measured: deployment (fuzzy
boundaries), non-energy fission and fusion nuclear, ERD&D in other government agencies
All subsequent charts are in constant 2000 dollars
Problems with program direction estimates Data source is fiscal year Statistical Table of
Appropriations, two years after the fiscal year, where possible
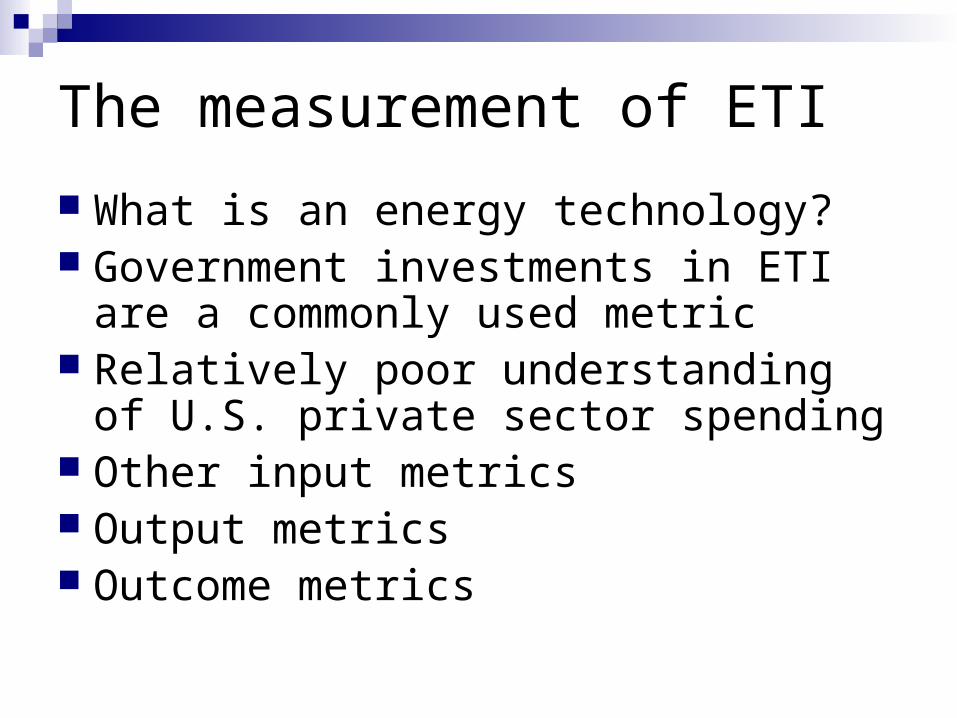
The measurement of ETI
What is an energy technology? Government investments in ETI are a
commonly used metric Relatively poor understanding of U.S.
private sector spending Other input metrics Output metrics Outcome metrics
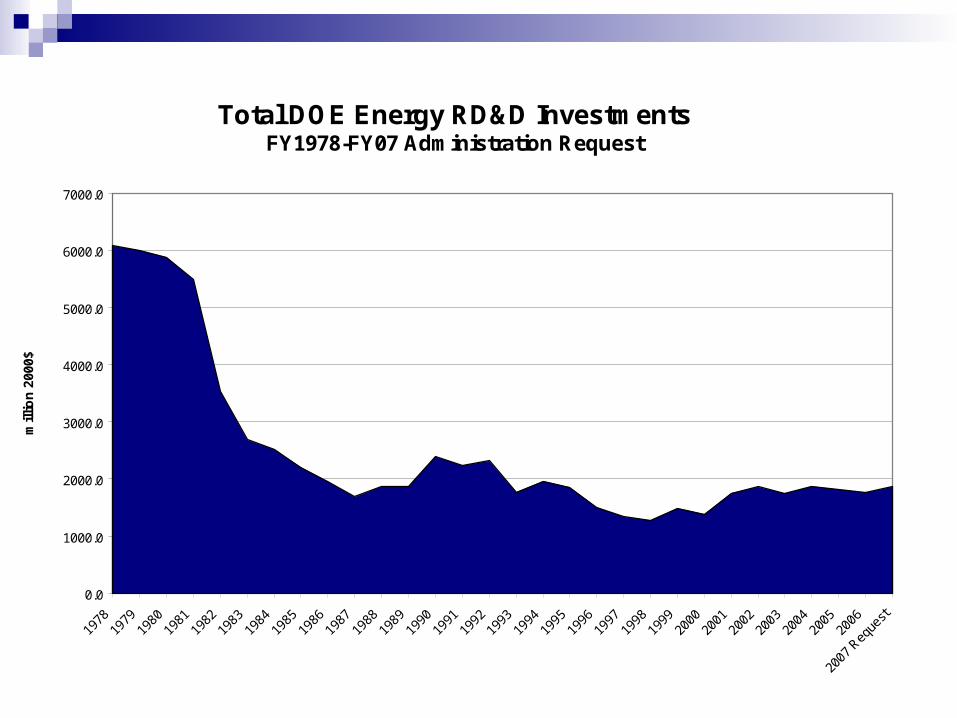
Total DOE Energy RD&D Investments FY1978-FY07 Administration Request
0.0
1000.0
2000.0
3000.0
4000.0
5000.0
6000.0
7000.0
1978
1979
1980
1981
1982
1983
1984
1985
1986
1987
1988
1989
1990
1991
1992
1993
1994
1995
1996
1997
1998
1999
2000
2001
2002
2003
2004
2005
2006
2007
Req
uest
mill
ion
200
0$
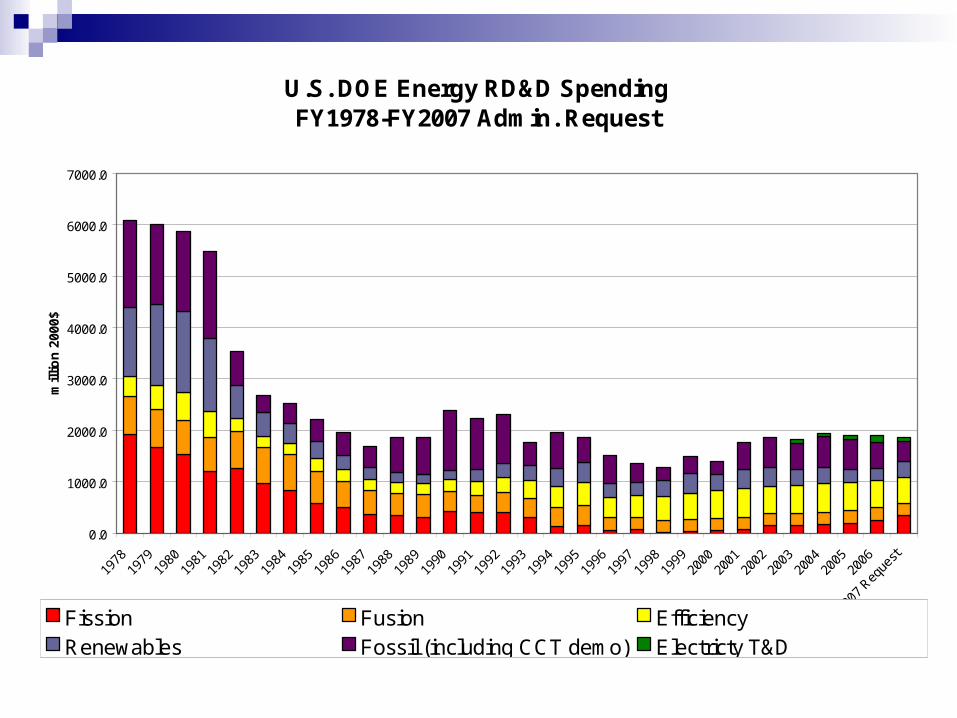
U.S. DOE Energy RD&D Spending FY1978-FY2007 Admin. Request
0.0
1000.0
2000.0
3000.0
4000.0
5000.0
6000.0
7000.0
1978
1979
1980
1981
1982
1983
1984
1985
1986
1987
1988
1989
1990
1991
1992
1993
1994
1995
1996
1997
1998
1999
2000
2001
2002
2003
2004
2005
2006
2007
Req
uest
mill
ion
200
0$
Fission Fusion EfficiencyRenewables Fossil (including CCT demo) Electricty T&D
0.0
100.0
200.0
300.0
400.0
500.0
600.0
mil
lio
n 2
00
0$
2000 2001 2002 2003 2004 2005 2006 2007 Request
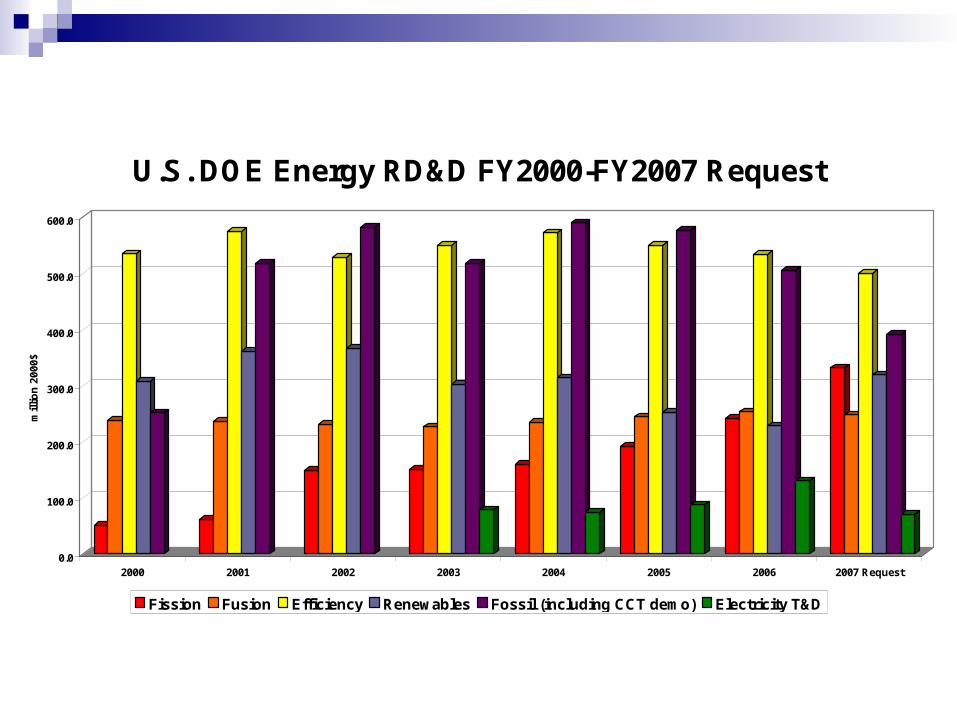
U.S. DOE Energy RD&D FY2000-FY2007 Request
Fission Fusion Efficiency Renewables Fossil (including CCT demo) Electricity T&D
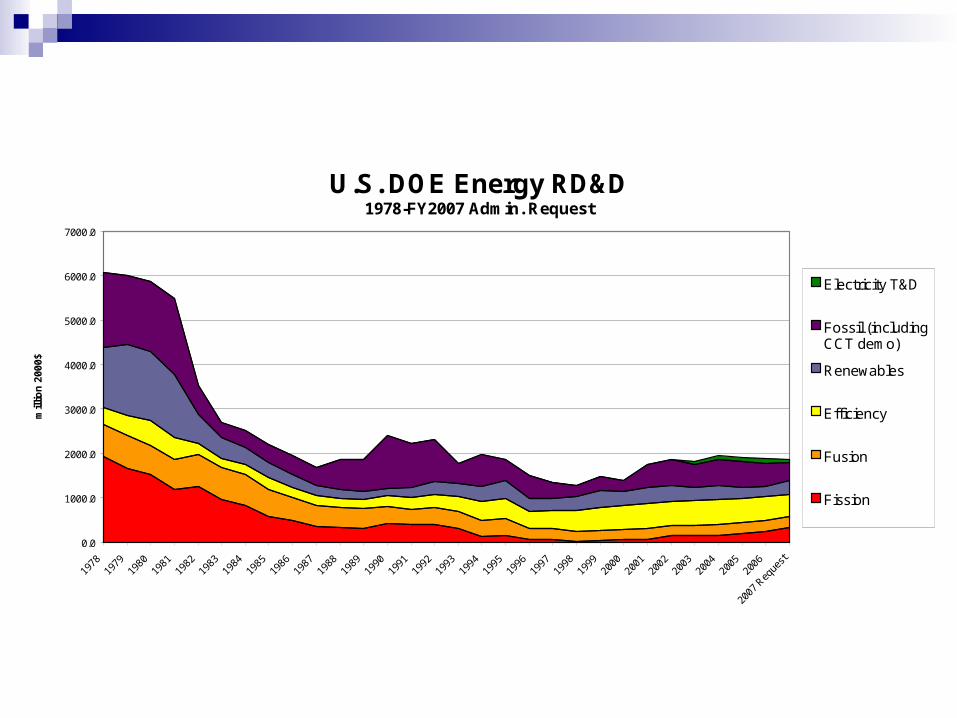
U.S. DOE Energy RD&D 1978-FY2007 Admin. Request
0.0
1000.0
2000.0
3000.0
4000.0
5000.0
6000.0
7000.0
1978
1979
1980
1981
1982
1983
1984
1985
1986
1987
1988
1989
1990
1991
1992
1993
1994
1995
1996
1997
1998
1999
2000
2001
2002
2003
2004
2005
2006
2007
Req
uest
mil
lio
n 2
00
0$
Electricity T&D
Fossil (includingCCT demo)
Renewables
Efficiency
Fusion
Fission
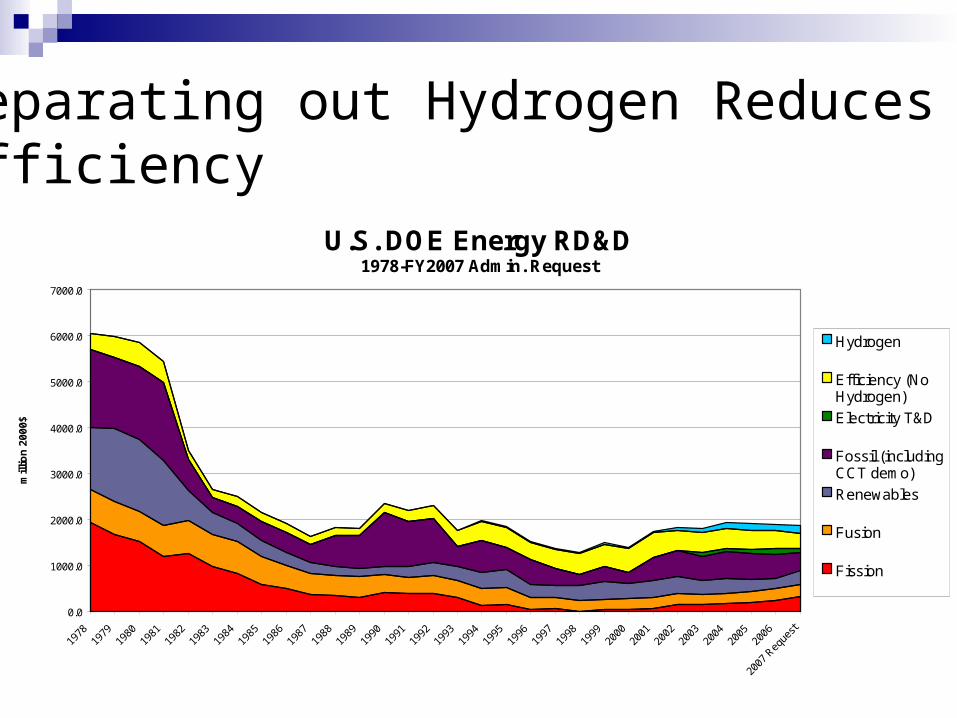
U.S. DOE Energy RD&D 1978-FY2007 Admin. Request
0.0
1000.0
2000.0
3000.0
4000.0
5000.0
6000.0
7000.0
1978
1979
1980
1981
1982
1983
1984
1985
1986
1987
1988
1989
1990
1991
1992
1993
1994
1995
1996
1997
1998
1999
2000
2001
2002
2003
2004
2005
2006
2007
Req
uest
mil
lio
n 2
00
0$
Hydrogen
Efficiency (NoHydrogen)
Electricity T&D
Fossil (includingCCT demo)
Renewables
Fusion
Fission
Note: Fossil contains hydrogen funding as well.
Separating out Hydrogen Reduces Efficiency
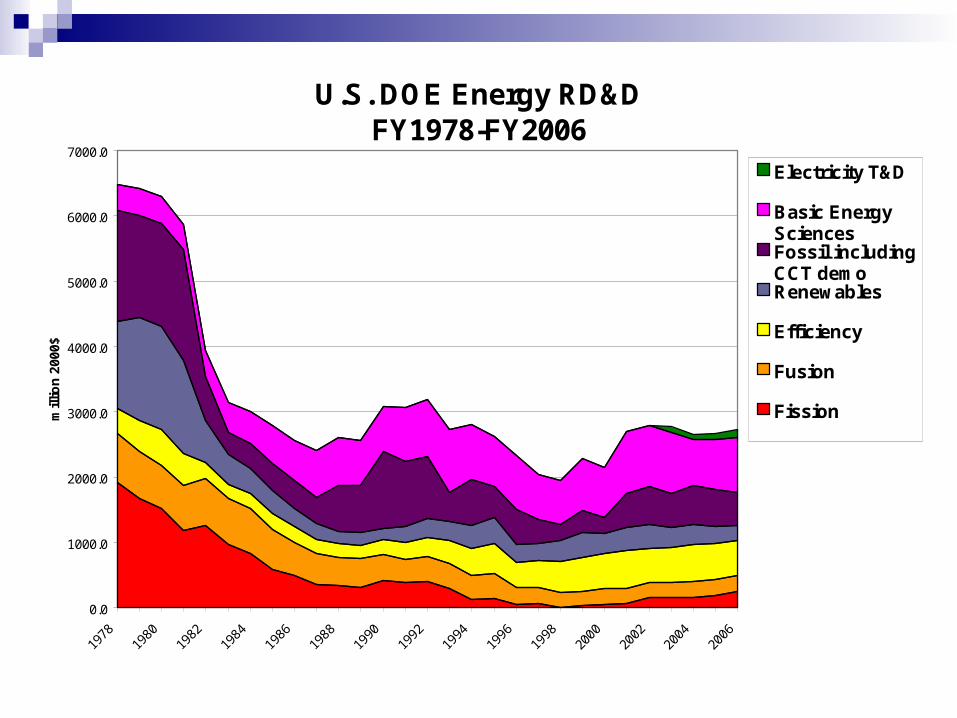
U.S. DOE Energy RD&D FY1978-FY2006
0.0
1000.0
2000.0
3000.0
4000.0
5000.0
6000.0
7000.0
1978
1980
1982
1984
1986
1988
1990
1992
1994
1996
1998
2000
2002
2004
2006
mill
ion
200
0$
Electricity T&D
Basic EnergySciencesFossil includingCCT demoRenewables
Efficiency
Fusion
Fission

U.S. Non-Nuclear DOE Energy RD&D Spending
0.0
500.0
1000.0
1500.0
2000.0
2500.0
3000.0
3500.0
4000.0
1978
1979
1980
1981
1982
1983
1984
1985
1986
1987
1988
1989
1990
1991
1992
1993
1994
1995
1996
1997
1998
1999
2000
2001
2002
2003
2004
2005
2006
2007
Req
uest
mill
ion
200
0$
Efficiency Renewables Fossil (including CCT demo) Electricity T&D
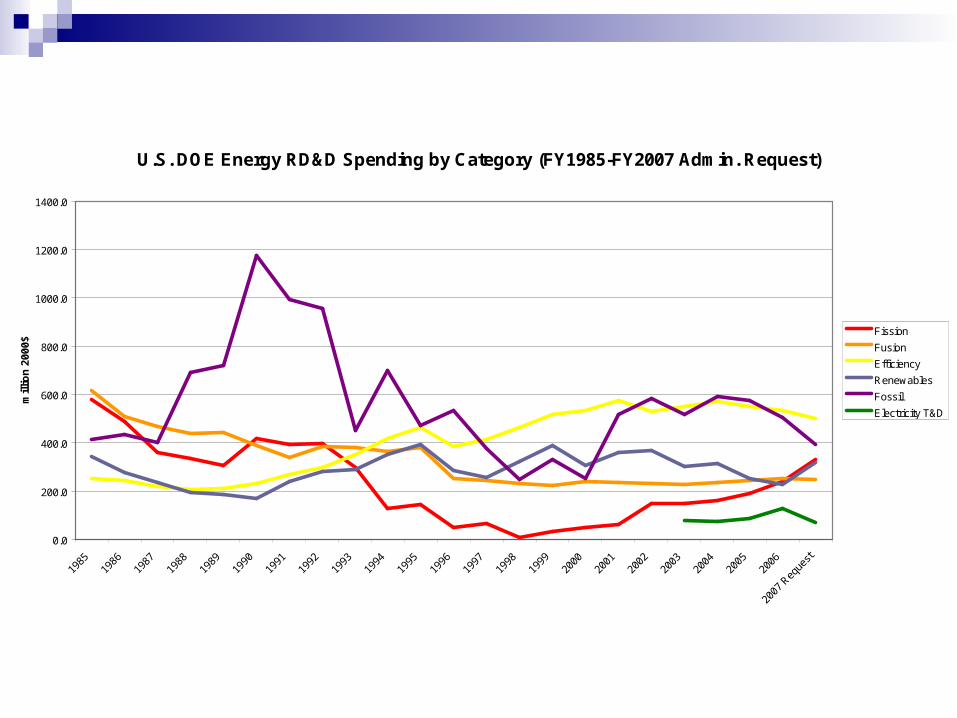
U.S. DOE Energy RD&D Spending by Category (FY1985-FY2007 Admin. Request)
0.0
200.0
400.0
600.0
800.0
1000.0
1200.0
1400.0
1985
1986
1987
1988
1989
1990
1991
1992
1993
1994
1995
1996
1997
1998
1999
2000
2001
2002
2003
2004
2005
2006
2007
Req
uest
mil
lio
n 2
00
0$
Fission
Fusion
Efficiency
Renewables
Fossil
Electricity T&D
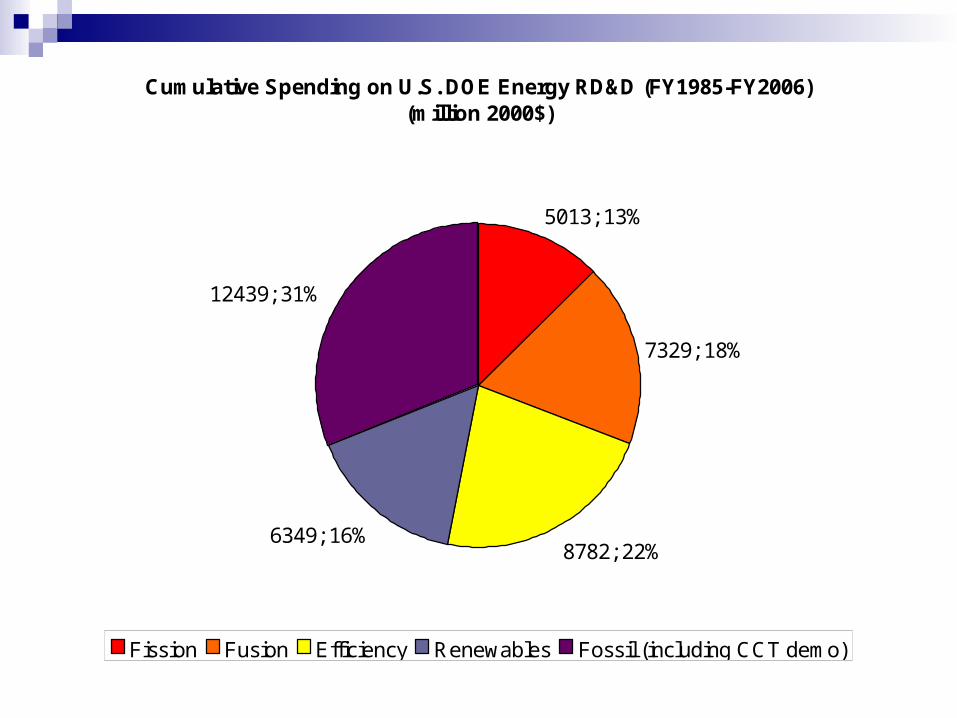
Cumulative Spending on U.S. DOE Energy RD&D (FY1985-FY2006)(million 2000$)
5013; 13%
7329; 18%
8782; 22%6349; 16%
12439; 31%
Fission Fusion Efficiency Renewables Fossil (including CCT demo)
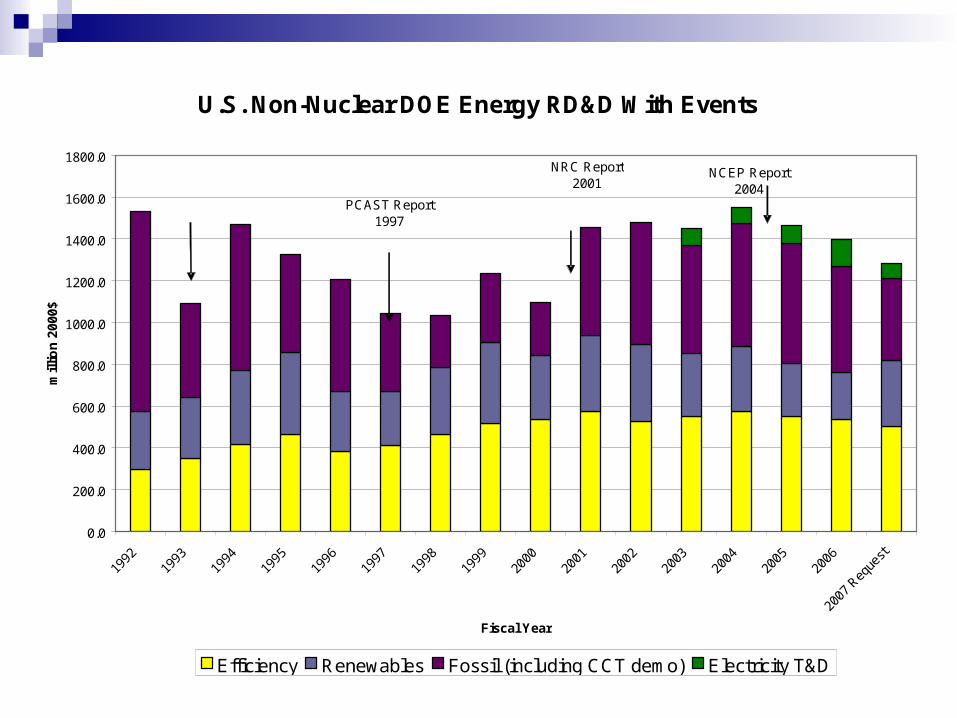
U.S. Non-Nuclear DOE Energy RD&D With Events
0.0
200.0
400.0
600.0
800.0
1000.0
1200.0
1400.0
1600.0
1800.0
1992
1993
1994
1995
1996
1997
1998
1999
2000
2001
2002
2003
2004
2005
2006
2007
Req
uest
Fiscal Year
mill
ion
200
0$
Efficiency Renewables Fossil (including CCT demo) Electricity T&D
PCAST Report 1997
G. W. Bush Takes Office2001
W.J. Clinton takes office
NCEP Report 2004
NRC Report2001
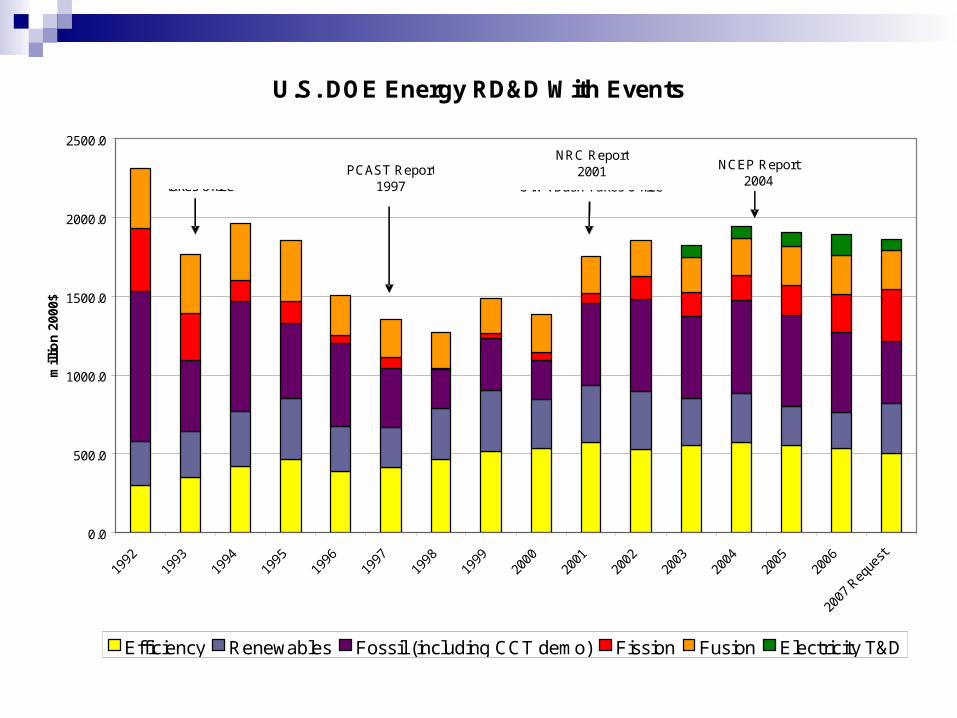
U.S. DOE Energy RD&D With Events
0.0
500.0
1000.0
1500.0
2000.0
2500.0
1992
1993
1994
1995
1996
1997
1998
1999
2000
2001
2002
2003
2004
2005
2006
2007
Req
uest
mill
ion
200
0$
Efficiency Renewables Fossil (including CCT demo) Fission Fusion Electricity T&D
PCAST Report 1997 G.W. Bush Takes Office
W.J. Clinton takes office
NCEP Report 2004
NRC Report2001
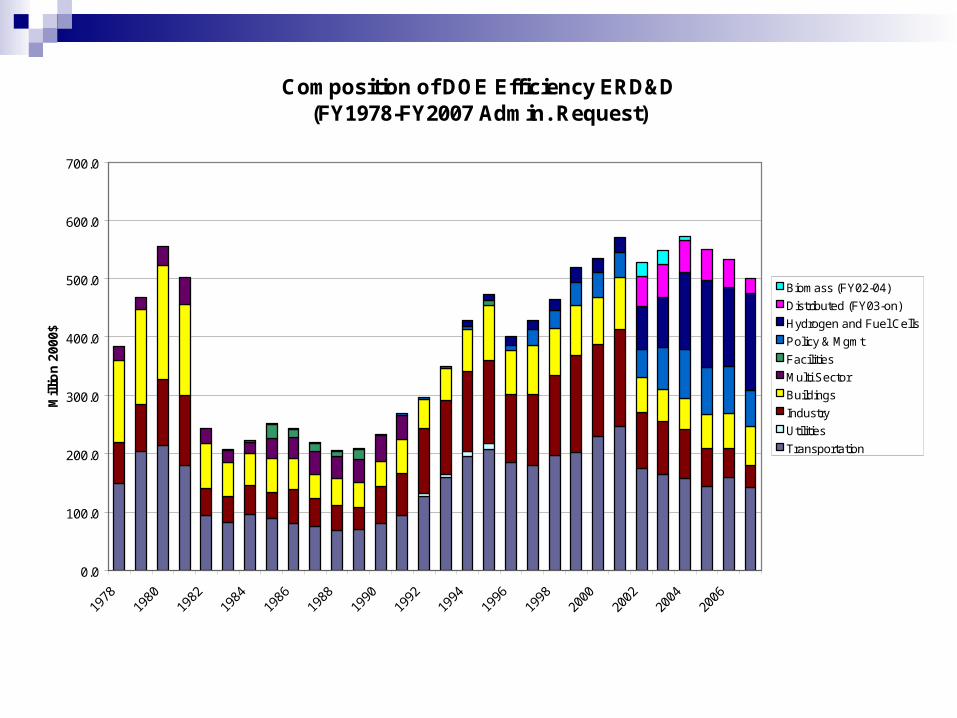
Composition of DOE Efficiency ERD&D (FY1978-FY2007 Admin. Request)
0.0
100.0
200.0
300.0
400.0
500.0
600.0
700.0
1978
1980
1982
1984
1986
1988
1990
1992
1994
1996
1998
2000
2002
2004
2006
Mill
ion
200
0$
Biomass (FY02-04)
Distributed (FY03-on)
Hydrogen and Fuel Cells
Policy & Mgmt
Facilities
Multi Sector
Buildings
Industry
Utilities
Transportation
Note: FY05-on, biomass included in renewables
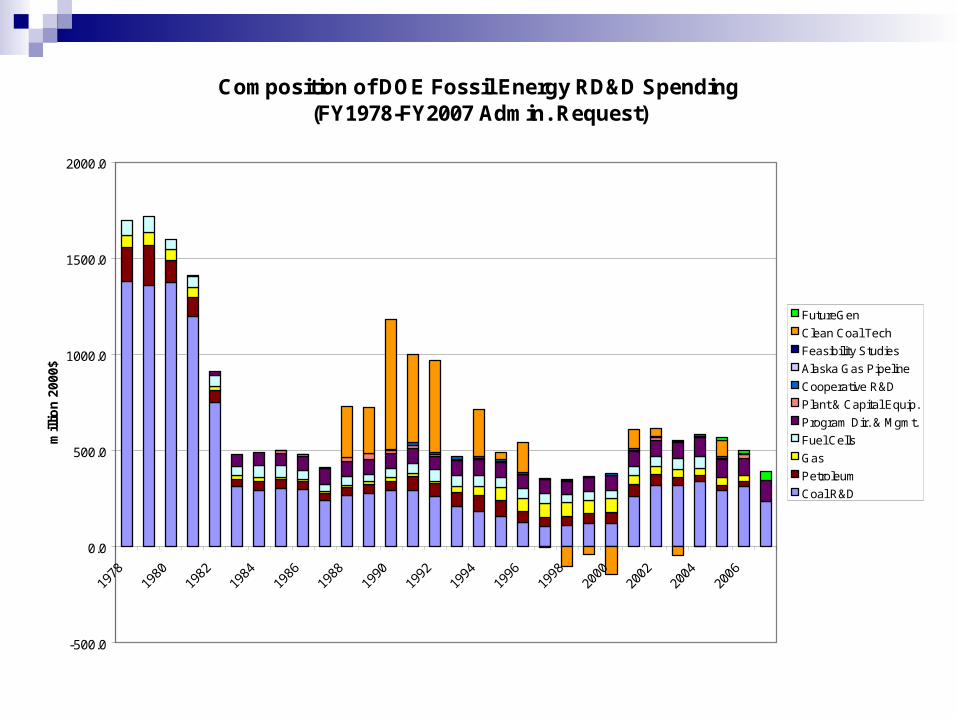
Composition of DOE Fossil Energy RD&D Spending (FY1978-FY2007 Admin. Request)
-500.0
0.0
500.0
1000.0
1500.0
2000.0
1978
1980
1982
1984
1986
1988
1990
1992
1994
1996
1998
2000
2002
2004
2006
mill
ion
200
0$
FutureGen
Clean Coal Tech
Feasibility Studies
Alaska Gas Pipeline
Cooperative R&D
Plant & Capital Equip.
Program Dir. & Mgmt.
Fuel Cells
Gas
Petroleum
Coal R&D
Note: Fuel cells from FY05-on are included under the efficiency category

Composition of Renewable Energy DOE ERD&D Spending (FY1998-FY2007 Admin. Request)
0.0
50.0
100.0
150.0
200.0
250.0
300.0
350.0
400.0
1998.0 1999.0 2000.0 2001.0 2002.0 2003.0 2004.0 2005.0 2006.0 2007.0
mill
ion
200
0$
Policy &Management
Storage
Indian Renewables
Electrical andStorage
Hydropower
Geothermal
Wind
Biomass andBiorefinery Systems
Solar
Note:Hydrogen is included in the Efficiency category
Overall. . .
$99 million increase in total ERD&D in constant 2000 dollars (5.6% increase)
President Bush claimed he was increasing funding by 22 percent for “clean-energy research at the Department of Energy” for “zero-emission coal-fired plants; revolutionary solar and wind technologies; and clean, safe nuclear energy” but. . .
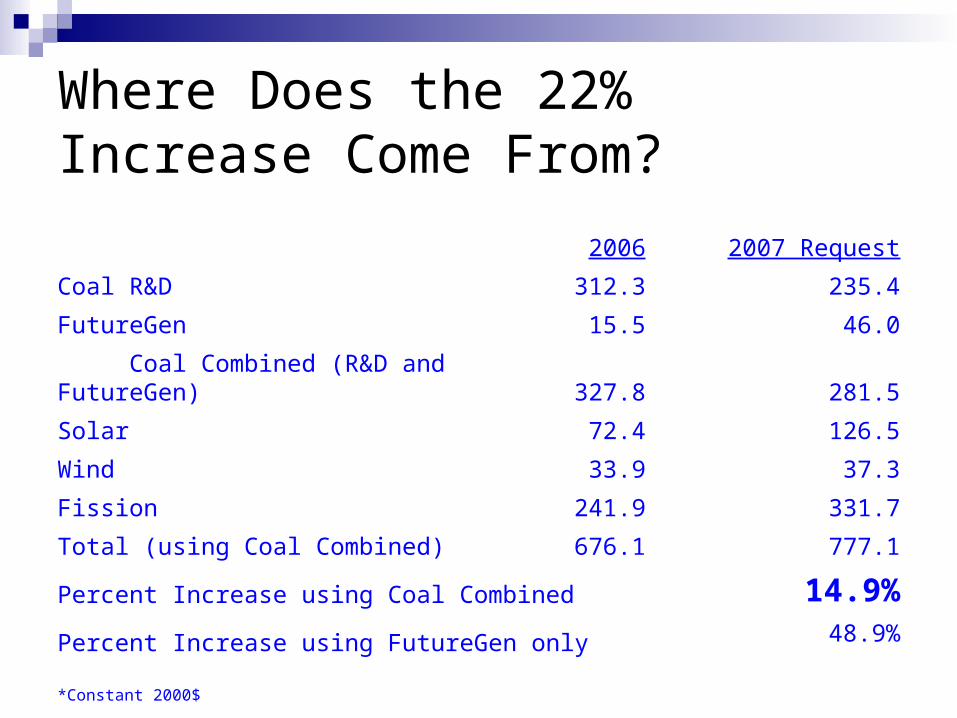
Where Does the 22% Increase Come From?
2006 2007 Request
Coal R&D 312.3 235.4
FutureGen 15.5 46.0
Coal Combined (R&D and FutureGen) 327.8 281.5
Solar 72.4 126.5
Wind 33.9 37.3
Fission 241.9 331.7
Total (using Coal Combined) 676.1 777.1
Percent Increase using Coal Combined 14.9%
Percent Increase using FutureGen only
*Constant 2000$
48.9%

Category FY06 FY07 Request
% change
Renewable energy 228.2 319.4 +40%
Fission 241.9 331.7 +37%
Efficiency 533.6 500.2 -6%
Fusion 253.2 247.7 -2%
Non-hydrogen efficiency 398.0 333.2 -16%
Fossil 505.6 391.7 -23%
Electricity T&D 130.4 70.9 -46%
Change from FY06 to FY07: Administration Request in Broad Categories (million 2000$)
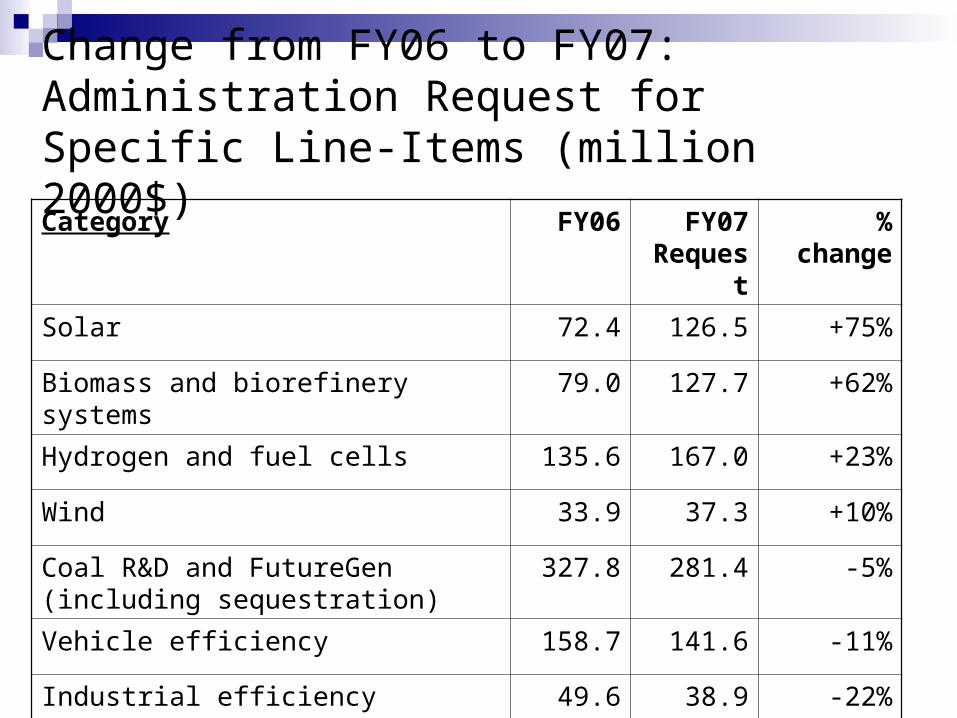
Category FY06 FY07 Request
% change
Solar 72.4 126.5 +75%
Biomass and biorefinery systems 79.0 127.7 +62%
Hydrogen and fuel cells 135.6 167.0 +23%
Wind 33.9 37.3 +10%
Coal R&D and FutureGen (including sequestration)
327.8 281.4 -5%
Vehicle efficiency 158.7 141.6 -11%
Industrial efficiency 49.6 38.9 -22%
Change from FY06 to FY07: Administration Request for Specific Line-Items (million 2000$)
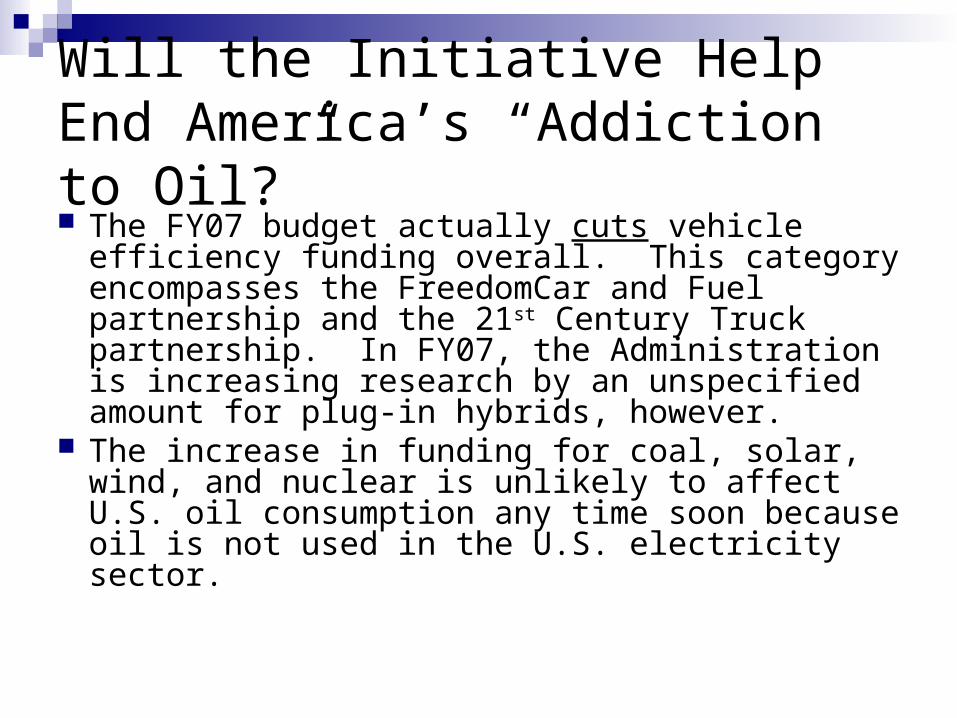
Will the Initiative Help End America’s “Addiction to Oil?” The FY07 budget actually cuts vehicle efficiency
funding overall. This category encompasses the FreedomCar and Fuel partnership and the 21st Century Truck partnership. In FY07, the Administration is increasing research by an unspecified amount for plug-in hybrids, however.
The increase in funding for coal, solar, wind, and nuclear is unlikely to affect U.S. oil consumption any time soon because oil is not used in the U.S. electricity sector.
Other Important Notes
Geothermal, hydropower, petroleum, and natural gas RD&D are all cancelled in the FY07 request
Weatherization funding (deployment) is cut by $91 million current dollars. Weatherization activities help the poor install energy-efficient technologies
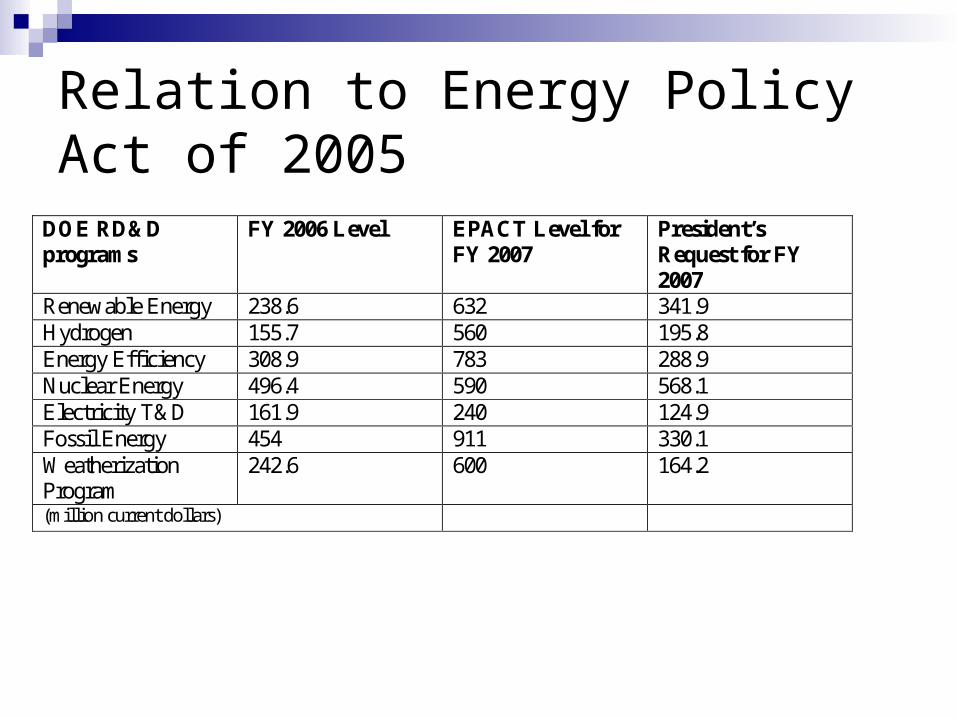
Relation to Energy Policy Act of 2005
DOE RD&D programs
FY 2006 Level EPACT Level for FY 2007
President’s Request for FY 2007
Renewable Energy 238.6 632 341.9 Hydrogen 155.7 560 195.8 Energy Efficiency 308.9 783 288.9 Nuclear Energy 496.4 590 568.1 Electricity T&D 161.9 240 124.9 Fossil Energy 454 911 330.1 Weatherization Program
242.6 600 164.2
(million current dollars)
Conclusions: Specifics
Carbon sequestration funding at $73 million is ridiculously low.
Do we want to completely zero out petroleum and natural gas funding? Cancel geothermal?
Although the percentage increases in solar, wind, and biomass investments seem impressive, their total budgets are relatively small.
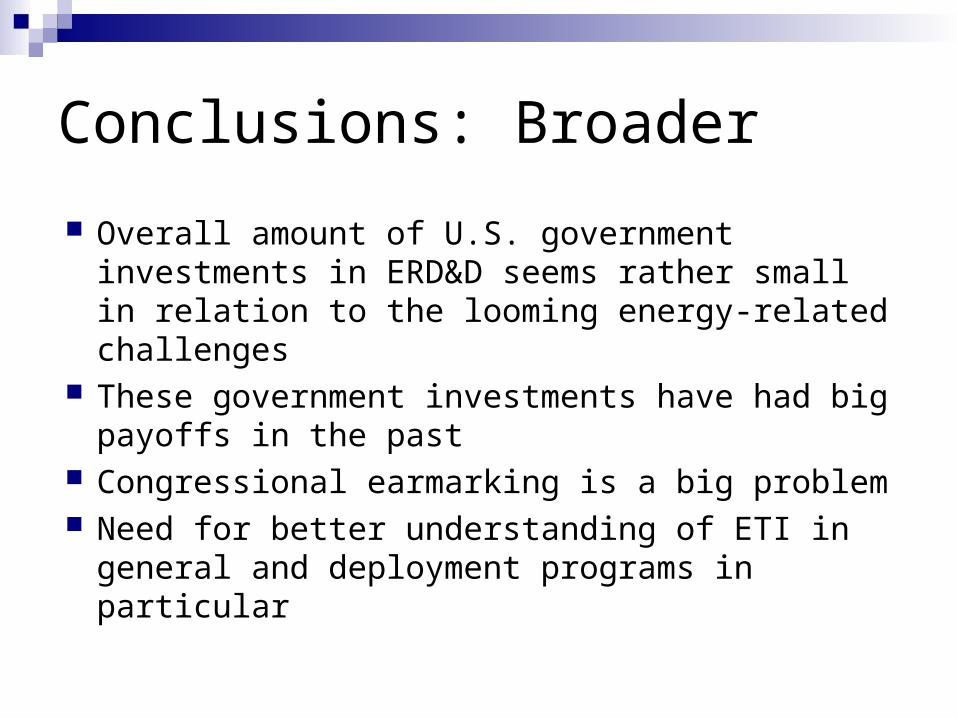
Conclusions: Broader
Overall amount of U.S. government investments in ERD&D seems rather small in relation to the looming energy-related challenges
These government investments have had big payoffs in the past
Congressional earmarking is a big problem Need for better understanding of ETI in general
and deployment programs in particular

Acknowledgements
• Data from 1978-1996 from spreadsheet by Paul de Sa and John Holdren dated May 2, 1997
• Updated by Kelly Gallagher, Ambuj Sagar, and Diane Segal, July 2004
• Updated by Kelly Gallagher in February 2005 and February 2006
• Comments from Ambuj Sagar on the database
• Funding from U.S. Energy Foundation
Database is available at http://bcsia.ksg.harvard.edu/energy