Amir Rasti Reza Rejaie Dept. of Computer Science University of Oregon.
Upload
derick-nortonCategory
view
221download
0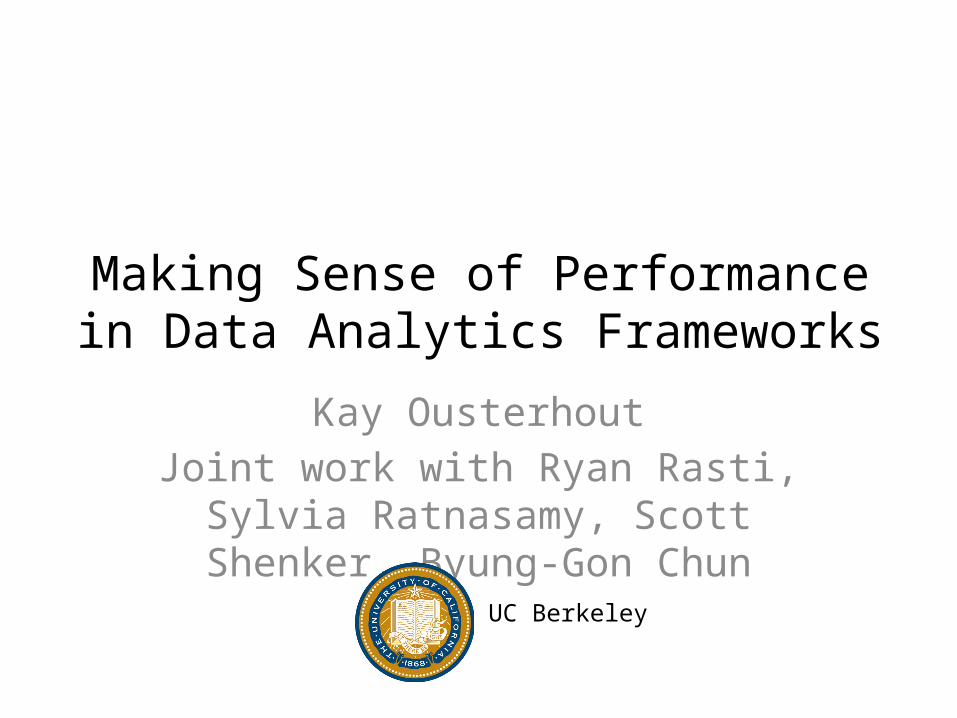
Making Sense of Performance in Data Analytics Frameworks
Kay OusterhoutJoint work with Ryan Rasti, Sylvia Ratnasamy, Scott
Shenker, Byung-Gon ChunUC Berkeley

About Me
PhD student at UC Berkeley
Thesis work centers around performance of large-scale distributed systems
Spark PMC member
…
……
Task Task
Task
Task
Spark (or Hadoop/Dryad/etc.) task

…
…
Task Task
Task
Task
Spark (or Hadoop/Dryad/etc.) task
…

…
…
Task Task
Task
Task
Task Task
Task
Task
…
…
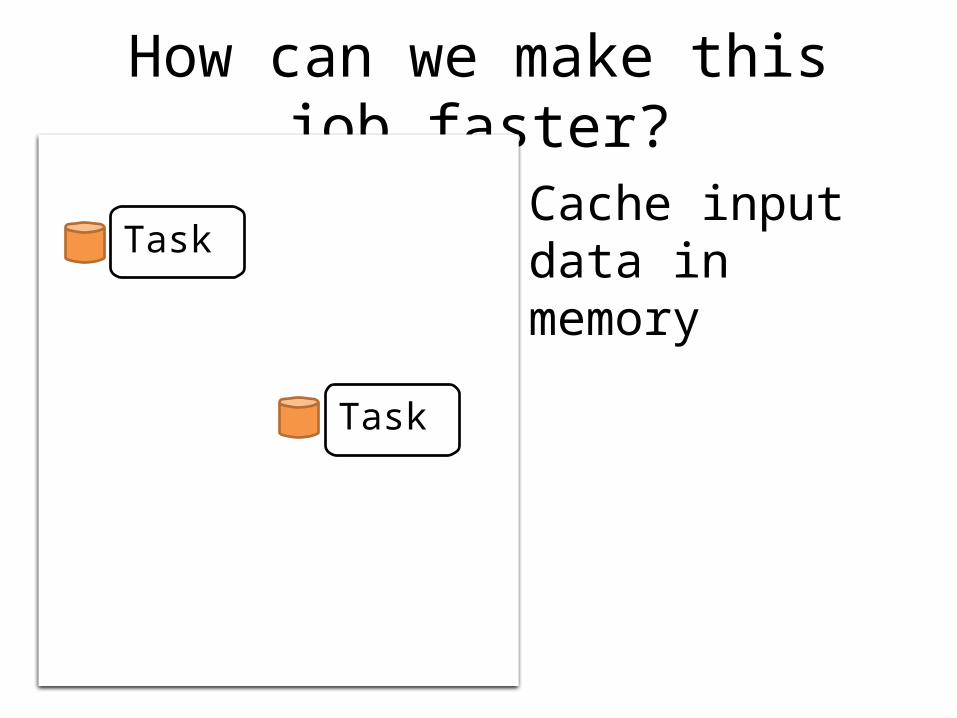
How can we make this job faster?
Cache input data in memory
Task
Task

…
How can we make this job faster?
Cache input data in memory
Task
Task

…
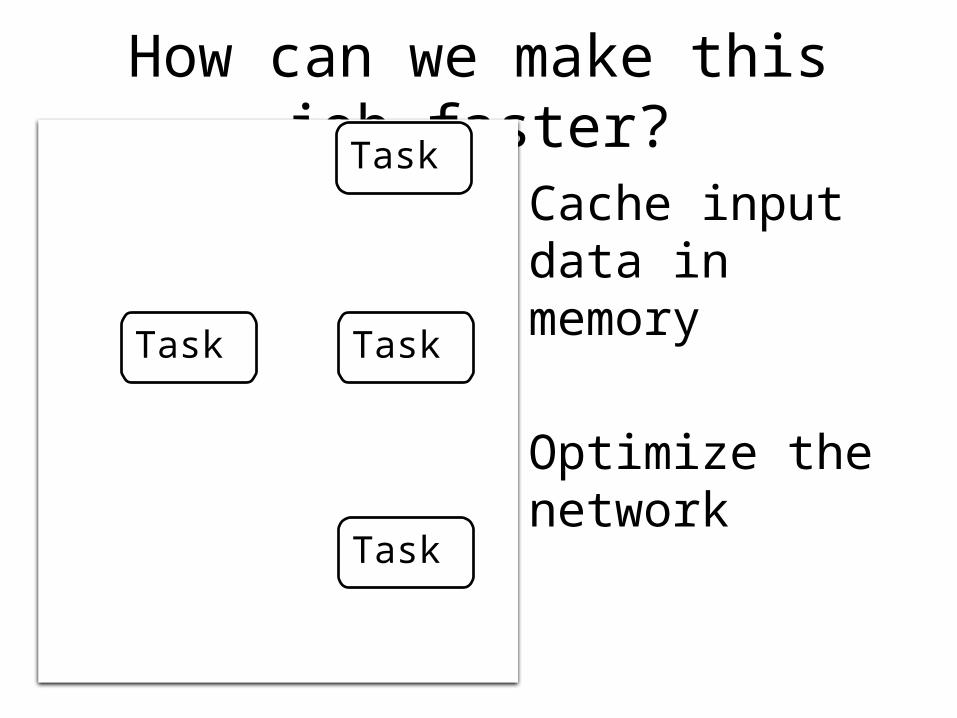
How can we make this job faster?
Cache input data in memory
Optimize the network
Task
Task
Task
Task
…
How can we make this job faster?
Cache input data in memory
Optimize the network
Task
Task
Task
Task
Task
Task
…
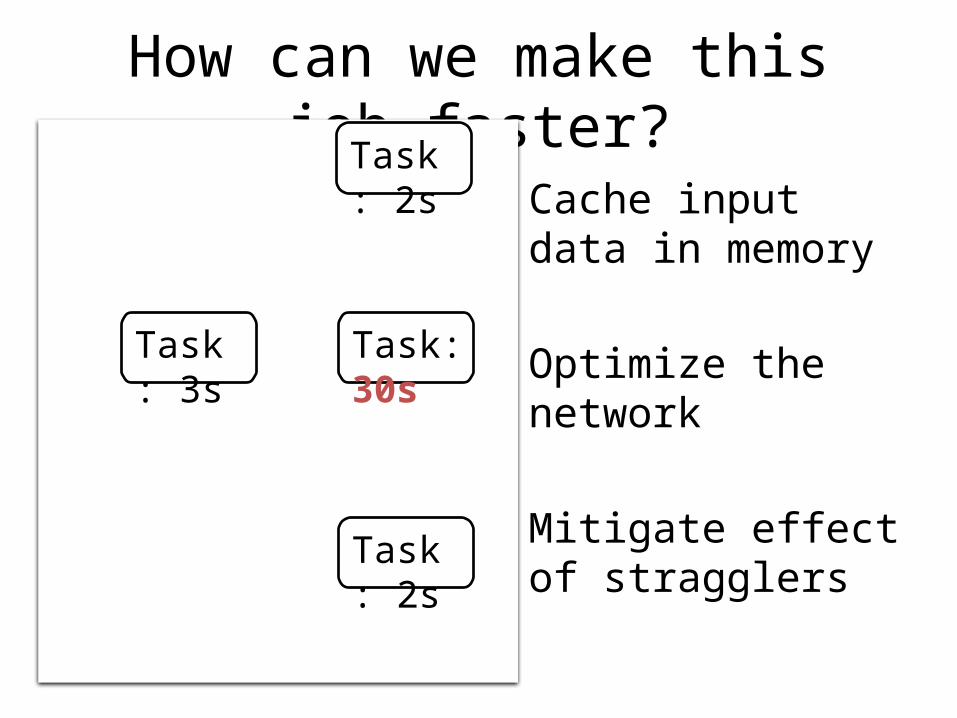
How can we make this job faster?
Cache input data in memory
Optimize the network
Mitigate effect of stragglers
Task
Task
Task: 30s
Task: 2s
Task: 3s
Task: 2s

StragglersScarlett [EuroSys ‘11], SkewTune [SIGMOD ‘12], LATE [OSDI ‘08], Mantri [OSDI ‘10], Dolly [NSDI ‘13], GRASS [NSDI ‘14], Wrangler [SoCC ’14]
DiskThemis [SoCC ‘12], PACMan [NSDI ’12], Spark [NSDI ’12], Tachyon [SoCC ’14]
NetworkLoad balancing: VL2 [SIGCOMM ‘09], Hedera [NSDI ’10], Sinbad [SIGCOMM ’13]Application semantics: Orchestra [SIGCOMM ’11], Baraat [SIGCOMM ‘14], Varys [SIGCOMM ’14]Reduce data sent: PeriSCOPE [OSDI ‘12], SUDO [NSDI ’12]In-network aggregation: Camdoop [NSDI ’12]Better isolation and fairness: Oktopus [SIGCOMM ’11], EyeQ [NSDI ‘12], FairCloud [SIGCOMM ’12]
Missing: what’s most important to
end-to-end performance?
StragglersScarlett [EuroSys ‘11], SkewTune [SIGMOD ‘12], LATE [OSDI ‘08], Mantri [OSDI ‘10], Dolly [NSDI ‘13], GRASS [NSDI ‘14], Wrangler [SoCC ’14]
DiskThemis [SoCC ‘12], PACMan [NSDI ’12], Spark [NSDI ’12], Tachyon [SoCC ’14]
NetworkLoad balancing: VL2 [SIGCOMM ‘09], Hedera [NSDI ’10], Sinbad [SIGCOMM ’13]Application semantics: Orchestra [SIGCOMM ’11], Baraat [SIGCOMM ‘14], Varys [SIGCOMM ’14]Reduce data sent: PeriSCOPE [OSDI ‘12], SUDO [NSDI ’12]In-network aggregation: Camdoop [NSDI ’12]Better isolation and fairness: Oktopus [SIGCOMM ’11], EyeQ [NSDI ‘12], FairCloud [SIGCOMM ’12]
Widely-accepted mantras:
Network and disk I/O are bottlenecks
Stragglers are a major issue withunknown causes
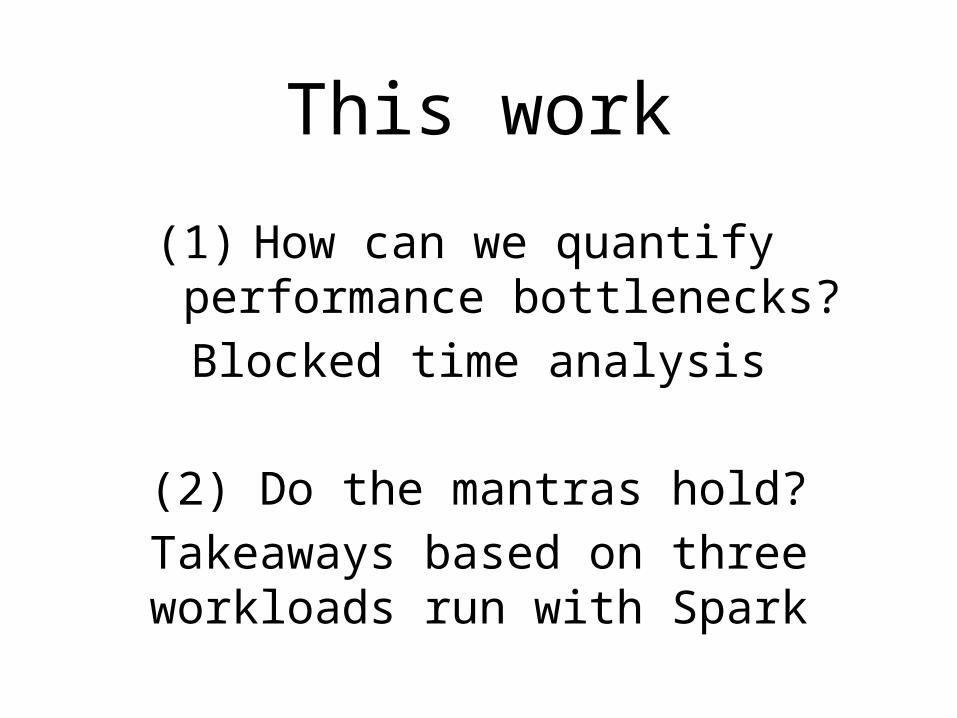
(1) How can we quantify performance bottlenecks?Blocked time analysis
(2) Do the mantras hold?Takeaways based on three workloads run with Spark
This work

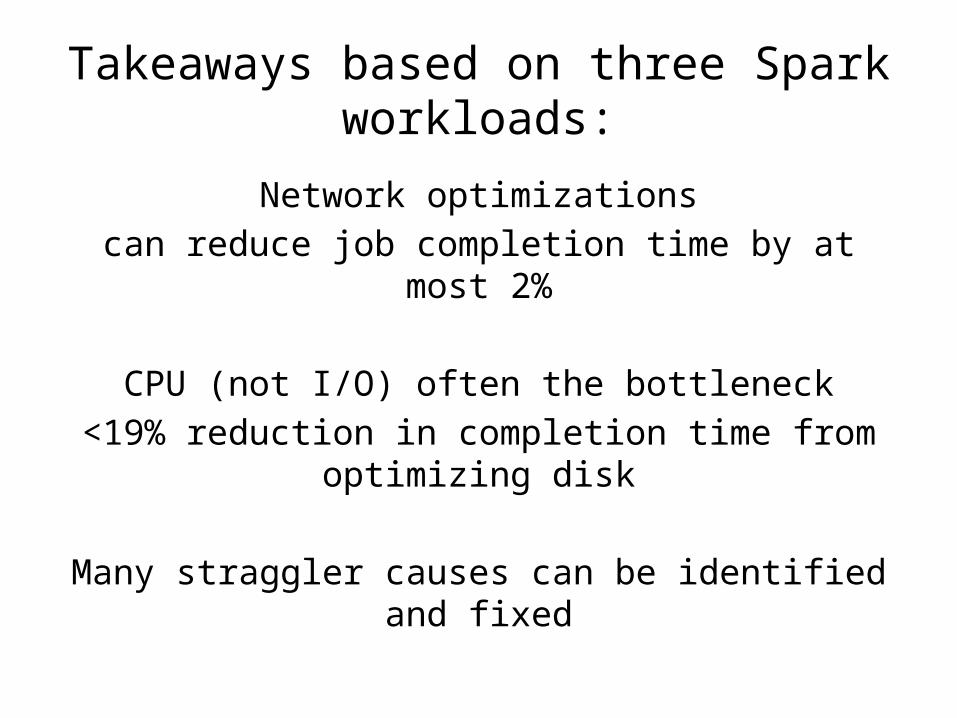
Takeaways based on three Spark workloads:
Network optimizationscan reduce job completion time by at most
2%
CPU (not I/O) often the bottleneck<19% reduction in completion time from
optimizing disk
Many straggler causes can be identified and fixed
Takeaways will not holdfor every single analytics
workloadnor for all time
Accepted mantras are often not true
Methodology to avoid performance misunderstandings
in the future
This work:
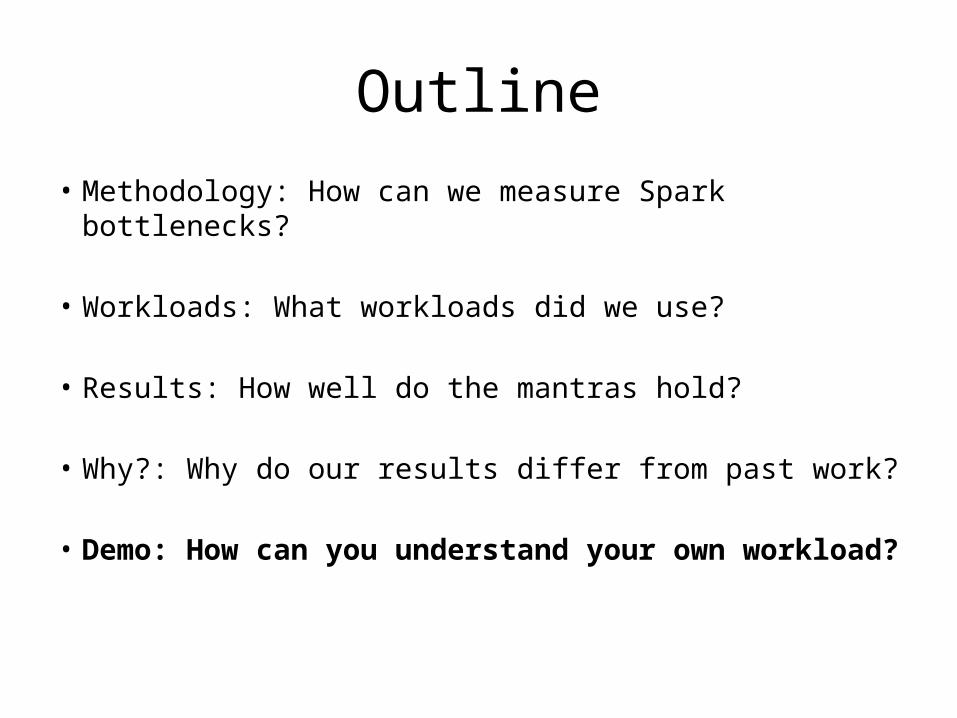
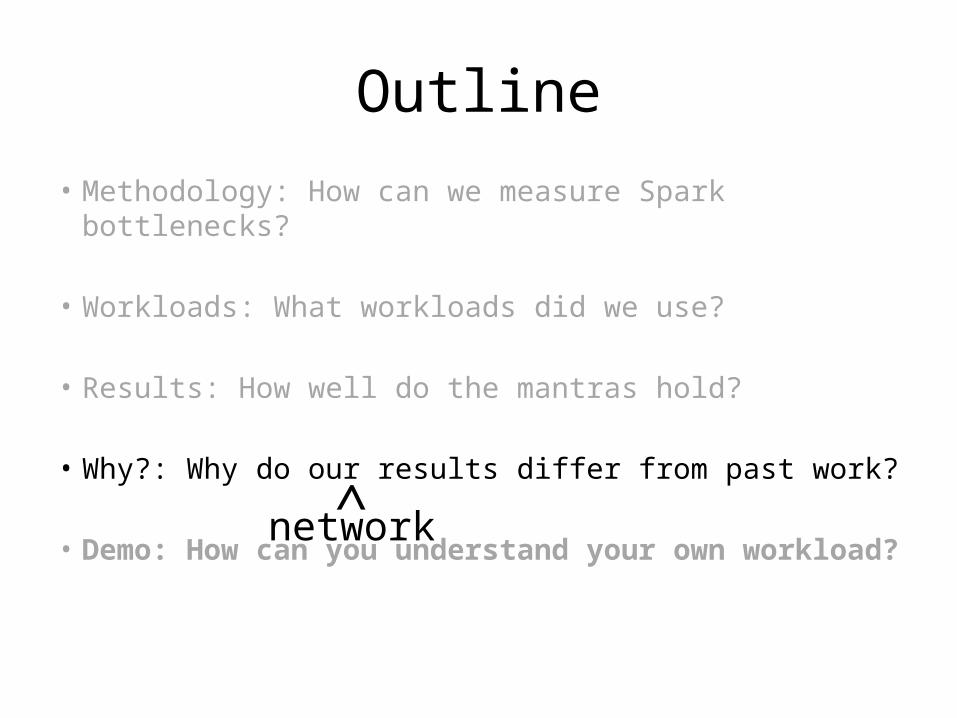
Outline
• Methodology: How can we measure Spark bottlenecks?
• Workloads: What workloads did we use?
• Results: How well do the mantras hold?
• Why?: Why do our results differ from past work?
• Demo: How can you understand your own workload?

Outline
• Methodology: How can we measure Spark bottlenecks?
• Workloads: What workloads did we use?
• Results: How well do the mantras hold?
• Why?: Why do our results differ from past work?
• Demo: How can you understand your own workload?

What’s the job’s bottleneck?
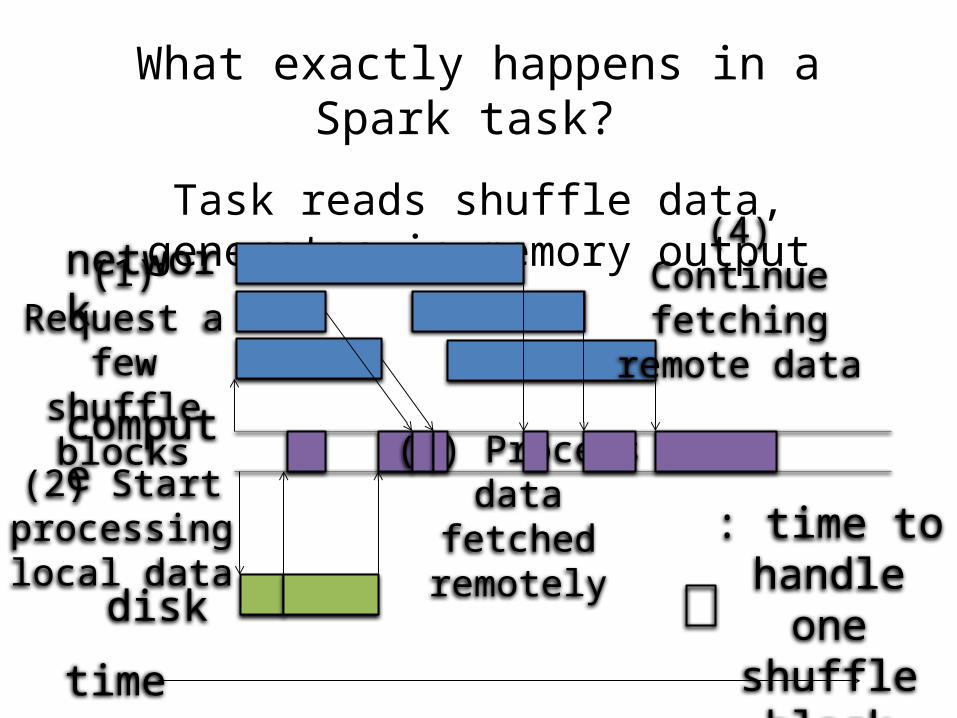
What exactly happens in a Spark task?
Task reads shuffle data, generates in-memory output
compute
network
time
(1) Request a few
shuffle blocks
disk
(2) Start processing local data
(3) Process data fetched
remotely
(4) Continue fetching
remote data
: time to handle one
shuffle block

What’s the bottleneck for this task?
Task reads shuffle data, generates in-memory output
compute
network
time
disk
Bottlenecked on
network and disk
Bottlenecked on network
Bottlenecked on CPU
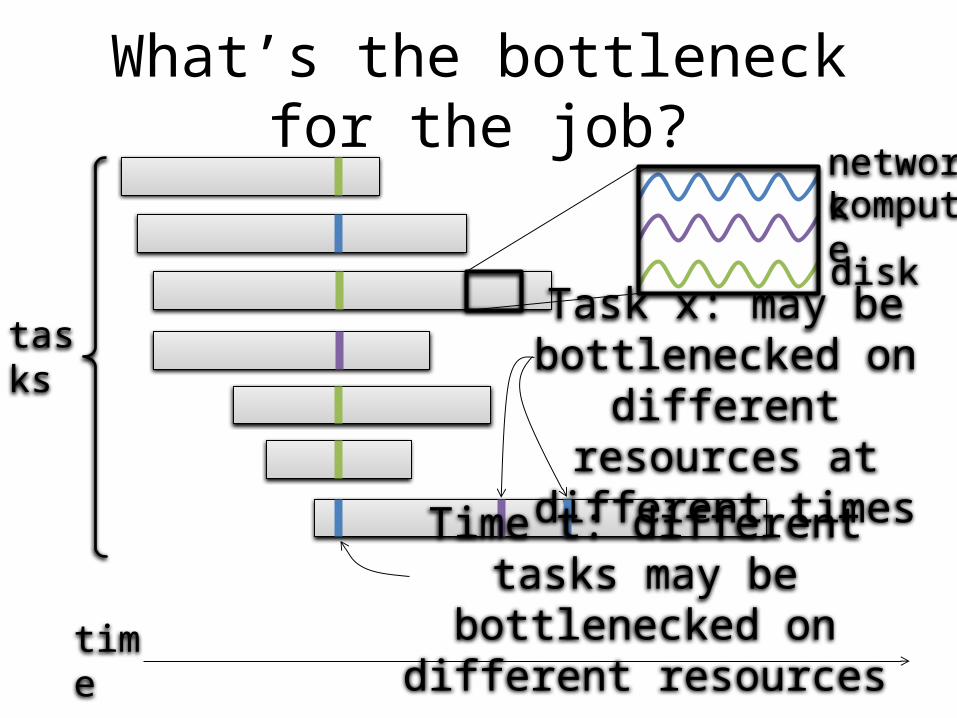
What’s the bottleneck for the job?
time
tasks
compute
network
disk
Task x: may be bottlenecked on
different resources at different times
Time t: different tasks may be bottlenecked on different resources

How does network affect the job’s completion time?
time
tasks
:Time when task is
blocked on the network
Blocked time analysis: how much faster would the job complete if
tasks never blocked on the network?

Blocked time analysis
tasks
(2) Simulate how job completion time would
change
(1) Measure time when tasks are
blocked on the network

(1) Measure time when tasks are blocked on network
compute
network
disk
: time blocked
on network: time blocked on disk
Original task runtime
task runtime if network were infinitely fast
Best case
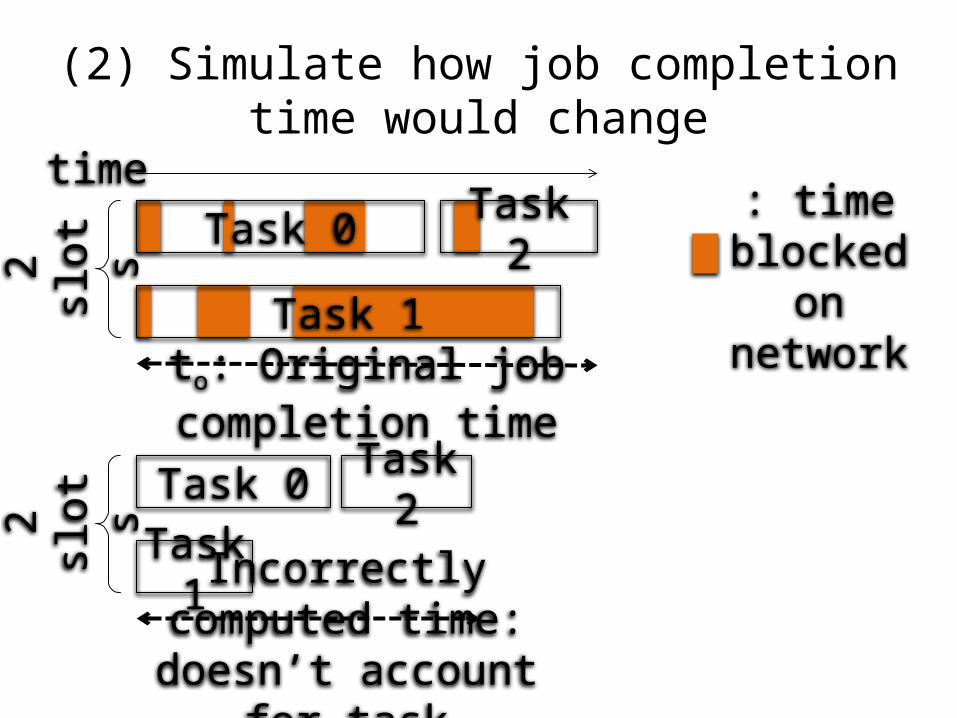
(2) Simulate how job completion time would change
Task 0
Task 1
Task 2time
2
slots
to: Original job completion time
Task 0Task
1
Task 22
sl
ots
Incorrectly computed time: doesn’t account
for task scheduling
: time blocked
on network

(2) Simulate how job completion time would change
Task 0
Task 1
Task 2time
2
slots
to: Original job completion time
Task 0Task
1Task
2
2
slots
: time blocked
on network
tn: Job completion time with infinitely fast network
Blocked time analysis: how quickly could a job have
completed if a resource were infinitely fast?

Outline
• Methodology: How can we measure Spark bottlenecks?
• Workloads: What workloads did we use?
• Results: How well do the mantras hold?
• Why?: Why do our results differ from past work?
• Demo: How can you understand your own workload?

Large-scale traces?Don’t have enough
instrumentation for blocked-time analysis

SQL Workloads run on SparkTPC-DS (20 machines, 850GB;
60 machines, 2.5TB; 200 machines, 2.5TB)
Big Data Benchmark (5 machines, 60GB)
Databricks (Production; 9 machines, tens of GB)
2 versions of each: in-memory, on-disk
Only 3 workloads
Small cluster sizes
Outline
• Methodology: How can we measure Spark bottlenecks?
• Workloads: What workloads did we use?
• Results: How well do the mantras hold?
• Why?: Why do our results differ from past work?
• Demo: How can you understand your own workload?
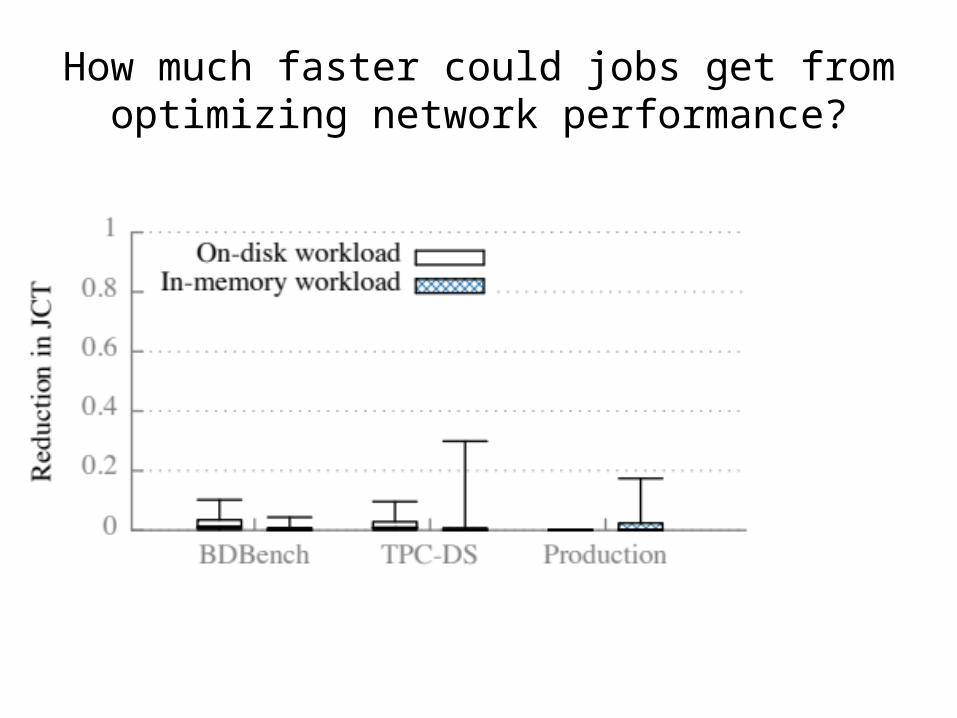
How much faster could jobs get from optimizing network performance?
How much faster could jobs get from optimizing network performance?
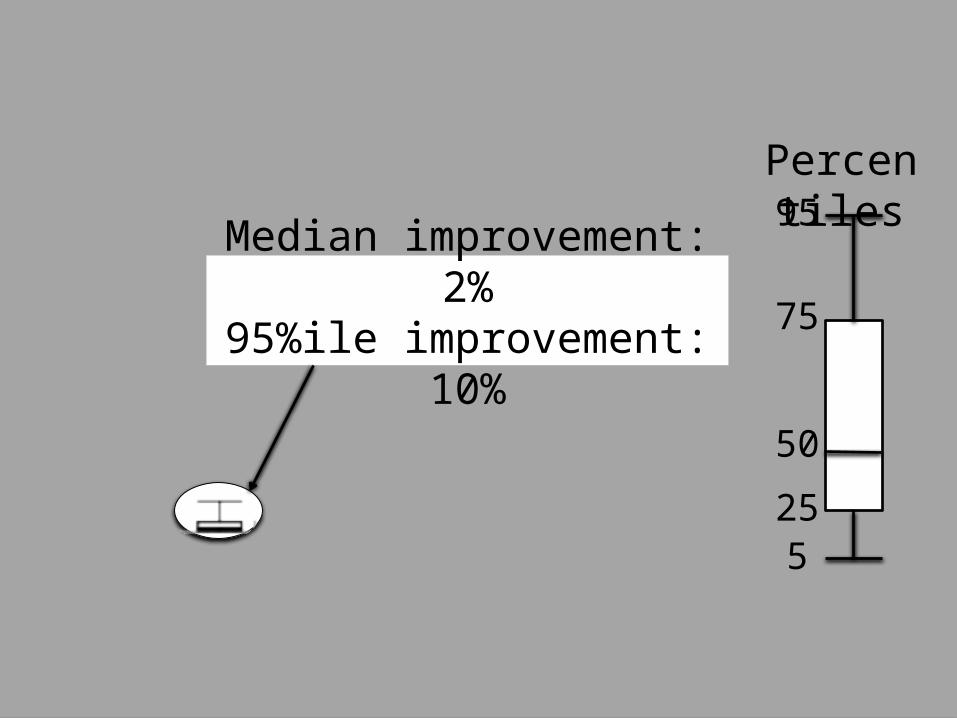
5
95
75
25
50
Percentiles
Median improvement: 2%
95%ile improvement: 10%

How much faster could jobs get from optimizing network performance?
Median improvement at most 2%
5
95
75
25
50
Percentiles

How much faster could jobs get from optimizing disk performance?
Median improvement at most 19%

How important is CPU?
CPU much more highly utilized than disk or network!
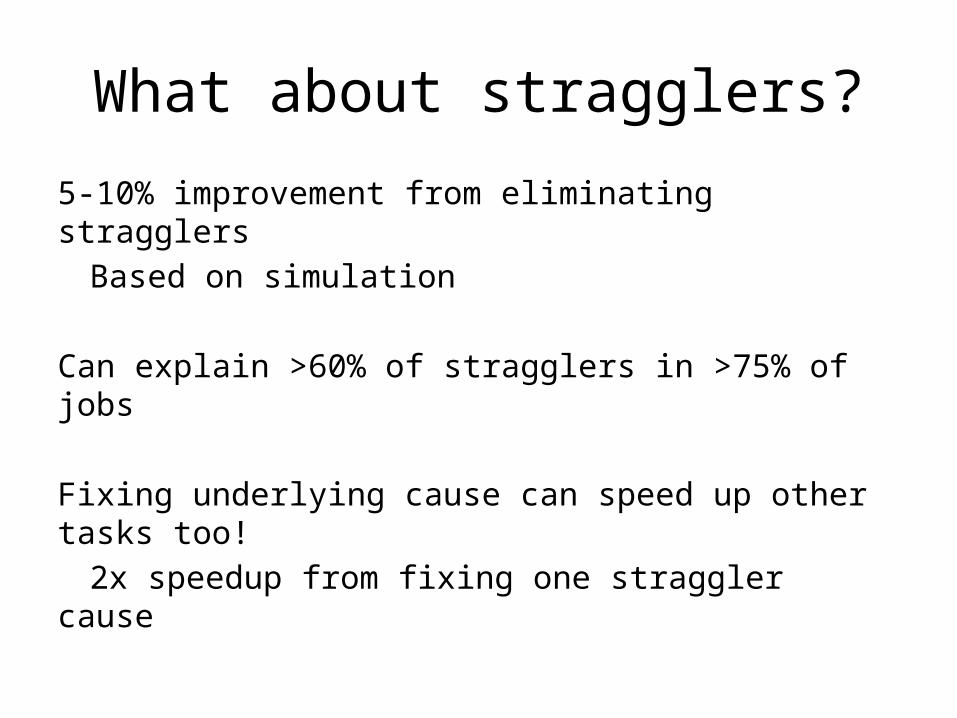
What about stragglers?
5-10% improvement from eliminating stragglers
Based on simulation
Can explain >60% of stragglers in >75% of jobs
Fixing underlying cause can speed up other tasks too!
2x speedup from fixing one straggler cause
Takeaways based on three Spark workloads:
Network optimizationscan reduce job completion time by at most
2%
CPU (not I/O) often the bottleneck<19% reduction in completion time from
optimizing disk
Many straggler causes can be identified and fixed
Outline
• Methodology: How can we measure Spark bottlenecks?
• Workloads: What workloads did we use?
• Results: How well do the mantras hold?
• Why?: Why do our results differ from past work?
• Demo: How can you understand your own workload?
network
>

Why are our results so different than what’s stated in prior work?
Are the workloads we measured unusually network-light?
How can we compare our workloads to large-scale traces used to motivate
prior work?

How much data is transferred per CPU second?
Microsoft ’09-’10: 1.9–6.35 Mb / task secondGoogle ’04-‘07: 1.34–1.61 Mb / machine second

Why are our results so different than what’s stated in prior work?
Our workloads are network light
1)Incomplete metrics
2)Conflation of CPU and network time

When is the network used?map task
map task
map task
…
reduce task
reduce task
reduce task
…
Input data (read locally
)
Output
data
(1) To shuffle
intermediate data
(2) To replicate output data
Some work focuses
only on the shuffle
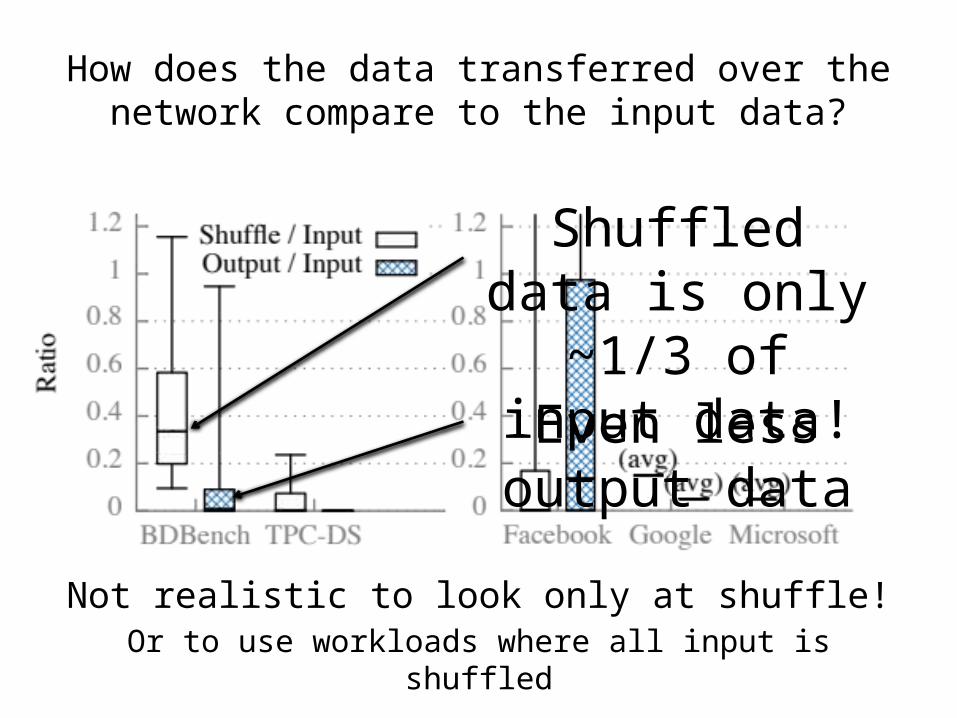
How does the data transferred over the network compare to the input data?
Not realistic to look only at shuffle!Or to use workloads where all input is shuffled
Shuffled data is only ~1/3 of
input data!Even less
output data
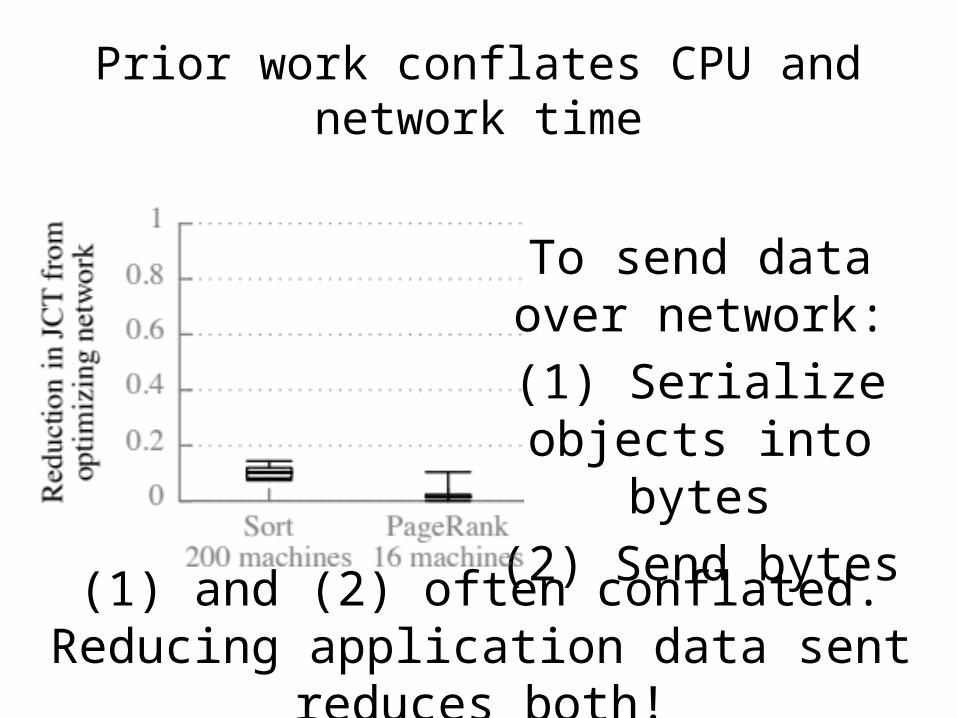
Prior work conflates CPU and network time
To send data over network:
(1) Serialize objects into bytes
(2) Send bytes
(1) and (2) often conflated.Reducing application data sent
reduces both!

When does the network matter?
Network important when:
(1) Computation optimized
(2) Serialization time low(3) Large amount of data
sent over network

Why are our results so different than what’s stated in prior work?
Our workloads are network light
1) Incomplete metricse.g., looking only at shuffle time
2) Conflation of CPU and network timeSending data over the network has an
associated CPU cost

Limitations
Only three workloadsIndustry-standard workloadsResults sanity-checked with larger
production traces
Small cluster sizesResults don’t change when we
move between cluster sizes
Limitations aren’t fatal
Only three workloadsIndustry-standard workloadsResults sanity-checked with larger
production traces
Small cluster sizesTakeaways don’t change when we
move between cluster sizes
Outline
• Methodology: How can we measure Spark bottlenecks?
• Workloads: What workloads did we use?
• Results: How well do the mantras hold?
• Why?: Why do our results differ from past work?
• Demo: How can you understand your own workload?

Demo
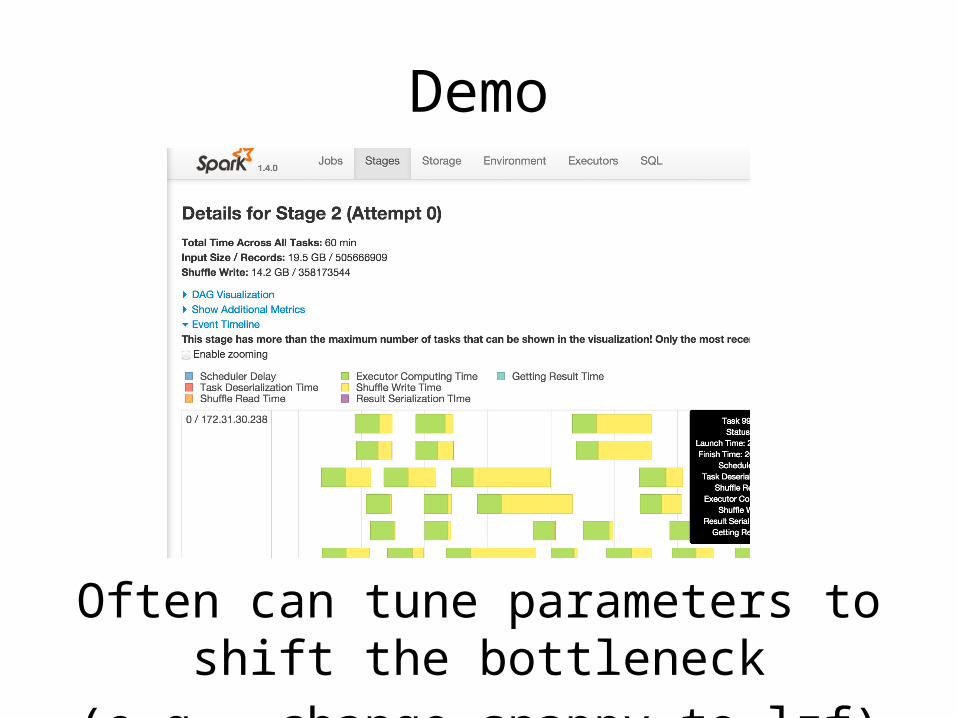
Demo
Often can tune parameters to shift the bottleneck
(e.g., change snappy to lzf)

What’s missing from Spark metrics?
Time blocked on reading input data and writing output data (HADOOP-11873)
Time spent spilling intermediate data to disk (SPARK-3577)
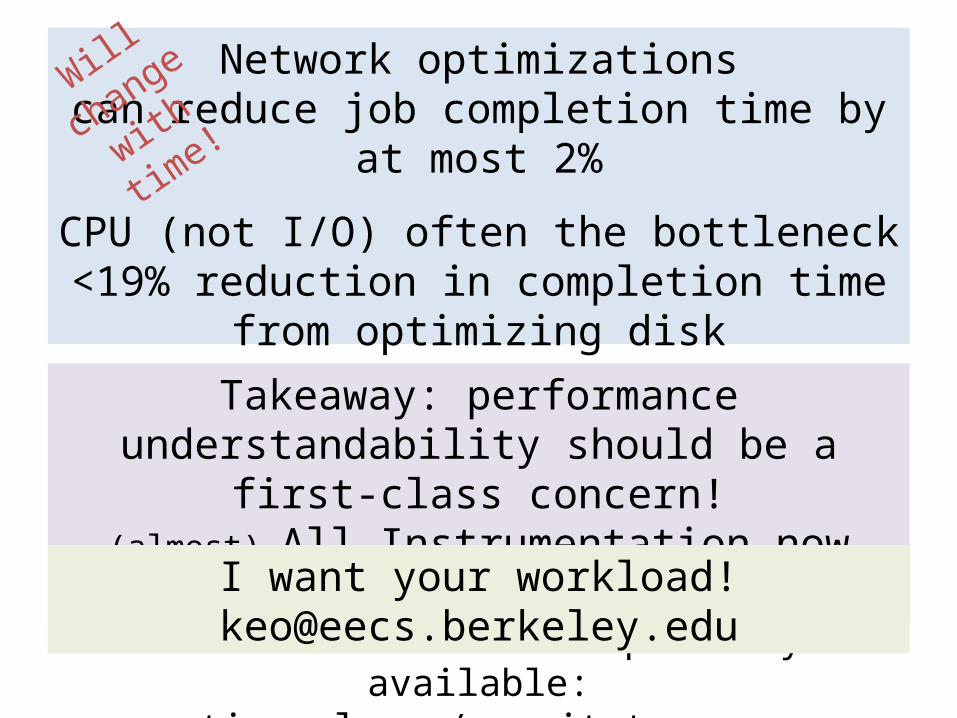
Network optimizationscan reduce job completion time by at
most 2%
CPU (not I/O) often the bottleneck<19% reduction in completion time
from optimizing disk
Many straggler causes can be identified and fixed
All traces and tools publicly available:tinyurl.com/summit-traces
Will
change
with
time!
Takeaway: performance understandability should be a first-class
concern!(almost) All Instrumentation now part of
SparkI want your workload! [email protected]