Making profits by leading retailers in the digital ...
38
HAL Id: hal-03332318 https://hal.archives-ouvertes.fr/hal-03332318 Preprint submitted on 2 Sep 2021 HAL is a multi-disciplinary open access archive for the deposit and dissemination of sci- entific research documents, whether they are pub- lished or not. The documents may come from teaching and research institutions in France or abroad, or from public or private research centers. L’archive ouverte pluridisciplinaire HAL, est destinée au dépôt et à la diffusion de documents scientifiques de niveau recherche, publiés ou non, émanant des établissements d’enseignement et de recherche français ou étrangers, des laboratoires publics ou privés. Making profits by leading retailers in the digital transition: A comparative analysis of Carrefour, Amazon and Wal-Mart (1996-2019) Céline Baud, Cédric Durand To cite this version: Céline Baud, Cédric Durand. Making profits by leading retailers in the digital transition: A compar- ative analysis of Carrefour, Amazon and Wal-Mart (1996-2019). 2021. hal-03332318
Transcript of Making profits by leading retailers in the digital ...

HAL Id: hal-03332318https://hal.archives-ouvertes.fr/hal-03332318
Preprint submitted on 2 Sep 2021
HAL is a multi-disciplinary open accessarchive for the deposit and dissemination of sci-entific research documents, whether they are pub-lished or not. The documents may come fromteaching and research institutions in France orabroad, or from public or private research centers.
L’archive ouverte pluridisciplinaire HAL, estdestinée au dépôt et à la diffusion de documentsscientifiques de niveau recherche, publiés ou non,émanant des établissements d’enseignement et derecherche français ou étrangers, des laboratoirespublics ou privés.
Making profits by leading retailers in the digitaltransition: A comparative analysis of Carrefour,
Amazon and Wal-Mart (1996-2019)Céline Baud, Cédric Durand
To cite this version:Céline Baud, Cédric Durand. Making profits by leading retailers in the digital transition: A compar-ative analysis of Carrefour, Amazon and Wal-Mart (1996-2019). 2021. �hal-03332318�

Political Economy Working Papers | No. 4/2021
Making profits by leading retailers in the digital transition
A comparative analysis of Carrefour, Amazon and Wal-Mart
(1996-2019)
Céline Baud (Université Paris-Dauphine)
Cédric Durand (Université de Genève, CEPN-Université
Sorbonne Paris Nord)
Department of History, Economics and Society, University of Geneva, UniMail, bd du Pont-d'Arve 40, CH-1211 Genève 4. T: +41 22 379 81 92. Fax: +41 22 379 81 93
Working paper

Making profits by leading retailers in the digital transition A comparative analysis of Carrefour, Amazon and Wal-Mart (1996-2019)
Céline Baud Université Paris-Dauphine
Cédric Durand
Université de Genève et Centre d’Économie Paris Nord [email protected]
Key words: Retailing, digitalization, financialization, profits, accounting JEL codes: L81, L22, M41, D22, G32 Abstract: This contribution documents the contrasting fate of three key actors of the retail industry since the mid-nineties: Carrefour, Wal-Mart and Amazon. Stylized facts about their respective financial trajectories and a description of their engagement with digitalization allow to identify their distinct dynamics. Through a combination of accounting, business and economic analyses, this paper clarifies the underlying logics of profit making in the context of retail digitalization and provides new insights concerning the role of fixed costs leveraging in the digital age.

1
1. INTRODUCTION ......................................................................................................................................................... 2 2. SOME STYLIZED FACTS ON CARREFOUR, WAL-MART AND AMAZON DIVERGING FINANCIAL TRAJECTORIES ..................................................................................................................................................................... 4
2.1. REVENUE AND ASSETS ........................................................................................................................................................... 4 2.2. ECONOMIC PROFITABILITY ................................................................................................................................................... 6 2.3. VALUE ACCRUING TO SHAREHOLDERS ................................................................................................................................ 8
3. THE DIGITALIZATION OF RETAILING ............................................................................................................ 11 3.1. ALGORITHMIC GOVERNMENTALITY IN THE RETAIL SECTOR ......................................................................................... 11 3.2. OMNICHANNEL CUSTOMER EXPERIENCE AND ENHANCED EFFICIENCY ....................................................................... 12 3.3. BEYOND THE RETAILING-MANUFACTURING DIVIDE ....................................................................................................... 13
4. DIVERSITY OF PROFITS STRATEGIES IN THE DIGITAL RETAIL TRANSITION ................................. 14 4.1. A COMBINATORY OUTLOOK ON VALUE CREATION AND VALUE APPROPRIATION ....................................................... 14 4.2. PROFIT SOURCES AND USES IN THE RETAIL DIGITALIZATION ....................................................................................... 16
5. THE UNEVEN UNFOLDING OF CARREFOUR, WAL-MART AND AMAZON’S DIGITALIZATION ..... 17 5.1. CARREFOUR: FROM ERRATIC METAMORPHOSIS TO BACKWARDNESS .......................................................................... 17 5.2. WAL-MART: THE RAPID MUTATION OF A LATECOMER ................................................................................................. 20 5.3. AMAZON: THE DEPLOYMENT OF A BUSINESS CONCEPT IN THE RETAIL SECTOR ........................................................ 22
6. “LEVERAGING FIXED COSTS”: INTELLECTUAL MONOPOLY DYNAMICS AND NETWORK EFFECTS IN THE MAKING OF PROFITS ........................................................................................................................................ 25 7. DISCUSSION AND CONCLUDING REMARKS ................................................................................................... 30
REFERENCES........................................................................................................................................................................................... 32

2
1. Introduction Modern retailing made a triumphal entry into the twenty-first century. From the mid-nineties to the mid 2000s, leading western retailers’ activities was expanding rapidly with an annual growth rate of their sales generally above 10 %, in large part resulting from a rapid internationalization of their operations (Baud & Durand, 2012; Durand & Wrigley, 2009; Hamilton et al., 2011; Wrigley & Lowe, 2007; Wrigley & Wood, 2018). However, since the 2008 crisis the situation dramatically reversed. The press even used the term “Retail apocalypse” to qualify the wave of brick-and-mortar stores closure and job destruction in developed economies throughout the 2010s (Centre for Retail Research, 2020; Fertik, 2019; Thompson, 2017). Diverse causes are mentioned for this trend among which, sluggish consumer spending and rising inequalities, over-indebtedness due to LBO operations and the oversupply of mall. But this sectoral trend conceals widening differences regarding the trajectories of individual firms, which suggests that, rather than a simple decline, retailing is experiencing a profound qualitative mutation. Indeed, the 2010s also are the decade when the development of e-commerce finally materialized the revolutionary promises of digital economic restructuring of the nineties. According to the U.S. Census bureau data, this market segment represented only 0.8% of retail sales in the US in 2000 but progressed to a share of 4.2% a decade later, in 2010, accelerating to 11.8% in the first quarter of 2020 (US census Bureau, 2020). More broadly, e-commerce has steadily increased in the past decade and ramped-up during pandemic lockdown, attaining new high in the second half of 2020 in countries where its use was already widespread such as China (25% of retail sales), Germany (21%) or the US (16%). In the meantime, retail e-sales accelerated markedly in countries where e-commerce was initially less developed and among new segment of the population. As a result nearly half of the world population is estimated to have made online orders in 2020 (Alfonso et al., 2021). In this context, firms’ capacity to develop their online activities and to take advantage of the opportunity offered by digitalization has become a key factor in their trajectory. However, the ability of firms to ride the digital wave is nothing less than uniform. This contribution proposes to explore this uneven digital restructuring of retailing through a study of three prominent western firms: Wal-Mart, Amazon and Carrefour. The reason we choose US based Wal-Mart and Amazon are straightforward. Wal-Mart is the industry leader; Amazon is the leading e-commerce firm. And these two firms are becoming increasingly direct competitors (Coulter, 2019; Gray & Lee, 2021; Irwin, 2017). The choice of Carrefour is different. While the French-based firm was second to Wal-Mart in terms of sale in the 2000s, it slid to the tenth rank of the sector at the end of the 2010s1. This firm thus provides us an interesting point of comparison in terms of relative decline. Overall, the very contrasted trajectories of the three firms provide a great opportunity for comparative analysis. In this paper we pursue such a work by focusing on the logics of profit making and its relation to the digitalization the industry. As we will show, this process cannot be understood by focusing only on technological changes. The uneven operational development
1 Carrefour S.A. has been excluded from Deloitte’s Global Power of retailing 2021 report at the company’s request. However, with a revenue of 83 bln USD in 2019, the French companies would rank the tenth according to this criterion just ahead of Tesco (Deloitte, 2021).

3
of the firms is also the outcome of managerial strategies and financial policies that must be clarified. In particular, it is important to explore to what extent the neoliberal puzzle of profits without accumulation identified in the industry a decade ago (Baud & Durand, 2012) is still relevant and how it relates to the qualitative metamorphoses of the sector. To do so, we first rely on a systematic analysis and comparison of the consolidated financial statements of the three firms (see dataset in appendix)2, as disclosed on the Orbis database under the so-called detailed format3. The analysis begins with Amazon’s first 12-months annual reporting, in 19954, and ends with the last pre-Covid reporting, at the end of 20195. Exploiting the power of such detailed accounting data allows to precisely delineate changes in financial and investment behavior at the firm level (Davis, 2016). Additionally, relying on accounting conventions provide a basis that enables comparisons between individual firms’ trajectories. However, as also stressed by Davis (2016) relying on accounting conventions may also restrict the analysis. To better capture the firm-level dynamics that may either challenge or subsume accounting conventions, we turned, in a second phase, towards the additional material provided by the three companies in their annual reports6, which provide a fresh outlook on the digital retail transition. Section 2 presents some comparative stylized facts in order to delineate the contrasted dynamics of Carrefour, Wal Mart and Amazon in terms of income, assets, profitability and value accruing to shareholders. Section 3 offers an overview of the issues identified in management studies about digitalization of retailing. Section 4 outlines a conceptual framework to relate profits sources and uses in the context of the digital transition. Section 5 describes these firms’ engagement in the retail digital transition and section 6 explores from an accounting perspective the traces of this mutation. Section 7 discusses our results and concludes.
2 Contrary to Carrefour and Amazon, Wal-Mart ends its fiscal year at the end of January. Data disclosed in January N+1 thus primarily relate to the activities pursued during year N. Accordingly, all the data presented here for any given year N for Wal-Mart are to be related to the financial statements published in January N+1. 3 Orbis is a database of financial information, ratings, earning estimates, stock data and news on globally listed public companies published by the Bureau Van Dijk (see: https://www.bvdinfo.com/en-gb/our-products/data/international/orbis). Company consolidated financial statements were downloaded under the ‘detailed format’ in current thousand US$. The ‘detailed format’ is a global format: its presentation is the same for all companies regardless of national templates, which enables comparisons. Additionally, available data on Orbis regarding patent portfolio and stock (pricing series beginning in 2002) have also been exploited. 4 Time-series relying on growth data consequently begin in 1996. This also allows us to divide the time-period in 4 sub-periods of 6 years each, which explains why year 1995 has been omitted in Figure 4 to 7. 5 2019 (2020 for Wal-Mart) is also the first year of application of the new accounting standards for leases (IFRS 16 and ASC 842, issued as ASU 2016-02), which makes comparability with previous years difficult. As a proxy, we chose not to recognize operating lease right-of-use assets in our 2019 data on assets. As, contrary to IAS 17 and ASU 2016-02, IFRS 16 does not require the differentiation of finance and operational leases, for Carrefour, we chose to derecognize the total lease right-of-use assets and to recognize instead the amount of right-of-use assets relating to finance leases published immediately before the date of first-time application of IFRS 16 (367 million euros, at January 1, 2019). We also chose to ignore the other impacts of these changes, which limits the comparability of the data with previous years. 6 Notably in the “notes to the consolidated financial statements” and in “the Management's Discussion and Analysis of Financial Condition and Results of Operations”, which have been thoroughly analyzed.

4
2. Some stylized facts on Carrefour, Wal-Mart and Amazon diverging financial trajectories
In this section we briefly sketch the financial trajectories of Carrefour, Wal-Mart and Amazon. We first look at their revenue and fixed assets growth. Second, we consider their profitability. Then we turn to value accruing to their shareholders. Presenting their diverging trajectories allow to contrast their fate, paving the ground for an examination of the relationship between profit making and the digital transformation of the industry in the rest of the paper.
2.1. Revenue and assets Up-to the 2008 financial crisis we observe a long period of sustained total income growth for Carrefour, Wal-Mart and Amazon, but the trends dramatically diverged afterward (Figure 1). Figure 1 Carrefour, Wal-Mart and Amazon total revenue (1995-2019)
The evolution of the growth of revenue (Figure 2) and fixed assets (Figure 3) of these three firms show their very distinctive fates. The operations of Carrefour, which was the second global retailer in the 2000s declined markedly since the great financial crisis. While its total revenue increased at an annual rhythm above 10% between 1995 and 2007, it subsequently turned negative at annual rate of about 3 %. As a result, its sales in nominal terms contracted from 122 bln$ in 2007 to 83 bln$ in 2019, a massive retreat of one third in nominal terms and about 40 % in real terms. Correspondingly, while the French retailer was accumulating fixed assets at a rapid pace up to 2007, it reduced them afterwards. In addition to shrinking its hypermarket segment in France, it divested most of its foreign operations. The most spectacular retreat at a 5% annual rate was immediately after 2008 but it continued at a slower pace afterwards.

5
Contrastingly, Wal-Mart, who is the industry leader and the largest private company in the world by revenue and number of employees (Fortune, 2020), managed to pursue its expansion, although at a slower rate than in the previous period. Annual revenue growth dramatically slowed from above 13% at the turn of the millennium to less than 2% since 2014. Facing new challenges, the firm rolled back some of its investment in Japan, Argentina, UK and Brazil (Narioka & Landers, 2020). In parallel, it focused on strengthening its positions in North and Central America, in China and in Asia and on fostering its e-commerce segment thanks to the development of its omnichannel capabilities (see section 5.2). As a result, the pace of expansion of its fixed assets very markedly diminished but it stayed nonetheless positive. Without surprise the fate of Amazon is very different from that of traditional retailers. Amazon is the firm that embodies the digital retail Zeitgeist. Its sales increased at a yearly rate of 30 % between 2002 and 2013 and stayed very dynamic at 25 % since then. As a result the firm supplanted most other retailers, positioning itself second at a distant sight of Wal-Mart with a global turnover of $ 280 blns USD in 2019 against $ 524 blns for the firm based in Bentonville (Arkansas). True, part of Amazon’s growth is provided by the expansion of cloud-based business services and subscription services. However, in 2019, these account respectively for 12% and 7% of the firm’s revenue, while 50% of it income comes from online stores, 20% from third party selling services and 5% from physical stores (Ang, 2020). Retailing is thus the most important business segment of the firm. The scaling up of Amazon’s operations went hand in hand with an increasing internationalization, in the 2010s in a wide array of new countries, including Singapore, Turkey, Australia, India and Brazil (Szahun, 2020). This translates in very dynamic expansion of the fixed assets basis with an astonishing 50% yearly increased from 2008 to 2013 and still a 37% increased afterwards. Figure 2: CAGR total revenue of Carrefour, Wal-Mart and Amazon by 6 years period (1996-2019)

6
Figure 3: CAGR fixed assets of Carrefour, Wal-Mart and Amazon by 6 years period (1996-2019)
2.2. Economic profitability The comparison of revenue and fixed assets growth establish a clear distinction between a rapidly expanding and internationalizing business (Amazon), a declining one (Carrefour) and an industry leader that considerably slowed its growth but nonetheless pursue its expansion as it focused on a handful of key markets (Wal-Mart). Looking at profitability the picture is somehow different. The mark-up (net profit / total revenue) at Wal-Mart stayed at a very high level over the whole period. It improved continuously (from 3 to 3.5%) before declining at an average of 2.5% after 2014 (Figure 4). Mark-up at Amazon is lower, at about 2%, but stable. Contrastingly, Carrefour experienced a drastic reduction of its mark-up. It was always lower than at Wal-Mart but the decline is nonetheless spectacular, from around 2% before 2008 to about 0.7% in the last period.

7
Figure 4 Carrefour, Wal-Mart and Amazon mark-up (6 years periods average, 1996-2019)
Turning to the return on assets (ROA) allows to assess more specifically the economic profitability of these firms (Figure 5). It confirms the dynamic observed in terms of mark-up. Carrefour profitability declined sharply after the 2008 crisis, from an average of 4 % in 2002-2007 to 1.1% in the last period. Wal-Mart ROA stayed generally stable but slightly declined in the last period, at 7.2 %, while Amazon appears to be less profitable after 2008. However, confrontation of ROAs with mark-ups also highlights one of Wal-Mart’s key strengths: if its mark-ups are always above average, the company’s profitability is also strongly driven by its impressively high - and stable - asset turnover ratio (revenue/assets), which allows to leverage on the mark-ups. Thus, Wal-Mart asset turnover ratio has never been under 2,26 during our 24 years period, while Carrefour never reached this level and Amazon has continuously failed in maintaining such an efficient use of assets after 2008 (Figure 5 bis in appendix).

8
Figure 5 Carrefour, Wal-Mart and Amazon economic profitability (ROA, 6 years periods average, 1996-2019)
2.3. Value accruing to shareholders As shown in Baud & Durand (2012), because of their business model, retailers benefit from a cash-generating operating cycle that allows to operate with reduced levels of long term funds (equity and debts). Combining this advantageous situation with some degree of debt leverage then allows to further increase return to shareholders. This is how, year after year, Wal-Mart steadily turns its strong ROAs into even more impressive ROEs and how Carrefour, which has very aggressively relied on this strategy, has for long maintained – and arguably still maintains – a level of ROE disproportionate to its plummeting ROA (Figure 6 and Figure 6 bis and 6 ter in the appendix). However, debt leverage is an efficient strategy to amplify return to shareholders only in so far as economic profitability is higher than the cost of debt. This explains why Carrefour had to depart from this strategy and reduced its indebtedness in the last period while Amazon, which is developing the same aggressive strategy adopted by Carrefour until the mid-2010’s, has successfully turned its decreasing ROA into an improving ROE.

9
Figure 6 Carrefour, Wal-Mart and Amazon financial profitability (ROE, 6 years periods average, 1996-2019)
Another spectacular evolution concerns the distribution of dividends and buybacks to shareholders (Figure 7). Carrefour used the downsizing of its activities to fund its payments to shareholders well above its profits in the post 2008 period, however this strategy finally collapsed as the firm capacity to distribute extinguished from 2013 on. In the case of Wal-Mart one observes a steady increase of the distributed earnings to shareholders. In a context of enduring high profitability and slowing growth, retained earnings accumulated to such an extent that, during the last period, Wal-Mart has even been able to distribute more than its profits while simultaneously reducing its debt to equity ratio. The trajectory of Amazon is very different. The firm did not distribute directly any funds to its shareholders, except between 2006 and 2008 and in 2011 and 2012. The negative numbers correspond to a period when it distributed in spite of losses, however in a context of overall very robust growth. Taking into account the variation of the equity price in addition to distribution, the total shareholder return (TSR) helps to understand the spectacularly distinctive dynamics at stake (Figure 8). While the shareholders of Carrefour are finally losing money, Wal-Mart’s TSR is rising as a result of increased distribution while Amazon’s shareholders are getting richer at a very impressive rhythm thanks to the appreciation of the equity price and not in reason of the distribution of earnings.

10
Figure 7 Carrefour, Wal-Mart and Amazon distribution to shareholders (dividends and buybacks over profits, 6 years periods average, 1996-2019)
Figure 8 Carrefour, Wal-Mart and Amazon total shareholder return (dividends, buybacks and equity variation over capitalization, periods average, 2003-2019)
This outline of the dynamic of revenue, fixed assets growth, profitability and value accruing to shareholders allow to make two broad statements. First, slow growth for Wal-Mart and decline for Carrefour after 2008 contrast vividly vis-à-vis the previous period of rapid and profitable expansion for both firms. Second, the fate of the three firm is highly divergent since 2008.

11
Carrefour is descaling rapidly its operations in the meantime as its profitability plummeted which, in the last period, imply that its shareholders are getting poorer. Wal-Mart the industry leader is able to preserve a very high level of profitability but with a sluggish growth as it refocuses its activity. However, contrary to Carrefour, the firm manages to increase its distribution to shareholder relatively to its profits and enrich its shareholders at an accelerating rhythm. Finally, Amazon, is very rapidly expanding its operations but this occurs with a lower profitability in comparison to Wal-Mart. Return to its shareholders are almost exclusively driven by the very rapid increase of equity price. In the rest of this paper, we will analyze to what extent these contrasted evolutions can be related to uneven engagement in the digital transition.
3. The digitalization of retailing The implication of the introduction of ICT in retail firms is a matter of interest for decades. Research has for example documented operational improvement resulting from the introduction of control systems linked to electronic point of sale (EPoS) technologies in UK supermarkets from the mid-seventies on (Nightingale et al., 2003) while McKinsey attributed an important role of IT uses by Wal-Mart in the US productivity surge of the late nineties (McKinsey Global Institute, 2001). On a less functionalist perspective, sociologists have discussed the deployment of the barcode scanning in the grocery retail sectors over the course of four decades as an emerging market infrastructure (Kjellberg et al., 2019). In the 2010s the digital transformation of retailing dramatically accelerated. Reviewing some pieces of the literature to outlines the main venue of transformation, this section exposes the new assertiveness of algorithmic governmentality in retailing, the rise of omnichannel devices and the redefinition of the retail-manufacturing divide.
3.1. Algorithmic governmentality in the retail sector The growing role of Big Data and predictive analytic in the industry and the related deployment of algorithmic governmentality fosters the digital transformation of retail businesses and retail value chain. Algorithmic governmentality refers “to a certain type of (a)normative or (a)political rationality founded on the automated collection, aggregation and analysis of big data so as to model, anticipate and pre-emptively affect possible behaviors”. One of its main features is that it “avoids reflexive human subjects, feeding on infra-individual data which are meaningless on their own, to build supra-individual models of behaviours or profiles without ever involving the individual, and without ever asking them to themselves describe what they are or what they could become.” (Rouvroy & Berns, 2013) In the context of retailing, this social technology produces very powerful effect. For example, in the realm of supply-chain management. Consulting firm McKinsey explains how data-informed automating advanced planning can dramatically improve quality and reduce costs thanks to better demand forecasting:
Leading retailers have already created algorithms with which software can automate order processes by “learning” from data - also without having to rely on rules-based programming. This entails determining and continually optimizing all parameters that influence replenishment management individually at article and store levels. Often, more than 50 parameters are factored into the analysis, among them prices

12
and sales promotions (including those of competitors), cannibalization, local weather conditions, store opening times, and holidays - and at a far greater level of detail than standard systems. This results in more precise demand forecasts and more cost-effective orders. On average, retailers with such planning systems report a 25 percent reduction in stock shortages in their fresh-produce assortment, at least a 10 percent decrease in write-offs, up to 9 percent higher gross margins, and a better inventory range. At the same time, the cost of inventory planning decreases by as much as 30 percent due to the higher degree of automation.(McKinsey, 2020, p. 45)
On the other side of retailing, regarding the relation with customers, the concept of “deep retail” relates to the possibilities of hyper-personalization of trade services. As stressed by Bradlow et al., “When one takes the multiplicity of People × Products × Time × Location × Channel data, this is bigdata. Retailers that have the ability to link all of these data together are ones that will be able to not only enact more targeted strategies, but also measure their effects more precisely (2017, p. 81). Hyper personalization appears then as the new frontier of retailing (Shukla & Nigam, 2018). KPMG (2019) explains that the use of behavioral and real-time data is a new Eldorado for the industry :
For many years, every customer with a smartphone has been a source of data. However, the new frontier in personalization will analyze emotional data, eye movements and DNA in addition to searches, purchases and views to pinpoint exactly what customers need in real time. Hyper personalization is the next step in our obsession with data. (…) AI, image recognition mood analysis provide deep detailed understandings consumer attitudes, reactions patterns. Background image: emotional level and take analytics technologies to the next level”.
3.2. Omnichannel customer experience and enhanced efficiency Most management studies and consulting firms consider that retailing digitalization brought in innovations that can improve both consumer experience and firms’ profits. An important venue in this direction is the development of omnichannel retailing i.e. the integration of mobile, web-based store customer experience (Jocevski et al., 2019). On the one hand, technology enables consumers to make more informed decisions, receive more targeted and beneficial offers, and obtain faster service. On the other hand, digitalization assists retailers in reaching appropriate consumers at lower costs, due to technologically created efficiencies (Grewal et al., 2017). For example Inman and Nikolova (2017) explore how technology can create new sources of profits by: 1) “extracting greater consumer surplus (e.g., charging higher prices to shoppers who are
willing to pay more), increasing the amount purchased at the retailer by current shoppers, attracting new shoppers to the retailer and increasing payments from suppliers”
2) thanks to technology-derived cost decreases due to “offloading labor to shoppers (e.g., self-scanning) and automating processes (e.g., digital shelves)”.
Revealingly, most management studies on the issue tends to overlook the implications of increasing digital mediation of retail work. The concept of ‘algorithmic management’ refers to dispositive where algorithms track the performance of employee and assign them tasks (M. K. Lee et al., 2015; Schildt, 2017). In the meantime, the generalization of mobile phone equipment opens the possibility of much greater “domestication” of consumers in the context of physical stores. Indeed, establishing a link between

13
“cookified” individuals and drivers of shopping-cart promises “a 360-degree view on consumers” (Beauvisage & Mellet, 2020). However, while these tools can improve some productivity metrics (Munandar & Khoriyah, 2020), their frailties tend to be ignored. Loss of sense of worker activity, intensification of labor and disregards vis-à-vis non-coded activity and symbolic labour are identified as the main pitfalls of such dispositive (Evans & Kitchin, 2018). In addition, customers increased access to and use of smartphone lead to more complexity of the job of sales assistant in bricks and mortar stores. In such a context, mismatches in terms of equipment and competencies could hinder the ability of worker to meet customers’ requirements while the use of digital device can also constrain engagement with them (Arkenback, 2019). Overall, new forms of engagement with customers and the related transformation of the mobilization of labor cannot be reduced to efficiency-enhancing dimensions. They participate in the redefinition of social relations, an ongoing and open-ended process where the repositioning of competing economic interests and agencies are at stake.
3.3. Beyond the retailing-manufacturing divide Some authors insist that digitalization leads to a transformation of the retail value chain, with a changing articulation between brand manufacturers, institutional retailers and consumers (Reinartz et al., 2019). The division of labor between providers of consumer goods and those engaged in distribution and sales has been rather stable for decades: consumers were essentially relegated to a passive role while institutional retailers operating brick and mortar stores played a central role in interconnecting and maintaining relationship between manufacturers and end consumers, pushing the products of the first to the second. The surge of digital technology is rapidly transforming this traditional linear structure (manufacturer => retailer => consumer). The digital opportunities of use value creation at the firm level (automation, personalization, interaction...) bring in perceived benefits for customers (convenience, relevance, savings, empowerment…). In the meantime, they allow for a transformation of the vertical market structure as manufacturers and digital platforms compete increasingly with traditional retailer to engage directly with final consumers. A monography on the implementation by the Chinese platform JD.com of the consumer-to-manufacturer model (C2M) illustrates the dramatic transformation at stake (Mak & Max Shen, 2020). The concept is that of a fully demand-driven supply chain thanks to intensive digitalization. JD had in June 2020 417.4 million of active users which brings to the firm a vast amount of consumer preference and behavior data. Its C2M model allows the platform to move beyond customization order by:
1) accelerating products design and simulation. Its data analytics allows to identify and anticipate unfulfilled needs of consumers. The important point is that in addition to product characteristics this business process takes into account potential sales, buyers and prices and launch product test and trial procedures that explore simultaneously the product-consumer fit and the entire purchase experience, i.e. marketing conditions, including packaging, delivery...

14
2) fueling integrated planning process with big-data-driven forecasts to prepares both upstream manufacturing and downstream distribution operations ahead of order placement.
As the authors note “digital coordination of operations across boundaries of facilities and supply chain stages enables them to operate as one virtual entity, thus achieving quick response to customer demand as well as efficient operations” (2020, p. 7). Accordingly, smart manufacturing proposes to leverage digital integration in order to achieve “rapid-response, low-inventory efficient small-batch production operations” as front-end platform provides consumers with a variety of customization purchasing scenarios whereas the back-end coordinates the upstream processes to respond to demand quickly. In sum, the deployment of digital technology empowered by big data brings in a dramatic change in business processes and business models, in particular via radically enhanced supply chain management and much deeper engagement with customers. We will detail in section 5 how the firms we focus on participated in this digital transformation of retailing. However, from a broader economic point of view, one should note that these managerial literature studies do not consider how investment and profit dynamics in retailing are related to these transformations. We now turn to a conceptual discussion of these issues.
4. Diversity of profits strategies in the digital retail transition The concept of “control revolution” (Beniger, 1986; Bensussan, 2021) exposes the uneven evolution of industrial techniques and information systems and its consequences. One particular salient problem in the context of digitalization is that innovation in control technology can foster value creation but do not necessarily coincide with value appropriation (Björkdahl & Holmén, 2019). We propose that, in the context of retail digitalization, the discrepancy between investment activity and profitability is a manifestation of such a crisis. In order to explore this possibility, we proceed in two steps. First, we set-up an elementary framework explaining firms’ dynamics according to the manner they articulate value creation and appropriation. Second, we delineate three diverse profits strategies in the digital transition relating to investment and payout policies. These stylized strategies will help us to explore in the next sections the relation between digitalization and business trajectories of the three firms under consideration in this research.
4.1. A combinatory outlook on value creation and value appropriation In this highly stylized development, we consider sustained investment as a proxy for value creation as investing aims to the amplification and renovation of the business model. Contrastingly, profitability is considered as a manifestation of the ability to appropriate value. Combining these two dimensions, Table 1 distinguish four stylized business dynamics7. 7 This matrix echoes some aspects of the famous BCG growth share Matrix (Boston Consulting Group, 2021, 1968). However, it diverges from it in three fundamental ways. The first is that it focuses not on the fate of various business units in a single firm but on the fate of various firms at the intra-industry or the inter-industry level. The second concerns the relational dimension: here predation and subordination are two interdependent dynamics. Three, contrary to the BCG framework, this matrix is not designed to inform management practices but rather to enlighten sector and/or economy wide dynamics.

15
First, firms can both create and appropriate value which allow them to expand (expansion). However, it is also possible that value creation and value appropriation do not coincide. We thus have a second configuration where firms can create value for customers or other firms but are not necessarily able to capture that value. This configuration is non desirable and often non sustainable from a business perspective. It can be temporary when it corresponds to the launching of a new business or a restructuration linked to product or process innovation (starting-up). In this case the firm will attempt to modify the business model through the provision of new services in order to capture value (Björkdahl & Holmén, 2019). It can also be structural when for subordinate capitals it is not possible to exit due to sunk cost but it is nonetheless possible to survive as long as profits, although abnormally low, are above interest rate, for example in the context of global value chains (Starosta, 2010). In a third configuration, on the contrary, the firm appropriate value in excess to its contribution to value creation, which implies some form of predation (Durand, 2021). Such a dynamic would be reminiscent of sabotage envisioned by Veblen when “the successful business strategist is enabled to get a little something for nothing at constantly increasing cost to the community at large” (1921, p. 117‑118) or, in a Marxist perspective, would amount to an appropriation of value fully or largely disconnected from surplus value production (Foley, 2013). It should be noted that it implies a form of zero-sum game which means that the counter part of predation is some form of value expropriation at the expense of some other actors. Finally, a fourth configuration reflect a situation where a business is neither investing to create value nor appropriating value. In this case, it is hollowing out as it consumes itself. Table 1. Business dynamics in relation to the articulation of value creation and value appropriation
VALUE CREATION (I)
+ -
VALU
E AP
PRO
PRIA
TIO
N (P
)
+ expansion predation
-
subordination
starting up
hollowing out

16
4.2. Profit sources and uses in the retail digitalization Because in this study we are interested in the fate of already big and well-established firms, we focus on expansion, predation and hollowing out business dynamics. In order to understand to what extent these categories can illuminate the trajectories of leading retail firms in the context of the digital transformation of the sector, one has to clarify the evolution of the sources and uses of profits in the industry. With this objective we propose three stylized scenarios sketched in Figure 9. The first one is that of a persistence in a previously dominant model that becomes obsolete due to the lack of investment. Without insufficient investment, operating performances tend to decrease and a scaling down of operations by focusing on the most profitable business is the only way to serve high pay-out to shareholders. This trajectory is consistent with the “downsize and distribute” financialization mantra (Lazonick & O’sullivan, 2000) which stresses how growing assertiveness of shareholder value came at the expense of non-financial corporations' investment (Aglietta, 2000; Froud et al., 2000; Lazonick, 2017). In the context of retailing, short term emphasis on shareholder returns impedes the investment necessary to accommodate the digital transformation and the attempt to follow a path of sustain profits without accumulation ultimately fail. Over the course of years, the cumulative effects of the degrowth of the firm fuels a spiral of losses of scale economies and competencies. Considering the crucial role of fixed cost in information infrastructure, the huge economies of scale in their operations and the strategic relevance of access to original data descaling appears a self-defeating strategy on the terrain of digital competition. Ultimately this lead to a hollowing-out of the corporation when, in addition to decreasing revenue, shareholder returns retreat. The final destination of such a business trajectory is dismantling, bankruptcy, absorption or survival as a subordinate from a dominant business, possibly from the Tech sector, or on a niche market. The second scenario is that of a transition from the old pre-digital model to a new digitalized one. In this case a dominant incumbent can leverage its already existing capabilities and infrastructure as well as its supplier and customer base in the course of its digital transformation. The investment in the new intangible intensive model permits to further valorize pre-existing resources which allow the firm both to serve high pay-out to shareholders and to fund its expansion along the new industrial rationale. In this scenario of renewed dominance profits are not proportionate to investment. The firm leverage its initially dominant position to prevail in terms of value capture vis-à-vis other stakeholders, which amounts to a predatory dynamic. The third scenario is that of a rising model. The disrupter is fully dedicated to scale-up its operations with the aim of amplifying the extraction of intangible related rents. Here pay-out to shareholders are the least of the concerns of managers as they retain and reinvest profits to pursue their race to establish their new market dominance. Shareholders follow as they are pleased by the surge in stock prices that anticipates future income and allow for immediate substantial capital gains. Profits goes hand in hand with accumulation, at least in this phase of conquest. The next section will allow us to explore these scenarios along the even development of digitalization in Carrefour, Wal Mart and Amazon.

17
Figure 9: Three stylized scenarios for profit in the digital retail transition
5. The uneven unfolding of Carrefour, Wal-Mart and Amazon’s digitalization
This section analyzes the respective trajectories in terms of digitalization of the three firms under study and relate them to their financial policies. A narrative summary is proposed successively for each of the firms. It is based on firms’ financial reports, economic and specialized press and a systematic examination of their acquisitions using marketline data. In the last subsection, we provide a brief comparison of these trajectory and discuss some patents data to confirm the uneven engagement with digitalization.
5.1. Carrefour: from erratic metamorphosis to backwardness Carrefour enters in the e-commerce business in 2000, with the acquisition of Ooshop, an online supermarket launched in 1999, which belonged to Promodès. In spite of this early push, this business didn’t grow much. As late as 2018, sales revenue of this business unit was just 95 millions euros with only 134 direct employees. In parallel, drive pick-up delivery system was launched in 2009 (Marouseau, 2012) and represent the main cross-channel e-commerce development for the firm. Total amount of online sales accounted 1 Bln euros in 20168, about 1.3% of its total sales at that time. Carrefour tentative development in e-commerce was rather tortuous. In the late 2000, there was an attempt to expand the sale of online contents with the launch of a VOD service in 2008 and 8 according to its CEO : https://www.lsa-conso.fr/carrefour-s-offre-le-pure-player-du-bio-greenweez,242871

18
a digital download site with complete music, video game and software offering in 2009. In 2015, it launched a new service of video and books, Nolim, just to be abandoned three years later. There were also attempts to make inroads in the e-commerce non-food segment with a strategic partnership with Pixmania from 2011 to 2015 and then the acquisition of Rue du Commerce. However, the selling of the latter in 2019 signaled the abandonment of Carrefour’s ambition to become a general e-commerce retailer. Rather, the strategic objective put forward since 2018 is to pursue online the same strategic objective as for its general business, i.e. to become the global leader in e-commerce food transition, by which it means “to make healthy, quality, sustainably produced food accessible to everyone ».
This objective is consistent with a succession of acquisition in e-commerce food business such as Greenweez, a specialist of organic food products in 2015, e-Midia a Brazilian foodtech firm, in 2018, So.bio, Planeta Huerta, Dejbox and Potager city in 2019. This same year Carrefour also acquired Quitoque, a start-up specialized in home-delivered meal kits. All these acquisition in the premium segment of online grocery services are complemented with several partnerships for the delivery services to its online purchasers: Globo in 2019 for Spain, Italy and Argentina; Dada-JD Daojia for China and Jumia for East Africa in 2018. Moreover, up-to-date online and mobile payment solutions were brought in thanks to partnership with financial institutions, prominently with BNP Paribas (2016). Grocery e-commerce is the main venue for Carrefour online sales development. However, the company made a handful of acquisitions in other strands of business, for example a petfood website, Croquetteland, in 2016, and a controlling stake in fashion retailer showroomprivé.com in 2018. This last operation is presented as « part of both groups' strategy of developing a leading omni-channel offering, and notably covers areas such as sales, marketing, logistics and data » (Annual report 2018). This statement in fact exposes the very weakness in Carrefour digital transformation. Indeed, at the turn of the 2020s, it is safe to say that Carrefour has not yet made a leap forward in pure digital coordination activities. In absence of a proprietary marketplace, the firm is still lacking core competencies in data accumulation and management. A marketplace electronic platform is a key driver of competitiveness, because allowing third parties to use firm’s logistic and e-commerce infrastructure for a fee helps not only to generate income but also to generate increasing volume and wider scope of transactions. These are the key determinants in the accumulation of data riches and the ability to enlarge the customer base. In the absence of such a digital stronghold, the company is in difficult position to improve its capabilities in the highly correlated businesses of advertisement and behavioral prediction related sales. As part of its new strategic plan, Carrefour adopted in 2017 four new operating principles: “more streamlined, more open, more competitive and more selective”. Then, despite recurring announcements suggesting an ambitious investment policy to achieve the objective of becoming “the world leader in food e-commerce by 2022”, it is clear that Carrefour’s strategy is led by a downsizing trend: the firm is withdrawing from less favorable segments, which prompted an explosion of restructuring costs that further constrains the capacity to invest (Figure 10).

19
Figure 10 Investment and restructuring costs at Carrefour (2014-2019)
Facing such a bleak situation, the digitalization strategy is almost entirely focused on the development of partnerships and, specifically, Carrefour concluded in 2018 that it had no other choice than to enter in a strategic partnership with Google (Bertrand, 2018). This partnership includes the building of a Carrefour-Google innovation lab aimed at exploring new distribution models, purchase recommendation and commerce experiences for shoppers. It also includes the availability of Carrefour products through Google assistant and Google shopping website and the deployment of G Suite productivity tools and collaborative solutions across Carrefour.
An agreement the same year with Tencent to develop a smart store in Shangaï that includes a facial recognition payment solution participates in the same tentative catch-up strategy, but in this case in the field of store operations. Endogenous development was limited to the deployment of automatic cashiers (scan and go technology) (2018) and the launch a first walk-in click and collect store in Belgium (2019). The company also relied on external competencies to deploy blockchain technology in the management of food supply chain, in this case a partnership with IBM (2018).
This rapid outline of Carrefour’s stalling in its digital transformation is consistent with its decline in terms of revenue, assets, and financial performance presented in section 2. As discussed in another study of this firm, the restructuring of stock ownership in the first decade of the century has fueled a new profit strategy giving short-term priority to shareholder returns, which has negatively impacted operations, the wage-labor nexus, and relations with stakeholders (Benquet & Durand, 2016). The inability of Carrefour to engage successfully in the digital transition further illustrate this contradiction of financialization: the primacy given to the distribution of profits can deprive the firm of the resources necessary to invest and tackle the industrial challenges of the time; at the end of the day, it hampers its long-term development prospect and result in negative socioeconomic outcomes, including from the point of view of the creation of shareholder value.

20
Moreover, it strongly contrasts with Amazon and Wal-Mart industrial, economic and financial trajectories that we will explore now.
5.2. Wal-Mart: the rapid mutation of a latecomer Wal-Mart is a latecomer in e-commerce. In 2007 its Site to Store service enabled customers to make a purchase online and pick up merchandise in stores, which allowed in 2009 the CEO to mention for the first time in his address to shareholder online sales. However, the 2010s was a decade of catching-up with a dramatic evolution that could be traced along the numerous acquisitions aimed at reinforcing the firm digital capabilities and services offered to customers. Wal-Mart’s digital strategy took off in the 2010s with acquisitions at an accelerating pace. While, like in the case of Carrefour, a first objective was to enter the business of online content, contrary to Carrefour, Wal-Mart attempted to develop its digital capabilities in order to improve its core business competencies and performances in three directions: first, in purely digital technology, second in online sales know-how and three, following’s Amazon example, by leveraging its fixed cost through the development of selling services to third parties. The willingness to build in-house digital capabilities is the first noticeable strategic orientation. The acquisition of Kosmix, a specialist of social media, in 2011, lead to the creation of Wal-Mart lab in 2012. Several operations such an investment in Team8, a cyber security company in 2018 and the acquisition of Aspectiva, a natural language processing startup in 2019, aimed at increasing tech capabilities of the company. Throughout the years, the company attempted to consolidate and develop this internal and external tech know-how with the opening of other R&D entities of Wal-Mart labs in the US, the UK and in India. In 2019, Wal-Mart confirmed its ambition to leverage its leadership in retailing to catch up in digital technologies with the the appointment of ex Google, Microsoft, Amazon, IBM Suresh Kumar to a new elevated position of Chief Technology Officer and Chief Development Officer reporting directly to President and CEO Doug McMillon. The development of an in-house advertisement business, Wal-Mart Media Group, and the acquisition of an advertising start-up, Polymorph Labs, in 2019, illustrates further the group ambitions to use its huge customer base and the corresponding data riches to sell in-store and online targeted advertisement. It also pursued innovation strategy in the field of logistics, with the registration in 2018 of US patents for a fleet of robotic bee drones and autonomous robots controlled through a blockchain network. This move in hardcore logistics tech was perceived in the business press as a challenge to Amazon ambitions to attain technology supremacy (Coulter, 2019). However one should recall that Wal-Mart has a long history of digitalization of its supply-chain with the implementation of barcode in 1983, the deployment of its system of satellite communication in 1987 and the launch of Retail Link, in 1992, to provide it suppliers with real time data on sale trends and inventory levels (Wailgum, 2007). Recent digital developments include the deployment of SAP HANA business intelligence platform to perform tasks such as processing the company’s half a trillion daily transactions records in 2015 and a partnership with IBM and Tsinghua University (2018) for Block-chain based system of supply chain management. On the side of store operations, digitalization went through with the opening of No checkout stores (2017), the introduction of AI shelf-scanning technology (2018) and Check-out with me (pay anywhere in the store, using credit card). This same year it abandoned its scan & go

21
technology due to poor feedback of this system which required the download of an app and ask customers to take on the labor of checkout themselves. The second orientation concern the enlargement of its sales capabilities via the development of online sales and the increasing integration of online and offline businesses. It is noticeable that Wal-Mart e-commerce expansion relied in large part on acquisitions and alliances, in particular but not exclusively in foreign markets. The expansion of Wal-Mart’s operations in China is particularly revealing in this regard. In 2011 it acquired a minority stake in Yihaodian, a Chinese grocery online business. This business was brought to JD.com in 2016, as Wal-Mart and the Chinese e-commerce leader by sales revenue, entered into a strategic alliance. Wal-Mart progressively became the second shareholder of JD, after Tencent, stepping up its stake to 12,1% in 2017. In the meantime, the two firms tied their operations (Shieber, 2018): Wal-Mart’s China-made U.S.-branded products available to Chinese consumers through JD.com’ online marketplace while JD.com’s tech wares showroom are dispatched in Wal-Mart stores throughout China and their online and offline supply chains are integrated, including in the grocery business. The Chinese e-commerce connection of Wal-Mart is not the only one. In 2018, Wal-Mart entered in strategic alliance with Rakuten, the leading e-commerce Japanese company, with ramifications along several businesses lines from e-books to grocery. The same year it also acquired a controlling stake in Flipkart, the leading e-commerce Indian company. In the meantime, the company pursued an aggressive external growth strategy in purely online operations via the acquisition of dozens of online stores and brands, such as Jet.com a discount retailer in 2016 or Bonobos, an online apparel retailer in 2017. Jet.com founder Marc Lore then became the CEO of Wal-Mart’s US e-commerce operations and has since been driving Wal-Mart’s digital revolution. The development of online marketing skills aims for niche markets (hearing aid devices, auto-insurance…) and innovative sales patterns. For example, a partnership with Kidbox (2019) allows customers to receive a set of apparel items based on an online preferences quiz, with an option of automatic shipments of up to six boxes a year timed to seasons. From 2017 on, the company aggressively pursued an expansion of online grocery business in the US, which led to many partnerships aimed at improving the last mile delivery logistics, including many agreements at the local level. On the marketing side, it also developed new interface such as fresh online and 3D shopping tour, in order to increase the sensorial intensity of online shopping experience. In 2019, In Home service allows Wal-Mart’s camera-equipped “associates” to enter home and deliver food directly into the fridge. Partnership with Google home (2017) and Apple (Siri) (2019) facilitated the vocal ordering. A third crucial orientation transformation concerns the development of Wal-Mart marketplace and reflect the growing awareness of Wal-Mart of the advantages to leverage its logistic and technological capabilities, following Amazon example. Wal-Mart online catalog consists of products listed for sale by Wal-Mart itself (also known as first-party items) and the marketplace of third-party sellers. Wal-Mart started inviting sellers in 2009, but it wasn’t until 2016 that it crossed the first thousand sellers and accelerated rapidly afterwards, which as a result expanded Wal-Mart’s online catalog by tens of millions of new products (Marketplace Pulse, 2018). Wal-Mart online assortment has over 43 million products in 2018 against 12 million in 2016. However, Wal-Mart sells only 3.5 million products. The marketplace is responsible for 92% of the full catalog. First-party items listed by Wal-Mart are down to 8% of all items available on Wal-Mart.com. In sum, the marketplace is driving most of the catalog growth and, as a result, it allows to catch up vis-à-vis Amazon in covering the long-tail. This development allows the company to

22
increase its income and enlarge its customer base while accumulating data riches; in the meantime, it can still focus on the top million stock-keeping units leaving the rest to the marketplace. This surge in Wal-Mart market place was backed by a partnership since 2017 with CIN7, a cloud- based inventory management for third party sellers.
5.3. Amazon: the deployment of a business concept in the retail sector “This is Day 1 for the Internet and, if we execute well, for Amazon.com. Today, online commerce saves customers money and precious time. Tomorrow, through personalization, online commerce will accelerate the very process of discovery. Amazon.com uses the Internet to create real value for its customers and, by doing so, hopes to create an enduring franchise, even in established and large markets. »
Jeffrey Bezos, 1997 Letter to Amazon’s shareholders
This quote from Amazon’s first annual report to its shareholders illustrates the specific position of this company in the process of digitalization of retailing. Amazon business was never just about books; it’s about economic coordination in the digital age and “the very process of discovery” that supports it. Through personalization, i.e. the accumulation of personal and contextual data, Amazon positions itself upstream of the consumer's choice, anticipating demand and even stimulating it with relevant suggestions. The core of Amazon's business is therefore not the sale of books, but rather a transformation of the cognitive conditions of access to goods through contextualization. Its initial ambition to take aim at “established and large markets” - such as general retailing and grocery - refers to a radical innovation: to collect mass digital data to guide economic transactions. Considering the specific point of departure of Amazon’s trajectory, it makes no sense to look at the digitalization of this business. On the contrary, one needs to look at the penetration of this digital pure player into the retail market as instrumental to the transformation of the sector. We will first describe Amazon’s deployment in retailing and then turn towards the business logic of its powerful expansionary drive from an accounting perspective. The first indications of “generalistization” intervene very early. As soon as 1999, the company move beyond its bookselling business as it acquires stakes in drugstore.com, HomeGrocer.com, Pets.com and Exchange.com. And this first move is followed by partnership with Toys R Us (toys and videogame) in 2000 and Footlocker (sportswear) in 2003. This same year the company added 40,000 gourmet food items, more than 60,000 jewelry items, and over 70,000 health and personal care items to its product portfolio. From this moment on, there is an unabated succession of acquisition of online stores (for example: Shopbop.com a retailer of fashion-forward apparel in 2006; Diapers.com an online baby care specialty site in 2010; Pillpack, an online pharmacy in 2018) along with the development of private labels and dedicated online stores (i.e. AmazonBasics, a collection of consumer electronics, in 2009; Amazon Wine in 2012; 50+ Active and Healthy Living Store in 2013; 3D printed products store in 2014). On the product line plan, Amazon stayed mostly a bookseller up to the 2010s. However, its early tentative diversification went hand in hand with a radical move with the launch in 2000

23
of its own marketplace, offering other merchants the option to pay to list their wares on Amazon’s digital shelves and, later, stock them in the company’s own warehouses(Day & Gu, 2019). As a result, Amazon’s business progressively changed as the share of physical gross merchandise sales sold on Amazon by independent thirdparty sellers – as opposed to Amazon retail’s own first party sales - have grown from 3% in 2000 of the total to 58% in 2018. This decision was crucial in Amazon’s success. It increased the attractiveness of Amazon.com and the sales of its own selection without tying up the company’s cash in inventory. In the meantime, it generated income and data riches that could be leveraged in company’s growth. It’s only in the second half of the 2010s that it became crystal clear that Amazon moved closer each day to be a direct and all-encompassing competitor to traditional retailers. In this period it began by accelerating its grocery delivery services in the US, then from 2018 directly entered into traditional retailing via partnership with traditional retailers such as French group Casino, the acquisition of premium organic grocery chain Whole Foods, investment in two Indian supermarket groups More and Future retail, and the opening of brick-and-mortar Amazon stores : physical bookstore, cashierless Amazon Go convenience store, Amazon 4-Star store, with its highly rated items, and in 2020 its first supermaket Amazon Go grocery. More anecdotally, from 2017 the company tried to accumulate experience though ephemeral-shopping points such as pop-up stores in high-end street in Europe and Treasure truck, i.e. one-item-daily mobile stores. Last but not least, Amazon has been very active on the technological front. One important dimension concerns its partially automated Go store we just mentioned. On the front of vocal custom voice command, Amazon was a frontrunner with the launch of Amazon Echo in 2014 in the US and the progressive sophistication of its vocal assistant Alexa. It also pioneered the business of home delivery with Amazon key. This service introduced in 2017 leverages the company inroads in smart home devices to allow couriers to unlock customers’ doors and make deliveries right into their kitchen. One step further, its Dash buttons (physical, then virtual) moved the company closer to automatic ordering systems, a program pursued in collaboration with a wide range of companies - including GE and Samsung - since 2015 under the label Amazon Dash Replenishment Service (DRS) program. In 2016, the company in partnership with Brita, launched the first Wi-Fi-enabled Brita Infinity pitcher, which automatically orders a new filter through Amazon Dash Replenishment. On the logistics front, the push in robots warehousing, following the acquisition of Kiva Systems in 2012, led to the opening of its first robotics fulfillment center in Texas, in 2018. In parallel the company explore, since 2011 at least, the prospects of drone deliveries. It is also closely involved in the deepening of the Internet of Things (IoT), for example through a partnership launched in 2019 with Iridium communications for developing a satellite-based network, CloudConnect, for the IoT applications. IoT offers for Amazon to integrate closely its trade, logistics and webservices activities. As soon as 2015, the company create a AWS Internet of Things (IoT) platform that enables devices such as cars, turbines, sensor grids and light bulbs, among others, to connect to AWS services so that companies can store, process, examine, and act on the volumes of data generated by connected devices on a global scale
Table 2 highlights the key steps in the process of digitalization of our three cases. First it underscores the specificity of Amazon vis-à-vis the two other traditional retailers: Amazon was a pure e-commerce player at the beginning and only recently moved to brick & mortar stores both via acquisition and partnership with established retailers and by innovating via the creation of intensely digitalized physical stores and engaging more directly with final consumers.

24
Second, it shows a stall of Carrefour vis-à-vis Wal-Mart. While the latter accelerated its digital transformation both through a great number of acquisition and the development of internal digital capabilities, the former dropped out its attempt to catch-up on digitalization on its own, favoring partnership with technologies companies such as IBM and Google. The contrast between the three companies is very spectacular when one looks at their patenting activity (Figure 11). Generally, there is an acceleration of patenting. However, Amazon is by far a leader in this activity, while Wal-Mart only recently entered in the patenting activity to be a significant contender. In the meantime, Carrefour is simply not participating in the innovation race, with a stagnant and negligible patenting activity and a miserable patent portfolio in comparison to the two other firms (Figure 11 bis appendix). Overall engagement with digitalization match closely the dynamic in terms of revenue, assets and total shareholder return presented in section 2. In order to understand what are the mechanisms linking these two dimensions, we turn to the accounting analysis. Table 2 Key steps on the digital transformation of retailing: Carrefour, Wal-Mart and Amazon
CARREFOUR WAL-MART AMAZON UP-TO 2004 First online
supermarket Digital integration of the supply chain (retailink)
Creation of an option for online shopping
Definition of general purpose e-commerce as a strategic aim
Proprietary marketplace
2005-2014 In store pick-up delivery of online sales
Tentative development of online contents business
Proprietary marketplace
In store pick-up delivery of online sales
Accelerated diversification of e-commerce catalog through organic and external growth
SINCE 2015 Specialization in e-commerce grocery, through organic and external growth
Partnership with google and IBM to acquire digital technologies
Introduction of self and mobile check out solutions
Accelerated online growth in grocery and general merchandize businesses, mainly through external growth
Accelerated in-house data technology, digital automatic logistics and online marketing development
Introduction of self and mobile check out solutions
Deployment in Brick and Mortar stores, through partnership and organic growth
Cashier-less store
Semi-automatic replenishment program

25
Figure 11 Carrefour, Wal-Mart and Amazon patent fillings by 6 years period (1996-2019)
6. “Leveraging fixed costs”: intellectual monopoly dynamics and network effects in the making of profits
The relationship between profit-making and digitalization needs to be further clarified. On the one hand, the trajectory of Carrefour characterized by a decline in activity and profitability and a lack of engagement in the digital transition, suggests a technological obsolescence of traditional retailing. According to this case, retailing without digitalization seems to be passé. Here the lack of restructuration of operations and their downsizing seems consistent with a hollowing out logic aimed at reallocating capital away from this sector. Of course, this hypothesis should be explored more systematically at the sectoral level, in particular taking into account the hard discount segment. On the other hand, one need to explain positively the logic of profit-making related to digitalization. And this is the purpose of this section. The literature discusses the nature of investment in the digital age and the related measurement issues that arise as a result of the growing role of intangible assets (Corrado et al., 2012; Haskel & Westlake, 2018). In the context of the broad US retail sector, Crouzet and Eberly (2019) argue that under-accounting of investment in intangibles is the reason why investment level appears to be inconsistent with high valuation and rise in productivity. However, their analysis at the industry level do not allow to disentangle dynamic related to the changing composition of the industry from the shift in business models occurring at the firm level. Contrastingly, other contributions point to a distinctive logic of profit-making in the digital age due to the specificities of the cost structure and return to scale associated with intangible assets.

26
They point to the growing role of data-related intellectual monopoly profits as an emerging property resulting from the centralization of intangible assets (Durand & Milberg, 2020; Pagano, 2014; Pagano & Rossi, 2009; Rikap, 2019, 2020). In such a perspective, we propose to look for indications of powerful returns to scale and economies of scope related to digital transformations of operations (product mix, CRM, Supply chains). Information about investment activities and operations published by companies are an essential source to understand their profit strategies. Nonetheless, at a certain level of details each company differs in the presentation of its data, which make a direct comparison impossible. Taking into account this constraint and building on the singularity of the firms, we found some indications of the role of digitalization in the making of profits in Wal-Mart and Amazon accounting information. According to O’Sullivan (2019) Wal-Mart sustained profitability do not result from improving productivity due to an efficient organization but from two old tricks of the merchant profession: 1) an agile definition of the product mix allowing for a higher inventory turnover and 2) market power preserving mark-up. However, beyond what she calls a “banality of retail”, there are in the past decade some indications of a significant transformation of the way Wal-Mart is making profits. As indicated by its chief executive, Doug McMillon, Wal-Mart is “in an early stage of building a new business model”(Gray & Lee, 2021). The intense development and accumulation of digital capabilities documented in paragraph 5.2 corroborates this affirmation, which is further strengthen by the observation of some changes occurring in terms of investment policy. As one can see in Figure 12, the share of Capital Expenditures (Capex) dedicated to e-commerce, technology and supply chain management surged from 2.9 billion USD in 2006-2007 to 5.4 billion in 2018-2019. This increase is all the more relevant that it occurred in a context of a significant decline of Capex of one third over the same period. In other words, while tech-related investment accounted for just 18% of Wal-Mart Capex in 2006-2007 it represented more than half in 2018-2019. This evolution is also interesting as it suggests that in a context of drastically slowing growth of revenue (Figure 2) a qualitative mutation of investment toward digital capabilities allows Wal-Mart to preserve mark-up (Figure 4), profitability (Figure 5 and Figure 6) and improve shareholder returns (Figure 7 and Figure 8). The logic of investment reduction observable at Wal-Mart is thus very different from the downsizing strategy of Carrefour (Figure 10). In the case of Wal-Mart, operating with lower levels of investment is apparently do not lead to major increases in operating costs. Digitalization is cited as one of the main drivers of cost increases for year 2018 and 2019, but in a context of overall decreasing costs which suggests that, as highlighted by Brett Biggs, the firm’s CFO, investments in wages, training, technology and process improvements help “increase productivity, manage inventory, reduce costs and serve customers” (Annual Report 2019, p.4). In other words, investing in technology for Wal-Mart is a way to deploy resources more efficiently, to improve their customer proposition, to expand in e-commerce and to prepare future services enhancement. The fact that reduced capital expenditure goes along with improved operating efficiency also suggests a strengthening of the enterprise’s market power position.

27
Figure 12: Allocation of CAPEX at Wal-Mart (2006-2019, average of selected periods)
At Amazon, the profit strategy is intimately interwoven with the expansionary technological drive. Its logic appears in plain English in the Management’s Discussion and Analysis of Financial Condition and Results of Operations section of its annual report: “We seek to reduce our variable costs per unit and work to leverage our fixed costs”. This formulation is reiterated in identical terms years after years since 2007 and with only minor variation before that. While the objective to minimize variable costs is not original, the persistent emphasis on leveraging – as opposed to reducing - fixed costs is much more unusual and brings us at the specificities of making profits out of digital capabilities. It means that the company is determined to grow and to leverage its growth, i.e. to seek the maximum of profitable uses possible of its investments and of the operational outcomes of its operations. In other words, the orientation towards the leveraging of fixed costs expresses a willingness to take advantage of the versatile character of the capabilities corresponding to these fixed costs, which are “the costs necessary to build and run [its] technology infrastructure; to build, enhance, and add features to [its] online stores, web services, electronic devices, and digital offerings; and to build and optimize [its] fulfillment centers and delivery networks and other facilities” (Annual report, 2020). The rise of Amazon raise serious antitrust issues (Khan, 2016) and worries about related knowledge predation (Rikap, 2020). Nonetheless, it is true that this strategy of profit through the leveraging of growth also aims at benefiting from economies of scope, economies of scale and network effect. It can be traced in the composition of Amazon’s sales and costs. We already observed the spectacular expansion of Amazon’s operations (Figure 1 and Figure 2). However, this growth went along with a shift in the composition of Amazon’s operations toward service sales at the expense of product sales in the past decade (Figure 13). Services accounted for 9% of its revenue in 2009 and grew up-to 43% in 2019. For this year they are mostly constituted of third-party seller services (19% of total revenue), web services by AWS (12%) and subscription services, mainly Amazon Prime (7%) (Annual report, 2020).

28
The shift toward sales of services materializes the diversification of the profitable uses of infrastructure, computing, marketing and algorithmic capabilities initially deployed by Amazon for the sale of products on its website. While selling its logistic, computing and algorithmic capabilities as services, Amazon is able to improve its operations in several way. First, it benefits from scale economies beyond the limits of its own product sales operations. Such a strategy allows for a positive spiral of cumulative competitive advantages: on the one hand, the sheer size of its sales operations generate such huge economies of scale that the logistics, computing and algorithmic services it sells are very competitive; on the other hand, the surge of scale related to the sales of these services further improve the efficiency of its own operations. Second, it enlarges its “ecosystem of digital products and services” (Annual report 2014), paving the way for some complementarities both on the supply and the demand side. In the meantime, this allows for an enlargement of its client base along the long tail and further engagement of its various kind of customers through network effects. Three, it increases its gathering of data, which allows for further improvements and refinements of its recommendation, prediction and innovation capabilities with positive impact on its various lines of businesses. The impact of this fixed cost leveraging strategy is apparent in the evolution of Amazon’s cost structure (Figure 14) and, more specifically, in the dramatic diminution of the cost of sales category from 91% in 2009 to 57% a decade later. Indeed, the counterpart of this diminution is the increase of two items related to fixed costs. First, “fulfillment” costs accounts for around 15 % of total costs at the end of the 2010s against less than 10% in the previous decade. The most important reason for that is the growing internalization of logistic and transportation services. This is a transformation of variable costs into fixed costs that pave the way for further leveraging: Amazon can “make” itself these services instead of buying them then, once they are deployed internally, the firm is able to sell them to third parties. As explained by the Financial Times, this results in a surprising business connection, including with Wal-Mart: “Amazon Multi-Channel Fulfillment (MCF) is a lesser-known subdivision of the company’s highly successful Fulfillment By Amazon (FBA) programme. Where FBA stores, packs and delivers to Amazon customers, sometimes in as little as a day, MCF offers much the same for sales on other websites, such as Walmart, eBay, Etsy, Shopify and several others”(D. Lee, 2021). Second, the category “technology and content”9 grew even more rapidly from 5 to 13 % over the same period. Technology and content costs concern primarily software, content and 9 To understand what is at stake in this increase it’s useful to quote at length what the company says on this topic: “Technology and content costs include payroll and related expenses for employees involved in the research and development of new and existing products and services, and infrastructure costs. Infrastructure costs include servers, networking equipment, and data center related depreciation, rent, utilities, and other expenses necessary to support AWS and other Amazon businesses. Collectively, these costs reflect the investments we make in order to offer a wide variety of products and services to our customers. We seek to invest efficiently in numerous areas of technology and content so we may continue to enhance the customer experience and improve our process efficiency through rapid technology developments, while operating at an ever increasing scale. Our technology and content investment and capital spending projects often support a variety of product and service offerings due to geographic expansion and the cross-functionality of our systems and operations. We expect spending in technology and content to increase over time as we continue to add employees and technology infrastructure.
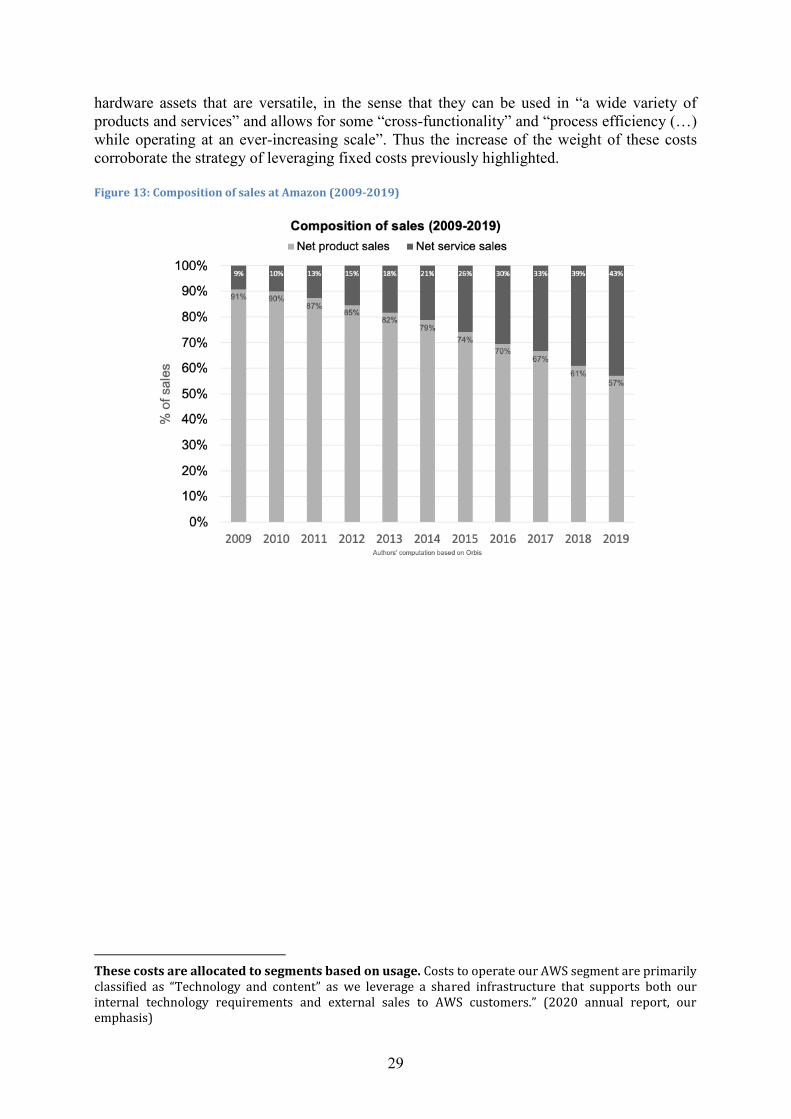
29
hardware assets that are versatile, in the sense that they can be used in “a wide variety of products and services” and allows for some “cross-functionality” and “process efficiency (…) while operating at an ever-increasing scale”. Thus the increase of the weight of these costs corroborate the strategy of leveraging fixed costs previously highlighted. Figure 13: Composition of sales at Amazon (2009-2019)
These costs are allocated to segments based on usage. Costs to operate our AWS segment are primarily classified as “Technology and content” as we leverage a shared infrastructure that supports both our internal technology requirements and external sales to AWS customers.” (2020 annual report, our emphasis)
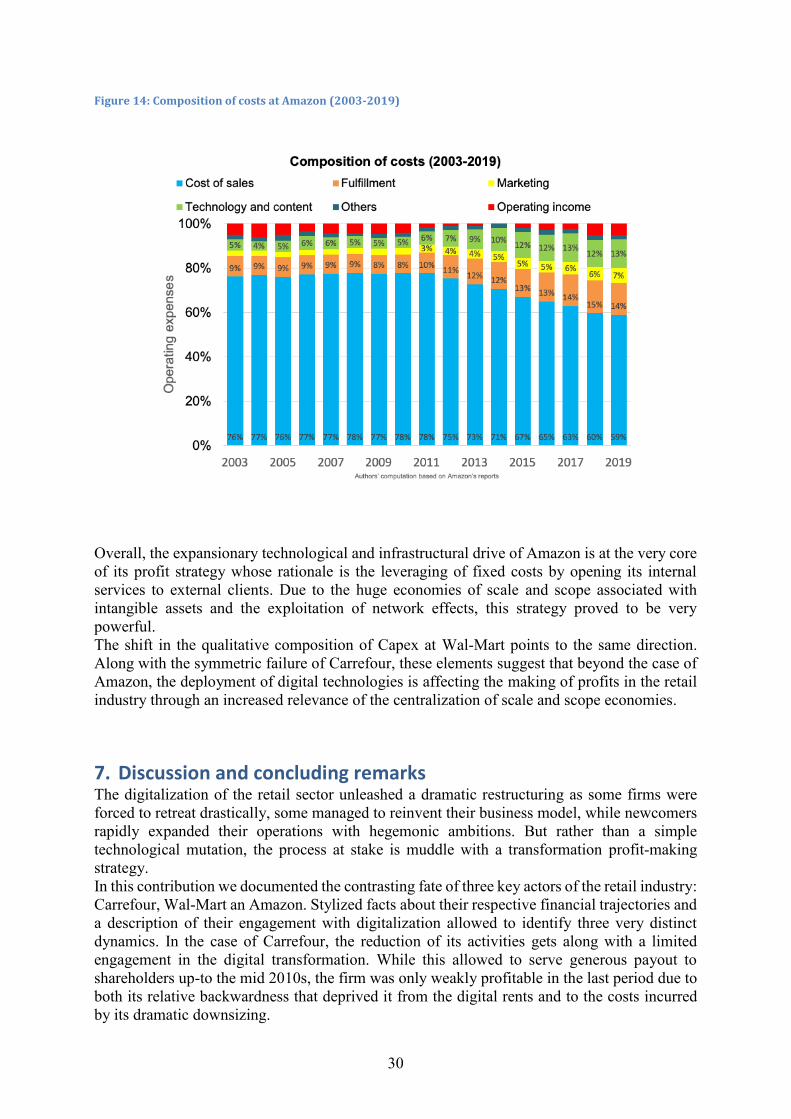
30
Figure 14: Composition of costs at Amazon (2003-2019)
Overall, the expansionary technological and infrastructural drive of Amazon is at the very core of its profit strategy whose rationale is the leveraging of fixed costs by opening its internal services to external clients. Due to the huge economies of scale and scope associated with intangible assets and the exploitation of network effects, this strategy proved to be very powerful. The shift in the qualitative composition of Capex at Wal-Mart points to the same direction. Along with the symmetric failure of Carrefour, these elements suggest that beyond the case of Amazon, the deployment of digital technologies is affecting the making of profits in the retail industry through an increased relevance of the centralization of scale and scope economies.
7. Discussion and concluding remarks The digitalization of the retail sector unleashed a dramatic restructuring as some firms were forced to retreat drastically, some managed to reinvent their business model, while newcomers rapidly expanded their operations with hegemonic ambitions. But rather than a simple technological mutation, the process at stake is muddle with a transformation profit-making strategy. In this contribution we documented the contrasting fate of three key actors of the retail industry: Carrefour, Wal-Mart an Amazon. Stylized facts about their respective financial trajectories and a description of their engagement with digitalization allowed to identify three very distinct dynamics. In the case of Carrefour, the reduction of its activities gets along with a limited engagement in the digital transformation. While this allowed to serve generous payout to shareholders up-to the mid 2010s, the firm was only weakly profitable in the last period due to both its relative backwardness that deprived it from the digital rents and to the costs incurred by its dramatic downsizing.

31
Contrasting with the decline of Carrefour, Wal-Mart was able to pursue its growth, albeit at a slower rate, while engaging in a strong restructuration of its business model in order to benefit from the economic rents associated with the digitalization of the business. One of the remarkable performances of Wal-Mart was its ability to maintain a high level of profitability and payout all over this period, which suggest that it was already in the past years able to use the gains from its digital transformation to absorb the costs of its restructuring. Amazon rejoined the general retail business progressively, mostly via the broadening of its e-commerce activities and, more recently, by some intrusions in brick-and-mortar sales channels. The firm is still expanding at a very rapid pace, both in terms of sales and assets. Its profits strategy is intimately interwoven with the expansionary technological drive as it permanently attempts to complement its internal activities and sales of business services in order to leverage its fixed costs. Consistent with a high level of investment, this strategy please shareholders thanks to continuously increasing stock prices that reflect investors’ confidence in the firm’s long-lasting hegemony. These analytical elements and the theoretical discussion developed in section 3 suggest that there is a specific cost structure associated with digitalization. Thanks to the benefit accruing from data centralization, assets related to digitalization have the possibility to generate both scale and scope economies across various lines of businesses generating powerful economic rents. According to this interpretation, one can identify two important stakes. First, as digital rents allow value appropriation beyond investing activities, one can ask whether this will favor a further deepening of the dissociation between profits and accumulation that is at the core of the financialization dynamics. On the one hand, as leading firms lacks investing opportunities as profitable as their current operations, they should rather distribute profits to their shareholders, accumulate precautionary cash holdings or expand their domination through the acquisition of rivals or firms in other lines of business. However, on the other hand, the limits of the cumulative gains arising from the digital interconnection of various lines of business is still not in sight, as testified by the persisting high level of investment of Amazon. In this perspective intensive investment by leading actors could go hand in hand with a rapid concentration of assets, this predatory expansion eventually fueling a decrease of investment at the sectoral level, nurturing further financial overaccumulation and related crisis tendencies. Second, with increasing concentration of the sector and more hierarchized relations between businesses, digitalization is changing the condition of economic coordination with tremendous consequences for workers, customers, businesses and communities. There is already for a couple of years a rising awareness of social scientists, policymakers and the general public on these issues regarding leading digital companies. Nonetheless, one would draw attention to the fact that traditional anti-trust policy is not necessarily adequate as breaking-up businesses would, in the meantime, destroy scale and scope economies. Rather than weakening these forces of coordination, regulators should rather aim at controlling them by imposing objectives in terms of social, ecological and psychological impact of the digital tools deployed in the sector.

32
References Aglietta, M. (2000). Shareholder value and corporate governance : Some tricky questions. Economy and Society, 29(1), 146‑159. https://doi.org/10.1080/030851400360596 Alfonso, V., Boar, C., Frost, J., Gambacorta, L., & Liu, J. (2021). E-commerce in the pandemic and beyond. BIS Bulletin, 36. Ang, C. (2020, octobre 14). Visualized : A Breakdown of Amazon’s Revenue Model. Visual Capitalist. https://www.visualcapitalist.com/amazon-revenue-model-2020/ Arkenback, C. (2019). WHAT ARE WE EDUCATING TOWARDS? SALES ASSISTANTS´ WORK IN DIGITALISED BRICKS AND MORTAR STORES. 8544‑8554. Baud, C., & Durand, C. (2012). Financialization, globalization and the making of profits by leading retailers. Socio-Economic Review, 10(2), 241‑266. https://doi.org/10.1093/ser/mwr016 Beauvisage, T., & Mellet, K. (2020). Mobile consumers and the retail industry : The resistible advent of a new marketing scene. Journal of Cultural Economy, 13(1), 25‑41. https://doi.org/10.1080/17530350.2019.1611623 Beniger, J. R. (1986). The control revolution : Technological and economic origins of the Information Society (5. print). Harvard Univ. Press. Benquet, M., & Durand, C. (2016). Financialization of the Large Retailers. Restructuring Stock Ownership and the Economic Decline of the Carrefour Group (1999-2013). Revue Française de Socio-Économie, 16(1), 37‑59. Cairn.info. Bensussan, H. (2021, forthcoming). La dimension construite de l’ordre spontané : De la cybernétique de F. A. Hayek à celle de J. R Beniger. Cahiers d’économie politique. Bertrand, P. (2018, juin 12). Alexandre Bompard donne du lustre à sa stratégie digitale. Les Echos. https://www.lesechos.fr/2018/06/alexandre-bompard-donne-du-lustre-a-sa-strategie-digitale-973842 Björkdahl, J., & Holmén, M. (2019). Exploiting the control revolution by means of digitalization : Value creation, value capture, and downstream movements. Industrial and Corporate Change, 28(3), 423‑436. https://doi.org/10.1093/icc/dty022 Boston Consulting Group. (2021, 1968). What Is the Growth Share Matrix? Switzerland - EN. https://www.bcg.com/en-ch/about/our-history/growth-share-matrix Bradlow, E. T., Gangwar, M., Kopalle, P., & Voleti, S. (2017). The role of big data and predictive analytics in retailing. Journal of Retailing, 93(1), 79‑95. Centre for Retail Research. (2020). The Crisis in Retailing. https://www.retailresearch.org/retail-crisis.html Corrado, C. A., Haskel, J., Iommi, M., & Jona Lasinio, C. (2012). Intangible capital and growth in advanced economies : Measurement and comparative results. Coulter, M. (2019, juin 16). Walmart outpaces Amazon in drone patent race. https://www.ft.com/content/7cd22fb6-8e79-11e9-a24d-b42f641eca37 Crouzet, N., & Eberly, J. C. (2019). Understanding weak capital investment : The role of market concentration and intangibles (No 0898‑2937). National Bureau of Economic Research. Davis, L. E. (2016). Identifying the “financialization” of the nonfinancial corporation in the U.S. economy : A decomposition of firm-level balance sheets. Journal of Post Keynesian Economics, 39(1), 115‑141. https://doi.org/10.1080/01603477.2015.1116370 Day, M., & Gu, J. (2019, mars 27). The Numbers Behind Amazon’s Market Reach. Bloomberg.Com. https://www.bloomberg.com/graphics/2019-amazon-reach-across-markets/ Deloitte. (2021). Global Powers of Retailing. https://www2.deloitte.com/global/en/pages/consumer-business/articles/global-powers-of-retailing.html Durand, C. (2021). Predation in the age of algorithms. Accumulating Capital Today:

33
Contemporary Strategies of Profit and Dispossessive Policies. Durand, C., & Milberg, W. (2020). Intellectual monopoly in global value chains. Review of International Political Economy, 27(2), 404‑429. https://doi.org/10.1080/09692290.2019.1660703 Durand, C., & Wrigley, N. (2009). Institutional and economic determinants of transnational retailer expansion and performance : A comparative analysis of Wal-Mart and Carrefour. Environment and Planning A, 41(7), 1534‑1555. https://doi.org/10.1068/a4137 Evans, L., & Kitchin, R. (2018). A smart place to work ? Big data systems, labour, control and modern retail stores. New Technology, Work and Employment, 33(1), 44‑57. Fertik, M. (2019, mai 2). How to Avoid Being Victim to the Retail Apocalypse. Forbes. https://www.forbes.com/sites/michaelfertik/2019/05/02/how-to-avoid-being-victim-to-the-retail-apocalypse/ Foley, D. K. (2013). Rethinking Financial Capitalism and the “information” Economy. Review of Radical Political Economics, 45(3), 257‑268. Fortune. (2020). Fortune 500. Fortune. https://fortune.com/fortune500/2020/ Froud, J., Haslam, C., Johal, S., & Williams, K. (2000). Shareholder value and Financialization : Consultancy promises, management moves. Economy and Society, 29(1), 80‑110. https://doi.org/10.1080/030851400360578 Gray, A., & Lee, D. (2021, mai 11). Walmart vs Amazon : The battle to dominate grocery. Financial Times. https://www.ft.com/content/9ab41b9e-a294-430f-951d-49cfc3415460 Grewal, D., Roggeveen, A. L., & Nordfält, J. (2017). The Future of Retailing. The Future of Retailing, 93(1), 1‑6. https://doi.org/10.1016/j.jretai.2016.12.008 Hamilton, G. G., Senauer, B., & Petrovic, M. (Éds.). (2011). The market makers : How retailers are reshaping the global economy. Oxford University Press. Haskel, J., & Westlake, S. (2018). Capitalism without capital : The rise of the intangible economy. Princeton University Press. Inman, J. J., & Nikolova, H. (2017). Shopper-facing retail technology : A retailer adoption decision framework incorporating shopper attitudes and privacy concerns. Journal of Retailing, 93(1), 7‑28. Irwin. (2017, juin 7). The Amazon-Walmart Showdown That Explains the Modern Economy—The New York Times. New York Times. https://www.nytimes.com/2017/06/16/upshot/the-amazon-walmart-showdown-that-explains-the-modern-economy.html Jocevski, M., Arvidsson, N., Miragliotta, G., Ghezzi, A., & Mangiaracina, R. (2019). Transitions towards omni-channel retailing strategies : A business model perspective. International Journal of Retail & Distribution Management. Khan, L. M. (2016). Amazon’s antitrust paradox. Yale LJ, 126, 710. Kjellberg, H., Hagberg, J., & Cochoy, F. (2019). Thinking Market Infrastructure : Barcode Scanning in the US Grocery Retail Sector, 1967–2010. In Thinking infrastructures. Emerald Publishing Limited. KPMG Global. (2019). Global Retail Trends. https://home.kpmg/xx/en/home/insights/2019/02/retail-trends-2019.html Lazonick, W. (2017). The functions of the stock market and the fallacies of shareholder value. Corporate Governance in Contention, 117‑151. Lazonick, W., & O’sullivan, M. (2000). Maximizing shareholder value : A new ideology for corporate governance. Economy and society, 29(1), 13‑35. Lee, D. (2021, août 3). Amazon expands deliveries to serve unlikely clients : Its rivals | Financial Times. https://www.ft.com/content/9a630924-c9d0-4816-9d39-e7519e4dde72 Lee, M. K., Kusbit, D., Metsky, E., & Dabbish, L. (2015). Working with machines : The impact of algorithmic and data-driven management on human workers. 1603‑1612.

34
Mak, H.-Y., & Max Shen, Z.-J. (2020). When Triple-A Supply Chains Meet Digitalization : The Case of JD.com’s C2M Model. Production and Operations Management, n/a(n/a). https://doi.org/10.1111/poms.13307 Marketplace Pulse. (2018, octobre 16). The Evolution of Walmart.com. Marketplace Pulse. https://www.marketplacepulse.com/articles/the-evolution-of-walmart Marouseau, G. (2012). Le click and drive : Un nouveau rôle pour le client en e-commerce alimentaire. 29. McKinsey. (2020). Future of retail operations : Winning in a digital era. https://www.mckinsey.com/industries/retail/our-insights/future-of-retail-operations-winning-in-a-digital-era McKinsey Global Institute. (2001). US productivity Growth 1995-2000. Understanding the Contribution of Information Technology, McKinsey Global Institute. https://www.mckinsey.com/featured-insights/americas/us-productivity-growth-1995-2000 Munandar, A. I., & Khoriyah, S. (2020). Retail in the digital era : Case study of a modern store and a smart store. 14. Narioka, K., & Landers. (2020, novembre 16). Walmart Retreats Around Globe to Focus on E-Commerce. Wall Street Journal. https://www.wsj.com/articles/walmart-retreats-around-globe-to-focus-on-e-commerce-11605518960 Nightingale, P., Brady, T., Davies, A., & Hall, J. (2003). Capacity utilization revisited : Software, control and the growth of large technical systems. Industrial and Corporate Change, 12(3), 477‑517. O’Sullivan, M. (2019). Economic fetishes of “modern” retail capitalism. Pagano, U. (2014). The crisis of intellectual monopoly capitalism. Cambridge Journal of Economics, 38(6), 1409‑1429. Pagano, U., & Rossi, M. A. (2009). The crash of the knowledge economy. Cambridge Journal of Economics, 33(4), 665‑683. https://doi.org/10.1093/cje/bep033 Reinartz, W., Wiegand, N., & Imschloss, M. (2019). The impact of digital transformation on the retailing value chain. Marketing Perspectives on Digital Business Models, 36(3), 350‑366. https://doi.org/10.1016/j.ijresmar.2018.12.002 Rikap, C. (2019). Asymmetric Power of the Core : Technological Cooperation and Technological Competition in the Transnational Innovation Networks of Big Pharma. Review of International Political Economy, 26(5), 987‑1021. https://doi.org/10.1080/09692290.2019.1620309 Rikap, C. (2020). Amazon : A story of accumulation through intellectual rentiership and predation. Competition & Change, 1024529420932418. Rouvroy, A., & Berns, T. (2013). Algorithmic governmentality and prospects of emancipation. Disparateness as a precondition for individuation through relationships? (E. Libbrecht, Trad.). Réseaux, 177(1), 163‑196. Cairn.info. https://doi.org/10.3917/res.177.0163 Schildt, H. (2017). Big data and organizational design–the brave new world of algorithmic management and computer augmented transparency. Innovation, 19(1), 23‑30. Shieber, J. (2018, avril 2). Walmart brings its partnership with JD.com into the food business. TechCrunch. https://social.techcrunch.com/2018/04/02/walmart-brings-its-partnership-with-jd-com-into-the-food-business/ Shukla, P. S., & Nigam, P. V. (2018). E-shopping using mobile apps and the emerging consumer in the digital age of retail hyper personalization : An insight. Pacific Business Review International, 10(10), 131139. Starosta, G. (2010). Global Commodity Chains and the Marxian Law of Value. Antipode, 42(2), 433‑465. https://doi.org/10.1111/j.1467-8330.2009.00753.x Szahun, T. (2020, juin 10). Top 50 global retailers. Kantar.Com. https://www.kantar.com/inspiration/retail/top-50-global-retailers-cn

35
Thompson, D. (2017, avril 10). What in the World Is Causing the Retail Meltdown of 2017? The Atlantic. https://www.theatlantic.com/business/archive/2017/04/retail-meltdown-of-2017/522384/ US census Bureau. (2020, décembre). US Census Bureau Monthly & Annual Retail Trade. https://www.census.gov/retail/index.html#ecommerce Veblen, T. (1921). The engineers and the price system. Routledge. Wailgum, T. (2007, octobre 17). 45 Years of Wal-Mart History : A Technology Time Line | CIO. https://www.cio.com/article/2437873/45-years-of-wal-mart-history--a-technology-time-line.html Wrigley, N., & Lowe, M. (2007). Introduction : Transnational retail and the global economy. Journal of Economic Geography, 7(4), 337‑340. https://doi.org/10.1093/jeg/lbm025 Wrigley, N., & Wood, S. (2018). An economic geography of globalizing retail : Emergence, characteristics, contribution. The Routledge Companion to Economic Geography and International Business. London.