Making our Communities Ready for Ageing - ILCUK
59
www.ilcuk.org.uk Making our Communities Ready for Ageing A call to action ILC-UK and Age UK Seminar Series COMMUNITY MATTERS David Sinclair and Jessica Watson
Transcript of Making our Communities Ready for Ageing - ILCUK

www.ilcuk.org.uk
Making our Communities Ready for Ageing A call to action ILC-UK and Age UK Seminar Series
COMMUNITY MATTERS
David Sinclair and Jessica Watson

Contents Summary of findings and recommendations.....................................................................................3
Introduction ................................................................................................................................................8
A community for all ages........................................................................................................................10
10 things every local authority should do..........................................................................................12
Ageing in our communities....................................................................................................................13
Communities Ready for Ageing: Delivering beyond our basic needs.......................................15
At home........................................................................................................................................................17
- We must build new houses to meet population growth....................................................................19
- Our houses are not adapted for our ageing society.............................................................22
- Housing choices are limited for many older people............................................................28
- A lack of quality information and advice contributes to poor decision making by many “Last time buyers” ........................................................30
- We are facing a housing affordability crisis...........................................................................30
Getting out and about...............................................................................................................................31
- On the road again.......................................................................................................................32
- Public transport .........................................................................................................................35
- Two wheels good?.....................................................................................................................36
- The ageing pedestrian...............................................................................................................37
- From mobility scooters to urban pods ...................................................................................38
- The nuts and bolts: toilets, seating and crime.......................................................................39
Ensuring communities offer what older people want...........................................................................40
- The great outdoors.....................................................................................................................41
- Relationships...............................................................................................................................43
- Activities ......................................................................................................................................44
- Community capacity ................................................................................................................45
What’s missing? ......................................................................................................................................48
Planning for the future.............................................................................................................................51
Acknowledgements................................................................................................................................52
Endnotes....................................................................................................................................................54
The views and recommendations are the collective result of the Community Matters programme and do not necessarily represent the views or policies of ILC-UK or Age UK.

Making our Communities Ready for Ageing I 3
Summary of findings and recommendations
Over the past six months, ILC-UK and Age UK have worked together with academics and opinion formers to take a futures perspective on understanding the evidence about how communities need to adapt to an ageing society. Our aim was to promote the need for policy makers, journalists and opinion formers to better understand the evidence and to focus on solutions to ensure communities are ready for ageing.
We focussed on three main themes:
At home. How to ensure that our homes support our ability to engage in the community?
Getting out and about. How to ensure that the space and services (for example transport) between the home and the broader community facilitate engagement?
Ensuring communities offer what older people want. How to ensure that future communities deliver the sort of services and activities that an ageing society demands?
Alongside this final report we have discussed these issues with experts, published evidence briefings and opened the debate out to the public. Throughout these conversations and in this report, we have focussed on three overarching messages.
Our overarching messages from this project:Communities have to do more than cater for our basic needs – they should be places of fun for everyone
In this report we refer to Maslow’s 1943 vision of the hierarchy of needs in his paper “A Theory of Human Motivation”; with basic needs such as breathing, eating and sleeping at the bottom, while at the top are a human need for self-actualisation and reaching our maximum potential.
Throughout this project it became clear that, at present, we are far too often failing to support our needs at the top end of the heirarchy.
If communities are to work for today’s and tomorrow’s older populations, planners must focus on how we can ensure that our communities are places that deliver much more than the basics. A strong message we received throughout our conversations with experts is that there is not enough emphasis on fun and playfulness for older people. Our communities should be places of fun for everyone; places where people want to get together with new and old friends and that recognise that playfulness is not just the preserve of the young.
To realise this ambition requires a step change in our approach to planning our communities in the context of ageing, and an adjustment in how we see older age and what it offers and needs.
We are already exploring existing capacity in our communities – but there’s more out there
The evidence reviews for the three Community Matters themes provide a snapshot of some of the work going into supporting older people and preparing for our ageing population. In the climate of austerity, there have been greater constraints on what can be funded with public money. Many of the conversations we had in the process of this project convey a sense that we know what needs to be done. We do not need revolutionary ideas or enormous budgets to bring communities together around ageing issues. For many of the topics discussed, there are piecemeal solutions or guidance in place, but these are not being adopted or do not go far enough.

Making our Communities Ready for Ageing I 4
There is a strong need for a multidisciplinary approach to ageing and issues related to older people – requiring collegial working across central and local government, the voluntary sector and community groups: health, social care, community services, housing, work and pensions, transport and business. All these parties need to work in concert, avoiding duplication and supporting each other’s strengths. But we can look beyond the groups already working towards this goal, and ask more from businesses, organisations and groups about what they can offer.
Communities are for all ages
Planning for ageing does not begin at state pension age; ageing happens across the life course. In planning conversations, planning for ageing should have an equal place with encouraging younger people to increase their physical activity and housing standards. With this in mind, communities need to work for all ages and not segregate the needs of different groups. Creating silos of interest builds conflict between those seeking to improve communities for different groups of people, for example younger and older groups, without seeing the potential for overlap and pooling ideas and resources.
The biggest resource a community has is its people, but often their involvement is stifled by overemphasis on safeguarding in service provision. We don’t want to put vulnerable people at risk – but if we allow concerns around safeguarding to become a barrier, we may be merely shifting the risk and subjecting people to loneliness, isolation and poverty.
RecommendationsIdeas bankThe ideas set out below form an “ideas bank” of suggestions which emerged from the Community Matters project. They do not necessarily represent the views of ILC-UK or Age UK but we believe they are a useful starting point for a debate about what public policy changes may be necessary for us ensure that future communities meet the needs of all ages.
At home• Government policy should support a vision of enabling active ageing at home. The
Lifetime Homes standard should be made mandatory for all new houses across the country.
• Planning policy should reflect the reality that specialist retirement housing represents a small proportion of housing. The planning vision should be that of inclusive places for an ageing population, with lifetime home standards in all mainstream housing (in which the vast majority of older people live) alongside specialist and retirement housing.
• Greater regulation of the private rented sector is a policy that benefits multiple generations and increasingly older people as housing ownership falls.
• If we are to cope with demographic change, we need to build far more houses than we are currently doing. This housing must be set within age friendly environments and needs to be designed inclusively to accommodate people’s changing circumstances and needs across the lifecourse.
• Central and local government must not leave the housing market to self-regulate but should develop and implement policies to ensure that our future housing stock is appropriate for our ageing society.
• Government should explore whether they could fiscally incentivise expenditure on housing improvements and adaptations. A tax incentivised voucher scheme for housing adaptations may be one way of doing this.

Making our Communities Ready for Ageing I 5
• Some people will want to move into retirement housing. There is a need for greater choice across the country, as well as across rural, suburban and urban settings – planning teams and developers should respond to the diversity of these demands.
• Estate agents should be trained to better understand the potential needs of the older consumer and could better promote the Lifetime Homes Standard or at least highlight some of the inclusive design features in mainstream homes.
• Housing advice organisations should produce a “later life movers” guide and checklist in-line with the ‘FirstStop Advice’ initiative which offers independent, impartial and free advice on housing options.
Getting out and about
• Measures of accessibility in research and evaluation of transport should include analysis of whole journeys including pavement quality, and the experience and timing of interchange between services.
• Government should lead improvements in road infrastructure, including clearer signage to benefit drivers of all ages.
• Local authorities and the voluntary sector should explore the development of car buddying and sharing schemes to support people wanting to stop driving.
• Online updates for bus times, live information boards at bus stops and spoken stop announcements on buses should be prioritised in local transport plans. These changes should be rolled out across the country to encourage use of bus networks for new users.
• Concessionary travel schemes based on age, such as free bus passes across England, should allow for flexibility for travel in peak time for volunteers.
• Community transport should join up and consider opening doors to the public – including school and university buses.
• Local authorities and bus companies should explore the role for a subsidised taxi service for older people similar to concessionary fares on local buses.
• Increasing the number of cyclists across the life-course to be prioritised as a public health, environmental and social goal by Health and Wellbeing Boards and Local Authorities.
• Existing cycling infrastructure, for example cycle hire schemes, to be made age-friendly to support active ageing, such as offering subsidies in line with other public transport.
• DfT should create a set of national standards for road crossings including age-friendly standards, incorporating types, siting and maintenance with a mandatory requirement on local authorities to adhere to such standards.
• DfT should consider replacing the older people crossing road sign with a sign with more positive imagery promoting walking as part of later life.
• The Highway Agency and local transport teams should communicate details of assistive technology that supports pedestrians (for example motion-activated crossings) to build confidence.
• The cost of maintaining pavements should be justified through public health outcomes such as falls reduction, with segments of public health budgets potentially ring fenced to support improvements to pavements.
• Existing community programmes to consider informal buddying systems for participants to

Making our Communities Ready for Ageing I 6
walk to sessions.
• Health commissioners and providers should promote a key message of ‘improving in strength and balance to support independence’ for falls prevention programmes to counter rejection of the ‘faller’ label.
• Lack of public toilets should be highlighted as a public health issue by Health and Wellbeing Boards (associated risks of loneliness and isolation for fear of going out). Availability of public toilets should be a public health priority, with responsibility placed on Local Authorities to maintain toilets or work with partners to provide facilities.
• Local authorities should subsidise the upkeep of public benches (and other facilities) by offering advertising space to local businesses.
• Retailers and businesses with a high street presence should have Corporate Social Responsibility strategies to include age-friendly business approaches to support the communities they have become part of – including access to toilets for non-customers.
• Community planners must do more to design out the potential for both crime and anti-social behaviour.
Ensuring communities offer what older people want
• Local authorities need to recognise the health benefits of access to green space, and could consider placing some spending on green space under the umbrella of health and ring-fencing it to ensure a commitment to recurrent spend.
• Planning systems should be rationalised so that non-mandatory features such as green space don’t ‘slip through the cracks’ and get lost. An appropriate minimum standard of access to green space might be based on the Accessible Natural Greenspace Standard (ANGSt). This minimum standard should be applied by planning departments as a mandatory requirement for private developers to provide suitable green space on-site in housing (general and specialist housing) developments.
• Recognising the physical and mental health benefits of access to green space, the CQC should place a requirement for residents in care homes to have access to gardens and assistance to enjoy them.
• Local authorities should provide desegregated apparatus for fun in outdoor spaces that includes people of all ages – like swings outside of children’s play areas, and outdoor gyms.
• Local authorities to investigate use levels of outdoor versus indoor leisure facilities in their area and to adjust public spending accordingly.
• Park awards judging criteria (such as the Green Flag awards) should include a positive promotion of activity and healthy ageing.
• Government to create a cross-departmental strategy for widowhood designed to identify and offer support to people who have lost a partner.
• Community stakeholders to participate in supporting people at crucial ‘trigger’ moments for isolation and loneliness.
• Further research is required to understand the significance (and potential cost benefits) of ‘community enabler’ positions.
• Local public health campaigns on loneliness, backed by Health and Wellbeing Boards, with GPs prepared to give advice and referrals to local community groups and older people’s groups for people identified as being at risk of loneliness or who self-referred

Making our Communities Ready for Ageing I 7
for loneliness.
• Local authorities and older people’s groups should maintain a list of activities available in the local area and distribute to community centres, GP surgeries, local information boards etc.
• Community groups to continue to promote access for all, such as through the use of phone groups for people with limited mobility.
• Funding for adult education should reflect the differing needs of adult learners – both short and longer-term education should be supported.
• Local authority safeguarding systems and requirements should be examined to ensure that they are not ‘killing kindness’ by creating barriers too difficult to cross, for example for intergenerational projects.
• Local authorities to support the formation of intergenerational problem-solving forums to engage diverse sections of communities to respond to problems.
• Retailers and businesses with a ‘high street’ presence – including the ‘unusual suspects’ of betting shops and convenience stores – have a responsibility to actively contribute to age-ready communities (and they could benefit by doing so).
• Community centres to protect time for local group activities to maintain the space as community resource (as opposed to a hall for hire).
• Landlords of empty high street shops and organisations with real estate to establish open-door policies for local groups seeking space to meet or hold activities
• Care homes should be designed or adapted to have space for community activities, and should maintain open policies to integrate the home into its community.
• Local service commissioners, including social care budget holders and clinical commissioning groups, to support community networks.
• To make a convincing business and value-for-money case for community interventions, cost-efficiency must be demonstrated in evaluations of existing schemes. This should be supported by local health and social care systems with more flexible access to data; and by research organisations offering evaluation support to community and voluntary groups.
• UK Research Councils and research funders to invest in knowledge sharing that supports the championing of best practice and avoids duplication.
• Funders and commissioners must appreciate the value of participatory research and provide sensible and serious research criteria for evaluation of projects that do not exclude service providers without professional research knowledge or support.
Making our Communities Ready for Ageing I 8
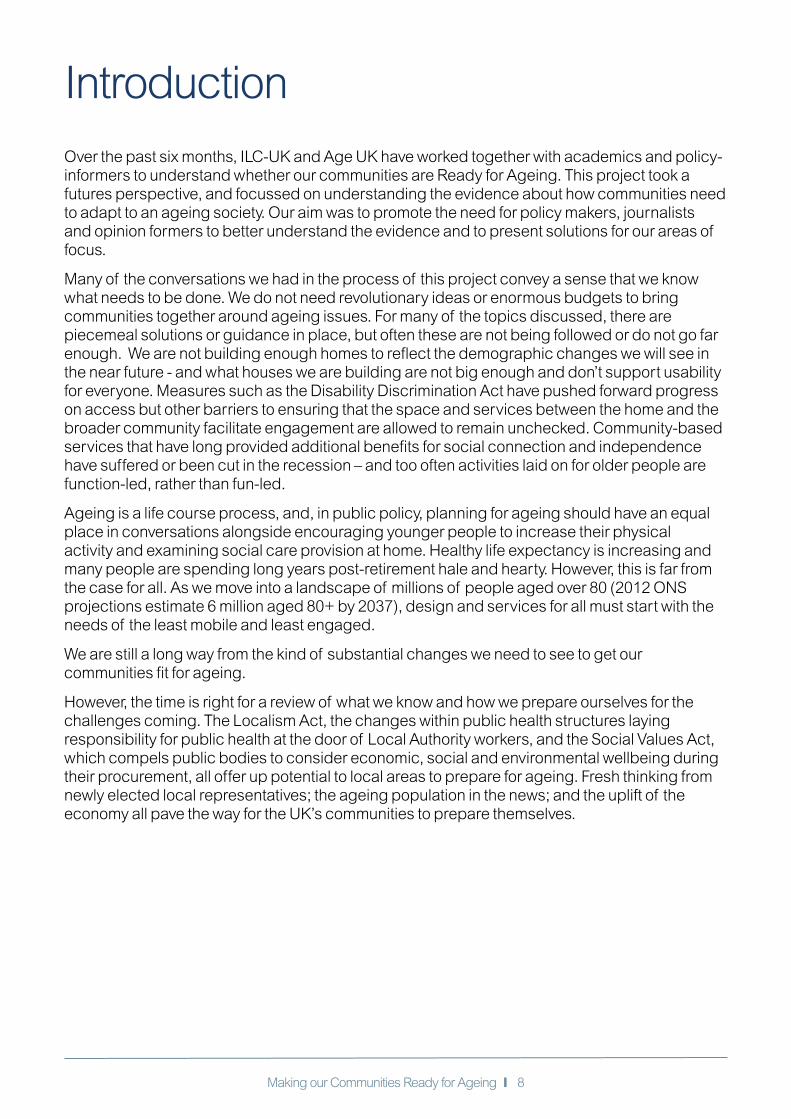
Introduction
Over the past six months, ILC-UK and Age UK have worked together with academics and policy-informers to understand whether our communities are Ready for Ageing. This project took a futures perspective, and focussed on understanding the evidence about how communities need to adapt to an ageing society. Our aim was to promote the need for policy makers, journalists and opinion formers to better understand the evidence and to present solutions for our areas of focus.
Many of the conversations we had in the process of this project convey a sense that we know what needs to be done. We do not need revolutionary ideas or enormous budgets to bring communities together around ageing issues. For many of the topics discussed, there are piecemeal solutions or guidance in place, but often these are not being followed or do not go far enough. We are not building enough homes to reflect the demographic changes we will see in the near future - and what houses we are building are not big enough and don’t support usability for everyone. Measures such as the Disability Discrimination Act have pushed forward progress on access but other barriers to ensuring that the space and services between the home and the broader community facilitate engagement are allowed to remain unchecked. Community-based services that have long provided additional benefits for social connection and independence have suffered or been cut in the recession – and too often activities laid on for older people are function-led, rather than fun-led.
Ageing is a life course process, and, in public policy, planning for ageing should have an equal place in conversations alongside encouraging younger people to increase their physical activity and examining social care provision at home. Healthy life expectancy is increasing and many people are spending long years post-retirement hale and hearty. However, this is far from the case for all. As we move into a landscape of millions of people aged over 80 (2012 ONS projections estimate 6 million aged 80+ by 2037), design and services for all must start with the needs of the least mobile and least engaged.
We are still a long way from the kind of substantial changes we need to see to get our communities fit for ageing.
However, the time is right for a review of what we know and how we prepare ourselves for the challenges coming. The Localism Act, the changes within public health structures laying responsibility for public health at the door of Local Authority workers, and the Social Values Act, which compels public bodies to consider economic, social and environmental wellbeing during their procurement, all offer up potential to local areas to prepare for ageing. Fresh thinking from newly elected local representatives; the ageing population in the news; and the uplift of the economy all pave the way for the UK’s communities to prepare themselves.

Making our Communities Ready for Ageing I 9
The Community Matters project
We focussed on three areas:
At home. How to ensure that our homes support our ability to engage in the community?
Getting out and about. How to ensure that the space and services (for example transport) between the home and the broader community facilitate engagement?
Ensuring communities offer what older people want. How to ensure that future communities deliver the sort of services and activities that an ageing society demands?
Understanding the evidence:
ILC-UK and Age UK produced evidence reviews on each of the topics outlined above. The evidence reviews have been published alongside this report and are available on the ILC-UK website and the Age UK Knowledge Hub. These documents were not intended to be systematic reviews but instead aimed to highlight some of the latest evidence from researchers in the UK and across the world.
Debating the evidence:
ILC-UK and Age UK organised three discussion seminars to debate the evidence and focus on policy solutions. During the seminars, academic and policy experts were asked to set out evidence and highlight their personal policy priorities. The discussion groups were facilitated to be a “safe place” to develop ideas and possible solutions: see page 52 for details of speakers and participants.
Presenting the solutions:
ILC-UK gathered the inputs and ideas from the evidence reviews and discussion seminars and presented them at a public discussion event. The results of these conversations, along with comments from the experts who participated in the seminars, have fed into this final report.
The Ready for Ageing Alliance
In response to the Lords Select Committee on Public Services and Demographic Change report, Ready for Ageing?, eight national charities working on ageing issues formed the Ready for Ageing Alliance. The Alliance, of which ILC-UK and Age UK are members, is working to urge the Government and all political parties to face up to the major changes and challenges from our rapidly ageing society. This report highlights some of the concerns of the Alliance in the context of our communities.

Making our Communities Ready for Ageing I 10
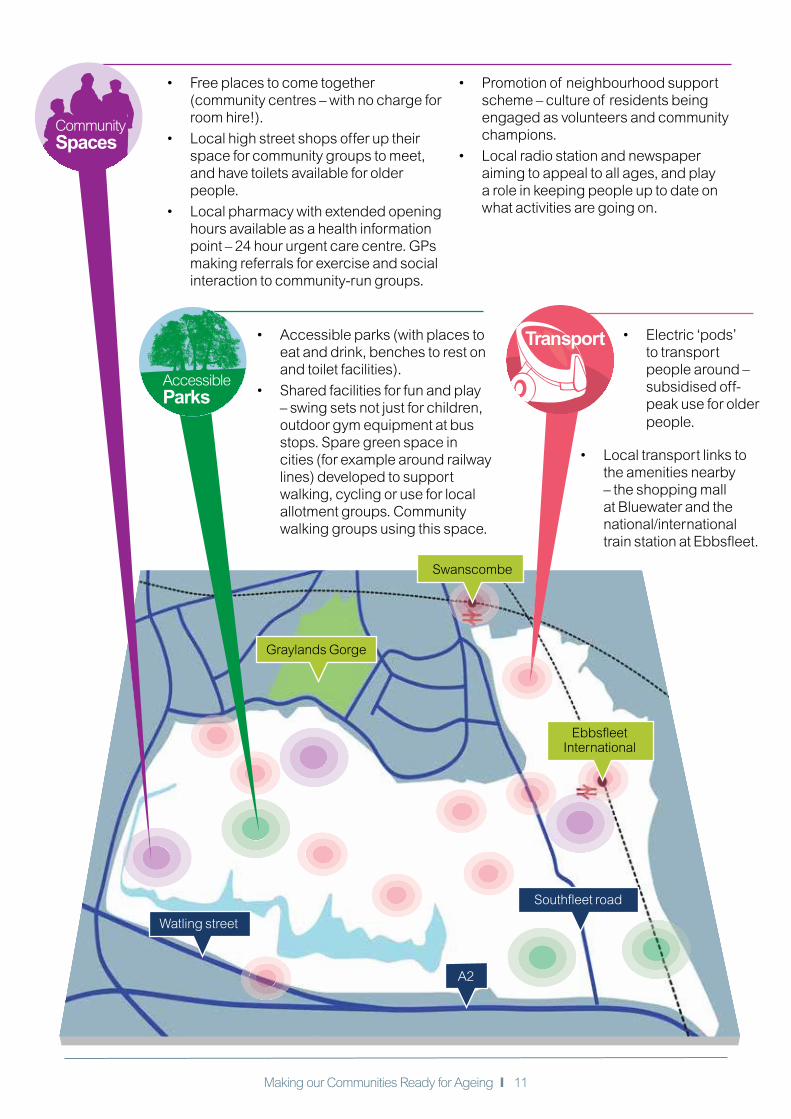
A community for all agesIn the 2014 Budget, the Chancellor announced that a new garden city will be built in Ebbsfleet. Here is our vision of what Ebbsfleet could look like in 2025, as a community ready for ageing.
Graylands Gorge
Swanscombe
Southfleet road
EbbsfleetInternational
A2
In home technology
All-inclusive housing
A new lifetime neighbourhood standard introduced and measured
Watling street
• All-inclusive housing, plus some specialist retirement housing and care homes sited in the town centre.
• Environmentally friendly housing to support a pledge for ‘no excess winter deaths’.
• Flats that promote a community feel, houses, bungalows (no high rise) – so extended families can live in the same community.
• More new homes, built to the lifetime homes standard – those with limited mobility can visit friends and can move around without experiencing problems.
• In home technology – incoming technology such as app-operated heating brought into mainstream and offered as standard (with complementary device) to those on social energy tariffs.
• In home display monitors linked to smart meters could help us control our home from a single place (central locking of all doors; controlling our heating; highlighting needs for home improvements or repairs).
Making our Communities Ready for Ageing I 11
Graylands Gorge
Southfleet road
Watling street
A2
Community Spaces
• Accessible parks (with places to eat and drink, benches to rest on and toilet facilities).
• Shared facilities for fun and play – swing sets not just for children, outdoor gym equipment at bus stops. Spare green space in cities (for example around railway lines) developed to support walking, cycling or use for local allotment groups. Community walking groups using this space.
• Electric ‘pods’ to transport people around – subsidised off-peak use for older people.
• Free places to come together (community centres – with no charge for room hire!).
• Local high street shops offer up their space for community groups to meet, and have toilets available for older people.
• Local pharmacy with extended opening hours available as a health information point – 24 hour urgent care centre. GPs making referrals for exercise and social interaction to community-run groups.
• Promotion of neighbourhood support scheme – culture of residents being engaged as volunteers and community champions.
• Local radio station and newspaper aiming to appeal to all ages, and play a role in keeping people up to date on what activities are going on.
Transport
• Local transport links to the amenities nearby – the shopping mall at Bluewater and the national/international train station at Ebbsfleet.
EbbsfleetInternational
Swanscombe
Accessible Parks

Making our Communities Ready for Ageing I 12
10 things every local authority should doMaximise and recognise the social and economic value of older people – Offer, encourage and support opportunities to work and volunteer
Recognise the need to plan and build housing which is appropriate and adaptable to the needs of older people – Build to lifetime homes standard and support
Offer more than our basic needs – Offer and encourage places to play for all ages
Encourage generations to come together – Ensure community centres are accessible and attractive to all ages
Places to meet not places to hire – Offer free space to allow people to come together to talk and enjoy life
Ensure people aren’t caught on a bladder leash – Maintain and keep open public toilets and/or incentivise businesses to open up their toilet facilities as a public resource
Help us get out of our house – Ensure that built environments and public spaces are designed to be safe, convenient, and enjoyable to walk and cycle in, and that journeys are accessible from doorstep to destination
Use their new powers to improve communities for all ages – Be aware of the opportunities of the Social Values Act and procure with age-readiness at front of mind
Build neighbourliness – Find ways of breaking down “safeguarding” barriers that currently prevent generations working together
Plan for ageing – ensure transport, housing and community development plans recognise the demographic changes ahead – and use existing tools like the Equality Impact Assessment

Making our Communities Ready for Ageing I 13
100
100
In 2013,
7.7 million people in UK households lived alone, of whom 3.6 million were aged 65 or above.
At age 65 the majority of people living alone (68%) were female in 20131.
Ageing in our communities
People living alone by age group 2003-20132
16-44 down
19%45-64 up
28%65+ up
8%
The number of centenarians living in the UK has risen by
73% over the last decade to 13,350 in 20123.
18-24 age group
= 44%
2010 election turnout
65+ age group
= 76%4
This gap has almost doubled since 19705 18-24 65+
The UK will have
the largest population in Europe by 2050.

Making our Communities Ready for Ageing I 14
UK is 80% urbanised. – above global average.
Just over
¾ of people aged 65+ live in rural areas6.
Rural areas are ageing faster – projected increase of the 65+ age group in rural areas to
29% compared to 20%
in urban areas by 20217
There remains a clear trend for older age groups to live around the coast, particularly the east, south and north west, something which is predicted to continue to 2030.8,9
Growing numbers of us are likely to be renting – average age of a first time buyer without family assistance is now 33, compared to 30 in 200810
Over half of pensioner owner-occupiers have housing equity of more than £175,000, around a quarter have less than £125,00011
In 2010, over 65s made a net contribution (through taxes, spending power, provision of social care and value of volunteering) of
£40 billion to the UK economy.
By 2030 projections suggest that will grow to
£77 billion by 203012

Making our Communities Ready for Ageing I 15
Communities Ready for Ageing: Delivering beyond our basic needs
Abraham Maslow’s 1943 paper, “A Theory of Human Motivation”, published in Psychological Review, argued that humans have a hierarchy of needs. At the bottom are our basic needs (breathing, eating and sleeping) and at the top is our need for self-actualisation. During our discussions on transport, Professor Musselwhite (see page 52) argued that transport provision for older people has focussed on the basic needs for transport and has too often ignored our needs further up the pyramid.
Throughout this project it became clear that many communities are failing to support anything beyond the needs expressed at the lower end of the pyramid. If communities are to work for today’s and tomorrow’s older populations, planners must also focus on how we can ensure that our communities are places that deliver much more than the basics.
Towns, cities and villages need to be places of fun. Places for all ages and places where people want to get together with new and old friends. To realise this ambition requires a step change in our approach to planning our communities in the context of ageing.
Meeting our physiological needs
In some cases, even the basic needs of older people are not supported. Cuts to public toilets and the decline of the town centre have made access to essential services more difficult, particularly for people whose transport choices are limited.
Our communities must:
• Provide for decent housing
• Ensure access to basic services including fresh and affordable food
• Provide for drinking water
• Deliver adequate publicly accessible toilets
Meeting our need for security
For our communities to be ready for ageing, they must be safe and secure. On the one hand, crime levels have fallen over recent decades; on the other, fear of crime and concerns about anti-
Self-actualisation
Esteem
Love/Belonging
Safety
Physiological
morality, creativity
spontaneity,problem solving,lack of prejudice,
acceptance of facts
Self esteem,confidence, achievement,
respect of others, respect by others
breathing, food, water, sex, sleep, homeostasis, excretion
security of body, of employment, of resources, of morality, of the family, of health, of property
friendship, family, sexual intamacy

Making our Communities Ready for Ageing I 16
social behaviour are of particular concern to older people. The design of our communities must facilitate improved health and wellbeing. Our communities need to play a part in ensuring our financial security.
Our communities must:
• Design out crime and the potential for fear of crime
• Ensure there are jobs for people of all ages
• Facilitate health and active ageing rather than a sedentary lifestyle and a reliance on the car as the main form of transport
• Design out the risk of falls inside and outside our homes
Love and belonging
Our discussions focussed attention on the importance of communities in tackling the growing epidemic of isolation and loneliness. Yet it is clear that communities are failing to deliver for today’s older population. If our communities are to be ready for ageing, they must place a greater emphasis on meeting our need for friendship, family and intimacy.
Our communities must:
• Not discriminate on the basis of age
• Offer open public spaces for all ages to come together
• Offer services which bring together friends and family instead of forcing them apart
• Offer free community spaces to come together, not “rooms to rent”
• Facilitate mobility solutions that allow for ‘discretionary journeys’ to allow people to engage with family and friends or just get out and about.
Esteem
The prevalence of ageism in our communities plays a part in reducing self-esteem and self-respect. We need to be valued.
Our communities must:
• Offer opportunities for people of all ages to share their skills and experience
• Encourage and support community engagement by people of all ages
• Remove barriers to opportunities to volunteer
• Recognise and support the contribution of volunteers of all ages
Self-actualisation
The top level of Maslow’s hierarchy focused on the need for self-actualisation. We need to ensure that our potential is maximised rather than limited by the community around us.
Our communities must:
• Recognise our diversity of issues, wishes and needs
• Offer a range of services beyond the typecasting of ‘what older people want’
• Not undermine our need for self-actualisation

Making our Communities Ready for Ageing I 17
At homeRecommendations:• Government policy should support a vision of enabling active ageing at home.
The Lifetime Homes standard should be made mandatory for all new houses across the country.
• Planning policy should reflect the reality that specialist retirement housing represents a small portion of housing. The planning vision should be that of inclusive places for an ageing population, with lifetime home standards in all mainstream housing (where the vast majority of older people live) alongside specialist and retirement housing.
• Greater regulation of the private rented sector is a policy that benefits multiple generations and increasingly older people as housing ownership falls.
Many older people view their home as an important part of their lives, providing fundamental benefits to their health, wellbeing and quality of life (Care and Repair 2013).
The home environment is an important factor in the wellbeing of people of all ages. The quality of our home impacts on our independence. But it is also critical to preventing poor health and ensuring community engagement.
Yet we are failing to plan for the sort of homes we need if we are to meet the needs of our ageing society. Our homes are a long way from being “ready for ageing”. In fact, the policy and market drivers that incentivise smaller properties may well mean that much of the stock is less adaptable than ever before.
Communities can drive desirability of location. Accessibility, proximity to services and community facilities and access to relevant mobility options should be key factors in where older people choose to live - and should be relevant when thinking about new provision. The effects of clustering in specific ‘ageing’ communities (for example Eastbourne, Torbay etc.) and the impacts of family dispersal geographically are also important factors to give some thought to when thinking about how and where appropriate housing is developed for older people.
Home ownership is currently by far the most prevalent tenure in old age in the UK (75%) and as such dominates debates on where we live in old age. Compared to younger age groups, a high proportion of older people own their properties outright.
We should not however, automatically assume that home ownership levels will continue to be as high as they are today. Future generations may be more likely to be home renters rather than owners. In some European countries, renting remains more common throughout life. Whilst providing security, stability and choice for many, for some, home ownership can be a burden in old age as it can be both difficult and costly for us to maintain and adapt our homes. Ensuring longer and protected tenures in the private rented sector will be vital if this form of tenure is to adapt to our ageing society.
However, home ownership is central to discussion of financial assets in later life, given that, for many people, the majority of their wealth is held in their property. At the same time, maintaining a home is of major concern to older people and finding money to maintain their housing is difficult. If we recognise that, for the vast majority, staying put is likely to be the preferred (and often their only) option, it is vital that all government policy supports a vision of enabling active ageing at home.

Making our Communities Ready for Ageing I 18
7 million older households (500,000 specialist units)13
30% of all homes lived in by older people14
90% live in mainstream housing stock (6% sheltered/retirement, 4% residential/nursing/other)15
75% owner occupation (specialist housing = 80% social rented)16
The relative permanency of where we live, and the huge influence that housing standards have on the health, wellbeing and functioning of occupants, strengthen the need for central and local government to intervene to make the markets work for today’s and tomorrow’s populations. There is a real lack of imagination in the construction industry. The industry, understandably, wants products they can build and sell quickly. Yet these products may not be what either today’s or tomorrow’s ageing populations need. While retrofitting adaptations onto existing homes is an option, the added costs are significant, compared to the marginal increase in building costs potentially incurred by integrating modifications during construction.
We cannot expect the market alone to deliver for the long term needs of our population.

Making our Communities Ready for Ageing I 19
We must build new houses that meet population growth
Recommendation• If we are to cope with demographic change, we need to build far more houses than
we are currently doing. This housing must be set within age friendly environments and needs to be designed inclusively to accommodate people’s changing circumstances and needs across the lifecourse.
The lack of new housing supply has been a political hot potato for some time. Now, as we approach the 2015 General Election, both the Conservatives and Labour are promising to tackle this issue head on. In the recent Budget, George Osborne promised £500m of financing for small builders and new Garden Cities as part of his blueprint to ease the country’s housing shortage with 200,000 new homes. For their part, Labour have promised to build 200,000 new homes a year – the highest level of house building since the late 1980s. But the plans are unlikely to be sufficient as they will fail to keep pace with population change.
Since the end of the 1970s, the number of new dwellings started has failed to exceed 300,000 in any one calendar year, with much of the 1990s seeing numbers dwindle below 200,000. Housing starts then increased in the years leading up to the financial crisis – though still nowhere near 1970s levels – before falling below 150,000 since 2008 (the lowest level in over 40 years) (see chart).
While house building has failed to match 1970s levels, the UK’s population has continued to rise.
Figure 1. Number of permanent dwellings started in UK 1969-2013
300,000
400,000
350,000
50,000
150,000
100,000
200,000
250,000
Source: DCLG
0
1969
-70
1970
-71
1971
-72
1972
-73
1973
-74
1974
-75
1975
-76
1976
-77
1977
-78
1978
-79
1979
-80
1980
-81
1981
-82
1982
-83
1983
-84
1984
-85
1985
-86
1986
-87
1987
-88
1988
-89
1989
-90
1990
-91
1991
-92
1992
-93
1993
-94
1994
-95
1995
-96
1996
-97
1997
-98
1999
-00
2000
-01
2001
-02
2002
-03
2003
-04
2004
-05
2005
-06
2006
-07
2007
-08
2008
-09
2009
-10
2010
-11
2011
-12
2012
-13
1998
-99
Number of permanent dwellings stated in UK 1969-2013FIG1
Difference between number of new dwellings started and year on year population growth
FIG2
200,000
400,000
300,000
-500,000
-300,000
-400,000
-200,000
-100,000
100,000
Source: DCLG and author’s calculations
Source: ONS DCLG and author’s calculations
0
1969
1971
1973
1975
1977
1979
1981
1983
1985
1987
1989
1991
1993
1995
1997
1999
2001
2003
2005
2007
2009
2011
2013
Local Authorities
Housing association
Private enterprise
FIG3
300,000
400,000
350,000
50,000
150,000
100,000
200,000
250,000
0
1969
-70
1973
-74
1971
-72
1975
-76
1977
-78
1979
-80
1981
-82
1983
-84
1985
-86
1987
-88
1989
-90
1991
-92
1993
-94
1995
-96
1997
-98
1999
-00
2001
-02
2003
-04
2005
-06
2007
-08
2009
-10
Composition of dwelling started
200,000
400,000
300,000
-500,000
-300,000
-400,000
-200,000
-100,000
100,000
0
1969
2017
1972
1975
2020
1978
1981
1984
2023
1987
1990
2026
1993
2029
1996
1999
2001
2032
2005
2008
2035
2011
2014
FIG4 Difference between number of new dwellings started year on yearand population growth
FIG5 New homes required versus previous house building scenarios
FIG6 Average size of new homes
FIG7 Total council spend on 65+ care services and difference to the level implied by long-run trend
FIG 8 Housing our Ageing Population: Panel for Innovation
FIG 9 Mobility, accessibility and quality of later life
FIG 10 Length of car driver journeys 2011-12
FIG 11 Length of car driver journeys 2011-12
1970s yearly home starts
1980s yearly home starts
1990s yearly home starts
Housing starts-total annualpopulation growth (actual)
Post 2008 crisis yearly home starts
1980s yearly home starts
1990s yearly home starts
Post 2008 crisis yearly home starts
What we will actually need
1970s yearly home starts
50,000
100,000
150,000
200,000
250,000
300,000
350,000
2013
2015
2017
2019
2021
2023
2025
2031
2033
2035
2037
2029
2027
Source: ONS author’s calculations
Source: The RIBA (2011) based on work by Policy Exchange and Localis (2005)
UK 76m2
Japan (21% bigger) 92m2
Netherlands (53% bigger) 115.5m2
Denmark (80% bigger) 137m2
12
10
8
6
4
2
01994-
951995-
961996-
971997-
981998-
991999-2000
2000-01
2001-02
2002-03
2003-04
2004-05
2005-06
2006-07
2007-08
2008-09
2009-10
2010-11
2011-12
2012-13
Total expenditure Long term trend (based on average annual expenditure growth rate, 1994-2010)
27%
£bill
ion
Source: Census (2001),Elderly Accomodation Counsel, Community Care Statistics (2008), Housing LIN
General Needs Housing with pensioner housing in England 5,809,582
Specialist Housing 729,818
General Needs Housing in England 19,655,611
Residential Home in England 105,676
Nursing Home in England 58,304
Units of Sheltered Accomodation in England 476,000
Units of Very Sheltered Accommodation in England 23,000
Close Care in England 12,938
Units of Retirement Villages in England 8,466
Specialised/Dementia Care in England 6,293
Extra Care in England 39,141
Primary mobility needs
Secondary mobility needs
Tertiarymobility needs
0
2
4
6
8
10
12
21-2
9
30-3
9
40-4
9
50-5
4
55-5
9
60-6
4
75-7
9
80-8
4
85+
70-7
4
65-6
9
Age group
Leng
th o
f ca
r d
river
jour
neys
,mile
sJo
urne
ys p
er y
ear
Women
Men
Car passengerCar driver BusOther Walk
-
200
400
600
800
1,000
1,200
Men Women
40-4
9
50-5
4
55-5
9
60-6
4
75-7
9
80-8
4
85+
70-7
4
65-6
9
-
200
400
600
800
1,000
1,200
40-4
9
50-5
4
55-5
9
60-6
4
75-7
9
80-8
4
85+
70-7
4
65-6
9
500
1000
1500
2000
2500
3000
3500
4000
4500
01995/97 1998/00 2002 2005 2010 2011 2012
Mile
s dr
iven
/per
son/
year
GB
60-69
70++77%
All ages
FIG 12 Miles driven GB
10
0.02.04.06.08.0
10.012.014.016.018.020.0
20
30
40
50
60
70
80
90
1975
/7619
85/86
1989
/9119
92/94
1995
/9719
98/00 2002
2003
2004
2005
2006
2007
2008
2009
2010
2011
2012
female
+77%
male
FIG 13 % of GB licence holders over 70
FIG 14 Internet non-users % of all adults
2011Q1
2011Q2
2011Q3
2011Q4
2012Q1
2012Q2
2012Q3
2012Q4
2013Q1
2013Q2
2013Q3
2013Q4
Source: DCLG

Making our Communities Ready for Ageing I 20
The stagnation in house building has been driven by the substantial fall in local authority new builds that have not been replaced by private enterprise or housing associations (see chart). The financial crisis exacerbated this long-term problem by lowering demand for property and reducing access to credit for the construction industry.
Just to keep up with anticipated population growth between now and 2037, we will need to build houses at the fastest rate since the 1970s. The chart below shows the impact of a number of different house building scenarios on the housing deficit. Even under a 1970s-style scenario with over 300,000 new dwellings started a year, the annual increase in the UK’s population will be greater for almost the entire period. And this does not take into account the fact that many current homes are unsuitable and some homes will need to be demolished over the period.
Figure 2. Difference between number of new dwelling started and year on year population growth
300,000
400,000
350,000
50,000
150,000
100,000
200,000
250,000
Source: DCLG
0
1969
-70
1970
-71
1971
-72
1972
-73
1973
-74
1974
-75
1975
-76
1976
-77
1977
-78
1978
-79
1979
-80
1980
-81
1981
-82
1982
-83
1983
-84
1984
-85
1985
-86
1986
-87
1987
-88
1988
-89
1989
-90
1990
-91
1991
-92
1992
-93
1993
-94
1994
-95
1995
-96
1996
-97
1997
-98
1999
-00
2000
-01
2001
-02
2002
-03
2003
-04
2004
-05
2005
-06
2006
-07
2007
-08
2008
-09
2009
-10
2010
-11
2011
-12
2012
-13
1998
-99
Number of permanent dwellings stated in UK 1969-2013FIG1
Difference between number of new dwellings started and year on year population growth
FIG2
200,000
400,000
300,000
-500,000
-300,000
-400,000
-200,000
-100,000
100,000
Source: DCLG and author’s calculations
Source: ONS DCLG and author’s calculations
0
1969
1971
1973
1975
1977
1979
1981
1983
1985
1987
1989
1991
1993
1995
1997
1999
2001
2003
2005
2007
2009
2011
2013
Local Authorities
Housing association
Private enterprise
FIG3
300,000
400,000
350,000
50,000
150,000
100,000
200,000
250,000
0
1969
-70
1973
-74
1971
-72
1975
-76
1977
-78
1979
-80
1981
-82
1983
-84
1985
-86
1987
-88
1989
-90
1991
-92
1993
-94
1995
-96
1997
-98
1999
-00
2001
-02
2003
-04
2005
-06
2007
-08
2009
-10
Composition of dwelling started
200,000
400,000
300,000
-500,000
-300,000
-400,000
-200,000
-100,000
100,000
0
1969
2017
1972
1975
2020
1978
1981
1984
2023
1987
1990
2026
1993
2029
1996
1999
2001
2032
2005
2008
2035
2011
2014
FIG4 Difference between number of new dwellings started year on yearand population growth
FIG5 New homes required versus previous house building scenarios
FIG6 Average size of new homes
FIG7 Total council spend on 65+ care services and difference to the level implied by long-run trend
FIG 8 Housing our Ageing Population: Panel for Innovation
FIG 9 Mobility, accessibility and quality of later life
FIG 10 Length of car driver journeys 2011-12
FIG 11 Length of car driver journeys 2011-12
1970s yearly home starts
1980s yearly home starts
1990s yearly home starts
Housing starts-total annualpopulation growth (actual)
Post 2008 crisis yearly home starts
1980s yearly home starts
1990s yearly home starts
Post 2008 crisis yearly home starts
What we will actually need
1970s yearly home starts
50,000
100,000
150,000
200,000
250,000
300,000
350,000
2013
2015
2017
2019
2021
2023
2025
2031
2033
2035
2037
2029
2027
Source: ONS author’s calculations
Source: The RIBA (2011) based on work by Policy Exchange and Localis (2005)
UK 76m2
Japan (21% bigger) 92m2
Netherlands (53% bigger) 115.5m2
Denmark (80% bigger) 137m2
12
10
8
6
4
2
01994-
951995-
961996-
971997-
981998-
991999-2000
2000-01
2001-02
2002-03
2003-04
2004-05
2005-06
2006-07
2007-08
2008-09
2009-10
2010-11
2011-12
2012-13
Total expenditure Long term trend (based on average annual expenditure growth rate, 1994-2010)
27%
£bill
ion
Source: Census (2001),Elderly Accomodation Counsel, Community Care Statistics (2008), Housing LIN
General Needs Housing with pensioner housing in England 5,809,582
Specialist Housing 729,818
General Needs Housing in England 19,655,611
Residential Home in England 105,676
Nursing Home in England 58,304
Units of Sheltered Accomodation in England 476,000
Units of Very Sheltered Accommodation in England 23,000
Close Care in England 12,938
Units of Retirement Villages in England 8,466
Specialised/Dementia Care in England 6,293
Extra Care in England 39,141
Primary mobility needs
Secondary mobility needs
Tertiarymobility needs
0
2
4
6
8
10
12
21-2
9
30-3
9
40-4
9
50-5
4
55-5
9
60-6
4
75-7
9
80-8
4
85+
70-7
4
65-6
9
Age group
Leng
th o
f ca
r d
river
jour
neys
,mile
sJo
urne
ys p
er y
ear
Women
Men
Car passengerCar driver BusOther Walk
-
200
400
600
800
1,000
1,200
Men Women
40-4
9
50-5
4
55-5
9
60-6
4
75-7
9
80-8
4
85+
70-7
4
65-6
9
-
200
400
600
800
1,000
1,200
40-4
9
50-5
4
55-5
9
60-6
4
75-7
9
80-8
4
85+
70-7
4
65-6
9
500
1000
1500
2000
2500
3000
3500
4000
4500
01995/97 1998/00 2002 2005 2010 2011 2012
Mile
s dr
iven
/per
son/
year
GB
60-69
70++77%
All ages
FIG 12 Miles driven GB
10
0.02.04.06.08.0
10.012.014.016.018.020.0
20
30
40
50
60
70
80
90
1975
/7619
85/86
1989
/9119
92/94
1995
/9719
98/00 2002
2003
2004
2005
2006
2007
2008
2009
2010
2011
2012
female
+77%
male
FIG 13 % of GB licence holders over 70
FIG 14 Internet non-users % of all adults
2011Q1
2011Q2
2011Q3
2011Q4
2012Q1
2012Q2
2012Q3
2012Q4
2013Q1
2013Q2
2013Q3
2013Q4
Source: ONS, DCLG and author’s calculations
Figure 3. Composition of dwelling started
300,000
400,000
350,000
50,000
150,000
100,000
200,000
250,000
Source: DCLG
0
1969
-70
1970
-71
1971
-72
1972
-73
1973
-74
1974
-75
1975
-76
1976
-77
1977
-78
1978
-79
1979
-80
1980
-81
1981
-82
1982
-83
1983
-84
1984
-85
1985
-86
1986
-87
1987
-88
1988
-89
1989
-90
1990
-91
1991
-92
1992
-93
1993
-94
1994
-95
1995
-96
1996
-97
1997
-98
1999
-00
2000
-01
2001
-02
2002
-03
2003
-04
2004
-05
2005
-06
2006
-07
2007
-08
2008
-09
2009
-10
2010
-11
2011
-12
2012
-13
1998
-99
Number of permanent dwellings stated in UK 1969-2013FIG1
Difference between number of new dwellings started and year on year population growth
FIG2
200,000
400,000
300,000
-500,000
-300,000
-400,000
-200,000
-100,000
100,000
Source: DCLG and author’s calculations
Source: ONS DCLG and author’s calculations
0
1969
1971
1973
1975
1977
1979
1981
1983
1985
1987
1989
1991
1993
1995
1997
1999
2001
2003
2005
2007
2009
2011
2013
Local Authorities
Housing association
Private enterprise
FIG3
300,000
400,000
350,000
50,000
150,000
100,000
200,000
250,000
0
1969
-70
1973
-74
1971
-72
1975
-76
1977
-78
1979
-80
1981
-82
1983
-84
1985
-86
1987
-88
1989
-90
1991
-92
1993
-94
1995
-96
1997
-98
1999
-00
2001
-02
2003
-04
2005
-06
2007
-08
2009
-10
Composition of dwelling started
200,000
400,000
300,000
-500,000
-300,000
-400,000
-200,000
-100,000
100,000
0
1969
2017
1972
1975
2020
1978
1981
1984
2023
1987
1990
2026
1993
2029
1996
1999
2001
2032
2005
2008
2035
2011
2014
FIG4 Difference between number of new dwellings started year on yearand population growth
FIG5 New homes required versus previous house building scenarios
FIG6 Average size of new homes
FIG7 Total council spend on 65+ care services and difference to the level implied by long-run trend
FIG 8 Housing our Ageing Population: Panel for Innovation
FIG 9 Mobility, accessibility and quality of later life
FIG 10 Length of car driver journeys 2011-12
FIG 11 Length of car driver journeys 2011-12
1970s yearly home starts
1980s yearly home starts
1990s yearly home starts
Housing starts-total annualpopulation growth (actual)
Post 2008 crisis yearly home starts
1980s yearly home starts
1990s yearly home starts
Post 2008 crisis yearly home starts
What we will actually need
1970s yearly home starts
50,000
100,000
150,000
200,000
250,000
300,000
350,000
2013
2015
2017
2019
2021
2023
2025
2031
2033
2035
2037
2029
2027
Source: ONS author’s calculations
Source: The RIBA (2011) based on work by Policy Exchange and Localis (2005)
UK 76m2
Japan (21% bigger) 92m2
Netherlands (53% bigger) 115.5m2
Denmark (80% bigger) 137m2
12
10
8
6
4
2
01994-
951995-
961996-
971997-
981998-
991999-2000
2000-01
2001-02
2002-03
2003-04
2004-05
2005-06
2006-07
2007-08
2008-09
2009-10
2010-11
2011-12
2012-13
Total expenditure Long term trend (based on average annual expenditure growth rate, 1994-2010)
27%
£bill
ion
Source: Census (2001),Elderly Accomodation Counsel, Community Care Statistics (2008), Housing LIN
General Needs Housing with pensioner housing in England 5,809,582
Specialist Housing 729,818
General Needs Housing in England 19,655,611
Residential Home in England 105,676
Nursing Home in England 58,304
Units of Sheltered Accomodation in England 476,000
Units of Very Sheltered Accommodation in England 23,000
Close Care in England 12,938
Units of Retirement Villages in England 8,466
Specialised/Dementia Care in England 6,293
Extra Care in England 39,141
Primary mobility needs
Secondary mobility needs
Tertiarymobility needs
0
2
4
6
8
10
12
21-2
9
30-3
9
40-4
9
50-5
4
55-5
9
60-6
4
75-7
9
80-8
4
85+
70-7
4
65-6
9
Age group
Leng
th o
f ca
r d
river
jour
neys
,mile
sJo
urne
ys p
er y
ear
Women
Men
Car passengerCar driver BusOther Walk
-
200
400
600
800
1,000
1,200
Men Women
40-4
9
50-5
4
55-5
9
60-6
4
75-7
9
80-8
4
85+
70-7
4
65-6
9
-
200
400
600
800
1,000
1,200
40-4
9
50-5
4
55-5
9
60-6
4
75-7
9
80-8
4
85+
70-7
4
65-6
9
500
1000
1500
2000
2500
3000
3500
4000
4500
01995/97 1998/00 2002 2005 2010 2011 2012
Mile
s dr
iven
/per
son/
year
GB
60-69
70++77%
All ages
FIG 12 Miles driven GB
10
0.02.04.06.08.0
10.012.014.016.018.020.0
20
30
40
50
60
70
80
90
1975
/7619
85/86
1989
/9119
92/94
1995
/9719
98/00 2002
2003
2004
2005
2006
2007
2008
2009
2010
2011
2012
female
+77%
male
FIG 13 % of GB licence holders over 70
FIG 14 Internet non-users % of all adults
2011Q1
2011Q2
2011Q3
2011Q4
2012Q1
2012Q2
2012Q3
2012Q4
2013Q1
2013Q2
2013Q3
2013Q4
Source: DCLG and author’s calculations
Making our Communities Ready for Ageing I 21
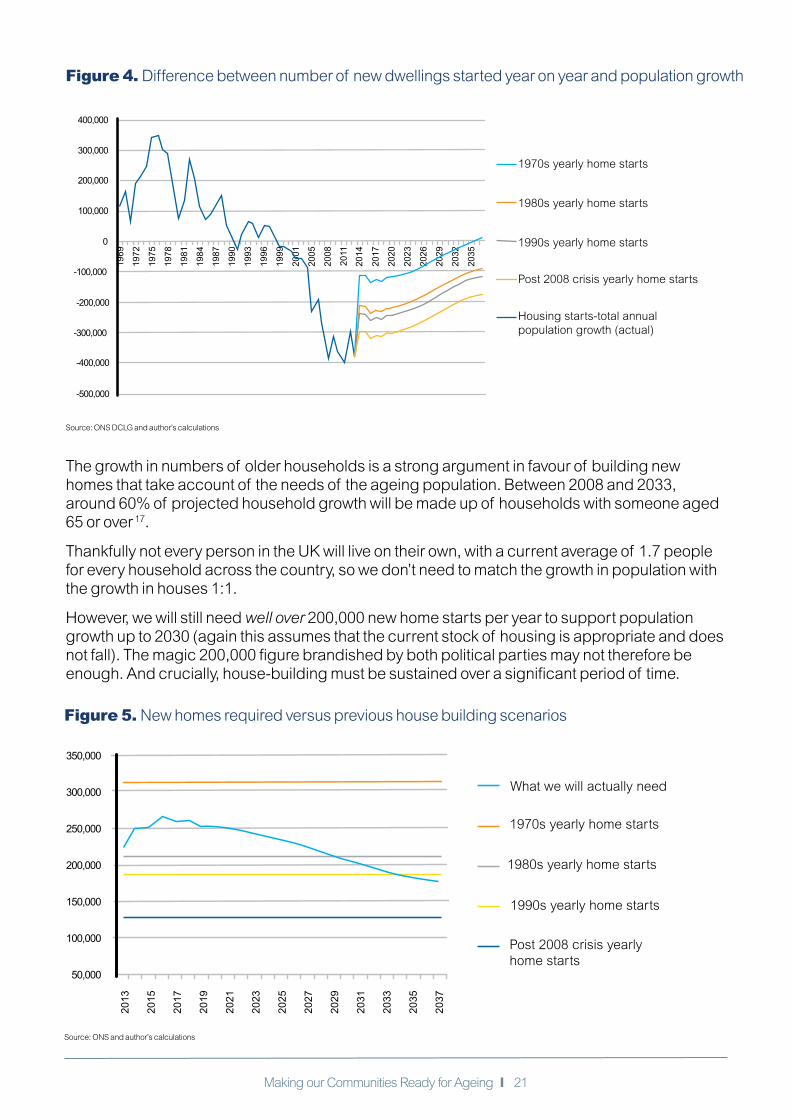
The growth in numbers of older households is a strong argument in favour of building new homes that take account of the needs of the ageing population. Between 2008 and 2033, around 60% of projected household growth will be made up of households with someone aged 65 or over 17.
Thankfully not every person in the UK will live on their own, with a current average of 1.7 people for every household across the country, so we don’t need to match the growth in population with the growth in houses 1:1.
However, we will still need well over 200,000 new home starts per year to support population growth up to 2030 (again this assumes that the current stock of housing is appropriate and does not fall). The magic 200,000 figure brandished by both political parties may not therefore be enough. And crucially, house-building must be sustained over a significant period of time.
Figure 4. Difference between number of new dwellings started year on year and population growth
300,000
400,000
350,000
50,000
150,000
100,000
200,000
250,000
Source: DCLG
0
1969
-70
1970
-71
1971
-72
1972
-73
1973
-74
1974
-75
1975
-76
1976
-77
1977
-78
1978
-79
1979
-80
1980
-81
1981
-82
1982
-83
1983
-84
1984
-85
1985
-86
1986
-87
1987
-88
1988
-89
1989
-90
1990
-91
1991
-92
1992
-93
1993
-94
1994
-95
1995
-96
1996
-97
1997
-98
1999
-00
2000
-01
2001
-02
2002
-03
2003
-04
2004
-05
2005
-06
2006
-07
2007
-08
2008
-09
2009
-10
2010
-11
2011
-12
2012
-13
1998
-99
Number of permanent dwellings stated in UK 1969-2013FIG1
Difference between number of new dwellings started and year on year population growth
FIG2
200,000
400,000
300,000
-500,000
-300,000
-400,000
-200,000
-100,000
100,000
Source: DCLG and author’s calculations
Source: ONS DCLG and author’s calculations
0
1969
1971
1973
1975
1977
1979
1981
1983
1985
1987
1989
1991
1993
1995
1997
1999
2001
2003
2005
2007
2009
2011
2013
Local Authorities
Housing association
Private enterprise
FIG3
300,000
400,000
350,000
50,000
150,000
100,000
200,000
250,000
0
1969
-70
1973
-74
1971
-72
1975
-76
1977
-78
1979
-80
1981
-82
1983
-84
1985
-86
1987
-88
1989
-90
1991
-92
1993
-94
1995
-96
1997
-98
1999
-00
2001
-02
2003
-04
2005
-06
2007
-08
2009
-10
Composition of dwelling started
200,000
400,000
300,000
-500,000
-300,000
-400,000
-200,000
-100,000
100,000
0
1969
2017
1972
1975
2020
1978
1981
1984
2023
1987
1990
2026
1993
2029
1996
1999
2001
2032
2005
2008
2035
2011
2014
FIG4 Difference between number of new dwellings started year on yearand population growth
FIG5 New homes required versus previous house building scenarios
FIG6 Average size of new homes
FIG7 Total council spend on 65+ care services and difference to the level implied by long-run trend
FIG 8 Housing our Ageing Population: Panel for Innovation
FIG 9 Mobility, accessibility and quality of later life
FIG 10 Length of car driver journeys 2011-12
FIG 11 Length of car driver journeys 2011-12
1970s yearly home starts
1980s yearly home starts
1990s yearly home starts
Housing starts-total annualpopulation growth (actual)
Post 2008 crisis yearly home starts
1980s yearly home starts
1990s yearly home starts
Post 2008 crisis yearly home starts
What we will actually need
1970s yearly home starts
50,000
100,000
150,000
200,000
250,000
300,000
350,000
2013
2015
2017
2019
2021
2023
2025
2031
2033
2035
2037
2029
2027
Source: ONS author’s calculations
Source: The RIBA (2011) based on work by Policy Exchange and Localis (2005)
UK 76m2
Japan (21% bigger) 92m2
Netherlands (53% bigger) 115.5m2
Denmark (80% bigger) 137m2
12
10
8
6
4
2
01994-
951995-
961996-
971997-
981998-
991999-2000
2000-01
2001-02
2002-03
2003-04
2004-05
2005-06
2006-07
2007-08
2008-09
2009-10
2010-11
2011-12
2012-13
Total expenditure Long term trend (based on average annual expenditure growth rate, 1994-2010)
27%
£bill
ion
Source: Census (2001),Elderly Accomodation Counsel, Community Care Statistics (2008), Housing LIN
General Needs Housing with pensioner housing in England 5,809,582
Specialist Housing 729,818
General Needs Housing in England 19,655,611
Residential Home in England 105,676
Nursing Home in England 58,304
Units of Sheltered Accomodation in England 476,000
Units of Very Sheltered Accommodation in England 23,000
Close Care in England 12,938
Units of Retirement Villages in England 8,466
Specialised/Dementia Care in England 6,293
Extra Care in England 39,141
Primary mobility needs
Secondary mobility needs
Tertiarymobility needs
0
2
4
6
8
10
12
21-2
9
30-3
9
40-4
9
50-5
4
55-5
9
60-6
4
75-7
9
80-8
4
85+
70-7
4
65-6
9
Age group
Leng
th o
f ca
r d
river
jour
neys
,mile
sJo
urne
ys p
er y
ear
Women
Men
Car passengerCar driver BusOther Walk
-
200
400
600
800
1,000
1,200
Men Women
40-4
9
50-5
4
55-5
9
60-6
4
75-7
9
80-8
4
85+
70-7
4
65-6
9
-
200
400
600
800
1,000
1,200
40-4
9
50-5
4
55-5
9
60-6
4
75-7
9
80-8
4
85+
70-7
4
65-6
9
500
1000
1500
2000
2500
3000
3500
4000
4500
01995/97 1998/00 2002 2005 2010 2011 2012
Mile
s dr
iven
/per
son/
year
GB
60-69
70++77%
All ages
FIG 12 Miles driven GB
10
0.02.04.06.08.0
10.012.014.016.018.020.0
20
30
40
50
60
70
80
90
1975
/7619
85/86
1989
/9119
92/94
1995
/9719
98/00 2002
2003
2004
2005
2006
2007
2008
2009
2010
2011
2012
female
+77%
male
FIG 13 % of GB licence holders over 70
FIG 14 Internet non-users % of all adults
2011Q1
2011Q2
2011Q3
2011Q4
2012Q1
2012Q2
2012Q3
2012Q4
2013Q1
2013Q2
2013Q3
2013Q4
Source: ONS DCLG and author’s calculations
Figure 5. New homes required versus previous house building scenarios
300,000
400,000
350,000
50,000
150,000
100,000
200,000
250,000
Source: DCLG
0
1969
-70
1970
-71
1971
-72
1972
-73
1973
-74
1974
-75
1975
-76
1976
-77
1977
-78
1978
-79
1979
-80
1980
-81
1981
-82
1982
-83
1983
-84
1984
-85
1985
-86
1986
-87
1987
-88
1988
-89
1989
-90
1990
-91
1991
-92
1992
-93
1993
-94
1994
-95
1995
-96
1996
-97
1997
-98
1999
-00
2000
-01
2001
-02
2002
-03
2003
-04
2004
-05
2005
-06
2006
-07
2007
-08
2008
-09
2009
-10
2010
-11
2011
-12
2012
-13
1998
-99
Number of permanent dwellings stated in UK 1969-2013FIG1
Difference between number of new dwellings started and year on year population growth
FIG2
200,000
400,000
300,000
-500,000
-300,000
-400,000
-200,000
-100,000
100,000
Source: DCLG and author’s calculations
Source: ONS DCLG and author’s calculations
0
1969
1971
1973
1975
1977
1979
1981
1983
1985
1987
1989
1991
1993
1995
1997
1999
2001
2003
2005
2007
2009
2011
2013
Local Authorities
Housing association
Private enterprise
FIG3
300,000
400,000
350,000
50,000
150,000
100,000
200,000
250,000
0
1969
-70
1973
-74
1971
-72
1975
-76
1977
-78
1979
-80
1981
-82
1983
-84
1985
-86
1987
-88
1989
-90
1991
-92
1993
-94
1995
-96
1997
-98
1999
-00
2001
-02
2003
-04
2005
-06
2007
-08
2009
-10
Composition of dwelling started
200,000
400,000
300,000
-500,000
-300,000
-400,000
-200,000
-100,000
100,000
0
1969
2017
1972
1975
2020
1978
1981
1984
2023
1987
1990
2026
1993
2029
1996
1999
2001
2032
2005
2008
2035
2011
2014
FIG4 Difference between number of new dwellings started year on yearand population growth
FIG5 New homes required versus previous house building scenarios
FIG6 Average size of new homes
FIG7 Total council spend on 65+ care services and difference to the level implied by long-run trend
FIG 8 Housing our Ageing Population: Panel for Innovation
FIG 9 Mobility, accessibility and quality of later life
FIG 10 Length of car driver journeys 2011-12
FIG 11 Length of car driver journeys 2011-12
1970s yearly home starts
1980s yearly home starts
1990s yearly home starts
Housing starts-total annualpopulation growth (actual)
Post 2008 crisis yearly home starts
1980s yearly home starts
1990s yearly home starts
Post 2008 crisis yearly home starts
What we will actually need
1970s yearly home starts
50,000
100,000
150,000
200,000
250,000
300,000
350,000
2013
2015
2017
2019
2021
2023
2025
2031
2033
2035
2037
2029
2027
Source: ONS author’s calculations
Source: The RIBA (2011) based on work by Policy Exchange and Localis (2005)
UK 76m2
Japan (21% bigger) 92m2
Netherlands (53% bigger) 115.5m2
Denmark (80% bigger) 137m2
12
10
8
6
4
2
01994-
951995-
961996-
971997-
981998-
991999-2000
2000-01
2001-02
2002-03
2003-04
2004-05
2005-06
2006-07
2007-08
2008-09
2009-10
2010-11
2011-12
2012-13
Total expenditure Long term trend (based on average annual expenditure growth rate, 1994-2010)
27%
£bill
ion
Source: Census (2001),Elderly Accomodation Counsel, Community Care Statistics (2008), Housing LIN
General Needs Housing with pensioner housing in England 5,809,582
Specialist Housing 729,818
General Needs Housing in England 19,655,611
Residential Home in England 105,676
Nursing Home in England 58,304
Units of Sheltered Accomodation in England 476,000
Units of Very Sheltered Accommodation in England 23,000
Close Care in England 12,938
Units of Retirement Villages in England 8,466
Specialised/Dementia Care in England 6,293
Extra Care in England 39,141
Primary mobility needs
Secondary mobility needs
Tertiarymobility needs
0
2
4
6
8
10
12
21-2
9
30-3
9
40-4
9
50-5
4
55-5
9
60-6
4
75-7
9
80-8
4
85+
70-7
4
65-6
9
Age group
Leng
th o
f ca
r d
river
jour
neys
,mile
sJo
urne
ys p
er y
ear
Women
Men
Car passengerCar driver BusOther Walk
-
200
400
600
800
1,000
1,200
Men Women
40-4
9
50-5
4
55-5
9
60-6
4
75-7
9
80-8
4
85+
70-7
4
65-6
9
-
200
400
600
800
1,000
1,200
40-4
9
50-5
4
55-5
9
60-6
4
75-7
9
80-8
4
85+
70-7
4
65-6
9
500
1000
1500
2000
2500
3000
3500
4000
4500
01995/97 1998/00 2002 2005 2010 2011 2012
Mile
s dr
iven
/per
son/
year
GB
60-69
70++77%
All ages
FIG 12 Miles driven GB
10
0.02.04.06.08.0
10.012.014.016.018.020.0
20
30
40
50
60
70
80
90
1975
/7619
85/86
1989
/9119
92/94
1995
/9719
98/00 2002
2003
2004
2005
2006
2007
2008
2009
2010
2011
2012
female
+77%
male
FIG 13 % of GB licence holders over 70
FIG 14 Internet non-users % of all adults
2011Q1
2011Q2
2011Q3
2011Q4
2012Q1
2012Q2
2012Q3
2012Q4
2013Q1
2013Q2
2013Q3
2013Q4
Source: ONS and author’s calculations

Making our Communities Ready for Ageing I 22
Our houses are not adapted for our ageing society
Recommendation• Central and local government must not leave the housing market to self-regulate
but should develop and implement policies to ensure that our future housing stock is appropriate for our ageing society.
• Government should explore whether they could fiscally incentivise expenditure on housing improvements and adaptations. A tax incentivised voucher scheme for housing adaptations may be one way of doing this.
Effective use of housing adaptations can support older people to remain functional in their homes and remain independent. Quantitative evidence has shown that adaptations in the home are the joint most important factor (alongside tenure type) in determining whether older people opt to remain living in their communities. Results from qualitative enquiry indicate that housing adaptations can contribute to an enhanced perception of security and belonging for older people. In consequence, housing adaptations defer older people from taking up residential care, which represents substantial savings to both individuals and the state.
• 1.4 million individuals have a medical condition or disability that means they need specially adapted accommodation – 22% consider their current home unsuitable18.
• By 2036, around 810,000 people aged 75+ will be living in unsuitable homes (based on current population projections) – 70% of these will be in owner-occupied properties19.
• Home modifications strengthened personal and social meaning of home for older people20.
• Home modifications lessened dependence in performing daily activities21.
• 89% of a Nottingham sample reported a ‘major impact’ on quality of life and 65% a ‘major impact’ on independence as a result of a major home adaption22.
One significant policy emphasised by the previous Government’s Lifetime Homes, Lifetime Neighbourhoods Strategy that remains in place today is the provision of the Disabled Facilities Grant (DFG). The DFG provides funding towards the cost of providing adaptations and facilities to enable the disabled person to continue to live in their home. However, whilst funding for DFG has grown, it has done so at the same time as the cessation of national Private Sector Housing funding to local housing authorities, the ending of the grant ring-fence and cuts to adult social care. As a consequence of these changes, local delivery of help with home adaptations is highly variable. Whilst systems for delivery of minor adaptations and equipment under £1000 are designed to be fast and straight forward through the non-means Community Equipment scheme, in the case of major adaptations where a DFG is involved systems are usually more complex. This is in part due to the DFG being a means tested grant for which assessment is needed. However, with the advent of much greater flexibility around use of DFG national funding, some local authorities have pioneered much improved systems for delivery of provision of home adaptations 23. There is a strong case for both maintaining the national funding for local provision of help with home adaptations alongside encouragement to health, housing & social care authorities to work together to ensure that they are delivering the home adaptations rapidly and efficiently, as well as enabling older people to prepare their homes themselves for later life through earlier adaptation.
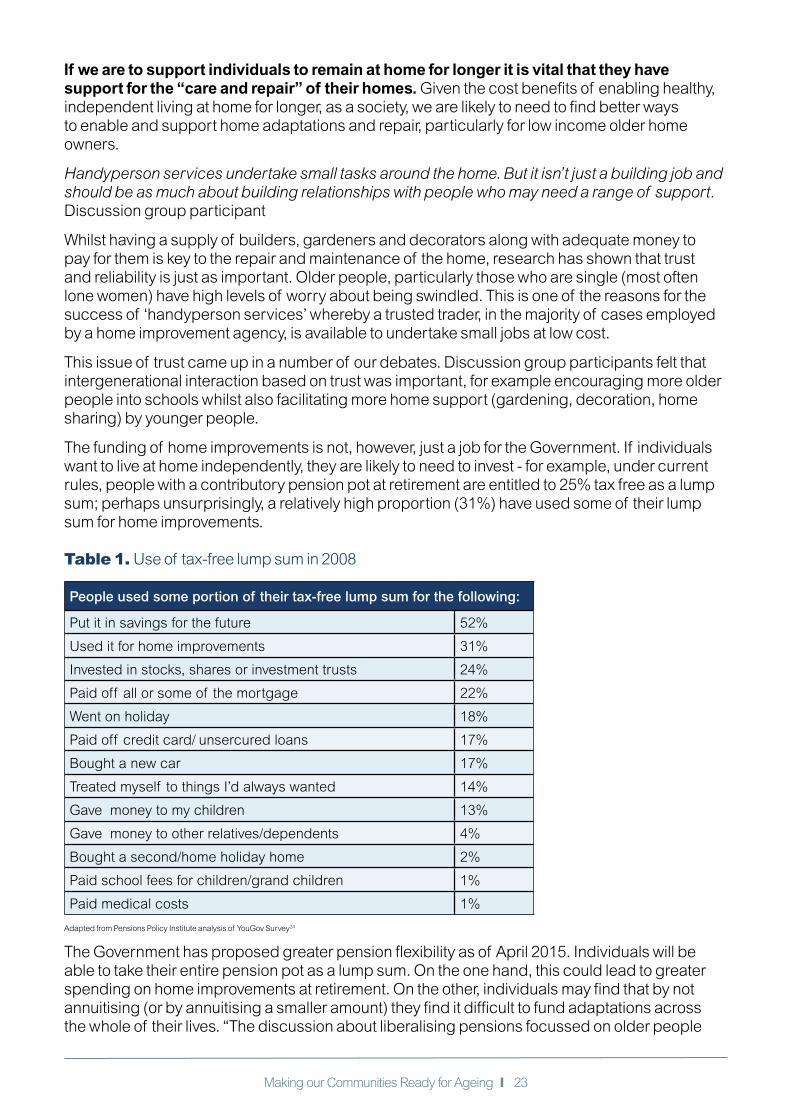
Making our Communities Ready for Ageing I 23
If we are to support individuals to remain at home for longer it is vital that they have support for the “care and repair” of their homes. Given the cost benefits of enabling healthy, independent living at home for longer, as a society, we are likely to need to find better ways to enable and support home adaptations and repair, particularly for low income older home owners.
Handyperson services undertake small tasks around the home. But it isn’t just a building job and should be as much about building relationships with people who may need a range of support. Discussion group participant
Whilst having a supply of builders, gardeners and decorators along with adequate money to pay for them is key to the repair and maintenance of the home, research has shown that trust and reliability is just as important. Older people, particularly those who are single (most often lone women) have high levels of worry about being swindled. This is one of the reasons for the success of ‘handyperson services’ whereby a trusted trader, in the majority of cases employed by a home improvement agency, is available to undertake small jobs at low cost.
This issue of trust came up in a number of our debates. Discussion group participants felt that intergenerational interaction based on trust was important, for example encouraging more older people into schools whilst also facilitating more home support (gardening, decoration, home sharing) by younger people.
The funding of home improvements is not, however, just a job for the Government. If individuals want to live at home independently, they are likely to need to invest - for example, under current rules, people with a contributory pension pot at retirement are entitled to 25% tax free as a lump sum; perhaps unsurprisingly, a relatively high proportion (31%) have used some of their lump sum for home improvements.
Table 1. Use of tax-free lump sum in 2008
Adapted from Pensions Policy Institute analysis of YouGov Survey24
The Government has proposed greater pension flexibility as of April 2015. Individuals will be able to take their entire pension pot as a lump sum. On the one hand, this could lead to greater spending on home improvements at retirement. On the other, individuals may find that by not annuitising (or by annuitising a smaller amount) they find it difficult to fund adaptations across the whole of their lives. “The discussion about liberalising pensions focussed on older people
People used some portion of their tax-free lump sum for the following:
Put it in savings for the future 52%
Used it for home improvements 31%
Invested in stocks, shares or investment trusts 24%
Paid off all or some of the mortgage 22%
Went on holiday 18%
Paid off credit card/ unsercured loans 17%
Bought a new car 17%
Treated myself to things I’d always wanted 14%
Gave money to my children 13%
Gave money to other relatives/dependents 4%
Bought a second/home holiday home 2%
Paid school fees for children/grand children 1%
Paid medical costs 1%

Making our Communities Ready for Ageing I 24
buying a Lamborghini with their pot rather than any debate on ‘Thora Hurd adaptations’ and accessible baths”. However, there are many ways that accessible design can be stylish and desirable. We need to mainstream ‘planning ahead’ in order to move accessible design into aspirational design.
Given the potential benefit to the UK housing stock and to the health and wellbeing of older people, Government should explore whether they could fiscally incentivise expenditure on housing improvements and adaptations. A tax incentivised voucher scheme for housing adaptations may be one way of doing this. In addition, the key role home improvement agencies play in helping to deliver adaptations should be recognised.
We do not make the most of new technology to help us stay in our homes independently for longer. But it is crucial that we move the debate beyond the microwave and telecare. Technology which automatically “turned things off” was popular amongst those studied by Professor Sheila Peace (see page 53). Whilst housing technology has developed, participants expressed concern that “disability equipment” still had a reputation for ugliness. If we are to convince people to adapt their homes, we must make the options desirable.
New technology has the potential to help us live independently for longer in our own homes. Linking our new smart meters with a touch screen device that can help control different aspects of the home could be of significant benefit.
Over the past 10 years, Government has focussed on the benefits of both telecare and telehealth in the home. Yet, whilst telecare is relatively widespread, in home telehealth is still developing. If we are to maximise the potential of telehealth and smart homes, we must ensure that we get the basics right. A precursor to technological advances will be ensuring thermal comfort and decent homes as well as installing basic adaptations.
“Telehealth (also referred to as telemedicine) covers the remote monitoring of physiological data, for example temperature and blood pressure, that can be used by health professionals for diagnosis or disease management.
Telecare uses a combination of alarms, sensors and other equipment, usually in the home environment, to help people live more independently by monitoring for changes and warning the people themselves or raising an alert at a control centre.”
I’ve been to the Grand Designs kitchen exhibition for the last couple of years. I’m told time and again that the market for kitchens is 18-60 year olds. The industry doesn’t recognise the market potential or the need to design inclusively” Discussion group participant.
A strong theme emerging from the research and our discussion groups related to the importance of design. Ensuring that more new homes meet the Lifetime Homes Standards is key to age proofing our housing stock. Interesting initiatives by RIBA and the Design Council highlight how designing for age is attracting increasing interest.
Government has recognised the role of housing design and functionality in promoting wellbeing, as evident in the 2008 national strategy for housing in an ageing society, Lifetime Homes, Lifetime Neighbourhoods. This strategy stated that, ‘good design works well for people of all ages, but for those with mobility problems or with sensory or cognitive impairments it can make the difference between independent living and social exclusion’26.
“You don’t notice that housing hasn’t a step. You don’t notice that the door is wider except when moving in the sofa. The building industry is focussed on the cost of standards rather than the long term benefits of building more appropriate properties. Builders are still building in imperial not metric and can’t get their minds beyond the 3 foot 6 door” Discussion group participant
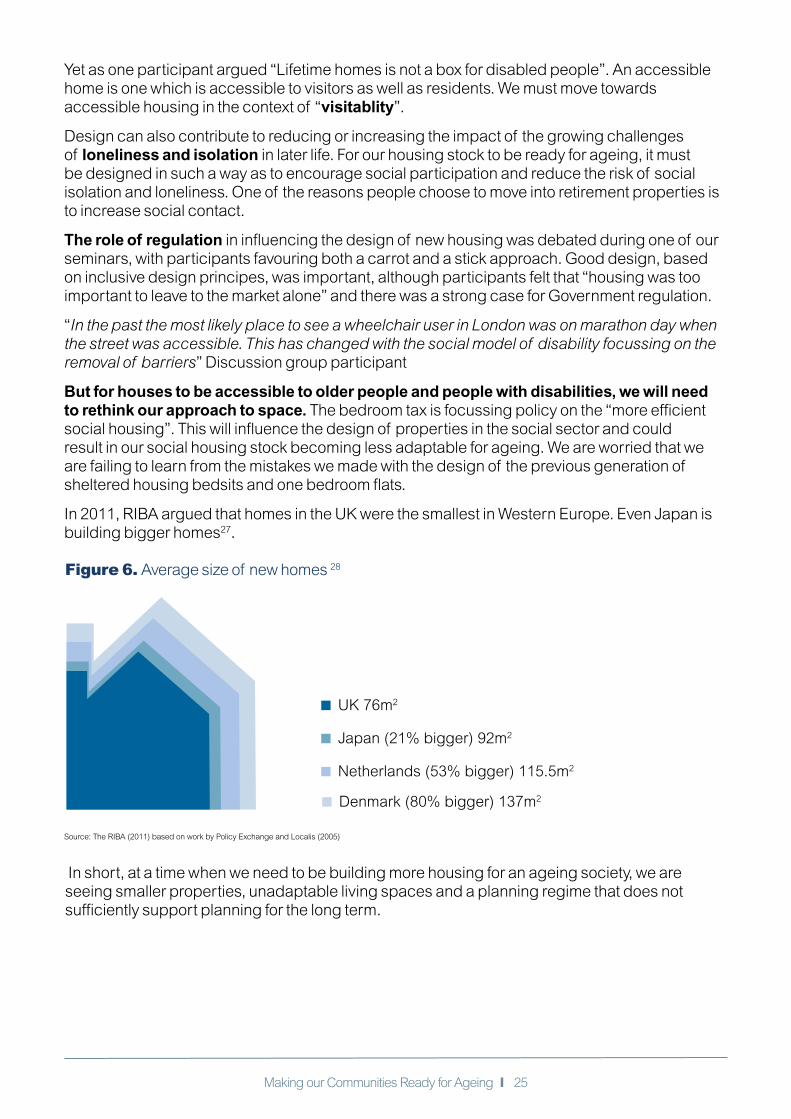
Making our Communities Ready for Ageing I 25
Yet as one participant argued “Lifetime homes is not a box for disabled people”. An accessible home is one which is accessible to visitors as well as residents. We must move towards accessible housing in the context of “visitablity”.
Design can also contribute to reducing or increasing the impact of the growing challenges of loneliness and isolation in later life. For our housing stock to be ready for ageing, it must be designed in such a way as to encourage social participation and reduce the risk of social isolation and loneliness. One of the reasons people choose to move into retirement properties is to increase social contact.
The role of regulation in influencing the design of new housing was debated during one of our seminars, with participants favouring both a carrot and a stick approach. Good design, based on inclusive design principes, was important, although participants felt that “housing was too important to leave to the market alone” and there was a strong case for Government regulation.
“In the past the most likely place to see a wheelchair user in London was on marathon day when the street was accessible. This has changed with the social model of disability focussing on the removal of barriers” Discussion group participant
But for houses to be accessible to older people and people with disabilities, we will need to rethink our approach to space. The bedroom tax is focussing policy on the “more efficient social housing”. This will influence the design of properties in the social sector and could result in our social housing stock becoming less adaptable for ageing. We are worried that we are failing to learn from the mistakes we made with the design of the previous generation of sheltered housing bedsits and one bedroom flats.
In 2011, RIBA argued that homes in the UK were the smallest in Western Europe. Even Japan is building bigger homes27.
Figure 6. Average size of new homes 28
300,000
400,000
350,000
50,000
150,000
100,000
200,000
250,000
Source: DCLG
0
1969
-70
1970
-71
1971
-72
1972
-73
1973
-74
1974
-75
1975
-76
1976
-77
1977
-78
1978
-79
1979
-80
1980
-81
1981
-82
1982
-83
1983
-84
1984
-85
1985
-86
1986
-87
1987
-88
1988
-89
1989
-90
1990
-91
1991
-92
1992
-93
1993
-94
1994
-95
1995
-96
1996
-97
1997
-98
1999
-00
2000
-01
2001
-02
2002
-03
2003
-04
2004
-05
2005
-06
2006
-07
2007
-08
2008
-09
2009
-10
2010
-11
2011
-12
2012
-13
1998
-99
Number of permanent dwellings stated in UK 1969-2013FIG1
Difference between number of new dwellings started and year on year population growth
FIG2
200,000
400,000
300,000
-500,000
-300,000
-400,000
-200,000
-100,000
100,000
Source: DCLG and author’s calculations
Source: ONS DCLG and author’s calculations
0
1969
1971
1973
1975
1977
1979
1981
1983
1985
1987
1989
1991
1993
1995
1997
1999
2001
2003
2005
2007
2009
2011
2013
Local Authorities
Housing association
Private enterprise
FIG3
300,000
400,000
350,000
50,000
150,000
100,000
200,000
250,000
0
1969
-70
1973
-74
1971
-72
1975
-76
1977
-78
1979
-80
1981
-82
1983
-84
1985
-86
1987
-88
1989
-90
1991
-92
1993
-94
1995
-96
1997
-98
1999
-00
2001
-02
2003
-04
2005
-06
2007
-08
2009
-10
Composition of dwelling started
200,000
400,000
300,000
-500,000
-300,000
-400,000
-200,000
-100,000
100,000
0
1969
2017
1972
1975
2020
1978
1981
1984
2023
1987
1990
2026
1993
2029
1996
1999
2001
2032
2005
2008
2035
2011
2014
FIG4 Difference between number of new dwellings started year on yearand population growth
FIG5 New homes required versus previous house building scenarios
FIG6 Average size of new homes
FIG7 Total council spend on 65+ care services and difference to the level implied by long-run trend
FIG 8 Housing our Ageing Population: Panel for Innovation
FIG 9 Mobility, accessibility and quality of later life
FIG 10 Length of car driver journeys 2011-12
FIG 11 Length of car driver journeys 2011-12
1970s yearly home starts
1980s yearly home starts
1990s yearly home starts
Housing starts-total annualpopulation growth (actual)
Post 2008 crisis yearly home starts
1980s yearly home starts
1990s yearly home starts
Post 2008 crisis yearly home starts
What we will actually need
1970s yearly home starts
50,000
100,000
150,000
200,000
250,000
300,000
350,000
2013
2015
2017
2019
2021
2023
2025
2031
2033
2035
2037
2029
2027
Source: ONS author’s calculations
Source: The RIBA (2011) based on work by Policy Exchange and Localis (2005)
UK 76m2
Japan (21% bigger) 92m2
Netherlands (53% bigger) 115.5m2
Denmark (80% bigger) 137m2
12
10
8
6
4
2
01994-
951995-
961996-
971997-
981998-
991999-2000
2000-01
2001-02
2002-03
2003-04
2004-05
2005-06
2006-07
2007-08
2008-09
2009-10
2010-11
2011-12
2012-13
Total expenditure Long term trend (based on average annual expenditure growth rate, 1994-2010)
27%
£bill
ion
Source: Census (2001),Elderly Accomodation Counsel, Community Care Statistics (2008), Housing LIN
General Needs Housing with pensioner housing in England 5,809,582
Specialist Housing 729,818
General Needs Housing in England 19,655,611
Residential Home in England 105,676
Nursing Home in England 58,304
Units of Sheltered Accomodation in England 476,000
Units of Very Sheltered Accommodation in England 23,000
Close Care in England 12,938
Units of Retirement Villages in England 8,466
Specialised/Dementia Care in England 6,293
Extra Care in England 39,141
Primary mobility needs
Secondary mobility needs
Tertiarymobility needs
0
2
4
6
8
10
12
21-2
9
30-3
9
40-4
9
50-5
4
55-5
9
60-6
4
75-7
9
80-8
4
85+
70-7
4
65-6
9
Age group
Leng
th o
f ca
r d
river
jour
neys
,mile
sJo
urne
ys p
er y
ear
Women
Men
Car passengerCar driver BusOther Walk
-
200
400
600
800
1,000
1,200
Men Women
40-4
9
50-5
4
55-5
9
60-6
4
75-7
9
80-8
4
85+
70-7
4
65-6
9
-
200
400
600
800
1,000
1,200
40-4
9
50-5
4
55-5
9
60-6
4
75-7
9
80-8
4
85+
70-7
4
65-6
9
500
1000
1500
2000
2500
3000
3500
4000
4500
01995/97 1998/00 2002 2005 2010 2011 2012
Mile
s dr
iven
/per
son/
year
GB
60-69
70++77%
All ages
FIG 12 Miles driven GB
10
0.02.04.06.08.0
10.012.014.016.018.020.0
20
30
40
50
60
70
80
90
1975
/7619
85/86
1989
/9119
92/94
1995
/9719
98/00 2002
2003
2004
2005
2006
2007
2008
2009
2010
2011
2012
female
+77%
male
FIG 13 % of GB licence holders over 70
FIG 14 Internet non-users % of all adults
2011Q1
2011Q2
2011Q3
2011Q4
2012Q1
2012Q2
2012Q3
2012Q4
2013Q1
2013Q2
2013Q3
2013Q4
Source: The RIBA (2011) based on work by Policy Exchange and Localis (2005)
300,000
400,000
350,000
50,000
150,000
100,000
200,000
250,000
Source: DCLG
0
1969
-70
1970
-71
1971
-72
1972
-73
1973
-74
1974
-75
1975
-76
1976
-77
1977
-78
1978
-79
1979
-80
1980
-81
1981
-82
1982
-83
1983
-84
1984
-85
1985
-86
1986
-87
1987
-88
1988
-89
1989
-90
1990
-91
1991
-92
1992
-93
1993
-94
1994
-95
1995
-96
1996
-97
1997
-98
1999
-00
2000
-01
2001
-02
2002
-03
2003
-04
2004
-05
2005
-06
2006
-07
2007
-08
2008
-09
2009
-10
2010
-11
2011
-12
2012
-13
1998
-99
Number of permanent dwellings stated in UK 1969-2013FIG1
Difference between number of new dwellings started and year on year population growth
FIG2
200,000
400,000
300,000
-500,000
-300,000
-400,000
-200,000
-100,000
100,000
Source: DCLG and author’s calculations
Source: ONS DCLG and author’s calculations
0
1969
1971
1973
1975
1977
1979
1981
1983
1985
1987
1989
1991
1993
1995
1997
1999
2001
2003
2005
2007
2009
2011
2013
Local Authorities
Housing association
Private enterprise
FIG3
300,000
400,000
350,000
50,000
150,000
100,000
200,000
250,000
0
1969
-70
1973
-74
1971
-72
1975
-76
1977
-78
1979
-80
1981
-82
1983
-84
1985
-86
1987
-88
1989
-90
1991
-92
1993
-94
1995
-96
1997
-98
1999
-00
2001
-02
2003
-04
2005
-06
2007
-08
2009
-10
Composition of dwelling started
200,000
400,000
300,000
-500,000
-300,000
-400,000
-200,000
-100,000
100,000
0
1969
2017
1972
1975
2020
1978
1981
1984
2023
1987
1990
2026
1993
2029
1996
1999
2001
2032
2005
2008
2035
2011
2014
FIG4 Difference between number of new dwellings started year on yearand population growth
FIG5 New homes required versus previous house building scenarios
FIG6 Average size of new homes
FIG7 Total council spend on 65+ care services and difference to the level implied by long-run trend
FIG 8 Housing our Ageing Population: Panel for Innovation
FIG 9 Mobility, accessibility and quality of later life
FIG 10 Length of car driver journeys 2011-12
FIG 11 Length of car driver journeys 2011-12
1970s yearly home starts
1980s yearly home starts
1990s yearly home starts
Housing starts-total annualpopulation growth (actual)
Post 2008 crisis yearly home starts
1980s yearly home starts
1990s yearly home starts
Post 2008 crisis yearly home starts
What we will actually need
1970s yearly home starts
50,000
100,000
150,000
200,000
250,000
300,000
350,000
2013
2015
2017
2019
2021
2023
2025
2031
2033
2035
2037
2029
2027
Source: ONS author’s calculations
Source: The RIBA (2011) based on work by Policy Exchange and Localis (2005)
UK 76m2
Japan (21% bigger) 92m2
Netherlands (53% bigger) 115.5m2
Denmark (80% bigger) 137m2
12
10
8
6
4
2
01994-
951995-
961996-
971997-
981998-
991999-2000
2000-01
2001-02
2002-03
2003-04
2004-05
2005-06
2006-07
2007-08
2008-09
2009-10
2010-11
2011-12
2012-13
Total expenditure Long term trend (based on average annual expenditure growth rate, 1994-2010)
27%
£bill
ion
Source: Census (2001),Elderly Accomodation Counsel, Community Care Statistics (2008), Housing LIN
General Needs Housing with pensioner housing in England 5,809,582
Specialist Housing 729,818
General Needs Housing in England 19,655,611
Residential Home in England 105,676
Nursing Home in England 58,304
Units of Sheltered Accomodation in England 476,000
Units of Very Sheltered Accommodation in England 23,000
Close Care in England 12,938
Units of Retirement Villages in England 8,466
Specialised/Dementia Care in England 6,293
Extra Care in England 39,141
Primary mobility needs
Secondary mobility needs
Tertiarymobility needs
0
2
4
6
8
10
12
21-2
9
30-3
9
40-4
9
50-5
4
55-5
9
60-6
4
75-7
9
80-8
4
85+
70-7
4
65-6
9
Age group
Leng
th o
f ca
r d
river
jour
neys
,mile
sJo
urne
ys p
er y
ear
Women
Men
Car passengerCar driver BusOther Walk
-
200
400
600
800
1,000
1,200
Men Women
40-4
9
50-5
4
55-5
9
60-6
4
75-7
9
80-8
4
85+
70-7
4
65-6
9
-
200
400
600
800
1,000
1,200
40-4
9
50-5
4
55-5
9
60-6
4
75-7
9
80-8
4
85+
70-7
4
65-6
9
500
1000
1500
2000
2500
3000
3500
4000
4500
01995/97 1998/00 2002 2005 2010 2011 2012
Mile
s dr
iven
/per
son/
year
GB
60-69
70++77%
All ages
FIG 12 Miles driven GB
10
0.02.04.06.08.0
10.012.014.016.018.020.0
20
30
40
50
60
70
80
90
1975
/7619
85/86
1989
/9119
92/94
1995
/9719
98/00 2002
2003
2004
2005
2006
2007
2008
2009
2010
2011
2012
female
+77%
male
FIG 13 % of GB licence holders over 70
FIG 14 Internet non-users % of all adults
2011Q1
2011Q2
2011Q3
2011Q4
2012Q1
2012Q2
2012Q3
2012Q4
2013Q1
2013Q2
2013Q3
2013Q4
In short, at a time when we need to be building more housing for an ageing society, we are seeing smaller properties, unadaptable living spaces and a planning regime that does not sufficiently support planning for the long term.

Making our Communities Ready for Ageing I 26
Our homes could better facilitate good health in old age
The empirical link between housing and health is well established and it is for older people that this association is most pronounced, with a number of longitudinal studies demonstrating a clear link between housing tenure and health (for example, see work from Dedman and colleagues29
and Marsh et al 30). Office for National Statistics figures estimated that 31,100 excess winter deaths occurred in England and Wales in 2012/2013, a 29% increase compared with the previous winter31. Research has also shown that 31.8% of households where the oldest person is over 75 live in non-decent homes 32 and there are 1 million vulnerable older people (75+) living in non-decent homes, mostly in the owner occupied sector.
Among negative physical health outcomes associated with poor quality housing are: arthritis and musculoskeletal conditions. Research has also shown that poor quality housing can take a toll on mental health in various ways, including through anxiety and sense of identity. Poor housing can also potentiate the pressures of fuel poverty, which results in many deaths among older people.
The Labour Government invested significant financial resource in improving the quality of the social housing stock. Yet the investment in “decent homes” did not reach some of the most vulnerable living in private rented accommodation, or indeed home owners.
“We’re now seeing the first wave of people who bought their council houses reaching retirement and they’ve missed out on all the improvements made to social housing since then – compared to their neighbours who didn’t buy their own homes, they’re much worse off.” Discussion group participant
Disappointingly, the Public Health Outcomes Framework does not specifically drive investment in housing to deliver health improvements for older people, despite housing factors being linked to a number of individual outcomes such as falls, and their associated health costs. Public health professionals must engage with housing and health across all tenures, and advocates must continue to make the case for the health benefits of investing in our homes.
If our homes are to enable good health later in life, they must be designed in such a way as to enable active ageing. Whilst the development of lifetime homes is key, we must also ensure that the design of our home facilitates and supports physical activity, a healthy lifestyle and social engagement rather than discouraging these things.

Making our Communities Ready for Ageing I 27
Homecare could better facilitate ageing in place
In an ageing society, it is vital that we join up planning for housing, health and social care. Total council spending on social care in support of older people rose steadily from 1994 to 2010 but it has since fallen by 6%. If the long term average annual growth rate in total council spending had been extended over the last three years, expenditure would be 27% higher than it is today33.
Many older people who want to stay at home into old age are likely to need some care and support. Whether their Local Authority pays for this support is a postcode lottery, with authorities having different criteria as to what level of need they fund. Currently, 85% of authorities only fund those deemed to have substantial or critical needs34. The consequence of this is that the vast majority of older people are forced to provide the funding themselves or seek the assistance of the third sector. In addition, if we are going to enable independence in the home, funders of care services need to change the way they commission such services to ensure that home carers receive the appropriate support. Better terms and conditions for home carers must go alongside a recognition of the important role they play in supporting people to live independently at home.
Policymakers must ensure that the way services are commissioned results in incentivising prevention and independence rather than supporting dependence. The home care market is commissioned on a “task and time” basis rather than on wider outcomes such as reducing hospital admissions, trips and falls. Many local authorities continue to commission in silo, limiting the potential for prevention of ill health and creating perverse incentives. For example, if a recipient of home care deteriorates and needs more care, the provider gets more money.
Figure 7. Total council spend on 65+care services by long-run trend
300,000
400,000
350,000
50,000
150,000
100,000
200,000
250,000
Source: DCLG
0
1969
-70
1970
-71
1971
-72
1972
-73
1973
-74
1974
-75
1975
-76
1976
-77
1977
-78
1978
-79
1979
-80
1980
-81
1981
-82
1982
-83
1983
-84
1984
-85
1985
-86
1986
-87
1987
-88
1988
-89
1989
-90
1990
-91
1991
-92
1992
-93
1993
-94
1994
-95
1995
-96
1996
-97
1997
-98
1999
-00
2000
-01
2001
-02
2002
-03
2003
-04
2004
-05
2005
-06
2006
-07
2007
-08
2008
-09
2009
-10
2010
-11
2011
-12
2012
-13
1998
-99
Number of permanent dwellings stated in UK 1969-2013FIG1
Difference between number of new dwellings started and year on year population growth
FIG2
200,000
400,000
300,000
-500,000
-300,000
-400,000
-200,000
-100,000
100,000
Source: DCLG and author’s calculations
Source: ONS DCLG and author’s calculations
0
1969
1971
1973
1975
1977
1979
1981
1983
1985
1987
1989
1991
1993
1995
1997
1999
2001
2003
2005
2007
2009
2011
2013
Local Authorities
Housing association
Private enterprise
FIG3
300,000
400,000
350,000
50,000
150,000
100,000
200,000
250,000
0
1969
-70
1973
-74
1971
-72
1975
-76
1977
-78
1979
-80
1981
-82
1983
-84
1985
-86
1987
-88
1989
-90
1991
-92
1993
-94
1995
-96
1997
-98
1999
-00
2001
-02
2003
-04
2005
-06
2007
-08
2009
-10
Composition of dwelling started
200,000
400,000
300,000
-500,000
-300,000
-400,000
-200,000
-100,000
100,000
0
1969
2017
1972
1975
2020
1978
1981
1984
2023
1987
1990
2026
1993
2029
1996
1999
2001
2032
2005
2008
2035
2011
2014
FIG4 Difference between number of new dwellings started year on yearand population growth
FIG5 New homes required versus previous house building scenarios
FIG6 Average size of new homes
FIG7 Total council spend on 65+ care services and difference to the level implied by long-run trend
FIG 8 Housing our Ageing Population: Panel for Innovation
FIG 9 Mobility, accessibility and quality of later life
FIG 10 Length of car driver journeys 2011-12
FIG 11 Length of car driver journeys 2011-12
1970s yearly home starts
1980s yearly home starts
1990s yearly home starts
Housing starts-total annualpopulation growth (actual)
Post 2008 crisis yearly home starts
1980s yearly home starts
1990s yearly home starts
Post 2008 crisis yearly home starts
What we will actually need
1970s yearly home starts
50,000
100,000
150,000
200,000
250,000
300,000
350,000
2013
2015
2017
2019
2021
2023
2025
2031
2033
2035
2037
2029
2027
Source: ONS author’s calculations
Source: The RIBA (2011) based on work by Policy Exchange and Localis (2005)
UK 76m2
Japan (21% bigger) 92m2
Netherlands (53% bigger) 115.5m2
Denmark (80% bigger) 137m2
12
10
8
6
4
2
01994-
951995-
961996-
971997-
981998-
991999-2000
2000-01
2001-02
2002-03
2003-04
2004-05
2005-06
2006-07
2007-08
2008-09
2009-10
2010-11
2011-12
2012-13
Total expenditure Long term trend (based on average annual expenditure growth rate, 1994-2010)
27%
£bill
ion
Source: Census (2001),Elderly Accomodation Counsel, Community Care Statistics (2008), Housing LIN
General Needs Housing with pensioner housing in England 5,809,582
Specialist Housing 729,818
General Needs Housing in England 19,655,611
Residential Home in England 105,676
Nursing Home in England 58,304
Units of Sheltered Accomodation in England 476,000
Units of Very Sheltered Accommodation in England 23,000
Close Care in England 12,938
Units of Retirement Villages in England 8,466
Specialised/Dementia Care in England 6,293
Extra Care in England 39,141
Primary mobility needs
Secondary mobility needs
Tertiarymobility needs
0
2
4
6
8
10
12
21-2
9
30-3
9
40-4
9
50-5
4
55-5
9
60-6
4
75-7
9
80-8
4
85+
70-7
4
65-6
9
Age group
Leng
th o
f ca
r d
river
jour
neys
,mile
sJo
urne
ys p
er y
ear
Women
Men
Car passengerCar driver BusOther Walk
-
200
400
600
800
1,000
1,200
Men Women
40-4
9
50-5
4
55-5
9
60-6
4
75-7
9
80-8
4
85+
70-7
4
65-6
9
-
200
400
600
800
1,000
1,200
40-4
9
50-5
4
55-5
9
60-6
4
75-7
9
80-8
4
85+
70-7
4
65-6
9
500
1000
1500
2000
2500
3000
3500
4000
4500
01995/97 1998/00 2002 2005 2010 2011 2012
Mile
s dr
iven
/per
son/
year
GB
60-69
70++77%
All ages
FIG 12 Miles driven GB
10
0.02.04.06.08.0
10.012.014.016.018.020.0
20
30
40
50
60
70
80
90
1975
/7619
85/86
1989
/9119
92/94
1995
/9719
98/00 2002
2003
2004
2005
2006
2007
2008
2009
2010
2011
2012
female
+77%
male
FIG 13 % of GB licence holders over 70
FIG 14 Internet non-users % of all adults
2011Q1
2011Q2
2011Q3
2011Q4
2012Q1
2012Q2
2012Q3
2012Q4
2013Q1
2013Q2
2013Q3
2013Q4
Source: The Health and Social Care Information Centre and Author’s calculations

Making our Communities Ready for Ageing I 28
Housing choices are limited for many older people
Recommendation• Some people will want to move into retirement housing. There is a need for greater choice
across the country, as well as across rural, suburban and urban settings – planning teams and developers should respond to the diversity of these demands.
• Estate agents should be trained to better understand the potential needs of the older consumer and could better promote the Lifetime Homes Standard or at least highlight some of the inclusive design features in mainstream homes.
Choice is limited by inequality within the older generation and by where you live. Housing equity is distributed very unevenly across the country and across social groups, for example 40% is found in London and the South East compared to 4% in the North East35. Some older people have both the resources and knowledge to make informed choices or live in an area with a range of alternative housing options, but for many the choice is limited.
“If you are at the bottom of the ladder you can’t downsize”. Discussion group participant
Specialist housing needs to focus on function and lifestyle rather than chronological age. For those with financial resources, an aspirational model of housing for old age is developing. This is much less true for those in social housing.
And whilst new housing models have developed over recent years, these are on a very small scale and there is limited research on, for example, the potential of home sharing and the role of intergenerational non-familial caring. A better understanding of the relationships in these settings could help us understand the untapped potential of these options.
Co-housing Co-housing units are intentional communities, in that they are formed by a group of individuals who wish to manage a shared community in which mutual support is at hand if needed. For older people, co-housing can represent a living arrangement to combat isolation and loneliness, through a supportive and neighbourly environment. Co-housing for older people is prevalent in Sweden, Denmark, the Netherlands and also Finland. A Finnish study found that a co-housing site engendered a very close social network and fostered a strong sense of community. Key to social interaction in the co-housing scheme was the communal space - well designed common areas stimulated social activities36.
Extra care housing ‘is a model that combines purpose-built and ergonomically designed housing for older people with onsite flexible care that adapts to residents’ changing needs’37, although there remains local variation in the extra care model. Extra care housing can be associated with a lower uptake of hospital beds, fewer falls, and substantially lower costs to the state in the long term.
Homeshare provides a simple way for people to help each other out. A householder may need help at home whilst a homesharer needs somewhere to live. In return for a room, the homesharer provides some support with day to day living (cleaning, cooking etc).
“It’s all about ‘location, location, location’” Discussion group participant
Extending the choices open to older people is vital. A greater provision of specialist and retirement housing is key to opening up these choices, but there are currently only just over half

Making our Communities Ready for Ageing I 29
a million units available in Britain. There is likely to be a gap between supply and demand given that just 7% of older households (530,000) live in specialist housing where a lease or tenancy restricts occupations to people over 55, 60 or 6538. If retirement housing is to play a growing role in delivering new housing options for older people, the product is likely to have to innovate, a fact highlighted in contributions to last year’s Hanover@50 debate39.
The figure below demonstrates the current portion of housing taken up by specialist housing for older people.
While pejorative terms such as ‘bedroom blockers’ are all too readily bandied about within the housing debate, housing wealth in the UK is concentrated to a degree within older people, as would be expected given that older people have spent their lifetime paying off their mortgage. Also, as the analysis by Searle has clearly demonstrated, this housing wealth is very unevenly distributed across location and social group.
When looking at tenure type by age of household reference person, the proportion of owner occupiers is highest among the 65-74 year old category, at 29.1%. There is evidence to suggest that older people are interested in downsizing (though often to smaller mainstream properties, not just to specialist housing). Polling of the over 60s at the ‘top of the housing ladder’ showed that more than half of the sample (57%) were interested in downsizing, a proportion that rose to 76% among people currently occupying three, four and five bedroom houses41.
Public policy debates on housing often emphasise a conflicting debate between ‘mainstream’ and ‘retirement housing’. One side frequently paints a picture of “who wants to live in retirement housing”, whilst the other highlights that “retirement housing is marvellous”. Differing perspectives on age segregation and age integration (the balance between communal, intergenerational living and individual living) can add to this conflict. Our participants emphasised the need for diversity in housing options arguing that there is “not one single solution”.
Figure 8. Housing our ageing population: panel for innovations (Adapted from the HAPPI report40)
300,000
400,000
350,000
50,000
150,000
100,000
200,000
250,000
Source: DCLG
0
1969
-70
1970
-71
1971
-72
1972
-73
1973
-74
1974
-75
1975
-76
1976
-77
1977
-78
1978
-79
1979
-80
1980
-81
1981
-82
1982
-83
1983
-84
1984
-85
1985
-86
1986
-87
1987
-88
1988
-89
1989
-90
1990
-91
1991
-92
1992
-93
1993
-94
1994
-95
1995
-96
1996
-97
1997
-98
1999
-00
2000
-01
2001
-02
2002
-03
2003
-04
2004
-05
2005
-06
2006
-07
2007
-08
2008
-09
2009
-10
2010
-11
2011
-12
2012
-13
1998
-99
Number of permanent dwellings stated in UK 1969-2013FIG1
Difference between number of new dwellings started and year on year population growth
FIG2
200,000
400,000
300,000
-500,000
-300,000
-400,000
-200,000
-100,000
100,000
Source: DCLG and author’s calculations
Source: ONS DCLG and author’s calculations
0
1969
1971
1973
1975
1977
1979
1981
1983
1985
1987
1989
1991
1993
1995
1997
1999
2001
2003
2005
2007
2009
2011
2013
Local Authorities
Housing association
Private enterprise
FIG3
300,000
400,000
350,000
50,000
150,000
100,000
200,000
250,000
0
1969
-70
1973
-74
1971
-72
1975
-76
1977
-78
1979
-80
1981
-82
1983
-84
1985
-86
1987
-88
1989
-90
1991
-92
1993
-94
1995
-96
1997
-98
1999
-00
2001
-02
2003
-04
2005
-06
2007
-08
2009
-10
Composition of dwelling started
200,000
400,000
300,000
-500,000
-300,000
-400,000
-200,000
-100,000
100,000
0
1969
2017
1972
1975
2020
1978
1981
1984
2023
1987
1990
2026
1993
2029
1996
1999
2001
2032
2005
2008
2035
2011
2014
FIG4 Difference between number of new dwellings started year on yearand population growth
FIG5 New homes required versus previous house building scenarios
FIG6 Average size of new homes
FIG7 Total council spend on 65+ care services and difference to the level implied by long-run trend
FIG 8 Housing our Ageing Population: Panel for Innovation
FIG 9 Mobility, accessibility and quality of later life
FIG 10 Length of car driver journeys 2011-12
FIG 11 Length of car driver journeys 2011-12
1970s yearly home starts
1980s yearly home starts
1990s yearly home starts
Housing starts-total annualpopulation growth (actual)
Post 2008 crisis yearly home starts
1980s yearly home starts
1990s yearly home starts
Post 2008 crisis yearly home starts
What we will actually need
1970s yearly home starts
50,000
100,000
150,000
200,000
250,000
300,000
350,000
2013
2015
2017
2019
2021
2023
2025
2031
2033
2035
2037
2029
2027
Source: ONS author’s calculations
Source: The RIBA (2011) based on work by Policy Exchange and Localis (2005)
UK 76m2
Japan (21% bigger) 92m2
Netherlands (53% bigger) 115.5m2
Denmark (80% bigger) 137m2
12
10
8
6
4
2
01994-
951995-
961996-
971997-
981998-
991999-2000
2000-01
2001-02
2002-03
2003-04
2004-05
2005-06
2006-07
2007-08
2008-09
2009-10
2010-11
2011-12
2012-13
Total expenditure Long term trend (based on average annual expenditure growth rate, 1994-2010)
27%
£bill
ion
Source: Census (2001),Elderly Accomodation Counsel, Community Care Statistics (2008), Housing LIN
General Needs Housing with pensioner housing in England 5,809,582
Specialist Housing 729,818
General Needs Housing in England 19,655,611
Residential Home in England 105,676
Nursing Home in England 58,304
Units of Sheltered Accomodation in England 476,000
Units of Very Sheltered Accommodation in England 23,000
Close Care in England 12,938
Units of Retirement Villages in England 8,466
Specialised/Dementia Care in England 6,293
Extra Care in England 39,141
Primary mobility needs
Secondary mobility needs
Tertiarymobility needs
0
2
4
6
8
10
12
21-2
9
30-3
9
40-4
9
50-5
4
55-5
9
60-6
4
75-7
9
80-8
4
85+
70-7
4
65-6
9
Age group
Leng
th o
f ca
r d
river
jour
neys
,mile
sJo
urne
ys p
er y
ear
Women
Men
Car passengerCar driver BusOther Walk
-
200
400
600
800
1,000
1,200
Men Women
40-4
9
50-5
4
55-5
9
60-6
4
75-7
9
80-8
4
85+
70-7
4
65-6
9
-
200
400
600
800
1,000
1,200
40-4
9
50-5
4
55-5
9
60-6
4
75-7
9
80-8
4
85+
70-7
4
65-6
9
500
1000
1500
2000
2500
3000
3500
4000
4500
01995/97 1998/00 2002 2005 2010 2011 2012
Mile
s dr
iven
/per
son/
year
GB
60-69
70++77%
All ages
FIG 12 Miles driven GB
10
0.02.04.06.08.0
10.012.014.016.018.020.0
20
30
40
50
60
70
80
90
1975
/7619
85/86
1989
/9119
92/94
1995
/9719
98/00 2002
2003
2004
2005
2006
2007
2008
2009
2010
2011
2012
female
+77%
male
FIG 13 % of GB licence holders over 70
FIG 14 Internet non-users % of all adults
2011Q1
2011Q2
2011Q3
2011Q4
2012Q1
2012Q2
2012Q3
2012Q4
2013Q1
2013Q2
2013Q3
2013Q4
Source: Census (2001),Elderly Accomodation Counsel, Community Care Statistics (2008), Housing LIN
300,000
400,000
350,000
50,000
150,000
100,000
200,000
250,000
Source: DCLG
0
1969
-70
1970
-71
1971
-72
1972
-73
1973
-74
1974
-75
1975
-76
1976
-77
1977
-78
1978
-79
1979
-80
1980
-81
1981
-82
1982
-83
1983
-84
1984
-85
1985
-86
1986
-87
1987
-88
1988
-89
1989
-90
1990
-91
1991
-92
1992
-93
1993
-94
1994
-95
1995
-96
1996
-97
1997
-98
1999
-00
2000
-01
2001
-02
2002
-03
2003
-04
2004
-05
2005
-06
2006
-07
2007
-08
2008
-09
2009
-10
2010
-11
2011
-12
2012
-13
1998
-99
Number of permanent dwellings stated in UK 1969-2013FIG1
Difference between number of new dwellings started and year on year population growth
FIG2
200,000
400,000
300,000
-500,000
-300,000
-400,000
-200,000
-100,000
100,000
Source: DCLG and author’s calculations
Source: ONS DCLG and author’s calculations
0
1969
1971
1973
1975
1977
1979
1981
1983
1985
1987
1989
1991
1993
1995
1997
1999
2001
2003
2005
2007
2009
2011
2013
Local Authorities
Housing association
Private enterprise
FIG3
300,000
400,000
350,000
50,000
150,000
100,000
200,000
250,000
0
1969
-70
1973
-74
1971
-72
1975
-76
1977
-78
1979
-80
1981
-82
1983
-84
1985
-86
1987
-88
1989
-90
1991
-92
1993
-94
1995
-96
1997
-98
1999
-00
2001
-02
2003
-04
2005
-06
2007
-08
2009
-10
Composition of dwelling started
200,000
400,000
300,000
-500,000
-300,000
-400,000
-200,000
-100,000
100,000
0
1969
2017
1972
1975
2020
1978
1981
1984
2023
1987
1990
2026
1993
2029
1996
1999
2001
2032
2005
2008
2035
2011
2014
FIG4 Difference between number of new dwellings started year on yearand population growth
FIG5 New homes required versus previous house building scenarios
FIG6 Average size of new homes
FIG7 Total council spend on 65+ care services and difference to the level implied by long-run trend
FIG 8 Housing our Ageing Population: Panel for Innovation
FIG 9 Mobility, accessibility and quality of later life
FIG 10 Length of car driver journeys 2011-12
FIG 11 Length of car driver journeys 2011-12
1970s yearly home starts
1980s yearly home starts
1990s yearly home starts
Housing starts-total annualpopulation growth (actual)
Post 2008 crisis yearly home starts
1980s yearly home starts
1990s yearly home starts
Post 2008 crisis yearly home starts
What we will actually need
1970s yearly home starts
50,000
100,000
150,000
200,000
250,000
300,000
350,000
2013
2015
2017
2019
2021
2023
2025
2031
2033
2035
2037
2029
2027
Source: ONS author’s calculations
Source: The RIBA (2011) based on work by Policy Exchange and Localis (2005)
UK 76m2
Japan (21% bigger) 92m2
Netherlands (53% bigger) 115.5m2
Denmark (80% bigger) 137m2
12
10
8
6
4
2
01994-
951995-
961996-
971997-
981998-
991999-2000
2000-01
2001-02
2002-03
2003-04
2004-05
2005-06
2006-07
2007-08
2008-09
2009-10
2010-11
2011-12
2012-13
Total expenditure Long term trend (based on average annual expenditure growth rate, 1994-2010)
27%
£bill
ion
Source: Census (2001),Elderly Accomodation Counsel, Community Care Statistics (2008), Housing LIN
General Needs Housing with pensioner housing in England 5,809,582
Specialist Housing 729,818
General Needs Housing in England 19,655,611
Residential Home in England 105,676
Nursing Home in England 58,304
Units of Sheltered Accomodation in England 476,000
Units of Very Sheltered Accommodation in England 23,000
Close Care in England 12,938
Units of Retirement Villages in England 8,466
Specialised/Dementia Care in England 6,293
Extra Care in England 39,141
Primary mobility needs
Secondary mobility needs
Tertiarymobility needs
0
2
4
6
8
10
12
21-2
9
30-3
9
40-4
9
50-5
4
55-5
9
60-6
4
75-7
9
80-8
4
85+
70-7
4
65-6
9
Age group
Leng
th o
f ca
r d
river
jour
neys
,mile
sJo
urne
ys p
er y
ear
Women
Men
Car passengerCar driver BusOther Walk
-
200
400
600
800
1,000
1,200
Men Women
40-4
9
50-5
4
55-5
9
60-6
4
75-7
9
80-8
4
85+
70-7
4
65-6
9
-
200
400
600
800
1,000
1,200
40-4
9
50-5
4
55-5
9
60-6
4
75-7
9
80-8
4
85+
70-7
4
65-6
9
500
1000
1500
2000
2500
3000
3500
4000
4500
01995/97 1998/00 2002 2005 2010 2011 2012
Mile
s dr
iven
/per
son/
year
GB
60-69
70++77%
All ages
FIG 12 Miles driven GB
10
0.02.04.06.08.0
10.012.014.016.018.020.0
20
30
40
50
60
70
80
90
1975
/7619
85/86
1989
/9119
92/94
1995
/9719
98/00 2002
2003
2004
2005
2006
2007
2008
2009
2010
2011
2012
female
+77%
male
FIG 13 % of GB licence holders over 70
FIG 14 Internet non-users % of all adults
2011Q1
2011Q2
2011Q3
2011Q4
2012Q1
2012Q2
2012Q3
2012Q4
2013Q1
2013Q2
2013Q3
2013Q4
300,000
400,000
350,000
50,000
150,000
100,000
200,000
250,000
Source: DCLG
0
1969
-70
1970
-71
1971
-72
1972
-73
1973
-74
1974
-75
1975
-76
1976
-77
1977
-78
1978
-79
1979
-80
1980
-81
1981
-82
1982
-83
1983
-84
1984
-85
1985
-86
1986
-87
1987
-88
1988
-89
1989
-90
1990
-91
1991
-92
1992
-93
1993
-94
1994
-95
1995
-96
1996
-97
1997
-98
1999
-00
2000
-01
2001
-02
2002
-03
2003
-04
2004
-05
2005
-06
2006
-07
2007
-08
2008
-09
2009
-10
2010
-11
2011
-12
2012
-13
1998
-99
Number of permanent dwellings stated in UK 1969-2013FIG1
Difference between number of new dwellings started and year on year population growth
FIG2
200,000
400,000
300,000
-500,000
-300,000
-400,000
-200,000
-100,000
100,000
Source: DCLG and author’s calculations
Source: ONS DCLG and author’s calculations
0
1969
1971
1973
1975
1977
1979
1981
1983
1985
1987
1989
1991
1993
1995
1997
1999
2001
2003
2005
2007
2009
2011
2013
Local Authorities
Housing association
Private enterprise
FIG3
300,000
400,000
350,000
50,000
150,000
100,000
200,000
250,000
0
1969
-70
1973
-74
1971
-72
1975
-76
1977
-78
1979
-80
1981
-82
1983
-84
1985
-86
1987
-88
1989
-90
1991
-92
1993
-94
1995
-96
1997
-98
1999
-00
2001
-02
2003
-04
2005
-06
2007
-08
2009
-10
Composition of dwelling started
200,000
400,000
300,000
-500,000
-300,000
-400,000
-200,000
-100,000
100,000
0
1969
2017
1972
1975
2020
1978
1981
1984
2023
1987
1990
2026
1993
2029
1996
1999
2001
2032
2005
2008
2035
2011
2014
FIG4 Difference between number of new dwellings started year on yearand population growth
FIG5 New homes required versus previous house building scenarios
FIG6 Average size of new homes
FIG7 Total council spend on 65+ care services and difference to the level implied by long-run trend
FIG 8 Housing our Ageing Population: Panel for Innovation
FIG 9 Mobility, accessibility and quality of later life
FIG 10 Length of car driver journeys 2011-12
FIG 11 Length of car driver journeys 2011-12
1970s yearly home starts
1980s yearly home starts
1990s yearly home starts
Housing starts-total annualpopulation growth (actual)
Post 2008 crisis yearly home starts
1980s yearly home starts
1990s yearly home starts
Post 2008 crisis yearly home starts
What we will actually need
1970s yearly home starts
50,000
100,000
150,000
200,000
250,000
300,000
350,000
2013
2015
2017
2019
2021
2023
2025
2031
2033
2035
2037
2029
2027
Source: ONS author’s calculations
Source: The RIBA (2011) based on work by Policy Exchange and Localis (2005)
UK 76m2
Japan (21% bigger) 92m2
Netherlands (53% bigger) 115.5m2
Denmark (80% bigger) 137m2
12
10
8
6
4
2
01994-
951995-
961996-
971997-
981998-
991999-2000
2000-01
2001-02
2002-03
2003-04
2004-05
2005-06
2006-07
2007-08
2008-09
2009-10
2010-11
2011-12
2012-13
Total expenditure Long term trend (based on average annual expenditure growth rate, 1994-2010)
27%
£bill
ion
Source: Census (2001),Elderly Accomodation Counsel, Community Care Statistics (2008), Housing LIN
General Needs Housing with pensioner housing in England 5,809,582
Specialist Housing 729,818
General Needs Housing in England 19,655,611
Residential Home in England 105,676
Nursing Home in England 58,304
Units of Sheltered Accomodation in England 476,000
Units of Very Sheltered Accommodation in England 23,000
Close Care in England 12,938
Units of Retirement Villages in England 8,466
Specialised/Dementia Care in England 6,293
Extra Care in England 39,141
Primary mobility needs
Secondary mobility needs
Tertiarymobility needs
0
2
4
6
8
10
12
21-2
9
30-3
9
40-4
9
50-5
4
55-5
9
60-6
4
75-7
9
80-8
4
85+
70-7
4
65-6
9
Age group
Leng
th o
f ca
r d
river
jour
neys
,mile
sJo
urne
ys p
er y
ear
Women
Men
Car passengerCar driver BusOther Walk
-
200
400
600
800
1,000
1,200
Men Women
40-4
9
50-5
4
55-5
9
60-6
4
75-7
9
80-8
4
85+
70-7
4
65-6
9
-
200
400
600
800
1,000
1,200
40-4
9
50-5
4
55-5
9
60-6
4
75-7
9
80-8
4
85+
70-7
4
65-6
9
500
1000
1500
2000
2500
3000
3500
4000
4500
01995/97 1998/00 2002 2005 2010 2011 2012
Mile
s dr
iven
/per
son/
year
GB
60-69
70++77%
All ages
FIG 12 Miles driven GB
10
0.02.04.06.08.0
10.012.014.016.018.020.0
20
30
40
50
60
70
80
90
1975
/7619
85/86
1989
/9119
92/94
1995
/9719
98/00 2002
2003
2004
2005
2006
2007
2008
2009
2010
2011
2012
female
+77%
male
FIG 13 % of GB licence holders over 70
FIG 14 Internet non-users % of all adults
2011Q1
2011Q2
2011Q3
2011Q4
2012Q1
2012Q2
2012Q3
2012Q4
2013Q1
2013Q2
2013Q3
2013Q4

Making our Communities Ready for Ageing I 30
A lack of quality information and advice contributes to poor decision making by many “Last time buyers”
Recommendation• Housing advice organisations should produce a “later life movers” guide and checklist
in-line with the ‘FirstStop Advice’ initiative which offers independent, impartial and free advice on housing options.
Last time buyers would benefit from guidance on things to consider when making a decision about their final housing move. Too few consider the impact of being forced to stop driving, the closure of local convenience stores or the need to be close to medical services. Good housing choices early in retirement can contribute to the prevention of future institutionalised housing and a better experience of ageing in the community.
Yet, for too many, major housing decisions are taken at a point of crisis. We also rarely consider or plan for our future housing needs and advice is accessed too late. Ageing is unpredictable.Taking control and being informed is therefore vital. And creating an informed engaged older consumer is vital if we are to ensure that the future housing market is ready for ageing.
But demand for housing, care, financial information and advice is likely to grow beyond the capacity of current provision, which in itself is inadequate in supply. Properly trained, we could better use estate agents to promote the benefits of alternative housing across the life course and rebrand later life housing features as a selling point.
Participants at our discussion group highlighted how the media and public policy focuses on first time buyers, but gives little thought to “Last time buyers”. There is a significant challenge of marketing to this group given individual denial of ageing but it is clear that this group deserves more attention – as “Later Life Movers”. As one participant pointed out: “City centre flats are far too often marketed by, and for, trendy young people. The image is of a latte drinking, salsa dancing, yuppie”. But these products could be fantastic for older people. Services are close, the buildings are accessible.”
We are facing a housing affordability crisis. The crisis is not just one for younger people. The recent changes to the mortgage market could make it more difficult for people of all ages to be able to access finance to support a move to a new home and there is a risk that mortgage companies place a high emphasis on age when making an assessment on the lifelong capacity of an individual to pay off a mortgage. It is important that the FCA monitor the new rules to ensure that people of all ages have access to finance which allows them to move into the home they want and need.
A public policy emphasis on the housing situation in London and the South East risks policy solutions that have unintended consequences. House prices outside of this area have not seen the same rises, and the huge demand for housing is heavily focussed on the South East. In addition, the current focus on under occupancy does not take into account the significant challenges facing some regions. We heard in the discussion groups that in parts of the country unlettable properties are being turned from 2/3 bedroom properties to much smaller and less adaptable homes.

Making our Communities Ready for Ageing I 31
Getting out and aboutRecommendation
• Measures of accessibility in research and evaluation of transport should include analysis of whole journeys including pavement quality, and the experience and timing of interchange between services.
Some people are fortunate enough to live in accessible well designed and adaptable homes that meet their needs. But even if homes are well suited to ageing, evidence suggests that navigating the space between the home and the community can cause problems for older people. Whether it be poor transport links, badly maintained pavements, or a fear of crime, physically getting from home to the community can be problematic.
• A quarter of people aged 80 and over do not have access to a car42.
• 67% of interviewees without car access said that they were experiencing some restriction on their participation in community activities, and over 25% reported that they were prevented from any form of involvement43.
Transport has a vital role to play in ensuring a smooth transition between the home and the broader community. The spaces and the services that we physically move through in our local areas can also have supplementary roles to play. Transport is often seen as a purely functional part of a community’s purpose rather than of intrinsic value. However, analysis of the mobility needs of older people have found that being mobile encompasses a range of needs above and beyond the requirement of getting from A to B. Musselwhite and Haddad’s analysis44 demonstrated three levels of need from mobility and transportation:
“A reduction in mobility can result in an increase in isolation, loneliness and depression and an overall poorer quality of life”45.
“342,000 over 75 year olds ‘feel trapped’ in their own homes through lack of suitable transport”46.
Tertiary mobility needs: Aesthetic needs, for example the need for the journey itself for relaxation, visit nature, use and test cognitive skills
Secondary mobility needs: Social/affective needs , for example the need for independence, control, to be seen as normal. Linked to status, roles, identity, self-esteem.
Primary mobility needs: Practical/utilitarian needs, for example getting from A to B as safely, reliably, cheaply and comfortably as possible
Figure 9. Mobility, accessibility and quality of later life
300,000
400,000
350,000
50,000
150,000
100,000
200,000
250,000
Source: DCLG
0
1969
-70
1970
-71
1971
-72
1972
-73
1973
-74
1974
-75
1975
-76
1976
-77
1977
-78
1978
-79
1979
-80
1980
-81
1981
-82
1982
-83
1983
-84
1984
-85
1985
-86
1986
-87
1987
-88
1988
-89
1989
-90
1990
-91
1991
-92
1992
-93
1993
-94
1994
-95
1995
-96
1996
-97
1997
-98
1999
-00
2000
-01
2001
-02
2002
-03
2003
-04
2004
-05
2005
-06
2006
-07
2007
-08
2008
-09
2009
-10
2010
-11
2011
-12
2012
-13
1998
-99
Number of permanent dwellings stated in UK 1969-2013FIG1
Difference between number of new dwellings started and year on year population growth
FIG2
200,000
400,000
300,000
-500,000
-300,000
-400,000
-200,000
-100,000
100,000
Source: DCLG and author’s calculations
Source: ONS DCLG and author’s calculations
0
1969
1971
1973
1975
1977
1979
1981
1983
1985
1987
1989
1991
1993
1995
1997
1999
2001
2003
2005
2007
2009
2011
2013
Local Authorities
Housing association
Private enterprise
FIG3
300,000
400,000
350,000
50,000
150,000
100,000
200,000
250,000
0
1969
-70
1973
-74
1971
-72
1975
-76
1977
-78
1979
-80
1981
-82
1983
-84
1985
-86
1987
-88
1989
-90
1991
-92
1993
-94
1995
-96
1997
-98
1999
-00
2001
-02
2003
-04
2005
-06
2007
-08
2009
-10
Composition of dwelling started
200,000
400,000
300,000
-500,000
-300,000
-400,000
-200,000
-100,000
100,000
0
1969
2017
1972
1975
2020
1978
1981
1984
2023
1987
1990
2026
1993
2029
1996
1999
2001
2032
2005
2008
2035
2011
2014
FIG4 Difference between number of new dwellings started year on yearand population growth
FIG5 New homes required versus previous house building scenarios
FIG6 Average size of new homes
FIG7 Total council spend on 65+ care services and difference to the level implied by long-run trend
FIG 8 Housing our Ageing Population: Panel for Innovation
FIG 9 Mobility, accessibility and quality of later life
FIG 10 Length of car driver journeys 2011-12
FIG 11 Length of car driver journeys 2011-12
1970s yearly home starts
1980s yearly home starts
1990s yearly home starts
Housing starts-total annualpopulation growth (actual)
Post 2008 crisis yearly home starts
1980s yearly home starts
1990s yearly home starts
Post 2008 crisis yearly home starts
What we will actually need
1970s yearly home starts
50,000
100,000
150,000
200,000
250,000
300,000
350,000
2013
2015
2017
2019
2021
2023
2025
2031
2033
2035
2037
2029
2027
Source: ONS author’s calculations
Source: The RIBA (2011) based on work by Policy Exchange and Localis (2005)
UK 76m2
Japan (21% bigger) 92m2
Netherlands (53% bigger) 115.5m2
Denmark (80% bigger) 137m2
12
10
8
6
4
2
01994-
951995-
961996-
971997-
981998-
991999-2000
2000-01
2001-02
2002-03
2003-04
2004-05
2005-06
2006-07
2007-08
2008-09
2009-10
2010-11
2011-12
2012-13
Total expenditure Long term trend (based on average annual expenditure growth rate, 1994-2010)
27%
£bill
ion
Source: Census (2001),Elderly Accomodation Counsel, Community Care Statistics (2008), Housing LIN
General Needs Housing with pensioner housing in England 5,809,582
Specialist Housing 729,818
General Needs Housing in England 19,655,611
Residential Home in England 105,676
Nursing Home in England 58,304
Units of Sheltered Accomodation in England 476,000
Units of Very Sheltered Accommodation in England 23,000
Close Care in England 12,938
Units of Retirement Villages in England 8,466
Specialised/Dementia Care in England 6,293
Extra Care in England 39,141
Primary mobility needs
Secondary mobility needs
Tertiarymobility needs
0
2
4
6
8
10
12
21-2
9
30-3
9
40-4
9
50-5
4
55-5
9
60-6
4
75-7
9
80-8
4
85+
70-7
4
65-6
9
Age group
Leng
th o
f ca
r d
river
jour
neys
,mile
sJo
urne
ys p
er y
ear
Women
Men
Car passengerCar driver BusOther Walk
-
200
400
600
800
1,000
1,200
Men Women
40-4
9
50-5
4
55-5
9
60-6
4
75-7
9
80-8
4
85+
70-7
4
65-6
9
-
200
400
600
800
1,000
1,200
40-4
9
50-5
4
55-5
9
60-6
4
75-7
9
80-8
4
85+
70-7
4
65-6
9
500
1000
1500
2000
2500
3000
3500
4000
4500
01995/97 1998/00 2002 2005 2010 2011 2012
Mile
s dr
iven
/per
son/
year
GB
60-69
70++77%
All ages
FIG 12 Miles driven GB
10
0.02.04.06.08.0
10.012.014.016.018.020.0
20
30
40
50
60
70
80
90
1975
/7619
85/86
1989
/9119
92/94
1995
/9719
98/00 2002
2003
2004
2005
2006
2007
2008
2009
2010
2011
2012
female
+77%
male
FIG 13 % of GB licence holders over 70
FIG 14 Internet non-users % of all adults
2011Q1
2011Q2
2011Q3
2011Q4
2012Q1
2012Q2
2012Q3
2012Q4
2013Q1
2013Q2
2013Q3
2013Q4

Making our Communities Ready for Ageing I 32
In many cases, improvements in a community’s transport aimed at the older population will also have benefits for all age groups. Additionally, transport plans for communities that are underpinned by responsible and sustainable planning - in terms of environmental impact and financial viability – will continue to benefit a wider group into the future.
Whilst ageing organisations have emphasised the importance of the car in later life, it is vital that society does more to free itself from car dependency. Many older people will move to a situation of not driving, or not having access to a car in their household in later life. Evidence suggests that those who prepare for this change by exploring alternatives in advance, and gradually switching to other forms of transport, will make a more successful transition47.This could help to avoid the more negative aspects of such a change, which can include poorer mental and physical health. A society which is less dependent on the car is likely to be better for both the young and the old as well as the environment.
On the road again
Recommendations: • Government should lead improvements in road infrastructure, including clearer signage
to benefit drivers of all ages.
• Local authorities and the voluntary sector should explore the development of car buddying and sharing schemes to support people who want to stop driving.
We are living in an increasingly hyper-mobile society, and, as access to services, shops, work and families becomes further dispersed, many people are reliant on their cars to remain connected. Yet, as we age, the distance we travel declines48.
Whilst we make fewer journeys of a shorter distance as we age, the average mileage travelled by older people has increased over the past 20 years, whilst it has fallen for all ages. 50
Figure 10. Lengths of car journeys 2011-12 49
300,000
400,000
350,000
50,000
150,000
100,000
200,000
250,000
Source: DCLG
0
1969
-70
1970
-71
1971
-72
1972
-73
1973
-74
1974
-75
1975
-76
1976
-77
1977
-78
1978
-79
1979
-80
1980
-81
1981
-82
1982
-83
1983
-84
1984
-85
1985
-86
1986
-87
1987
-88
1988
-89
1989
-90
1990
-91
1991
-92
1992
-93
1993
-94
1994
-95
1995
-96
1996
-97
1997
-98
1999
-00
2000
-01
2001
-02
2002
-03
2003
-04
2004
-05
2005
-06
2006
-07
2007
-08
2008
-09
2009
-10
2010
-11
2011
-12
2012
-13
1998
-99
Number of permanent dwellings stated in UK 1969-2013FIG1
Difference between number of new dwellings started and year on year population growth
FIG2
200,000
400,000
300,000
-500,000
-300,000
-400,000
-200,000
-100,000
100,000
Source: DCLG and author’s calculations
Source: ONS DCLG and author’s calculations
0
1969
1971
1973
1975
1977
1979
1981
1983
1985
1987
1989
1991
1993
1995
1997
1999
2001
2003
2005
2007
2009
2011
2013
Local Authorities
Housing association
Private enterprise
FIG3
300,000
400,000
350,000
50,000
150,000
100,000
200,000
250,000
0
1969
-70
1973
-74
1971
-72
1975
-76
1977
-78
1979
-80
1981
-82
1983
-84
1985
-86
1987
-88
1989
-90
1991
-92
1993
-94
1995
-96
1997
-98
1999
-00
2001
-02
2003
-04
2005
-06
2007
-08
2009
-10
Composition of dwelling started
200,000
400,000
300,000
-500,000
-300,000
-400,000
-200,000
-100,000
100,000
0
1969
2017
1972
1975
2020
1978
1981
1984
2023
1987
1990
2026
1993
2029
1996
1999
2001
2032
2005
2008
2035
2011
2014
FIG4 Difference between number of new dwellings started year on yearand population growth
FIG5 New homes required versus previous house building scenarios
FIG6 Average size of new homes
FIG7 Total council spend on 65+ care services and difference to the level implied by long-run trend
FIG 8 Housing our Ageing Population: Panel for Innovation
FIG 9 Mobility, accessibility and quality of later life
FIG 10 Length of car driver journeys 2011-12
FIG 11 Length of car driver journeys 2011-12
1970s yearly home starts
1980s yearly home starts
1990s yearly home starts
Housing starts-total annualpopulation growth (actual)
Post 2008 crisis yearly home starts
1980s yearly home starts
1990s yearly home starts
Post 2008 crisis yearly home starts
What we will actually need
1970s yearly home starts
50,000
100,000
150,000
200,000
250,000
300,000
350,000
2013
2015
2017
2019
2021
2023
2025
2031
2033
2035
2037
2029
2027
Source: ONS author’s calculations
Source: The RIBA (2011) based on work by Policy Exchange and Localis (2005)
UK 76m2
Japan (21% bigger) 92m2
Netherlands (53% bigger) 115.5m2
Denmark (80% bigger) 137m2
12
10
8
6
4
2
01994-
951995-
961996-
971997-
981998-
991999-2000
2000-01
2001-02
2002-03
2003-04
2004-05
2005-06
2006-07
2007-08
2008-09
2009-10
2010-11
2011-12
2012-13
Total expenditure Long term trend (based on average annual expenditure growth rate, 1994-2010)
27%
£bill
ion
Source: Census (2001),Elderly Accomodation Counsel, Community Care Statistics (2008), Housing LIN
General Needs Housing with pensioner housing in England 5,809,582
Specialist Housing 729,818
General Needs Housing in England 19,655,611
Residential Home in England 105,676
Nursing Home in England 58,304
Units of Sheltered Accomodation in England 476,000
Units of Very Sheltered Accommodation in England 23,000
Close Care in England 12,938
Units of Retirement Villages in England 8,466
Specialised/Dementia Care in England 6,293
Extra Care in England 39,141
Primary mobility needs
Secondary mobility needs
Tertiarymobility needs
0
2
4
6
8
10
12
21-2
9
30-3
9
40-4
9
50-5
4
55-5
9
60-6
4
75-7
9
80-8
4
85+
70-7
4
65-6
9
Age group
Leng
th o
f ca
r d
river
jour
neys
,mile
sJo
urne
ys p
er y
ear
Women
Men
Car passengerCar driver BusOther Walk
-
200
400
600
800
1,000
1,200
Men Women
40-4
9
50-5
4
55-5
9
60-6
4
75-7
9
80-8
4
85+
70-7
4
65-6
9
-
200
400
600
800
1,000
1,200
40-4
9
50-5
4
55-5
9
60-6
4
75-7
9
80-8
4
85+
70-7
4
65-6
9
500
1000
1500
2000
2500
3000
3500
4000
4500
01995/97 1998/00 2002 2005 2010 2011 2012
Mile
s dr
iven
/per
son/
year
GB
60-69
70++77%
All ages
FIG 12 Miles driven GB
10
0.02.04.06.08.0
10.012.014.016.018.020.0
20
30
40
50
60
70
80
90
1975
/7619
85/86
1989
/9119
92/94
1995
/9719
98/00 2002
2003
2004
2005
2006
2007
2008
2009
2010
2011
2012
female
+77%
male
FIG 13 % of GB licence holders over 70
FIG 14 Internet non-users % of all adults
2011Q1
2011Q2
2011Q3
2011Q4
2012Q1
2012Q2
2012Q3
2012Q4
2013Q1
2013Q2
2013Q3
2013Q4
Source: National Travel Survey 2012
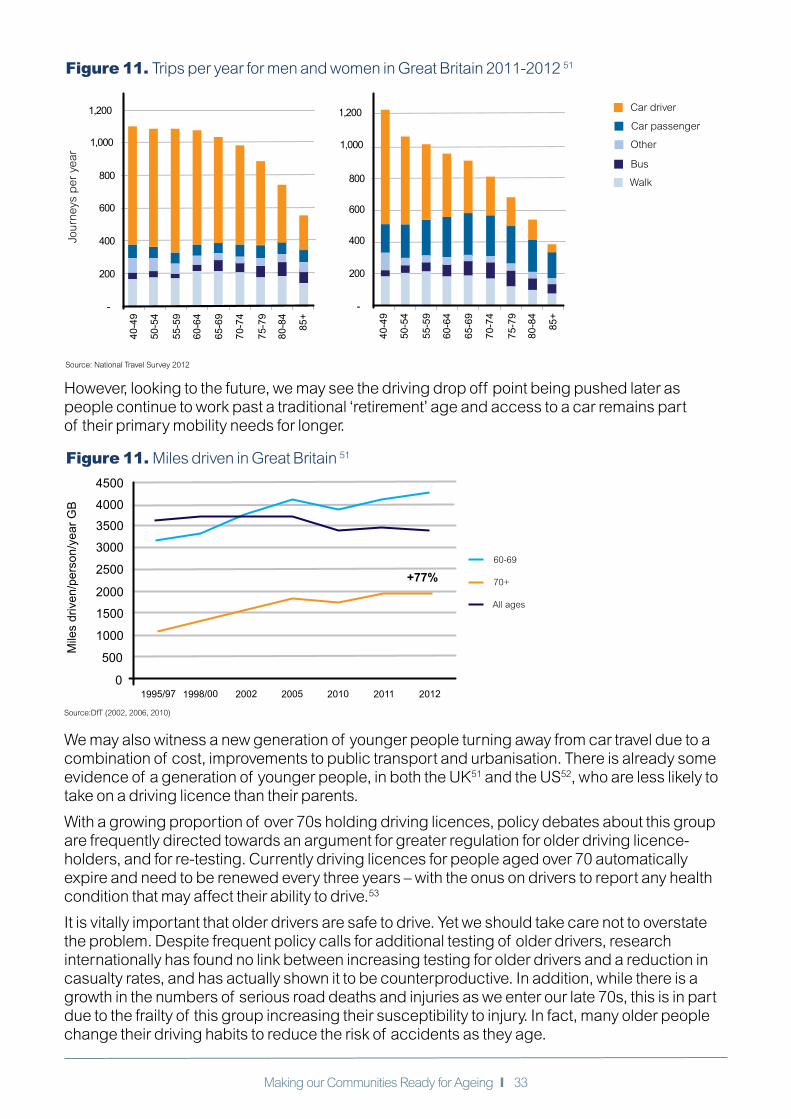
Making our Communities Ready for Ageing I 33
However, looking to the future, we may see the driving drop off point being pushed later as people continue to work past a traditional ‘retirement’ age and access to a car remains part of their primary mobility needs for longer.
Figure 11. Trips per year for men and women in Great Britain 2011-2012 51
300,000
400,000
350,000
50,000
150,000
100,000
200,000
250,000
Source: DCLG
0
1969
-70
1970
-71
1971
-72
1972
-73
1973
-74
1974
-75
1975
-76
1976
-77
1977
-78
1978
-79
1979
-80
1980
-81
1981
-82
1982
-83
1983
-84
1984
-85
1985
-86
1986
-87
1987
-88
1988
-89
1989
-90
1990
-91
1991
-92
1992
-93
1993
-94
1994
-95
1995
-96
1996
-97
1997
-98
1999
-00
2000
-01
2001
-02
2002
-03
2003
-04
2004
-05
2005
-06
2006
-07
2007
-08
2008
-09
2009
-10
2010
-11
2011
-12
2012
-13
1998
-99
Number of permanent dwellings stated in UK 1969-2013FIG1
Difference between number of new dwellings started and year on year population growth
FIG2
200,000
400,000
300,000
-500,000
-300,000
-400,000
-200,000
-100,000
100,000
Source: DCLG and author’s calculations
Source: ONS DCLG and author’s calculations
0
1969
1971
1973
1975
1977
1979
1981
1983
1985
1987
1989
1991
1993
1995
1997
1999
2001
2003
2005
2007
2009
2011
2013
Local Authorities
Housing association
Private enterprise
FIG3
300,000
400,000
350,000
50,000
150,000
100,000
200,000
250,000
0
1969
-70
1973
-74
1971
-72
1975
-76
1977
-78
1979
-80
1981
-82
1983
-84
1985
-86
1987
-88
1989
-90
1991
-92
1993
-94
1995
-96
1997
-98
1999
-00
2001
-02
2003
-04
2005
-06
2007
-08
2009
-10
Composition of dwelling started
200,000
400,000
300,000
-500,000
-300,000
-400,000
-200,000
-100,000
100,000
0
1969
2017
1972
1975
2020
1978
1981
1984
2023
1987
1990
2026
1993
2029
1996
1999
2001
2032
2005
2008
2035
2011
2014
FIG4 Difference between number of new dwellings started year on yearand population growth
FIG5 New homes required versus previous house building scenarios
FIG6 Average size of new homes
FIG7 Total council spend on 65+ care services and difference to the level implied by long-run trend
FIG 8 Housing our Ageing Population: Panel for Innovation
FIG 9 Mobility, accessibility and quality of later life
FIG 10 Length of car driver journeys 2011-12
FIG 11 Length of car driver journeys 2011-12
1970s yearly home starts
1980s yearly home starts
1990s yearly home starts
Housing starts-total annualpopulation growth (actual)
Post 2008 crisis yearly home starts
1980s yearly home starts
1990s yearly home starts
Post 2008 crisis yearly home starts
What we will actually need
1970s yearly home starts
50,000
100,000
150,000
200,000
250,000
300,000
350,000
2013
2015
2017
2019
2021
2023
2025
2031
2033
2035
2037
2029
2027
Source: ONS author’s calculations
Source: The RIBA (2011) based on work by Policy Exchange and Localis (2005)
UK 76m2
Japan (21% bigger) 92m2
Netherlands (53% bigger) 115.5m2
Denmark (80% bigger) 137m2
12
10
8
6
4
2
01994-
951995-
961996-
971997-
981998-
991999-2000
2000-01
2001-02
2002-03
2003-04
2004-05
2005-06
2006-07
2007-08
2008-09
2009-10
2010-11
2011-12
2012-13
Total expenditure Long term trend (based on average annual expenditure growth rate, 1994-2010)
27%
£bill
ion
Source: Census (2001),Elderly Accomodation Counsel, Community Care Statistics (2008), Housing LIN
General Needs Housing with pensioner housing in England 5,809,582
Specialist Housing 729,818
General Needs Housing in England 19,655,611
Residential Home in England 105,676
Nursing Home in England 58,304
Units of Sheltered Accomodation in England 476,000
Units of Very Sheltered Accommodation in England 23,000
Close Care in England 12,938
Units of Retirement Villages in England 8,466
Specialised/Dementia Care in England 6,293
Extra Care in England 39,141
Primary mobility needs
Secondary mobility needs
Tertiarymobility needs
0
2
4
6
8
10
12
21-2
9
30-3
9
40-4
9
50-5
4
55-5
9
60-6
4
75-7
9
80-8
4
85+
70-7
4
65-6
9
Age group
Leng
th o
f ca
r d
river
jour
neys
,mile
sJo
urne
ys p
er y
ear
Women
Men
Car passengerCar driver BusOther Walk
-
200
400
600
800
1,000
1,200
Men Women
40-4
9
50-5
4
55-5
9
60-6
4
75-7
9
80-8
4
85+
70-7
4
65-6
9
-
200
400
600
800
1,000
1,200
40-4
9
50-5
4
55-5
9
60-6
4
75-7
9
80-8
4
85+
70-7
4
65-6
9
500
1000
1500
2000
2500
3000
3500
4000
4500
01995/97 1998/00 2002 2005 2010 2011 2012
Mile
s dr
iven
/per
son/
year
GB
60-69
70++77%
All ages
FIG 12 Miles driven GB
10
0.02.04.06.08.0
10.012.014.016.018.020.0
20
30
40
50
60
70
80
90
1975
/7619
85/86
1989
/9119
92/94
1995
/9719
98/00 2002
2003
2004
2005
2006
2007
2008
2009
2010
2011
2012
female
+77%
male
FIG 13 % of GB licence holders over 70
FIG 14 Internet non-users % of all adults
2011Q1
2011Q2
2011Q3
2011Q4
2012Q1
2012Q2
2012Q3
2012Q4
2013Q1
2013Q2
2013Q3
2013Q4
300,000
400,000
350,000
50,000
150,000
100,000
200,000
250,000
Source: DCLG
0
1969
-70
1970
-71
1971
-72
1972
-73
1973
-74
1974
-75
1975
-76
1976
-77
1977
-78
1978
-79
1979
-80
1980
-81
1981
-82
1982
-83
1983
-84
1984
-85
1985
-86
1986
-87
1987
-88
1988
-89
1989
-90
1990
-91
1991
-92
1992
-93
1993
-94
1994
-95
1995
-96
1996
-97
1997
-98
1999
-00
2000
-01
2001
-02
2002
-03
2003
-04
2004
-05
2005
-06
2006
-07
2007
-08
2008
-09
2009
-10
2010
-11
2011
-12
2012
-13
1998
-99
Number of permanent dwellings stated in UK 1969-2013FIG1
Difference between number of new dwellings started and year on year population growth
FIG2
200,000
400,000
300,000
-500,000
-300,000
-400,000
-200,000
-100,000
100,000
Source: DCLG and author’s calculations
Source: ONS DCLG and author’s calculations
0
1969
1971
1973
1975
1977
1979
1981
1983
1985
1987
1989
1991
1993
1995
1997
1999
2001
2003
2005
2007
2009
2011
2013
Local Authorities
Housing association
Private enterprise
FIG3
300,000
400,000
350,000
50,000
150,000
100,000
200,000
250,000
0
1969
-70
1973
-74
1971
-72
1975
-76
1977
-78
1979
-80
1981
-82
1983
-84
1985
-86
1987
-88
1989
-90
1991
-92
1993
-94
1995
-96
1997
-98
1999
-00
2001
-02
2003
-04
2005
-06
2007
-08
2009
-10
Composition of dwelling started
200,000
400,000
300,000
-500,000
-300,000
-400,000
-200,000
-100,000
100,000
0
1969
2017
1972
1975
2020
1978
1981
1984
2023
1987
1990
2026
1993
2029
1996
1999
2001
2032
2005
2008
2035
2011
2014
FIG4 Difference between number of new dwellings started year on yearand population growth
FIG5 New homes required versus previous house building scenarios
FIG6 Average size of new homes
FIG7 Total council spend on 65+ care services and difference to the level implied by long-run trend
FIG 8 Housing our Ageing Population: Panel for Innovation
FIG 9 Mobility, accessibility and quality of later life
FIG 10 Length of car driver journeys 2011-12
FIG 11 Length of car driver journeys 2011-12
1970s yearly home starts
1980s yearly home starts
1990s yearly home starts
Housing starts-total annualpopulation growth (actual)
Post 2008 crisis yearly home starts
1980s yearly home starts
1990s yearly home starts
Post 2008 crisis yearly home starts
What we will actually need
1970s yearly home starts
50,000
100,000
150,000
200,000
250,000
300,000
350,000
2013
2015
2017
2019
2021
2023
2025
2031
2033
2035
2037
2029
2027
Source: ONS author’s calculations
Source: The RIBA (2011) based on work by Policy Exchange and Localis (2005)
UK 76m2
Japan (21% bigger) 92m2
Netherlands (53% bigger) 115.5m2
Denmark (80% bigger) 137m2
12
10
8
6
4
2
01994-
951995-
961996-
971997-
981998-
991999-2000
2000-01
2001-02
2002-03
2003-04
2004-05
2005-06
2006-07
2007-08
2008-09
2009-10
2010-11
2011-12
2012-13
Total expenditure Long term trend (based on average annual expenditure growth rate, 1994-2010)
27%
£bill
ion
Source: Census (2001),Elderly Accomodation Counsel, Community Care Statistics (2008), Housing LIN
General Needs Housing with pensioner housing in England 5,809,582
Specialist Housing 729,818
General Needs Housing in England 19,655,611
Residential Home in England 105,676
Nursing Home in England 58,304
Units of Sheltered Accomodation in England 476,000
Units of Very Sheltered Accommodation in England 23,000
Close Care in England 12,938
Units of Retirement Villages in England 8,466
Specialised/Dementia Care in England 6,293
Extra Care in England 39,141
Primary mobility needs
Secondary mobility needs
Tertiarymobility needs
0
2
4
6
8
10
12
21-2
9
30-3
9
40-4
9
50-5
4
55-5
9
60-6
4
75-7
9
80-8
4
85+
70-7
4
65-6
9
Age group
Leng
th o
f ca
r d
river
jour
neys
,mile
sJo
urne
ys p
er y
ear
Women
Men
Car passengerCar driver BusOther Walk
-
200
400
600
800
1,000
1,200
Men Women40
-49
50-5
4
55-5
9
60-6
4
75-7
9
80-8
4
85+
70-7
4
65-6
9
-
200
400
600
800
1,000
1,200
40-4
9
50-5
4
55-5
9
60-6
4
75-7
9
80-8
4
85+
70-7
4
65-6
9
500
1000
1500
2000
2500
3000
3500
4000
4500
01995/97 1998/00 2002 2005 2010 2011 2012
Mile
s dr
iven
/per
son/
year
GB
60-69
70++77%
All ages
FIG 12 Miles driven GB
10
0.02.04.06.08.0
10.012.014.016.018.020.0
20
30
40
50
60
70
80
90
1975
/7619
85/86
1989
/9119
92/94
1995
/9719
98/00 2002
2003
2004
2005
2006
2007
2008
2009
2010
2011
2012
female
+77%
male
FIG 13 % of GB licence holders over 70
FIG 14 Internet non-users % of all adults
2011Q1
2011Q2
2011Q3
2011Q4
2012Q1
2012Q2
2012Q3
2012Q4
2013Q1
2013Q2
2013Q3
2013Q4
300,000
400,000
350,000
50,000
150,000
100,000
200,000
250,000
Source: DCLG
0
1969
-70
1970
-71
1971
-72
1972
-73
1973
-74
1974
-75
1975
-76
1976
-77
1977
-78
1978
-79
1979
-80
1980
-81
1981
-82
1982
-83
1983
-84
1984
-85
1985
-86
1986
-87
1987
-88
1988
-89
1989
-90
1990
-91
1991
-92
1992
-93
1993
-94
1994
-95
1995
-96
1996
-97
1997
-98
1999
-00
2000
-01
2001
-02
2002
-03
2003
-04
2004
-05
2005
-06
2006
-07
2007
-08
2008
-09
2009
-10
2010
-11
2011
-12
2012
-13
1998
-99
Number of permanent dwellings stated in UK 1969-2013FIG1
Difference between number of new dwellings started and year on year population growth
FIG2
200,000
400,000
300,000
-500,000
-300,000
-400,000
-200,000
-100,000
100,000
Source: DCLG and author’s calculations
Source: ONS DCLG and author’s calculations
0
1969
1971
1973
1975
1977
1979
1981
1983
1985
1987
1989
1991
1993
1995
1997
1999
2001
2003
2005
2007
2009
2011
2013
Local Authorities
Housing association
Private enterprise
FIG3
300,000
400,000
350,000
50,000
150,000
100,000
200,000
250,000
0
1969
-70
1973
-74
1971
-72
1975
-76
1977
-78
1979
-80
1981
-82
1983
-84
1985
-86
1987
-88
1989
-90
1991
-92
1993
-94
1995
-96
1997
-98
1999
-00
2001
-02
2003
-04
2005
-06
2007
-08
2009
-10
Composition of dwelling started
200,000
400,000
300,000
-500,000
-300,000
-400,000
-200,000
-100,000
100,000
0
1969
2017
1972
1975
2020
1978
1981
1984
2023
1987
1990
2026
1993
2029
1996
1999
2001
2032
2005
2008
2035
2011
2014
FIG4 Difference between number of new dwellings started year on yearand population growth
FIG5 New homes required versus previous house building scenarios
FIG6 Average size of new homes
FIG7 Total council spend on 65+ care services and difference to the level implied by long-run trend
FIG 8 Housing our Ageing Population: Panel for Innovation
FIG 9 Mobility, accessibility and quality of later life
FIG 10 Length of car driver journeys 2011-12
FIG 11 Length of car driver journeys 2011-12
1970s yearly home starts
1980s yearly home starts
1990s yearly home starts
Housing starts-total annualpopulation growth (actual)
Post 2008 crisis yearly home starts
1980s yearly home starts
1990s yearly home starts
Post 2008 crisis yearly home starts
What we will actually need
1970s yearly home starts
50,000
100,000
150,000
200,000
250,000
300,000
350,000
2013
2015
2017
2019
2021
2023
2025
2031
2033
2035
2037
2029
2027
Source: ONS author’s calculations
Source: The RIBA (2011) based on work by Policy Exchange and Localis (2005)
UK 76m2
Japan (21% bigger) 92m2
Netherlands (53% bigger) 115.5m2
Denmark (80% bigger) 137m2
12
10
8
6
4
2
01994-
951995-
961996-
971997-
981998-
991999-2000
2000-01
2001-02
2002-03
2003-04
2004-05
2005-06
2006-07
2007-08
2008-09
2009-10
2010-11
2011-12
2012-13
Total expenditure Long term trend (based on average annual expenditure growth rate, 1994-2010)
27%
£bill
ion
Source: Census (2001),Elderly Accomodation Counsel, Community Care Statistics (2008), Housing LIN
General Needs Housing with pensioner housing in England 5,809,582
Specialist Housing 729,818
General Needs Housing in England 19,655,611
Residential Home in England 105,676
Nursing Home in England 58,304
Units of Sheltered Accomodation in England 476,000
Units of Very Sheltered Accommodation in England 23,000
Close Care in England 12,938
Units of Retirement Villages in England 8,466
Specialised/Dementia Care in England 6,293
Extra Care in England 39,141
Primary mobility needs
Secondary mobility needs
Tertiarymobility needs
0
2
4
6
8
10
12
21-2
9
30-3
9
40-4
9
50-5
4
55-5
9
60-6
4
75-7
9
80-8
4
85+
70-7
4
65-6
9
Age group
Leng
th o
f ca
r d
river
jour
neys
,mile
sJo
urne
ys p
er y
ear
Women
Men
Car passengerCar driver BusOther Walk
-
200
400
600
800
1,000
1,200
Men Women
40-4
9
50-5
4
55-5
9
60-6
4
75-7
9
80-8
4
85+
70-7
4
65-6
9
-
200
400
600
800
1,000
1,200
40-4
9
50-5
4
55-5
9
60-6
4
75-7
9
80-8
4
85+
70-7
4
65-6
9
500
1000
1500
2000
2500
3000
3500
4000
4500
01995/97 1998/00 2002 2005 2010 2011 2012
Mile
s dr
iven
/per
son/
year
GB
60-69
70++77%
All ages
FIG 12 Miles driven GB
10
0.02.04.06.08.0
10.012.014.016.018.020.0
20
30
40
50
60
70
80
90
1975
/7619
85/86
1989
/9119
92/94
1995
/9719
98/00 2002
2003
2004
2005
2006
2007
2008
2009
2010
2011
2012
female
+77%
male
FIG 13 % of GB licence holders over 70
FIG 14 Internet non-users % of all adults
2011Q1
2011Q2
2011Q3
2011Q4
2012Q1
2012Q2
2012Q3
2012Q4
2013Q1
2013Q2
2013Q3
2013Q4
300,000
400,000
350,000
50,000
150,000
100,000
200,000
250,000
Source: DCLG
0
1969
-70
1970
-71
1971
-72
1972
-73
1973
-74
1974
-75
1975
-76
1976
-77
1977
-78
1978
-79
1979
-80
1980
-81
1981
-82
1982
-83
1983
-84
1984
-85
1985
-86
1986
-87
1987
-88
1988
-89
1989
-90
1990
-91
1991
-92
1992
-93
1993
-94
1994
-95
1995
-96
1996
-97
1997
-98
1999
-00
2000
-01
2001
-02
2002
-03
2003
-04
2004
-05
2005
-06
2006
-07
2007
-08
2008
-09
2009
-10
2010
-11
2011
-12
2012
-13
1998
-99
Number of permanent dwellings stated in UK 1969-2013FIG1
Difference between number of new dwellings started and year on year population growth
FIG2
200,000
400,000
300,000
-500,000
-300,000
-400,000
-200,000
-100,000
100,000
Source: DCLG and author’s calculations
Source: ONS DCLG and author’s calculations
0
1969
1971
1973
1975
1977
1979
1981
1983
1985
1987
1989
1991
1993
1995
1997
1999
2001
2003
2005
2007
2009
2011
2013
Local Authorities
Housing association
Private enterprise
FIG3
300,000
400,000
350,000
50,000
150,000
100,000
200,000
250,000
0
1969
-70
1973
-74
1971
-72
1975
-76
1977
-78
1979
-80
1981
-82
1983
-84
1985
-86
1987
-88
1989
-90
1991
-92
1993
-94
1995
-96
1997
-98
1999
-00
2001
-02
2003
-04
2005
-06
2007
-08
2009
-10
Composition of dwelling started
200,000
400,000
300,000
-500,000
-300,000
-400,000
-200,000
-100,000
100,000
0
1969
2017
1972
1975
2020
1978
1981
1984
2023
1987
1990
2026
1993
2029
1996
1999
2001
2032
2005
2008
2035
2011
2014
FIG4 Difference between number of new dwellings started year on yearand population growth
FIG5 New homes required versus previous house building scenarios
FIG6 Average size of new homes
FIG7 Total council spend on 65+ care services and difference to the level implied by long-run trend
FIG 8 Housing our Ageing Population: Panel for Innovation
FIG 9 Mobility, accessibility and quality of later life
FIG 10 Length of car driver journeys 2011-12
FIG 11 Length of car driver journeys 2011-12
1970s yearly home starts
1980s yearly home starts
1990s yearly home starts
Housing starts-total annualpopulation growth (actual)
Post 2008 crisis yearly home starts
1980s yearly home starts
1990s yearly home starts
Post 2008 crisis yearly home starts
What we will actually need
1970s yearly home starts
50,000
100,000
150,000
200,000
250,000
300,000
350,000
2013
2015
2017
2019
2021
2023
2025
2031
2033
2035
2037
2029
2027
Source: ONS author’s calculations
Source: The RIBA (2011) based on work by Policy Exchange and Localis (2005)
UK 76m2
Japan (21% bigger) 92m2
Netherlands (53% bigger) 115.5m2
Denmark (80% bigger) 137m2
12
10
8
6
4
2
01994-
951995-
961996-
971997-
981998-
991999-2000
2000-01
2001-02
2002-03
2003-04
2004-05
2005-06
2006-07
2007-08
2008-09
2009-10
2010-11
2011-12
2012-13
Total expenditure Long term trend (based on average annual expenditure growth rate, 1994-2010)
27%
£bill
ion
Source: Census (2001),Elderly Accomodation Counsel, Community Care Statistics (2008), Housing LIN
General Needs Housing with pensioner housing in England 5,809,582
Specialist Housing 729,818
General Needs Housing in England 19,655,611
Residential Home in England 105,676
Nursing Home in England 58,304
Units of Sheltered Accomodation in England 476,000
Units of Very Sheltered Accommodation in England 23,000
Close Care in England 12,938
Units of Retirement Villages in England 8,466
Specialised/Dementia Care in England 6,293
Extra Care in England 39,141
Primary mobility needs
Secondary mobility needs
Tertiarymobility needs
0
2
4
6
8
10
12
21-2
9
30-3
9
40-4
9
50-5
4
55-5
9
60-6
4
75-7
9
80-8
4
85+
70-7
4
65-6
9
Age group
Leng
th o
f ca
r d
river
jour
neys
,mile
sJo
urne
ys p
er y
ear
Women
Men
Car passengerCar driver BusOther Walk
-
200
400
600
800
1,000
1,200
Men Women
40-4
9
50-5
4
55-5
9
60-6
4
75-7
9
80-8
4
85+
70-7
4
65-6
9
-
200
400
600
800
1,000
1,200
40-4
9
50-5
4
55-5
9
60-6
4
75-7
9
80-8
4
85+
70-7
4
65-6
9
500
1000
1500
2000
2500
3000
3500
4000
4500
01995/97 1998/00 2002 2005 2010 2011 2012
Mile
s dr
iven
/per
son/
year
GB
60-69
70++77%
All ages
FIG 12 Miles driven GB
10
0.02.04.06.08.0
10.012.014.016.018.020.0
20
30
40
50
60
70
80
90
1975
/7619
85/86
1989
/9119
92/94
1995
/9719
98/00 2002
2003
2004
2005
2006
2007
2008
2009
2010
2011
2012
female
+77%
male
FIG 13 % of GB licence holders over 70
FIG 14 Internet non-users % of all adults
2011Q1
2011Q2
2011Q3
2011Q4
2012Q1
2012Q2
2012Q3
2012Q4
2013Q1
2013Q2
2013Q3
2013Q4
Source: National Travel Survey 2012
Figure 11. Miles driven in Great Britain 51
300,000
400,000
350,000
50,000
150,000
100,000
200,000
250,000
Source: DCLG
0
1969
-70
1970
-71
1971
-72
1972
-73
1973
-74
1974
-75
1975
-76
1976
-77
1977
-78
1978
-79
1979
-80
1980
-81
1981
-82
1982
-83
1983
-84
1984
-85
1985
-86
1986
-87
1987
-88
1988
-89
1989
-90
1990
-91
1991
-92
1992
-93
1993
-94
1994
-95
1995
-96
1996
-97
1997
-98
1999
-00
2000
-01
2001
-02
2002
-03
2003
-04
2004
-05
2005
-06
2006
-07
2007
-08
2008
-09
2009
-10
2010
-11
2011
-12
2012
-13
1998
-99
Number of permanent dwellings stated in UK 1969-2013FIG1
Difference between number of new dwellings started and year on year population growth
FIG2
200,000
400,000
300,000
-500,000
-300,000
-400,000
-200,000
-100,000
100,000
Source: DCLG and author’s calculations
Source: ONS DCLG and author’s calculations
0
1969
1971
1973
1975
1977
1979
1981
1983
1985
1987
1989
1991
1993
1995
1997
1999
2001
2003
2005
2007
2009
2011
2013
Local Authorities
Housing association
Private enterprise
FIG3
300,000
400,000
350,000
50,000
150,000
100,000
200,000
250,000
0
1969
-70
1973
-74
1971
-72
1975
-76
1977
-78
1979
-80
1981
-82
1983
-84
1985
-86
1987
-88
1989
-90
1991
-92
1993
-94
1995
-96
1997
-98
1999
-00
2001
-02
2003
-04
2005
-06
2007
-08
2009
-10
Composition of dwelling started
200,000
400,000
300,000
-500,000
-300,000
-400,000
-200,000
-100,000
100,000
0
1969
2017
1972
1975
2020
1978
1981
1984
2023
1987
1990
2026
1993
2029
1996
1999
2001
2032
2005
2008
2035
2011
2014
FIG4 Difference between number of new dwellings started year on yearand population growth
FIG5 New homes required versus previous house building scenarios
FIG6 Average size of new homes
FIG7 Total council spend on 65+ care services and difference to the level implied by long-run trend
FIG 8 Housing our Ageing Population: Panel for Innovation
FIG 9 Mobility, accessibility and quality of later life
FIG 10 Length of car driver journeys 2011-12
FIG 11 Length of car driver journeys 2011-12
1970s yearly home starts
1980s yearly home starts
1990s yearly home starts
Housing starts-total annualpopulation growth (actual)
Post 2008 crisis yearly home starts
1980s yearly home starts
1990s yearly home starts
Post 2008 crisis yearly home starts
What we will actually need
1970s yearly home starts
50,000
100,000
150,000
200,000
250,000
300,000
350,000
2013
2015
2017
2019
2021
2023
2025
2031
2033
2035
2037
2029
2027
Source: ONS author’s calculations
Source: The RIBA (2011) based on work by Policy Exchange and Localis (2005)
UK 76m2
Japan (21% bigger) 92m2
Netherlands (53% bigger) 115.5m2
Denmark (80% bigger) 137m2
12
10
8
6
4
2
01994-
951995-
961996-
971997-
981998-
991999-2000
2000-01
2001-02
2002-03
2003-04
2004-05
2005-06
2006-07
2007-08
2008-09
2009-10
2010-11
2011-12
2012-13
Total expenditure Long term trend (based on average annual expenditure growth rate, 1994-2010)
27%
£bill
ion
Source: Census (2001),Elderly Accomodation Counsel, Community Care Statistics (2008), Housing LIN
General Needs Housing with pensioner housing in England 5,809,582
Specialist Housing 729,818
General Needs Housing in England 19,655,611
Residential Home in England 105,676
Nursing Home in England 58,304
Units of Sheltered Accomodation in England 476,000
Units of Very Sheltered Accommodation in England 23,000
Close Care in England 12,938
Units of Retirement Villages in England 8,466
Specialised/Dementia Care in England 6,293
Extra Care in England 39,141
Primary mobility needs
Secondary mobility needs
Tertiarymobility needs
0
2
4
6
8
10
12
21-2
9
30-3
9
40-4
9
50-5
4
55-5
9
60-6
4
75-7
9
80-8
4
85+
70-7
4
65-6
9
Age group
Leng
th o
f ca
r d
river
jour
neys
,mile
sJo
urne
ys p
er y
ear
Women
Men
Car passengerCar driver BusOther Walk
-
200
400
600
800
1,000
1,200
Men Women
40-4
9
50-5
4
55-5
9
60-6
4
75-7
9
80-8
4
85+
70-7
4
65-6
9
-
200
400
600
800
1,000
1,200
40-4
9
50-5
4
55-5
9
60-6
4
75-7
9
80-8
4
85+
70-7
4
65-6
9
500
1000
1500
2000
2500
3000
3500
4000
4500
01995/97 1998/00 2002 2005 2010 2011 2012
Mile
s dr
iven
/per
son/
year
GB
60-69
70++77%
All ages
FIG 12 Miles driven GB
10
0.02.04.06.08.0
10.012.014.016.018.020.0
20
30
40
50
60
70
80
90
1975
/7619
85/86
1989
/9119
92/94
1995
/9719
98/00 2002
2003
2004
2005
2006
2007
2008
2009
2010
2011
2012
female
+77%
male
FIG 13 % of GB licence holders over 70
FIG 14 Internet non-users % of all adults
2011Q1
2011Q2
2011Q3
2011Q4
2012Q1
2012Q2
2012Q3
2012Q4
2013Q1
2013Q2
2013Q3
2013Q4
Source:DfT (2002, 2006, 2010)
We may also witness a new generation of younger people turning away from car travel due to a combination of cost, improvements to public transport and urbanisation. There is already some evidence of a generation of younger people, in both the UK51 and the US52, who are less likely to take on a driving licence than their parents.
With a growing proportion of over 70s holding driving licences, policy debates about this group are frequently directed towards an argument for greater regulation for older driving licence-holders, and for re-testing. Currently driving licences for people aged over 70 automatically expire and need to be renewed every three years – with the onus on drivers to report any health condition that may affect their ability to drive.53
It is vitally important that older drivers are safe to drive. Yet we should take care not to overstate the problem. Despite frequent policy calls for additional testing of older drivers, research internationally has found no link between increasing testing for older drivers and a reduction in casualty rates, and has actually shown it to be counterproductive. In addition, while there is a growth in the numbers of serious road deaths and injuries as we enter our late 70s, this is in part due to the frailty of this group increasing their susceptibility to injury. In fact, many older people change their driving habits to reduce the risk of accidents as they age.

Making our Communities Ready for Ageing I 34
Table 2. Testing can be counter-productive 54
Grabowski et al (2004)
USA Vision tests, road tests, more frequent licence renewals, in person renewals no difference
Langford et al (2008)
Victoria (no age controls) and New South Wales (medical assessment 80+ and on road test 85+)
No significant differences for older or other road users
Mitchell (2008) Across Europe Lowest fatality rates for this age group occur in two of the countries (UK and the Netherlands) with more relaxed procedures
Siren and Meng (2012)
Introduction of age-based cognitive screening starting from the age of 70 in Denmark in May 2006, in a population-based study.
Whilst collision rates for car drivers did not significantly change across any age group, the collision rate for older vulnerable road users in the post-implementation period increased significantly: by 38%.
Langford et al., (2004).
In Sydney (where there is man-datory assessment from 80 years onwards) and Melbourne (in which there are no age-based controls)
Older drivers in Sydney (with age-based controls) had higher collision risks per licence and per times spent driving than those in Melbourne (who had no controls).
Strong recommendations to improve road safety have come from, among others, the RAC Foundation, which has made a case for improving road infrastructure for the benefit of all drivers. Their recommendations include the provision of clear signage and road markings. US guidelines for the development of highway design for older drivers have also been developed. The DfT and Highways Agency should review this evidence and consider whether there is a need for UK guidance.
ILC-UK have explored in detail issues of road safety and concluded that, rather than a regulatory approach, there was a case for voluntary restricted licences as well as a better “nudge” to encourage people to stop when the time is right55. ILC-UK proposed better use of transport technology and intelligent transport systems to support better driving, as well as the introduction of prompts (mobile phone apps; self-assessment questionnaires) to help people and their families make the correct decisions about when to stop driving.
A further issue which arose out of this research was as older people age, car use decreases but a car is often still needed for short and occasional trips. ILC-UK proposed the use of car clubs as a possible solution, which could become a part of an integrated transport system supporting this need.
One reason older people become reliant on their car is due to decisions made earlier in retirement about where to live. A move to the countryside or even the suburbs can result in reliance on a car, something which quickly becomes isolating if people need to stop driving. Individuals need to consider their housing options in such a way that does not build in a reliance on the car.
A significant barrier that many older people face when giving up the car is a lack of support. People who have never or rarely used public transport before are likely to need help to get acquainted with these unfamiliar services. Another option is the development of buddy schemes that can help ensure that isolation does not follow the loss of access to a car.

Making our Communities Ready for Ageing I 35
Public transport
Recommendations:• Online updates for bus times, live information boards at bus stops and spoken stop
announcements on buses should be prioritised in local transport plans. These changes should be rolled out across the country to encourage use of bus networks for new users.
• Concessionary travel schemes based on age, such as free bus passes across England, should allow for flexibility for travel in peak time for volunteers.
• Community transport should join up and consider opening doors to the public – including school and university buses.
• Local authorities and bus companies should explore the role for a subsidised taxi service for older people similar to concessionary fares on local buses.
Encouraging people to give up driving must go alongside a move to more aspirational public transport. For this to happen, public transport must be Safe, Accessible, Reliable and Affordable (SARA)56. RVS research found that, even if concessionary schemes are in place, 17% of the over 75s reported not using public transport because it wasn’t suitable for their disabilities57.
There are a number of existing technologies that make public transport a friendlier and more usable option. Live updates for buses and trains available at stations, bus stops and online can save frustrations with public transport reliability and encourage use of services, particularly for rural areas with infrequent bus services. Additionally, further spread of audio and visual announcements on public transport can promote confidence in using these services for people who may have only recently stopped using their car as their sole or primary form of transport. These technologies are also inclusive for people most often at risk of isolation and exclusion: disabled people and those with sensory impairments. However, many of these services are not available country-wide, or are only accessible to people with smart phones.
While concessionary travel fares for older people operate on most local bus services throughout the country (and are widely credited as an excellent and efficient counter to issues such as social exclusion and loneliness), many of these are limited to off-peak times. With calls for active older people to be contributing more time through volunteering, restricting these discounts at times when people may wish to be travelling to a voluntary placement is counterintuitive. Instead, people who are entitled to off-peak fares should be given fare relief if they are giving up their time for unpaid placements. Reviews of concessionary public transport fares, often in the headlines as options for cuts, must take into account the associated economic loss with curtailing free transport – both for its impact on volunteering, and the potential increase in isolation and loneliness suffered by people unable to get out without the subsidy. For example, pteg analysis has demonstrated that, for every £1 of public money spent on the English National Concessionary Travel Scheme, £1.50 of economic benefit is generated58 (through, for example, allowing older volunteers to get to their placements).
Taxis are now part of the public transport system and more can be done to explore the role they can play for individual journeys. While many people will find taxis too expensive, there may be benefits in using existing fare subsidy schemes to make taxis more accessible to everyone.
Provision of public transport should be periodically reviewed to ensure that it is serving the needs of the community. An issue raised in the discussion group was that often public transport is laid on to gravitate towards a town centre or station, but community activities are often closer to home – but only accessible through a journey into a larger hub, and out again.

Making our Communities Ready for Ageing I 36
Community transport
Recent years have seen unprecedented cuts to local transport, and community transport has had to fill some of the gaps. Community transport, such as minibuses that do not follow a set schedule, are of huge value to areas not fully served by mainstream public transport. However, there is an issue with the perception in older groups that such transport is only for use by people with extreme mobility issues. We are already seeing open attitudes where transport originally laid on for a particular group has then been opened out to others, for example the uno bus in Hertfordshire, formerly a university-run shuttle bus, is now available for public use. Having more open attitudes to a transport system that works for everyone can help challenge the idea that community transport is ‘not for me’. Community transport schemes are often largely staffed by volunteers and need to curtail eligibility because they do not have capacity or resources to provide a service for all, instead serving those who cannot physically use mainstream travel networks. Community transport, for example school and university buses, should explore opening their doors to older people who still have enough mobility to access their non-specialist vehicles, but who may not have access to a car or mainstream bus route.
Car share schemes and car clubs should also become a more important part of the community transport “offer” and could offer significant benefit to older people. In the USA, ITNAmerica has developed the community transport model, where members donate a car and receive a certain number of miles of transport in return from specially recruited volunteer drivers59.
Two wheels good?
Recommendations: • Increasing the numbers of cyclists across the life-course to be prioritised as a
public health, environmental and social goal by Health and Wellbeing Boards and Local Authorities.
• Existing cycling infrastructure, for example cycle hire schemes, to be made age-friendly to support active ageing, such as offering subsidised fares in line with other public transport.
Comparisons between the UK and countries who have invested in cycling demonstrate stark differences – 23% of journeys made by people aged 65 and older in the Netherlands are made by bicycle, compared to 9% in Germany and just 1% in the UK60. While this might not seem surprising, comparisons between the Netherlands and the UK from the 1960s demonstrate that, at that time, our rates of cycling were roughly comparable. Recent results from the 2011 census show that the over 66s are the least likely group to use a bicycle to commute to work61.
The health benefits of cycling as a method of increasing physical activity and active ageing are clear. But somewhere along the way we have sent a message that cycling is not for older people, and certainly not as a means of functional transport. The majority of the cycling we do in this country is leisure based62. Discussion in the seminars suggested that some of this is rooted in social norms around cycling. The strong identity of ‘cyclists’ as young male professionals living in cities is potentially alienating to other groups. We also heard that the development of road infrastructure to better support cyclists is key to ensuring that people feel safe enough to get around on a bike, although infrastructure changes alone are not sufficient. Social, legal and educational changes are also required to create an environment that is encouraging and enabling for cyclists of all ages63.
This is of particular interest to the future of cities – as the 2011 Census data shows, the greatest increases in cycling have been in cities. As more people will potentially live their whole lives in

Making our Communities Ready for Ageing I 37
cities, ‘cycling in place’ needs to come into city plans for the future. A number of UK cities have established cycle hire schemes, which mostly met with success. But more could be done to make these welcoming to older cyclists as part of a wider active ageing agenda. Options could include a tricycle option for greater stability, greater space for shopping or luggage, or including cycle hire as part of concessionary fare schemes. There may also be a role for electric bikes to play in encouraging cycling among older people.
The ageing pedestrian
Recommendations:• DfT should create a set of national standards for road crossings including age-
friendly standards, incorporating types, siting, and maintenance with a mandatory requirement on local authorities to adhere to such standards.
• DfT should consider replacing the older people crossing road sign with a sign with more positive imagery promoting walking as part of later life.
• The Highway Agency and local transport teams should communicate details of assistive technology that supports pedestrians (for example motion-activated crossings) to build confidence.
• The cost of maintaining pavements should be justified through public health outcomes such as falls reduction, with segments of public health budgets potentially ring fenced to support improvements to pavements.
• Existing community programmes to consider informal buddying systems for participants to walk to sessions.
• Health commissioners and providers should promote a key message of ‘improving in strength and balance to support independence’ for falls prevention programmes to counter rejection of the ‘faller’ label.
Communities and their transport should be judged for the whole experience of travel. Even with well-designed, appropriately timed public transport, the first and final parts of a journey can still be made more difficult through poor accessibility for pedestrians. Despite being the simplest way for someone to get out and about in their community, there are many barriers to walking for older people including badly maintained pavements, and a lack of public toilets and benches. Additionally, while inclusive design towards usability and accessibility is desirable, physical activity should not be ‘designed out’ of community spaces.
While some of the discussion on increasing walking for the older age group is a more general conversation about the appeal of public space in our communities, and the role of green space and parks, more can be done to support and empower older pedestrians specifically.
“I would like to ban that awful road sign of older people walking with sticks.” Discussion group participant
Concerns have been voiced around the unwelcoming infrastructure for older pedestrians. The IDGO programme (among other researchers) highlights the disparity between the design walking speed for UK pedestrian crossings (1.2m/second) compared to the speed of the older pedestrians in their study (0.7 – 0.9m/second)64. Other researchers have shown that a fear of not being quick enough to cross the road has restricted people leaving home and has limited the areas in which they travel. Puffin crossings with sensors to detect when pedestrians are still crossing are one option to tackle this. However, our discussions have highlighted that there was a lack of communication about this technology at crossings and subsequently no reduction in the stress associated with needing to get across the road.

Making our Communities Ready for Ageing I 38
The quality of pavements is a topic of great concern – particularly given the clear links to falling and the associated costs of falls to health services. Public health outcomes must highlight this link, and this message must be communicated to transport teams so that any pavement maintenance has the aim of reducing falls at its heart.
In order to optimise ‘pavement friendliness’ planners must also recognise the different needs of older people. Adjustments to pavements, such as addition of tactile areas of pavement, have benefits for people with visual impairment – but can be uncomfortable for those with musculoskeletal conditions such as arthritis.
There may be a conflict of interest for some interventions designed to increase walking among older people. Studies have shown that going outside can be one of the best predictors of having a fall, and this increased risk makes it difficult to tackle the associated drop in confidence among older people.
In our discussions, we talked about the role for buddying systems to support walking for people after a fall. Anecdotally, some people are resistant to these schemes - qualitative research has shown that people don’t like to be labelled as ‘fallers’. Building on the knowledge that peoples’ desire to get out is often social or to take part in activities, an integration of walking support with existing activities could have more success than a straight ‘post-fall’ intervention. Community groups should be encouraged to engage with members on how they travel to sessions, and the potential for ‘buddying’ on walks. Promoting better strength and balance to support independence should be used as the key message for falls prevention programmes in order to counter people’s rejection of the ‘faller’ label. However, buddying systems should not be considered a replacement for the vital role of health and social care systems to provide rehabilitation and re-enablement services, particularly if a fall has resulted in a fracture, given that fragility fractures present a significant risk to health and wellbeing (for example 20% of hip fracture patients die within four months of their injury and 30% die within a year65).
From mobility scooters to urban podsRecommendation:• As new technologies develop, Government must review the regulation of road transport
to ensure that there are no unnecessary barriers to the use of new technologies that could support greater independence.
It is estimated that there are around 300,000 mobility-scooter users in the UK66. Scooters are very positively received by users as they help maintain freedom and independence (see Barham et al., 200667 and Steyn and Chan, 200868). But there is a stigma associated with mobility scooter use. There are frequent debates about safety and questions about whether they replace walking and therefore impact on health. Other issues stem from a lack of accessibility of pavements for mobility scooters and their subsequent use on roads, and the potential shared use of scooters and bicycles on cycle routes.
We have discussed earlier the role of cycling as a potentially useful method of mobility for older people. But innovations in transport could contribute to greater opportunities for older people to both get out of the home and get out and about in the town. Other new options which may prove of use in the future are the driverless car ‘pods’ currently in use at Heathrow and soon to be introduced in Milton Keynes as a low carbon option for travelling from the station to the town.69 While the costs of these pods are yet to be confirmed, similar technologies could help older and frailer people move around town centres – if the price is right.
As new technologies develop, Government must review the regulation of road transport to ensure that there are no unnecessary barriers to the use of new technologies that could support greater independence.

Making our Communities Ready for Ageing I 39
The nuts and bolts: toilets, seating and crime
Recommendations:• Lack of public toilets should be highlighted as a public health issue by Health
and Wellbeing Boards (associated risks of loneliness and isolation for fear of going out). Availability of public toilets should be made a public health priority, with responsibility placed on Local Authorities to maintain toilets or work with partners to provide facilities.
• Local authorities should subsidise the upkeep of public benches (and other facilities) by offering advertising space to local businesses.
• Retailers and businesses with a high street presence should have Corporate Social Responsibility strategies to include age-friendly business approaches to support the communities they have become part of – including access to toilets for non-customers.
• Community planners must do more to design out the potential for both crime and anti-social behaviour.
Even if all the other pieces of the transport ‘puzzle’ are in place, there are number of issues that contribute to a lack of desire to go out. Central to these issues are the ‘nuts and bolts’ of daily life.
In the UK, an estimated 24% of older people are affected by urinary incontinence70 - a trend set to rise in line with an ageing population. However, in 2013 the British Toilet Association estimated that there had been a 40% drop in the number of public toilets across the UK over the last 10 years.71 There is a need for more public toilets in order to support people in getting out and about. The Welsh Government has recently produced draft legislation putting the responsibility on local authorities to ensure that there are adequate public toilets72, a strong step towards removing this enormous but often unspoken barrier to people getting out in the community. Companies with a local presence such as high street shops can also take greater social responsibility within their communities and offer free access to toilet facilities. The Great British Toilet Map project has sought to identify facilities like these, including both toilets that are free and those with paid-access.
Central to supportive environments for older people to get out of the house and move about are, somewhat counterintuitively, public seating and places to rest. The need for safety and comfort through a place to rest, even on what might be perceived to be a short walk (previous Department for Transport guidelines have suggested at every 100m along pedestrian routes), is a vital part of the support for enabling people to get out more.
Crime and fear of crime can also be major barriers to older people’s willingness to spend time in outdoor space in the community. Older people report a greater fear of crime than younger age groups despite the fact that older people are less likely to be victims of crime. A survey of 4,000 older people found that almost half of those aged over 75 were too afraid to leave their homes after dark because they believed they would be subject to verbal abuse or mugging. Two thirds believed that they would inevitably become victims of crime as they got older, while a fifth said this fear had contributed to a sense of loneliness and isolation. Half of those aged over 75 were too afraid to leave their homes after dark73.
Crime Prevention Through Environmental Design (CPTED) could possibly help to alleviate some of these fears. CPTED aims to reduce opportunities for crime through effective planning and design to produce a built environment that provides and encourages empowerment to legitimate users and the marginalisation of the illegitimate.

Making our Communities Ready for Ageing I 40
Ensuring communities offer what older people wantHow to ensure future communities deliver the sort of services and activities an ageing society demands?
Central to the discussions in our seminars was a desire to get rid of the concept of a need for segregated options for older people’s activities, and instead to have a more integrated and inclusive approach to community services and activities to ensure that people of all ages are able to access them. But participants at our events argued that “safeguarding” was blocking the development of all-age projects and services.
People’s interests and hobbies don’t automatically change because they have passed retirement age (though of course people’s interests can change throughout their lives) so community offerings shouldn’t assume that they do. There was also a shared desire to centralise the idea of playfulness and fun, rather than only function, into conversations about ‘what older people want’. Similar to the concept of ‘gamification’ of, for example, educational activities, participants felt that we should be able to have fun for fun’s sake at all ages, as well as there being a role for play to lead desirable outcomes (such as people wanting to get out more).
“I found that the older people I talked to did not relate their activities to the term ‘play’ which they associated with children. ‘Playful’ or ‘playful state of mind’ may work better or even ‘enjoyable’. In urban design terms there is talk of vitality and conviviality although they are not quite the same.” Discussion group participant
Bringing play for all ages into communities could be done through desegregation of playground equipment and the further spread of all-age play equipment outside public parks – such as swings at bus stops, and outdoor gym facilities (see below).
At the least, local areas and travelling between them should support residents and their activities. At best, transport, the experience of travelling and the places we move through within our communities will support a more active lifestyle for all ages and will create a sense of wellbeing and improvements in quality of life.

Making our Communities Ready for Ageing I 41
The great outdoors
Recommendations:• Local authorities need to recognise the health benefits of access to green space, and
could consider placing some spending on green space under the umbrella of health and ring-fencing it to ensure a commitment to recurrent spend.
• Planning systems should be rationalised so that non-mandatory features such as green space don’t ‘slip through the cracks’ and get lost. An appropriate minimum standard of access to green space might be based on the Accessible Natural Greenspace Standard (ANGSt). This minimum standard should be applied by planning departments as a mandatory requirement for private developers to provide suitable green space on-site in housing (general and specialist housing) developments.
• Recognising the physical and mental health benefits of access to green space, the CQC should place a requirement for residents in care homes to have access to gardens and assistance to enjoy them.
• Local authorities should support provision of desegregated apparatus for fun in outdoor spaces that includes people of all ages – like swings outside of children’s play areas, and outdoor gyms.
• Local authorities to investigate use levels of outdoor versus indoor leisure facilities in their area and to adjust public spending accordingly.
• Park awards judging criteria (such as the Green Flag awards) should include a positive promotion of activity and healthy ageing.Park managers to explore more options of funding infrastructure to support good quality public green space such as sponsorship from local businesses.
As well as supporting basic needs, our physical environment can have a number of additional benefits; living in and having access to a pleasant environment is good for us. Access to greenspace is important to our wellbeing and living within 10 minutes of a pleasant park impacts on the amount we walk. Recent research has also revealed health benefits of living within 5km of the sea74. Greenspace is a broad concept, and goes beyond parks and green leisure spaces into natural environments being part of the fabric of a community. This was echoed in the seminars – there is a strong feeling that greenspace should not be isolated pockets, but to be part of, for example, pedestrian routes to support and encourage walking, and in housing settings to improve wellbeing of residents. This also benefits those who may not habitually go out to specifically visit parks, but could benefit from these green routes.
“I’ve asked European colleagues how the UK compares to the rest of Europe – the answer is ‘Your parks are wonderful but your streets are a disaster’” Discussion group participant
Alongside the desire for greenspace, discussion group participants also highlighted that there is a need to recognise our parks for the great resource that they are for communities. In 2002, the Urban Green Spaces Taskforce reported that under-investment was leading to the decline of parks and greenspace, despite 30 million people in England using parks frequently75.
“We know so little about parks. We started our research by talking about parks to policymakers – but it’s like [the parks] were invisible. There’s an assumption parks look after themselves.” Discussion group participant
Historically, there has also been a lack of priority given to parks as an option for supporting physical activity in communities (for example spending on urban parks and open spaces dropped from 43% of local authority spending in 1976/77 to 32% in 1998/99). Indoor leisure has

Making our Communities Ready for Ageing I 42
also been prioritised in public spending, despite more visits being made to parks and outdoor leisure spaces than the indoor complexes. Indeed, there were concerns from participants in our seminars that, in some cases, the management of gyms in leisure centres has been handed over to private companies who may not have the same interest in serving the whole community as local authorities are obliged to. Comments from our seminars also suggested that use of parks and outdoor leisure space is often hugely underestimated by local governments.
Pleasant outdoor spaces and greenspace can also encourage a culture of recreational physical activity through more walking, as well as the benefits to wellbeing mentioned above.
“The focus should be on leisure not exercise… if you make it seem that exercise is a ‘trial by ordeal’ then no-one will do it.” Discussion group participant
Knowing what we do know about the benefits of greenspace, and the aspirations towards a more physically active population, integrating natural environments into our communities is essential. We can do this by rationalising our planning regulations, housing plans and design for new community spaces with greenspace at their hearts. This applies to people living in all kinds of housing – care homes and specialist housing should support this in their design.
“People who are housebound like to have a good view from their window. And they like to see movement even if they can’t move themselves”. Discussion group participant
In many cases the changes that will support age-readiness in outdoor natural space are those that will benefit all generations: toilets, catering facilities and equipment such as outdoor gyms, which have the potential to be an all-age resource, bringing playfulness into activity.
“One of the reasons for the success of the outdoors gyms springing up is there hasn’t been a sense that they ‘belong’ to one generation or age group – like you get with indoor gyms” Discussion group participant
To make these a success however, thought needs to go into their design to ensure they are accessible for all.
The maintenance of attractive and usable outdoor space requires recurrent spend, a potential challenge. Maintaining and building on existing greenspace has clear health benefits, but robust evidence is needed for public health budget ring-fencing to permit this spending. A concern from our discussion seminar was that leisure spending is often focussed on getting people of working age fit, and the positive effects of health for all ages through high quality greenspace are not given the same priority. Making this a priority for local budget-holders is key. Existing award schemes for parks, such as the Green Flag awards, have been extremely successful and are popular with local councillors. Inclusion of active living within the criteria for these awards would promote this to the managers of parks and greenspaces.
Much of the improvements to parks in the last few decades have been due to the Heritage Lottery Fund – who have invested £650 million since 1996 (with joint-funding from the Big Lottery since 2006)76, with funding continuing through the Parks for People programme. With funding options under pressure, alternative options such as advertising space for local businesses may help to support refurbishment and maintenance of greenspace and parks to support active ageing in the community.
Making our Communities Ready for Ageing I 43
Relationships and people
Recommendations:• Government to create a cross-departmental strategy for widowhood designed to
identify and offer support to people who have lost a partner.
• Community stakeholders to participate in supporting people at crucial ‘trigger’ moments for isolation and loneliness.
• Further research is required to understand the significance (and potential cost benefits) of ‘community enabler’ positions.
• Local public health campaigns on loneliness, backed by Health and Wellbeing Boards, with GPs prepared to give advice and referrals to local community groups and older people’s groups for people identified as being at risk of loneliness or who self-referred for loneliness.
Society’s ideas of the key moments in the ageing process tend to be focussed on physical changes, but social and psychological changes are also critical. For example, losing a partner can be a trigger for a withdrawal from society – people who are widowed are at increased risk of social exclusion77 - but this moment can also be a tipping point, motivating people to act to avoid loneliness. Our discussion groups commented that there is a culture, particularly in the middle classes, of couples interacting with couples, and, post-bereavement, this can lead to a further drop in social support. There is a role for a strategy to identify recently bereaved people and provide support with buy-in from multiple stakeholders.
Trends such as families not living as close to each other as they used to (a significant minority of older people live more than 40 miles away from their closest child78), and people being less likely to know their neighbours (a million people over 75 do not know their nearest neighbour79) combine with life stage changes, such as stopping work, to reduce a person’s social contacts.
One of the key factors in motivating people to get out into the community is other people. There is a role for analysis of the nature of this enabling and support role – and whether community support through people can be as effective as the most accessible built environment as a method of encouraging people to participate.

Making our Communities Ready for Ageing I 44
Activities for older peopleRecommendations:• Local authorities and older people’s groups should maintain a list of activities available
in the local area and distribute to community centres, GP surgeries, local information boards etc.
• Community groups to continue to promote access for all, such as through the use of phone groups for people with limited mobility.
• Funding for adult education should reflect the differing needs of adult learners – both short and longer-term education should be supported.
• Local authority safeguarding systems and requirements should be examined to ensure that they are not ‘killing kindness’ by creating barriers too difficult to cross, for example for intergenerational projects.
Three principles were particularly prominent in our discussions on how activities for older people can be developed in communities:
- There is evidence that many people do not identify themselves as ‘older’, and, in consequence, view services obviously aimed at ‘older people’ as repellent.
- There is not a single set of ‘ageing activities’ that older people want to participate in.
- The co-design of activities, led by the desires and needs of the people being provided for, is the most important determinant of participation.
There is a great number of groups, activities and classes available to adults, including those only available to people over a certain age. However, there is often a dearth of clear information about what is available in an area. Local authorities could potentially coordinate this information as well as provide a more formalised referral system to community groups offering activities, along the lines of GP-referral exercise schemes, where gyms and leisure centres offer free or subsidised periods using exercise facilities with support from staff.
“Those delivering services at the coalface know what works – it’s not brain surgery” Discussion group participant
As people experience health issues that affect their mobility, they may be less able to participate in the activities available. Different options for ‘bringing activity to the people’ included the use of phone clubs for people who are housebound or have limited mobility. One participant from Open Age, a charity providing activities for older people, cited telephone groups set up for a book club and creative writing classes.
There is also great potential for technology and the internet to spread engagement in community activities. A desire to stay in contact with family members has been found to be the most important reason for older people coming online. Leading with fun and social contact should be a strong selling point for activities and classes aimed at getting people online.
Local authority-coordinated adult education classes and funds have a key role to play in supporting lifelong learning, for an ageing population may need to work, volunteer and contribute for longer. However, our discussions suggest that there is a potential mismatch between the ways that funding is provided and the desires of those using these services:
“The adult and community learning funds are largely target driven – more important to get bums on seats and show progression - but people want to carry on and have longer term interests than a 12 week course.” Discussion group participant

Making our Communities Ready for Ageing I 45
The desire for help and support over the longer term, and particularly with IT courses, is not well met in this current climate.
Discussions in the seminars touched on the barriers and red tape that at present stop some effective schemes from taking place – for example, lunch clubs have faced difficulties with food regulations. This is a particular issue where a (potentially liable) individual or organisation is taking a lead in organising activities. In order to avoid “regulations killing kindness”, as one participant put it, individuals should have to accept the potential risks by giving their consent – in order to have freedom to participate in activities. The participants also commented that a number of promising ideas, particularly those involving intergenerational work and children, were a “safeguarding nightmare” and were subsequently dropped. There is more work to be done to encourage people to be less risk averse given the gains that can be made for communities through maximising potential
Community capacityRecommendations:• Local authorities to support the formation of intergenerational problem-solving forums
to engage diverse sections of communities to respond to problems.
• Retailers and businesses with a ‘high street’ presence – including the ‘unusual suspects’ of betting shops and convenience stores – have a responsibility to actively contribute to age-ready communities (and they could benefit by doing so).
• Community centres to protect time for local group activities to maintain the space as community resource (as opposed to a hall for hire).
• Landlords of empty high street shops and organisations with real estate to establish open-door policies for local groups seeking space to meet or hold activities.
• Care homes should be designed or adapted to have space for community activities, and should maintain open policies to integrate the home into its community.
Much of the discussion held in our sessions covered the lack of funding available for community initiatives, and the local services that have been affected by austerity drives, cuts or dwindling interest and support. There is a subsequent need for a ‘Make do and Mend’ approach to the capacity already available in communities, whether in terms of human capital through skills and willing volunteers or the space and amenities on offer.
People are the most valuable resource a community has – without engagement and interest and support from people in an area, none of the recommendations made here will come to fruition. However, there are many ways in which we are not making the most of the human capital that powers our communities. Highlighted in RIBA’s report on the Third Age in cities, are figures that 69% of people aged 65 and over think that businesses currently have little interest in older people – and 76% think that older people have unused/wasted talents80. Options such as all-age apprenticeships, not just for younger people, may offer possibilities for skilling-up and opening further doors to this potential for local economies.
Around the country there are intergenerational projects that match up the skills of older and younger people, but there are further options for expanding this model. Recent revivals of interest in ‘grow your own’ vegetables and making your own garments could be supported by older people with these existing skills.
“Is there a virtuous circle to be found with younger people sharing their knowledge of IT with older people who share other knowledge and skills, perhaps help with homework? How could that be rolled out?” Discussion group participant

Making our Communities Ready for Ageing I 46
Reducing numbers of people who do not use the internet may be key to some of these ideas taking shape. Where we aren’t using the knowledge and expertise from older people in our communities, the use of technology could be central to establish, for example, intergenerational problem-solving forums to engage diverse sections of communities to respond to neighbours’ problems and offer support. Anecdotally, there are particular frustrations with the under-use of computer labs in schools – as they are paid for by taxpayers’ money, it seems unfair that this valuable resource is left idle when it could be used to support improving digital skills for older age groups.
Shops on the high street have long been at risk, both from economic contraction after 2008, but also from long-standing trends like an increase in out-of-town shopping malls and supermarkets – and the rise and rise of online shopping. When we examine what our high streets look like post-recession, there has been a recent increase in convenience stores and coffee shops – but also in betting shops and pound shops (PwC and the Local Data Company 201381). The increase in convenience shops is a potential positive move for encouraging growth back to the high street, and the return of small service and amenity shops to local centres. WH Smith accommodating some Post Offices is another positive step in maintaining local high streets.
Changing neighbourhood landscapes – shutting up shop• 16 shops a day closing in UK town centres
• 28 pubs a week closing between April and December 2013
• Closure of 2,500 Post Offices between 2008 and 2009
• Library Campaign predicts closure of further 400 UK libraries by 2016
But – potential in the up-and-comers?• Pound shop openings up by 13% and coffee shop openings up by 3.4% in 2012
• Wetherspoon planning to open another 25 pubs between September 2013 – July 2014
• Commitment from Post Office CEO to protect rural and community branches of existing 11,800 post offices and refurbishing 6,000 of those
Some retailers have already taken on board their role as community-shapers, for example, shops signing up to initiatives such as training staff to be ‘dementia-friendly’. However there is a larger role for other companies to play in making high streets age-friendlier. Chain coffee shops and pubs, which have a presence in most towns and cities, could be doing more to make their doors open for community activities, or more generally giving thought to the needs of an older consumer and ageing community. A presence on the high street should be accompanied by businesses considering their contribution to being age-ready – so the ‘unusual suspects’ such as betting shops, pound shops and convenience stores (doing comparatively very well in the light of the recession) should also be taking age-readiness into account in their Corporate Social Responsibility.
With the closure of many community spaces such as libraries, remaining space for activities has been under pressure. Participants in the discussion groups highlighted a loss of a sense of local centres and halls as a community resource:
“Community centres aren’t community centres any more – they’re halls for hire.” Discussion group participant
As the recession has continued, and empty shops have become a frequent sight on the high street, this space has been taken advantage of by local groups and used as meeting spaces, art galleries and more. Landlords should keep an open-door policy for local groups to discuss

Making our Communities Ready for Ageing I 47
short term use of spaces in this way. Other spaces with vacant periods such as churches, leisure centres and other public sector buildings could open their doors and support a more efficient use of resources within the community. And there is a strong role for pubs and coffee shops as natural meeting places to support these trends –from maintaining existing offerings like discounts for older people to recognising and embracing their role as, for example, a public toilet facility for the community.
There is a strong call for a greater integration of care homes into communities. Suggestions were made for care homes to open doors for community groups to use them as meeting spaces. Care home design could also include space built in for GP surgeries, pharmacies or coffee shops, an additional benefit for the community with the bonus of creating a more porous boundary between the care home and the community it sits in. As demand for services such as Wifi increases in the care sector, care homes could consider offering themselves up as an internet cafe. Integrating services such as childcare and day services for older people into places the rest of the community visits – like care homes or high streets – can also help to prevent the barriers between different age groups.

Making our Communities Ready for Ageing I 48
What’s missing?Recommendations:
• Local service commissioners, including social care budget holders and clinical commissioning groups, to support community networks.
• To make a convincing business and value-for-money case for community interventions, cost-efficiency must be demonstrated in evaluations of existing schemes. This should be supported by local health and social care systems with more flexible access to data; and by research organisations offering evaluation support to community and voluntary groups.
• UK Research Councils and research funders to invest in knowledge sharing that supports the championing of best practice and avoids duplication.
• Funders and commissioners must appreciate the value of participatory research and provide sensible and serious research criteria for evaluation of projects that do not exclude service providers without professional research knowledge or support.
Support within communities
It is clear from the evidence reviews and seminars in this project that there is a great deal going on across the country, but often poor coordination. A role for community support workers was discussed a number of times during the seminars, with schemes highlighted such as the national LinkAge Plus project, or the Village Agents scheme originally established in Gloucestershire, where agents work 10 hours a week to support those aged over 50 in the community. The scheme is jointly funded by the local council and clinical commissioning group. As the model has spread across the Country, other schemes have been funded by voluntary sector partnerships. The success of this scheme is a clear example to other commissioners and those with health and social care budgets of a low-cost, high-impact method of tackling the smaller-scale issues which, left unchecked, can escalate into crisis points. This is also supported by other schemes that tie their evaluations into outcomes such as reduced GP and hospital visits as a result of actions. Local health and social care services should be supporting such evaluations with provision of data where requested..
“No decision about me…”
Our discussion groups emphasised the need to better engage older people in decision-making. Participants argued that failure to involve older people led to poorer decisions.
“If you ask older people what they want from their communities, the priorities are strikingly different from what is currently being delivered. Older people say they want a Post Office, good street lighting and clean toilets” Discussion group participant
“There was a complete failure to engage older people in the Supporting People programme despite the fact that it led to transformation of housing for older people” Discussion group participant
Participants in our discussion groups argued that the professionalisation of communities as a policy topic had resulted in a debate that was losing touch with the wants and desires of older people.

Making our Communities Ready for Ageing I 49
“I participated in an inquiry into retirement housing. We had to spend a huge amount of time talking about what retirement housing actually is”
“Only housing professionals and policy makers use the word housing. We need to refocus policy emphasis on the word ‘home’ not ‘housing’”
Older people are already disproportionately more likely to be voters, but need to engage further in policy-making. Their voices are needed to articulate what the higher levels of social need look like for them.
Digital inclusion and the role for technology
The number of people who have never used the internet continues to fall: by the end of 2013, 13% of adults had never used the internet, a fall of 0.7million from the previous year82 - consistent with the falling numbers of people offline in recent years.
Those still offline are disproportionately older people, those with disabilities and the very poor – some of the groups who could most benefit from support. Moving into exclusively-online community engagement must be resisted until it is certain that everyone will have access to participate. These groups will be further marginalised and ignored as these numbers continue to fall, and society moves towards a point where everyone else is online.
“There is a huge ICT learning and support void – once you’re online, you’re expected to be your own IT department”. Discussion group participant
Figures used by policy-makers to discuss digital exclusion are often the ONS statistics for people who have never been online (currently 7 million). There are far fewer references to the numbers of people who have used the internet but have low skill levels (11 million). While funds are being directed towards this group (the Big Lottery Fund is currently supporting work to improve digital skills), the longer-term approach to existing courses to ‘get online’ is far from universal. There is a clear need for a comprehensive and freely available learning and support for technology use. Technological literacy must be at a level where everyone feels comfortable enough to access the services that are now only available online.
Despite these challenges, there is great potential for technology both in shaping future communities and for local people to engage with them. The future of cities is intrinsically linked to big data, where datasets on our interaction with the city (for example peak times of travel) can be used to redesign services and infrastructure, and there is untapped potential in the use of technology to combat problems such as loneliness. Virtual community groups on social media sites like Facebook represent the beginning of this curve, and existing sites such as FixMyStreet.
Figure 12. Internet non-users percentage of all adults
300,000
400,000
350,000
50,000
150,000
100,000
200,000
250,000
Source: DCLG
0
1969
-70
1970
-71
1971
-72
1972
-73
1973
-74
1974
-75
1975
-76
1976
-77
1977
-78
1978
-79
1979
-80
1980
-81
1981
-82
1982
-83
1983
-84
1984
-85
1985
-86
1986
-87
1987
-88
1988
-89
1989
-90
1990
-91
1991
-92
1992
-93
1993
-94
1994
-95
1995
-96
1996
-97
1997
-98
1999
-00
2000
-01
2001
-02
2002
-03
2003
-04
2004
-05
2005
-06
2006
-07
2007
-08
2008
-09
2009
-10
2010
-11
2011
-12
2012
-13
1998
-99
Number of permanent dwellings stated in UK 1969-2013FIG1
Difference between number of new dwellings started and year on year population growth
FIG2
200,000
400,000
300,000
-500,000
-300,000
-400,000
-200,000
-100,000
100,000
Source: DCLG and author’s calculations
Source: ONS DCLG and author’s calculations
0
1969
1971
1973
1975
1977
1979
1981
1983
1985
1987
1989
1991
1993
1995
1997
1999
2001
2003
2005
2007
2009
2011
2013
Local Authorities
Housing association
Private enterprise
FIG3
300,000
400,000
350,000
50,000
150,000
100,000
200,000
250,000
0
1969
-70
1973
-74
1971
-72
1975
-76
1977
-78
1979
-80
1981
-82
1983
-84
1985
-86
1987
-88
1989
-90
1991
-92
1993
-94
1995
-96
1997
-98
1999
-00
2001
-02
2003
-04
2005
-06
2007
-08
2009
-10
Composition of dwelling started
200,000
400,000
300,000
-500,000
-300,000
-400,000
-200,000
-100,000
100,000
0
1969
2017
1972
1975
2020
1978
1981
1984
2023
1987
1990
2026
1993
2029
1996
1999
2001
2032
2005
2008
2035
2011
2014
FIG4 Difference between number of new dwellings started year on yearand population growth
FIG5 New homes required versus previous house building scenarios
FIG6 Average size of new homes
FIG7 Total council spend on 65+ care services and difference to the level implied by long-run trend
FIG 8 Housing our Ageing Population: Panel for Innovation
FIG 9 Mobility, accessibility and quality of later life
FIG 10 Length of car driver journeys 2011-12
FIG 11 Length of car driver journeys 2011-12
1970s yearly home starts
1980s yearly home starts
1990s yearly home starts
Housing starts-total annualpopulation growth (actual)
Post 2008 crisis yearly home starts
1980s yearly home starts
1990s yearly home starts
Post 2008 crisis yearly home starts
What we will actually need
1970s yearly home starts
50,000
100,000
150,000
200,000
250,000
300,000
350,000
2013
2015
2017
2019
2021
2023
2025
2031
2033
2035
2037
2029
2027
Source: ONS author’s calculations
Source: The RIBA (2011) based on work by Policy Exchange and Localis (2005)
UK 76m2
Japan (21% bigger) 92m2
Netherlands (53% bigger) 115.5m2
Denmark (80% bigger) 137m2
12
10
8
6
4
2
01994-
951995-
961996-
971997-
981998-
991999-2000
2000-01
2001-02
2002-03
2003-04
2004-05
2005-06
2006-07
2007-08
2008-09
2009-10
2010-11
2011-12
2012-13
Total expenditure Long term trend (based on average annual expenditure growth rate, 1994-2010)
27%
£bill
ion
Source: Census (2001),Elderly Accomodation Counsel, Community Care Statistics (2008), Housing LIN
General Needs Housing with pensioner housing in England 5,809,582
Specialist Housing 729,818
General Needs Housing in England 19,655,611
Residential Home in England 105,676
Nursing Home in England 58,304
Units of Sheltered Accomodation in England 476,000
Units of Very Sheltered Accommodation in England 23,000
Close Care in England 12,938
Units of Retirement Villages in England 8,466
Specialised/Dementia Care in England 6,293
Extra Care in England 39,141
Primary mobility needs
Secondary mobility needs
Tertiarymobility needs
0
2
4
6
8
10
12
21-2
9
30-3
9
40-4
9
50-5
4
55-5
9
60-6
4
75-7
9
80-8
4
85+
70-7
4
65-6
9
Age group
Leng
th o
f ca
r d
river
jour
neys
,mile
sJo
urne
ys p
er y
ear
Women
Men
Car passengerCar driver BusOther Walk
-
200
400
600
800
1,000
1,200
Men Women
40-4
9
50-5
4
55-5
9
60-6
4
75-7
9
80-8
4
85+
70-7
4
65-6
9
-
200
400
600
800
1,000
1,200
40-4
9
50-5
4
55-5
9
60-6
4
75-7
9
80-8
4
85+
70-7
4
65-6
9
500
1000
1500
2000
2500
3000
3500
4000
4500
01995/97 1998/00 2002 2005 2010 2011 2012
Mile
s dr
iven
/per
son/
year
GB
60-69
70++77%
All ages
FIG 12 Miles driven GB
10
0.02.04.06.08.0
10.012.014.016.018.020.0
20
30
40
50
60
70
80
90
1975
/7619
85/86
1989
/9119
92/94
1995
/9719
98/00 2002
2003
2004
2005
2006
2007
2008
2009
2010
2011
2012
female
+77%
male
FIG 13 % of GB licence holders over 70
FIG 14 Internet non-users % of all adults
2011Q1
2011Q2
2011Q3
2011Q4
2012Q1
2012Q2
2012Q3
2012Q4
2013Q1
2013Q2
2013Q3
2013Q4
Source: Office for National Statistics 2014

Making our Communities Ready for Ageing I 50
com may also have a role to play. The potential for mapping of local areas to display what is on offer may also aid issues of duplication.
Social responsibility
Many of the forces that shape and change our communities are large organisations that are difficult to engage with. National companies and large institutions like universities may not have an obvious access point and their priorities are set at a different level to the struggles of the communities they sit within. However, there is an argument to be made for all presences in a community to make contributions – and, as highlighted above, there are ways in which chain retailers and others can be supporting age-ready communities. Businesses in particular should look on their role within local high streets and across the community as an opportunity for corporate social responsibility through becoming age-prepared. This responsibility should not be limited to the usual suspects – and communities should be welcoming to approaches from areas previously overlooked in terms of community support.
There are promising links already being forged – such as universities offering support with evaluation and assessment of community group activities, something which is vital for these to continue to win funding. Partnerships such as these as the norm will ensure that the mistakes of poor or non-existent evaluation of projects are not repeated, and we can get a better understanding of what is working for our communities. There is also a role for professional organisations that shape neighbourhoods, housing and environments to take an active interest in ageing and the ways in which their efforts can be made ready for the coming demographic changes. Including ageing as part of professional curriculums can be a key part of this, and can help ensure that future generations of, for example, architects and designers, are already aware of these issues beyond the need for inclusive landscapes and access.
Knowledge sharing
There has historically been little investment in knowledge translation into action on this topic. In our seminars, academic and policy personnel alike condemned the ‘vast repositories’ of knowledge “just sitting there”. In the UK, we have some of the best research capacity in world but seem to lack the capacity to shift fundamental debate around these topics to demonstrating cost savings and the impact of good practice examples.
Fun and playfulness
As highlighted throughout this report, there is a lack of interest and attention paid to fun and playfulness as part of later life. This includes limited research conducted on the impact of fun on health and wellbeing, and on the value of leisure as opposed to exercise. We must think outside of bowls and bingo in planning activities for an older population. As the baby boomers retire, the desires of this generation will challenge perceptions of what needs to be accessible to all ages – communities will be in need of age-friendly gig spaces for live music, exercise classes, nightclubs and internet cafes. Underlying communities’ moves towards age-readiness must be a fundamental rethink in the way we view older people and an aspiration for all to be able to reach the highest levels of Maslow’s hierarchy.

Making our Communities Ready for Ageing I 51
Planning for the futureThe coincidence of our rapidly ageing society, the rise of interactive technology and the increasing voice of dissatisfaction with the political status quo (from, among other sources, social media) means that politicians will be looking to address issues with major traction for the future – of which ageing is one of the biggest. It is expected that ageing will be a major issue for the Parliament elected in 2015.
Increasing dissatisfaction with the political status quo (fuelled, among other factors, by social media) means that politicians will be looking in future to address major societal issues on which they can get traction. As one of the most significant, ageing is expected to be a major issue for the Parliament elected in 2015.
In launching his committee’s influential report, Ready for Ageing, Lord Filkin pointed out that society is woefully unprepared for ageing. He highlighted the challenge of engaging politicians in issues and decisions that go beyond their political term. A similar issue emerged during our discussion groups, in which participants expressed concern about how to motivate local authorities to plan for the long term.
Some of the new powers bestowed upon local authorities by the recent Acts of Parliament open some doors for local authorities to plan for the future. Criticisms have been made – for example of the Localism Act – that the climate of austerity has effectively curtailed most authorities from acting on these new opportunities. However, from the point of view of ageing strategy, it is helpful to be looking into the mid- and long-term future. There is great potential in the Public Health changes, particularly the shift in responsibility for public health to staff of local authorities. But we are yet to see the innovative thinking that would take advantage of this approach, and a recognition that health goes hand in hand with issues like housing and greenspace planning. Existing tools are also not yet being put to good use – for example the World Health Organisation HEAT tool, which demonstrates the economic impact of walking and cycling infrastructure on health outcomes and subsequent costs83.
In many ways, we are repeating ourselves and colleagues’ previous sound advice on these issues. However, as headlines about poor quality of life for older people continue to appear, it bears repeating that our whole approach must be to underpin creation, planning, design, refurbishment, repair and plans for living in our communities with an understanding of what an ageing population entails.
There is a strong need for a multidisciplinary approach to ageing and issues related to older people – requiring collegial working across central and local government, the voluntary sector and community groups: health, social care, community services, housing, work and pensions, transport and business. All these parties need to work in concert, as well as actively involving older people in the consultation and decision making processes, to ensure that our communities are ready for ageing.
“In many ways we have succeeded in tackling the biological injuries of ageing with scientific and medical advancements – but we are a long way from dealing with the social injuries of age.” Discussion group participant
Throughout the conversations we have had as part of this project, there is a concern that, as the ageing issue continues to hit headlines and becomes part of mainstream political debate, all too often the narrative of ageing is one of a lack of capacity to deal with the functional aspects of a society growing older. Failing to see the complexities of the 40 or 50 year-long span of ‘old age’ and the desire for socialising, fun and wellbeing, undermines the road to self-actualisation in Maslow’s vision. We do have to get the basics right but the ultimate goal for our communities should be to allow people, regardless of age, to reach their maximum potential.

Making our Communities Ready for Ageing I 52
AcknowledgementsWe are grateful to Age UK for supporting this work, and particularly to Phil Rossall for his input and support.
We would like to thank JRF, DCLG, Age UK and Arup for hosting the project events.
Thanks also go to Jonathan Scrutton and Ben Franklin at ILC-UK for their input.
We are grateful to the following participants who contributed to our discussion seminars held in March and April 2014, and for their comments on a draft of this report:
Sue Adams OBE Care and Repair
Najib Baig University of Cambridge
Carol Barac Elderflowers Projects Co. Ltd
William Barker Department for Communities and Local Government
Ingrid Barnes Department for Communities and Local Government
Sadie Boniface UCL
Gillian Connor Hanover
Karen Croucher University of York
Zhang Dakun University of Cambridge
Professor Leela Damodaran Loughborough University
Malcolm Dean Formerly The Guardian
Amy Forbes Arthritis Research UK
Rebecca Fuller pteg Support Unit
Paul Gamble Habinteg
Emily Georghiou Age UK
Marcus Green Age UK
Sophie Handler Manchester City Council
Kevin Harris Local Level
Eric Harris RICA (Research Institute for Consumer Affairs)
Kate Jopling Campaign to End Loneliness
Ruth Lamont Office for Civil Society, Cabinet Office
Bob Laventure Loughborough University
Helen Leech Open Age
Abigail Lock Mears Group
Michelle Low University of Cambridge
Tim McSweeney Department for Communities and Local Government
Professor David Metz University College London
Jenny MindellStreet Mobility and Network Accessibility, University College London
Dr C.G.B. “Kit” Mitchell
Stuart Murray Transport for Greater Manchester
Professor Charles Musselwhite Swansea University
Making our Communities Ready for Ageing I 53
Joe Oldman Age UK
Sherrelle Parke Department for Communities and Local Government
James Parkinson RIBA
Professor Sheila Peace Open University
Joanna Pearl Which?
Jocelyn Pearson Passenger Focus
Liang-Chai Poh University of Cambridge
Ian Shergold University of the West of England
Neil Smith Greater London Authority
Steve Smith Royal Voluntary Service
Benedict Spencer CycleBOOM
Russell Taylor Department for Work and Pensions
Laura Vaughan Street Mobility and Network Accessibility, UCL
Professor Catharine Ward Thompson OPENspace Research Centre (also member of I’DGO)
Simon Wilkinson Department for Work and Pensions
Nicola Woodward Office for Civil Society, Cabinet Office
Professor Ken Worpole Cities Institute, London Metropolitan University

Making our Communities Ready for Ageing I 54
Endnotes
1 ONS (2013). Families and Households, 2013. (http://www.ons.gov.uk/ons/rel/family-demography/families-and-households/2013/stb-families.html#tab-Living-alone)
2 Based on graph from ONS (2013) Families and Households. Source: Labour Force Survey - Office for National Statistics.
3 ONS (2014c) Estimates of the Very Old (including Centenarians) for the United Kingdom, 2002-2014
4 Ipsos Mori (2013) How Britain Voted in 2010. http://www.ipsos-mori.com/researchpublications/researcharchive/2613/How-Britain-Voted-in
5 Gottfried, G., Lodge, G. and Birch, S. (2013) Divided democracy: Political inequality in the UK and why it matters. http://www.ippr.org/publications/divided-democracy-political-inequality-in-the-uk-and-why-it-matters
6 Beech et al (2014) Population Ageing & the Voluntary Sector: Key Figures & Projected Trends http://www.ilcuk.org.uk/index.php/publications/publication_details/population_ageing_the_voluntary_sector_key_figures_projected_trends
7 ONS (2012). Interim 2011-based subnational population projections, persons by single year of age for local authorities in England.
8 ONS (2012). Interim 2011-based subnational population projections, persons by single year of age for local authorities in England.
9 The Office of National Statistics has profiled the changing population by age across the UK with an online map. http://www.ons.gov.uk/ons/interactive/theme-pages-1-2/age-interactive-map.html
10 Council of Mortgage Lenders (2011) First time buyers and affordability: a fresh perspective http://www.cml.org.uk/cml/publications/newsandviews/104/390
11Aldridge, H, Kenway, P and Pannell, J (2012) Affordability of Retirement Housing in the UK. New Policy Institute
12 WRVS (2011) Gold age pensioners: valuing the socio-economic contribution of older people in the UK. http://www.royalvoluntaryservice.org.uk/Uploads/Documents/gold_age_report_2011.pdf
13 ODI Census Data/ DCLG (Annual) Survey of English Housing via Care and Repair England (2014) Ageing Well at Home http://www.careandrepair-england.org.uk/pdf/ageing_well_2014.pdf
14 DCLG (Annual) Survey of English Housing, via Care and Repair England (2013) More than bricks and mortar http://www.careandrepair-england.org.uk/pdf/more_than_bricks_and_mortar_may_2013.pdf
15 DCLG (Annual) Survey of English Housing, via Care and Repair England (2013) More than bricks and mortar http://www.careandrepair-england.org.uk/pdf/more_than_bricks_and_mortar_may_2013.pdf
16 DCLG (Annual) Survey of English Housing, via Care and Repair England (2013) More than bricks and mortar http://www.careandrepair-england.org.uk/pdf/more_than_bricks_and_mortar_may_2013.pdf
17 DCLG (2013) Providing housing support for older and vulnerable people https://www.gov.uk/government/policies/providing-housing-support-for-older-and-vulnerable-people

Making our Communities Ready for Ageing I 55
18 Adams, S. and Ellison, H. (2009) Time to Adapt. Home adaptations for older people: the increase in need and future of state provision. Care and Repair England. http://www.careandrepair-england.org.uk/pdf/time_to_adapt_report.pdf
19 Adams, S. and Ellison, H. (2009) Time to Adapt. Home adaptations for older people: the increase in need and future of state provision. Care and Repair England. http://www.careandrepair-england.org.uk/pdf/time_to_adapt_report.pdf
20 Tanner, B., Tilse, C., & de Jonge, D. (2008). Restoring and sustaining home: The impact of home modifications on the meaning of home for older people. Journal of Housing for the Elderly.22, 195–215.21
21Connell, B. R., Sanford, J. A., Long, R. G., Archea, C. K., & Turner, C. S. (1993). Home modifications and performance of routine household activities by individuals with varying levels of mobility impairments. Technology and Disability, 2, 9–18.
22 Watson S and Crowther L, 2005. Was it worth it? A study into the effectiveness of major adaptations. Nottingham, Nottingham City Council.
23 Home Adaptations Consortium (2013) Home Adaptations for Disabled People: A detailed guide to related legislation, guidance and good practice http://www.careandrepair-england.org.uk/pdf/dfg_good_practice_guide_2013.pdf
24 PPI (2011) Retirement income and assets: the implications of ending the effective requirement to annuitise by age 75. https://www.pensionspolicyinstitute.org.uk/uploaded/documents/2011/20110414_RIA5_-_the_implications_of_ending_the_effective_requirement_to_annuitise_by_age_75.pdf
25 RCN. Telehealth and telecare. https://www.rcn.org.uk/development/practice/e-health/telehealth_and_telecare
26 DCLG (2008) Delivering Lifetime Homes, Lifetime Neighbourhoods: A National Strategy for Housing in an Ageing Society http://webarchive.nationalarchives.gov.uk/20120919132719/http:/www.communities.gov.uk/documents/housing/pdf/deliveringlifetimehomes.pdf
27 http://england.shelter.org.uk/__data/assets/pdf_file/0011/652736/Shelter_Little_Boxes_v4.pdf
28 Taken from http://england.shelter.org.uk/__data/assets/pdf_file/0011/652736/Shelter_Little_Boxes_v4.pdf
29 Dedman, DJ., Gunnell, D., Smith, GD. & Frankel, S. (2001) Childhood housing conditions and later mortality in the Boyd Orr cohort. Journal of Epidemiology and Community Health. (55), p.10-15.
30 Marsh, A. (1999) Home Sweet Home? The Impact of Poor Housing on Health. Bristol: The Policy Press.
31 Office for National Statistics. (2013) Excess Winter Mortality in England and Wales, 2012/2013 (Provisional) and 2011/2012 (Final). London: Office for National Statistics.
32 English Housing Survey Housing Stock Summary statistics 2009, July 2011 http://www.communities.gov.uk/documents/statistics/xls/1937429.xls Table SST3.4
33 Franklin, B. (2014) The Future Care Workforce. http://www.ilcuk.org.uk/index.php/publications/publication_details/the_future_care_workforce
34 Age UK (2014) Care in Crisis: What’s next for social care? http://www.ageuk.org.uk/Documents/EN-GB/Campaigns/CIC/PDF%20Care%20in%20Crisis%20-%20What%20next%20for%20social%20care%202014.pdf?dtrk=true

Making our Communities Ready for Ageing I 56
35 Searle BA (2013) Who owns all the housing wealth? Patterns of inequality in England, Mind the (Housing) Wealth Gap Briefings No 3, Centre for Housing Research, University of St Andrews
36 Tyvimaa, T. (2011) Social and physical environments in senior communities: the Finnish experience. International Journal of Housing Markets and Analysis. 4(3), pp.197-209.
37 Kneale, D. (2011) Establishing the extra in Extra Care, Perspectives from three Extra Care Housing Providers http://www.ilcuk.org.uk/index.php/publications/publication_details/establishing_the_extra_in_extra_care_perspectives_from_three_extra_care_hou
38 Pannell, J., Aldridge, H,. and Kenway, P. (2012) Older People’s housing: choice, quality of life and under-occupation. London: JRF
39 See hanover50debate.org.uk
40 Housing our Ageing Population: Panel for Innovation (2009) HAPPI Report https://www.homesandcommunities.co.uk/sites/default/files/happi_final_report_-_031209.pdf
41 Wood, C. (2013) The Top Of The Ladder. London: Demos.
42 WRVS (2013) Going nowhere fast: Impact of inaccessible public transport on wellbeing and social connectedness of older people in Great Britain http://www.royalvoluntaryservice.org.uk/Uploads/Documents/Reports%20and%20Reviews/Trans%20report_GB_web_v1.pdf
43 Shergold, I., Parkhurst, G., and Musselwhite, C. (2012). Rural car dependence: An emerging barrier to community activity for older people. Transportation Planning and Technology, 35 (1). pp. 69-85.
44 Musselwhite, C. and Haddad, H. (2010). Mobility, accessibility and quality of later life. Quality in Ageing and Older Adults. 11(1), 25-37.
45 See: http://www.slideshare.net/ILC-UK/getting-out-and-about-a-community-matters-seminar-from-ilcuk-and-age-uk
46 WRVS (2013) Going nowhere fast: Impact of inaccessible public transport on wellbeing and social connectedness of older people in Great Britain http://www.royalvoluntaryservice.org.uk/Uploads/Documents/Reports%20and%20Reviews/Trans%20report_GB_web_v1.pdf
47 Musselwhite, C. and Shergold, I. (2012) Examining the process of driving cessation in later life. European Journal of Ageing, 10 (2). pp. 89-100.
48 Data from National Travel Survey 2012, see https://www.gov.uk/government/collections/national-travel-survey-statistics
49 Data from National Travel Survey 2012, see https://www.gov.uk/government/collections/national-travel-survey-statistics
50 DfT (2002, 2006, 2010), see http://www.slideshare.net/ILC-UK/getting-out-and-about-a-community-matters-seminar-from-ilcuk-and-age-uk
51 http://www.theguardian.com/money/2014/jan/10/cost-driving-lessons-insurance-blamed-drop-young-learners-provisional-licence
52 http://www.theatlantic.com/business/archive/2012/07/the-dramatic-30-year-decline-of-young-drivers-in-1-chart/260126/
53 DfT (2002, 2006, 2010), see http://www.slideshare.net/ILC-UK/getting-out-and-about-a-community-matters-seminar-from-ilcuk-and-age-uk
54 http://www.slideshare.net/ILC-UK/getting-out-and-about-a-community-matters-seminar-from-ilcuk-and-age-uk
55 Berry, C (2011) Older drivers and behavioural change. ILC-UK: London http://www.ilcuk.org.

Making our Communities Ready for Ageing I 57
uk/index.php/publications/publication_details/older_drivers_and_behavioural_change
56 http://www.publications.parliament.uk/pa/cm200708/cmselect/cmtran/84/84we26.htm
57 WRVS (2013) Going nowhere fast: Impact of inaccessible public transport on wellbeing and social connectedness of older people in Great Britain http://www.royalvoluntaryservice.org.uk/Uploads/Documents/Reports%20and%20Reviews/Trans%20report_GB_web_v1.pdf
58 pteg (2013) The Case for the Urban Bus – the economic and social benefits of investment in the urban bus http://pteg.net/resources/types/reports/case-urban-bus-economic-and-social-benefits-investing-urban-bus
59 See http://www.itnamerica.org/
60 Buehler, R., Pucher, J. 2012. “Trends in Walking and Cycling in Western Europe and the United States,” TR News. Special Issue on Walking and Cycling, No. 280, pp. 34-42. http://policy.rutgers.edu/faculty/pucher/TRNWesternEurope.pdf
61 http://www.ons.gov.uk/ons/rel/census/2011-census-analysis/cycling-to-work/2011-census-analysis---cycling-to-work.html#tab-Who-cycles-
62 Three million people cycling three times a week or more compared to 741,000 commuting to work by bicycle http://www.ctc.org.uk/resources/ctc-cycling-statistics
63 Pooley, C. et al. (2011) Understanding Walking and Cycling. http://www.its.leeds.ac.uk/fileadmin/user_upload/UWCReportSept2011.pdf
64 IDGO (2007) http://www.idgo.ac.uk/design_guidance/factsheets/Pedestrian_Crossings.htm
65 Department of Health (2009) Falls and fractures: effective interventions in health and social care
66 DfT (Department for Transport) (2010) Public attitudes towards mobility scooters, London:Department for Transport
67 Barham,P., Fereday, D. and Oxley, P. (2006) Review of Class 2 and Class 3 Powered Wheelchairs and Powered Scooters Final Report, Department for Transport
68 Steyn, P. V. and Chan, A. S. (2008) Mobility Scooter Research Project: Final report, Centre for Education and Research on Aging, University College of the Fraser Valley, Canada.
69 http://www.independent.co.uk/life-style/gadgets-and-tech/news/milton-keynes-introducing-driverless-public-transport-pods-by-2017-8925119.html
70Hunskaar, S., Lose, et al. (2003) Prevalence of Stress Urinary Incontinence in Women in Four European Countries, 2002. ICS: UK. http://www.icsoffice.org/publications/2002/pdf/257.pdf
71 http://www.bbc.co.uk/news/uk-wales-26788560
72 http://www.bbc.co.uk/news/uk-wales-26788560
73 BBC (2003). Fear of crime ‘trapping elderly’. http://news.bbc.co.uk/1/hi/uk/3044625.stm
74 White, M.P., Alcock, I., Wheeler B.W. and Depledge, M.H. (2013) Coastal proximity, health and well-being:results from a longitudinal panel survey. Health and Place. 23: pp. 97-103.
75The Urban Green Spaces Taskforce (2002) Green Spaces, Better Places. London: Department of Transport, Local Government and the Regions http://www.ocs.polito.it/biblioteca/verde/taskforce/gspaces_.pdf
76 Parliamentary Written Answer from Parliamentary Under-Secretary of State for Culture, Media and Sport, 19 March 2013. http://www.theyworkforyou.com/wrans/?id=2013-03-19a.147199.h
77 Kneale, D. (2012) Is Social Exclusion still important for Older People? ILC-UK, London. http://www.ilcuk.org.uk/index.php/publications/publication_details/is_social_exclusion_still_

Making our Communities Ready for Ageing I 58
important_for_older_people
78 WRVS (2012) Loneliness amongst older people and the impact of family connections http://www.royalvoluntaryservice.org.uk/our-impact/reports-and-reviews/loneliness-amongst-older-people-and-impact-of-family-connections
79 See RVS (2013) http://www.royalvoluntaryservice.org.uk/news-and-events/news/older-people-isolated-by-lack-of-neighbourly-support----neighbours-hold-the-key-to-combating-chronic-loneliness-in-older-people
80 RIBA (2013) Silver Livings: The Active Third Age and the City. London: RIBA.
81 http://www.pwc.co.uk/retail-consumer/issues/high-street-closures-reach-twenty-a-day.jhtml
82 ONS (2014) Internet Access Quarterly Update, Q4 2013 http://www.ons.gov.uk/ons/dcp171778_353031.pdf
83 WHO. Health economic assessment tool (HEAT) for cycling and walking. http://www.euro.who.int/en/health-topics/environment-and-health/Transport-and-health/activities/guidance-and-tools/health-economic-assessment-tool-heat-for-cycling-and-walking

ILC–UK11 Tufton StreetLondonSW1P 3QBTel : +44 (0) 20 7340 0440
www.ilcuk.org.ukPublished in May 2014 © ILC-UK 2014
Registered Charity Number: 1080496.