Making it Count - Saco, Maine
184
! ! ! !
Transcript of Making it Count - Saco, Maine

!!
!
!

Making it Count: Metrics for High Performing EDOs
February 3, 2014

International Economic Development Council
Making it Count: Metrics for High Performing EDOs
International Economic Development Council
The International Economic Development Council (IEDC) is a non-profit membership organization serving economic developers. With more than 4,000 members, IEDC is the largest organization of its kind. Economic developers promote economic well-being and quality of life for their communities, by creating, retaining and expanding jobs that facilitate growth, enhance wealth and provide a stable tax base. From public to private, rural to urban, and local to international, IEDC’s members are engaged in the full range of economic development experience. Given the breadth of economic development work, our members are employed in a wide variety of settings including local, state, provincial and federal governments, public private partnerships, chambers of commerce, universities and a variety of other institutions. When we succeed, our members create high-quality jobs, develop vibrant communities, and improve the quality of life in their regions.
www.iedconline.org
Bill Sproull, FM President and CEO, Richardson Chamber of Commerce Chairman of the Board Paul Krutko, FM President and CEO, Ann Arbor SPARK Immediate Past Chair of the Board Jeffrey A. Finkle, CEcD President and CEO International Economic Development Council
Copyright 2014 International Economic Development Council

International Economic Development Council
Making it Count: Metrics for High Performing EDOs
Primary Authors Swati Ghosh
Jess Chen
Contributing Authors and Research Support Aaron Chafetz
Frankie Clogston Mishka Parkins
Kristina Pecorelli David Lai
Editor Tye Libby
Graphics Support Mishka Parkins

International Economic Development Council
Making it Count: Metrics for High Performing EDOs
Economic Development Research Partners (EDRP) The EDRP Program is the “think tank” component of IEDC, designed to help economic development professionals weather the challenges and grab opportunities from economic changes affecting our communities. EDRP members are leaders in the field of economic development, working through this program to improve the knowledge and practice of the profession.
Amarillo Economic Development Corporation
American Electric Power
Ann Arbor SPARK
Baltimore County Department of Economic Development
BNSF Railway Company
Brick City
Buffalo Niagara Enterprise
Camoin Associates
CDC Small Business Finance Corp.
Cedar Rapids Metro Economic Alliance
Charlotte Regional Partnership
Choose New Jersey
City of Austin - Economic Growth and Redevelopment Services Office
City of Cedar Hill Economic Development Corporation
Columbus 2020!
Frisco Economic Development Corporation
Georgia Tech Enterprise Innovation Institute
Greater Fort Lauderdale Alliance
Greater Houston Partnership
Greater MSP
Greater New Braunfels Chamber of Commerce
Greater Oklahoma City
Greater Richmond Partnership, Inc.
Greater Wichita Economic Development Coalition
Greater Yuma Economic Development Corporation
Invest Atlanta
JumpStart
Lake Superior Community Partnership
Lincoln Economic Development Association
Longview Economic Development Corporation
Los Angeles County Economic Development Corporation
Louisiana Department of Economic Development
Lubbock Economic Development Alliance
Metro Orlando Economic Development Commission
Michigan Economic Development Corporation
Midland Tomorrow
Mississippi Manufacturers Association
Nashville Area Chamber of Commerce
New Orleans Business Alliance
North Carolina's Eastern Region
North Louisiana Economic Partnership
Oakland County Executive Office
Oklahoma Department of Commerce Office
Richardson Economic Development Partnership
Saginaw Future Inc.
St. Louis Economic Development Partnership
Southwest Michigan First
St. Louis Regional Chamber & Growth Association
The Right Place, Inc.
Towson University
Tulsa Regional Chamber
York County Economic Alliance

International Economic Development Council
Making it Count: Metrics for High Performing EDOs
Acknowledgments This project was a massive undertaking for IEDC and EDRP. With a project timeline spanning nearly two years, a number of people contributed time, expertise and support to the development of this study.
The Economic Development Research Partners (EDRP) program provided the impetus and resources for this project. Several EDRP members reviewed portions of the research along the way and we would like to thank all of them. In particular, we thank the Metrics Task Force for their time and guidance in the report’s development. Many thanks to:
• Tim Chase, CEcD, FM, Greater Wichita Economic Development Coalition (Co-Chair) • Dan Gundersen, Econsult Solutions (Co-Chair) • Allison Thompson, CEcD, EDFP, City of Cedar Hill Economic Development
Corporation • Greg Wingfield, Greater Richmond Partnership, Inc. • Jim Damicis, Camoin Associates • Jay Moon, CEcD, FM, Mississippi Manufacturers Association
We would also like to acknowledge Janet Hammer, Portland State University, who helped in the design of the survey methodology, a cornerstone of this project. Thank you to Liz Thorstensen who also helped shape the project research methodology while she was on staff at IEDC as VP of Knowledge Management and Development.
Several economic development professionals participated in focus groups during IEDC conferences and EDRP retreats and provided insights into their own organization’s performance measurement systems. Although too numerous to be thanked individually, we recognize that this paper would be incomplete without their contributions. We would also like to acknowledge the moderators and facilitators for these sessions: Gene Deprez, Maury Forman and Dino Signore, PhD.
Lastly, we would like to thank Jeffrey Finkle, CEcD, IEDC’s President and CEO, for his support throughout this project.
International Economic Development Council
Making it Count: Metrics for High Performing EDOs i
Table of Contents
Part I: Guidebook .................................................................................................... 1
Introduction ....................................................................................................................................................... 2 Methodology ...................................................................................................................................................... 5 Overview of Survey Results ......................................................................................................................... 6 Metrics for High Performing EDOs – A Menu of Options ................................................................. 9 Tracking Important but Uncommon Metrics ........................................................................................ 12 Recommendations on Adopting Metrics ............................................................................................... 17
Part II: A Menu of Options ................................................................................... 19
Part III: Case Studies ............................................................................................ 44
Virginia Performs .......................................................................................................................................... 45 Government of South Australia ............................................................................................................... 47 Southwest Michigan First .......................................................................................................................... 49 Women’s Initiative ..........................................................................................................................................51 City of Fort Collins, Colorado .................................................................................................................... 52 New York City Economic Development Corporation (NYCEDC) .............................................. 54 Yates County, New York ............................................................................................................................ 55
Part IV: Metrics Research and Analysis .............................................................. 57
Literature Review .......................................................................................................................................... 58 New Approaches to Performance Measurement ............................................................................. 79 Detailed Survey Results............................................................................................................................. 102 Tools and Resources .................................................................................................................................. 174

Part I: Guidebook
International Economic Development Council

International Economic Development Council
Making it Count: Metrics for High Performing EDOs 2
Introduction
"That which is measured improves. That which is measured and reported improves exponentially.”
- Karl Pearson
Economic development organizations (EDOs) understand how important it is to measure performance. First, measuring performance helps economic developers ensure that they are spending their time on high-value activities (accountability to self, organization, and board of directors or elected officials) and second, it helps funders of EDOs and economic development activities—primarily governments and businesses—know what they are receiving in return for their investment.
Nearly two-thirds of EDOs in the U.S. evaluate their performance on a regular basis (discussed in more detail later); and, most of them use at least four variables that have emerged as the key metrics of measuring economic development success: job creation, capital investment, changes in tax base, and personal income. These metrics are consistently and widely used—in urban and rural communities; city, state, and national organizations; public agencies and public-private partnerships—and irrespective of the local industries or local economic mix.
Although these metrics have roots in business attraction, EDOs have come to use them to measure performance in vastly different economic development functions, from entrepreneurship, to workforce development, and a whole host of other functions. As the profession evolves and moves beyond a myopic focus on business attraction, the metrics have remained largely unchanged. Many EDOs continue using these metrics as a statutory requirement, while others are required to use certain metrics by elected officials or a board of directors. Still, others may not know of better metrics to use, and some may find it daunting to move away from measures that they have become comfortable using over decades. Ultimately, traditional economic development metrics are not fully aligned with the work of economic developers today.
Performance measurement is more complex and difficult in economic development than in many other fields. While economic developers play critical roles in the health of their communities’ economies, the results of their efforts often are not immediate or may appear disconnected from their efforts. Much of their high-value work involves building relationships and making connections, and this work may not pay off for months or even years. In addition, much of their impact is influenced by market, demographic, and other forces outside of their control. These are some reasons for continued use of old economic development metrics.
Economic developers have received criticism in recent years for inadequately tracking and measuring their performance. In December 2012, the New York Times published a series of

International Economic Development Council
Making it Count: Metrics for High Performing EDOs 3
articles that were critical of economic developers (and elected officials) for wastefully spending taxpayer money through business incentives when the linkage between such practices and benefits to the communities is not well established. Although the series was focused on the use of incentives as a practice, one of the key issues raised was the lack of measurement among organizations responsible for providing incentives, including EDOs.
There are some signs of progress, though. EDOs are beginning to adopt more nuanced metrics, which are better aligned with their myriad functions, with the aim of measuring performance both qualitatively and quantitatively. These include metrics related to people- or place-based goals, such as job quality (e.g., wage levels, benefits), type of investment (e.g., redevelopment versus greenfield development, or the revitalization of a distressed area), or environmental sustainability (e.g., green building).
It is also widely accepted that current metrics are going to continue to be used at least in the near future. Yet, the need for further research on this topic is undeniable in order to devise improved metrics that help EDOs better measure their performance. This research project, which is funded and guided by IEDC’s Economic Development Research Partners (EDRP) program, is a step in that direction. It is part of a series of research papers—themed Adapting and Thriving: New Realities for Economic Development Organizations—that focus on the issues and challenges facing EDOs and their responses. Other papers in the series are available for download from the IEDC website (www.iedconline.org).
It is important to note that this research focuses on measuring organizational performance and not individual projects that EDOs undertake.
The purpose of this research project is two-fold.
1. Provide a comprehensive list of metrics that EDOs can choose from. All research conducted during this project has been distilled into an easy-to-use “menu” of economic development metrics that EDOs can utilize according to their mission, functions, goals and objectives, scope of work, and resources available. The menu can be especially useful for EDOs that do not currently track performance, yet the vast majority of EDOs that do measure performance in some fashion can use this as an opportunity to revisit their performance tracking systems and revise as necessary.
2. Propose new metrics that EDOs should start using in order to accurately measure their performance and report results to investors and decision-makers.
Performance Measurement Approaches in Economic Development
Typically EDOs, like most nonprofits, use the logic model of performance measurement. According to this model, metrics can be categorized in four different ways, as defined by Harry Hatry.
• Inputs – “Resources such as money, staff time, and other items used to produce outputs and outcomes. Inputs indicate the amount of a particular resource that is actually used to produce a desired result.”

International Economic Development Council
Making it Count: Metrics for High Performing EDOs 4
• Activities – “The actions a program takes to achieve a particular result.”
• Outputs – “The amounts of products created and services delivered in a reported period, such as number of training programs conducted, number of classes taught, or number of clients served.”
• Outcomes – “Changes in knowledge, skills, attitudes, values, behavior, or conditions that indicate progress toward achieving the program’s mission and objectives. Outcomes are linked to a program’s overall mission.”
Hatry places an emphasis on the fourth category, “outcomes,” which he says are most important because, “Outcomes are not what the program itself did but the consequences of what the program did.”1
A significant number of EDOs, it appears, use output metrics. It is partly due to the ease with which outputs can be measured, especially in a profession like economic development, and partly due to the lack of proven causal relationships between economic development efforts and the final outcomes, even though it is clear that EDOs play a significant role in those outcomes.
Another approach that businesses commonly use but that is also becoming popular among EDOs is the Balanced Scorecard. It is a framework for evaluating metrics for both financial and operational performance that includes evaluating an organization’s ability to create value moving ahead.2 The “balanced scorecard” was developed with the purpose of “focus(ing) the attention of a company’s top executives on a short list of critical indicators of current and future performance.” The model outlines four perspectives that answer four key questions. Their “innovation perspective and learning perspective” is what they call the “driver of future performance.”3
• Customer perspective – How do customers see us?
• Internal business perspective – What must we excel at?
• Innovation and learning perspective – Can we continue to improve and create value?
• Financial perspective – How do we look to shareholders?
The Charlotte Regional Partnership is often cited as one of the best examples of EDOs utilizing the balanced scorecard approach. Some state EDOs have also experimented with this, such as the Pennsylvania Department of Community and Economic Development.
Other models for performance measurement, though some not as not common among EDOs, include the Base of the Pyramid Model, Corporate Social Performance metrics, Malcolm Baldridge Assessment, Key Performance Indicators, and SWOT analysis (strengths, weaknesses, opportunities, and threats). Each of these models is discussed in
1 Warren, John. (May 2005). The Role of Performance Measurement in Economic Development. Retrieved from Angelou Economics website: http://www.angeloueconomics.com/measuring_ed.html 2 Kaplan, R. , & Norton, D. (2005). The balanced scorecard: Measures that drive performance. Harvard Business Review, 83(7/8), 172-180. Reprint of 1992 article in same journal. Retrieved from: http://hbr.org/2005/07/the-balanced-scorecard-measures-that-drive-performance/ar/1 3 Kaplan and Norton, p. 174.

International Economic Development Council
Making it Count: Metrics for High Performing EDOs 5
more detail in the literature review; please refer to the Metrics Research and Analysis section of the report.
Collectively, recent attempts at designing improved EDO performance measures have focused on more nuanced measurement systems that consider and capture the following.
• Consequences/Feedback – Measures that consider the effects on an organization in terms of use of resources to both develop and excel under new performance measurement system
• Meaningful Benchmarks – Measures that provide for comparisons over time or across cases (i.e., that are longitudinal and/or cross-sectional)
• Actionable Items – Measures of outcomes, not just outputs; measures that are not just retrospective but prospective
• Qualitative Outcomes – Measures that account for value brought to an organization in ways that are not easily quantified, including capacity-building in the workforce and industry and relationship building.
These guiding principles are reflected in the proposed metrics.
Methodology
The main findings and recommendations in this report were informed by a comprehensive survey of EDOs and economic development professionals from around the country and abroad. The survey aimed to collect two types of information on over 200 different metrics used by EDOs.
• Is it used by the responding EDO?
• How important is the metric in accurately measuring EDO performance?
The survey was conducted from April to June 2013, and it was sent to nearly 30,000 contacts in the IEDC database (members and non-members included). It was promoted at IEDC events and through social media during that time period. Over 500 responses were gathered.
A considerable amount of research went into the development of this comprehensive survey, including:
• A literature review of performance measurement, especially pertaining to economic development;
• Research on different methodologies for performance measurement;
• Data collection on metrics used by different types of EDOs from across the country, which was analyzed to determine the commonalities and differences between different approaches and metrics; and,

International Economic Development Council
Making it Count: Metrics for High Performing EDOs 6
• Facilitated group discussions on various metrics topics at several IEDC events, including IEDC conferences and the EDRP Retreats at the Edward Lowe Foundation.
The usage and importance ratings formed the basis for the development of a “menu” of economic development metrics from which EDOs can choose. The menu offers metrics—organized by EDO functions—that can be customized based on EDO resources, mission, and scope of work. Each metric received an average importance rating, which was then used to rank the metrics by their relative importance in measuring performance for each function. Across the board, the top third most important metrics are considered “Core” metrics, the second third are considered “Important,” and the bottom third are considered “Bonus.”
Two types of metrics need special attention:
1. Uncommon but important metrics, which were ranked highly in importance but are not frequently used by EDOs.
2. Fringe metrics, which were gathered from survey responses to open-ended questions about other metrics that EDOs use.
In addition, IEDC assembled a Metrics Taskforce—comprised of EDRP members—to serve as an expert body for reviewing and guiding the development of the final menu. Where the survey data provided insufficient insight into a specific metric or EDO function, the taskforce served as the decision-making body on the metrics to be recommended for use.
Two exceptions to this general approach are the sustainability metrics and those pertaining to the environment. Survey responses were insufficient for categorizing metrics by importance and usage for these sets. Therefore, these metrics are listed along with fringe metrics.
The report is divided into four parts. The first part is the guidebook, which includes the research highlights and recommendations on EDO performance measurement. The menu of economic development metrics is covered in Part II alongside possible data sources that can be used to obtain information on various sets of metrics. Part III highlights several EDOs as examples to showcase best practices in performance measurement in economic development and how other EDOs can emulate these best practices. Part IV—Metrics Research and Analysis—includes the literature review, detailed survey results, a summary of performance measurement approaches, and resources for further study.
Overview of Survey Results
The survey gathered input from several different types of economic development professionals and organizations representing eight countries, 47 states, 380 cities, 145

International Economic Development Council
Making it Count: Metrics for High Performing EDOs 7
private EDOs, 84 public-private partnerships, and 26 consultants. Detailed survey results can be found in Part IV of the report.
Over 30 percent of EDOs do not measure performance regularly.
One of the most interesting findings of the survey is that nearly one-third of the respondents do not measure their performance at all or on a regular basis. These “non-trackers” share several common traits.
• Non-trackers are more frequently government agencies or community/neighborhood EDOs.
• Over 50 percent of local (city-level) EDOs do not track performance. Approximately 20 to 30 percent of county and regional EDOs do not track performance.
• Organizational structure does not impact the chances of an EDO measuring its performance. Roughly the same percent (20-25 percent) of EDOs across different organizational structures do not track metrics: public, private non-profit, private for-profit, and public-private partnerships.
• Non-trackers are more prevalent among smaller communities.
Over 80 percent of non-trackers have considered tracking metrics at some point. This suggests that a significant number of EDOs face barriers that they are unable to overcome in order to regularly monitor their performance. Some of these barriers include disagreement over what metrics to use, a lack of understanding about how metrics relate to performance, a lack of resources, and difficulty in obtaining data.
The existence of an organizational strategic plan is a key determining factor in whether an organization measures performance.
The vast majority of EDOs track their performance on a regular basis, and the single largest guiding factor in performance monitoring is a strategic plan. Over 80 percent of organizations that track performance have a strategic plan. Almost 70 percent of these plans include guidelines for measuring performance. A strategic plan provides the framework for overall performance measurement and sometimes even specifies certain metrics to be used.
Among organizations that do not have a strategic plan, only 40 percent monitor performance regularly. Other common attributes of “trackers” are as follows.
• EDOs use metrics to track their own progress over time as well as for goal setting and assessing the effectiveness of programs and services. Some organizations are motivated by funding or budget reasons, while others utilize the data for staffing purposes, too. Organizations also frequently use metrics for benchmarking their performance against other similar organizations.
• Most organizations report monthly to internal stakeholders and annually to external stakeholders.

International Economic Development Council
Making it Count: Metrics for High Performing EDOs 8
• Business leaders and elected officials are the most influential voices in deciding which metrics EDOs will use. Other EDOs, civic organizations, and educational leaders are sometimes involved in decision-making as well.
• Most organizations use internally generated data (surveys, interviews, focus groups, etc.) or freely available public data.
We live by jobs, we die by jobs, and that is a problem.
A premise at the beginning of this research was the ubiquity of “jobs” (created, attracted, retained, and other variations thereof) as a metric for measuring organizational and programmatic success among EDOs. Although the survey corroborates the notion, several respondents point to the problems of relying on different job measurements as the most important metric.
• Jobs created may not reflect new jobs open to new employees. Instead, the measure may reflect a shifting of jobs within a community.
• Target job creation may not come to fruition until after the performance measurement period since projects take time to ramp up.
• Job creation may be difficult to track because companies do not always release salary information or statistics on the number of jobs created.
• It is difficult to estimate indirect job creation, with some organizations choosing not to cite this measure rather than providing an ambiguous estimate.
• Some organizations believe job creation is a function of employer decisions and market conditions—like price, product quality, and innovation—and is thus outside of the purview of economic development. Instead, these organizations track their influence on business decisions.
Performance measurement is not for the faint of the heart.
Organizations that track their performance regularly expend significant resources in data collection and monitoring. They face many challenges, including:
• A lack of accurate and timely data. Sometimes the data is not granular enough to effectively pinpoint the work that EDOs have done.
• Stakeholders’ misinterpretation of the data. EDOs oftentimes struggle with demonstrating value and return on investment without inappropriately taking credit for successes and misrepresenting data. At the same time, some feel pressured to show “big wins” to investors and decision-makers, lest they are not interested in funding economic development activities.
• Inconsistent metrics that can complicate performance measurement over time and across programs/projects.
• A lack of time and budget resources needed to collect useful data. EDOs that collect data through surveys of local companies may struggle to gather responses due to either a lack of time or confidentiality concerns.
• A desire among many EDOs and stakeholders to quantify everything, when quantitative data alone is insufficient to effectively capture the full range of an EDO’s efforts.

International Economic Development Council
Making it Count: Metrics for High Performing EDOs 9
• A lack of a standardized reporting system that makes it difficult to select appropriate metrics. This is especially challenging for newer and smaller EDOs.
• The need to devise metrics for areas that EDOs are starting to work in, such as sustainability.
For more details on characteristics of trackers and non-trackers as well as results on individual metrics, please refer to Section Four: Metrics Research and Analysis.
Metrics for High Performing EDOs – A Menu of Options
All of the research gathered and knowledge gained during this project has been distilled into an easy-to-use “menu” of economic development metrics. The menu includes almost 300 metrics. While this may seem like a very large number, it does not capture the universe of metrics EDOs use (and can use) to measure their performance. It does, however, offer a group pf metrics that professionals and experts in the field believe to be the most important ones to measure. Economic developers can choose metrics for their organization from this menu based on their specific mission, functions, scope of work, and available resources. They can also supplement these metrics with additional metrics that better reflect the work they perform.
The menu is organized into four segments. The:
1. Internal Segment measures activities that help an EDO conduct the business of the organization (irrespective of specific programs and functions).
2. ED Program Segment helps EDOs measure the performance of its economic-development-related functions. As such, there are several “sets” of metrics based on specific ED programs.
a. Business Attraction and Marketing Set b. Business Creation and Entrepreneurship Set c. Business Retention and Expansion Set d. Technology and Innovation Set e. Real Estate: Industrial Use Set f. Sustainable Development & Green Jobs Set
3. Relationship Management Segment measures EDOs’ efforts made to build and strengthen relationships with internal and external stakeholders. The vast majority of EDOs currently do not use these metrics. Sets of metrics in this segment are based on the type of stakeholder/relationship.
a. EDO Leadership Set b. Relationships Established Set c. Communications Set d. Client Satisfaction Set
4. Community Segment measures the community’s well-being. EDOs may only have limited control over this measure, but many EDOs track it in order to help

International Economic Development Council
Making it Count: Metrics for High Performing EDOs 10
understand the community’s needs. Metrics sets cover different aspects of community well-being, including the following.
a. Demographic Makeup Set b. Business Related Factors Set c. Real Estate: Housing Set d. Quality of Life Set e. Transportation and Public Transit Set f. Trade and Tourism Set g. Environment Set
Metrics in each set are grouped into four main categories:
1. Core Metrics are the most basic metrics that must be used for measuring performance in any given area.
2. Important Metrics form the second tier of metrics and should ideally be used for a comprehensive performance examination in the functional area. These will require more resources and may not be possible for smaller EDOs or those with fewer resources.
3. Bonus Metrics include other metrics that are not considered essential, but they may apply to some EDOs depending on the scope, vision, and mission of the organization.
4. Fringe Metrics capture a number of other metrics that survey respondents recommended. These metrics do not have supporting data like the other three categories. These are likely to be relevant to a very small number of EDOs.
Below is an example of a set of metrics from the menu.
Reliable and Accurate Data is Crucial
The vast majority of data that EDOs use is available publicly and for free. A significant portion of this data is provided through federal or state governmental agencies, though

International Economic Development Council
Making it Count: Metrics for High Performing EDOs 11
communities generate data locally as well. Yet, knowing which sources to use for any particular type of information can be tricky. Therefore, references to a number of possible data sources are included for several sets of metrics. These are mentioned at the bottom of each set.
EDOs also generate a huge amount of data that complements publicly available data. Typically, qualitative information must be actively gathered at the local level. To effectively measure EDO performance, EDOs need to use a combination of public, proprietary, and self-generated data for both quantitative and qualitative measurement.
Special Note about Relationship Management Metrics
So much of what EDOs do today is geared towards building and cultivating relationships with local, regional, state, national, and international partners. EDOs can expand their services and products dramatically through their networks. Yet, very few EDOs actively monitor their performance on developing and nurturing relations, both internally (within the organization) and externally (with other stakeholders and partners).
Consequently, this relationship management will be a new category of metrics for most EDOs. It is as important to measure performance in this area as any other program or functional area of economic development.
What this menu is:
• Starter Guide: This menu serves as a starter guide for EDOs that do not regularly measure performance but wish to start doing so. The menu can help suggest important metrics to track based on the EDO’s mission, functions, and resources.
• Benchmarking: This menu helps EDOs that already track performance compare their metrics against a standard set of metrics that is ranked in importance by peers across the country.
• New Metrics: Intensive research went into producing this menu, which may include new metrics and approaches that can help EDOs refine their performance measurement.
What this menu is not:
• This menu is not exhaustive. While every attempt has been made to gather all metrics EDOs currently use, it is nearly impossible to capture all metrics in existence. EDOs may need to devise additional metrics to fully encompass their mission and programs.
• The menu does not replace strategic plans. It can, however, supplement the performance measurement sections of EDO strategic plans.
• The menu does not offer guidance on how to measure performance. The menu provides the metrics themselves but not how to track them. The methodology behind most metrics is left to the EDO. However, the guidebook offers detailed insights into specific metrics in addition to overall guidance on performance measurement.
• The menu is a prototype, not a definitive guide. The menu is the result of IEDC’s first research project on a long-discussed topic. This is the beginning of the conversation. The recommendations will evolve as EDOs continue to adopt these metrics and as the practice of economic development changes.

International Economic Development Council
Making it Count: Metrics for High Performing EDOs 12
Tracking Important but Uncommon Metrics
The survey provided a set of metrics that were rated highly in importance but low in regard to how commonly EDOs used them. Low usage can be indicative of several challenges, including a lack of adequate data, expensive data, a lack of knowledge on how to properly measure such performance, and even an EDO being unaware that it should be measuring such activity. These metrics are highlighted by an asterisk (*) sign next to them on the menu.
The table below lists these uncommon but important metrics.
Internal Measures • Level of EDO employee satisfaction
• Diversification of funding sources (ratio of investors to total funds)
EDO Program Measures
• Impact on employment by industry/sector due to EDO efforts
• Cost-benefit analysis of proposed projects (cost to the community vs. the benefits)
• Internal rate of return for projects (especially real estate projects)
Relationship Management Measures
• Effectiveness of EDO board to remove barriers to economic development progress (e.g., engaging in local and state policy development related to economic development)
• Depth of involvement with each partner (heavy, medium, light)
Community Indicators
• Job openings per sector
• Talent Movement (jobs filled by college graduates in the community)
• Educational opportunities for entrepreneurs (number and variety of programs offered)
• Labor force productivity (value added per employee)
• Ratio of housing price to income
• Access to broadband internet
• Percent of locally owned businesses
• Exports (amount and/or growth) and trade activity
• Improvement in region’s “competitive position” in the global economy
• Branding the region to generate more business development opportunities
• Percent of globally connected entrepreneurs in the community

International Economic Development Council
Making it Count: Metrics for High Performing EDOs 13
Although these are not commonly used metrics among EDOs, several of them can be integrated into current performance measurement systems relatively easily. EDOs that indicated using these metrics were interviewed to gather information on how other EDOs can adopt these metrics. Below are the recommendations for these metrics.
Internal Segment
Level of EDO employee satisfaction
• Conduct a semi-annual employee engagement survey and a semi-annual stakeholder satisfaction survey using survey software such as SurveyMonkey.
• Hold a personal performance plan feedback session that provides the employee with an opportunity to tell the boss what they like and do not like about work.
• Conduct customer surveys with a question like: “Has an employee ever told you they do not like working for the ____EDO?”
• Recently, a governor implemented a statewide initiative to seek employee feedback on how to create a more engaged and effective work environment. An EDO that participated in this survey found areas of needed improvement that were added to its metrics scorecard.
Diversification of funding sources (ratio of investors to total funds)
• Annually report on the percent of total funding from public (city and county), private (local businesses), rent revenues (e.g., business incubator in a building owned by the city), and other sources (grants, sale of assets, etc.) .
• Calculate the percent of the operating budget that comes from public sources versus private sources. For capital projects, calculate the sources of private funds by sector, size of firm, and geographic location.
EDO Program Segment: Business Attraction & Marketing Set
Impact on employment by industry/sector due to EDO efforts
• Use a worker training program and measure if the employee received higher wages after receiving the training.
• EDOs can use technology and software to assist in these efforts. Two more commonly used kinds of software are customer relationship management (CRM) software and software for tracking economic impacts of projects. This must be done on a monthly and annual basis.
• Track the number of jobs from several sources, but count only those for which EDO provided some support (e.g., incentive package development and approval by elected officials, referrals for services, mentoring, licensing and permitting guidance, site selection, tech transfer from the regional federal lab, etc.). Count actual and promised jobs per application for incentives.
• At the end of each year, ask local businesses to provide their current headcount and any anticipated changes in the new year. This helps track job growth in the county as a whole and among businesses with which the EDO has worked. This

International Economic Development Council
Making it Count: Metrics for High Performing EDOs 14
would be difficult in large communities, so it could be narrowed down to certain job sectors.
Cost-benefit analysis of proposed projects (cost to community vs. benefit to the community)
• Local grant applications require applicants to state the total cost of proposed projects (cost to community) and the number of jobs created (benefit to community).
• Use an economic impact model that includes input (jobs and average wages, taxable real estate and personal property investment). It calculates the community economic impact of the direct and indirect jobs. This helps to justify incentive packages.
• If an EDO is having difficulty obtaining cost figures from a project, an expert in the industry’s finances can be brought in to help. This is not an easy undertaking, but it can be done.
EDO Program Segment: Real Estate & Industrial Use Set
Internal rate of return for projects
• Selected incentives projects are analyzed using the state’s resource allocation model to determine the potential return on investment.
• Calculate internal rate of return from the company’s cash flow models.
Relationship Management Segment: EDO Leadership Set
Effectiveness of EDO board to remove barriers to economic development progress (e.g., engaging in local and state policy development related to economic development)
• Measure lobbying activities at the local, county, and state levels.
• Measure the organization’s participation on any task forces dealing with policy recommendations or testimony before a legislative committee prior to a session. Count the number of member correspondences with elected officials on a specific issue and then the result of issue/policy.
Relationship Management Segment: Relationships Established Set
• Measure the depth of involvement with each partner (heavy, medium, light).
• Tailor-make return on investment for different groups of “investors” (i.e., bankers, realtors, etc.).
• Keep track of participation and involvement of partners at EDO committees, events board meetings, etc.

International Economic Development Council
Making it Count: Metrics for High Performing EDOs 15
Community Segment: Demographic Makeup Set
Job openings per sector
• Leverage external sites for this data (e.g., federal sites such as the Bureau of Labor Statistics).
• Several states maintain such data that EDOs can access.
• Use third-party sites such as Indeed.com to research job advertisements/openings. For example, in one community 70 percent of the advertised jobs on Indeed.com were in healthcare.
Talent Movement (jobs filled by college graduates in the community)
• Use third-party sites like LinkedIn to track movement of workers.
• Survey local real estate brokers.
• Colleges track placement and usually have forwarding addresses that provide geographic dispersion data.
Educational opportunities for entrepreneurs (number and variety of programs offered)
• Track attendance, scope and other metrics at EDO-sponsored programs or events for entrepreneurs.
• Sometimes Small Business Development Centers, technology incubators, or the state government may track these metrics.
Community Segment: Business Related Factors Set
Labor force productivity (value added per employee)
• Use third-party sites like the conference board (http://www.conference-board.org/data/economydatabase/).
• Calculate this as a simple ratio of GDP-to-employment. Analyze it by sector over time to get a picture of the relative strength of local economic sectors.
• Partner with universities to obtain this data, as more nuanced measures can become complicated.
Community Segment: Real Estate & Housing Set
Ratio of housing price to income
• Use federal data such as from the U.S. Census Bureau’s American Community Survey on income and housing costs.
• Use third-party data such as annual demographic reports (http://www.demographia.com/).

International Economic Development Council
Making it Count: Metrics for High Performing EDOs 16
Community Segment: Quality of Life Set
Access to broadband internet
• Use state data sources such as: http://broadband.mt.gov and http://broadband.maryland.gov/map.html.
• Use federal data such as: http://www.broadbandmap.gov/technology.
Percent of locally owned businesses
• Collect the addresses of owners listed on local business licenses.
Community Segment: Trade & Tourism Set
Exports (amount and/or growth) and trade activity
• Data is available through state offices, such as http://businessresources.mt.gov/TIR/default.mcpx.
• Use federal resources such as the International Trade Administration for trade statistics.
• Specifically look at the activity at local ports.
• Use economic models such as the input-output model.
• Survey companies that received assistance on their export value from the EDO (increased dollar amount of export sales).
Improvement in region’s “competitive position” in the global economy
• Use global rankings such as KPMG’s index (http://www.competitivealternatives.com/), rankings by Site Selection Magazine, Forbes, CNN, CNBC, Business Facilities, etc.
• Use regional Federal Reserve data: http://research.stlouisfed.org/fred2/categories/3008.
Branding the region to generate more business development opportunities
• Track state and regional marketing and advertising initiatives by other organizations. Keep up to date on their latest campaigns and opportunities for collaboration on marketing.
• Partner with tourism agencies to collect this data.
• Conduct surveys pre- and post-campaign to demonstrate the impact the marketing campaign had on building more interest in the region.
Percent of globally connected entrepreneurs in the community
• Use third-party resources like Startup Genome (http://www.startupgenome.com/) and other startup directories.
• Survey businesses that are engaged in global trade.

International Economic Development Council
Making it Count: Metrics for High Performing EDOs 17
Recommendations on Adopting Metrics
“If you don’t know where you are going, any road will take you there.” – Lewis Carroll
Simply picking metrics from the menu will not help EDOs effectively measure their performance or improve their work. Performance measurement is a combination of using correct metrics, collecting the right data, and understanding how the variables interact with each other to provide insights into the EDO’s impact on the community. EDOs must carefully select metrics based on a complete understanding of their mission, functions and resources.
Below are general recommendations for all EDOs regarding performance measurement.
Start with a strategic plan
Metrics can serve as road signs, but a strategic plan is the map. An economic development strategic plan can provide the impetus to establish a robust performance measurement system as well as guidance on how it should be implemented.
Start small
Not all EDOs have the resources, both in staff time and budget, to track every single metric in this menu. Neither does it make sense to use a lot of metrics. What is important is to make sure that the metrics align closely with the EDO’s work and to collect the right data and information for each of the selected metrics. Start with the core measures. Add more metrics over time as it becomes clearer how performance measurement fits in with the EDO’s work.
Assign someone to each metric
Assigning responsibility for specific metrics to EDO staff helps to establish an environment of shared accountability across the entire organization. It also helps to ensure that the tasks required to be completed for a particular metric get done.
Get buy-in from the top
Whether it is a board of directors, city council, or other governing committee, it is important to have full leadership support in deciding how performance measurement should be done. This way, leadership will also be accountable for monitoring performance.

International Economic Development Council
Making it Count: Metrics for High Performing EDOs 18
Make some metrics temporary
EDOs may sometimes want to select a set of metrics only for a defined period of time, such as for special projects. It can also be a useful strategy to test a new metrics and understand the kind of insights they provide.
Do not just add to the list
Just as metrics should be added over time if needed, make sure to remove metrics when they are no longer relevant. Unwieldy measurement systems require more resources to maintain and may prove to be a detriment to the overall health of an organization rather than a tool to improve performance.
Take credit responsibly
EDOs should use sound judgment when taking credit for an activity. Metrics should reflect the work that EDOs actually do, not outcomes outside of their control.

International Economic Development Council
Part II: A Menu of Options

International Economic Development Council
Important Notes on the Metrics MenuFor details on the methodology used in the development of the menu, please refer to the metrics guidebook.
Three important items are highlighted in each set of metrics:
01. The “uncommon but important” metrics. These metrics are rated important by respondents to the survey, but are less frequently tracked. 02. New metrics - metrics that were not included in IEDC’s original survey but have emerged from additional research as the project progressed. These are marked in a special section titled “New Metrics” within each set. 03. Each set in the ED Programs and Community segments includes a list of resources for collecting data pertaining to those metrics. Resources include sources for proprietary and publicly available free data. Internal and Relationship Management sections mostly require internal data to be developed.
The Metrics Menu is a guide for EDOs to choose metrics from a range of di�erent types of measures to evaluate their performance. The metrics that an EDO chooses will depend on its functions, scope, mission, and resources available. EDOs should pick metrics from each of the four main sections of the menu and the applicable sets of metrics.
Within each set, the metrics are ranked in order of importance:
CORE METRICS
“Core Metrics” include the core or basic metrics that must be used for measuring performance in any given area.
!
IMPORTANT METRICS
“Important Metrics” include the second tier of metrics ideally should be used for comprehensive examination of performance. These will require more resources and may not be possible for smaller EDOs or those with fewer resources.
BONUSMETRICS
“Bonus Metrics” include other metrics that are not considered essential, but may apply to some EDOs depending on the scope, vision, and mission of the organization.

International Economic Development Council
Internal SegmentMeasure activities that help an EDO conduct the business of the organization (irrespective of specific programs and functions).
ED Programs SegmentHelp EDOs measure performance on its economic development related functions. As such, there are several lists of metrics based on specific ED programs.
Relationship ManagementSegment Measure e�orts made by EDOs to build and strengthen relationships with internal and external stakeholders. The vast majority of EDOs currently dont use these metrics. Lists of metrics here are based on the type of stakeholder/relationship.
Community SegmentMeasure the well-being of the community, which EDOs may have limited control over but many track to understand the community’s needs. Metrics lists cover di�erent aspects of community well-being.
a. EDO Leadership Metricsb. Relationships Established Metricsc. Communications Metricsd. Client Satisfaction Metrics
a. Demographic Makeup Metricsb. Business Related Factors Metricsc. Real Estate: Housing Metricsd. Quality of Life Metricse. Transportation and Public Transit Metricsf. Trade and Tourism Metricsg. Environment Metrics
a. Business Attraction and Marketing Metricsb. Business Creation and Entrepreneurship Metricsc. Business Retention and Expansion Metricsd. Technology and Innovation Metricse. Real Estate: Industrial Use Metricsf. Sustainable Development/Green Jobs Metrics
METRICS MENU

Success implementing strategic plan (i.e. how many goals were actually met)
Investments attracted to EDO / Total revenues generated
Public sector funding increased
Private sector funding increased
Public sector funding retained
Private sector funding retained
!
Linkages between the EDO strategic plan and other economic development plans in the community (Regional economic development plan, marketing plans, etc.)
Ratio of public to private sector funding for EDO
Expansion of services provided by EDO
Level of EDO employee satisfaction*
Diversification of funding sources (Ratio of investors to total funds)*
Number of businesses and/or diversity represented on EDO board, council, or committees
Level of diversity in the EDO leadership (ethnicity, gender, age, race, etc.)
IMPORTANT METRICS
CORE METRICS
BONUSMETRICS
Starred metrics represent measures that are important but not frequently used by EDOs. Refer to the guidebook for recommendations on tracking these metrics.
International Economic Development Council

FRINGE METRICS
RESOURCES
Accounts
Surveys
Feedback from clients
Other internally generated data sources
Demands on sta� time that keep them from the work they are supposed to do (use as a basis for budget increase justification and/or to identify opportunities to collaborate and share work with other divisions or outside organizations)
Employment productivity
Sta� volunteer hours
Checks cashed versus funding commitment
Employee learning outcomes
Excess funding generated
Income and expenses per revenue stream (cost benefit analysis)
Conversion of clients to members
Ratio of investors receiving services
Employee retention
Sta� diversity
Quality of board leadership and ability to retain them
Trust and integrity of organization/board and sta�
Business referrals by businesses and community leaders
“Touches” with EDO investors
Usage of software (and other internal expenditures) vs. its costs
International Economic Development Council

International Economic Development Council
Starred metrics represent measures that are important but not frequently used by EDOs. Refer to the guidebook for recommendations on tracking these metrics..
Businesses attracted to the region (number, distribution across target industry sectors)
Number of jobs attracted (full time, part time, contract, seasonal)
Total number and value of new development projects
New investment attracted/facilitated (overall, per project, public vs. private, etc.)
Increase in tax revenue/base growth
Wages/salaries of jobs attracted (average)
“Active” prospects in the pipeline (number, distribution across target industry sectors)
Cost-benefit analysis of proposed projects (Cost to community vs. benefit to the community)*
Incentives awarded (Number and/or value)
Targeted marketing campaigns undertaken (number, number of people reached, variety of marketing techniques, etc.)
Impact on employment by industry/sector due to EDO e�orts*
!
CORE METRICS
BONUSMETRICS
Number of international tours hosted (in-bound) or organized (outbound)
Number of international conferences and conventions attended by EDO sta�
Bu
sin
ess
Att
racti
on
&
Mark
eti
ng
IMPORTANT METRICS
Presence and quality of direct programs locally to assist new firms (technical assistance, competitive intelligence, marketing, financing, workforce training, etc.)
Branding e�orts launched (number, extent of outreach, variety of messaging, etc.)
Percent of business leads that choose to locate in community/region
Economic multipliers to calculate the ripple e�ects of jobs attracted/created
Cost savings for businesses assisted as a result of EDO programs
Foreign Direct Investment (FDI) attracted to the community

International Economic Development Council
RESOURCES
RIMS II economic multipliers (discontinued). Bureau of Economic Analysis. https://www.bea.gov/regional/rims/rimsii/
Foreign Direct Investment by State and Industry. Bureau of Economic Analysis. http://www.bea.gov/international/di1fdiop.htm
FRINGEMETRICS
Number of calls made for business attraction/Number of business visits conducted
Number of general business assistance requests; how much time was taken up with general calls and referrals
Map where the deals landed on a county map to track and support municipalities where businesses are landing for improved infrastructure and planning purposes
Number of regional vs. statewide projects
Bu
sin
ess
Att
racti
on
&
Mark
eti
ng

International Economic Development Council
Number of new business starts/Businesses created
Number of jobs created (full time, part time, contract, seasonal)
Financing for businesses/total capital provided (total amount of capital, etc.)!
CORE METRICS
BONUSMETRICS
Increased diversity of businesses in economy (Number of sectors, number per sector)
Number of business licenses issued/businesses registered
Systematic comparisons between companies/regions that received assistance and those that did not
Per capita lending activity per SBA loan programs
Small Business Innovation Research (SBIR) grant winners in the community
B
usi
ne
ss C
reati
on
&
En
tre
pre
ne
urs
hip
IMPORTANT METRICS
Availability of di�erent types of startup capital for local businesses - loans, venture capital, angel investment, etc. (total number of financial providers, total amount of capital provided, etc.)
New business startups as percentage of all businesses

International Economic Development Council
FRINGEMETRICS
RESOURCES
Statistics of U.S. Businesses. U.S. Census Bureau. http://www.census.gov/econ/susb/
Survey of Business Owners. U.S. Census Bureau. http://www.census.gov/econ/sbo/
Venture capital data. National Venture Capital Association. http://www.nvca.org/index.php?option=com_content&view=article&id=344&Itemid=103
Business Employment Dynamics. U.S. Bureau of Labor Statistics. http://www.bls.gov/bdm/
Sustainability and growth of locally grown companies
Number of individuals trained in entrepreneurial training programs
Race, age, gender and income level of entrepreneurs assisted
Number of contacts made to small businesses
Events/programs launched
Change in entrepreneurial potential (intent, self-e�cacy, mindset [e.g., role identity])
Detailed dynamic maps of entrepreneurial ecosystem
Sources of all business/entrepreneur capital
Referrals to other resources (e.g. federal or state programs)
Funding application turnaround times
B
usi
ne
ss C
reati
on
&
En
tre
pre
ne
urs
hip

International Economic Development Council
Number of businesses expanded
Number of businesses retained
Number of jobs retained (full time, part time, contract, seasonal)
Number of businesses assisted (type of assistance, value of assistance provided, etc.)
Ratings of the business climate in the community
Amount of financing provided ($)
!
Businesses remaining and growing in region following a risk of departure or closure
Percent of "jobs at risk" retained
Past utilization of and satisfaction with local business assistance programs
Relocation of supplier or customers
Percent of revenue growth for businesses receiving EDO assistance
Number of residents/businesses assisted in economically distressed and under-served communities
Local business-to-business investment levels
IMPORTANT METRICS
CORE METRICS
BONUSMETRICSB
usi
ne
ss R
ete
nti
on
&
Exp
an
sio
n

International Economic Development Council
Bu
sin
ess
Re
ten
tio
n
& E
xp
an
sio
n
RESOURCES
Statistics of U.S. Businesses. U.S. Census Bureau. http://www.census.gov/econ/susb/
Survey of Business Owners. U.S. Census Bureau. http://www.census.gov/econ/sbo/
Business Employment Dynamics. U.S. Bureau of Labor Statistics. http://www.bls.gov/bdm/
FRINGEMETRICS
Number of meetings with existing businesses
Number of calls for service/information from BRE clients outside of the normal BRE visit process/cycle
New markets opened for existing businesses
Training provided and programs launched
Activities that are done to support “Buy Local” campaign

International Economic Development Council
Access to broadband internet
Percent growth in tech-oriented businesses
Local or regional technology transfer from local universities to area businesses
!CORE
METRICS
BONUSMETRICS
Percent growth in tech-oriented education programs
Increase in technology zone incentives (reduction in permit/user fees, ordinance exemptions, flexibility in special zoning, etc.)
Patents (number of patents filed by local businesses, major sectors in which patents are filed, etc)
Tech
no
log
y &
In
no
vati
on
IMPORTANT METRICS
Number of R&D contracts and grants for businesses assisted by EDO
Amount of R&D funding for businesses assisted by EDO
Modernization of facilities
Number of new products and/or production lines, new services
FRINGEMETRICS
Patents and licenses of university technology
Change in intent and mindset for technology entrepreneurs

International Economic Development Council
Starred metrics represent measures that are important but not frequently used by EDOs. Refer to the guidebook for recommendations on tracking these metrics.
Availability of shovel-ready sites (number, acreage, etc.)
Number and value of redevelopment projects
Vacancy and absorption rates (as well as di�erence in rates between various industrial/commercial areas of the community)
Availability of certified sites (number, acreage, etc.)
Average value of commercial property
Number of new building permits granted
Change in property valuation over time
!CORE
METRICS
BONUSMETRICS
Average cost of remediation (In case of redevelopment projects)
Number of subsidized buildings
Re
al
Est
ate
&
Ind
ust
rial
Use
IMPORTANT METRICS
Diversity of financing methods used (Tax credits, tax increment financing districts, leases, public use bonds, etc)
Internal rate of return for projects*
Average cost of construction
Timeliness of project completion
Real estate tax rates

International Economic Development Council
Su
stain
ab
le D
eve
lop
me
nt
G
ree
n J
ob
s
FRINGEMETRICS
Percent of green jobs in the economy
Green jobs per dwelling unit
Patents related to clean tech or green industries
Venture capital related to green tech business
Clean tech or green start ups
Percent of new and retrofitted buildings green building/technology
Green sites (reuse of materials, on-site energy, recycled water, natural bu�ers, etc.)
Employers per acre
Cost of services and infrastructure per capita (e.g., recreation, schools, water and sewer laterals, public facilities, roads, utilities, and operational costs)

International Economic Development Council
Regular information sharing with community stakeholders by EDO board
E�ectiveness of EDO board to remove barriers to economic development progress (e.g. engaging in local and state policy development related to economic development)*
!
Businesses participating in EDO leadership (Board or ED related committees)
Public sector representatives participating in EDO leadership
Civic Engagement (number and variety of civic organizations represented on EDO board or committees or actively engaged in implementing EDO programs)
Participation by minorities, women, and immigrants in EDO leadership and community organizations
IMPORTANT METRICS
CORE METRICS
ED
O L
ead
ers
hip
RESOURCES
Accounts
Surveys
Feedback from clients
Other internally generated data sources
Starred metrics represent measures that are important but not frequently used by EDOs. Refer to the guidebook for recommendations on tracking these metrics.
BONUSMETRICS

International Economic Development Council
Collaboration with nearby four year colleges and universities, technical colleges, and community colleges
Public-private partnerships, joint ventures, collaboration (Number, size, type)
Relationships established with regional and national site selectors
Relationships established with area legislators
Relationships with other organizations to expand resources, alternative funding streams, etc.
!
Number of instances where EDO has partnered with other organizations to share resources (with or without formal partnership agreements)
Collaboration with area workforce investment boards (WIBs)
EDO engagement with organized industry networks
Number of relationships established between EDO and community stakeholders (Civic groups, schools, social service groups, environmental)
Number of meetings held with potential investors
Depth of involvement with each partners (heavy, medium, light)*
Partnerships with workforce training providers
Consolidated resource measurements to measure e�ect of partnering on capacity
Research conducted jointly with partner organizations
IMPORTANT METRICS
CORE METRICS
FRINGE METRICSR
ela
tio
nsh
ips
Est
ab
lish
ed
RESOURCES
Accounts
Surveys
Feedback from clients
Other internally generated data sources
Starred metrics represent measures that are important but not frequently used by EDOs. Refer to the guidebook for recommendations on tracking these metrics.

International Economic Development Council
Educating local elected o�cials on economic development practice
Engaging/informing state and regional partners on EDO activities and progress
Number of positive media hits (Local/national/international recognition) - overall and due to outreach vs. due to response
Ranking of website in online search engines (Search engine optimization)
!
EDO related communications on partner organization websites (State, regional, local partners)
Submission of articles related to the EDO to area media sources and publication
Number of face to face calls
IMPORTANT METRICS
CORE METRICS
FRINGE METRICS
Co
mm
un
icati
on
s
RESOURCES
Accounts
Surveys
Feedback from clients
Other internally generated data sources

International Economic Development Council
Community/client satisfaction rating (via survey)
Number of client success stories from participants in EDO programs
Client retention
!
Client attrition rate
Number of new clients who were recommended by existing clients
Average client interaction costs (Total costs for interacting divided by number of interactions)
IMPORTANT METRICS
CORE METRICS
BONUSMETRICS
Cli
en
t S
ati
sfacti
on
RESOURCES
Accounts
Surveys
Feedback from clients
Other internally generated data sources

International Economic Development Council
Number of schools in jurisdiction (public and private) and classroom size
Job openings per sector*
Educational opportunities for entrepreneurs (Number and variety of programs o�ered)*
Talent Movement (Jobs filled by college graduates in the community)*
School enrollment
High school, College Dropout rates - overall and by subgroup (i.e. ethnic group)
Labor market relationsIMPORTANT METRICS
Employment by industry and sector
Number of qualified workers for specific jobs and sectors
Education levels/attainment
Average wage rates by industry
Change in per capita income over time
Labor and training needs in the community (full/part time employees, average wage rates, skill levels of work force, percent unionized, annual turnover rate, current hours of training, etc)
Unemployment rate
Labor force participation (Number of residents in workforce)
Commuting patterns to measure leakages from community
Earnings, by sector
Age distribution of working population
Wage growth (Changes in average wages or salaries)
!
CORE METRICS
Per capita state/region/city expenditure for education for K-12 and higher education
Test scores
Immigration/emigration levels
Hiring of foreign nationals
Companies that have signed "local hiring" agreements with EDO/local governmentBONUS
METRICS
Starred metrics represent measures that are important but not frequently used by EDOs. Refer to the guidebook for recommendations on tracking these metrics.
De
mo
gra
ph
ic M
ake
up

International Economic Development Council
Labor force productivity (value added per employee)*
Satisfaction rating of public services/facilities in the community
Increased diversity of businesses in the economy
Expansion in services provided by EDO
Breadth and depth of services o�ered by financial institutions
Research funding available and awarded (public and private)
Access to business conference space/meeting facilities
Immigrant friendliness (Cultural diversity in the community, strong business subgroups/associations/chambers around specific nationalities, etc.)
Business bankruptcy filings
Systematic comparisons between companies/regions that received assistance and those that did not (under business assistance)
IMPORTANT METRICS
CORE METRICS
BONUSMETRICS
Bu
sin
ess
Re
late
d F
acto
rsAssessment of business workforce needs
Barriers to growth - Inadequate supply of qualified job applicants (overall and by job type), uncompetitive tax rates, crime rate, uncompetitive cost of living, high energy costs, etc.
Ratings of the business climate in the community
Ease of doing business (average number of days to open a business/number of permits to be obtained, average cost of opening a business, etc.)
Access to capital (Federal/state/local subsidies, SBA loans, etc)
!
Starred metrics represent measures that are important but not frequently used by EDOs. Refer to the guidebook for recommendations on tracking these metrics.

International Economic Development Council
Ho
usi
ng
Vacancy rates
Housing units built
Ratio of housing price to income*
Average monthly rental
Value of new housing construction (in targeted area)
Housing conditions
Percentage of owner occupied households
Average construction costs per square inchIMPORTANT METRICS
Average housing size
Change in foreclosure rateBONUSMETRICS
A�ordability of housing
Cost of living (Avg housing costs, avg utility costs, etc.)
Property values (Residential versus commercial)CORE METRICS
Starred metrics represent measures that are important but not frequently used by EDOs. Refer to the guidebook for recommendations on tracking these metrics.

International Economic Development Council
Qu
ali
ty o
f L
ife
Population diversity
Access to sports and recreation
Percent of locally owned businesses*
Total and per capita expenditures on arts and culture (museums, parks, etc.), infrastructure improvements, community projectsIMPORTANT
METRICS
Access to broadband internet*
Median/average household/family incomes
Healthcare (Number of hospitals, quality of healthcare o�ered, options for elderly care, etc.)
Crime ratesCORE METRICS
Physical/streetscape improvements
Distance to vital retail amenities such as grocery stores, pharmacies, and postal o�ces, from major housing establishments
Cost and availability of child care services
Park space inventory and proximity to residents
Number of celebrations and festivals in community/municipality and number of visitors
Walk-ability
Volunteerism to improve the community (hours)
Value of charitable donations
Gini Coe�cients (Measuring inequality of income or wealth between di�erent segments of the community)
Voting rates
Gentrification or displacement
Participation by minorities, women, and immigrants in community/civic organizations
Number of local newspaper publishers
Morbidity, mortality ratesBONUSMETRICS
Starred metrics represent measures that are important but not frequently used by EDOs. Refer to the guidebook for recommendations on tracking these metrics.

Tra
nsp
ort
ati
on
&
Pu
bli
c T
ran
sit
Reliability of public transportation
Transit service coverage and density
Cost of public transportation
Percent of population using public transportationIMPORTANT METRICS
Average commute times
Travel times to other communities and employment centers
Access to mass transit
!CORE
METRICS
Bicycle and pedestrian networks
Congestion levels
Vehicle miles traveled per capita
Percent of residents that live within walking distance of public transport
Percent of population carpooling to work
Transportation incentives to o�set costs or manage tra�c flows (tolls, HOV lanes, tax rebates on transit fares, etc.)BONUS
METRICS
International Economic Development Council

International Economic Development Council
Tra
de
& T
ou
rism
Starred metrics represent measures that are important but not frequently used by EDOs. Refer to the guidebook for recommendations on tracking these metrics.
Positive impressions from branding campaigns*
Exports (amount and/or growth) and trade activity*
Website/social media hits
Hotel vacancy rates (weekend and weekday)
!CORE
METRICS
Number of places that flights connect to
Improvement in region’s “competitive position” in the global economy*
Number of Fortune 500 companies with local presence
Festivals and events (number, number of participants, visitors)
Annual average hotel occupancy rate
Number of accommodations – hotels, motels, bed and breakfasts
Number of businesses in the tourism sector
Number of new visitors to community
Frequency of international flights
Tourist/visitor average length of stay
Growth in tourism spending per visitIMPORTANT METRICS
Percent of globally connected entrepreneurs in the community*
Visitors services (number of locations that provide visitor information, online presence, frequency with which information is updated, etc.)
Number of international trade shows participated
Number of trade missions and diversity of countries visited
Number of tourism packages developed
Number of Sister City relationships actively cultivated/established
Number of globally renowned think tanks that are locally based
Number of student foreign exchange opportunities cultivated/establishedBONUSMETRICS

International Economic Development Council
En
vir
on
me
nt
FRINGEMETRICS
Annual energy savings (through an EDO led reduction)
Rebates for green energy
Local/regional environmental quality in comparison to national level
Planned environmental improvements
Energy/renewable provided (types, amount, or capacity)
Energy use/e�ciency
Energy portfolio (e.g. percentage of renewable energy vs traditional energy)
Sprawl (increased development of real estate in the outskirts of towns, villages and metropolitan areas accompanied by a lack of development, redevelopment or reuse of land within the urban centers themselves)
Cropland value
Per capita greenhouse gas emissions
Community’s overall greenhouse gas emissions
Water quality and availability
Air quality
Brownfield remediation
Disaster or hazard prevention/mitigation
Infill development
Preservation of farmland, natural habitats, or open spaces
Decrease in amount of development occurring within environmentally sensitive areas (Wetland, floodplains, prime farmlands, coastal zones, etc)
Net wetland loss
Per capita water use
Per capita storm water runo�
Per capita acreage of impervious surfaces
Connectivity of open space and natural lands

Part III: Case Studies
International Economic Development Council

International Economic Development Council
Making it Count: Metrics for High Performing EDOs 45
Case Studies Overview
These case studies are examples of how economic development organizations of different sizes, functions, and geographic locations are taking innovative approaches to tracking metrics. This includes selection of new and interesting metrics (e.g., Southwest Michigan First), fresh approaches to the metrics process itself (e.g., City of Fort Collins), and strategies for making performance measurement easier to carry out (e.g., Government of South Australia). Some case studies highlight how even small EDOs (e.g., Yates County, New York) have built a performance measurement system from the ground up with few extra resources.
Virginia Performs
In 2004, the Council on Virginia's Future was established to develop an economic development vision, and corresponding goals to help realize that vision, for the Commonwealth of Virginia. Given this purpose, the council established a statewide accountability system that aligns impact and performance measurements across state agencies.4 Dubbed Virginia Performs, this performance measurement system facilitates a comprehensive approach to the state’s planning, budgeting, and performance management efforts. This case study illustrates a state-level approach that assembles performance metrics from typically disparate agencies.
Today, more than 80 state agencies enter performance data directly into the Virginia Performs database. In order to aid the assimilation to outcome rather than process measures, agencies received structured training and guidelines.5 Now, agencies simply report on standardized measures relevant to the state’s long-term goals. Performance metrics are outcome- or output-based and measured quarterly, semi-annually, or annually. Agencies also indicate the measurement intent of a given metric. For example, a metric may track general agency performance or a service that the agency provides. Furthermore, agencies specify the classification of a given metric (e.g., key, productivity, or other measure).
Key agency measures then correspond to a goal central to the realization of the state’s vision. For example, the Virginia Economic Development Partnership measures and inputs agency performance on the number of jobs created by new and existing companies.6 This 4 Personal Communication with Gerard Ward, Deputy Director of the Council on Virginia's Future, January 8, 2014.
5 Council on Virginia's Future (2009). Evolution of Virginia Performs. Issue Insight, Volume 4. Retrieved from http://www.future.virginia.gov/publications/docs/IssueInsights/Insight4-EvolutionVaP.pdf 6 https://solutions.virginia.gov/pbreports/rdPage.aspx?rdReport=vp_Agency&rdAgReset=True&Agency=310

International Economic Development Council
Making it Count: Metrics for High Performing EDOs 46
measure is a key indicator of Virginia’s performance on employment growth. Virginia’s Department of Business Assistance also reports on related measures for employment growth. A key agency measure is the number of companies assisted by the Virginia Jobs Investment Program.7 Monitoring the performance of this program is important to employment growth, because its objective is to assist businesses in the state to create and retain jobs.
All the key metrics for each agency are then aggregated, summarized, and displayed on the Virginia Performs website. The website shows how Virginia is doing with scorecards, data maps, and performance indicators.8 An example of a scorecard item with the corresponding goals and indicators is provided below.
Figure 1: VA Performs Economy Scorecard Item9
Not only does this provide transparency for citizens, it also provides a practical performance tracking model for regional and local agencies. For example, the Council on Virginia’s Future collaborated with the Hampton Roads region to create Hampton Roads Performs. This regional model utilizes some of the Virginia Performs measures and replicates the Virginia Performs monitoring process on a regional scale. For more information on Virginia Performs, visit http://vaperforms.virginia.gov.
7 https://solutions.virginia.gov/pbreports/rdPage.aspx?rdReport=vp_Agency&rdAgReset=True&Agency=325
8 Ibid.
9 http://vaperforms.virginia.gov/Scorecard/ScorecardatGlance.php

International Economic Development Council
Making it Count: Metrics for High Performing EDOs 47
Government of South Australia
South Australia is one of six states in the Commonwealth of Australia. In 2004, the Government of South Australia launched a statewide strategic plan with 79 targets for improvement. The plan was created in response to the state’s Economic Development Board’s request for a long-term, transparent, and measurable strategic plan.10 The South Australian Strategic Plan tackles six interrelated and long-term objectives: growing prosperity, improved wellbeing, attaining sustainability, fostering creativity, building communities, and expanding opportunity. To ensure effective monitoring and evaluation of the plan, the government appointed an independent five-member audit committee. This case study illustrates a best practice of not only monitoring measures but also verifying the relevance of metrics to associated goals.
The audit committee meets quarterly to review performance targets and creates semiannual progress reports. Each progress report is divided into two main parts: a report card and section with commentary and recommendations. Each progress report uses a two-part rating system (adopted in 2008) to provide a snapshot of performance.11 The rating system indicates the progress observed to date and achievability. The table below shows how the progress and achievability rating system is applied to targets.
10 http://saplan.org.au/pages/an-evolving-plan 11 http://saplan.org.au/media/BAhbBlsHOgZmSSIgMjAxMi8wOS8yNi8wMV80OV8yNV8yN19maWxlBjoGRVQ/01_49_25_27_file
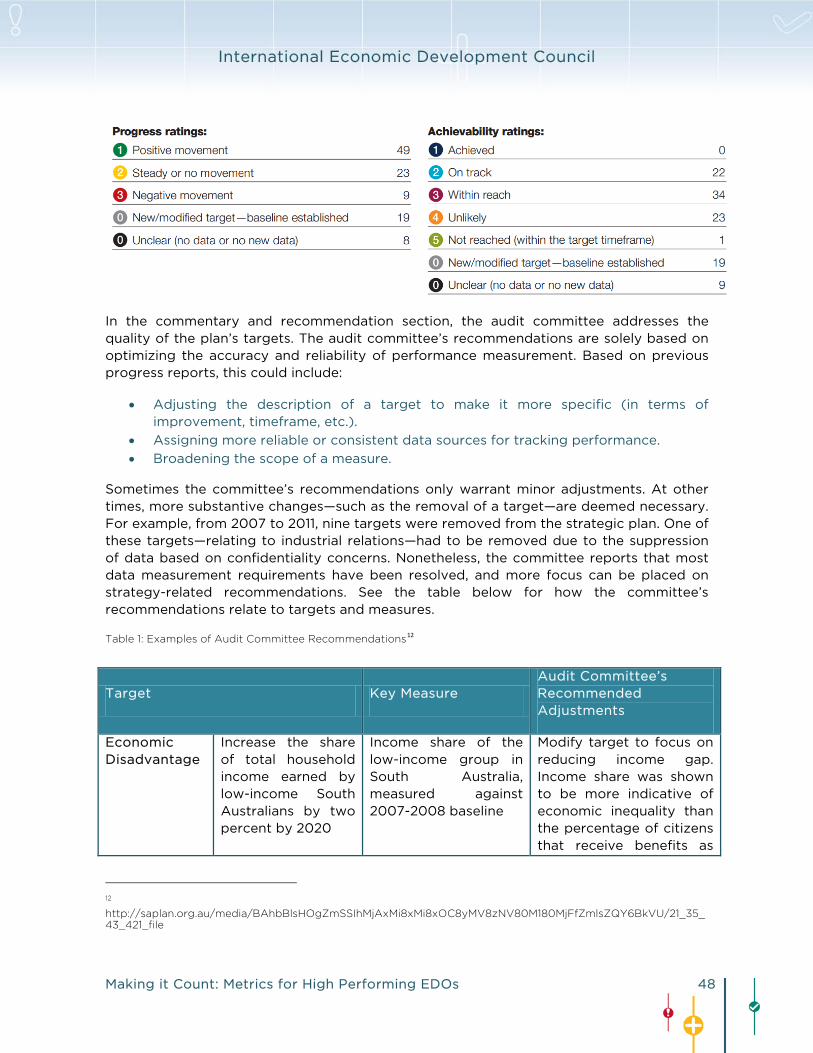
International Economic Development Council
Making it Count: Metrics for High Performing EDOs 48
In the commentary and recommendation section, the audit committee addresses the quality of the plan’s targets. The audit committee’s recommendations are solely based on optimizing the accuracy and reliability of performance measurement. Based on previous progress reports, this could include:
• Adjusting the description of a target to make it more specific (in terms of improvement, timeframe, etc.).
• Assigning more reliable or consistent data sources for tracking performance.
• Broadening the scope of a measure.
Sometimes the committee’s recommendations only warrant minor adjustments. At other times, more substantive changes—such as the removal of a target—are deemed necessary. For example, from 2007 to 2011, nine targets were removed from the strategic plan. One of these targets—relating to industrial relations—had to be removed due to the suppression of data based on confidentiality concerns. Nonetheless, the committee reports that most data measurement requirements have been resolved, and more focus can be placed on strategy-related recommendations. See the table below for how the committee’s recommendations relate to targets and measures.
Table 1: Examples of Audit Committee Recommendations12
12 http://saplan.org.au/media/BAhbBlsHOgZmSSIhMjAxMi8xMi8xOC8yMV8zNV80M180MjFfZmlsZQY6BkVU/21_35_43_421_file
Target Key Measure Audit Committee’s Recommended Adjustments
Economic Disadvantage
Increase the share of total household income earned by low-income South Australians by two percent by 2020
Income share of the low-income group in South Australia, measured against 2007-2008 baseline
Modify target to focus on reducing income gap. Income share was shown to be more indicative of economic inequality than the percentage of citizens that receive benefits as

International Economic Development Council
Making it Count: Metrics for High Performing EDOs 49
For more information on the South Australia Strategic Plan, visit http://saplan.org.au.
Southwest Michigan First
Southwest Michigan First is a Kalamazoo-based regional economic development
organization driven by the core belief that “the greatest force for change is a job.”13 Since
its inception, the organization has been committed to accelerating business growth in the Southwest Michigan region through the expansion, attraction, and creation of primary employers. As such, the organization relies on outcome-based performance metrics to guide its efforts. This case study exemplifies a practical yet creative and engaging approach to EDO performance measurement.
Southwest Michigan First identifies goals on an annual basis and then establishes a set of outcome-driven performance indicators. The organization’s annual goals and performance 13 http://www.southwestmichiganfirst.com/about_us/about_us.cfm
their major income.
Affordable Housing
South Australia will lead the nation over the period to 2020 in the proportion of homes sold or built that are affordable by low and moderate-income households.
Proportion of properties built or sold that are affordable for low and moderate income households
Rewording target so that focus is placed on improving performance over time, rather than ranking the State among other jurisdictions
Economic Growth
Exceed the national economic growth rate over the period to 2020
Cumulative growth in GSP/GDP since the baseline year
Treat results with caution and view results in the context as this data series is considered “volatile and subject to frequent revision” by the Australian Bureau of Statistics.
Business Investment
Exceed Australia’s ratio of business investment as a percentage of the economy by 2014 and maintain thereafter
Ratio of private new capital expenditure to GSP / GDP
Private gross fixed-capital formation as a proportion of GSP/GDP may prove a better measure than the ratio of private new capital expenditure to GSP/GDP.

International Economic Development Council
Making it Count: Metrics for High Performing EDOs 50
indicators are also tied to regional economic goals and indicators. In 2013, Southwest Michigan First established the following measures.14
• Consultations with Existing Industry — Number of face-to-face meetings with existing businesses that are primary employers. Primary employers sell more than half of their products or services outside of the Southwest Michigan region.
• Site Decision Influencer Impacts — Number of one-on-one meetings with Individuals who work with potential companies looking to relocate or expand in the region.
• Number Suspects and Prospects — A suspect is a company or consultant that requests initial information from the organization. A prospect is a company or consultant that visits the region after reviewing the initial information provided.
• Announcements and New Jobs — An announcement is a notification of job creation. New Jobs tracks the total number of direct and indirect jobs associated with those announcements.
• Innovation Suspects — Number of start-up companies or entrepreneurs that approach Southwest Michigan First for acceleration through funding, company formation, or network building.
• Chamber Consultations — Number of face-to-face meetings with existing businesses that support the Southwest Michigan First Chamber Division, which is focused on small- to-medium-sized business growth.
• Chamber Members — Number of members that support and partake in the education, networking and advocacy opportunities of the Southwest Michigan First Chamber Division.
• Leaders Impacted — Number of community and business leaders impacted by either attending a leadership or educational event led or sponsored by Southwest Michigan First.
• Social Media Followers — Cumulative number of followers of the organization’s social media accounts and followers of team members whose social media presence reflects the organization’s “face.”
• New “Council of 100” Members — Number of new members of the Council of 100, a group that supports the organization’s mission of job creation.
• Engagement — Cultural assessment index administered by HUMANeX Ventures. o Team Engagement — Measures the engagement of current employees on
engagement and relationships within the organization. o Board Engagement — Measures the engagement of board members with
the organization’s mission, organization and team. o Partner Engagement — Measures the engagement of the organization’s
regional partners with the region’s collaborative mission, organization, and team.
Once the results are checked for accuracy and consistency, performance levels are then reviewed by the entire team and the Board of Directors every two weeks. To make performance outcomes more tangible, the organization uses a wall scoreboard (think Wrigley Field) to illustrate each performance goal and current performance levels.
14 Descriptions of measurement as stated in Southwest Michigan First’s Internal Annual Goals document.

International Economic Development Council
Making it Count: Metrics for High Performing EDOs 51
The performance-based focus of Southwest Michigan First has led to success both internally and externally. For example, the organization set an annual goal to favorably influence site selector decisions on at least 160 occasions and reached 101 halfway through the year.15 The organization’s reputation for producing data-proven results has also led to increasing interest from companies both within and outside of their region, and international recognition as a catalyst for economic growth.
Women’s Initiative
Women’s Initiative for Self-Employment is a 25-year old nonprofit that provides training, funding, and ongoing support to help high-potential, low-income women start their own businesses. Based in the San Francisco Bay Area, Women’s Initiative serves clients in San Francisco, Oakland, as well as in New York City. The organization targets traditionally underserved groups. The majority of its clients are low or extremely-low income, and most are minorities. Women’s Initiative works to increase its clients’ income and assets and to support the local economy by helping clients launch businesses and create jobs.
To track success in reaching these goals, Women’s Initiative has developed a comprehensive set of metrics. It has surveyed clients over the past five years, resulting in a combined total of 753 clients surveyed. Women’s Initiative calculates its impact by measuring key statistics before a client receives training and 18 months after training. These economic statistics include the following.
Economic Impacts
Sales: Clients’ average gross annual revenue increased from $6,235 to $82,057.
Income: On average, clients double their income from $12,938 to $25,839.
Wages paid: Clients created and retained 2,313 local jobs for others in 2012.
Sales tax paid: About 70% of tax revenues in California are spent on local public services (Women’s Initiative). The average tax revenue spent locally per Women’s Initiative client increased from $366 before training to $4,811.
Women’s Initiative combines these local impacts to calculate its overall return on investment. ROI is calculated as total local impacts divided by program costs, which include workshops, courses, financial services, and overhead. Referencing results 18 months after training, Women’s Initiative estimates that clients return $30 in local economic impact for every $1 invested in the program. Five years after training, ROI is even higher, as every $1 invested in the program produces $108 in local economic return. This is an average cumulative impact of $531,811 per client on the local economy. Women’s Initiative clients have had a combined $1.4 billion impact on the local economy.
15http://www.mlive.com/business/west-michigan/index.ssf/2013/06/southwest_michigan_first_is_cr.html

International Economic Development Council
Making it Count: Metrics for High Performing EDOs 52
Women’s Initiative also measures its clients’ social contributions to the community:
Social Impacts
Volunteerism: 54% of clients volunteer on a regularly basis.
Charitable donations: 65% of graduates made donations to charitable organizations, averaging $1,345 annually in cash and in-kind donations.
Buying locally: 82% of clients buy locally, including 39% who do so daily or more than once per week.
Green practices: Over 50% of clients use environmentally friendly packaging materials, and a significant number of clients incorporate green practices in their waste and energy management and purchasing policies.
Community engagement: 81% of clients report that they are considered a role model in their community. A third of clients even mentor other entrepreneurs.
City of Fort Collins, Colorado
The City of Fort Collins’ innovative work in performance measurement has been recognized by the International City/County Management Association (ICMA) with a Certificate of Excellence from the ICMA Center for Performance Measurement (CPM). The city government’s metrics are closely tied to its budgeting process, since the metrics tracked are specific to the projects that are funded. The city uses the “Budgeting for Outcomes” process, which prioritizes the city’s budget toward services that citizens deem most valuable. Under this process, each city department prepares a proposal for its activities, a budget, and relevant metrics for the upcoming year. The proposals are reviewed by purchasing groups, made up of city council staff and local citizens. There are seven purchasing groups, with each focusing on one of the particular community outcomes below.
1. Community and Neighborhood Livability 2. Economic Health 3. Environmental Health 4. High Performing Government 5. Safe Community 6. Transportation 7. Culture and Recreation
The purchasing groups make recommendations to the city council on which proposals to fund based on community priorities for that year. For example, an upcoming community priority is local food production. Proposals that include this priority will have a higher

International Economic Development Council
Making it Count: Metrics for High Performing EDOs 53
chance of being funded. Proposals are usually fully funded, though in some cases they are partially funded or may even receive additional funding beyond the levels requested.
Based on recommendations from the purchasing groups, city leadership develops purchasing plans and solicits service providers to make offers. Purchasing plans are filled until City budget for the year is spent. Thus, the Budgeting for Outcomes process ensures that citizens’ most important priorities for community development are carried out while accounting for the realities of finite city budgets.
The metrics that each city department tracks depend on which projects are funded. Through the Budgeting for Outcomes process, metrics can be added at any step (e.g., by purchasing groups) and then brought back to city departments for tracking. Other metrics may be eliminated if projects are not funded. Below is a sample of projects and metrics the City’s Economic Health Office tracks.
Project Metrics
Storefront Improvement Program
The leverage ratio of tax increment financing (TIF) funding to private investment per project, with the target being $1:$1
The number of grants awarded per year, with a target of at least 5 per year for 2013 and 2014
Support of Targeted Industry Clusters/Cluster Development
Track jobs in the 5 industry clusters
Leverage city assistance into private investment
Support the Rocky Mountain Innosphere (a regional technology incubator)
Track # of companies to reach an the first round of capital
Track the number and $ value of capital investments in RMI client companies
Leverage city support of RMI through fundraising
Business Retention and Expansion
Target 8 companies annually recognized by Colorado Companies to Watch program
Track leads and successes generated by Northern Colorado Economic Development Corporation
Urban Renewal Authority Operations
Track total private investment in URA area; Leverage city assistance into private investment
In addition to project-specific metrics, the City of Fort Collins publishes a quarterly community performance measurement dashboard that covers each of the seven community outcome categories mentioned previously. The data for the dashboard comes from the International City/County Management Association (ICMA) Center for Performance Measurement, and operational data comes from city departments.

International Economic Development Council
Making it Count: Metrics for High Performing EDOs 54
The city undertakes several initiatives to ensure transparency in local governance. For instance, in 2013 the city distributed surveys to 1,800 residents soliciting feedback on city services. This process is repeated every two years. The city also publishes a monthly City Manager’s Report, manages an online tool that tracks local government spending (Open Book), and publishes detailed financial reports from the city’s finance department. The city is currently working to develop a centralized database supported by its budget and IT departments.
New York City Economic Development Corporation (NYCEDC)
With New York City undergoing perpetual urban consolidation and growth, effective management of its expansion is necessary to catalyze economic development. Formed in 2012 through a merger of the New York City Economic Development Corporation and the New York City Economic Growth Corporation, the NYCEDC is responsible for this task. The corporation seeks to bolster economic growth in the five boroughs of New York City by facilitating business investments, competitive business environments, and generation of prosperity. The NYCEDC tracks and reviews the progress of economic development activities through a multi-faceted system of metrics. Its approach is particularly unique, because it uses a wide range of data sources—both public and private—from across multiple economic development areas.
Integral to the NYCEDC’s metric assessment is its Internal Economic Research and Analysis Group (IERAG), which compiles data from a variety of independent and public sources to outline the well-being of New York City’s populace and operating businesses. Particularly unique tools are NYCEDC’s Innovation Index and Stats Bee. The Innovation Index is designed to track New York City’s transformation into a hi-tech hub of innovation and the impact of innovation on its economy. The index is constructed from the average of data clusters from six dimensions of economic development.
Inputs 1. R&D 2. Finance 3. Human Capital Outputs 4. Intellectual Property 5. GCP (Gross City Product) 6. Entrepreneurship
To construct this index, IERAG utilizes data from Moody’s Analytics, a private firm that provides economic and financial data, along with research and analysis, on both macro and microeconomic scales. IERAG tracks this index over time to examine trends in innovation.

International Economic Development Council
Making it Count: Metrics for High Performing EDOs 55
Using preliminary data, the index can also predict future performance on innovation. This is an ideal example of how NYCEDC adopts a dual metric system, in which the social component is represented by features such as Human Capital and the numerical data is represented in the Finance or GCP data sets. Such an index reveals an understanding that the analysis of economic development depends on both the dynamics of social changes and resulting financial outcomes. The Stats Bee is a blog where IERAG outlines data released by private firms—such as PricewaterhouseCoopers (PWC) and Thomson Reuters—and public bodies like the National Venture Association (NVCA). A prime example is the analysis of venture capital results where PWC and NVCA’s Money Tree Report was used to assess whether the NYCEDC’s attempt to boost startups and subsequently stimulate employment creation was a success. Independent data sources like these enable the NYCEDC to objectively and quantitatively observe the effectiveness of their economic development activities. IERAG also publishes Monthly Economic Snapshots and Statistical Insight reports containing graphs and summaries for regular performance overview. These reports use public data sources from the U.S. Census Bureau, New York State Department of Labor, New York City Department of Health and Mental Hygiene, New York City Department of Transportation, and the Metropolitan Transportation Authority. IERAG also combines data from private consulting firms, like PKF Consulting, and real estate companies, like Cushman and Wakefield, for areas involving construction and building development or hotel occupancy. Specific reports are also prepared for the individual boroughs of New York City, and the same metrics are employed as those in general New York City data snapshots.
Yates County, New York
Yates County is a small county in central New York with a population of approximately 25,000. The sole economic development agency for the county is the Finger Lakes Economic Development Center (FLEDC). FLEDC also serves as the county’s industrial development agency, and as such oversees community development, waterfront development, and downtown development in the county. FLEDC operates with three full-time employees who manage the county’s business financing and incentives programs. FLEDC began systematically tracking metrics six years ago when new CEO Steve Griffin was hired. Griffin used his prior economic development experience and extensive sales background to build a new set of metrics that can be tracked using only internal data. FLEDC’s perspective as a smaller EDO offers some unique lessons for how an EDO with fewer resources can begin tracking metrics.
KEEP THINGS SIMPLE Griffin advocates using the “SMART” criteria for selecting metrics: Specific, Measurable, Attainable, Relevant, and Time-bound. Thus, FLEDC only tracks metrics that are directly tied to program goals. FLEDC tracks economic outcomes like jobs created and retained, capital investment, number of startup companies directly assisted, business attraction by

International Economic Development Council
Making it Count: Metrics for High Performing EDOs 56
industry, impact of loan funds, and more. FLEDC also keeps detailed records of loans given through the county’s revolving loan fund, which it manages. FLEDC is primarily funded through its ownership of a multi-tenant facility, which it leases out. FLEDC tracks vacancies at this facility as well as vacancies and makeup of businesses at the Main Street shopping district. Griffin holds the philosophy that “activity breeds activity,” which ultimately means that economic development outcomes reflect economic development efforts. Thus, FLEDC also tracks staff activities such as number of projects, meetings held with businesses, partnerships with local and regional agencies, and external presentations. One challenge FLEDC faces is finding a systematic way of tracking the number of inquiries received from businesses each year. While it receives calls constantly, not all calls are logged into a database as they come.
USE FREE DATA AND RESOURCES FLEDC does not dedicate a specific budget to the process of tracking metrics. In fact, it only uses internally-collected data and free public data. Most of the metrics are gathered via internal data. Griffin says, “If it is a priority, we find time to do it.” For example, FLEDC staff visits the county’s downtown area to manually count the number of vacancies. Other data can be collected using free public resources. Griffin uses Google Earth to measure sizes of properties and a customer relationship management tool called Zoho (www.zoho.com) that is free for organizations smaller than three employees. These are only a few of the many free resources that are available for tracking metrics.
There are some metrics that are not directly under the purview of FLEDC’s work but are also of interest. For example, the county tracks sales tax from new projects. FLEDC closely monitors the county’s metrics to supplement its own data.
SET REALISTIC BENCHMARKS FLEDC uses metrics for marketing purposes as well as for benchmarking the county’s performance. FLEDC reports to the general public on the county’s performance and monthly to the FLEDC board of directors. For benchmarking, FLEDC primarily compares its performance against neighboring counties and distant counties of similar size. It compares overall performance (such as unemployment rate) as well as performance within industries (such as growth in businesses in manufacturing, education, government, and hospitality). Griffin emphasizes the importance of setting realistic benchmarks; small EDOs must compare performance against similarly-sized EDOs.
Although performance measurement can seem daunting for smaller EDOs, FLEDC shows it is feasible. By using free programs, prioritizing important metrics, and tapping into the community’s resources, an EDO can gather fairly detailed metrics and gain a better understanding of its performance.

Part IV: Metrics Research and Analysis
International Economic Development Council

International Economic Development Council
Making it Count: Metrics for High Performing EDOs 58
Literature Review
The Evolution of Performance Metrics
Over the past few decades, the most common performance metrics (PMs) utilized in the economic development profession have been quantitative and primarily focused on the number of jobs created and the amount of investment dollars attracted. If an EDO relies on these metrics alone, the resulting assessment may be incomplete or skewed. Such a distorted outcome is especially likely during times of economic slowdown, despite positive advances—such as creating capacity to build the workforce and industry in its community—that the EDO may be making.
While common metrics regarding jobs, businesses, and investment are standard-bearers that will likely persist in the profession, there is a growing consensus that additional metrics may be needed to accurately reflect an EDO’s performance in areas that add value but are not measured by current barometers.16 As reported in a 2009 survey from the
International City Management Association, almost two-thirds of localities used performance measures to assess the effectiveness of economic development efforts.17
Developing useful performance metrics for businesses, nonprofits, and EDOs has been an iterative process that has, over time, been subject to constant adjustments and improvements. In particular, more recent attempts to create nuanced measurement systems have considered and attempted to capture the following information.
A. Consequences/Feedback – This types of metrics capture the effects on an organization—in terms of use of resources—to both develop and excel under new PM system.
B. Meaningful Benchmarks – These metrics provide for comparisons over time or across cases (i.e., that are longitudinal and/or cross-sectional).
C. Actionable Items – Such metrics Measure outcomes, not just outputs, and include metrics that are not just retrospective but prospective.
D. Qualitative Outcomes – These metrics account for value brought to an organization in ways that are not easily quantified, including capacity-building in the workforce and industry and relationship building
16 See articles including: Chase, Tim. (Summer 2010). A Crisis is a Terrible Thing To Waste. The IEDC Economic Development Journal, 9 (3), pp. 27-35; Ammons, David and Morgan, Jonathan. (June 2011). State-of-the-Art Measures in Economic Development, Public Management (00333611), 93(5), 6-10 – Available on the web at: http://webapps.icma.org/pm/9305/public/cover.cfm?author=David%20Ammons%20and%20Jonathan%20Morgan&title=State-of-the-Art%20Measures%20in%20Economic%20Development&subtitle= ; and Fulton, William. (September 2010). Measuring Economic Development Without Depending on Jobs. Governing The States and Localities. Retrieved from: http://www.governing.com/topics/economic-dev/measuring-economic-development-without-depending-jobs.html. Also reference International Economic Development Council. (2011). Economic Development Metrics Concept Paper.
17 Ammons and Morgan, p.6.

International Economic Development Council
Making it Count: Metrics for High Performing EDOs 59
The last item mentioned above is of particular interest to EDOs that are engaged in evaluating and improving their performance metric systems, as organizations are hoping to reflect the full value that their initiatives bring to the community. This attempt to go beyond traditional metrics that merely “quantify” is also relevant for corporations engaged in social welfare programs, nonprofit organizations, and other groups. Thus, there is a wealth of reference material for EDOs examining their PM systems, and some of this literature will be referenced herein.
A. CONSEQUENCES/FEEDBACK
Developing a performance metrics system is costly and political. In a 1975 Harvard Business Review article titled “Performance measures for small businesses,” Stahrl Edmunds discusses how smaller and fiscally strapped organizations as well as nonprofits and government entities have difficulty obtaining benchmark planning data. “The smaller the venture, the less time and staff available to search for planning data,” Stahrl writes.18
Additionally, as the British Chief Economic Development Officers’ Society (CEDOS) notes after studying EDOs in the United Kingdom, the danger is that developing and maintaining a PM system will take up a disproportionate amount of time.19
A performance measurement program is itself an operating expense that should be planned carefully and efficiently. The hope is that there will be a strong return on investment (ROI) down the road, if not in the immediate year. The concern is that organizations will become overinvested in the metrics that are established, and that they will focus on them to the detriment of other important goals. This concern has been voiced in particular with respect to the healthcare and educational sectors, which must meet mandated goals.2021
Some organizations may prioritize certain metrics more than others. The quest for an overall rank in the system could be suboptimal and lead to an outcome where each organization is limited in excelling according to its strengths. As discussed in reference to the field of education, low morale, corruption, cheating, and other organizational problems can result.22
18 Edmunds, Stahrl. 1979. Performance Measures for Small Business. Harvard Business Review. 57, no. 1: 172-176.
19 Chief Economic Development Officers’ Society/ County Surveyors’ Society. (April 2003). Performance Measurement for Local Authority Economic Development Phase 1 Report. Retrieved from: http://www.cedos.org/publications/0310%20performance%20report%201.pdf
20 Coylvas, Jeannette. (February 2012). Performance Metrics as Formal Structures and through the Lens of Social Mechanisms: When Do They Work and How Do They Influence? American Journal of Education, 118 (2), 167-197.
21 Educational institutions have PMs for their technology transfer programs – intersecting with an area of economic development. Some of these measures are quantifiable, including revenues, patents, licenses and start-ups generated but many other measures that are not quantifiable are not measured – including citations to academic research or the placement of graduates in private industry (Coylvas 170). How successful universities are with technology transfer has become so important to prestige as to be called a “fault line” and therefore the methodology of the measuring stick, or PM, is paramount. (Coylvas 171).
22 Coylvas.

International Economic Development Council
Making it Count: Metrics for High Performing EDOs 60
B. MEANINGFUL BENCHMARKS
It is important to develop a performance measurement system that allows for meaningful comparative analysis. A metric can be used to benchmark the performance of an organization over time (i.e. longitudinal) or in comparison to others in the same field (i.e. cross-sectional). There are arguments for both kinds of comparative methods, and both are widely used in the public and private sectors.
1. Longitudinal Measurement
In a longitudinal study—when measuring impacts from Time A to Time B—it is important to have good baseline data for Time A, and this can be a challenge to obtain.23 Additionally, at Time B, the system may have captured growth between A and B but may not have captured other growth that is in progress, which might be called other “leads and seeds.”
For longitudinal measurements, the Economic Developers Association of Canada (EDAC) identifies the problem of the long gestation period of projects that can last from one to three years before a public announcement is made.24
Additionally, William Fulton believes that appraisals should be future-oriented – weighing whether the economic development strategy will focus on local job creation in high-growth emerging sectors, though questions of how to appraise a strategy in progress remain.25
2. Measuring the Organization Against Others in the Field
For cross-sectional performance metrics, it is important to differentiate between institutions (i.e. higher education, lending, etc.) in order to develop effective benchmarks for comparison. It is perhaps even more difficult to control for different contexts, including the underlying economic conditions or policy environment. This is why, when scholars have studied performance measures, they have had challenges with comparison and therefore have had to hold so many variables constant to control for the differences.26
CEDOS formulated its performance metrics as benchmarks that they say “help organizations to improve their services through comparing their performance and learning from others.27” In pursuit of national benchmarks for EDOs that would provide fair and meaningful comparisons, CEDOS had to control for differences with contextual
23 Edmunds, Stahrl.
24 Economic Developers Association of Canada (EDAC). (2011). Performance Measurement in Economic Development. Retrieved from EDAC website: http://www.edac.ca/system/resources/BAhbBlsHOgZmSSJdMjAxMS8xMC8wMy8xNl81Nl8yMV81MTJfRmluYWxfUmVwb3J0X1BlcmZvcm1hbmNlX01lYXN1cmVtZW50X2luX0Vjb25vbWljX0RldmVsb3BtZW50LnBkZgY6BkVU/Final_Report_Performance_Measurement_in_Economic_Development.pdf
25 Fulton, William.
26 Salazar, Jose, Husted, Bryan W., Biehl, Markus. 2012. Thoughts on the Evaluation of Corporate Social Performance Through Projects. Journal of Business Ethics 105, 175-186, p. 176.
27 CEDOS, April 2003, p. 9.

International Economic Development Council
Making it Count: Metrics for High Performing EDOs 61
indicators, including economic activity rates, population, and market business health. However, CEDOS was still concerned that insufficient attention was cited for “distinctive characteristics,” in particular pertaining to rural EDOs, within the national membership.28 As a result, they assigned a dedicated working group to focus on rural contextual indicators to determine whether “there are any gaps that require(d) additional indicators to meet rural circumstances.”29
A study of the Department of Public Works (DPW) in Pinellas, Florida attempted to compare metrics for communities across five states but found that just one distinguishing condition—the presence of a sales tax funding mechanism—made this difficult. As a result, they concluded the comparison did not “provide any answers to the questions posed earlier as to whether the DPW was doing the right things. . .or the divisions were providing services competitively.”30
Some organizations do not believe that cross-sectional comparisons yield productive results. The Regional Innovation Acceleration Network (RIAN) cautions against the use of cross-sectional comparisons that “pit organization against organization.”31 Instead, in addition to jobs created, wages paid, investments attracted, and revenues earned, their fifth metric is a longitudinal measure: time in place. This metric measures the change the venture development organization (VDO) is affecting over time, and RIAN claims it is important to help ascertain the success of the VDO.32
C. ACTIONABLE PMS
Malcolm McPherson discusses the importance of “future-oriented strategic measures” that match capability against anticipated need.”33 McPherson stresses the need for having not
just retrospective or “lagging indicators” of performance but having “leading indicators” that may help foretell future performance.
For example, McPherson notes that, while profitability is a lagging indicator, employee satisfaction is a leading indicator of customer satisfaction and organizational output. Leading indicators, McPherson says, are often bottom-up, reflecting processes that have outcomes.
In the field of economic development, quantitative indicators such as “the number of jobs created in the past year” are often lagging indicators of retrospective performance. (However, if charted over several years they may give information of a trend that can be useful as a prospective indicator.) Some quantitative indicators may also be leading, such as business inquiries received. However, it may also be necessary to employ qualitative 28 CEDOS, April 2003, p. 7-8.
29 Ibid, p. 8.
30 Mason, David. (2009). The Long and Winding Road- Developing Useful Performance Measures - A Real World Case Study. OD Practitioner. 41 (2).
31 Regional Innovation Acceleration Network. Metrics that Matter. Retrieved from Regional Innovation Acceleration Network website: http://regionalinnovation.org/content.cfm?article=metrics-that-matter.
32 Ibid.
33 Macpherson, Malcolm (2001). Performance Measurement in Not-For-Profit and Public-Sector Organizations. Measuring Business Excellence. 5 (2). Pp. 13-17.
International Economic Development Council
Making it Count: Metrics for High Performing EDOs 62
metrics as leading indicators to tell a story of economic development opportunities that are in progress and may be harder to measure, such as new partnerships with educational institutions for workforce training programs.
Another way to measure not just past performance but future impact is to measure outcomes and not just outputs or activities. Writing about this distinction in 2006, the Urban Institute’s Harry Hatry stated: “Outcomes are not what the program itself did but the consequences of what the program did.”34 Outcomes may tell more of a story about
longer-term impact or the multiplier effect and benefits in the community.
D. QUALITATIVE OUTCOMES
Quantitative outputs have been historically measured by EDOs in part because they are “appealingly easy to compile and report,” according to David Ammons and Jonathan Morgan.35 Ammons and Morgan note that there is also a tendency to report quantitative
outcomes such as number of industrial contacts made, trade shows attended, and meetings, because these measures are within the control of EDOs. But the authors note that communities are now seeking to go outside of their former comfort zone and measure indicators that show enhancement of local and regional competitiveness and boosting of local capacity to support private investment and economic growth.36
There are multiple challenges involved in developing a system of qualitative metrics, however, including maintaining mission alignment, effectively capturing externalities and converting qualitative benefits to a numeric scale.
1. Performance Metrics/Mission Alignment
In developing performance metrics that capture value in less quantifiable areas, the overarching concern is developing a system that measures the alignment of PMs with the overall goals of the organization. In the pursuit of high achievement on micro-indicators, the macro-goal of the mission should not be lost. Some have noted that in the pursuit of meeting individual metrics, there is the danger of treating the symptoms rather than the cause.37 For example, one can measure the number of broken windows as an indicator of blight, but this might preclude better measurements of the underlying problem. (However, it can be less costly to measure easily readable indicators.)
2. Market Value vs. “External” Value/ Efficiency vs. Effectiveness
Historically, the measure of goods that are not quantifiable in the marketplace is often described as an analysis of “externalities.” The less quantifiable metrics that economic developers seek into incorporate into a PM system might measure positive
34 Hatry, Henry (2006). Performance Measurement – Getting Results. Washington, D.C.: Urban Institute Press.
35 Ammons and Morgan, p. 6.
36 Ibid, p. 10.
37 Sawhill, John and Williamson, David. (2001). Measuring what matters in nonprofits. McKinsey Quarterly (2) pp 98-107.

International Economic Development Council
Making it Count: Metrics for High Performing EDOs 63
contributions, including fostering relationships and building capacity in the workforce as well as projects in the pipeline.
Externalities can also be described as the “soft” effects. However, Epstein and McFarlan say in order to get the whole picture of an organization’s performance, they are essential, because while financial measures may capture the organization’s “efficiency,” nonfinancial measures may better address questions of “effectiveness.” These questions include: “Are we really delivering on our mission, not just meeting budget, and are we getting maximum impact from our expenditures?”38
3. Scaling Externalities
In the interest of developing an overall index of effects or impacts, it is useful to be able to integrate externalities into the scale. This is no easy task.
a. Spillover effects from a public economic development project in Chicago In the article “Integrating Hard-to-Measure Externalities into the Evaluation of Local Economic Development Projects,” Daniel Felsenstein et al. develop a system that evaluates economic development projects incorporating externalities—or what is known as “spill-over effects.”39 The model quantifies or assigns points to spillover effects, including investor confidence and visual effects on the neighborhood from economic development projects in Chicago.
For example, in Felsenstein’s model the spillover index for a project is 1,000. Both a cost-benefit analysis and a spillover index are applied to two firms vying for a contract in the city of Chicago. The fictional company PrintWorks, a minority-owned local printing firm is applying for a subsidized start-up loan. In addition to running a cost-benefit analysis, Felsenstein et al. accounts for the “hard-to-measure economic effects” on the community with a spillover index. The company scores 400 out of 1,000 as shown here.40
Metric Scoring Index for Externalities “PrintWorks” Industrial ED project41
Externality Points Livability and appearance 30 Investor confidence in neighborhood 45 Resident Consumer benefits 0 Neighborhood employment opportunities 90 Race/gender employment opportunities 60 Local ownership 90
38 Epstein, M. , & McFarlan, F. (2011). Measuring the efficiency and effectiveness of a nonprofit's performance. Strategic Finance, 93(4), 27-34.
39 Felsenstein, Daniel. Persky, Joseph and Wiewel, Wim. (1997) Integrating Hard-to-Measure Externalities into the Evaluation of Local Economic Development Projects. The Town Planning Review, 68 (1), pp. 55-79.
40 It is assumed by this author that each of the categories has a possible high score of 125 based on an equal distribution.
41 Felsenstein et al, Appendix 3, p. 77.

International Economic Development Council
Making it Count: Metrics for High Performing EDOs 64
Neighborhood organizational capability 0 Race/gender ownership 85 Total Points 400
Felsenstein contrasts this score with that of another fictional company, Global Informax, which is a high-tech printing subsidiary of a multinational corporation that plans to locate in a fully developed neighborhood and has no significant local or minority ownership. It scores only 30 on the spillover index.
In Felsenstein’s hypothetical situation, Global Informax contributes significantly lower positive spillover benefits, but based on the cost-benefit analysis, it promises greater monetized benefits. The local officials are left with a judgment call; however, at least they have the benefit of full information, measuring not just quantitative returns but qualitative returns, including social returns and long-term investment returns for the neighborhood.
b. Measuring corporate social performance Scaling is the methodology of choice for converting qualitative or soft benefits to numbers in other fields as well, including in the more highly quantitative field of corporate social responsibility (CSR) research, which grapples with how corporate social performance can be measured. In one study, Salazar et al. develop performance measures for a hypothetical social initiative of a multinational corporation providing assistance to people with build-it-yourself housing in low-income areas.42
Since the main goals of the program are to 1) reduce the time and cost of do-it-yourself construction in low income areas and 2) increase the welfare of families in terms of credit and relationships in the community, both quantitative and qualitative or scalar measures were needed. The questionnaire assigned some actual numbers to questions (i.e. how many dollars saved) and some points on a 1-5 scale (i.e. did you increase your relationships with neighbors in the program?).43
Management and Performance Measurement Frameworks
There are a number of popular management frameworks that have been developed for organizations over the past few decades. The following are some of those that have been used or could be used to develop a performance metrics model for economic development organizations in the United States.
A. LOGIC MODEL
The logic model was developed in the 1970s and EDOs have widely cited it in their discussion of performance metric systems. It offers a four-fold setup for performance 42 Salazar, Jose, Husted, Bryan W., Biehl, Markus. 2012. Thoughts on the Evaluation of Corporate Social Performance Through Projects. Journal of Business Ethics 105, pp. 175-186.
43 Ibid, pp. 184-185.

International Economic Development Council
Making it Count: Metrics for High Performing EDOs 65
measurement. Hatry developed the following definitions, though there are several other variants of these definitions by other scholars.
• Inputs – “Resources such as money, staff time and other items used to produce outputs and outcomes. Inputs indicate the amount of a particular resource that is actually used to produce a desired result.”
• Activities – “The actions a program takes to achieve a particular result.” • Outputs – “The amounts of products created and services delivered in a reported
period, such as number of training programs conducted, number of classes taught, or number of clients served; and,” amounts of products.”
• Outcomes – “Changes in knowledge, skills, attitudes, values, behavior, or conditions that indicate progress toward achieving the program’s mission and objectives. Outcomes are linked to a program’s overall mission.”
Hatry places an emphasis on the fourth category, “outcomes,” which he says are most important because: “Outcomes are not what the program itself did but the consequences of what the program did.”44
John Warren illustrates how this model might correspond to metrics for the field of economic development.45
Inputs Activities Outputs Outcomes
• Money • Staff • Volunteers • Facilities • Equipment • Supplies
• Tourism • Business
Recruitment • International
Trade
• Number of Inquiries • Number of
Companies Assisted • Number of Projects
Completed
• Job Growth • Capital Investment • Sales Figures of
Client • Income Growth
It should be noted that these categories have been interpreted in different ways. While Hatry defines activities as actions a program might use to achieve a result, he actually classifies the programs or program areas themselves as activities. Elsewhere, as in the CSP literature, activities refer to specific actions such as donations or fundraisers.
Epstein and McFarlan utilize Hatry’s definitions but add a fifth category denoting “impacts” in the article “Measuring the Efficiency and Effectiveness of a Nonprofit’s Performance.”46
In their analysis, outcomes are more specific to the audience that receives the services will impacts include spillover effects to the “community and society as a whole.”
What seems most important is consistency and clarity in interpretation of the categories.
44 Warren, John. (May 2005). The Role of Performance Measurement in Economic Development. Retrieved from Angelou Economics website: http://www.angeloueconomics.com/measuring_ed.html 45 Warren.
46 Epstein and McFarlan.

International Economic Development Council
Making it Count: Metrics for High Performing EDOs 66
B. THE BALANCED SCORECARD FRAMEWORK – A BUSINESS PERSPECTIVE One of the most influential models used in business is the “balanced scorecard.” It was introduced in “The Balanced Scorecard: Measures That Drive Performance,” a 1992 article by Robert Kaplan and David Norton. They conceptualize a framework for evaluating performance metrics for both financial and operational measures that includes evaluating an organization’s ability to create value moving ahead.47 The “balanced scorecard” was
developed with the purpose of “focus(ing) the attention of a company’s top executives on a short list of critical indicators of current and future performance.”
This approach spawned an organization, The Balanced Scorecard Institute, which consults businesses on management based on the balanced scorecard. They define it as “a strategic planning and management system used to align business activities to the vision and strategy of the organization, improve internal and external communications, and monitor organizational performance against strategic goals.”48
In Kaplan and Norton’s article, they develop a model with four perspectives to help answer four key questions. Their “innovation perspective and learning perspective” is what they call the “driver of future performance.”49
• Customer perspective – How do customers see us?
• Internal business perspective – What must we excel at?
• Innovation and learning perspective – Can we continue to improve and create value?
• Financial perspective – How do we look to shareholders?
Their article provides a scorecard in which the authors have developed performance metrics for a semiconductor company. The specific metrics on the balanced scorecard can be adapted for organizations of other types. The following is a table that combines metrics for businesses that Kaplan and Norton identified along with possible corresponding areas of metrics for economic developers.
Goals Indicators for Semiconductor Company: Kaplan and Norton
Examples of Potential Metrics: EDOs
1. Customer Perspective
New/Existing Products
Percentage of sales from new and propriety products
• Business Retention
Expansion and Attraction (BREA)
• Jobs • Investment
Percentage of sales from propriety products
Response supply On-time delivery (defined by customers)
47 Kaplan, R. , & Norton, D. (2005). The balanced scorecard: Measures that drive performance. Harvard Business Review, 83(7/8), 172-180. Reprint of 1992 article in same journal. Retrieved from: http://hbr.org/2005/07/the-balanced-scorecard-measures-that-drive-performance/ar/1
48 The Balanced Scorecard Institute. Retrieved from website: http://www.balancedscorecard.org/. 49 Kaplan and Norton, p. 174.

International Economic Development Council
Making it Count: Metrics for High Performing EDOs 67
Preferred suppliers Share of Key accounts' purchases
Customer partnerships Number of cooperative engineering efforts
2. Internal Business Perspective
Technology Capability Manufacturing geometry versus competition
• Staff • Technical and
technological capabilities
• Funding sources
Manufacturing excellence Cycle time, unit cost, yield
Design productivity Engineering efficiency
New Product introduction Actual introduction schedule versus plan
3. Innovation & Learning Perspective • Small businesses/
innovation • Relationship building
– partnerships, networks
• Sustainability of projects over time
• Growth/ contraction in human capital
Technology leadership
Time to develop next generation
Manufacturing learning
Process time to maturity
Product focus Percentage of products that equal 80% of sales
Time to Market New product introduction versus competition
4. Financial Perspective
Survive Cash flow • Measures of fiscal
health of organization
Succeed Quarterly sales growth and operating income by division
Prosper Increased market share & ROE
C. THE BASE OF THE PYRAMID MODEL – A NONPROFIT PERSPECTIVE Another framework focusing on nonprofits is Base of the Pyramid model, developed by Ted London in his 2009 Harvard Business Review article titled “Making Better Investments at the Base of the Pyramid.”50 His framework was dedicated to ventures including
businesses, nonprofits, and other organizations “doing business with the base of the economic pyramid (BoP)” that need “more than financials and feel-good stories to measure success.”51 He indicates that often their current performance measurement
systems are not sufficiently robust to capture the change they achieve on the ground.
London developed a framework organized around three dimensions that he says “can create more successful, sustainable business models” and serve as a “forward-looking tool” to “help managers identify and enhance the positive effects of a venture’s products and
50 London, T. (2009). Making better investments at the base of the pyramid. Harvard Business Review, 87(5), 106-113 (5). Retrieved from: http://hbr.org/2009/05/making-better-investments-at-the-base-of-the-pyramid/es
51 Ibid, p. 106.

International Economic Development Council
Making it Count: Metrics for High Performing EDOs 68
services, understand and mitigate the negative effects, and more clearly articulate current performance and prospects for improvement.”52 These are:
• Economics – Gains or losses in income, assets, or liabilities.
• Capabilities – Skills, health, and confidence individuals and communities need to help influence their surroundings, including access to training, education, and physical resources.
• Relationships – Helping BoP ventures develop new partnerships, access new networks, and give individuals and communities a greater voice.
London identified metrics to correspond to these three categories in his framework for two nonprofit organizations. The first column of the following table presents the main areas of metrics developed for the nonprofit VisionSpring, an organization that assists micro-entrepreneurs with delivering eye care in India. The second column shows examples of potential corresponding metrics for EDOs.
52 Ibid, p. 107.
Dimensions Impact Measurements – VisionSpring Nonprofit
Examples of Potential Metrics for EDOs
1. Economics
Income • BREA • Jobs • Investment • Small Businesses/ Investment
Productivity
New Businesses and Synergies
Jobs
Infrastructure
2. Capabilities
Training and education • Staff • Technical/technological
Capabilities • Strategic plan
Access to information
Goals and strategy
3. Community
Relationship with government and institutions • Relationship building -
partnerships, networks • Growth/contraction in human
capital • Environmental cost benefit
analysis • Social cost benefit analysis • Customer satisfaction
Social cohesion
Gender, race equity
Relationship with natural environment
Business inquiries

International Economic Development Council
Making it Count: Metrics for High Performing EDOs 69
Increasingly, business models are developing in which part of the metric system looks at the more quantifiable measures (i.e. in Kaplan and Norton’s model, the financial and internal business perspective, and in London’s model, economics) while part of the framework captures less quantifiable metrics (i.e. in Kaplan and Norton’s model, innovation and learning perspective, and in London’s model, capabilities.)
D. CORPORATE SOCIAL PERFORMANCE (CSP) METRICS In the last few decades there has been a move to try to create a definition and, by some, a universal index to measure corporate social performance (CSP). Corporate social performance is related to a firm’s accomplishments in the area of corporate social responsibility (CSR), which began to be incorporated into many firms’ business models starting in the 1980s under the presumption that a firm’s stakeholders extend to the community.
Jennifer Griffin summarizes much of the research on corporate social performance and addresses many of the vexing questions facing the development of a metric system, including the ultimate goal of such a system: stakeholder satisfaction (outputs) or organizational effectiveness (outcomes)?53 Again, this question opposes measures of
efficiency that quantitatively signal success with those of effectiveness that may require deeper analysis and possibly a qualitative component.
Salazar, Husted, and Bichi find that with respect to CSP, organizations report activities rather than “actual social outcomes achieved.” They advocate a move away from measurement of donations and philanthropic activities to “outcomes and impacts (e.g., lives saved, improvements in health, incomes raised, increased happiness, etc.).”54 This kind
of shift necessitates that top management look not just at aggregate performance metrics for social performances (i.e. giving), but also project-level outcomes. They write, “Without the discipline of clear benchmarks for project performance, social projects only fulfill ceremonial and symbolic purposes, which legitimize the firm, rather than move forward an agenda of improving social wellbeing.”55
The statement above captures the importance of getting performance metrics right. According to Salazar et al., PMs need to be more than just ceremonial and symbolic indicators for organizations, including EDOs, and their stakeholders. They should meaningfully reflect value measured not just from an aggregate metric figure but from a PM system that captures project-level impacts on the community.
E. OTHER ORGANIZATIONAL ASSESSMENT TOOLS There are too many other organizational indicators to mention, but the following are some of the ones often mentioned for industry and nonprofits as well as for EDOs.
53 Griffin, Jennifer (2000). Corporate Social Performance: Research Directions for the 21st Century. Business Society 39, p. 479-491.
54 Salazar, Jose, Husted, Bryan W., Biehl, Markus. 2012. Thoughts on the Evaluation of Corporate Social Performance Through Projects. Journal of Business Ethics 105, pp. 175-186, p. 176.
55 Ibid, p. 179.

International Economic Development Council
Making it Count: Metrics for High Performing EDOs 70
1. Malcolm Baldridge Assessment
In the 1980s Malcolm Baldridge, who served as President Ronald Reagan’s Secretary of Commerce from 1981 until his death in 1987, developed a set of performance criteria for organizations. The Baldridge Award, which judges companies based on the criteria he developed, is now the only award given out to organizations from both the public and private sectors to recognize performance excellence.
The Baldridge Criteria are the basis for organizational assessments with the goal of “providing organizations with an integrated approach to organizational performance management that results in the delivery of ever-improving value to patients/customers/students, the improvement of overall organizational effectiveness and capabilities, and organizational and personal learning.”
The Criteria are organized into seven categories.
1. Leadership 2. Strategic Planning 3. Customer Focus 4. Measurement, Analysis, and Knowledge Management 5. Workforce Focus 6. Operations Focus 7. Results
The “Baldridge National Quality Program,” administered by the National Institute of Standards and Technology (NIST), just completed its 25th year in 2013. In addition to having handed out over 100 awards in that time period, the program offers businesses the opportunity to complete a self-assessment and receive a comparison of their organization with others.56 This cross-sectional comparison benchmarks the organization against others in their field (e.g., education, health care, or business/nonprofit).57
2. Key Performance Indicators (KPIs)
Along with the Balanced Scorecard approach, one of the most oft-cited and used frameworks for assessing performance within a business organization is the use of KPIs. On its website, the Advanced Performance Institute provides references for books, white papers, and articles on KPIs (with many of these works also on the balanced scorecard).58 Organizations use books, software, and consultants to help them design their own KPIs that accurately measure their organization. KPIs are most associated with quantifiable measures providing “objective, uniform, and rigorous picture of reality,” but they also report balancing qualitative measures including words, pictures, and videos in their approach.
56 National Institute of Standards and Technology, Baldrige National Quality Program. Retrieved from: http://www.baldrige.nist.gov/Contacts_Profiles.htm.
57 National Institute of Standards and Technology, Baldrige National Quality Program. Retrieved from: http://www.baldrige.nist.gov/eBaldrige/Step_One.htm.
58 Advanced Performance Institute. Retrieved from: http://www.ap-institute.com/books.aspx.

International Economic Development Council
Making it Count: Metrics for High Performing EDOs 71
That said, the following are the main categories of metrics that organizations employing KPIs use.59
• Quantitative indicators, which are generally presented as a number. • Practical indicators that line with existing company processes. • Directional indicators specifying whether an organization is getting better or
not. • Actionable indicators ensuring that indicators are sufficiently in an
organization's control to effect change. • Financial indicators – Used in performance management
3. SWOT Analysis (Strengths, Weaknesses, Opportunities, and Threats)
The SWOT analysis is a frequently-used method for evaluating the Strengths, Weaknesses/Limitations, Opportunities, and Threats of business ventures. It originated in the 1970s.
Performance Metric Studies for Economic Development Organizations
In the areas of economic development and city planning, the practice of measuring less quantifiable performance metrics is increasing. Not only are transaction-based and quantifiable measures like “jobs created” and “investment leveraged” important, but so too are contributions including “building capacity in the workforce” and “industry and building relationships that foster economic development.”
A few recent studies shed more light on performance measures for local and state economic development organizations in the U.S. and abroad. The following represent some of the reports from EDOs that have recently engaged in studies on performance metric systems.
• Performance Measurement in Economic Development, the Economic Developers Association of Canada (EDAC), 2011.60
• Performance Measurement in State Economic Development Agencies: Lessons and Next Steps for Georgia Department of Industry, Trade, and Tourism, prepared by Andrew Young School of Policy Studies, February 2004.61
• Performance Measurement for Local Authority Economic Development, 2003 and Performance Indicators for Local Authority Economic Development (Phase 2), 2004, the Chief Economic Developers Society of England (CEDOS).62
59 Numerous organizations providing assistance with KPIs refer to these categories including Ready Ratios as can be referenced on their website, http://www.readyratios.com/reference/analysis/performance_indicator.html; Paper Plans http://www.readyratios.com/reference/analysis/performance_indicator.html; and numerous others in the U.S. and Europe.
60 Economic Developers Association of Canada (EDAC). (2011). Performance Measurement in Economic Development. Retrieved from EDAC website: http://www.edac.ca/system/resources/BAhbBlsHOgZmSSJdMjAxMS8xMC8wMy8xNl81Nl8yMV81MTJfRmluYWxfUmVwb3J0X1BlcmZvcm1hbmNlX01lYXN1cmVtZW50X2luX0Vjb25vbWljX0RldmVsb3BtZW50LnBkZgY6BkVU/Final_Report_Performance_Measurement_in_Economic_Development.pdf
61 Melkers, Dr. Julia and Malone, Ms. Laura. Performance Measurement in State Economic Development Agencies. 2002. http://www.housepdf.com/Performance-Measurement-in-State-Economic-Development-Agencies.html.

International Economic Development Council
Making it Count: Metrics for High Performing EDOs 72
A. CANADA – EDAC
In September 2011, the Economic Developers Association of Canada (EDAC) published a study summarizing literature on Performance Measurement in Economic Development with the goal of providing guidance to local economic developers creating their own performance metric systems.63 While EDAC initially sought to produce a standardized
template for all economic developers, the organization ultimately chose not to produce one due to the heterogeneity of its member communities.
After surveying 99 respondents, EDAC found that the kinds of metrics being used by their member organizations differed significantly. EDAC found it was not possible to streamline and centralize one performance metric system that could measure performance for all the distinct characteristics of communities.
The 99 local economic development organizations across Canada participating in the survey were asked to rate the top metrics they used. The rankings were as follows.
1. New businesses opened 2. Population 3. Full-time jobs created 4. Workforce 5. Inquiries received 6. New business investment attracted 7. Building permits – Commercial 8. Building permits – Institutional 9. Business closures 10. Unemployment rates
Not one indicator was cited by all 99 recipients, which shows the diversity of rating criteria among organizations in Canada.
EDAC produced seven recommendations for EDOs to help them develop a PM system.
1. Select a handful of metrics rather than measuring everything. 2. The metrics selected should reflect the goal of the organization. 3. Include a few metrics to show activity and outputs. 4. All metrics must have an identified data source. 5. Survey your clients. 6. Claim only what your organization played a role in. 7. Report outcomes over time.
Limits of one-size-fits-all PM system – The report is particularly sensitive to the limits of a “one-size-fits-all” performance metrics system for EDOs. The recommendations are sensitive to the varying resource capacities or “inputs” of organizations. Some may be 62Chief Economic Development Officers’ Society/ County Surveyors’ Society. (April 2003). Performance Measurement for Local Authority Economic Development Phase 1 Report. East Sussex, England and Chief Economic Development Officers’ Society/ County Surveyors’ Society. (June 2004). Performance Indicators for Local Authority Economic Development. (Phase 2 Report). East Sussex, England. Retrieved from: Retrieved from: Retrieved from: http://www.cedos.org/publications.html
63 EDAC.

International Economic Development Council
Making it Count: Metrics for High Performing EDOs 73
small in terms of staff and resources. Some may be weak in baseline data and/or capacity for data collection. The contextual variables also vary significantly (i.e. some EDOs may be in urban areas, while others are in rural areas).
Time horizons of ED projects – EDAC is also sensitive to the fact that the time horizons of projects may be long, and results are therefore not quantifiable or measurable when it comes time for an annual audit and report to stakeholders. As a result, they suggest “reporting outcomes over time,” or taking a longitudinal approach so that the community has an understanding of the cumulative long-term return on investment in economic development programs.
Credit-claiming and causality – EDAC also raises the issues of credit-claiming and causality. Often, an economic development organization cannot claim all or majority credit for an accomplishment, and questions therefore arise about whether or how it should be counted in a performance metric system. Thus, in its guidelines, it suggests organizations “claim only what your organization played a role in.” Because a claim to an accomplishment is often shared, there will always be a problem with measurement error in this area. This is not something that can ever be totally solved, but it is something economic developers should be careful about. Perhaps more difficult to isolate is that there may be other causes in the environment—including macroeconomic condition—that help account for success or failure, thereby affecting scores on the PM scale.
B. STATE OF GEORGIA, 2004
The 2004 study “Performance Measurement in State Economic Development Agencies” completed by Melkers and Malone for the State of Georgia’s Department of Industry, Trade, and Tourism examined PM systems in economic development agencies in 41 states and produced a set of guidelines for EDOs establishing metric systems.64
The study surveyed key managers in state economic development agencies nationwide and produced several findings, including the following.
• 68% of agency respondents were using some performance measures.
• 76% partook in on-going data collection.
• 51% of respondents said all major activities in their organizations had PMs.
• 65% said the PM system was initiated internally, while 38% referenced state reporting requirements.65
• 10% used consultants in developing PMs.
The following were the most important “outcome measurements” reported by Division Directors in the areas of tourism, business recruitment and international trade.66
64 Melkers and Malone.
65 Ibid, p. 7-9
66 Ibid, p. 13

International Economic Development Council
Making it Count: Metrics for High Performing EDOs 74
Tourism
• Return on Investments
• Economic Impacts
• Number of Inquiries
• Market Share
Business Recruitment
• Number of Companies
• Assisted
• Process/Activity Reports
• Marketing/Advertising Effectiveness
International Trade
• Sales Figures (of client companies)
• Client Satisfaction
• Number of new clients
As a result of research into performance metrics and survey results from programs around the country, the guidelines developed for the State of Georgia were as follows.67
• Measures should reflect activities, but also outputs and most importantly outcomes (e.g., the results of your activities). Some aspect of quality and customer satisfaction should be part of the outcome measures as well.
• Measure should be identified for major activities, as opposed to all activities.
• Targets should be specified separately from measures.
Some measures may make sense to track on a monthly basis, whereas others will only be meaningful on a quarterly, semi-annual, or even annual basis. This then will drive the data collection.
• All measures must be explicitly defined.
• All measures must have a specified data source.
• All measures should be revisited following a period of data collection (for at least six months) to determine their usefulness and value.
• Measures that require client input/feedback will involve the development of data collection instruments.
EDAC strongly endorsed the above guidelines in its 2011 report. EDAC says that while these guidelines were developed for the state of Georgia, “they are applicable to all economic development organizations.”68
67 As found in EDAC, 2011, pp. 24-25. The citation is to a report by Melkers and Malone of the same title from 2004, with their authorship listed along with the Andrew Young School of Policy Studies at Georgia State University.
68 EDAC, p. 25.

International Economic Development Council
Making it Count: Metrics for High Performing EDOs 75
Monitoring the PM system – The guidelines in this report offer more specific suggestions for the development and follow-up of the metrics than the other two reports. They discuss not only the need for an explicit definition of metrics and careful specification of data source, but also for a system of follow-up to check the continuing relevance of the metrics and also careful attention to the intervals for measurement of PMs (i.e. some should be tracked monthly, others semi-annually or annually).
Monitoring not just Activities but Outputs – In their study, the authors found that “activity and process measures are reported to be most common by central agency staff.”69
C. CHIEF ECONOMIC DEVELOPERS SOCIETY OF ENGLAND (CEDOS) CEDOS began its project to develop a system of performance measurement for local authority economic development activity in 2000. CEDOS coauthored the report with the County Surveyors’ Society. The Local Government Association and the Audit Commission were also engaged in the project to develop a national set of contextual and performance indicators for economic development and a benchmarking framework for EDOs in the United Kingdom.
CEDOS completed two reports. Phase 1, which was released in April 2003, discusses principles behind the development of indicators. Phase 2, which was released in June 2004, delivers indicators and definitions of performance metrics to be used as a benchmarking service for CEDOS members (i.e., economic development organizations in England).70
CEDOS surveyed its members to indicate their use and ranking of important performance measurements. As a result, in Phase 2 of the report CEDOS created a national benchmarking service for EDOs that contained the following performance metrics.
69 Melkers and Malone, p. 11.
70 CEDOS, 2003.
Business Support Inward Investment Land & Premises Training & Employment
• Businesses assisted
• Business start-ups supported
• Jobs created/ safeguarded
• Customer satisfaction
• Investments • Companies
assisted • Jobs created/
safeguarded • Cost per job • Customer
satisfaction
• Brownfield land reclaimed
• Workspace occupancy rate
• Leverage of external funding
• Jobs supported • Cost per job/ per
sq. meter of floor space
• Business survival • Business growth • Customer
satisfaction
• Unemployed people going into employment/ full time education
• Customer Satisfaction

International Economic Development Council
Making it Count: Metrics for High Performing EDOs 76
The key principles underpinning their set of performance indicators are:
• Few in number;
• Easy to collect;
• Easy to understand;
• Effective measures of performance;
• Adequate to define the results of economic development activities; and
• Directly related to the outcomes of local authorities’ actions.
CEDOS also lists additional principles that should underpin economic developers, many of which are concerned with precision of measurement i.e., cautioning against the use of overly broad indicators that may not reflect local actions, differentiating direct from indirect impacts, and impact that is the result of a single EDO from one that is the result of a partnership.
Clarity/User-friendliness – CEDOS pays careful attention to the need for simplicity and user-friendliness in the PM system, stipulating that indicators should be few in number, easy to collect, and easy to understand. Given a system that might be deployed nationally to EDOs with varying resource capabilities, these criteria are important. A system that is more limited in its number of indicators might also better facilitate the comparative and cross-sectional use of the results across areas that CEDOS intends.
Adjustments for Local Conditions/Rural Adjustments – All of CEDOS’ indicators are quantitative measures. CEDOS provides significant guidance to ensure the measures are well-defined so that the measurements reflect accurately the impacts of a particular EDO in that area. The organization also recognizes the need to adjust benchmarks for rural areas that have different economic characteristics.
D. COMMON METRICS AND COMPARISON When looking at the preceding three studies of economic development organizations, there are many metrics in common among the three reports. The following are the most salient common guidelines for performance metric systems across the three reports discussed above.
• Limit the Number of Metrics
• Clearly Define Metrics
• Metrics Should Reflect the Mission
• Data Collection Quality Control (i.e., Data should be collected systematically and at appropriate intervals.)
• Members Should be Surveyed
• Customer Satisfaction is Important
• Take Care Claiming Credit (Sometimes credit should be shared, and sometimes there are other factors of causality like macro-economic conditions.)
Additionally, below is a comparison of the guidelines included in the three reports regarding developing performance metrics.

International Economic Development Council
Making it Count: Metrics for High Performing EDOs 77
Guidelines for PMs EDAC State EDOs CEDOS
Few in Number x x
Reflect Mission x
Reflect Output, Not just Activity x x x
Data Collection QC x x x
Survey clients x x x
Attention to Individual Claim/Partnership x
x
Report over Time – Longitudinal x Report comparisons B/T areas - Cross-Sectional
x
Rank Activities
x
Carefully Design Tracking System x Revisit PMs
x
Define/clarify measures
x x
Measure customer satisfaction x * “Measures to create jobs” and “Effective measures of performance” (CEDOS categories) were omitted based on the assumption that the categories were applicable to all.
E. THE SMART MODEL The SMART model is widely used to help management develop and achieve organizational objectives. The model has been widely applied to industry and organizations, including EDOs, since the 1980s. The acronym stands for Specific, Measurable, Achievable, Relevant, and Time-based. Some credit George Doran with its development in 1981.71
John Warren of AngelouEconomics applied the model to economic development as follows.72
• Specific – Establishing a lofty measurement that sounds good but is not specific
will not give you the credibility you need or help your program accomplish its goals. Performance measurements need to be as specific as possible so that people investing in economic development efforts know how those efforts are going to be measured.
• Measurable – There’s an old saying, “If you don’t know where you’re going, any
road will get you there.” A performance measurement is only useful if you can actually measure it, either by quantifying it with specific numbers or verifying through qualitative means that the goal has been accomplished.
• Achievable – Make sure that your performance measures can actually be
accomplished. Setting a goal that is impossible to achieve will only cause frustration. It is all right, however, to set ambitious goals that stretch your organization. Everyone needs to reach a little beyond their grasp.
71 Doran, G. T. (1981). There's a S.M.A.R.T. way to write management’s goals and objectives. Management Review, 70(11), 35.
72 Ibid.

International Economic Development Council
Making it Count: Metrics for High Performing EDOs 78
• Relevant – Performance measurements need to be relevant to your organization’s
mission and your program’s strategic objectives.
• Time-based – Make sure that performance measures are achieved within a specific
period.
Additional Information – Historical Background on Performance Metrics
The definition and application of performance metrics (PMs) has evolved in recent decades. In 1995, A.D. Meely defined PMs as tools “used to quantify the efficiency and/or effectiveness of an action.”73 Performance measurement in industry—and increasingly
government, nonprofits, and EDOs—has been evolving for over a century, as Meely discusses in a 2003 literature review.”74
As Jeannette Colyvas writes, “Performance metrics are among the most salient links between data use and organizational improvement.”75 Performance measures help
organizations both think about their own practices and activities as well as the “larger missions in which they are embedded.”76 PMs may be constructed from within an
organization or may be professional standards that are experts promote in a top-down fashion as a means of benchmarking individuals and organizations. PMs yield significant power and consequence and can become a source of contention. Because they can be used to benchmark, rank, and compare individuals and organizations, they can not only measure practice but also affect practice.
As reviewed by Mark Richard Lindblad, the field of PM first became directly applied to local government organizations in the 1930s book Measuring Municipal Activities by Ridley and Simons.77,78 In the 1990s, the federal government increasingly required performance
metrics within its agencies, and many local governments began to follow suit. In 1994, the International City Manager’s Association began the Comparative Performance Measurement Program to enable local governments to share information.79 Lindblad
discusses how, while PM within local government began to increase and has received some attention from scholars and analysts, attention to PM in local ED has lagged. 73 Neely, A.D., Mills, J.F., Gregory, M.J. and Platts, K.W. (1995) Performance measurement system design – a literature review and research agenda.” International Journal of Operations and Production Management, 15 (4), pp. 80-116.
74 Bourne, Mike and Neely, Andy. (2003). Implementing performance measurement systems: a literature review. International Journal Business Performance Management, 15 (1).
75 Coylvas, Jeannette. (February 2012). Performance Metrics as Formal Structures and through the Lens of Social Mechanisms: When Do They Work and How Do They Influence? American Journal of Education, Vol. 118 (2), pp. 167-197.
76 Ibid, p. 167.
77 Lindblad, Mark Richard. (2006). Performance Measurement in Local Economic Development. Urban Affairs Review. 41, pp. 646-672.
78 Lindblad points to the following book as being seminal in the field of performance measurements for local government. Ridley, C.E., & Simon, H.A. (1938). Measuring Municipal Activities. Chicago: International City Managers' Association. The authors wrote several other pieces around the similar time period on the topic.
79 Lindblad, 2006.

International Economic Development Council
Making it Count: Metrics for High Performing EDOs 79
New Approaches to Performance Measurement
In recent years, a myriad of new approaches to performance measurement have been developed. IEDC analyzed several approaches used in economic development organizations. Some of these approaches borrow old concepts from fields like finance, technology, and environmental science and adapt them for economic development. Other new approaches are based on changing values in economic development, which is a greater recognition of how social and environmental goals impact economic ones. Finally, some new approaches apply organizational science to how economic development organizations interact with the community.
The new performance measurement approaches discussed in this section are as follows.
• Relationship building focuses on creating long-term relationships, and metrics are tailored to measure how each party perceives the relationship.
• Capacity building focuses on the commitment, resources, and skills within a community or organization to build on its strengths to address problems and to seize opportunities.
• The customer satisfaction approach measures how the target audience views the relevance and helpfulness of an economic development organization or program.
• The ratio of effort to results approach measures the efficiency of an enterprise by calculating its marginal benefits and costs.
• Social return on investment (SROI) quantifies the “social impacts” of an enterprise by taking into account social, environmental, and cultural outcomes as well as economic ones.
• Program sustainability emphasizes the ability of an enterprise to leverage resources to be effective over time.
• Environmental cost benefit analysis quantifies the impacts of an enterprise on the environment and on public health.
• Moving from partnerships to aligning organizations requires examining the degree to which organizations share values, beliefs, and behaviors.
• The growth of powerful networks approach quantifies the growth in the breadth and depth of economic development networks.
• Progress in open source collaborations measures the extent and effectiveness of an EDO’s grassroots engagement on economic development initiatives.
Relationship Building
Relationship building focuses on creating long-term relationships, and metrics are tailored to measure how each party perceives the relationship.
Relationship building is a relatively new approach to metrics that emphasizes long-term relationships instead of short-term outcomes. Relationships depend on organizational

International Economic Development Council
Making it Count: Metrics for High Performing EDOs 80
culture, which is built over time. According to Gallagher et al. (2008), organizational culture ultimately drives business performance, not profitability.80 In fact, profitability is a lagging indicator rather than a leading one. The same concept could be applied to EDOs. Metrics that measure an EDO’s relationship with its target audiences and stakeholders ultimately best describes its performance.
There are some traditionally-measured EDO metrics that capture aspects of external relationship building, typically looking at EDO relationships with potential and existing businesses, public sector and private sector funders, and with the larger community. These metrics include the following.
• “Active” prospects in the pipeline
• Businesses attracted to region
• Businesses expanded
• Companies participating in regional organization programs
• Local business to business investment levels
• Number of businesses assisted/Referrals closed
• Number of businesses counseled
• Public and private sector involvement (measures through stakeholder satisfaction surveys)
• Relationships established between local EDO representatives and emerging companies
• Value added
• Private sector funding increased
• Private sector funding retained
• Public sector funding retained
• Charitable donations
• Volunteerism to improve the community, hours However, these do not capture the full extent of relationship building, because relationships are difficult to quantify. Measurement of a relationship has much to do with perception (i.e., how each party that perceives the relationship defines its strength). Thus, the strength of a relationship may sometimes depend more on communication than on good intentions or quantifiable actions. One approach is to build a system of metrics around the critical elements of a relationship. Hon and Grunig (1999) identify six elements of a relationship.81
1. Control Mutuality – This is the “degree to which parties agree on who has the rightful power to influence one another.” Mutual control requires that two parties be attentive to each others’ opinions and sincerely consider them.
2. Trust – Trust is defined as “one party’s level of confidence in, and willingness to open oneself to, the other party.” Trust has three dimensions: integrity,
80 Gallagher, S., Brown, S. and Brown, L. (2008 Spring). A Strong Market Culture Drives Organizational Performance and Success. Employment Relations Today, 35:1. 81 Han, L.C. and J.E. Grunig. (1999). Guidelines for Measuring Relationships in Public Relations. Institute for Public Relations. Retrieved from http://www.aco.nato.int/resources/9/Conference%202011/Guidelines_Measuring_Relationships%5B1%5D.pdf.

International Economic Development Council
Making it Count: Metrics for High Performing EDOs 81
dependability, and competence. Integrity requires that both parties feel they are being treated fairly and with consideration. Dependability means each party can rely on the other to keep its promises. Competence requires parties to have faith in each other’s skills and abilities to complete a task.
3. Satisfaction – Satisfaction is “the extent to which each party feels favorably toward one another because positive expectations about the relationship are reinforced.” Satisfied parties feel happy from the relationship and enjoy dealing with each other.
4. Commitment – Commitment is “the extent to which each party believes and feels that the relationship is worth spending energy to maintain and promote.” Commitment is a belief in the long-term viability of the relationship and the desire to maintain it.
5. Exchange Relationship – “In an exchange relationship, one party gives benefits to the other only because the other has provided benefits in the past or is expected to do so in the future.” Parties in an exchange relationship expect to trade favors rather than provided or gain one-sided benefits.
6. Communal Relationship – “In a communal relationship, both parties provide benefits to the other because they are concerned for the welfare of the other—even when they get nothing in return.” Parties in a communal relationship will aid the other even without reciprocation.
These qualitative aspects of a relationship can be captured through specific questions that are quantified via a scale. Using these elements of a relationship, Hon and Grunig surveyed the general public on their perceptions of five organizations: General Electric, the National Rifle Association, the Social Security Administration, Microsoft, and the American Red Cross. Similarly, an EDO can evaluate its relationship with constituents by surveying key stakeholders or sampling local residents.
For example, Clatsop County, Oregon, deployed an economic development survey of local businesses and residents to assess their perceptions of the community’s quality of life, business climate, and economic development policies.82 The survey focused on key aspects of the Clatsop County government’s relationship with the community: how supportive the county government was to local business; the degree to which economic development policies support growth; opinions about which local entity should promote economic development; whether the county should use incentives to attract businesses; and a comparison of resident and business responses to the survey. Although EDOs may conduct community surveys of all kinds, it is helpful to include relationship-building metrics that capture the community’s trust of and satisfaction with general EDO services.
Relationship building is also similar to the Customer Satisfaction method, discussed later.
82 Community Service Center. (2005, March). Results of the Clatsop Economic Development Survey. Clatsop County. Retrieved from http://clatsopcounty.us/Assets/Dept_12/PDF/Results%20of%20the%20Clatsop%20County%20Economic%20Development%20Survey.pdf

International Economic Development Council
Making it Count: Metrics for High Performing EDOs 82
Community and Organizational Capacity Building
Capacity building focuses on the commitment, resources, and skills within a community or organization to build on its strengths to address problems and to seize opportunities.
Although communities may appear strong when times are good, their true strength is often demonstrated by their resiliency in hard times. The communities that have strong existing capacity and the ability to quickly deploy their resources, manpower, and external network are the ones most likely to emerge stronger. Rather than brave challenges blindly, economic developers can measure and plan capacity ahead of time.
However, defining the capacity of a community or organization can be difficult—much more so measuring it. Individual capacity impacts organizational capacity. Organizational capacity, along with social, economic, and environmental outcomes, impacts community capacity. Further, the whole is often more than the sum of the parts. Measuring capacity, then, requires monitoring outcomes to some extent on three levels: individual, organizational, and community. Here are some traditional metrics that help capture these three levels.
• Businesses attracted to region
• Businesses expanded
• Companies participating in regional organization programs
• Local business-to-business investment levels
• Number of businesses assisted/Referrals Closed
• Number of businesses counseled
• Public and private-sector involvement (measured through stakeholder satisfaction surveys)
• Relationships established between local EDO representatives and emerging companies
• Value added
• Private-sector funding increased
• Private-sector funding retained
• Public-sector funding retained
• Charitable donations
• Volunteerism to improve the community (in hours)
• Businesses created
• Capital investment
• Cost savings from EDO's applied research programs
• Direct financial returns on investments
• Earned media
• Emerging companies remaining and growing in region
• Expansion in services provided
• Integration of university R&D and technology transfer with regional ED
• Positive media hits (local/national/international recognition)
• Re-brand region to generate more business development opportunities
• Tax revenue/tax-base growth
• Cost of living
• Emission reductions
• Energy/renewable provided, types, amount, or capacity
• Participation by minorities, women, and immigrants
• Number of people/businesses served
• Transmission lines (in miles)
• Improve region’s “competitive position” in the global economy
• Miles of railroad built
• Educational opportunities for entrepreneurs

International Economic Development Council
Making it Count: Metrics for High Performing EDOs 83
The Aspen Institute, an education and policy nonprofit, systematically breaks down community capacity into several broad outcomes.83
1. Expanding, diverse, inclusive citizen participation 2. Expanding leadership base 3. Strengthened individual skills 4. Widely shared understanding and vision 5. Strategic community agenda 6. Consistent, tangible progress toward goals 7. More effective community organizations and institutions 8. Better resource utilization by the community
Each outcome is associated with a set of indicators and sub-indicators. For example, the table on the following page describes the metrics for economic development organizational capacity. Using these metrics, EDOs can take inventory of local, state, and regional organizations serving their community. First, EDOs must identify the relevant organizations to economic development and their essential functions. Then, they can assess the internal health of these organizations, examining important factors like leadership, strategic plans, resources, and organizational structure by interviewing each stakeholder. In addition, external health measures capture how well organizations are connected with each other and work together. These include relationships with common customers (i.e., private sector, government, and the community) as well as cross-fertilization between groups. Finally, EDOs can assess the community’s participation and perception of organizations. This holistic approach captures not only the capacities of individual organizations but can shed light on gaps and overlaps in services across all organizations.
Indicator Sub-indicators Examples of Metrics
Range of economic development organizations
Key stakeholders List of key constituencies; number of organizations serving each constituency; number of constituencies not served
Essential functions of each stakeholder
List of key functions; number of functions served by existing organizations; quality of service
Internal health of organizations
Learning/leadership If there are orientation programs, ongoing staff training, leadership transition, self-assessment, etc.
Strategy If there is a strategic plan, process for developing one, links with organization priorities and community priorities, etc.
Resources Number of members; percent increase in budget; amount raised through fundraising
Organization structure If there are bylaws, board of directors, committees; number of members satisfied
83 The Aspen Institute. (n.d). Tools for practice: Measuring Community Capacity Building: A workbook-in-progress for rural communitites, version 3-96. The Aspen Institute: Rural Economic Policy Program. Accessed from http://www.aspeninstitute.org/sites/default/files/content/docs/csg/MEASURING_COMMUNITY_CAPACTIY_BUILDING.PDF.

International Economic Development Council
Making it Count: Metrics for High Performing EDOs 84
External health of organizations
Business/private sector relations
If local business provide support; amount and length of support; number of collaborations
Cross-fertilization with other groups
If there are new, diverse partnerships; number of collaborative projects
Government relations Number of collaborative projects involving government agencies; quality of government technical assistance
Community effectiveness
Number of citizens who recognize name of organization, know its mission, or think it is effective
Community climate/spirit
Sustainability of community organizations
Age of organizations; percent of organizations with intergenerational leadership; percent with increasing membership
Celebration of community organizations
Number of positive or negative stories in media on organization; number of events held
Power relationships List of community “gatekeepers”; quality/level of communication among organizations
Handling of diversity issues
Number of generational/racial/cultural conflicts in community; percent change in incidents
Customer Satisfaction
The customer satisfaction approach measures how the target audience views the relevance and helpfulness of an economic development organization or program.
Customer satisfaction involves both “hard” outcomes and “soft” perceptions. There is a bottom line to customer satisfaction. Research shows that, when an economy grows and people’s purchasing power expands, customer satisfaction increases even if customer service has not changed from before.84 In other words, customers who are generally more happy are also likely to rate a specific program more highly. In addition, studies confirm that psychological and economic perspectives are both important to customer satisfaction. This is true not just for a few types of people or products but across individuals and product categories.85 Customers want to feel engaged as well as have their bottom line served.
Economic developers are well familiar with the need to demonstrate results through numbers as well as the importance of ensuring that key stakeholders feel engaged. One example of a customer satisfaction survey close to the economic development world is one commissioned by the State of New Hampshire. The state deployed a survey to
84 Frank, B. and T. Enkawa. (2008, March). How Economic Growth Affects Customer Service. Asian Pacific Management Review. 13(2): 531-544. Retrieved from http://apmr.management.ncku.edu.tw/comm/updown/DW0806261223.pdf. 85 Johnson, M.D. and C. Fornell. (1990, March 2). A framework for comparing customer satisfaction across individuals and product categories. Journal of Economic Psychology. 12(1991): 267-286. Retrieved from http://deepblue.lib.umich.edu/bitstream/2027.42/29302/1/0000365.pdf.

International Economic Development Council
Making it Count: Metrics for High Performing EDOs 85
evaluate satisfaction with its services. The survey explores five dimensions of customer satisfaction and ten sub-dimensions.
Five Dimensions with 10 Determinants of Service Quality Matrix86 Dimension #1 Serving Well
Dimension #2 Conveying Courtesy and Respect
Dimension #3 Earning Trust
Dimension #4 Inviting In
Dimension #5 Program Effectiveness
Reliability Timeliness Accuracy
Responsiveness Helpfulness Courtesy Communications
Competence Expertise Credibility Understanding the customer Security
Access Available information Tangibles
Determinants vary by program
These overarching principles apply to all departments within the New Hampshire state government, but the metrics are specific to each department. For example, the following are sample questions for the Department of Resources and Economic Development, in both statement and question formats.
Statement Format
Instructions:
To what extent do you agree or disagree with the following statements about our service?
Scale: Strongly Disagree, Disagree, Agree, Strongly Agree
Questions:
The NH Department of Resources and Economic Development (DRED) provides services in a timely manner. [Timeliness]
DRED provides services correctly the first time. [Accuracy]
Employees of DRED demonstrate a willingness to help customers. [Helpfulness]
Employees of DRED demonstrate knowledge and expertise. [Expertise]
DRED makes information easily available. [Available information]
86 New Hampshire Division of Personnel. (2009, February). How to Measure Customer Satisfaction In New Hampshire State Government. Retrieved from http://www.google.com/url?sa=t&rct=j&q=&esrc=s&source=web&cd=1&ved=0CDEQFjAA&url=http%3A%2F%2Fadmin.state.nh.us%2Fhr%2Fdocuments%2FWorkforce_Development%2FHow%2520to%2520Measure%2520Customer%2520Satisfaction%2520in%2520New%2520Hampshire%2520State%2520Government.doc&ei=gJt-UezNNYH94AOV-4CADw&usg=AFQjCNEpsTJ3WpAC6LzOKumxKJf-b_WuRQ&bvm=bv.45645796,d.dmg&cad=rja

International Economic Development Council
Making it Count: Metrics for High Performing EDOs 86
Question Format
Instructions:
Please answer the following questions regarding your rating of our service.
Scale: Poor, Below Average, Above Average, Excellent
Questions:
1. How would you rate the timeliness of the services provided by DRED? 2. How would you rate the ability of DRED to provide services correctly the first time? 3. How would you rate the helpfulness of DRED’s employees? 4. How would you rate the knowledge and expertise of DRED’s employees? 5. How would you rate the availability of information at DRED?
As with any survey, non-response bias can produce misleading results. For example, it is possible that only customers on the extreme ends of satisfaction—very satisfied or very dissatisfied—may respond. Thus, it is important to summarize responder profiles before displaying survey results. Further, an EDO should check if non-responders have any common attributes. If there are large non-response rates from certain customer groups, an EDO may want to consider whether it is making their customers aware of what they do or if there are gaps in customer service.
Ratio of Efforts to Results/Return on Investment
The ratio of effort to results approach measures the efficiency of an enterprise by calculating its marginal benefits and costs.
Within finance, return on investment (ROI) measures how many times an investor earns back his or her initial investment from the profits of a venture. The ratio of efforts to results is akin to the idea of ROI. A higher ratio of efforts to results indicates a higher return on investment.
Various inputs go into efforts and results. Efforts can be measured in terms of program investment, staff salaries, and volunteer time. Results are measured with more disparate metrics, since different organizations have different goals. For example, a survey by the Wisconsin Economic Development Institute found that the most common ROI metrics used by economic development organizations in Wisconsin are testimonials, public/private investment, number of businesses assisted, jobs created or retained, and land or buildings sold (see following page for full results).87
Metrics for measuring ROI can also be tailored to the type of economic development program. The following are some metrics used to measure ROI for incubators, tax increment financing districts, and development zones.
87 Nacker, R. (2002, October). Measuring Economic Development Return On Investment (ROI): Wisconsin Models. Wisconsin Economic Development Association, Inc. Retrieved from http://www.wisconsin.edu/summit/archive/2002/papers/nacker.pdf.

International Economic Development Council
Making it Count: Metrics for High Performing EDOs 87
Incubator Success Report TIF Districts Development Zones
• Current Number of Tenants
• Number of Existing Jobs
• Occupancy Rate (Footage or Suites) (%)
• Number of Graduates • Number of Failed
Businesses • Success Rate (%)
• Beginning Assessment • Current Assessment
• Number of Certified Businesses
• Amount of Private Investment
• Number of Jobs Created
• Amount of Tax Credits Allocated
There are a number of tools that EDOs can use to calculate ROI. WebLOCI (http://webloci.innovate.gatech.edu/) is a user-friendly local government fiscal impact tool developed by the Georgia Tech Enterprise Institute. EDOs across the country have used the tool since 2006, and it can be accessed by users outside of Georgia for a fee. The REMI Model (http://www.remi.com/) is a rigorous economic modeling software offered by Regional Economic Models, Inc. Although ROI models can be complex, the process can be broken down into a few pieces. The chart below describes a model developed by the Virginia Economic Development Partnership that calculates typical inputs, multipliers and outputs of a local investment project.88
Other resources:
Governor’s Workforce Development Council. (2011, December). Smart Investments Real Results. Retrieved from http://www.gwdc.org/docs/publications/ROI_Overview.pdf
88 IEDC does not endorse the products mentioned here. Rather these are offered as examples of products available to EDOs.

International Economic Development Council
Making it Count: Metrics for High Performing EDOs 88
Figure 2: ROI Measurements Used by Wisconsin EDOs (Wisconsin Economic Development Association)
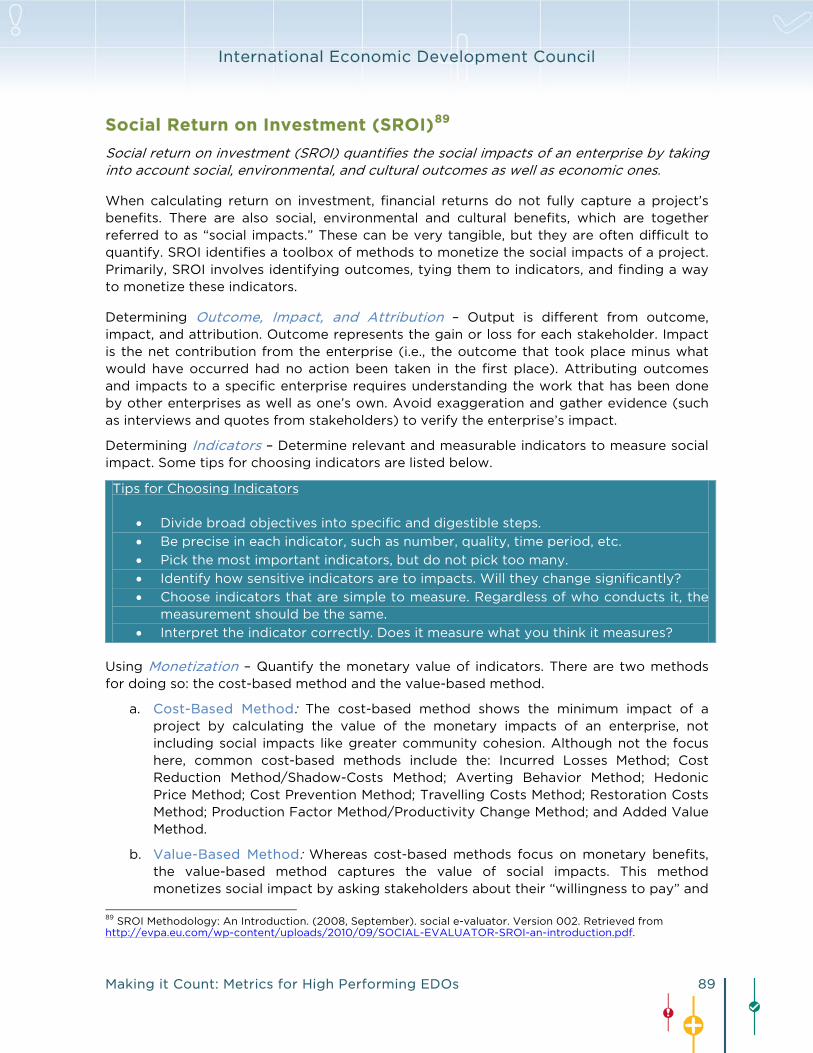
International Economic Development Council
Making it Count: Metrics for High Performing EDOs 89
Social Return on Investment (SROI)89
Social return on investment (SROI) quantifies the social impacts of an enterprise by taking into account social, environmental, and cultural outcomes as well as economic ones.
When calculating return on investment, financial returns do not fully capture a project’s benefits. There are also social, environmental and cultural benefits, which are together referred to as “social impacts.” These can be very tangible, but they are often difficult to quantify. SROI identifies a toolbox of methods to monetize the social impacts of a project. Primarily, SROI involves identifying outcomes, tying them to indicators, and finding a way to monetize these indicators.
Determining Outcome, Impact, and Attribution – Output is different from outcome, impact, and attribution. Outcome represents the gain or loss for each stakeholder. Impact is the net contribution from the enterprise (i.e., the outcome that took place minus what would have occurred had no action been taken in the first place). Attributing outcomes and impacts to a specific enterprise requires understanding the work that has been done by other enterprises as well as one’s own. Avoid exaggeration and gather evidence (such as interviews and quotes from stakeholders) to verify the enterprise’s impact.
Determining Indicators – Determine relevant and measurable indicators to measure social impact. Some tips for choosing indicators are listed below.
Tips for Choosing Indicators
• Divide broad objectives into specific and digestible steps.
• Be precise in each indicator, such as number, quality, time period, etc.
• Pick the most important indicators, but do not pick too many.
• Identify how sensitive indicators are to impacts. Will they change significantly?
• Choose indicators that are simple to measure. Regardless of who conducts it, the measurement should be the same.
• Interpret the indicator correctly. Does it measure what you think it measures?
Using Monetization – Quantify the monetary value of indicators. There are two methods for doing so: the cost-based method and the value-based method.
a. Cost-Based Method: The cost-based method shows the minimum impact of a project by calculating the value of the monetary impacts of an enterprise, not including social impacts like greater community cohesion. Although not the focus here, common cost-based methods include the: Incurred Losses Method; Cost Reduction Method/Shadow-Costs Method; Averting Behavior Method; Hedonic Price Method; Cost Prevention Method; Travelling Costs Method; Restoration Costs Method; Production Factor Method/Productivity Change Method; and Added Value Method.
b. Value-Based Method: Whereas cost-based methods focus on monetary benefits, the value-based method captures the value of social impacts. This method monetizes social impact by asking stakeholders about their “willingness to pay” and
89 SROI Methodology: An Introduction. (2008, September). social e-valuator. Version 002. Retrieved from http://evpa.eu.com/wp-content/uploads/2010/09/SOCIAL-EVALUATOR-SROI-an-introduction.pdf.

International Economic Development Council
Making it Count: Metrics for High Performing EDOs 90
“willingness to accept” the social issue at stake. One way to determine willingness is to construct a price sensitivity meter, as is done in marketing, where consumers are asked:
i. At what price would you find this product or service inexpensive? ii. At what price would you find this product or service so cheap that you
would start to have doubts about its quality? iii. At what price would you find this product too expensive? iv. At what price would you find this product or service so expensive that you
would not be willing to pay the price asked?
These questions help construct price tipping points that proxy as monetary values for the social impact of an enterprise. The SROI Ratio is then calculated as the value of social impact divided by the investment required to achieve it, as diagrammed below.
𝑺𝑹𝑶𝑰 𝑹𝒂𝒕𝒊𝒐 = 𝑽𝒂𝒍𝒖𝒆 𝒐𝒇 𝑺𝒐𝒄𝒊𝒂𝒍 𝑰𝒎𝒑𝒂𝒄𝒕
𝑰𝒏𝒗𝒆𝒔𝒕𝒎𝒆𝒏𝒕
One example of SROI analysis is the redevelopment of Oxford Castle, a heritage site in Oxfordshire, England.90 The site is owned by the Oxford County Council and comprises the city’s two oldest remaining buildings and structures. Over the course of ten years, the county transformed the site to a mixed-used development that includes an art gallery, hotel, education center, apartments, and restaurants. To assess the value of the development, the county undertook an SROI analysis. The following table describes outcomes and indicators they used and the assessed values of benefits. Specific indicators the county measured include the number of public events held at the castle, the number of visitors, the amount of increased tax revenue, total hotel occupancy, and the amount of retail spending at site attractions. 91
Stakeholder Outcome Indicator Value/Financial Proxy
Oxford citizens
Improved well-being as a result of increased wealth of Oxford citizens due to greater employment opportunities/levels
Decreased unemployment levels in the city
The annual average value of jobs created (25,428) multiplied by the number of new jobs (225 permanent, 80 temporary construction jobs which drop off after 1 year) = £7,775,540
90 The Prince’s Regeneration Trust. (2013). Case Study: Oxford Castle, Oxford. Retrieved from http://www.princes-regeneration.org/sustainableheritage/content/case-study-oxford-castle-oxford-0 91 The Prince’s Regeneration Trust. (n.d.) Social Return on Investment Analysis for the Redevelopment of Oxford Castle. Retrieved from http://www.princes-regeneration.org/sustainableheritage/sites/all/themes/prtrust/files/prt-oxford-castle-sroi.pdf
Figure 3: SROI Snapshot for Oxford Castle

International Economic Development Council
Making it Count: Metrics for High Performing EDOs 91
Stakeholder Outcome Indicator Value/Financial Proxy
Oxford citizens
Improved cultural opportunities for Oxford residents as a result of a greater variety of events being held in Oxford
Public events being held at the castle
The value of each event (7) in terms of income to the city multiplied by the number of events in a year = £280,000
Oxford citizens
Increased knowledge of the history of Oxford Castle gives citizens a greater appreciation of the castle's heritage importance
An increase in the uptake of learning opportunities about the castle
The number of visitors to the visitor centre (6160) multiplied by average admittance cost (£6.58) = £35,532
Oxford citizens
Increased well-being of residents due to increased quality of public services
An increase in local authority spending on public services
The total value of increased revenue to the local authority through business rates and council tax = £1,586,870
Oxford citizens
Wider appreciation of Oxford and its attractions increases the economy of the west end of the city
Increased number of overnight stays in Oxford
The annual turnover of the hotel = £4,014,000
Local businesses
Increased role of Oxford in the sub-regional economy leads to the increased vibrancy of Oxford's economy
Successful retail units and restaurants
The annual spending in retail units and restaurant/bars in the development = £3,373,000
Local businesses
Revitalization of west Oxford results in a more attractive environment and in turn increases local spending due to the redevelopment of Oxford Castle
Increased spending in west Oxford
Additional spending by visitors to Oxford castle attractions, shops, restaurants = £910,000

International Economic Development Council
Making it Count: Metrics for High Performing EDOs 92
Stakeholder Outcome Indicator Value/Financial Proxy
Local authority
Local authority reached greater performance targets as a result of decreased drain on resources
Decreased spending in asset management
The average cost saving of annual maintenance costs for the castle = £200,000
Environment
Increased recognition of Oxford as a sustainable city
Greater publicity of Oxford leading on sustainability projects
The cost savings by not demolishing Oxford Castle (demo costs) = £1,000,000
Central government
Increased investment in regional development (e.g. roads, schools) as a result of increased revenues from taxes from employees of Oxford Castle
Increase in public regional spending
Increased revenue to Treasury = £1,744,905; savings to Treasury through decreased long term unemployment benefit spending in Oxford = £634,400
Program Sustainability
Program sustainability emphasizes the ability of an enterprise to leverage resources to be effective over time.
Economic development goals are mostly achieved in the medium- to long-term. However, funding mechanisms are often difficult to project, and staff turnover (including in key stakeholders like local and state government) can challenge the ability of a program to operate effectively over time.
To ensure that programs are given enough time and resources to create an impact, economic developers should measure the sustainability of programs, not to mention of the EDO itself. Program sustainability metrics can help economic developers determine where and when to expand programmatic and organizational capacity.
The Center for Public Health Systems Science (CPHSS), a public health research group, outlines eight key areas of program sustainability.92
1. Political support – The internal and external political environment that influences program funding, strategies, initiatives, and acceptance.
92 Program Sustainability Assessment Tool (2012). Center for Tobacco Policy Research. Washington University. Retrieved from https://researchtoreality.cancer.gov/sites/default/files/SustainabilityTool_w_ScoringSheet%5B1%5D.pdf

International Economic Development Council
Making it Count: Metrics for High Performing EDOs 93
2. Funding stability –The ability to make long-term plans based on a stable funding environment.
3. Partnerships – The connection between program and community. Community is meant broadly and can exist at the local or state level.
4. Organizational capacity – The resources needed to effectively manage the program and its activities.
5. Program evaluation – The monitoring and evaluation of process and outcome data associated with program activities.
6. Program adaptation –The ability to adapt and improve in order to ensure effectiveness.
7. Communications – The strategic dissemination of program outcomes and activities with stakeholders, decision-makers, and the public.
8. Strategic planning – The process that defines program direction, goals, and strategies.
CPHSS includes a toolbox of indicators for each area of sustainability, with most of the indicators being qualitative measures (e.g., measuring on a scale of one to seven whether “the program communicates with community leaders.”) For example, the chart below lists indicators for assessing funding stability for an organization.93 The major considerations for financial stability have to do with the economic climate, proactive policies to ensure sustained funding, diversity of funding streams, combination of stable and flexible funding, and amount of sustained funding.
Stability: Establishing a consistent financial base for your program
To little or no extent To a very great extent
Not able to answer
1. The program exists in a supportive state economic climate.
1 2 3 4 5 6 7 NA
2. The program implements policies to help ensure sustained funding.
1 2 3 4 5 6 7 NA
3. The program is funded through a variety of sources.
1 2 3 4 5 6 7 NA 4. The program has a combination of stable and
flexible funding.
1 2 3 4 5 6 7 NA
5. The program has sustained funding.
1 2 3 4 5 6 7 NA
93 Program Sustainability Assessment Tool (2012). Center for Tobacco Policy Research. Washington University. Retrieved from https://researchtoreality.cancer.gov/sites/default/files/SustainabilityTool_w_ScoringSheet%5B1%5D.pdf

International Economic Development Council
Making it Count: Metrics for High Performing EDOs 94
Another example is a scorecard for program adaptation, which is how well a program or organization adapts to new realities and conditions. Metrics for this include how often an organization evaluates evidence (i.e., evaluates metrics), if it adapts to new strategies and new evidence, if it has a proactive system in place for adapting to changes, and if it evaluates which programs are effective and which ones are not.
Program Adaptation: Taking actions that adapt your program to ensure its ongoing effectiveness
To little or no extent To a very great extent
Not able to answer
1. The program periodically reviews the evidence base.
1 2 3 4 5 6 7 NA
2. The program adapts strategies as needed.
1 2 3 4 5 6 7 NA
3. The program adapts to new science.
1 2 3 4 5 6 7 NA 4. The program proactively adapts to changes in the
environment.
1 2 3 4 5 6 7 NA
5. The program makes decisions about which components are ineffective and should not continue.
1 2 3 4 5 6 7 NA
Environmental Cost Benefit Analysis
Environmental cost-benefit analysis quantifies the impacts of an enterprise on the environment and on public health.
When evaluating projects, EDOs should consider the environmental impacts of a potential project as well as its economic ones. Most projects have some type of environmental footprint, but it can be difficult to quantify these footprints on a project by project basis. Impacts on the environment and public health accumulate over time, and the causes are often confounded. Further, putting a price on a healthy environment and local population can be politically and practically challenging.
The costs of complying with a pollution rule or regulation are relatively straightforward (i.e., the cost of the technology or activity needed to meet the mitigation requirement). However, in the absence of a straightforward rule, justifying the costs of mitigation is more difficult. One broad approach can be utilizing a point system that rewards aspects of development that meet environmental goals. For example,
Cost-Benefit Analysis: Cost-benefit analysis compares the total expected cost of a venture against the total expected benefits. The goal is to assess if, and by how much, the benefits outweigh the costs.

International Economic Development Council
Making it Count: Metrics for High Performing EDOs 95
Chatham County, North Carolina, revised its approach to incentive awards to account for a project’s long-term economic, social, and environmental impacts. The new incentive system awards points if a project meets stated environmental goals, similar to the Leadership in Energy and Environmental Design (LEED) system. Its environmental goals include reuse of existing buildings, downtown location, location in industrial areas, use of a LEED Certified building, and others.94
Another index is the Energy Efficiency Scorecard created by the American Council for an Energy-Efficient Economy. The scorecard benchmarks each state on six areas of energy efficiency policy: utility and public benefits programs and policies; transportation policies; building energy codes; combined heat and power (CHP) policies; state government-led initiatives around energy efficiency; and appliance and equipment standards.95 The benchmarks change each year, reflecting the shifting nature of environmental policy.
Once the environmental goals are identified, there are several methods to quantify them. One approach is to survey the affected population and ask individuals what they would be willing to pay for something that cannot be bought in a store (i.e., the price to protect a local species from endangerment). This is the contingent valuation approach. Another method is to infer the price of environmental benefits from consumer behavior in other markets, such as how often people will travel to a recreational site based on its environmental quality. The hedonic pricing method is widely used in real estate valuation and assigns prices to certain aspects of a property or site. The averting expenditures approach can be thought of as the willingness to pay to avoid negative environmental or health outcomes. “Willingness to pay” is distinct from the “willingness to accept,” or how much people would want to be compensated to accept an environmental or health loss.96 The willingness to accept can be tied to the costs of illness, such as medical expenses and loss of income due to missing work.
Method Suitable for… Type of values
Conditions/Drawbacks
Contingent valuation
Virtually any public policy or program;
Use values,
The design and administration of a questionnaire is difficult. A number of biases are possible, but they can be limited
94 Jolly, J., McHugh, P., & Reid, D. (2001). Incentives 2.0. Economic Development Journal, 10(3). Retrieved from http://ioworldwide.com/includes/data1/images/promo/EDJ_Summer11.pdf 95 American Council for an Energy-Efficient Economy. (2013). The State Energy Efficiency Scorecard. Retrieved from http://aceee.org/sector/state-policy/scorecard 96 Pearce, D., Atkinson, G. & Mourato, S. (2006). Cost-Benefit Analysis and the Environment. Organization for Economic Co-operation. Retrieved from http://www.lne.be/themas/beleid/milieueconomie/downloadbare-bestanden/ME11_cost-benefit%20analysis%20and%20the%20environment%20oeso.pdf

International Economic Development Council
Making it Count: Metrics for High Performing EDOs 96
extremely flexible Non−use
values
through careful question construction and pre-testing of the survey instrument.
Travel cost methods
Only for amenities, natural resources (e.g., beaches, bodies of water, national parks, or wildlife reserves) or cultural sites (monuments) that people actively visit
Use values
Travel cost can be subject to measurement error, especially if the researcher wishes to include the opportunity cost of time. It may be difficult to identify substitute sites. Questions about trips taken under hypothetical conditions may be necessary to trace out the demand function at post−policy conditions.
Hedonic pricing methods
Only for changes in environmental or urban quality that can be captured into housing markets; only for job risks that are captured into compensating wage differentials.
In theory, both use and non−use
Market must clear. Sufficient transactions must be observed to estimate the hedonic regression, and sufficient variability in environmental or urban quality or job risks must exist to identify their effect. It can be difficult to separate the effect of these variables from other factors that can influence housing prices or wages.
Averting expenditures
Human health effects or other effects (e.g., materials damage) from which people can protect themselves
N/a Possible when individuals can document actions and expenditures incurred to reduce risks. In some cases, it is possible to engage in actions that reduce risks (e.g., staying indoors in days with high air pollution) but it is not easy to place a monetary value on these actions. Fails to capture the value of the discomfort of being sick.
Cost of illness
Human health effects N/a Relatively easy to perform, but fails to capture the value of the discomfort of being sick.
Moving from Partnerships to Aligning Organizations
Moving from partnerships to aligning organizations requires examining the degree to which organizations share values, beliefs, and behaviors.
The nature of economic development requires collaboration among key stakeholders like EDOs, local/state government agencies, and community development organizations. Organizations often partner on education initiatives, community investments, workforce investments, and strategic plans. However, their disparate visions, jurisdictions, resources, and directives can weaken the collaboration. Greater alignment between organizations on values, beliefs, and behaviors can strengthen bonds on specific initiatives as well as enrich the local collaborative atmosphere.

International Economic Development Council
Making it Count: Metrics for High Performing EDOs 97
Before aligning organizations, one must first identify the “who, what, why, where, and how” of alignment. For example, the Education Commission of the States poses four principles for alignment on education.
1. Alignment integrates education, workforce development, and economic development policy.
2. Alignment is regional. 3. Alignment positions education as the arbiter of student supply and workforce
demand. 4. Alignment requires a P-20 (preschool through college) approach.
The first principle recognizes the policy areas that need to be aligned. The second identifies the geographic scope of alignment. The third principle emphasizes the impact of alignment on education. Finally, the fourth principle identifies the institutions within a policy arena that need to be aligned. These four principles should be used to guide metrics for organizational alignment.
Possible metrics in this space can focus on the number of organizations sharing goals and strategies as well as the degree of their involvement. One starting place would be to measure the degree of alignment on a specific initiative. For example, the Florida Department of Economic Opportunity’s Five-Year Strategic Plan for Economic Development identifies metrics for aligning plans and processes across state, regional, and local entities toward the state’s economic development goals, including:97
• Number of state agency plans consistent with the goals and objectives of the five year plan;
• Number of regional and local plans consistent with the statewide plan; and
• Investments supporting multiple objectives.
Alternatively, metrics can focus on budget sharing or staff participation between organizations as a measure of alignment. The Charlotte Regional Partnership’s economic development balanced scorecard includes metrics for the state’s goal of “engag[ing] private and public stakeholders in an effort to improve the efforts to market the region, and to maintain adequate funding and support for the program regionally.”98 These metrics include private-sector funding increases, private-sector funding retained, State of North Carolina funding retained, and benchmarks for stakeholder attendance at its annual meeting.
Growth of Powerful Networks
The “growth of powerful networks” approach quantifies the growth in the breadth and depth of economic development networks.
97 Florida Department of Economic Opportunity. (2012, July). The Florida Five Year Strategic Plan for Economic Development. Retrieved from http://www.floridajobs.org/Business/FL5yrPlan/PlainLanguage.pdf 98 Charlotte Regional Partnership. (2011). Charlotte Regional Partnership FY 2011-2012 Balanced Scorecard.

International Economic Development Council
Making it Count: Metrics for High Performing EDOs 98
Measuring the growth of powerful networks is closely related to metrics for aligning organizations, but the focus is on the organizational connections themselves. Connections between organizations foster collaborative efforts by increasing information sharing between groups. These connections can be measured in terms of budget sharing, leadership sharing (i.e. through spots on the board of directors), regular meetings, and other communications.
Network analysis is a relatively young field. There are several ways to quantitatively measure the relationships within a network.99 These measures include:
1. Network density: Density is a ratio of the actual number of links within a network to the total possible number of links. The lower the density, the less connected the network.
2. Centralization: Two measures of centralization are degree centrality and betweenness centrality.
a. Degree centrality determines which stakeholder has the most ties to others in the network.
b. Betweenness centrality identifies the stakeholders who have the greatest number of accessible ties to others in the network. They are the best candidates to act as the conduit of information to others.
One example of network analysis in economic development is Ficenec’s (2012) analysis of Detroit.100 Ficenec compiles a list of the largest publicly-held companies, nonprofits, and foundations from Crain’s Detroit Business. She uses organization websites, Hoover’s Company Records, IRS Form 990s, and personal communication with organizations to determine what networks existed between them. The table below summarizes the network links between these organizations.
Interlocking directorates statistics
Number of organizations
Number of organizations with board members serving on multiple boards
Total number of board members
Number of board members serving on multiple boards
Density of board members
Publicly-held corporations
15 5 150 7 (4.7%) 0.074
Nonprofits 15 10 477 27 (5.7%) 0.134
Foundations 15 12 227 23 (10.1%) 0.226
All organizations
45 33 797 78 (9.8%) 0.069
99 Ficenec, S. (2012). Building Economic Development Networks in Detroit: A Comparison of Methods of Social Network Analysis. Retrieved from http://www.gwu.edu/~gwipp/Building%20Economic%20Development%20Networks%20in%20Detroit%204-25-11.pdf 100 Ibid

International Economic Development Council
Making it Count: Metrics for High Performing EDOs 99
The figure below represents graphically the networks that existed between the largest organizations in Detroit.
Ficenec also surveyed individuals in organizations to analyze how they view their interactions with other organizations. One question asked each individual to name 10 to 15 of the most important individuals in Detroit with regard to economic development policy. These 10-15 individuals were then interviewed to about their interactions with each other.
Progress in Open Source Collaborations
Progress in open source collaborations measures the extent and effectiveness of an EDO’s grassroots engagement on economic development initiatives.
Open source collaborations are characterized by the free sharing of information, work, or access to a product. A popular example of open source collaboration is in computer software development, such as the development of Mozilla Firefox and OpenOffice. Another example of open source collaboration is crowdfunding. Crowdfunding received a boost through the signing of the federal JOBS act (Jumpstart Our Business Startups) in April 2012, which allows startups to raise up to $1 million through crowdsourcing under a relatively streamlined process.

International Economic Development Council
Making it Count: Metrics for High Performing EDOs 100
Open source economic development, according to the Institute for Open Economic Networks (i-Open), “is based on voluntary communities of people contributing to common products.”101 Open source collaborations can expand and drive important relationships and networks. Measuring the extent of these collaborations can indicate how well an EDO is tapping into its local resources and connecting with key stakeholders. To understand how to measure open source collaboration, it is first important to understand why it contributes to economic development. Ed Morrison, founder of the Institute for Open Economic Networks, presents a five-factor model for open source economic development. There are key relationships that lend themselves to open source collaboration: talent and brainpower, entrepreneurship networks, connectedness of a place, branding stories and, civic collaboration. Together, these relationships combine to produce economic outcomes like innovative businesses, dynamic clusters, creative people, and local or regional “hot spots.”
Five Factor Model for Open Source Economic Development102
One example of an EDO utilizing open source collaboration is the RIdeation project of the Economic Development Foundation of Rhode Island, Inc. (EDFRI).103 Each quarter, EDFRI
101 I-Open. (n.d.) Offerings. I-Open. Retrieved from https://sites.google.com/site/instituteopeneconomicnetworks/home 102 Morrison, Ed. (2009, October 11). Open Source Economic Development: Using Data to Guide Conversations [Powerpoint]. Presented to University Economic Development Association, San Antonio. Retrieved from http://edmorrison.com/new-data-tools-for-open-source-economic-devel

International Economic Development Council
Making it Count: Metrics for High Performing EDOs 101
presents three economic development challenges to the “crowd,” who posts ideas on possible solutions. The crowd can then self-organize under networks to develop each idea. Ideas are voted on by the crowd, and the winning idea earns a cash prize and is executed.
103 Gibbs, S. & Valois, M. (2012). Open-Source Ideation for Economic Development: Rhode Island. The Futurist. 46(4). Retrieved from http://www.wfs.org/futurist/july-august-2012-vol-46-no-4/building-and-connecting-communities-for-future/open-source-ide

International Economic Development Council
Making it Count: Metrics for High Performing EDOs 102
Detailed Survey Results
Types of Respondents
While most of the respondents are based in the United States, the survey includes international respondents as well. The table below lists respondent counts by country. A significant number of international respondents are based in Canada, and a few are scattered throughout Europe, Asia, and Australia.
Table 2: Respondents by Country
Country Count
Australia 2
Bulgaria 1
Canada 36
England 3
India 1
Mexico 1
South Africa 1
United States 369
Total 416
The following map illustrates the geographical distribution of respondents by state. The survey results span a broad geographical scope, with most states represented in the responses.

International Economic Development Council
Making it Count: Metrics for High Performing EDOs 103
Figure 4: Geography of Respondents by State
IEDC asked respondents to describe their organization in terms of its type, structure, jurisdiction, and functions.

International Economic Development Council
Making it Count: Metrics for High Performing EDOs 104
MOST ORGANIZATIONS ARE EDOS AND GOVERNMENT AGENCIES
Most organizations are an EDO, government agency, or economic development division within a larger organization. There are consultants, university/academia, chambers of commerce, community/neighborhood development/civic organizations, and utilities represented as well. Other types of organizations represented include a combined chamber and EDO, ports, regional planning agencies, industry association, small business development centers, and a government-industry-education partnership.
1.0%
2.6%
3.6%
3.8%
5.2%
5.6%
10.6%
30.9%
36.9%
0 20 40 60 80 100 120 140 160 180 200
Utility Company
Community/Neighborhood Development/CivicOrganizations
Other, please specify
Chamber of Commerce
University/Academia
Consulting Firm
Economic Development Division or Departmentwithin a larger organization
Government
Economic Development Organization (autonomous)

International Economic Development Council
Making it Count: Metrics for High Performing EDOs 105
MOST ARE STRUCTURED AS NONPROFIT, PUBLIC, OR PUBLIC-PRIVATE
In terms of structure, most organizations operate as a private nonprofit, public entity, or public-private partnership. A smaller subset operates as a private for-profit.
MOST SERVE MUNICIPALITY, COUNTY AND REGIONAL JURISDICTIONS
The organizations represented primarily serve municipalities, counties or regions, but many have a state or national jurisdiction. Some serve multiple jurisdictions. Other jurisdictions include companies, research parks, business improvement districts, former military installations, tribal governments, MSAs, ports, and global reaches.
3.8%
26.3%
28.2%
41.7%
0 20 40 60 80 100 120 140 160
Private for profit
Public private partnership
Public entity
Private nonprofit
1.9%
4.9%
11.5%
17.9%
29.2%
34.5%
0 20 40 60 80 100 120 140 160 180
National
Other (please specify)
State or Province
Region
County/Parrish,Municipal District (Canada)
Municipality

International Economic Development Council
Making it Count: Metrics for High Performing EDOs 106
MOST ORGANIZATIONS SERVE MID-SIZE POPULATIONS, BUT MANY SIZES ARE REPRESENTED
The organizations serve a wide range of population sizes, with the most serving mid-size populations. However, smaller populations below 10,000 to larger populations reaching over 5 million are represented.
WIDE RANGE OF COMMUNITY TYPES REPRESENTED Like with population size, the communities represented in the survey represent a good mix of urban, suburban, and rural. Almost a third of the communities encompass all three types of communities.
8.2%
12.6%
14.4%
15.8%
17.2%
11.4%
9.8%
10.5%
8.2%
0 10 20 30 40 50 60 70 80
Less than 10,000
10,000 24,999
25,000 49,999
50,000 99,999
100,000 249,999
250,000 499,999
500,000 999,999
1 million 4.99 million
More than 5 million
0.4%
2.1%
6.1%
7.0%
17.1%
19.0%
19.8%
28.5%
0 20 40 60 80 100 120 140 160
Native American or Aboriginal Tribes
N/A
Suburban
Urban
Suburban/Rural
Urban/Suburban
Rural
Urban/Suburban/Rural

International Economic Development Council
Making it Count: Metrics for High Performing EDOs 107
MOST CARRY OUT SEVERAL ECONOMIC DEVELOPMENT FUNCTIONS IEDC asked respondents to list their main economic development functions. While business retention and expansion and business attraction topped the list of most common functions, it is clear that organizations multi-task. A large majority of organizations also market their community, support small business development/entrepreneurship, and conduct strategic planning for economic development. Other functions listed include business licensing, art and culture, retail development, professional education and advocacy, affordable and mixed income housing, brownfield reuse, equity investing, and business incubation.
ADVICE, NETWORKING, AND MARKETING TOP LIST OF EDO SERVICES IEDC asked respondents to describe the services that their organization provides. Topping the list are advice and assistance, networking and partnerships, and awareness campaigns/marketing and communications. Over half of EDOs also facilitate and organize events and manage stakeholder engagement. Other common services include education or training and management of loans and grant programs. EDOs also carry out services not included in the question menu, such as analysis and report writing, grant writing, local philanthropy, built environment improvements, and agricultural development.
8.8%
16.3%
24.1%
24.1%
32.1%
33.5%
36.1%
38.4%
40.4%
61.8%
62.2%
64.1%
75.7%
80.5%
0 50 100 150 200 250 300 350 400 450
Other (please specify)
Neighborhood development
International trade/commerce
Tourism
Finance/Access to capital for economic development…
Real estate/development projects
Technology/Innovation based economic development
Workforce development
Economic development research
Strategic planning for economic development in the…
Small business development/entrepreneurship
Marketing your community
Business attraction
Business retention and expansion

International Economic Development Council
Making it Count: Metrics for High Performing EDOs 108
Characteristics of Non-Trackers
When IEDC asked whether their organization measures its performance on a regular basis, over 30 percent of respondents said their organization does not regularly track performance. About 320 answered affirmatively out of 474 responses, which means that only 68 percent regularly measure performance. That leaves 32 percent of respondents who do not regularly track metrics.
Government and community/neighborhood EDOs are the most frequent non-trackers. The following page provides cross-tabs that illuminate what types of EDOs are non-trackers. Over 50 percent of government EDOs do not track metrics. This is an astonishing amount, considering that the number of government EDO respondents (155) is statistically significant. In addition, over 30 percent of community/neighborhood EDOs are non-trackers, although the number of community/neighborhood EDO respondents (13) is very low. The highest numbers of
3.8%
7.8%
11.2%
11.8%
41.8%
44.0%
59.8%
61.8%
63.1%
74.5%
83.5%
0 50 100 150 200 250 300 350 400 450
Other (please specify)
Certification program(s)
Value chain management and support
Inspection and enforcement
Loans, grant programs
Education or training
Stakeholder engagement
Facilitation/events
Awareness campaigns/marketing and…
Networking and partnerships
Advice and assistance
32.49%
67.51%
No Yes
Does your organization measure its performance on a regular basis?

International Economic Development Council
Making it Count: Metrics for High Performing EDOs 109
respondents work for an autonomous EDO (185), and over a quarter of these respondents said they do not track metrics.
EDOs with municipal jurisdiction are the most frequent non-trackers, while state EDOs are the most likely to track metrics. Over 50 percent of EDOs residing over municipalities do not track metrics. On the other hand, only about seven percent of state EDOs do not track metrics. Falling in the middle are county and regional EDOs, of which about 20-30 percent do not track metrics.
Non-trackers do not significantly differ in structure. Roughly the same percent (20-25 percent) of EDOs do not track metrics across various structures – public, private non-profit, private for-profit and public private partnership. Private for-profit EDOs have a slightly higher percent of non-trackers, but this figure is not statistically significant.

International Economic Development Council
Making it Count: Metrics for High Performing EDOs 110
Does your organization measure its performance on a regular basis?
Organization Type
Chamber of Commerce
Community/ Neighborhood Development/
Civic Organizations
ED Division or Department
within a larger organization
ED Organization (autonomous) Government
Other, please specify
University/ Academia
Utility Company Total
# % # % # % # % # % # % # % # % # %
No 5 26.3% 4 30.8% 13 24.5% 47 25.4% 78 50.3% 3 16.7% 4 15.4% 0 0% 154 32.5%
Yes 14 73.7% 9 69.2% 40 75.5% 138 74.6% 77 49.7% 15 83.3% 22 84.6% 5 100% 320 67.5%
Total 19 100% 13 100% 53 100% 185 100% 155 100% 18 100% 26 100% 5 100%
474 100%
Does your organization measure its performance on a regular basis?
Jurisdiction
County/Parrish, Municipal District
(Canada) Municipality National Other (please
specify) Region State or Province Total
# % # % # % # % # % # % # %
No 41 29.7% 82 50.6% 2 22.2% 5 21.7% 19 22.6% 4 7.3% 153 32.5%
Yes 97 70.3% 80 49.4% 7 77.8% 18 78.3% 65 77.4% 51 92.7% 318 67.5%
Total 138 100% 162 100% 9 100% 23 100% 84 100% 55 100% 471 100%
Does your organization measure its performance on a regular basis?
Structure
Private for profit Private nonprofit Public entity Public private partnership Total
# % # % # % # % # %
No 4 33.3% 34 25.6% 21 23.3% 17 20.2% 76 23.8%
Yes 8 66.7% 99 74.4% 69 76.7% 67 79.8% 243 76.2%
Total 12 100% 133 100% 90 100% 84 100% 319 100%
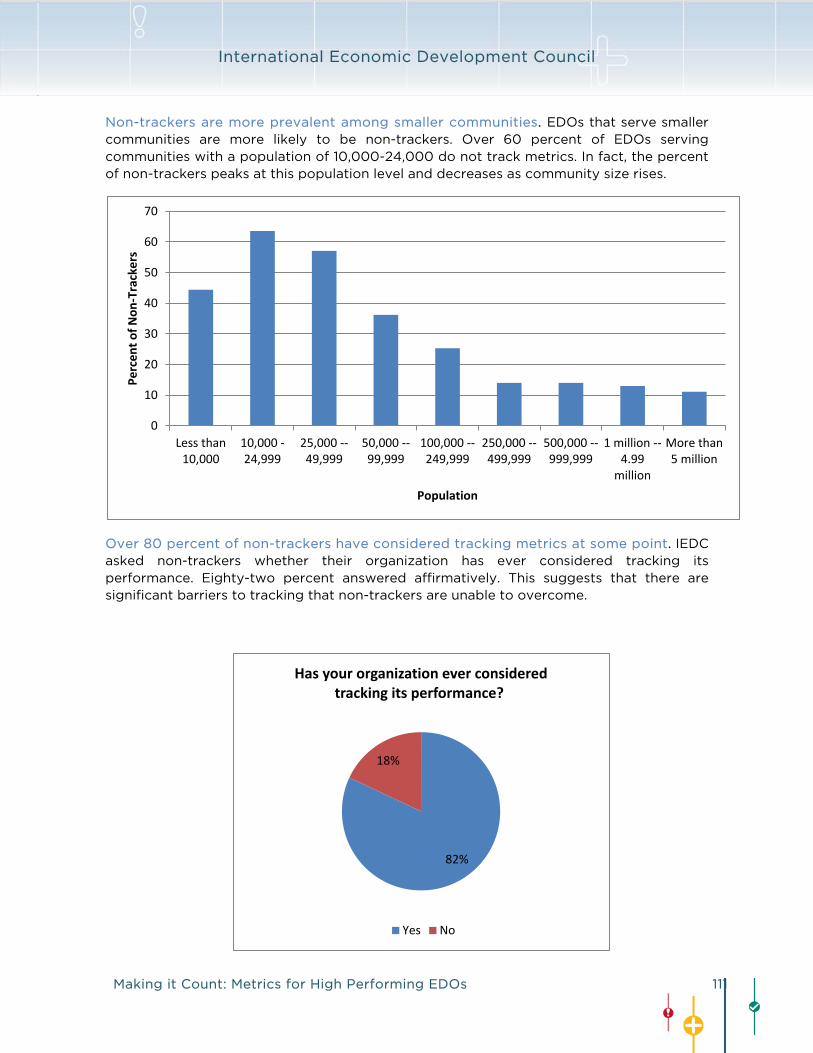
International Economic Development Council
Making it Count: Metrics for High Performing EDOs 111
Non-trackers are more prevalent among smaller communities. EDOs that serve smaller communities are more likely to be non-trackers. Over 60 percent of EDOs serving communities with a population of 10,000-24,000 do not track metrics. In fact, the percent of non-trackers peaks at this population level and decreases as community size rises.
Over 80 percent of non-trackers have considered tracking metrics at some point. IEDC asked non-trackers whether their organization has ever considered tracking its performance. Eighty-two percent answered affirmatively. This suggests that there are significant barriers to tracking that non-trackers are unable to overcome.
0
10
20
30
40
50
60
70
Less than10,000
10,000 24,999
25,000 49,999
50,000 99,999
100,000 249,999
250,000 499,999
500,000 999,999
1 million 4.99
million
More than5 million
Perc
ent o
f Non
-Tra
cker
s
Population
82%
18%
Has your organization ever considered tracking its performance?
Yes No

International Economic Development Council
Making it Count: Metrics for High Performing EDOs 112
Barriers to measurement include disagreement over metrics and lack of resources. To understand why organizations are open to tracking but do not follow through, IEDC asked about the major barriers they face in measuring performance. The figure below assembles a word cloud of the commonly used words from the open responses to this question. Common words like “staff”, “time,” and “resources” suggest a lack of resources to track metrics. “Board” may imply problems interfacing with key stakeholders in selecting and reporting on metrics.
WHAT ARE THE MAJOR BARRIERS YOU FACE IN MEASURING YOUR ORGANIZATION’S PERFORMANCE? Created using Wordle.net
After analyzing responses, it is clear that respondents point to several key barriers.
• Uncertainty about the selection of metrics. EDOs are unsure about what they should be tracking and what metrics they are able to track. Without a cohesive motivation for the selection of metrics, EDOs are unsure about what to do with the data.
• Influence from key stakeholders complicates selection of metrics. Stakeholders may lack knowledge of what to track and how to track it. Political influence from key stakeholders may sway what is tracked. When boards change, EDOs often change their targets and thus must select new metrics.
• Many outcomes are outside the purview of economic developers and thus should not be measured. Project cycles are often very long, so tracking outcomes may not accurately reflect what EDOs are currently doing.

International Economic Development Council
Making it Count: Metrics for High Performing EDOs 113
• Lack of data or inability to track outcomes. The data available may be too aggregated or vague. Without a tracking system or database, EDOs are not able to keep track of metrics.
• Some economic development goals are not inherently quantitative. Some EDOs focus on a small customer base, so comparing their performance to that of EDOs with a large customer base would not be appropriate.
• Inadequate resources, such as staffing, to track metrics. Tracking metrics requires budget and staff time beyond the current resources of some EDOs.
Characteristics of Trackers
Over 80 percent of organizations have a strategic plan, of which almost 70 percent include guidelines for measuring performance. Four hundred out of 475 respondents, or 84 percent, said their organization has a strategic plan or a similar guiding document. A smaller percent of this subset, 69 percent, include specific ways to measure performance in the strategic plan.
Organizations that have a strategic plan are 80 percent more likely to collect metrics. Of the organizations that have a strategic plan, 72 percent regularly collect metrics. Of those that do not have a strategic plan, only 40 percent collect metrics. Thus, those organizations with a strategic plan are 80 percent more likely to track metrics than those without one.
Most organizations collect metrics monthly, quarterly, or annually. One third of organizations surveyed collect metrics on a monthly basis. About a quarter do so on a quarterly basis, and 21 percent do so annually.
Metrics help achieve multiple internal goals, but most track progress over time. IEDC asked respondents how they use the metrics internally (e.g., to compare performance within an organization between different departments, against past performance, etc.)
2%
9%
34%
26%
21%
4%
0 20 40 60 80 100 120
Infrequently or never
Weekly
Monthly
Quarterly
Annually
BiAnnually
Number of Respondents
On average, how often does your organization COLLECT performance measures?

International Economic Development Council
Making it Count: Metrics for High Performing EDOs 114
Most organizations are using metrics for more than one internal goal. The top internal goal is to measure progress over time. Other top internal goals are in regard to setting targets, assessing the effectiveness of programs and services, and benchmarking progress. Some respondents also wrote in internal goals such as funding, budgeting, establishing staffing levels, and determining staff compensation.
Metrics serve many external goals, especially to benchmark progress. IEDC asked how organizations use metrics to achieve external goals (i.e., how they compare performance with other organizations. The top external goal is to benchmark progress. However, measuring progress over time, assessing program effectiveness, and setting goals and targets are also top external goals.
Most organizations report monthly to internal stakeholders and annually to external stakeholders. IEDC asked organizations how often they report to internal stakeholders, such as organizational staff and board members, and to external stakeholders, such as
0 50 100 150 200 250 300 350
Other (please specify )
To benchmark progress
To assess effectiveness of programs and services
To set goals or targets
To measure progress over time
Number of Respondents
How does your organization USE the metrics it collects for decision making? (Internally)
0 20 40 60 80 100 120 140 160 180
Other (please specify )
To set goals or targets
To assess effectiveness of programs and services
To measure progress over time
To benchmark progress
Number of Respondents
How does your organization USE the metrics it collects for decision making? (Externally)

International Economic Development Council
Making it Count: Metrics for High Performing EDOs 115
outside investors, elected officials, and the larger community. Most organizations report monthly to internal stakeholders but only annually to external stakeholders.
Business leaders and elected officials have the most influence on decision-making. Important stakeholders directly and indirectly guide the types of metrics organizations use to measure performance. For organizations that do track metrics, IEDC asked how much influence various stakeholders have on their decision-making. The response choices range from “No Influence” to “Minor Influence,” “Moderate Influence,” and “Heavy Influence.” The following graph presents a weighted average of responses on the importance of various stakeholders based on the number of respondents that marked each level of importance. A few important results emerge.
• Most organizations indicate that business leaders and elected officials have heavy to moderate influence on decision-making.
• Most organizations indicated that EDOs, civic organizations, and education leaders have minor-to-moderate influence on decision-making.
0 20 40 60 80 100 120 140 160 180 200
Infrequently or never
Weekly
Monthly
Quarterly
Annually
BiAnnually
Number of Respondents
On average, how often does your organization REPORT performance metrics to internal and external stakeholders?
Externally Internally

International Economic Development Council
Making it Count: Metrics for High Performing EDOs 116
• Most organizations indicated neighborhood jurisdictions and environmental groups as having no influence or only minor influence.
Most organizations use internally generated or free public data. IEDC asked respondents about the data sources they use to measure performance. Most use internally generated data such as surveys, interviews, observations focus groups and case studies. A large proportion also uses publicly available free data. Fewer EDOs use purchased and/or proprietary data.
0 50 100 150 200 250 300 350
Proprietary purchased data
Proprietary data publicly available
Publicly available purchased data
Publicly available free data
Internally generated (Surveys, interviews,…
Number of Respondents
What types of data sources does your organization use to measure performance?
0 0.5 1 1.5 2 2.5 3 3.5
Environmental groups
Neighboring jurisdictions
Education leaders
Civic organizations and their leaders
Economic development organizations
Other (please specify)
Elected officials (from your jurisdiction)
Business leaders
1 = No Influence 2 = Minor Influence 3 = Moderate Influence 4 = Heavy Influence
Please rate how much influence the following stakeholders have on your organization’s decisionmaking.

International Economic Development Council
Making it Count: Metrics for High Performing EDOs 117
Job creation is universally used but may not reflect actual performance. IEDC asked respondents to list the metrics that their organization tracks but that may not be accurate reflections of their organization’s performance. Many respondents indicated that job creation, while a universally tracked measure, is not an accurate reflection of their organization’s performance.
Some respondents cited specific reasons why job creation falls short as a metric.
• Jobs created may not reflect new jobs open to new employees; instead, the measure may reflect a shifting around of jobs within a community.
• Target job creation may not come to fruition until after the performance measurement period, since projects often take time to ramp up.
• Job creation may be difficult to track, because companies do not always release salaries and number of jobs created.
• It is difficult to estimate indirect job creation, with some organizations choosing not to cite this measure rather than providing an ambiguous estimate.
• Some organizations believe job creation is a function of employer decisions and market conditions like price, product quality, and innovation and is thus outside of the purview of economic development. Instead, these organizations track their influence on business decisions.
Lack of data, stakeholder misinterpretation, and inconsistent metrics complicate performance measurement. Among organizations that track metrics, IEDC asked about the main challenges in doing so. Three recurring challenges emerged: difficulty in collecting accurate and timely data, misinterpretation of the data by stakeholders, and inconsistent metrics.
Data problems are the most common response. Respondents cite a lack of resources, including both time and budget, to collect useful metrics. Oftentimes, the data that is available is not granular enough to pinpoint the work of EDOs or may not be timely or accurate. EDOs that collect survey data from local companies may struggle to get companies to respond either due to a lack of time or confidentiality concerns. Lastly, a few respondents emphasize that “not everything can be put into statistics.”
Misinterpretation by stakeholders is also a problem. Respondents say they struggle with how to demonstrate value and ROI without inappropriately taking credit for successes. When stakeholders outside of the economic development profession (e.g., elected officials) wish to dominate the performance measurement process, this can skew how accurately metrics reflect EDO performance. On the other hand, public officials may not be interested in metrics unless there are “big wins” to report.
Finally, respondents say that a lack of a standardized reporting system makes it difficult to select appropriate metrics. This is especially challenging for newer and smaller EDOs.
Moving on to the metrics themselves, IEDC asked respondents about specific performance metrics that their organization collects. In addition, IEDC asked respondents to rate the degree to which they consider each metric to be important indicators of the work in which

International Economic Development Council
Making it Count: Metrics for High Performing EDOs 118
their organization engages. For the survey, IEDC divided economic development measures into four categories.
1. Internal Measures 2. ED Program Measures 3. Relationship Management Measures 4. Community Indicators
A list of metrics was included under each category. Organizations were asked to select metrics that they currently track and provide an opinion on its usefulness as an indicator of their organization’s performance. The rating system follows three levels: 1 (Not Useful), 2 (Nice to Have), and 3 (Important Measure). Respondents were welcome to provide an opinion on metrics that they do not track.
Internal Measures
286 Responses
Internal measures are metrics that evaluate activities that help an EDO conduct the business of the organization (irrespective of specific programs and functions). IEDC asked all organizations the same question on internal measures, since the particular function an EDO plays is irrelevant in this case.
There were 285 total responses to this question. IEDC counts as one response any respondent who indicated that he or she collects at least one of the listed metrics, as well as respondents who did not mark any of the listed metrics but indicated that they collect other metrics.
To understand how many metrics each respondent tracks in this category, the histogram below presents the number of total metrics per respondent. Nineteen respondents track only one metric, while ten respondents track all 13 metrics. (The metric option “Others” is not included here.) On average, respondents track 6.5 internal measures out of the 13 total.
05
10152025303540
1 2 3 4 5 6 7 8 9 10 11 12 13Number of Metrics Per Respondent
Internal Measures

International Economic Development Council
Making it Count: Metrics for High Performing EDOs 119
Strategic plan benchmarks and funding metrics are the most-tracked metrics. The internal measure that most organizations track is success in implementing its strategic plan (i.e., how many goals were actually met). Funding indicators dominate the next most important measures: investments attracted to the EDO or total revenues generated, public and private-sector funding increased, and public and private-sector funding retained. A few respondents indicated that they do not collect internal measures, only external ones.
The least-tracked metrics are level of diversity in EDO leadership and level of EDO employee satisfaction. Less than a quarter of respondents track these measures.
Tracking Frequency of Internal Measures Frequency Percent 1 Success implementing strategic plan (i.e., how many goals
were actually met) 235 82.2% 2 Investments attracted to EDO / Total revenues generated 217 75.9% 3 Public-sector funding increased 186 65.0% 4 Private-sector funding increased 175 61.2% 5 Public-sector funding retained 174 60.8% 6 Private-sector funding retained 150 52.4% 7 Ratio of public-to-private-sector funding for EDO 136 47.6% 8 Number of businesses represented on EDO board, council,
or committees 130 45.5% 9 Expansion of services provided by EDO 127 44.4% 10 Linkages between the EDO strategic plan and other
economic development plans in the community (regional economic development plan, marketing plans, etc.) 126 44.1%
11 Diversification of funding sources (Ratio of investors to total funds) 85 29.7%
12 Level of EDO employee satisfaction 68 23.8% 13 Level of diversity in the EDO leadership (ethnicity, gender,
age, race, etc.) 64 22.4% The most-tracked metrics are also rated the most important on average. These are success in implementing the organization’s strategic plan (i.e., how many goals were actually met), investments attracted to the EDO or total revenues generated, public and private-sector funding increased, and public and private-sector funding retained.

International Economic Development Council
Making it Count: Metrics for High Performing EDOs 120
Average Importance of Internal Measures 1 = Not Useful, 2 = Nice to Have, 3 = Important Measure Mean
1 Success implementing strategic plan (i.e., how many goals were actually met) 2.85 2 Investments attracted to EDO / Total revenues generated 2.73 3 Public-sector funding increased 2.63 4 Private-sector funding increased 2.59 5 Public-sector funding retained 2.58 6 Private-sector funding retained 2.54 7 Linkages between the EDO strategic plan and other economic development
plans in the community (regional economic development plan, marketing plans, etc.) 2.45
8 Ratio of public-to-private-sector funding for EDO 2.4 9 Expansion of services provided by EDO 2.35 10 Level of EDO employee satisfaction 2.23 11 Diversification of funding sources (Ratio of investors to total funds) 2.22 12 Number of businesses represented on EDO board, council, or committees 2.12 13 Level of diversity in the EDO leadership (ethnicity, gender, age, race, etc.) 1.81
The graph below illustrates whether the frequency of tracking and importance rating of each metric is above or below average. The average frequency is taken as the average number of trackers for each metric across this category. The average importance rating is the mean of ratings across metrics. This graph helps identify whether the frequency of tracking matches the importance rating by showing how each metric measures up to the category average.

International Economic Development Council
Making it Count: Metrics for High Performing EDOs 121
Employee satisfaction and diversification of funding sources are rated important, but they are not as frequently tracked. These two metrics are rated only slightly below average, but their tracking frequency is far below average. In fact, the level of EDO employee satisfaction and diversification of funding sources are ranked more important than the number of businesses represented on EDO boards, councils, or committees, but these two metrics are tracked much less frequently.
The number of businesses represented on the EDO’s board is frequently tracked, but it is not the most important metric. This metric is tracked more often than the expansion of services provided by the EDO, linkages between the EDO’s strategic plan and other
0 0.2 0.4 0.6 0.8 1 1.2 1.4 1.6 1.8
Level of diversity in the EDO leadership (ethnicity,gender, age, race, etc.)
Level of EDO employee satisfaction
Diversification of funding sources (Ratio of investorsto total funds)
Linkages between the EDO strategic plan and othereconomic development plans in the community…
Expansion of services provided by EDO
Number of businesses represented on EDO board,council, or committees
Ratio of public to private sector funding for EDO
Private sector funding retained
Public sector funding retained
Private sector funding increased
Public sector funding increased
Investments attracted to EDO / Total revenuesgenerated
Success implementing strategic plan (i.e. how manygoals were actually met)
Percent of Average
Tracking Frequency and Importance Rating as Percent of Average
Importance Tracked

International Economic Development Council
Making it Count: Metrics for High Performing EDOs 122
Public-sector funding retained
Top Metrics by Type
Investments attracted to EDO; Success
implementing strategic plan; Public-sector funding increased
Private-sector funding increased
Government 50 Responses
ED Dept (within larger org)
34 Responses
Autonomous EDO 135 Responses
local ED plans, diversification of funding sources, and employee satisfaction. Yet, it is not as important as these latter metrics.
The tracking of public versus private-sector funding differs by organization type. Public-sector funding (increased and retained) are among the top metrics for ED departments (within a larger organization) and government EDOs. Autonomous EDOs focus on both private and public-sector funding for their top metrics. Other EDO types were not included because subsamples were too small.

International Economic Development Council
Making it Count: Metrics for High Performing EDOs 123
EDOs with heavy influence from business leaders track the highest number of metrics. The chart below lists the top metrics according to influential stakeholders (i.e., those marked has having “Heavy Influence” on the EDO’s decision making). The “X” marks internal measures that are tracked by at least 50 percent of respondents within each stakeholder category. EDOs that have heavy influence from business leaders track the most metric, as eight metrics are tracked by at least 50 percent of this subgroup. “Success implementing strategic plan,” “investments attracted,” and “private/public funding indicators” are top metrics across stakeholder groups. Heavy influence from business leaders also tends to induce EDOs to track the “ratio of public-to-private-sector funding” and “number of businesses on EDO board, council, and committees,” which is not a surprising result.

International Economic Development Council
Making it Count: Metrics for High Performing EDOs 124
Tracking of Internal Measures According to Influential Stakeholders
Elected officials (from your jurisdiction) have "Heavy Influence" (153 Responses)
Business leaders have "Heavy Influence" (149 Responses)
Civic organizations and their leaders have "Heavy Influence" (24 Responses)
Education leaders have "Heavy Influence" (36 Responses)
Economic development organizations have "Heavy Influence" (81 Responses)
Environmental groups have "Heavy Influence" (12 Responses)
Neighboring jurisdictions have "Heavy Influence" (6 Responses)
Success implementing strategic plan (i.e., how many goals were actually met) X X X X X Investments attracted to EDO / Total revenues generated X X X X X
Public-sector funding increased X X X X X X
Public-sector funding retained X X X X X X
Private-sector funding increased X X X X
Private-sector funding retained X X X Expansion of services provided by EDO Ratio of public-to-private-sector funding for EDO X Linkages between the EDO strategic plan and other economic development plans in the community (regional economic development plan, marketing plans, etc.) Number of businesses represented on EDO board, council, or committees X Diversification of funding sources (ratio of investors to total funds)
Level of EDO employee satisfaction Level of diversity in the EDO leadership (ethnicity, gender, age, race, etc.)

International Economic Development Council
Making it Count: Metrics for High Performing EDOs 125
ED Program Measures
ED program measures help measure an EDO’s performance on its economic development related activities. These are highly dependent on the specific economic development functions that an EDO is involved in, which vary from one organization to another.
BUSINESS ATTRACTION & MARKETING 244 Responses
EDOs that provide business attraction and marketing services promote the community as a good place to establish a business and help attract new businesses to the community. IEDC only presented this section to respondents that indicate their organization offers business attraction and marketing as a service.
There were a total of 244 responses to this section. Respondents on average track 10.4 metrics for business attraction and marketing out of the 19 total. Three respondents only track one metric, while 8 respondents track all 19 measures.
The number of new jobs, businesses, and development projects dominate business attraction and marketing metrics. The number of businesses attracted to a region (including their number and distribution across target industries), number of jobs attracted, and the total number and value of new development projects are among the most tracked metrics for EDOs that offer business attraction and marketing services. Following close behind are the categories of “new investment attracted” and “active prospects in the pipeline.” The least tracked metrics are “cost savings for businesses resulting from ED programs” and “number of international tours and conferences hosted.”
The least tracked metric is “cost savings for businesses assisted as a result of EDO programs.” Only 20 percent of respondents track this measure.
0
5
10
15
20
25
30
35
1 2 3 4 5 6 7 8 9 10 11 12 13 14 15 16 17 18 19Number of Metrics Per Respondent
EDO Program Measures: Business Attraction & Marketing

International Economic Development Council
Making it Count: Metrics for High Performing EDOs 126
Tracking Frequency of Business Attraction & Marketing Measures Frequency Percent
1 Number of jobs attracted (full time, part time, contract, seasonal) 223 91.4%
2 Businesses attracted to the region (number, distribution across target industry sectors) 218 89.3%
3 Total number and value of new development projects 210 86.1% 4 New investment attracted/facilitated (overall, per project,
public vs. private, etc.) 188 77.0% 5 “Active” prospects in the pipeline (number, distribution across
target industry sectors) 186 76.2% 6 Wages/salaries of jobs attracted (average) 174 71.3% 7 Incentives awarded (Number and/or value) 164 67.2% 8 Increase in tax revenue/base growth 142 58.2% 9 Targeted marketing campaigns undertaken (number, number
of people reached, variety of marketing techniques, etc.) 123 50.4% 10 Percent of business leads that choose to locate in
community/region 119 48.8% 11 Presence and quality of direct programs locally to assist new
firms (technical assistance, competitive intelligence, marketing, financing, workforce training, etc.) 110 45.1%
12 Economic multipliers to calculate the ripple effects of jobs attracted/created 108 44.3%
13 Branding efforts launched (number, extent of outreach, variety of messaging, etc.) 106 43.4%
14 Impact on employment by industry/sector due to EDO efforts 104 42.6% 15 Cost-benefit analysis of proposed projects (Cost to
community vs. benefit to the community) 94 38.5% 16 Foreign Direct Investment (FDI) attracted to the community 85 34.8% 17 Number of international conferences and conventions
attended by EDO staff 81 33.2% 18 Number of international tours hosted (in-bound) or organized
(outbound) 75 30.7% 19 Cost savings for businesses assisted as a result of EDO
programs 49 20.1% The most tracked metrics are also rated most important. These are “businesses attracted to the region”, “number of jobs attracted” and “total number and value of new development projects.”
Average Importance of Business Attraction & Marketing Measures 1 = Not Useful, 2 = Nice to Have, 3 = Important Measure Mean
1 Businesses attracted to the region (number, distribution across target industry sectors) 2.9
2 Number of jobs attracted (full time, part time, contract, seasonal) 2.87 3 Total number and value of new development projects 2.82 4 New investment attracted/facilitated (overall, per project, public vs. private,
etc.) 2.8 5 Wages/salaries of jobs attracted (average) 2.72

International Economic Development Council
Making it Count: Metrics for High Performing EDOs 127
6 Increase in tax revenue/base growth 2.72 7 “Active” prospects in the pipeline (number, distribution across target industry
sectors) 2.61 8 Cost-benefit analysis of proposed projects (Cost to community vs. benefit to
the community) 2.57 9 Incentives awarded (Number and/or value) 2.56 10 Targeted marketing campaigns undertaken (number, number of people
reached, variety of marketing techniques, etc.) 2.55 11 Impact on employment by industry/sector due to EDO efforts 2.53 12 Presence and quality of direct programs locally to assist new firms (technical
assistance, competitive intelligence, marketing, financing, workforce training, etc.) 2.48
13 Branding efforts launched (number, extent of outreach, variety of messaging, etc.) 2.44
14 Percent of business leads that choose to locate in community/region 2.43 15 Economic multipliers to calculate the ripple effects of jobs attracted/created 2.41 16 Cost savings for businesses assisted as a result of EDO programs 2.38 17 Foreign Direct Investment (FDI) attracted to the community 2.32 18 Number of international tours hosted (in-bound) or organized (outbound) 1.97 19 Number of international conferences and conventions attended by EDO staff 1.78
“Cost savings for businesses” considered important, but not tracked frequently. This metric is rated almost as important as the average importance of other metrics, but it is tracked less than 40 percent of the average tracking frequency. Cost savings for businesses is ranked more important than “the number of international conferences and conventions attended by EDO staff” and “the number of international tours hosted,” but both these metrics are tracked more often than “business cost savings.”
The “impact on employment by industry/sector due to EDO efforts” and the “cost-benefit analysis of proposed projects” metrics are considered important, but they are not frequently tracked. These metrics are both rated above average in importance but are tracked well below average frequency. There are four metrics rated less important but that are tracked more frequently.

International Economic Development Council
Making it Count: Metrics for High Performing EDOs 128
0 0.2 0.4 0.6 0.8 1 1.2 1.4 1.6 1.8
Cost savings for businesses assisted as a result of EDOprograms
Number of international tours hosted (inbound) ororganized (outbound)
Number of international conferences and conventionsattended by EDO staff
Foreign Direct Investment (FDI) attracted to thecommunity
Costbenefit analysis of proposed projects (Cost tocommunity vs. benefit to the community)
Impact on employment by industry/sector due to EDOefforts
Branding efforts launched (number, extent ofoutreach, variety of messaging, etc.)
Economic multipliers to calculate the ripple effects ofjobs attracted/created
Presence and quality of direct programs locally toassist new firms (technical assistance, competitive…
Percent of business leads that choose to locate incommunity/region
Targeted marketing campaigns undertaken (number,number of people reached, variety of marketing…
Increase in tax revenue/base growth
Incentives awarded (Number and/or value
Wages/salaries of jobs attracted (average)
“Active” prospects in the pipeline (number, distribution across target industry sectors)
New investment attracted/facilitated (overall, perproject, public vs. private, etc.)
Total number and value of new development projects
Businesses attracted to the region (number,distribution across target industry sectors)
Number of jobs attracted (full time, part time,contract, seasonal)
Percent of Average
Tracking Frequency and Importance Rating as Percent of Average
Importance Tracked

International Economic Development Council
Making it Count: Metrics for High Performing EDOs 129
Top Metrics by Type
Businesses attracted to the region; Total
number and value of new development
projects; Number of
New investment attracted/ facilitated
Wages/salaries of jobs attracted (average)
“Active” prospects in the pipeline (number, distribution across target industry sectors)
Government 53 Responses
ED Dept (within larger org)
36 Responses
Autonomous EDO 138 Responses
There are some differences in tracking by EDO type. The “number of jobs attracted,” “businesses attracted to the region,” and “total number and value of new development projects” are top metrics for autonomous EDOs, ED departments (within a larger organization) and government. Autonomous EDOs also prioritize active prospects in the pipeline, while ED departments (within a larger organization) focus on wages/salaries of jobs attracted and government entities prioritize new investment attracted/facilitated.
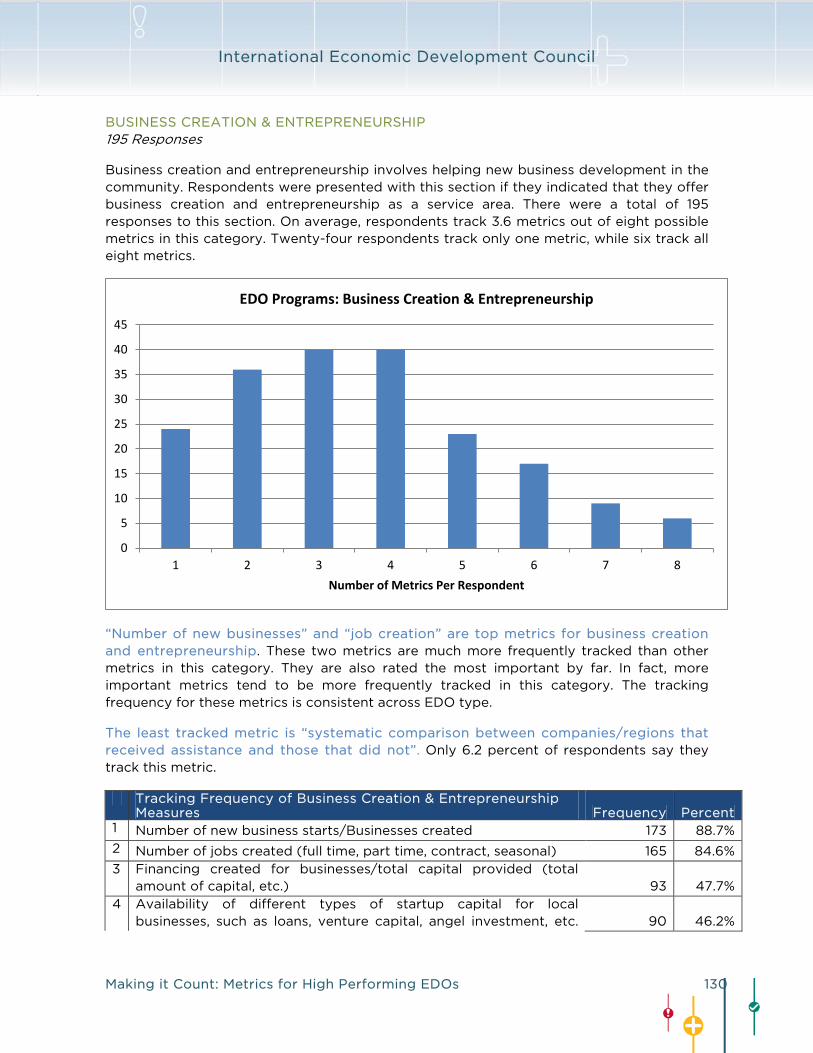
International Economic Development Council
Making it Count: Metrics for High Performing EDOs 130
BUSINESS CREATION & ENTREPRENEURSHIP 195 Responses
Business creation and entrepreneurship involves helping new business development in the community. Respondents were presented with this section if they indicated that they offer business creation and entrepreneurship as a service area. There were a total of 195 responses to this section. On average, respondents track 3.6 metrics out of eight possible metrics in this category. Twenty-four respondents track only one metric, while six track all eight metrics.
“Number of new businesses” and “job creation” are top metrics for business creation and entrepreneurship. These two metrics are much more frequently tracked than other metrics in this category. They are also rated the most important by far. In fact, more important metrics tend to be more frequently tracked in this category. The tracking frequency for these metrics is consistent across EDO type.
The least tracked metric is “systematic comparison between companies/regions that received assistance and those that did not”. Only 6.2 percent of respondents say they track this metric.
Tracking Frequency of Business Creation & Entrepreneurship Measures Frequency Percent
1 Number of new business starts/Businesses created 173 88.7%
2 Number of jobs created (full time, part time, contract, seasonal) 165 84.6%
3 Financing created for businesses/total capital provided (total amount of capital, etc.) 93 47.7%
4 Availability of different types of startup capital for local businesses, such as loans, venture capital, angel investment, etc. 90 46.2%
0
5
10
15
20
25
30
35
40
45
1 2 3 4 5 6 7 8Number of Metrics Per Respondent
EDO Programs: Business Creation & Entrepreneurship

International Economic Development Council
Making it Count: Metrics for High Performing EDOs 131
(total number of financial providers, total amount of capital provided, etc.)
5 Number of business licenses issued/businesses registered 64 32.8%
6 Increased diversity of businesses in economy (Number of sectors, number per sector) 58 29.7%
7 New business startups as percentage of all businesses in the city 50 25.6% 8 Systematic comparisons between companies/regions that
received assistance and those that did not 12 6.2%
Average Importance of Business Creation & Entrepreneurship Measures 1 = Not Useful, 2 = Nice to Have, 3 = Important Measure Mean
1 Number of new businesses started/created 2.84
2 Number of jobs created (full time, part time, contract, seasonal) 2.8
3 Financing created for businesses/total capital provided (total amount of capital, etc.) 2.52
4 Availability of different types of startup capital for local businesses, such as loans, venture capital, angel investment, etc. (total number of financial providers, total amount of capital provided, etc.) 2.49
5 New business startups as percentage of all businesses in the city 2.29
6 Increased diversity of businesses in economy (Number of sectors, number per sector) 2.28
7 Number of business licenses issued/businesses registered 2.25
8 Systematic comparisons between companies/regions that received assistance and those that did not 2.02
0 0.5 1 1.5 2 2.5
Systematic comparisons between…
New business startups as percentage of all…
Increased diversity of businesses in economy…
Number of business licenses issued/businesses…
Availability of different types of startup capital for…
Financing created for businesses/total capital…
Number of jobs created (full time, part time,…
Number of new business starts/Businesses created
Percent of Average
Tracking Frequency and Importance Rating as Percent of Average
Importance Tracked

International Economic Development Council
Making it Count: Metrics for High Performing EDOs 132
BUSINESS RETENTION & EXPANSION 242 Responses
Business retention and expansion (BRE) involves supporting local business so as to encourage them to stay in the community and hopefully expand their operations. This section was presented to respondents who indicate that they provide BRE services, and 242 respondents answered this section. On average, respondents collect 5.4 metrics out of 13 possible metrics in this category. Fifteen respondents only collect one metric, while two respondents collect all 13 metrics.
The “number of business expanded, retained, and assisted” and the “number of jobs retained” are most tracked BRE metrics. These metrics are tracked almost twice as often as other metrics in this category. They are also rated the most important. The frequency of tracking for metrics in this category is fairly consistent across EDO types.
The least tracked metric is “local business-to-business investment levels.” Less than ten percent of respondents track this measure.
0
5
10
15
20
25
30
35
40
1 2 3 4 5 6 7 8 9 10 11 12 13Number of Metrics Per Respondent
EDO Programs: Business Retention & Expansion

International Economic Development Council
Making it Count: Metrics for High Performing EDOs 133
Tracking Frequency of Business Retention & Expansion Measures Frequency Percent
1 Number of businesses expanded 209 86.4%
2 Number of businesses assisted (type of assistance, value of assistance provided, etc.) 192 79.3%
3 Number of jobs retained (full time, part time, contract, seasonal) 184 76.0%
4 Number of businesses retained 179 74.0%
5 Amount of financing provided ($) 112 46.3% 6 Ratings of the business climate in the community 107 44.2%
7 Businesses remaining and growing in region following a risk of departure or closure 74 30.6%
8 Past utilization of and satisfaction with local business assistance programs 60 24.8%
9 Percent of "jobs at risk" retained 57 23.6%
10 Number of residents/businesses assisted in economically distressed and under-served communities 42 17.4%
11 Relocation of supplier or customers 39 16.1% 12 Percent of revenue growth for businesses receiving EDO
assistance 31 12.8%
13 Local business-to-business investment levels 23 9.5%
Average Importance of Business Retention & Expansion Measures 1 = Not Useful, 2 = Nice to Have, 3 = Important Measure Mean
1 Number of businesses expanded 2.89 2 Number of businesses retained 2.83 3 Number of jobs retained (full time, part time, contract, seasonal) 2.82 4 Number of businesses assisted (type of assistance, value of assistance provided,
etc.) 2.74 5 Ratings of the business climate in the community 2.53 6 Amount of financing provided ($) 2.51 7 Businesses remaining and growing in region following a risk of departure or
closure 2.48 8 Percent of "jobs at risk" retained 2.48 9 Past utilization of and satisfaction with local business assistance programs 2.35 10 Relocation of supplier or customers 2.28 11 Percent of revenue growth for businesses receiving EDO assistance 2.2 12 Number of residents/businesses assisted in economically distressed and under-
served communities 2.13 13 Local business-to-business investment levels 2.04

International Economic Development Council
Making it Count: Metrics for High Performing EDOs 134
TECHNOLOGY & INNOVATION 92 Responses
Technology and innovation programs aim to assist high-tech industries from the idea phase through the growth of full-fledged high-tech companies. IEDC presented this section to respondents who indicated their organization provides such services. There were 92 total responses. On average, respondents collect 3.6 metrics out of a possible ten metrics in this category. Nineteen respondents only collect one metric, while three collect all 10.
0 0.5 1 1.5 2 2.5
Local businesstobusiness investment levels
Percent of revenue growth for businesses receiving…
Relocation of supplier or customers
Number of residents/businesses assisted in…
Percent of "jobs at risk" retained
Past utilization of and satisfaction with local…
Businesses remaining and growing in region…
Ratings of the business climate in the community
Amount of financing provided ($)
Number of businesses retained
Number of jobs retained (full time, part time,…
Number of businesses assisted (type of assistance,…
Number of businesses expanded
Percent of Average
Tracking Frequency and Importance Rating as Percent of Average
Importance Tracked

International Economic Development Council
Making it Count: Metrics for High Performing EDOs 135
“Access to broadband internet,” “percent growth in tech businesses,” and “tech transfer” top technology/innovation metrics. These metrics are most frequently tracked and are also rated most highly. Because there are fewer responses to this metrics category, results could not be compared between types of organizations.
The least tracked metric is “percent growth in tech-oriented education programs.” Less than a quarter of respondents track this measure.
Tracking Frequency of Technology & Innovation Measures Frequency Percent 1 Percent growth in tech-oriented businesses 48 52.2% 2 Access to broadband internet 46 50.0%
3 Local or regional technology transfer from local universities to area businesses 45 48.9%
4 Amount of R&D funding for businesses assisted by EDO 38 41.3%
5 Number of R&D contracts and grants for businesses assisted by EDO 32 34.8%
6 Patents (number of patents filed by local businesses, major sectors in which patents are filed, etc.) 30 32.6%
7 Modernization of facilities 28 30.4%
8 Number of new products and/or production lines, new services 24 26.1%
9 Increase in technology zone incentives (reduction in permit/user fees, ordinance exemptions, flexibility in special zoning, etc.) 22 23.9%
10 Percent growth in tech-oriented education programs 20 21.7%
0
5
10
15
20
25
1 2 3 4 5 6 7 8 9 10Number of Metrics Per Respondent
EDO Programs: Technology & Innovation

International Economic Development Council
Making it Count: Metrics for High Performing EDOs 136
Average Importance of Technology & Innovation Measures 1 = Not Useful, 2 = Nice to Have, 3 = Important Measure Mean
1 Access to broadband internet 2.61 2 Percent growth in tech-oriented businesses 2.59 3 Local or regional technology transfer from local universities to area businesses 2.51 4 Number of R&D contracts and grants for businesses assisted by EDO 2.45 5 Amount of R&D funding for businesses assisted by EDO 2.39 6 Modernization of facilities 2.37 7 Number of new products and/or production lines, new services 2.33 8 Percent growth in tech-oriented education programs 2.28 9 Increase in technology zone incentives (reduction in permit/user fees, ordinance
exemptions, flexibility in special zoning, etc.) 2.26 10 Patents (number of patents filed by local businesses, major sectors in which
patents are filed, etc.) 2.26 Patents are tracked frequently but rated less important. Patents (“number of patents filed by local businesses”, “major sectors in which patents are filed,” etc.) is rated last in importance, but it is tracked more often than five other metrics.
0 0.2 0.4 0.6 0.8 1 1.2 1.4 1.6
Percent growth in techoriented education programs
Increase in technology zone incentives (reduction inpermit/user fees, ordinance exemptions, flexibility…
Number of new products and/or production lines,new services
Modernization of facilities
Patents (number of patents filed by local businesses,major sectors in which patents are filed, etc)
Number of R&D contracts and grants for businessesassisted by EDO
Amount of R&D funding for businesses assisted byEDO
Local or regional technology transfer from localuniversities to area businesses
Access to broadband internet
Percent growth in techoriented businesses
Percent of Average
Tracking Frequency and Importance Rating as Percent of Average
Importance Tracked

International Economic Development Council
Making it Count: Metrics for High Performing EDOs 137
REAL ESTATE & INDUSTRIAL USE 103 Responses
Real estate and industrial use metrics help EDOs measure progress in advancing the built environment. This section was presented to EDOs who indicate that they provide such services. In total, there were 103 responses to this section. Respondents on average track 5.3 out of 13 possible metrics in this category. Nine respondents only track one metric, while four track all 13 metrics.
The “availability of shovel-ready sites” is the top real estate/industrial use metric. The number and acreage of available shovel-ready sites is tracked more frequently than any other metric in this category. It is also ranked the most important.
The least tracked metrics are the “number of subsidized buildings” and “average cost of remediation”. Less than 15 percent of respondents track each of these measures.
Tracking Frequency of Real Estate & Industrial Use Measures Frequency Percent 1 Availability of shovel-ready sites (number, acreage, etc.) 81 78.6% 2 Number and value of redevelopment projects 59 57.3% 3 Number of new building permits granted 58 56.3% 4 Diversity of financing methods used (Tax credits, tax increment
financing districts, leases, public use bonds, etc.) 48 46.6% 5 Availability of certified sites (number, acreage, etc.) 48 46.6% 6 Vacancy and absorption rates (as well as difference in rates
between various industrial/commercial areas of the community) 45 43.7% 7 Average value of commercial property 42 40.8% 8 Change in property valuation over time 39 37.9% 9 Average cost of construction 32 31.1%
0
2
4
6
8
10
12
14
16
1 2 3 4 5 6 7 8 9 10 11 12 13Number of Metrics Per Respondent
EDO Programs: Real Estate & Industrial Use

International Economic Development Council
Making it Count: Metrics for High Performing EDOs 138
10 Internal rate of return for projects 32 31.1% 11 Timeliness of project completion 28 27.2% 12 Number of subsidized buildings 15 14.6% 13 Average cost of remediation (In case of redevelopment projects) 15 14.6%
Average Importance of Real Estate & Industrial Use Measures 1 = Not Useful, 2 = Nice to Have, 3 = Important Measure Mean
1 Availability of shovel-ready sites (number, acreage, etc.) 2.86 2 Number and value of redevelopment projects 2.67 3 Vacancy and absorption rates (as well as difference in rates between various
industrial/commercial areas of the community) 2.65 4 Average value of commercial property 2.57 5 Availability of certified sites (number, acreage, etc.) 2.57 6 Number of new building permits granted 2.57 7 Change in property valuation over time 2.55 8 Internal rate of return for projects 2.49 9 Diversity of financing methods used (Tax credits, tax increment financing
districts, leases, public use bonds, etc.) 2.49 10 Timeliness of project completion 2.36 11 Average cost of construction 2.36 12 Average cost of remediation (In case of redevelopment projects) 2.21 13 Number of subsidized buildings 2.11
The “internal rate of return for projects” was rated important, but it is not often tracked. The “internal rate of return for projects” has an average importance rating, but it is only tracked about 75 percent of the average tracking frequency. This metric is rated as important as the “diversity of financing methods used,” but it is tracked much less frequently.
“Diversity of financing methods” is tracked frequently, but it is not the most important metric. This metric is tracked more frequently than the availability of certified sites, vacancy and absorption rates, average value of commercial property, and change in property value over time. However, these latter metrics are all rated more important than diversity of financing methods.

International Economic Development Council
Making it Count: Metrics for High Performing EDOs 139
SUSTAINABLE DEVELOPMENT/GREEN JOBS 0 Responses
Zero responses indicate lack of focus on sustainability and/or unwillingness to track these measures. Although IEDC included a section on Sustainable Development/Green Jobs for ED program measures, there were no responses to this section. This can either indicate that EDOs are not focusing on sustainability as a program area, or that they are slow to track these kinds of measures.
Relationship Management
Relationship management metrics refer to the efforts EDOs make to build and strengthen relationships with internal and external stakeholders. Such an effort may help EDOs expand
0 0.5 1 1.5 2 2.5
Average cost of remediation (In case ofredevelopment projects)
Number of subsidized buildings
Timeliness of project completion
Internal rate of return for projects
Average cost of construction
Change in property valuation over time
Average value of commercial property
Vacancy and absorption rates (as well as difference inrates between various industrial/commercial areas…
Availability of certified sites (number, acreage, etc.)
Diversity of financing methods used (Tax credits, taxincrement financing districts, leases, public use…
Number of new building permits granted
Number and value of redevelopment projects
Availability of shovelready sites (number, acreage,etc.)
Percent of Average
Tracking Frequency and Importance Rating as Percent of Average
Importance Tracked

International Economic Development Council
Making it Count: Metrics for High Performing EDOs 140
their services offered to new and existing businesses and improve the community’s business climate. Relationship management sections were presented to all respondents regardless of their service areas.
EDO LEADERSHIP 218 Responses
There were 218 responses to this section. On average, respondents track 3.4 metrics out of six possible metrics in this category. Thirty-one respondents only track one metric, while 28 track all six metrics. The most respondents (43) track three out of the six metrics.
“Businesses participating in EDO leadership,” “public-sector representatives participating in EDO leadership”, and “information sharing with community stakeholders” are the top metrics for this section. Less frequently tracked are the “effectiveness of EDO board to remove barriers to economic development progress,” “participation by minorities, women, and immigrants in EDO leadership and community organizations,” and “civic engagement.” The top metrics in this category are consistent across EDO type.
The least tracked metric is “civic engagement.” Less than 35 percent of respondents track civic engagement, as measured by the number and variety of civic organizations represented on EDO boards or committees or actively engaged in implement EDO programs.
Tracking Frequency of EDO Leadership Measures Frequency Percent 1 Businesses participating in EDO leadership (Board or ED related
committees) 176 80.7%
2 Public sector representatives participating in EDO leadership 160 73.4%
3 Regular information sharing with community stakeholders by EDO board 145 66.5%
4 Effectiveness of EDO board to remove barriers to economic development progress (e.g., engaging in local and state policy development related to economic development) 104 47.7%
5 Participation by minorities, women, and immigrants in EDO 78 35.8%
05
101520253035404550
1 2 3 4 5 6Number of Metrics Per Respondent
Relationship Management: EDO Leadership

International Economic Development Council
Making it Count: Metrics for High Performing EDOs 141
leadership and community organizations
6 Civic Engagement (number and variety of civic organizations represented on EDO board or committees or actively engaged in implementing EDO programs) 75 34.4%
Average Importance of EDO Leadership Measures 1 = Not Useful, 2 = Nice to Have, 3 = Important Measure Mean
1 Regular information sharing with community stakeholders by EDO board 2.56 2 Effectiveness of EDO board to remove barriers to economic development progress
(e.g., engaging in local and state policy development related to economic development) 2.55
3 Businesses participating in EDO leadership (Board or ED related committees) 2.47 4 Public-sector representatives participating in EDO leadership 2.4 5 Civic Engagement (number and variety of civic organizations represented on EDO
board or committees or actively engaged in implementing EDO programs) 2.11 6 Participation by minorities, women, and immigrants in EDO leadership and
community organizations 2.1 “Effectiveness in removing barriers” is among most important, but it is not the most tracked. This metric is among the two most important, but it is not as frequently tracked as businesses or public sector participation in EDO leadership. In fact, “effectiveness of the EDO board to remove barriers” is rated above average in importance but tracked below average frequency.
0 0.2 0.4 0.6 0.8 1 1.2 1.4 1.6
Civic Engagement (number and variety of civicorganizations represented on EDO board or…
Participation by minorities, women, and immigrants inEDO leadership and community organizations
Effectiveness of EDO board to remove barriers toeconomic development progress (e.g. engaging in…
Regular information sharing with communitystakeholders by EDO board
Public sector representatives participating in EDOleadership
Businesses participating in EDO leadership (Board orED related committees)
Percent of Average
Tracking Frequency and Importance Rating as Percent of Average
Importance Track

International Economic Development Council
Making it Count: Metrics for High Performing EDOs 142
RELATIONSHIPS ESTABLISHED 242 Responses
There were 242 responses to this section. On average, respondents collect 5.6 metrics out of the possible 11 metrics in this category. Twenty-eight respondents only collect one metric, while 21 collect all 11 metrics. The most respondents (33) collect six out of the 11 metrics.
Collaborations with education institutions, public-private partners, and legislators are top metrics. These metrics are most frequently tracked in the “Relationships Established” category. Relationships established with other stakeholders, such as site selectors, workforce investment boards, and other organizations are also tracked fairly frequently. Least tracked is the “depth of involvement with each partner,” as this metric is tracked less than half as often as collaboration with education institutions. The most tracked metrics also top the list of most important metrics.
The least tracked metric is “depth of involvement with each partner.” Only 28.9 percent of respondents track this measure.
Tracking Frequency of Relationships Established
Measures Frequency Percent 1 Collaboration with nearby four year colleges and
universities, technical colleges, and community colleges 164 67.8%
2 Public-private partnerships, joint ventures, collaboration (Number, size, type) 146 60.3%
3 Relationships established with area legislators 142 58.7%
4 Relationships established with regional and national site selectors 130 53.7%
5 Collaboration with area workforce investment boards (WIBs) 125 51.7%
6 Relationships with other organizations to expand resources, alternative funding streams, etc. 124 51.2%
7 Number of instances where EDO has partnered with other organizations to share resources (with or without formal partnership agreements) 121 50.0%
0
5
10
15
20
25
30
35
1 2 3 4 5 6 7 8 9 10 11Number of Metrics Per Respondent
Relationship Measurement: Relationships Established

International Economic Development Council
Making it Count: Metrics for High Performing EDOs 143
8 EDO engagement with organized industry networks 115 47.5%
9 Number of meetings held with potential investors 113 46.7%
10 Number of relationships established between EDO and community stakeholders (Civic groups, schools, social service groups, environmental) 113 46.7%
11 Depth of involvement with each partners (heavy, medium, light) 70 28.9%
Average Importance of Relationships Established Measures 1 = Not Useful, 2 = Nice to Have, 3 = Important Measure Mean
1 Collaboration with nearby four year colleges and universities, technical colleges, and community colleges 2.69
2 Public-private partnerships, joint ventures, collaboration (Number, size, type) 2.62 3 Relationships established with regional and national site selectors 2.6 4 Relationships established with area legislators 2.56 5 Relationships with other organizations to expand resources, alternative funding
streams, etc. 2.56 6 Number of instances where EDO has partnered with other organizations to share
resources (with or without formal partnership agreements) 2.44 7 Collaboration with area workforce investment boards (WIBs) 2.43 8 EDO engagement with organized industry networks 2.42 9 Number of relationships established between EDO and community stakeholders
(Civic groups, schools, social service groups, environmental) 2.39 10 Number of meetings held with potential investors 2.37 11 Depth of involvement with each partners (heavy, medium, light) 2.29
“Depth of involvement” is rated important but is tracked least frequently. This metric is least tracked, with only about 56 percent of the average tracking frequency for this category. However, it is rated with almost as much importance as many of the other metrics.

International Economic Development Council
Making it Count: Metrics for High Performing EDOs 144
“Important relationships established” differ by organization type. Collaboration with education institutions is a top metric for autonomous EDOs, ED departments (within a larger organization), and government ED entities. However, there are some differences in priorities across these EDO types as well. The Venn diagram below outlines these differences. Autonomous EDOs prioritize relationships established with site selectors, and government entities prioritize collaboration with workforce investment boards. Meanwhile, ED departments (within a larger organization) focus on meetings with potential investors. Both government and autonomous EDOs focus on relationships with area legislators. Government and ED departments (within a larger organization) prioritize public-private partnerships/joint ventures.
0 0.2 0.4 0.6 0.8 1 1.2 1.4
Depth of involvement with each partners (heavy,medium, light)
Number of relationships established between EDOand community stakeholders (Civic groups, schools,…
Number of meetings held with potential investors
EDO engagement with organized industry networks
Number of instances where EDO has partnered withother organizations to share resources (with or…
Relationships with other organizations to expandresources, alternative funding streams, etc.
Collaboration with area workforce investment boards(WIBs)
Relationships established with regional and nationalsite selectors
Relationships established with area legislators
Publicprivate partnerships, joint ventures,collaboration (Number, size, type)
Collaboration with nearby four year colleges anduniversities, technical colleges, and community…
Percent of Average
Tracking Frequency and Importance Rating as Percent of Average
Importance Tracked

International Economic Development Council
Making it Count: Metrics for High Performing EDOs 145
Public-private partnerships, joint
ventures, collaboration
(Number, size, type)
Top Metrics by Type
Collaboration with nearby four-year
colleges and universities, technical
colleges, and community colleges
Number of meetings held with potential investors
Relationships established with regional and national site selectors
Relationships established with area legislators
Government 33 Responses
ED Dept (within larger
org.) 28 Responses
Autonomous EDO 84 Responses

International Economic Development Council
Making it Count: Metrics for High Performing EDOs 146
COMMUNICATIONS 235 Responses
There were 235 respondents who answered the section on communications in relationship management. On average, respondents track three out of the five metrics in this category. Forty-four respondents only collect one metric, while 51 respondents collect all five metrics. The most respondents (56) collect two out of the five metrics.
“Engaging state and regional partners and local elected officials” and “media hits” are the most measured metrics. These metrics are most frequently tracked in the communications category. They are also rated the most important. In fact, the frequency of tracking tends to match the importance rating for all metrics in this category. The tracking frequency of these metrics is also consistent across EDO types.
The least tracked metric is “EDO-related communications on partner organization websites.” Just over 40 percent of respondents track this measure.
Tracking Frequency of Communications Measures Frequency Percent 1 Engaging/informing state and regional partners on EDO activities
and progress 167 71.1%
2 Educating local elected officials on economic development practice 161 68.5%
3 Number of positive media hits (Local/national/international recognition) 154 65.5%
4 Ranking of website in online search engines (Search engine optimization) 133 56.6%
5 EDO-related communications on partner organization websites (State, regional, local partners) 97 41.3%
0
10
20
30
40
50
60
1 2 3 4 5Number of Metrics Per Respondent
Relationship Management: Communications

International Economic Development Council
Making it Count: Metrics for High Performing EDOs 147
Average Importance of Communications Measures 1 = Not Useful, 2 = Nice to Have, 3 = Important Measure Mean
1 Educating local elected officials on economic development practice 2.69 2 Engaging/informing state and regional partners on EDO activities and progress 2.68 3 Number of positive media hits (Local/national/international recognition) 2.52 4 Ranking of website in online search engines (Search engine optimization) 2.5 5 EDO related communications on partner organization websites (State, regional,
local partners) 2.4
CLIENT SATISFACTION 184 Responses
There were 184 responses to the section on client satisfaction. On average, respondents collect 2.5 metrics out of the possible six metrics in this category. The most respondents (57) only collect one metric, and seven respondents collect all six metrics.
0 0.2 0.4 0.6 0.8 1 1.2 1.4
EDO related communications on partner organizationwebsites (State, regional, local partners)
Ranking of website in online search engines (Searchengine optimization)
Number of positive media hits(Local/national/international recognition)
Educating local elected officials on economicdevelopment practice
Engaging/informing state and regional partners onEDO activities and progress
Percent of Average
Tracking Frequency and Importance Rating as Percent of Average
Importance Tracked

International Economic Development Council
Making it Count: Metrics for High Performing EDOs 148
“Satisfaction ratings via survey,” “number of client success stories,” and “client retention” are the most tracked metrics. These metrics are tracked most frequently to gauge client satisfaction. They are also rated as the most important metrics. Within this category, the more frequently tracked metrics are also the more important ones. The tracking frequency of metrics is also consistent across EDO type.
The least tracked metric is “average client interaction costs.” About 12.5 percent of respondents track this measure.
Tracking Frequency of Client Satisfaction Measures Frequency Percent 1 Community/client satisfaction rating (via survey) 127 69.0%
2 Number of client success stories from participants in EDO programs 103 56.0%
3 Client retention 93 50.5%
4 Number of new clients who were recommended by existing clients 64 34.8%
5 Client attrition rate 60 32.6%
6 Average client interaction costs (Total costs for interacting divided by number of interactions) 23 12.5%
Average Importance of Client Satisfaction Measures 1 = Not Useful, 2 = Nice to Have, 3 = Important Measure Mean
1 Community/client satisfaction rating (via survey) 2.59 2 Number of client success stories from participants in EDO programs 2.56
3 Client retention 2.5
4 Client attrition rate 2.4 5 Number of new clients who were recommended by existing clients 2.36
6 Average client interaction costs (Total costs for interacting divided by number of interactions) 2.03
0
10
20
30
40
50
60
1 2 3 4 5 6Number of Metrics Per Respondent
Relationship Management: Client Satisfaction

International Economic Development Council
Making it Count: Metrics for High Performing EDOs 149
Community Measures
EDOs may not have much control over community measures, but most EDOs track related metrics as a way to understand and manage their impact on the overall community. All respondents were asked to answer this section.
DEMOGRAPHIC MAKEUP 257 Responses
Demographic makeup measures focus on workforce, wages, and education outcomes. There were 257 responses to this section. On average, respondents track 11.6 metrics out of the possible 24 metrics in this category. Eleven respondents only track one metric, while six respondents track all 24 metrics.
0 0.2 0.4 0.6 0.8 1 1.2 1.4 1.6 1.8
Average client interaction costs (Total costs forinteracting divided by number of interactions)
Client attrition rate
Number of new clients who were recommended byexisting clients
Client retention
Number of client success stories from participants inEDO programs
Community/client satisfaction rating (via survey)
Percent of Average
Tracking Frequency and Importance Rating as Percent of Average
Importance Tracked

International Economic Development Council
Making it Count: Metrics for High Performing EDOs 150
“Unemployment rate” and “employment by industry and sector” are the most tracked metrics. These metrics are tracked most frequently to measure demographic makeup. Other frequently tracked metrics are “education levels/attainment,” “labor force participation,” and “average wages by industry.” The most tracked metrics are consistent across EDO type. “Employment by industry/sector” and “number of qualified workers for specific jobs/sectors” are rated most important. Judging from these initial charts, many metrics in this category face a mismatch in tracking frequency and importance rating. The least tracked metric is companies that have signed “local hiring” agreements with EDO/local government. Only 10.5 percent of respondents track this measure.
Tracking Frequency of Demographic Makeup Measures Frequency Percent 1 Unemployment rate 226 87.9% 2 Employment by industry and sector 216 84.0%
3 Education levels/attainment 181 70.4%
4 Labor force participation (Number of residents in workforce) 180 70.0% 5 Average wage rates by industry 176 68.5%
6 Age distribution of working population 155 60.3%
7 Number of schools in jurisdiction (public and private) 154 59.9% 8 Commuting patterns to measure leakages from community 150 58.4%
9 Change in per capita income over time 148 57.6%
10 School enrollment 131 51.0% 11 Number of qualified workers for specific jobs and sectors 131 51.0%
12 Wage growth (Changes in average wages or salaries) 127 49.4%
13 Labor and training needs in the community (full/part-time employees, average wage rates, skill levels of work force, percent unionized, annual turnover rate, current hours of 126 49.0%
0
2
4
6
8
10
12
14
16
18
20
1 2 3 4 5 6 7 8 9 10 11 12 13 14 15 16 17 18 19 20 21 22 23 24Number of Metrics Per Respondent
Community Measures: Demographic Makeup

International Economic Development Council
Making it Count: Metrics for High Performing EDOs 151
training, etc.)
14 Earnings, by sector 123 47.9%
15 High school, College Dropout rates 118 45.9% 16 Educational opportunities for entrepreneurs (Number and
variety of programs offered) 99 38.5%
17 Per capita state/region/city expenditure for education 91 35.4%
18 Test scores 89 34.6% 19 Job openings per sector 87 33.9%
20 Labor market relations 81 31.5%
21 Immigration/emigration levels 62 24.1% 22 Talent Movement (Jobs filled by college graduates in the
community) 51 19.8%
23 Hiring of foreign nationals 32 12.5%
24 Companies that have signed "local hiring" agreements with EDO/local government 27 10.5%
Average Importance of Demographic Makeup Measures 1 = Not Useful, 2 = Nice to Have, 3 = Important Measure Mean
1 Employment by industry and sector 2.77 2 Number of qualified workers for specific jobs and sectors 2.69 3 Education levels/attainment 2.68 4 Average wage rates by industry 2.65 5 Change in per capita income over time 2.64 6 Labor and training needs in the community (full/part-time employees, average
wage rates, skill levels of work force, percent unionized, annual turnover rate, current hours of training, etc.) 2.64
7 Unemployment rate 2.62 8 Labor force participation (Number of residents in workforce) 2.61 9 Commuting patterns to measure leakages from community 2.57 10 Earnings, by sector 2.53 11 Age distribution of working population 2.52 12 Wage growth (Changes in average wages or salaries) 2.5 13 Number of schools in jurisdiction (public and private) 2.48 14 Job openings per sector 2.46 15 Educational opportunities for entrepreneurs (Number and variety of programs
offered) 2.43 16 Talent Movement (Jobs filled by college graduates in the community) 2.4 17 School enrollment 2.36 18 High school, College Dropout rates 2.35 19 Labor market relations 2.29 20 Per capita state/region/city expenditure for education 2.28 21 Test scores 2.18 22 Immigration/emigration levels 2.14 23 Hiring of foreign nationals 1.95 24 Companies that have signed "local hiring" agreements with EDO/local
government 1.93

International Economic Development Council
Making it Count: Metrics for High Performing EDOs 152
“Unemployment rate” is by far the most tracked, but it is only rated as the seventh most important metric. Many less frequently tracked metrics are rated more important than unemployment rate. For example, the “labor and training needs in the community” metric is rated more important than “unemployment rate,” but only 126 organizations track it while 226 organizations track unemployment. “Educational opportunities for entrepreneurs,” “job openings per sector,” and “talent movement” are important but not frequently tracked. These metrics are rated at the category average in terms of importance, but they are tracked with below average frequency. This is especially true for talent movement (jobs filled by college graduates in the community), which is only tracked at 40 percent the category average.

International Economic Development Council
Making it Count: Metrics for High Performing EDOs 153
BUSINESS RELATED FACTORS 219 Responses
0 0.2 0.4 0.6 0.8 1 1.2 1.4 1.6 1.8 2
Companies that have signed "local hiring"…
Hiring of foreign nationals
Talent Movement (Jobs filled by college graduates in…
Immigration/emigration levels
Labor market relations
Job openings per sector
Test scores
Per capita state/region/city expenditure for education
Educational opportunities for entrepreneurs…
High school, College Dropout rates
Earnings, by sector
Labor and training needs in the community (full/part…
Wage growth (Changes in average wages or salaries)
Number of qualified workers for specific jobs and…
School enrollment
Change in per capita income over time
Commuting patterns to measure leakages from…
Number of schools in jurisdiction (public and private)
Age distribution of working population
Average wage rates by industry
Labor force participation (Number of residents in…
Education levels/attainment
Employment by industry and sector
Unemployment rate
Percent of Average
Tracking Frequency and Importance Rating as Percent of Average
Importance Tracked

International Economic Development Council
Making it Count: Metrics for High Performing EDOs 154
Business-related factors include the ease of finding skilled workers, obtaining financing, navigating regulations, and other local impacts on doing business. There were 219 responses to this section. On average, respondents track 4.3 metrics out of 13 possible metrics in this category. The most respondents (40) only collect one metric, while five respondents collect all 13 metrics.
“Assessment of business workforce needs” and “ratings of business climate” are top metrics. These metrics are most frequently tracked among business-related factors and are also among the most important metrics. The most tracked metrics are consistent across EDO type.
The least tracked metric is “systematic comparison between companies/regions that received assistance and those that did not.” Similar for Business Creation and Entrepreneurship, this measure placed last in terms of tracking frequency.
Tracking Frequency of Business Related Factors Frequency Percent 1 Assessment of business workforce needs 127 58.0% 2 Ratings of the business climate in the community 122 55.7%
3 Barriers to growth (Inadequate supply of qualified job applicants, uncompetitive tax rates, crime rate, uncompetitive cost of living, high energy costs, etc.) 117 53.4%
4 Ease of doing business (average number of days to open a business/number of permits to be obtained, average cost of opening a business, etc.) 94 42.9%
5 Access to capital (Federal/state/local subsidies, SBA loans, etc.) 87 39.7%
6 Satisfaction rating of public services/facilities in the community 78 35.6%
7 Increased diversity of businesses in the economy 67 30.6% 8 Expansion in services provided by EDO 63 28.8%
9 Breadth and depth of services offered by financial institutions 52 23.7%
0
5
10
15
20
25
30
35
40
45
1 2 3 4 5 6 7 8 9 10 11 12 13Number of Metrics Per Respondent
Community Measures: Business Related Factors

International Economic Development Council
Making it Count: Metrics for High Performing EDOs 155
10 Labor force productivity (value added per employee) 48 21.9%
11 Business bankruptcy filings 37 16.9%
12 Immigrant friendliness (cultural diversity in the community, strong business subgroups/associations/chambers around specific nationalities, etc.) 29 13.2%
13 Systematic comparisons between companies/regions that received assistance and those that did not (under business assistance) 15 6.8%
Average Importance of Business Related Factors
1 = Not Useful, 2 = Nice to Have, 3 = Important Measure Mean 1 Assessment of business workforce needs 2.7
2 Barriers to growth (Inadequate supply of qualified job applicants, uncompetitive tax rates, crime rate, uncompetitive cost of living, high energy costs, etc) 2.66
3 Ratings of the business climate in the community 2.58
4 Ease of doing business (average number of days to open a business/number of permits to be obtained, average cost of opening a business, etc.) 2.55
5 Access to capital (Federal/state/local subsidies, SBA loans, etc) 2.49
6 Labor force productivity (value added per employee) 2.43 7 Satisfaction rating of public services/facilities in the community 2.42
8 Increased diversity of businesses in the economy 2.39
9 Expansion in services provided by EDO 2.34 10 Breadth and depth of services offered by financial institutions 2.31
11 Immigrant friendliness (Cultural diversity in the community, strong business subgroups/associations/chambers around specific nationalities, etc.) 2.04
12 Business bankruptcy filings 1.95
13 Systematic comparisons between companies/regions that received assistance and those that did not (under business assistance) 1.91
“Labor force productivity” is highly rated but not frequently tracked. This metric is rated above average in terms of importance, but it is tracked with below average frequency. It is more important than “satisfaction rating of public services/facilities in the community,” but it is only tracked about 60 percent as often.

International Economic Development Council
Making it Count: Metrics for High Performing EDOs 156
REAL ESTATE & HOUSING 27 Responses
Real estate and housing measures focus on residential real estate (industrial and commercial real estate is included under EDO Program Measures). There were only 27 responses to this category. Thus, results in this section must be qualified by a small sample size. On average, respondents track 8.3 metrics out of the possible 13 metrics in this category. The most respondents (six) track all 13 metrics, while two respondents only track one metric.
0 0.2 0.4 0.6 0.8 1 1.2 1.4 1.6 1.8 2
Systematic comparisons between companies/regionsthat received assistance and those that did not…
Immigrant friendliness (Cultural diversity in thecommunity, strong business…
Business bankruptcy filings
Labor force productivity (value added per employee)
Breadth and depth of services offered by financialinstitutions
Expansion in services provided by EDO
Increased diversity of businesses in the economy
Satisfaction rating of public services/facilities in thecommunity
Access to capital (Federal/state/local subsidies, SBAloans, etc)
Ease of doing business (average number of days toopen a business/number of permits to be obtained,…
Barriers to growth (Inadequate supply of qualified jobapplicants, uncompetitive tax rates, crime rate,…
Ratings of the business climate in the community
Assessment of business workforce needs
Percent of Average
Tracking Frequency and Importance Rating as Percent of Average
Importance Tracked

International Economic Development Council
Making it Count: Metrics for High Performing EDOs 157
“Vacancy rates” are top tracked metric in the real estate and housing category. Also frequently tracked are ‘percentage of owner-occupied households,” “housing units built,” and “property values.” The most important metrics are “property values,” “affordability of housing,” and “cost of living.” Responses in this category were too few to conduct cross-tabulations by organization type.
The least tracked metric is the “ratio of housing price to income.” About 44 percent of respondents track this measure.
Tracking Frequency of Housing Measures Frequency Percent 1 Vacancy rates 21 77.8%
2 Percentage of owner occupied households 20 74.1%
3 Housing units built 20 74.1%
4 Property values (residential versus commercial) 20 74.1%
5 Average monthly rental 19 70.4%
6 Affordability of housing 19 70.4%
7 Average housing size 18 66.7%
8 Cost of living (avg. housing costs, avg. utility costs, etc.) 17 63.0%
9 Change in foreclosure rate 15 55.6%
10 Value of new housing construction (in targeted area) 15 55.6%
11 Average construction costs per square inch 14 51.9%
12 Housing conditions 14 51.9%
13 Ratio of housing price to income 12 44.4%
0
1
2
3
4
5
6
7
1 2 3 4 5 6 7 8 9 10 11 12 13Number of Metrics Per Respondent
Community Measures: Real Estate & Housing

International Economic Development Council
Making it Count: Metrics for High Performing EDOs 158
Average Importance of Housing Measures 1 = Not Useful, 2 = Nice to Have, 3 = Important Measure Mean
1 Property values (residential versus commercial) 2.56
2 Affordability of housing 2.56 3 Cost of living (avg. housing costs, avg. utility costs, etc.) 2.56
4 Vacancy rates 2.47
5 Housing units built 2.44 6 Ratio of housing price to income 2.4
7 Average monthly rental 2.39
8 Value of new housing construction (in targeted area) 2.39 9 Housing conditions 2.33
10 Percentage of owner occupied households 2.32
11 Average construction costs per square inch 2.29 12 Average housing size 2.19
13 Change in foreclosure rate 2.17
“Cost of living,” “affordability of housing,” and “property values” are ranked as most important, but “vacancy rates” are most frequently tracked. These three metrics are tied for most important, yet they are not the most frequently tracked.
The “ratio of housing price to income” ranked important, but it is a metric that is not frequently tracked. The “ratio of housing price to income” is the least tracked metric, but it is ranked more important than half of the metrics in this category.

International Economic Development Council
Making it Count: Metrics for High Performing EDOs 159
QUALITY OF LIFE 222 Responses
There were 222 responses to the section on quality of life metrics. On average, respondents track 7.4 metrics out of the possible 22 metrics in this category. The most respondents (23) track only one metric, while three respondents track all 22 metrics.
0 0.2 0.4 0.6 0.8 1 1.2 1.4
Ratio of housing price to income
Housing conditions
Average construction costs per square inch
Value of new housing construction (in targeted area)
Change in foreclosure rate
Cost of living (Avg housing costs, avg utility costs, etc.)
Average housing size
Affordability of housing
Average monthly rental
Property values (Residential versus commercial)
Housing units built
Percentage of owner occupied households
Vacancy rates
Percent of Average
Tracking Frequency and Importance Rating as Percent of Average
Importance Tracked

International Economic Development Council
Making it Count: Metrics for High Performing EDOs 160
“Income,” “crime rates,” and “healthcare” are the most tracked metrics in this section. These metrics are most frequently tracked to measure quality of life. “Income” may indicate median, average household, or family incomes. These top metrics are consistent across EDO type.
The least tracked metrics are “participation by minorities, women, and immigrants in community/civic organizations” and “Gini coefficients.” Less than ten percent of respondents track these measures. The Gini coefficient is an economic indicator that measures the inequality of income between different segments of the community.
Tracking Frequency of Quality of Life Measures Frequency Percent 1 Median/average household/family incomes 166 74.8%
2 Crime rates 155 69.8% 3 Healthcare (Number of hospitals, quality of healthcare offered,
options for elderly care, etc.) 145 65.3%
4 Population diversity 133 59.9%
5 Access to sports and recreation 122 55.0% 6 Access to broadband internet 113 50.9%
7 Park space inventory and proximity to residents 97 43.7%
8 Number of celebrations and festivals in community/municipality and number of visitors 91 41.0%
9 Distance to vital retail amenities—such as grocery stores, pharmacies, and postal offices—from major housing establishments 77 34.7%
10 Physical/streetscape improvements 68 30.6%
0
5
10
15
20
25
1 2 3 4 5 6 7 8 9 10 11 12 13 14 15 16 17 18 19 20 21 22Number of Metrics Per Respondent
Community Measures: Quality of Life

International Economic Development Council
Making it Count: Metrics for High Performing EDOs 161
11 Number of local newspaper publishers 57 25.7%
12 Percent of locally owned businesses 57 25.7%
13 Walk-ability 48 21.6% 14 Total and per capita expenditures on arts and culture
(museums, parks, etc.), infrastructure improvements, and community projects 47 21.2%
15 Volunteerism to improve the community (hours) 46 20.7%
16 Cost and availability of child care services 46 20.7%
17 Voting rates 43 19.4%
18 Value of charitable donations 35 15.8%
19 Morbidity, mortality rates 34 15.3%
20 Gentrification or displacement 23 10.4%
21 Participation by minorities, women, and immigrants in community/civic organizations 22 9.9%
22 Gini Coefficients (Measuring inequality of income or wealth between different segments of the community) 21 9.5%
“Income,” “access to broadband internet,” and “healthcare” are the most important metrics in this section. Healthcare can be represented by the number of hospitals, the quality of healthcare offered, options for elderly care, and so forth.
Average Importance of Quality of Life Measures 1 = Not Useful, 2 = Nice to Have, 3 = Important Measure Mean
1 Access to broadband internet 2.63
2 Median/average household/family incomes 2.62 3 Healthcare (Number of hospitals, quality of healthcare offered, options for elderly
care, etc.) 2.59
4 Crime rates 2.52
5 Population diversity 2.43 6 Access to sports and recreation 2.37
7 Percent of locally owned businesses 2.33
8 Physical/streetscape improvements 2.23 9 Distance to vital retail amenities—such as grocery stores, pharmacies, and postal
offices—from major housing establishments 2.21 10 Cost and availability of child care services 2.19
11 Park space inventory and proximity to residents 2.18
12 Total and per capita expenditures on arts and culture (museums, parks, etc.), infrastructure improvements, community projects 2.13
13 Number of celebrations and festivals in community/municipality and number of visitors 2.12
14 Walk-ability 2.06
15 Volunteerism to improve the community (hours) 2.04
16 Value of charitable donations 1.95 17 Gini Coefficients (Measuring inequality of income or wealth between different
segments of the community) 1.92 18 Voting rates 1.9

International Economic Development Council
Making it Count: Metrics for High Performing EDOs 162
19 Gentrification or displacement 1.87
20 Participation by minorities, women, and immigrants in community/civic organizations 1.84
21 Number of local newspaper publishers 1.8
22 Morbidity, mortality rates 1.78 “Access to broadband internet” and “percent of locally-owned businesses” are rated important, but they are tracked less frequently. “Access to broadband internet” is rated most important in this category, but it is only the sixth most frequently tracked. The “percent of locally owned businesses” is above average in importance but well below average in tracking frequency. The “number of local newspaper publishers” is tracked frequently, but it is less important. This metric is ranked second to last in importance, yet it is tracked more often than half the metrics in this category.

International Economic Development Council
Making it Count: Metrics for High Performing EDOs 163
0 0.5 1 1.5 2 2.5
Gini Coefficients (Measuring inequality of income or…
Participation by minorities, women, and immigrants…
Gentrification or displacement
Morbidity, mortality rates
Value of charitable donations
Voting rates
Volunteerism to improve the community (hours)
Cost and availability of child care services
Total and per capita expenditures on arts and…
Walkability
Number of local newspaper publishers
Percent of locally owned businesses
Physical/streetscape improvements
Distance to vital retail amenities such as grocery…
Number of celebrations and festivals in…
Park space inventory and proximity to residents
Access to broadband internet
Access to sports and recreation
Population diversity
Healthcare (Number of hospitals, quality of…
Crime rates
Median/average household/family incomes
Percent of Average
Tracking Frequency and Importance Rating as Percent of Average
Importance Tracked

International Economic Development Council
Making it Count: Metrics for High Performing EDOs 164
TRANSPORTATION & PUBLIC TRANSIT 161 Responses
There were 161 responses to the section on transportation and public transit metrics. On average, respondents track 4.3 metrics out of 13 possible metrics in this category. The most respondents (43) track only one metric, while 12 respondents track all 13 metrics.
“Average commute times,” “access to mass transit,” and “travel times to other communities/employment centers” are the most tracked metrics. These metrics are most frequently used to measure transportation and public transit outcomes. The most tracked metrics are consistent across EDO type.
The least tracked metrics are “percent of population carpooling to work” and “transportation incentives to offset costs or manage traffic flows.” Only about 15 percent of respondents are tracking each measure.
Tracking Frequency of Transportation & Public Transit Measures Frequency Percent
1 Average commute times 101 62.7% 2 Access to mass transit 81 50.3%
3 Travel times to other communities and employment centers 81 50.3%
4 Reliability of public transportation 63 39.1% 5 Transit service coverage and density 57 35.4%
6 Bicycle and pedestrian networks 53 32.9%
7 Percent of population using public transportation 52 32.3%
0
5
10
15
20
25
30
35
40
45
50
1 2 3 4 5 6 7 8 9 10 11 12 13Number of Metrics Per Respondent
Community Measures: Transportation & Public Transit

International Economic Development Council
Making it Count: Metrics for High Performing EDOs 165
8 Cost of public transportation 52 32.3%
9 Congestion levels 42 26.1%
10 Vehicle miles traveled per capita 37 23.0% 11 Percent of residents that live within walking distance of public
transport 32 19.9%
12 Percent of population carpooling to work 25 15.5%
13 Transportation incentives to offset costs or manage traffic flows (tolls, HOV lanes, tax rebates on transit fares, etc.) 24 14.9%
The most tracked metrics are also the most important. The top three metrics are also rated the most important. On the whole, more important metrics tend to be tracked more frequently as well.
Average Importance of Transportation & Public Transit Measures 1 = Not Useful, 2 = Nice to Have, 3 = Important Measure Mean
1 Average commute times 2.42
2 Travel times to other communities and employment centers 2.42
3 Access to mass transit 2.29 4 Reliability of public transportation 2.26
5 Transit service coverage and density 2.22
6 Cost of public transportation 2.2 7 Percent of population using public transportation 2.15
8 Bicycle and pedestrian networks 2.13
9 Congestion levels 2.11 10 Vehicle miles traveled per capita 2.07
11 Percent of residents that live within walking distance of public transport 2.06
12 Percent of population carpooling to work 1.91 13 Transportation incentives to offset costs or manage traffic flows (tolls, HOV
lanes, tax rebates on transit fares, etc.) 1.83

International Economic Development Council
Making it Count: Metrics for High Performing EDOs 166
ENVIRONMENT 0 Responses
Zero responses to environment metrics indicate a lack of focus on this area or unwillingness to measure it. Although IEDC also included a section on Environment under the Community Measures section, there were no responses to this section.
TRADE & TOURISM 104 Responses
There were 104 responses to the section on trade and tourism metrics. On average, respondents track 8.7 metrics out of the possible 22 metrics in this category. The most respondents (11) track nine metrics. Seven respondents only track a single metric, while two respondents track all 22 metrics.
0 0.2 0.4 0.6 0.8 1 1.2 1.4 1.6 1.8 2
Transportation incentives to offset costs or manage…
Percent of population carpooling to work
Percent of residents that live within walking distance…
Vehicle miles traveled per capita
Congestion levels
Cost of public transportation
Percent of population using public transportation
Bicycle and pedestrian networks
Transit service coverage and density
Reliability of public transportation
Travel times to other communities and employment…
Access to mass transit
Average commute times
Percent of Average
Tracking Frequency and Importance Rating as Percent of Average
Importance Tracked

International Economic Development Council
Making it Count: Metrics for High Performing EDOs 167
“Website/social media hits,” “festivals and events,” and “regional branding” are the most tracked metrics in this section. These metrics are used most frequently to track trade and tourism outcomes. Responses to this category were too few to conduct cross-tabulations by EDO type.
The least tracked metrics are the “number of globally renowned think tanks that are locally based” and the “number of student foreign exchange opportunities cultivated/established.” Only 9.6 and 11.5 percent of respondents are tracking these measures, respectively.
Tracking Frequency of Trade & Tourism Measures Frequency Percent 1 Website/social media hits 71 68.3%
2 Festivals and events (number, number of participants, visitors) 60 57.7%
3 Branding the region to generate more business development opportunities 58 55.8%
4 Number of accommodations – hotels, motels, bed and breakfasts 57 54.8%
5 Annual average hotel occupancy rate 53 51.0%
6 Exports (amount and/or growth) and trade activity 53 51.0% 7 Number of businesses in the tourism sector 47 45.2%
8 Number of international trade shows participated 46 44.2%
9 Tourist/visitor average length of stay 45 43.3% 10 Number of trade missions and diversity of countries visited 44 42.3%
11 Number of Fortune 500 companies with local presence 44 42.3%
12 Growth in tourism spending per visit 43 41.3%
0
2
4
6
8
10
12
1 2 3 4 5 6 7 8 9 10 11 12 13 14 15 16 17 18 19 20 21 22Number of Metrics Per Respondent
Community Measures: Trade & Tourism

International Economic Development Council
Making it Count: Metrics for High Performing EDOs 168
13 Number of places that flights connect to 43 41.3%
14 Number of new visitors to community 42 40.4%
15 Improvement in region’s “competitive position” in the global economy 39 37.5%
16 Visitors services (number of locations that provide visitor information, online presence, frequency with which information is updated, etc.) 38 36.5%
17 Frequency of international flights 37 35.6%
18 Number of Sister City relationships actively cultivated/established 35 33.7%
19 Number of tourism packages developed 21 20.2%
20 Percent of globally connected entrepreneurs in the community 19 18.3%
21 Number of student foreign exchange opportunities cultivated/established 12 11.5%
22 Number of globally renowned think tanks that are locally based 10 9.6%
“Regional branding,” “exports/trade activity,” and “website/social media hits” are most important metrics in this section. Two of the most tracked metrics are also among the most important. However, these charts suggest that there may be several mismatches between what is most tracked and what is rated most important.
Average Importance of Trade & Tourism Measures 1 = Not Useful, 2 = Nice to Have, 3 = Important Measure Mean
1 Branding the region to generate more business development opportunities 2.65
2 Exports (amount and/or growth) and trade activity 2.57
3 Website/social media hits 2.53
4 Number of places that flights connect to 2.49
5 Improvement in region’s “competitive position” in the global economy 2.46
6 Number of Fortune 500 companies with local presence 2.44
7 Festivals and events (number, number of participants, visitors) 2.41
8 Number of accommodations – hotels, motels, bed and breakfasts 2.37
9 Annual average hotel occupancy rate 2.37
10 Number of businesses in the tourism sector 2.32
11 Number of new visitors to community 2.32
12 Tourist/visitor average length of stay 2.31
13 Frequency of international flights 2.31
14 Growth in tourism spending per visit 2.29
15 Visitors services (number of locations that provide visitor information, online presence, frequency with which information is updated, etc.) 2.24
16 Percent of globally connected entrepreneurs in the community 2.24
17 Number of international trade shows participated 2.12
18 Number of trade missions and diversity of countries visited 2.12 19 Number of tourism packages developed 2.05
20 Number of Sister City relationships actively cultivated/established 2.03
21 Number of student foreign exchange opportunities cultivated/established 1.82 22 Number of globally renowned think tanks that are locally based 1.82

International Economic Development Council
Making it Count: Metrics for High Performing EDOs 169
“Branding the region” is the most important metric, but it is not the most tracked. “Branding the region to generate more business development opportunities” is rated as most important, but it is only the third most tracked. “Improvement in region’s competitive position in global economy” and “exports/trade activity” are rated as important, but they are less frequently tracked. These metrics are among the top five most important in this category but are not among the five most tracked. The “percent of globally connected entrepreneurs in the community” is considered important, but it is very infrequently tracked. This metric is rated almost average importance, but it is only tracked at 45 percent of the average tracking frequency. “Number of international trade shows participated in” and “number of trade missions and diversity of countries visited” are frequently tracked, but they are not the most important. These metrics are tracked with above average frequency but rated below average importance. They are among the six least important metrics but are tracked more often than seven more important metrics.

International Economic Development Council
Making it Count: Metrics for High Performing EDOs 170
0 0.2 0.4 0.6 0.8 1 1.2 1.4 1.6 1.8
Number of globally renowned think tanks that are…
Number of student foreign exchange opportunities…
Percent of globally connected entrepreneurs in the…
Number of tourism packages developed
Number of Sister City relationships actively…
Frequency of international flights
Visitors services (number of locations that provide…
Improvement in region’s “competitive position” in …
Number of new visitors to community
Number of places that flights connect to
Growth in tourism spending per visit
Number of Fortune 500 companies with local…
Number of trade missions and diversity of countries…
Tourist/visitor average length of stay
Number of international trade shows participated
Number of businesses in the tourism sector
Exports (amount and/or growth) and trade activity
Annual average hotel occupancy rate
Number of accommodations – hotels, motels, bed …
Branding the region to generate more business…
Festivals and events (number, number of…
Website/social media hits
Percent of Average
Tracking Frequency and Importance Rating as Percent of Average
Importance Tracked

International Economic Development Council
Making it Count: Metrics for High Performing EDOs 171
Survey Feedback
Finally, IEDC asked respondents to give feedback about the survey itself. Respondents were asked, “Did the survey spark thoughts and ideas about how you can use this information?” The word cloud below summarizes responses to this question, which were overwhelmingly positive.
DID THE SURVEY SPARK THOUGHTS AND IDEAS ABOUT HOW YOU CAN USE THIS INFORMATION?
Created using Wordle.net
Some respondents said that taking the survey is a first step in helping them with improving their own performance evaluation methods. Several respondents requested a copy of the survey, while others suggested some specific ways this survey could help them or offered other thoughts on the survey.
Sample Answers
Illuminating more metrics:
• “I am anxious to see the results, as I realize our organization is not adequately tracking its successes/impacts.”
• “Yes, it provided a lot of ideas as to what kind of information we should/could be gathering and sharing.”
• “Yes, several of the factors we do not track and some we have not even considered.”
• “Thank you for providing this survey, it was well worth my time! It helped me to identify areas where our organization is falling short. There were measurements that I rated as important to our community but realized we do not track.”
Standardizing metrics:
• “A published list of all of the suggested criteria would be helpful in designing local

International Economic Development Council
Making it Count: Metrics for High Performing EDOs 172
metrics and evaluation tables.”
• “It will be interesting to see which ones are really being used and how helpful people think they are. When the survey reporting is presented, I will be looking through the list of measures again to see which ones we may want to incorporate into our program.”
Improve EDO collaboration: “Yes, more EDO collaboration is needed to share best practices and success stories relating to performance metrics.”
Educating elected officials: “Yes, I need to do a better job of educating our elected officials.”
Danger of over-measurement: “I don't think we are terribly good at measurement in our state, so these suggestions will be helpful. On the other hand, one could over-measure (e.g., if we used all of these metrics), so each of us really needs to choose those measures that are most important.”
Survey length: “Survey got too long. I ran out of time to think about these final questions.”
ADDITIONAL COMMENTS IEDC asked respondents to provide additional comments on the survey, if they had any. Several EDOs discussed how the responsibility of tracking metrics is often shared across entities and that this impacts how metrics should be used and interpreted. Many echoed the need for a standardized set of metrics that EDOs can use to benchmark against each other.
Created using Wordle.net

International Economic Development Council
Making it Count: Metrics for High Performing EDOs 173
Sample Answers
Tracking responsibilities are shared:
• “Many of the data points that I indicated that our organization doesn't collect (particularly that I indicated were important) are often collected by the city, our regional council of governments, or a regional economic development agency. I’m concerned that the survey results will show that there are many indicators that I believe are important are not available when they are collected by other organizations and readily available.”
• “Given the diversity of EDOs, measurements often depend on the scope of work of the EDO. The EDO might have access to many of the measurements being asked about, but through partner or other community organizations.”
Need for standardized menu of metrics: “If any of my colleagues within the ED profession have examples of spreadsheets or other ‘document forms’ whereby they track their respective metrics, I would love to have examples sent me. We tend to have multiple forms that require specific inputs but nothing that combines all inputs into one. We are always ‘bouncing’ from one form to another, as a result, for updating and reporting purposes.”

International Economic Development Council
Making it Count: Metrics for High Performing EDOs 174
Tools and Resources
DATA RESOURCES
• Search by geography, data type and more at data.gov: http://catalog.data.gov/dataset
• Metro, county, and regional data from the Bureau of Labor Statistics: http://www.bls.gov/bls/geography.htm
• Metro and state economic data from the Bureau of Economic Analysis: http://www.bea.gov/regional/index.htm
• Socioeconomic data for rural counties: Atlas of Rural and Small-Town America U.S. Department of Agriculture, Economic Research Service http://www.ers.usda.gov/data-products/atlas-of-rural-and-small-town-america.aspx#.UscnUdk6_cu
• County, metro and state-level data related to innovation: Innovation Index U.S. Economic Development Administration http://www.statsamerica.org/innovation/innovation_index/region-select.html
• State-level data and rankings on energy efficiency policies: The State Energy Efficiency Scorecard American Council for an Energy-Efficient Economy http://aceee.org/sector/state-policy/scorecard
• School district-level education data: National Center for Education Statistics http://nces.ed.gov/edat/
READING MATERIALS
• Advanced Performance Institute. Retrieved from: http://www.ap-institute.com/books.aspx.
• Ammons, David and Morgan, Jonathan. (June 2011). State-of-the-Art Measures in Economic Development, Public Management (00333611), 93(5), 6-10 – Available on the web at http://webapps.icma.org/pm/9305/public/cover.cfm?author=David%20Ammons%20and%20Jonathan%20Morgan&title=State-of-the-Art%20Measures%20in%20Economic%20Development&subtitle
• The Aspen Institute. (n.d). Tools for practice: Measuring Community Capacity Building: A workbook-in-progress for rural communitites, version 3-96. The Aspen Institute: Rural Economic Policy Program. Accessed from http://www.aspeninstitute.org/sites/default/files/content/docs/csg/MEASURING_COMMUNITY_CAPACTIY_BUILDING.PDF
• The Balanced Scorecard Institute. Retrieved from website: http://www.balancedscorecard.org/.

International Economic Development Council
Making it Count: Metrics for High Performing EDOs 175
• Bourne, Mike and Neely, Andy. (2003). Implementing performance measurement systems: a literature review. International Journal Business Performance Management, 15 (1).
• Charlotte Regional Partnership. (2011). Charlotte Regional Partnership FY 2011-2012 Balanced Scorecard.
• Chase, Tim. (Summer 2010). A Crisis is a Terrible Thing to Waste. The IEDC Economic Development Journal, 9 (3), pp. 27-35.
• Chief Economic Development Officers’ Society/ County Surveyors’ Society. (April 2003). Performance Measurement for Local Authority Economic Development Phase 1 Report. Retrieved from: http://www.cedos.org/publications/0310%20performance%20report%201.pdf
• Coylvas, Jeannette. (February 2012). Performance Metrics as Formal Structures and through the Lens of Social Mechanisms: When Do They Work and How Do They Influence? American Journal of Education, 118 (2), 167-197.
• Community Service Center. (2005, March). Results of the Clatsop Economic Development Survey. Clatsop County. Retrieved from http://clatsopcounty.us/Assets/Dept_12/PDF/Results%20of%20the%20Clatsop%20County%20Economic%20Development%20Survey.pdf.
• Doran, G. T. (1981). There's a S.M.A.R.T. way to write management’s goals and objectives. Management Review, 70(11), 35.
• Economic Developers Association of Canada (EDAC). (2011). Performance Measurement in Economic Development. Retrieved from EDAC website: http://www.edac.ca/system/resources/BAhbBlsHOgZmSSJdMjAxMS8xMC8wMy8xNl81Nl8yMV81MTJfRmluYWxfUmVwb3J0X1BlcmZvcm1hbmNlX01lYXN1cmVtZW50X2luX0Vjb25vbWljX0RldmVsb3BtZW50LnBkZgY6BkVU/Final_Report_Performance_Measurement_in_Economic_Development.pdf.
• Edmunds, Stahrl. 1979. Performance Measures for Small Business. Harvard Business Review. 57, no. 1: 172-176.
• Epstein, M. , & McFarlan, F. (2011). Measuring the efficiency and effectiveness of a nonprofit's performance. Strategic Finance, 93(4), 27-34.
• Felsenstein, Daniel. Persky, Joseph and Wiewel, Wim. (1997) Integrating Hard-to-Measure Externalities into the Evaluation of Local Economic Development Projects. The Town Planning Review, 68 (1), pp. 55-79.
• Ficenec, S. (2012). Building Economic Development Networks in Detroit: A Comparison of Methods of Social Network Analysis. Retrieved from http://www.gwu.edu/~gwipp/Building%20Economic%20Development%20Networks%20in%20Detroit%204-25-11.pdf.
• Florida Department of Economic Opportunity. (2012, July). The Florida Five Year Strategic Plan for Economic Development. Retrieved from http://www.floridajobs.org/Business/FL5yrPlan/PlainLanguage.pdf.
• Frank, B. and T. Enkawa. (2008, March). How Economic Growth Affects Customer Service. Asian Pacific Management Review. 13(2): 531-544. Retrieved from http://apmr.management.ncku.edu.tw/comm/updown/DW0806261223.pdf.
• Fulton, William. (September 2010). Measuring Economic Development Without Depending on Jobs. Governing The States and Localities. Retrieved from: http://www.governing.com/topics/economic-dev/measuring-economic-development-without-
depending-jobs.html.
• Gallagher, S., Brown, S. and Brown, L. (2008 Spring). A Strong Market Culture Drives Organizational Performance and Success. Employment Relations Today, 35:1.

International Economic Development Council
Making it Count: Metrics for High Performing EDOs 176
• Gibbs, S. & Valois, M. (2012). Open-Source Ideation for Economic Development: Rhode Island. The Futurist. 46(4). Retrieved from http://www.wfs.org/futurist/july-august-2012-vol-46-no-4/building-and-connecting-communities-for-future/open-source-ide
• Griffin, Jennifer (2000). Corporate Social Performance: Research Directions for the 21st Century. Business Society 39, p. 479-491.
• Han, L.C. and J.E. Grunig. (1999). Guidelines for Measuring Relationships in Public Relations. Institute for Public Relations. Retrieved from http://www.aco.nato.int/resources/9/Conference%202011/Guidelines_Measuring_Relationships%5B1%5D.pdf.
• Hatry, Henry (2006). Performance Measurement – Getting Results. Washington, D.C.: Urban Institute Press.
• I-Open. (n.d.) Offerings. I-Open. Retrieved from https://sites.google.com/site/instituteopeneconomicnetworks/home
• International Economic Development Council. (2011). Economic Development Metrics Concept Paper.
• Johnson, M.D. and C. Fornell. (1990, March 2). A framework for comparing customer satisfaction across individuals and product categories. Journal of Economic Psychology. 12(1991): 267-286. Retrieved from http://deepblue.lib.umich.edu/bitstream/2027.42/29302/1/0000365.pdf.
• Jolly, J., McHugh, P., & Reid, D. (2001). Incentives 2.0. Economic Development Journal, 10(3). Retrieved from http://ioworldwide.com/includes/data1/images/promo/EDJ_Summer11.pdf
• Kaplan, R. , & Norton, D. (2005). The balanced scorecard: Measures that drive performance. Harvard Business Review, 83(7/8), 172-180. Reprint of 1992 article in same journal. Retrieved from: http://hbr.org/2005/07/the-balanced-scorecard-measures-that-drive-performance/ar/1
• Lindblad, Mark Richard. (2006). Performance Measurement in Local Economic Development. Urban Affairs Review. 41, pp. 646-672.
• London, T. (2009). Making better investments at the base of the pyramid. Harvard Business Review, 87(5), 106-113 (5). Retrieved from: http://hbr.org/2009/05/making-better-investments-at-the-base-of-the-pyramid/es
• Melkers, Dr. Julia and Malone, Ms. Laura. Performance Measurement in State Economic Development Agencies. 2002. http://www.housepdf.com/Performance-Measurement-in-
State-Economic-Development-Agencies.html.
• Mason, David. (2009). The Long and Winding Road- Developing Useful Performance Measures - A Real World Case Study. OD Practitioner. 41 (2).
• Macpherson, Malcolm (2001). Performance Measurement in Not-For-Profit and Public-Sector Organizations. Measuring Business Excellence. 5 (2). Pp. 13-17.
• Morrison, Ed. (2009, October 11). Open Source Economic Development: Using Data to Guide Conversations [Powerpoint]. Presented to University Economic Development Association, San Antonio. Retrieved from http://edmorrison.com/new-data-tools-for-open-source-economic-devel
• Nacker, R. (2002, October). Measuring Economic Development Return On Investment (ROI): Wisconsin Models. Wisconsin Economic Development Association, Inc. Retrieved from http://www.wisconsin.edu/summit/archive/2002/papers/nacker.pdf
• National Institute of Standards and Technology, Baldrige National Quality Program. Retrieved from: http://www.baldrige.nist.gov/eBaldrige/Step_One.htm.

International Economic Development Council
Making it Count: Metrics for High Performing EDOs 177
• Neely, A.D., Mills, J.F., Gregory, M.J. and Platts, K.W. (1995) Performance measurement system design – a literature review and research agenda.” International Journal of Operations and Production Management, 15 (4), pp. 80-116.
• New Hampshire Division of Personnel. (2009, February). How to Measure Customer Satisfaction In New Hampshire State Government. Retrieved from http://www.google.com/url?sa=t&rct=j&q=&esrc=s&source=web&cd=1&ved=0CDEQFjAA&url=http%3A%2F%2Fadmin.state.nh.us%2Fhr%2Fdocuments%2FWorkforce_Development%2FHow%2520to%2520Measure%2520Customer%2520Satisfaction%2520in%2520New%2520Hampshire%2520State%2520Government.doc&ei=gJt-UezNNYH94AOV-4CADw&usg=AFQjCNEpsTJ3WpAC6LzOKumxKJf-b_WuRQ&bvm=bv.45645796,d.dmg&cad=rja
• Pearce, D., Atkinson, G. & Mourato, S. (2006). Cost-Benefit Analysis and the Environment. Organization for Economic Co-operation. Retrieved from http://www.lne.be/themas/beleid/milieueconomie/downloadbare-bestanden/ME11_cost-benefit%20analysis%20and%20the%20environment%20oeso.pdf
• The Prince’s Regeneration Trust. (2013). Case Study: Oxford Castle, Oxford. Retrieved from http://www.princes-regeneration.org/sustainableheritage/content/case-study-oxford-castle-oxford-0
• The Prince’s Regeneration Trust. (n.d.) Social Return on Investment Analysis for the Redevelopment of Oxford Castle. Retrieved from http://www.princes-regeneration.org/sustainableheritage/sites/all/themes/prtrust/files/prt-oxford-castle-sroi.pdf
• Program Sustainability Assessment Tool (2012). Center for Tobacco Policy Research. Washington University. Retrieved from https://researchtoreality.cancer.gov/sites/default/files/SustainabilityTool_w_ScoringSheet%5B1%5D.pdf
• Regional Innovation Acceleration Network. Metrics that Matter. Retrieved from Regional Innovation Acceleration Network website: http://regionalinnovation.org/content.cfm?article=metrics-that-matter.
• Ridley, C.E., & Simon, H.A. (1938). Measuring Municipal Activities. Chicago: International City Managers' Association.
• Salazar, Jose, Husted, Bryan W., Biehl, Markus. 2012. Thoughts on the Evaluation of Corporate Social Performance Through Projects. Journal of Business Ethics 105, 175-186, p. 176.
• Sawhill, John and Williamson, David. (2001). Measuring what matters in nonprofits. McKinsey Quarterly (2) pp 98-107.
• SROI Methodology: An Introduction. (2008, September). social e-valuator. Version 002. Retrieved from http://evpa.eu.com/wp-content/uploads/2010/09/SOCIAL-EVALUATOR-SROI-an-introduction.pdf
• Warren, John. (May 2005). The Role of Performance Measurement in Economic Development. Retrieved from Angelou Economics website: http://www.angeloueconomics.com/measuring_ed.html
ADDITIONAL RESOURCES:
• International City/County Management Association’s Center for Performance Measurement. http://icma.org/en/results/center_for_performance_measurement/home