Making Highly Enriched Uraniumaglaser/lecture2007_makingheu.pdf · pre-enriched feed-stock Serial...
30
Alexander Glaser WWS556d Princeton University February 26, 2007 Making Highly Enriched Uranium Revision 4 1
Transcript of Making Highly Enriched Uraniumaglaser/lecture2007_makingheu.pdf · pre-enriched feed-stock Serial...

Alexander GlaserWWS556dPrinceton UniversityFebruary 26, 2007
MakingHighly Enriched Uranium
Revision 4
1
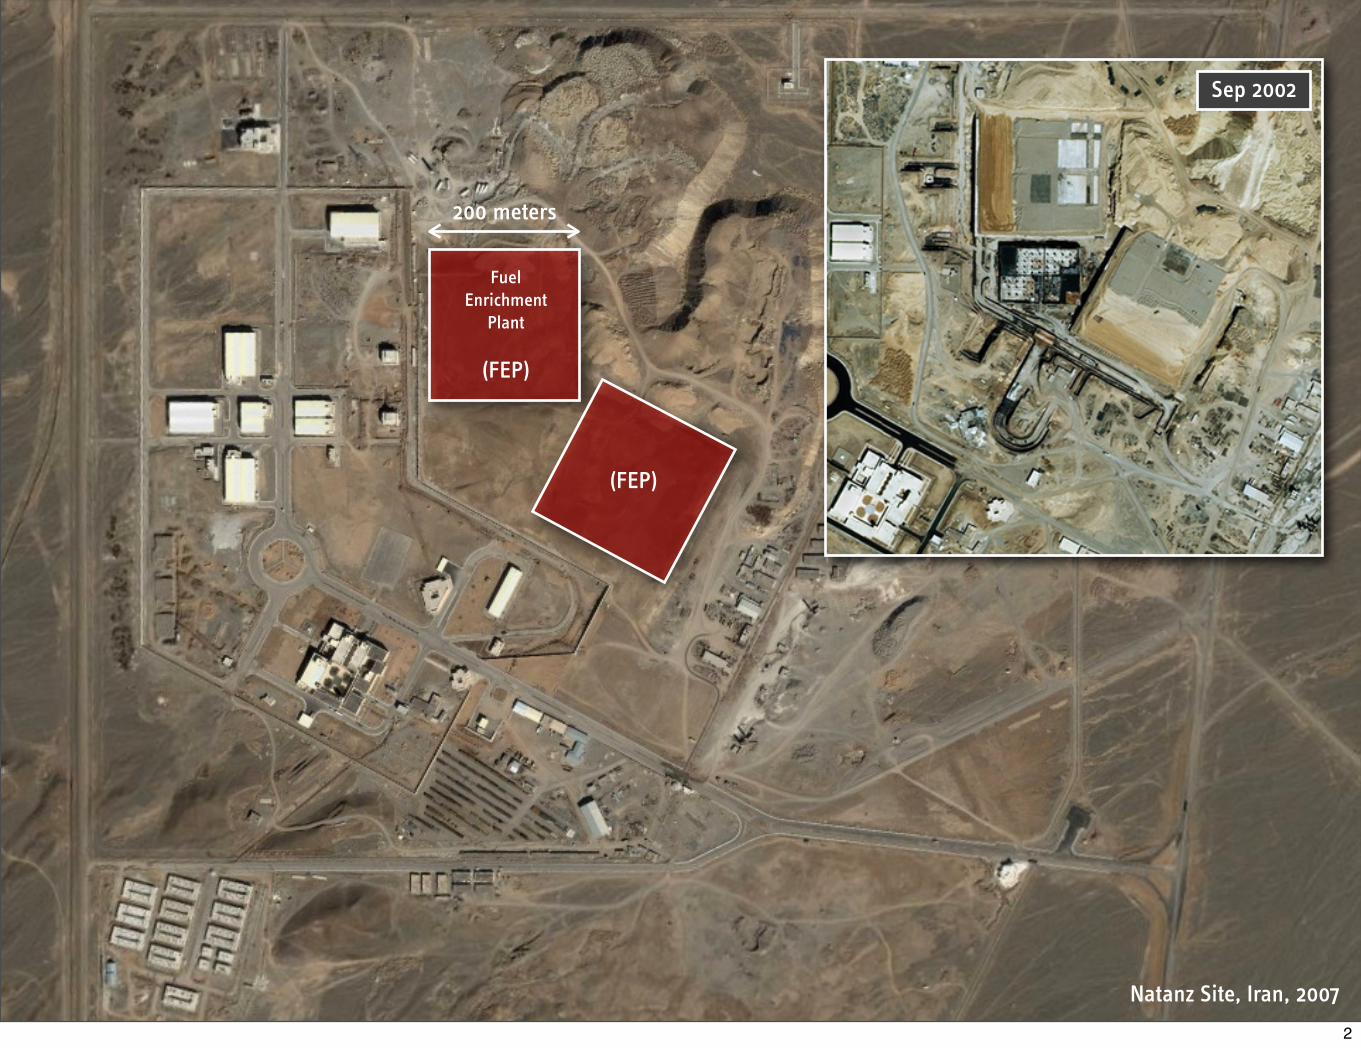
Natanz Site, Iran, 2007
Sep 2002
200 meters
(FEP)
FuelEnrichment
Plant
(FEP)
2

What is HEU?
3

Highly Enriched Uranium(visually)
Natural uranium0.7% U-235
Low-enriched uraniumtypically 3-5%,
but less than 20% U-235
U-235
U-238Uranium
Highly enriched uranium Weapon-grade uranium20% U-235 and above more than 90% U-235
HEU(weapon-usable)
4

LEU HEU
Critical Mass of Uranium
Enrichment [wt%]
Criti
cal M
ass [
kg]
0 20 40 60 80 1000
50
100
150
200
250
300
144 kg
12 kg
(for a beryllium-reflected metallic sphere)
5

Characteristics ofHighly Enriched Uranium
Easy to handleEasy to use in nuclear weapon or nuclear explosive device
Difficult/Impossible to detect
Difficult to produce
Conventionalchemical
propellant
Sub-critical pieces of uranium-235 combined
Plutonium core compressed
High-explosive lenses
6
Why Make HEU Anyway?(if there is so much of it around)
7

Global HEU Inventory 2007
China 22 MT____ ____ ± 25%
France 33 MT____ ____± 20%
India 0.2 MT____ ____ ± 50%
Pakistan 1.4 MT____ ____ ± 15%
Russia 770 MT____ ____ ± 300 MT
United Kingdom 24 MT____ ____ declared
United States 467 MT____ ____ declared
Non-nuclear states 10 MT____
TOTAL (rounded) 1325 MT____ ____ ± 310 MT
Country National Stockpile (estimate)
(civilian and military combined)
Estimates from IPFM Global Fissile Material Report 2006, updated partially based on D. Albright (ISIS)
(total world-inventory of HEU is enough for 50,000-100,000 nuclear weapons)
8

Global Distribution of Civilian HEU
1,000 -100 -
10 -1 -
10,000 kg1,000 kg
100 kg10 kg
More than 10,000 kg
Less than 1 kg (cleared)
Estimated total civilian inventory: about 50 metric tons
9
Production of Enriched Uranium(Uranium Enrichment)
10

Global Enrichment Picture 2007
Brazil Resende Commercial Under construction GC 120____
ChinaLanhou 2 Commercial Under construction GC 500____
Shaanxi Commercial In operation GC 500____
FranceGeorge Besse Commercial In operation GD 10800____
George Besse II Commercial Planned GC 7500____
Germany Urenco Deutschland Commercial In operation GC 1800 (+2700)____
India Rattehalli Military In operation GC 4-10____
Iran Natanz Commercial Under construction GC 100-250____
Japan Rokkasho Commercial In operation GC 1050____
Netherlands Urenco Nederland Commercial In operation GC 2500 (+1000)____
Pakistan Kahuta Military In operation GC 15-20____
Russia
Angarsk Commercial In operation GC 2350____
Novouralsk Commercial In operation GC 12160____
Zelenogorsk Commercial In operation GC 7210____
Seversk Commercial In operation GC 3550____
U.K. Capenhurst Commercial In operation GC 4000____
USA
Paducah Commercial In operation GD 11300____
Piketon (USEC/DOE) Commercial Planned GC 3500____
Eunice (LES) Commercial Planned GC 3000____
Country Name/Location Type Status Process Capacity [tSWU/yr]
11

Comparison of Enrichment Capacities
Feed Product Time
150,000 kg U(nat) at 0.71% 20,000 kg LEU at 4%(Tails at 0.20%)
1 year
Material and separative work required to fuel a 1000 MWe light-water reactor
Feed Product Time
150,000 kg U(nat) at 0.71% 654 kg(25-50 bombs)
HEU at 93%(Tails at 0.30%)
1 year
Material and separative work required to produce enough HEU for several bombs per year
150,000 kg U(nat) at 0.71% 100 kg (4-8 bombs)
HEU at 93%(Tails at 0.65%)
40 days
Values for a reference facility with a capacity of 130 tSWU/yr
020,000 kg LEU at 4% 100 kg (4-8 bombs)
HEU at 93%(Tails at 3.55%)
08 days
Additional time is needed before HEU can be produced in a facility that previously produced LEU becausethe “old” uranium gas has to be “flushed out” from the equipment and the facility may have to be reconfigured
12

The Case of the Gas Centrifuge
13

Centrifuges for Uranium Enrichment
Depleted uranium
Enriched uranium
rotor
bottom bearing
bottom scoop
baffle
top scoop
electromagnetic motor
casing
tails
feed
product
center post
Source: IPFM 2006 Report
Source: Presentation by Mohammad Saeidi (AEOI)
14

SeparatingUnit
SeparatingUnit
SeparatingUnit
SeparatingUnit
SeparatingUnit
SeparatingUnit
SeparatingUnit
SeparatingUnit
SeparatingUnit
SeparatingUnit
SeparatingUnit
SeparatingUnit
Feed
Tails
Product
Stage 1 Stage 2 Stage 3 Stage 4
15
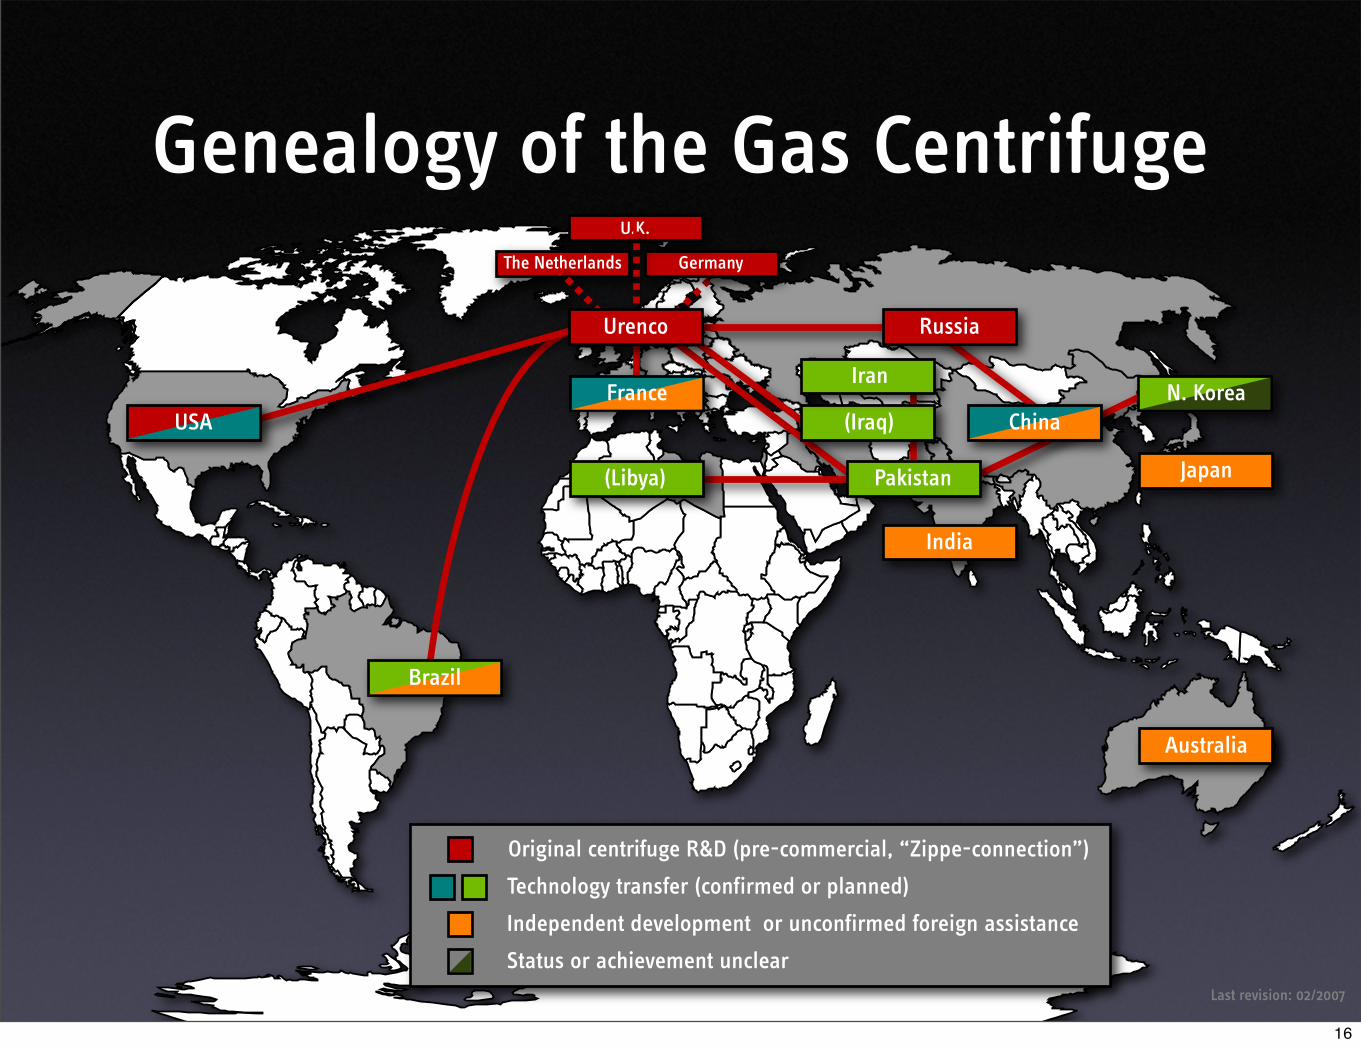
Genealogy of the Gas Centrifuge
Original centrifuge R&D (pre-commercial, “Zippe-connection”)
Technology transfer (confirmed or planned)
Independent development or unconfirmed foreign assistance
Status or achievement unclearLast revision: 02/2007
(Libya)
N. Korea
Pakistan
(Iraq)
Iran
Japan
India
Australia
ChinaFrance
Brazil
USA
Russia
Germany
U.K.
The Netherlands
Urenco
16

Why Are Centrifuges Different?
17

Crude Breakout Scenario(using an early-generation machine)
Stage number
Num
ber o
f mac
hine
s in
sta
ge
1 2 3 4 5 6 7 8 9 10 11 12 13 14 15 16 17 18 19 20 2160
40
20
0
20
40
60
21 40 56 71 84 96 106 91 79 67 57 48 40 34 27 22 17 13 9 6 3
Total number of machines in cascade: 987
Assumed characteristics of P-2-type machine
peripheral velocity =rotor diameter =
rotor height =separative power =
48515
1005
m/scmcmSWU/yr
Source: Urenco
of UF6 w/ natural uraniumof UF6 w/ 4.4%-enriched uranium
Feed =Product =
32.4 kg/d3.3 kg/d
Performance of reference LEU-cascade
18
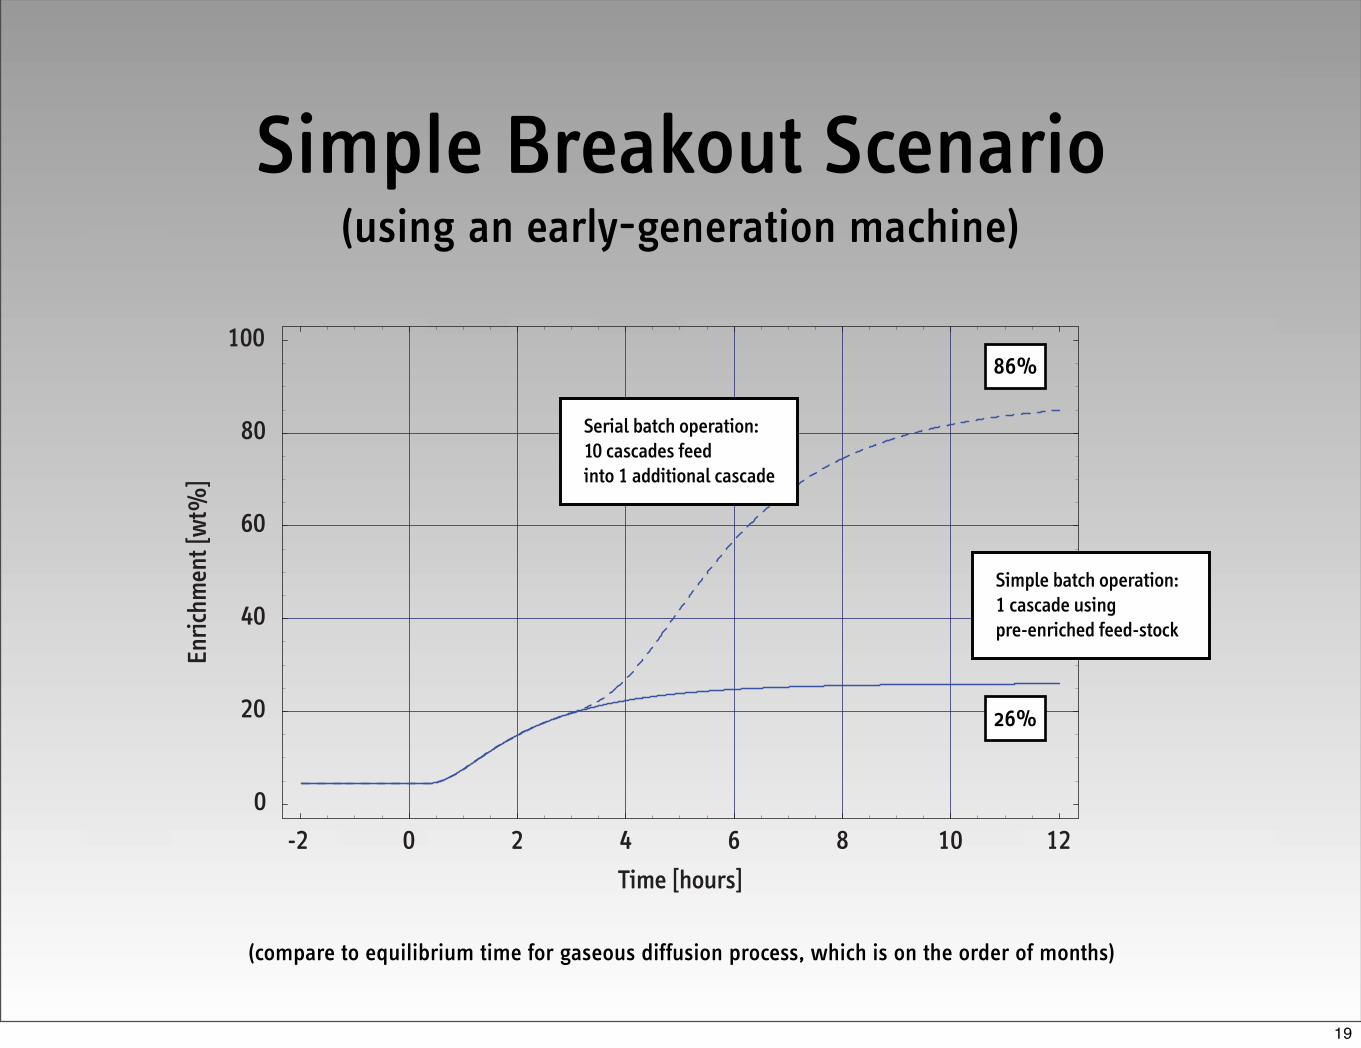
Simple Breakout Scenario(using an early-generation machine)
(compare to equilibrium time for gaseous diffusion process, which is on the order of months)
Time [hours]
Enric
hmen
t [w
t%]
-2 0 2 4 6 8 10 120
20
40
60
80
100
Simple batch operation:1 cascade usingpre-enriched feed-stock
Serial batch operation:10 cascades feedinto 1 additional cascade
26%
86%
19

Detection of Undeclared Facilities
20
240 meters
200
met
ers
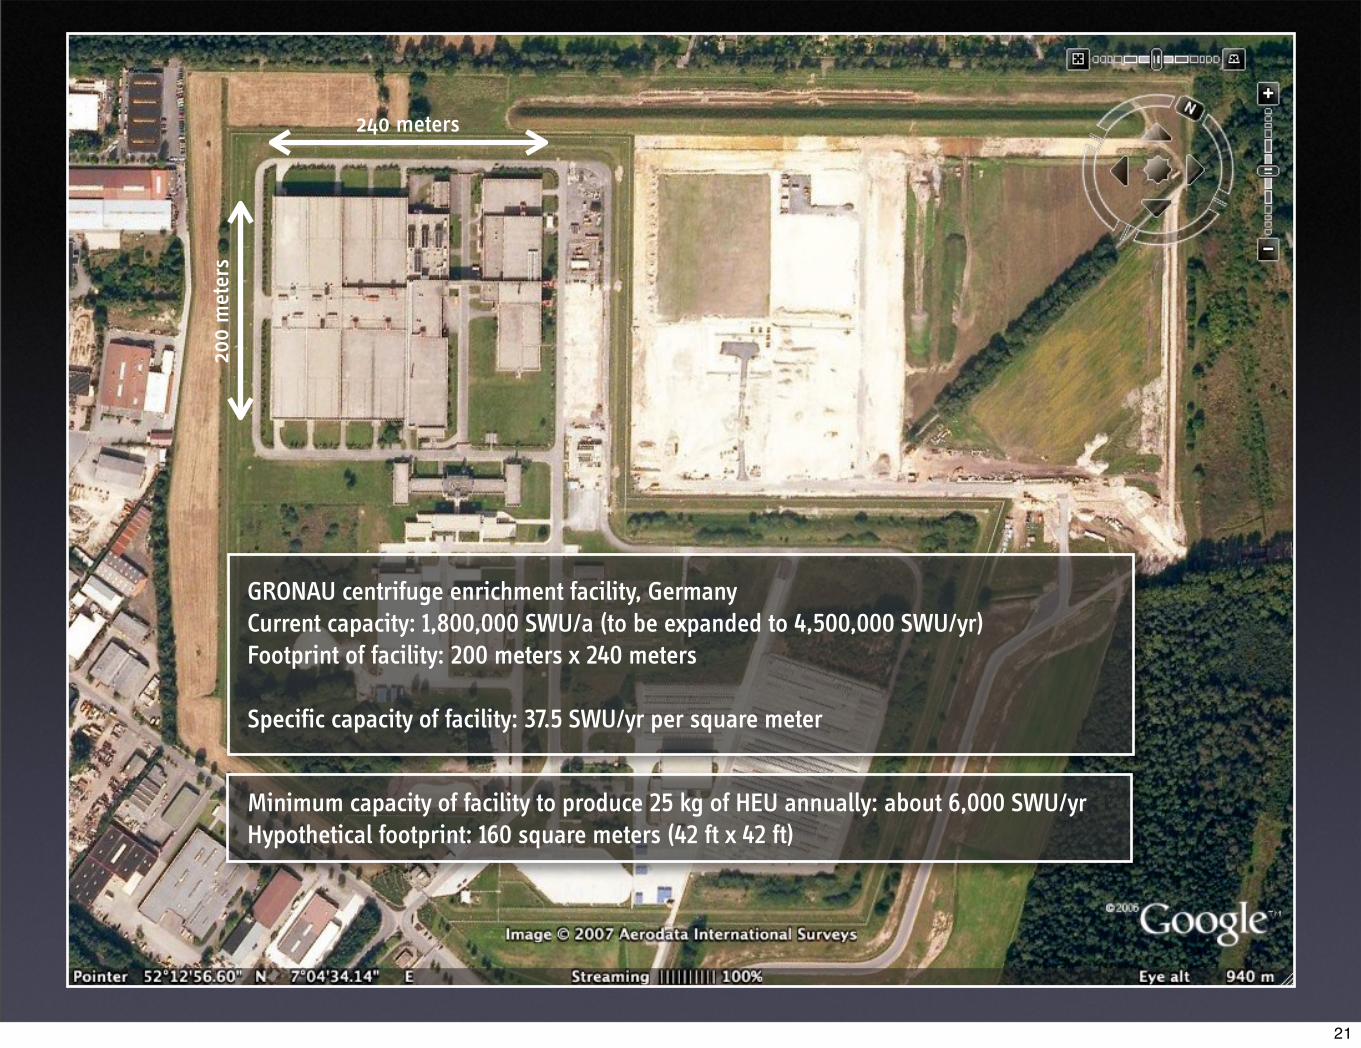
GRONAU centrifuge enrichment facility, GermanyCurrent capacity: 1,800,000 SWU/a (to be expanded to 4,500,000 SWU/yr)Footprint of facility: 200 meters x 240 meters
Specific capacity of facility: 37.5 SWU/yr per square meter
Minimum capacity of facility to produce 25 kg of HEU annually: about 6,000 SWU/yrHypothetical footprint: 160 square meters (42 ft x 42 ft)
21

Detectability of Undeclared Facilities
Reactor
Reprocessing
Yes Yes No
No No (Yes)
Detectability (Selected Criteria)
IdentifiableStructure
ThermalSignature Effluents
Calutron/EMIS
Gaseous diffusion
No Yes Yes
Yes Yes Yes
PlutoniumProduction
Centrifuge No No No
UraniumEnrichment
22

What Are Our Options?
23

• Increase the effectiveness of (and the confidence in) safeguards
• Increase the ability to detect undeclared facilities
• Contain technology to existing or selected producers
• Focus on the demand side (i.e. “devalue” nuclear weapons)
Possible Strategies to Limit the Front-End Proliferation Risks of the Nuclear Fuel Cycle
Preclude covert misuse
Motivation
Deter clandestine activities
TARGET/OBJECTIVESTRATEGY
Know-how held by “trusted users”
24

Global Nuclear Expansion Scenario(1500 GWe in 58 countries, based on 2003 MIT study)
More than 10 GWe installed
At least 1 GWe installed
25

Enrichment Demand and Distribution(for 1500 GWe Global Nuclear Expansion Scenario)
Global enrichment capacity: 1,500 x 150 tSWU/yr (225,000 tSWU/yr)
12,750
4,800
2,250
5,100
27,750
24,450
5,400
2,8503,150
2,850
36,600
20,850
37,200
11,050
10,300
17,650
tSWU/yr Total SWU-production in country
Combined SWU-demand of countries importing alltheir enrichment services: 11,850 tSWU/yr
26

Containment Strategies
Black Box approaches with or without “Poison Pills” and combined with multinational operation of facilities
Have and have-not approachesBush Proposal (2004) or other “criteria-based” proposals
Export ControlsDeter, delay, detect procurement efforts
But to what extent are they durable?Underlying assumption that indigenous R&D efforts are irrelevant/insufficient
27

Timeline of Centrifuge Programs
(arrows indicate uncertain dates of respective events or milestones)
1960 1970 1980 1990 2000 2010
Japan
India
U.K.
Netherlands
Iran
Germany R&D as part of URENCO/ETC
Pakistan
Australia
Brazil
R&D as part of URENCO/ETC
R&D as part of URENCO/ETC
R&D
Machineat least 2-5 SWU/yr
Test cascadeat least 100 machines
Pilot plantand further developments
DRAFT version, August 2006 - by Alexander Glaser, Princeton University
28

• Increase the effectiveness of (and the confidence in) safeguards
• Increase the ability to detect undeclared facilities
• Contain technology to existing or selected producers
• Focus on the demand side (i.e. “devalue” nuclear weapons)
Possible Strategies to Limit the Front-End Proliferation Risks of the Nuclear Fuel Cycle
Preclude covert misuse
Motivation
Deter clandestine activities
TARGET/OBJECTIVESTRATEGY
Know-how held by “trusted users”
29

30