Making a Molehill Out of a Mountain Jeff Janette, Assistant Principal Universal Trainer Secondary...
12
Making a Molehill Out of a Mountain Jeff Janette, Assistant Principal Universal Trainer Secondary Trainer
-
Upload
jack-houston -
Category
Documents
-
view
214 -
download
0
Transcript of Making a Molehill Out of a Mountain Jeff Janette, Assistant Principal Universal Trainer Secondary...

Making a Molehill Out of a Mountain
Jeff Janette, Assistant PrincipalUniversal Trainer
Secondary Trainer

PBS @ Abbeville High
InitiativesClassroom Management Plan
Teacher of the MonthCultural Awareness
Operation Bright FutureSecondary Intervention
RewardsPaw Points
R.O.A.R PartiesWildcat Cards
Free Duty Passes

Understanding Data
• Data is defined as individual facts, statistics, or items of information. (Dictionary.com)
• Data provides realistic information regarding every aspect of PBS
• Data can be manipulated by anyone.

Common Views on Data
• “I don’t understand data.”
• “There is too much data to analyze.”
• “I’m not a math person.”• “What do I do with it?”• “We don’t have the
resources to get the data we need.”

Clearing Up the Confusion
• Anyone can understand data when:– it makes sense.– it is presented correctly.– connections are made to
past and future events.• Use a group or
committee to:– collect the data– disaggregate the data– analyze the data
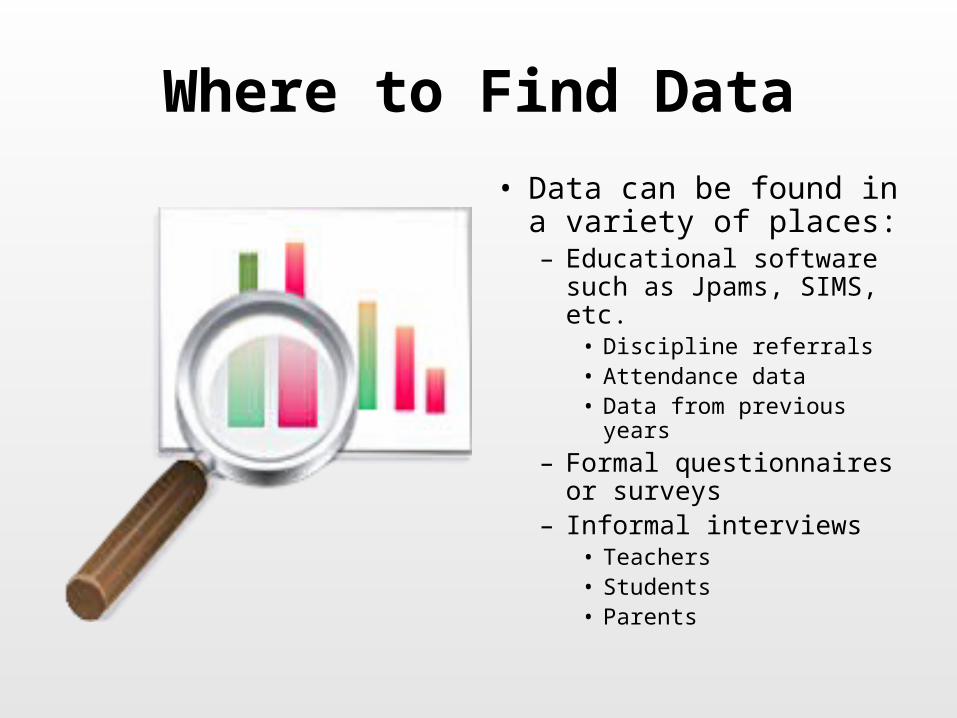
Where to Find Data
• Data can be found in a variety of places:– Educational software such
as Jpams, SIMS, etc.• Discipline referrals• Attendance data• Data from previous years
– Formal questionnaires or surveys
– Informal interviews• Teachers• Students• Parents

What Data Do You Need?
• Needs are determined by your goals.– Reduce referrals– Reduce repeat offenders– Determine problem
areas– Improve school culture– Improve teacher morale– Evaluate your initiatives

ISS Data
2008-2009 9th Grade 10th Grade 11th Grade 12th Grade Total
# of ISS 159 80 58 56 353
# of Students 75 46 38 33 191
2009-2010 9th Grade 10th Grade 11th Grade 12th Grade Total
# of ISS 238 52 66 39 395
# of Students 92 31 36 25 183
9th grade incidents of ISS increased 33% from 2008-2009 to 2009-2010.10th grade incidents of ISS decreased 35% from 2008-2009 to 2009-2010.11th grade incidents of ISS increased 12% from 2008-2009 to 2009-2010.12th grade incidents of ISS decreased 30% from 2008-2009 to 2009-2010.Total incidents of ISS increased 10% from 2008-2009 to 2009-2010.

ISS TrackingClass of 2010Incidents of ISS decreased 32% from 2008-2009 to 2009-2010.Percentage of 9th grade students in ISS decreased 9% from 2008-2009
to 2009-2010. Class of 2011Incidents of ISS decreased 18% from 2008-2009 to 2009-2010.Percentage of 10th grade students in ISS increased 6% from 2008-2009
to 2009-2010. Class of 2012Incidents of ISS decreased 63% from 2008-2009 to 2009-2010.Percentage of 9th grade students in ISS decreased 11% from 2008-2009
to 2009-2010.

Incident Data
Code Incident Description # Ref # Stud Ratio01 Willful disobedience 136 88 1.54 : 1
19 Is habitually tardy 94 45 2.08 : 1
81 Cell phone violation 81 71 1.14 : 1
76 Treats authority with disrespect 76 53 1.43 : 1
50 Failure to attend detention 50 39 1.28 : 1
• # of referrals allows you to identify your top issues• # of students allows you to see how many students are responsible for the total number of referrals which gives the ratio. (Ultimate goal is 1 : 1, which means no repeat offenders.)• Data is used to target interventions, both proactive and reactive to address the major issues.

Survey DataArea of Concern Possible Solution
• All concerns MUST be accompanied by a possible solution!• The solution may not be the right one but it does two (2) things:
1) Ensures that people think about the issue and what can be done.
2) Provides a starting point for discussion in the future.