Make Versus Buy in Trucking: Asset Ownership, Job Design ... · Make Versus Buy in Trucking: Asset...
45
Make Versus Buy in Trucking: Asset Ownership, Job Design and Information George P. Baker* Thomas N. Hubbard** August 2002 Explaining patterns of asset ownership in the economy is a central goal of both organizational economics and industrial organization. We develop a model of asset ownership in trucking, which we test by examining how the adoption of different classes of on-board computers (OBCs) between 1987 and 1997 influenced whether shippers use their own trucks for hauls or contract with for-hire carriers. We find that OBCs' incentive-improving features pushed hauls toward private carriage, but their resource-allocation- improving features pushed them toward for-hire carriage. We conclude that ownership patterns in trucking reflect the importance of both incomplete contracts (Grossman and Hart (1986)) and of job design and measurement issues (Holmstrom and Milgrom (1994)). *Harvard Business School and NBER **University of Chicago Graduate School of Business and NBER We would like to thank all those we talked to at trucking firms and private fleets for allowing us to visit their firms and discuss the issues we investigate in this paper. Thanks to Ann Merchant for research assistance and Oliver Hart, Bengt Holmstrom, Paul Milgrom, Canice Prendergast, Preston McAfee, MinSoo Park, an anonymous referee, and many seminar participants for comments. We gratefully acknowledge support from NSF grant SES-9975413, the NBER/Sloan Pin Factory Project, and the Harvard Business School Division of Research.
Transcript of Make Versus Buy in Trucking: Asset Ownership, Job Design ... · Make Versus Buy in Trucking: Asset...
Make Versus Buy in Trucking: Asset Ownership, Job Design and Information
George P. Baker*
Thomas N. Hubbard**
August 2002
Explaining patterns of asset ownership in the economy is a central goal of both organizational economics and industrial organization. We develop a model of asset ownership in trucking, which we test by examining how the adoption of different classes of on-board computers (OBCs) between 1987 and 1997 influenced whether shippers use their own trucks for hauls or contract with for-hire carriers. We find that OBCs' incentive-improving features pushed hauls toward private carriage, but their resource-allocation-improving features pushed them toward for-hire carriage. We conclude that ownership patterns in trucking reflect the importance of both incomplete contracts (Grossman and Hart (1986)) and of job design and measurement issues (Holmstrom and Milgrom (1994)).
*Harvard Business School and NBER **University of Chicago Graduate School of Business and NBER We would like to thank all those we talked to at trucking firms and private fleets for allowing us to visit their firms and discuss the issues we investigate in this paper. Thanks to Ann Merchant for research assistance and Oliver Hart, Bengt Holmstrom, Paul Milgrom, Canice Prendergast, Preston McAfee, MinSoo Park, an anonymous referee, and many seminar participants for comments. We gratefully acknowledge support from NSF grant SES-9975413, the NBER/Sloan Pin Factory Project, and the Harvard Business School Division of Research.

1
1. Introduction
Understanding the patterns of asset ownership in the economy is a central goal of both
organizational economics and industrial organization because it provides insights on firm
boundaries and industry structure. Major progress towards this goal was provided by Grossman
and Hart’s seminal paper in 1986, which argues that asset ownership confers on owners residual
rights of control that give them power and thus incentives to devote effort to value-increasing
activities. In this view, firms' boundaries are determined by the optimal allocation of these
residual rights of control. Holmstrom and Milgrom (1994), however, argue that firms'
boundaries reflect trade-offs in which asset ownership interacts with job design and other
organizational decisions. If so, firms' boundaries may reflect factors that do not appear in
Grossman and Hart's (1986) theory, including those that affect the optimal allocation of tasks
across individuals. In 1999, Holmstrom offered a critique of the property rights view in which
he argues that it fails to explain why firms rather than individuals own assets. He extends the
insight from the 1994 paper to argue that firms own assets precisely because this mutes the
incentives that come with individual asset ownership, allowing the firm to operate as a
“subeconomy” that can more precisely balance incentives and implement more complex
multitask job designs.
In this paper, we argue that the pattern of asset ownership in trucking—in particular the
decision by shippers about whether to use their internal fleet of trucks for a haul or contract with
for-hire carriers—reflects not only the factors identified in Grossman and Hart's theory, but also
those highlighted in Holmstrom and Milgrom (1994). Consistent with the former, ownership
patterns reflect trade-offs that arise from providing intermediaries strong incentives to identify
profitable uses for trucks. Consistent with the latter, ownership patterns also reflect issues of job
design: i.e., the degree to which drivers simply drive trucks, or provide a more complex
combination of transportation and service. Job design matters because "service-intensive"
trucking hinders intermediaries' ability to find profitable uses for the truck. Shipper ownership
of trucks mutes incentives and favors service-intensive trucking in which drivers' jobs involve
more than just driving trucks.
2
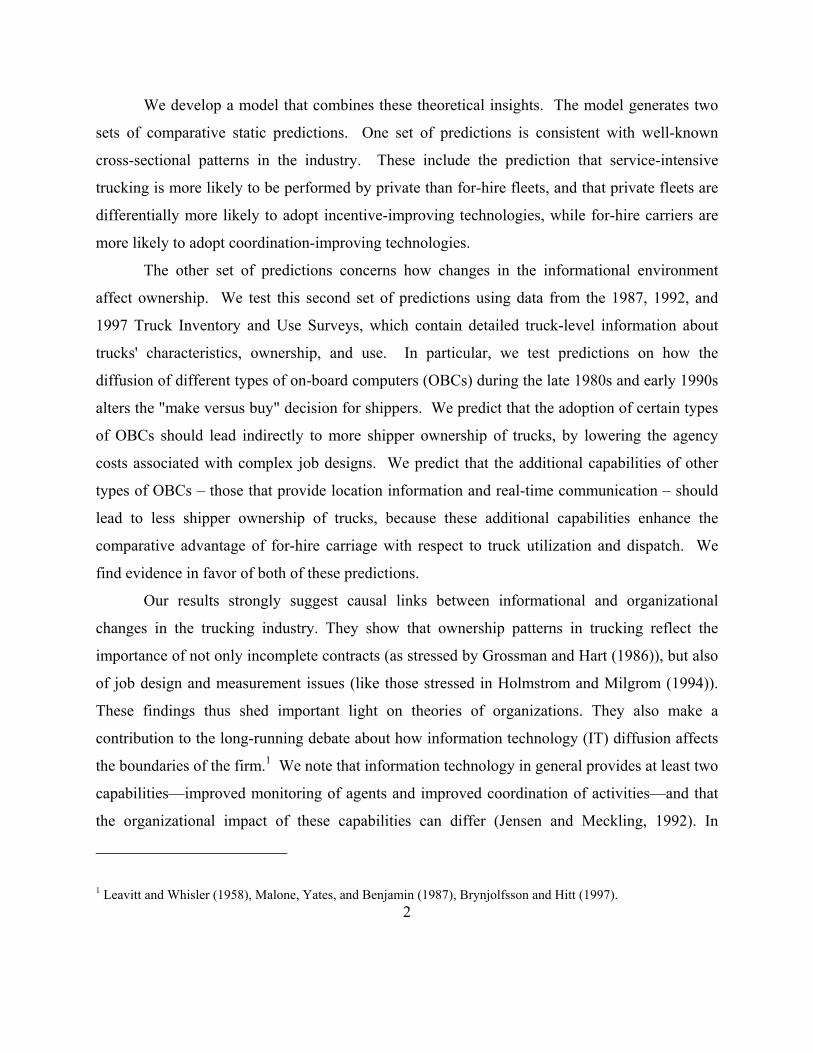
We develop a model that combines these theoretical insights. The model generates two
sets of comparative static predictions. One set of predictions is consistent with well-known
cross-sectional patterns in the industry. These include the prediction that service-intensive
trucking is more likely to be performed by private than for-hire fleets, and that private fleets are
differentially more likely to adopt incentive-improving technologies, while for-hire carriers are
more likely to adopt coordination-improving technologies.
The other set of predictions concerns how changes in the informational environment
affect ownership. We test this second set of predictions using data from the 1987, 1992, and
1997 Truck Inventory and Use Surveys, which contain detailed truck-level information about
trucks' characteristics, ownership, and use. In particular, we test predictions on how the
diffusion of different types of on-board computers (OBCs) during the late 1980s and early 1990s
alters the "make versus buy" decision for shippers. We predict that the adoption of certain types
of OBCs should lead indirectly to more shipper ownership of trucks, by lowering the agency
costs associated with complex job designs. We predict that the additional capabilities of other
types of OBCs – those that provide location information and real-time communication – should
lead to less shipper ownership of trucks, because these additional capabilities enhance the
comparative advantage of for-hire carriage with respect to truck utilization and dispatch. We
find evidence in favor of both of these predictions.
Our results strongly suggest causal links between informational and organizational
changes in the trucking industry. They show that ownership patterns in trucking reflect the
importance of not only incomplete contracts (as stressed by Grossman and Hart (1986)), but also
of job design and measurement issues (like those stressed in Holmstrom and Milgrom (1994)).
These findings thus shed important light on theories of organizations. They also make a
contribution to the long-running debate about how information technology (IT) diffusion affects
the boundaries of the firm.1 We note that information technology in general provides at least two
capabilities—improved monitoring of agents and improved coordination of activities—and that
the organizational impact of these capabilities can differ (Jensen and Meckling, 1992). In
1 Leavitt and Whisler (1958), Malone, Yates, and Benjamin (1987), Brynjolfsson and Hitt (1997).

3
trucking, improvements in monitoring (and the attendant improvement in incentives) lead to
larger, more integrated firms, while improvements in coordination (resulting in better asset
utilization) lead to more diffuse asset ownership and smaller, less integrated firms. Whether
these results generalize to other settings remains an open question.
In this paper we do not consider a third possibility regarding truck ownership: drivers
may own trucks. We investigate driver ownership of trucks in detail in another paper (Baker and
Hubbard (2000)). In that paper, we propose that asset ownership strengthens drivers’ incentives
to drive in ways that preserve trucks' value, but also encourages them to engage in rent-seeking
behavior. We then argue that OBC adoption alters this trade-off by allowing companies (either
for-hire carriers or private fleets) to use the monitoring capabilities of OBCs to substitute for
asset ownership. We show that OBCs lead to less driver ownership of trucks, especially for hauls
where rent-seeking is a potential problem. We ignore these issues in the present paper because
we believe they are not salient to the make-or-buy decision. Situations that are on the margin
between for-hire carriage and private carriage are not those where owner-operators are used. In
general, owner-operators are used for hauls that require little if any service provision by the
driver, and for good reason. The multitasking problems with service provision that lead for-hire
carriage to be inefficient relative to private carriage are exacerbated when drivers control trucks.
This is borne out by the fact that when shippers outsource hauls with non-negligible service
requirements, they rarely, if ever, do so by contracting with owner-operators.2
The paper is organized as follows. In the next section, we describe the institutional setting
that we model, defining the players, describing their roles in the provision of trucking services,
and characterizing the contracting environment in which they operate. In Section 3, we present
our model of job design and asset ownership. Section 4 describes OBCs and generates our main
empirical propositions. In Section 5, we describe our data and present the main empirical
2 In our empirical tests, "for-hire carriage" includes driver- and carrier-owned trucks, ownership structures where shippers do not own trucks. Our results are unchanged when we leave out owner-operators altogether.

4
patterns. Section 6 contains our main empirical results regarding the relationships between OBC
adoption and organizational change. Section 7 concludes.
2. Job Design, Search Incentives, and Asset Ownership in Trucking
This section describes the institutional framework, drawing heavily from what we learned
in a series of site visits and interviews. We describe the basic trade-offs involved in job design
and asset ownership decisions and explain why these decisions might be related. Throughout the
section, we will refer to several different parties. Drivers are individuals who drive trucks and
may have other customer service oriented tasks. Shippers are firms or divisions with demands to
move cargo from one place to another. Carriers are firms or divisions that supply transportation
services. Carriers that supply services using trucks owned by shippers are private carriers (i.e.,
shippers' internal fleets). Carriers that supply services using trucks they own themselves are for-
hire carriers. Brokers are third party informational intermediaries.
Driver Job Design: Driving and Service Provision
Drivers can engage in two sorts of activities: driving the truck and performing non-
driving service activities.3 Defining drivers' jobs to include non-driving activities lets carriers
offer high service options in which their customers can ask drivers to do things such as help
unload the truck and sort and store the cargo. This gives customers flexibility in how many of
their own workers they allocate to such tasks, and can improve the division of labor in the short
run because deliveries might take place when the opportunity cost of customers' workers' time is
high.
The benefit of giving drivers service responsibilities varies systematically across hauls
with the characteristics of the cargo. There are rarely such benefits when they haul bulk goods
such as gravel, ores, or grain, in large part because no handling is required upon delivery: when
trucks reach their destination, drivers dump the cargo where the recipient wants it. Giving
drivers service responsibilities is also generally unproductive when trucks haul goods for which
handling requires special equipment. For example, special machines – which drivers generally
3 See Ouellet (1994) for a detailed description of incentives and the organization of work in trucking.
5
are either unable or not trusted to use -- are usually necessary to move very heavy goods (large
rolls of paper, sheet metal). As a consequence, drivers generally just drive trucks when they haul
bulk or unwieldy goods.
In contrast, giving drivers service responsibilities can be valuable when trucks haul other
classes of goods, such as packaged goods or hazardous cargo. Packaged goods can be carried by
hand or transported with standard equipment such as hand trucks, conveyor belts, or forklifts.
Handling hazardous cargo such as petroleum or chemicals requires certification, which drivers
generally must have to haul such cargo legally. Giving drivers service responsibilities
diminishes the extent recipients must have certified personnel. As a consequence, drivers often
have service responsibilities when trucks haul packaged goods or hazardous cargo.
A drawback to giving drivers additional responsibilities is that agency costs are higher.4
Carriers always face the problem of motivating drivers to pick up and deliver goods on time and
drive in ways that preserve trucks' value. When drivers' jobs involve service, they also face the
problem of motivating drivers to allocate their time efficiently between driving and service.
Motivating drivers to pick up and deliver goods on time is straightforward because it is
relatively easy to evaluate drivers' performance in this dimension. The distances traveled and the
return time at the end of the run are known. Carriers also normally have good information
regarding whether drivers arrive late to intermediate stops – angry customers call them when
they do – and have some information about the impact of factors outside of drivers' control, such
as traffic and weather conditions. Thus, when drivers' jobs involve only driving from location to
location, the main agency problem that remains is inducing them to drive well because this is
what remains non-contractible.
Incentive problems are more complicated when drivers' jobs include service activities.
As is generally the case in multitasking problems, incentives must attend both to overall effort
levels and the allocation of effort across tasks. In this case, the incentive problem created by
multitasking is that carriers now must induce drivers to allocate effort between driving and
4 Following Jensen and Meckling (1976), agency costs here include both monitoring costs and the "residual loss" attributable to non-optimal decisions.

6
service appropriately. Simple distance and arrival time data provide little indication of the
fraction of time drivers spend driving versus doing other things. Some common service
activities such as cargo-handling are strenuous.5 Drivers with service responsibilities have an
incentive to misallocate their effort: for example by taking more time handling cargo, then
making it up by driving faster between stops. Carriers may respond to this, in the spirit of
Holmstrom and Milgrom (1991, 1994) and Baker (1992), by weakening drivers' incentives with
respect to other tasks. For example, they balance incentives by de-emphasizing on-time arrivals
or allowing more slack in schedules. In general, agency costs are higher when drivers have more
responsibilities because of some combination of lower overall effort levels and a worse
allocation of effort across tasks.
Market Clearing: Load Matching and Search
The demand for trucking services and the supply of truck capacity are highly
differentiated. Shippers' demands are specific with respect to time, location, and equipment
requirements. Likewise, truck capacity is idiosyncratic with respect to its geographic location
and the characteristics of the trailer. Capacity utilization in the industry depends crucially on
how efficiently supply and demand – trucks and hauls – are matched. Trucks and hauls are
matched in a highly decentralized manner in which shippers, carriers, and third-party brokers
search for good matches.
The matching problem is particularly difficult in trucking because individual shippers
rarely have demands that fill trucks for both legs of a round-trip. For this reason, once carriers
receive service orders from shippers, they then search for complementary hauls. When
individual shipments are too small to fill a truck, search takes the form of identifying other
shippers with similar demands. When demands are unidirectional, search is directed at
identifying shippers with demands that would fill the truck for the return trip (the "backhaul").
Dispatchers and brokers play a crucial role in identifying complementary hauls and
arranging matches. Dispatchers work for carriers, and seek to match hauls to trucks within their
5 Drivers whose jobs involve taking a fully-loaded trailer and delivering the goods to various destinations handle up to 40,000 pounds of cargo per day. Handling requires hand-lifting when trucks deliver to places without loading

7
carrier's fleet. Brokers seek to match hauls to trucks owned by other parties. These parties
acquire knowledge about city-pair demand in a two-stage process: they make long-run
investments in learning general demand patterns (e.g., who the demanders are), then learn
detailed "on the spot" information about short-run demands by contacting shippers' traffic
managers periodically throughout the day.
Search for complementary hauls in the short run tends to be more refined, and hence
productive, the more precisely parties can forecast when trucks will come free. This, in turn,
leads to better matches between trucks and hauls: for example, backhauls begin closer to or
sooner after "fronthauls" end and trucks arrive to be loaded closer to when shippers want them.
Thus, a second drawback to giving drivers service responsibilities on a haul is that service
interferes with search for the following haul; trucks' availability is more predictable following
low service than high service hauls.6
Asset Ownership and Incentives
Shippers' make-or-buy decision corresponds to whether they use a truck from their
internal fleet or an external fleet for a haul. Industry participants distinguish between private and
for-hire carriage by who has control rights over the truck.7 Below we discuss how and why asset
ownership affects incentives.
Ownership rights over trucks matter because contracts are incomplete with respect to
trucks' schedules. In particular, shippers and carriers do not write fully-contingent contracts with
respect to trucks’ schedules because the relevant contingencies are costly to identify ex ante and
verify ex post. To see this, consider one class of scheduling decisions: how long a truck should
wait at the loading dock to be loaded. A fully-contingent contract would stipulate how long
docks – such as most retail outlets.
6 In interviews, fleet managers and dispatchers indicated to us that forecasting how long deliveries take is much easier when drivers have fewer service responsibilities. They indicated that they could forecast how long a no-service delivery of a truckload of packaged goods would take within a half-hour window, but could only forecast how long a high-service delivery would take within a two to three hour window.
7 Trucks in private fleets are sometimes leased, are sometimes driven by short-term employees, and sometimes haul other shippers' goods (such as on backhauls). The distinction between private and for-hire carriage thus does not correspond to residual claimancy, the length of labor contracts, or exclusivity of use.

8
trucks should wait as a function of all relevant states of the world, including especially those
factors affecting the benefits of delay and individual trucks’ opportunity cost. Many of these
factors are known only to shippers and/or carriers and are difficult to verify by outsiders. It is
thus prohibitively costly to make contracts contingent on them. Schedule-setting is therefore a
residual right of control that is, by definition, held by the truck's owner.8
The contractual incompleteness surrounding truck scheduling leads to the main
consequence of the allocation of ownership rights. In private carriage, shippers own trucks: if
they want to alter trucks’ schedules in ways that do not violate existing agreements, they can do
so. They can unilaterally require that a truck picking up or delivering goods wait, for example.
In for-hire carriage, carriers own trucks. If shippers want to change trucks’ schedules, they must
negotiate this with carriers.
The possibility that schedules will have to be renegotiated leads to familiar sorts of
transactions costs in for-hire carriage. Both parties have an incentive to improve their bargaining
position, and thus engage in rent-seeking behavior.9 For shippers, this takes the form of
identifying other carriers who could serve them on short notice; for carriers, this takes the form
of identifying other local shippers with similar demands – finding substitute hauls. Exploring
back-up plans expends real resources, and is costly. In private carriage, by contrast, disputes
may arise between shippers and their private fleets' dispatchers (or shippers and brokers), but
identifying other ways to use trucks does not improve dispatchers' or brokers' bargaining position
because they cannot threaten to use trucks for other hauls. Neither private fleet dispatchers nor
brokers have incentives to identify substitute hauls for rent-seeking purposes.
While rent-seeking tends to be greater under for-hire carriage, truck utilization also tends
to be higher. One reason has to do with firms' incentives to obtain market information and
8 In practice, it is common for contracts between shippers and carriers to have clauses that penalize shippers when they delay trucks. The penalties, however, are not state-dependent, and thus are set intentionally high to deter shippers from delaying trucks in states of the world where trucks’ shadow value is high. Parties realize that renegotiation is likely to be efficient when trucks' shadow value is low, creating a situation that is analytically similar to those where schedules are non-contractible.
9 Grossman and Hart (1986), Milgrom and Roberts (1990). Baker and Hubbard (2000) argue that this incentive is also central for understanding why truck drivers tend not to own the trucks they operate.

9
search for complementary hauls. Firms can search more effectively for complementary hauls in
the short run if they have previously made investments (in the form of customer relationships
and general knowledge of demand) in particular markets. Shippers, for-hire carriers, and brokers
can all potentially make such investments. But because these investments are more valuable to
those who are frequently looking for backhauls, individual shippers will tend to only make
significant investments on city-pairs where their trucks haul high volumes of goods regularly.
On other routes they will invest less, have less information about demand, and therefore search
less productively in the short run than for-hire carriers or brokers, who exploit increasing returns
by utilizing knowledge across many shippers' hauls. Intermediaries thus have a comparative
advantage in finding complementary hauls in many circumstances. This alone need not imply
that truck utilization is necessarily lower under private carriage, since shippers could rely on
brokers to find hauls. However, brokers have weaker incentives to find particularly good
matches, because they do not own trucks and are thus less able to appropriate as large a share of
the value that they create. The combination of strong incentives to learn about demand and
strong incentives to find good matches for particular trucks leads matches to be better, and thus
truck utilization to be higher, under for-hire than private carriage.
Another reason why truck utilization tends to be higher in for-hire carriage is that drivers
are generally assigned fewer service responsibilities. Trucks spend more time on the road and,
as noted above, load matching is easier when drivers' responsibilities are narrow.
The next section develops a model of asset ownership and job design that captures the
institutional features described above and analyzes organizational relationships formally. This
model generates comparative static predictions that explain several important cross-sectional
patterns in the industry. It also generates predictions regarding how changes in the informational
environment should affect the make-or-buy decision. Later in the paper, we take these
predictions to the data.
3. A Model of Asset Ownership and Job Design
The model combines elements of Holmstrom and Milgrom (1991, 1994) and Grossman
and Hart (1986). We embed multi-task models of driver job design and dispatcher effort towards

10
finding hauls into a setting in which non-contractible truck scheduling problems make asset
ownership important. The timing follows. Initially, a shipper’s "fronthaul" and a matching truck
are assumed to exist: we do not model the process of matching fronthauls to trucks. This haul
may be one for which the value of service is high or low. We assume that parties cannot write a
complete contract with respect to this haul ex ante. Organizational form is then chosen; at this
point, asset ownership and drivers' job design are determined. Next, search for complementary
backhauls (and possibly substitute fronthauls) occurs. Depending on asset ownership and the
organizational form chosen, either a carrier or a broker chooses how much to search for hauls
that complement or substitute for the shipper's haul. Parties then bargain; this determines which
haul the truck is used for and how the surplus is split. Finally, production takes place (including
provision of service by the driver) and payoffs are realized.
Complementarities between job design and asset ownership are critical to the results, and
are a central feature of our model. To highlight this relationship and simplify the exposition, we
develop a model first of driver job design, then overlay the shipper's "make-or-buy" decision.
When shippers own trucks, this corresponds to "make"; when they do not, this corresponds to
"buy." For simplicity, we assume that under the “make” option, shippers use brokers to find
backhauls rather than find them themselves.10 We begin with a model of driver job design.
Driver Job Design: Driving and Service Provision
Let s be the scope of the driver's activities, and m be the marginal product of this scope.11
For some hauls and shippers, service activities are valuable (high m), and for some they are less
valuable. Motivating high service levels is costly, since it involves monitoring the mix of
activities that the driver is performing. Let σ be a parameter that captures the ability of the carrier
10 We present a more general model in which private carriers might use their own dispatchers to search for backhauls in an earlier version of the paper (Baker and Hubbard (2002)). None of the comparative statics presented below differ in this more general model.
11 Our equation of scope with service levels reflects an (unmodeled) assumption that some significant amount of driving is always part of the driver’s job: the driver is never doing mostly service. Thus, more service involves a greater mix of activities.
11
to monitor the driver’s efficiency in performing high-service activities: the higher is σ, the lower
is the marginal cost of monitoring. We specify V, the value of using the truck and driver for the
shipper's haul, as:
(1) ( , )V V ms M s σ= + −
where V is a fixed quantity, s is the scope of the driver’s activities, m is the marginal product of
this scope, σ is the degree to which the carrier can monitor driver activities, and M(s,σ) is agency
costs. We assume M1>0, M2<0, M12<0.
Given this set-up, the optimal amount of scope in the driver's job depends on the costs
and benefits of such scope. Assuming an interior solution, optimal job design sets scope such
that m = M1(s*,σ). Raising the marginal product of scope (raising m) or raising the firm’s ability
to monitor driver activities (raising σ) raises the optimal amount of scope. We assume that this
expression is invertible, so that we can express the result as s* = φ(m, σ).
Load Matching
Following the discussion in section 2, we assume that search for complementary hauls
adds value. Value is increasing in search levels because more effort produces better matches.
We also assume that the marginal productivity of search is reduced when drivers are assigned
more service-oriented activities.
We specify the value added of search for complementary hauls as:
(2) 1 1( )g s eθ−
where e1 is the effort toward finding complementary hauls and g1 is the marginal product of this
effort for hauls involving no service. θ captures the extent to which high service levels reduce the
marginal product of search, θ > 0. We also assume θ < g1/φ(m,σ); this regularity condition
ensures that the marginal benefit of searching for complementary hauls is positive at the
optimum.12 We specify the cost of searching for complementary hauls as C1(e1) = e12/2.
The expression for V, now including the value of the complementary haul, becomes:

12
(3) 1 1( ) ( , )V V g s e ms M sθ σ= + − + −
Bargaining, Truck Ownership, and Residual Rights of Control
The timing of the model is such that carriers and brokers can search for alternative uses
of the truck before they negotiate with shippers over the terms of trade. These activities yield
potential uses of the truck that are close substitutes for the shipper's haul. For simplicity, we
assume that this search is over alternatives that involve the same level of driver service, but that
using the truck and driver for the alternative is always less valuable than using them for the first
shipper's haul (perhaps because the alternative haul's origin is more distant). Assume that the
value created when the truck is used for an alternative shipper’s haul is:
(4) 2 2 1 1( ) ( , )P g e g s e ms M sθ σ= + − + −
where e2 represents effort toward finding alternative hauls and g2 represents the marginal
productivity of this effort.13 This formulation assumes that e1, the effort that the dispatcher
expends toward finding hauls that complement the first shipper's hauls, is equally valuable for
the alternative shipper's hauls (e.g., the backhaul she finds would complement either outbound
haul.). We specify the cost of searching for substitute hauls as C2(e2)= e22/2.
We can now calculate the amount of search when carriers or brokers search for hauls. We
assume that when shippers bargain with either for-hire carriers or brokers over the surplus, they
split the difference between the value of the haul and the value of the carrier's or broker's outside
alternative. A for-hire carrier's outside option is equal to P, the value of using the truck for an
12This guarantees that g1 - θs* is non-negative in the results below. The condition ensures that benefits of service are never so high so that the direct benefits of searching for complementary hauls are overwhelmed by its indirect costs.
13 Thus, V is the value of the first shipper's haul (net of service) and g2e2 is the value of the alternative haul. We assume V > ½ g2
2.

13
alternative shipper's haul. A broker does not have this outside option, because it does not own
trucks. We therefore normalize brokers' outside option to zero.14
A for-hire carrier chooses e1 and e2 to maximize:
(5) 2 2 2 21 1 1 12 2 2 21 2 1 1 2 2 1 2( ) / 2 ( 2( ) 2 2 ( , ) ) / 2V P e e V g s e ms M s g e e eθ σ+ − − = + − + − + − −
This yields search effort equal to:
(6) 121 1 2 2( ),F Fe g s e gθ= − =
If search is completed by a for-hire carrier, it will search both for hauls that complement and
substitute for the shipper's. Total value, which equals V less search costs, under this organizational
alternative is:
(7) 2 21 12 81 2( ) ( , )FTV V g s g ms M sθ σ= + − − + −
A broker chooses e1 and e2 to maximize:
(8) 2 2 2 21 1 1 12 2 2 21 2 1 1 1 2/ 2 ( ( ) ( , )) / 2V e e V g s e ms M s e eθ σ− − = + − + − − −
yielding effort of:
(9) 121 1 2( ), 0P Pe g s eθ= − =
Effort levels are lower under private carriage; brokers search less intensively for complements,
and not at all for substitutes. Total value under private carriage is:
(10) 238 1( ) ( , )PTV V g s ms M sθ σ= + − + −
Efficient Organizational Forms: Job Design and Asset Ownership
In order to compare the total value created by private carriage versus for-hire carriage, we
introduce an index variable, δ, that indicates asset ownership. δ=1 indicates for-hire carriage,
δ=0 private carriage. Total value as a function of s and δ is:
(11) 2 21 18 81 2( , ) (3 )( ) ( , )TV s V g s g ms M sδ δ θ δ σ= + + − − + −
14 This is a simplification: brokers might get some value from searching for substitute fronthauls. What is required for the model is that the marginal returns to searching for substitute fronthauls are lower for brokers than for carriers, which seems reasonable given the difference in residual control rights.
14
Proposition 1: TV(s,δ) is supermodular in (-s, -m, δ, -σ, g1, -g2) on the domain where s ≥ 0, δ ∈ {0, 1}, and 0 < θ < g1/φ(m,σ).
Proof: Supermodularity requires that TV has non-decreasing differences in (-s, -m, δ, -σ, g1, -g2); this is equivalent to non-negative cross-derivatives when TV is continuously twice-differentiable. (Topkis, 1978) All terms except the second term are supermodular in (-s, -m, δ, -σ, g1, -g2) on this domain by inspection. The second term is supermodular if g1 - θs ≥ 0, which is guaranteed if θ < g1/φ(m,σ). The sum of supermodular functions is supermodular.
This result allows us to apply a theorem from Topkis (1978) (see also Theorem 5 of
Milgrom and Shannon (1994)), and generate a set of monotone comparative statics that we can
test with data on asset ownership and technology adoption.
Proposition 2: -s* and δ* are monotone non-decreasing in (-m, -σ, g1, -g2) on the domain where s ≥ 0, δ ∈ {0, 1}, and 0 < θ < g1/φ(m,σ). -s* and δ* are (weak) complements.
Propositions 1 and 2 generate predictions that are consistent with several well-known
cross-sectional patterns in the industry.
One simple prediction is that s and δ should be inversely correlated: that is high service is
associated with shipper ownership of trucks. This is consistent with the stylized fact that drivers
in private fleets engage in more service-related activities than drivers in for-hire fleets. It is also
consistent with the assertion made by many shippers that attainment of better service is why they
choose private carriage over for-hire carriage.15
A second prediction is that δ should be high when g1 is high: that is, for-hire carriage
should be more prevalent when effort toward identifying complementary hauls is particularly
valuable. This is consistent with the stylized fact that for-hire carriage tends to be used more for
small shipments and long-distance shipments than large and short-distance shipments. (See
Bureau of the Census (1999b) and Hubbard (2001a) for empirical evidence.)
15 "[T]here are some good reasons why private carriage remains attractive to companies. Service is the key consideration. Many companies claim they require a private fleet to provide the high levels of service their customers expect. 'There are companies that decided to outsource their entire fleet, yet came running back to private

15
A third cross-sectional prediction concerns the adoption of different types of on-board
computers. As we discuss in more detail below, OBCs have different informational capabilities.
Certain simple devices (called trip recorders) allow fleet owners to monitor the actions of drivers
ex post; more advanced devices (called EVMS) also allow them to track trucks’ location in real
time. The model predicts that the value of these different informational capabilities should differ
between private and for-hire carriage: increasing the contractibility of drivers’ actions should be
more valuable in private carriage, while capabilities that raise the returns to searching for
complementary hauls should be more valuable in for-hire carriage.16 As a consequence, private
fleets should be differentially likely to adopt trip recorders and for-hire carriers should be
relatively more likely to adopt EVMS. Hubbard (2000) tests this prediction and finds exactly
this pattern. He shows that, in 1992, adoption rates for trip recorders and EVMS were
(respectively) 8.8% and 5.8% for private carriers, and 6.5% and 15.4% for for-hire carriers. This
evidence provides important support for the model that we propose, suggesting the relevance of
the agency and ownership issues that we highlight.
Our main empirical tests, however, examine relationships between informational
improvements enabled by the adoption of on-board computers (OBCs) and changes in
ownership. These exploit the predictions that increasing g1 should lead firms to (weakly)
increase δ, and increasing σ should lead firms to (weakly) decrease δ. If the productivity of
searching for complementary hauls (g1) increases as a result of improved information
technology, this should lead to two changes: a shift from private to for-hire carriage and a
decrease in the scope of drivers' activities. If firms' ability to monitor the allocation of drivers'
effort (σ) increases, this should lead directly to increases in the scope of drivers' activities and
indirectly to more shipper ownership of trucks.
Proposition 2 implies that sometimes changes in the model's parameters may not result in
changes in the optimal organizational structure. One case is of particular interest to us. If m = 0,
fleets when the service was not what they expected,' says [John McQuaid of the National Private Truck Council]." (Thomas (1998)).
16 Proposition 1 implies that increasing σ raises total value more when δ is low than high, and increasing g1 does so more when δ is high than low.

16
it is optimal to set s = 0 because there is no benefit from giving drivers service responsibilities.
If this is true, the total value function is:
(12) 2 21 18 81 2( , ) (3 )TV s V g gδ δ δ= + + −
If m = 0, TV is independent of σ: there is no multitasking, and no multitasking-related agency
problem. Therefore, if m = 0, changes in firms' ability to monitor the allocation of drivers' effort
(σ) should have no effect on asset ownership.
The following section describes OBCs in more detail and generates empirical
propositions relating OBC adoption to ownership changes.
4. On-Board Computers and Organizational Change
On-Board Computers
Two types of OBCs began to diffuse in the trucking industry in the late 1980s: trip
recorders and electronic vehicle management systems (EVMS).17 Trip recorders measure trucks’
operation. They record when trucks are turned on and off, their speed, sudden accelerations or
decelerations, and various engine performance statistics (e.g., fault codes). Dispatchers and fleet
managers receive the information trip recorders collect when drivers return to their base at the
end of a trip. Drivers give dispatchers a floppy disk or a similar device. Dispatchers upload the
information onto a computer, which processes the information and provides reports. These
reports indicate how drivers operated the truck; for example, how quickly they drove, how long
they allowed trucks to idle, and whether there were any non-scheduled stops. They also indicate
how long drivers spent at each stop.
EVMS record the same information trip recorders do, but provide three additional
capabilities. One is that they record trucks’ geographic location, often using satellite tracking
systems. Another is that they can transmit any information they collect to dispatchers in real
time. Dispatchers can thus know where trucks are at any point in time. Third, they provide
dispatchers a way of initiating communication with drivers. For example, dispatchers can send a
17See also Baker and Hubbard (2000) and Hubbard (2000).

17
text message that updates drivers’ schedule. If the message is complicated, dispatchers can send
a message that asks drivers to call in. This is a significant advance over the system firms have
traditionally used to communicate with drivers who are outside radio range (about 25 miles).
Traditionally, firms require drivers to call in every three or four hours. This requires drivers to
frequently pull over, stop, and find a phone, even though much of the time neither dispatchers
nor drivers have new information to communicate. Without EVMS, dispatchers often find it hard
to verify trucks' location and must wait for distant drivers to call in before they can communicate
instructions.
As Hubbard (2000) relates, there is an economically important distinction between these
two devices. Trip recorders are useful for improving incentives, because they provide verifiable
information about how trucks were operated. Importantly for this paper, they monitor how long
drivers spent driving and how long they spent performing other tasks: this helps mitigate the
agency problems associated with more complex job designs.18 Trip recorders are not generally
useful for improving resource allocation decisions (“coordination”). They do not improve
dispatchers’ ability to match trucks to hauls in the very short run because they do not supply
information in a timely enough fashion. They are generally not used to improve routing
decisions made over the longer run – for example, by helping benchmark routes – because firms
usually can obtain information about such things as how long routes take by other, less costly
means.19
In contrast, EVMS are useful for improving both incentives and coordination. Their
additional capabilities help dispatchers match trucks to hauls better, thereby increasing capacity
utilization. Real-time information about trucks’ location helps them schedule backhauls more
efficiently, for example.20 These capabilities also enable them to communicate schedule changes
18 An advertised benefit of trip recorders is their ability to help monitor drivers in this way. For example, Atrol claims that its devices can "tell you how effective your drivers are in managing their time." www.atrol.com.
19Many firms use software packages to help dispatchers schedule trucks. These packages often use information EVMS collect (for example, trucks’ location), but rarely use the information trip recorders collect.
20 Trade press articles and advertisements emphasize this. An example of a quote from a driver: "Dispatch knows where I am and where I'm headed so before I even get to my destination, they can plan ahead. Quite often I get a

18
to drivers in real time. Dispatchers can quickly reroute trucks in response to changes in market
conditions. For example, suppose a truck on the road is half-full. If a dispatcher can find a
shipper with cargo that can fill the truck, he can send a message to the driver asking him to make
an additional pick-up and delivery.
We next discuss our main empirical propositions, which predict how OBC adoption
should affect truck ownership. These propositions are based on the premise that trip recorder
adoption increases σ and EVMS adoption increases both σ and g1.
P1: Overall, trip recorder adoption should lead to more shipper ownership of trucks.
OBCs' incentive-improving capabilities allow carriers to better monitor how drivers
allocate time, and thus effort, across tasks. Trip recorder adoption thus raises σ, which by
proposition 3 increases the optimal choice of s and decreases δ; carrier ownership of trucks
should decrease. We cannot test whether trip recorder adoption increases s because the data do
not contain information on the scope of drivers' activities, but we can test whether it leads to
more shipper ownership of trucks.
P2: EVMS adoption should lead to less of an increase in shipper ownership of trucks than trip
recorder adoption, and may lead to less shipper ownership of trucks.
EVMS' coordination-improving capabilities make dispatchers' search more productive,
and thus raise g1. Knowing where trucks are allows dispatchers to better anticipate when trucks
will come free, and hence helps them refine their search. Being able to initiate communications
with drivers while they are in their cab enables them to better exploit the opportunities they
identify. For example, they can quickly reallocate drivers and trucks across hauls in response to
new opportunities. Because EVMS contain both incentive- and coordination-improving
load offering over my Qualcomm system before I'm even empty." www.qualcomm.com. Empirical evidence of EVMS' impact on capacity utilization is in Hubbard (2001b), who finds that EVMS has increased loaded miles among adopters by 13% as of 1997.
19
capabilities, EVMS adoption should increase both σ and g1 and thus has a theoretically
ambiguous impact on asset ownership. However, because EVMS adoption increases σ in the
same way trip recorder adoption does, EVMS adoption should move hauls less toward private
carriage than trip recorder adoption.
P3: Trip recorder adoption should increase shipper ownership of trucks more when drivers'
cargo-handling activities are potentially productive than when they are not productive. It should
not affect whether shippers own trucks when drivers' handling activities are not productive.
Trip recorder adoption should not lead to ownership changes when m = 0: for example
for hauls of bulk goods or goods that require people other than drivers to load and unload. It
should lead to ownership changes when m > 0. From above, this should be the case when trucks
haul packaged goods, especially when they pick up or deliver to small outlets. It should also be
the case when trucks haul goods for which handling requires certification, such as petroleum or
chemicals. However, it should not be true for hauls of bulk goods or goods that cannot be lifted
or transported with standard equipment.
5. Data
The data are from the 1987, 1992, and 1997 Truck Inventory and Use Surveys (TIUS).21
The TIUS is a mail-out survey of trucks taken by the Census as part of the Census of
Transportation. The Census sends forms to a random sample of truck owners. These forms ask
questions about individual trucks’ characteristics. Truck owners report the truck’s type (pick-up,
van, tractor-trailer, etc.), make, model, and many other characteristics. The TIUS also asks how
trucks are equipped, including whether they have trip recorders or EVMS installed, and how they
are used. Owners report how far from home individual trucks generally operated, the type of
trailer to which they were typically attached, the class of product they generally hauled, the state
21See Baker and Hubbard (2000), Bureau of the Census (1995, 1999a), and Hubbard (2000, 2001a) for more on the TIUS. The 1997 survey is actually called the Vehicle Inventory and Use Survey.

20
in which they were based, and whether they were used for for-hire or private carriage. Publicly-
available data from the Survey do not identify trucks’ owners because of confidentiality
restrictions. This paper uses only observations of truck-tractors (the front halves of tractor-
trailers) and excludes those that were generally operated off-road, carried household goods (i.e.,
moving trucks), or were attached to trailers that do not haul goods (e.g., trailers with large
winches permanently attached). Eliminating these observations leaves 21,236, 32,015, and
18,856 observations of tractor-trailers in 1987, 1992, and 1997 respectively. This is over 85% of
the tractor-trailers in the original samples.
Figure 1 shows private carriage shares in each of the three years. In each of these years,
the overall share is about 50% and is higher for shorter hauls than longer ones. The overall share
fluctuated during this period, increasing from 50.1% to 54.6% between 1987 and 1992, then
falling back to 51.7% in 1997. The time trends differ for hauls of different lengths. The private
carriage share increased for all distances between 1987 and 1992. It increased for short hauls but
declined for medium and long hauls between 1992 and 1997. This paper’s empirical tests
examine how these changes relate to the diffusion of on-board computers.
It is useful to put these changes in perspective: within the industry, they are considered
historically significant changes in ownership patterns.22 Other studies indicate that the private
carriage share was remarkably constant between the early 1970s and late 1980s. Even
deregulation, which initiated large structural changes within the for-hire sector of the industry,
appears to have changed make-or-buy decisions in the aggregate by no more than two percentage
points.23 We suspect that this reflects that neither haul characteristics nor the informational
environment changed much during this period. The aggregate changes in ownership patterns
depicted in Figure 1 – the increase of 3.5 percentage points in the private carriage share between
22 For example, Standards and Poor's DRI remarks upon the "rapid shift to for-hire trucking observed in the early to mid-1990s." (American Trucking Associations (1999))
23 Using different measures than those in Figure 1 (private fleets' volume share of intercity trucking shipments), the Eno Transportation Foundation estimates that the private carriage share was approximately 59% throughout the 1970s, and fell to 57.7% immediately following deregulation -- a decline of only 1.3 percentage points -- before climbing back to 60.3% in 1992. It estimates that by 1997 this figure had fallen by 3.5 percentage points to 56.8%, and has continued to fall since then. (Wilson (2001))

21
1987 and 1992 and the decrease of 2.9 percentage points between 1992 and 1997 -- appear larger
than those that immediately followed deregulation or any other period in the previous twenty-
five years.
Figure 2 summarizes patterns of OBC adoption over time and across distances. There are
three important patterns. First, adoption of OBCs was rapid during our sample period. In 1987,
a negligible number of tractor-trailers had an OBC installed; we treat this number as zero
throughout. In 1992, 19% of tractor-trailers had an OBC installed; by 1997, adoption increased
to 34%. Second, adoption was greater for trucks used for longer hauls. By 1997, half of long-
haul trucks had an OBC installed. Third, the composition of OBCs differed in the early and late
part of our sample period. Trip recorders made up nearly half of OBC adoption between 1987
and 1992, but there was no net adoption of trip recorders between 1992 and 1997. Evidence
from the trade press and interviews suggests that this reflects two offsetting factors: new trip
recorder adoption and upgrades from trip recorders to EVMS. In contrast, adoption of EVMS
accelerated. The share of trucks with EVMS more than doubled between 1992 and 1997. Thus,
broad patterns in the data suggest a correlation between technological and organizational change:
the movement from for-hire to private carriage between 1987 and 1992 was during a time when
trip recorder adoption was relatively high, and the movement from private to for-hire carriage
between 1992 and 1997 was during a time when OBC adoption was disproportionately EVMS.
Cohort Data
The bulk of our empirical analysis uses cohorts rather than individual trucks as the unit of
observation. This allows us to exploit the time dimension of the data and use first-differencing
to control for unobserved time-invariant factors that affect OBC use and the make-or-buy
decision independently. Like in our earlier work we define cohorts narrowly, basing them on
state-product-trailer-distance combinations; an example is “trucks based in New Jersey hauling
chemicals in tank trucks long distances.” There are 2773 cohorts with a positive number of
observations in 1987, 1992, and 1997. About three-quarters of our original observations are in
these cohorts.
The characteristics of the trucks in the original and cohort samples are similar with two
22
exceptions. One is that the cohort sample tends not to contain trucks that are predominantly
attached to uncommon trailers such as auto trailers, logging trailers, and specialized platform-
types. An implication is that the cohort sample contains a higher fraction of long haul trucks
than the population because hauls using specialized trailers tend to be short. The other is that,
conditional on distance, trucks attached to refrigerated vans make up a disproportionate share of
the cohort sample: about 20% rather than their 10% share in the original sample. The reason for
this is refrigerated vans almost exclusively haul a single product class: processed food.
Refrigerated van cohorts tend to be larger and are less likely to have zero observations than
cohorts associated with trailers that haul multiple product classes.
Table 1 contains summary statistics for the cohort sample. Cohorts tend to be based on
relatively few observations due to our narrow cohort definition: the number of observations per
cohort is less than ten in each year.24 The average private carriage share is about 50% and
average OBC adoption rates are similar to those in Figure 2. Table 2 provides evidence of
relationships between technological adoption and organizational change at the cohort level. The
top panel uses cohorts with positive observations in both 1987 and 1992. The first row indicates
that averaging across cohorts, the private carriage share increased from 0.49 to 0.50 between
1987 and 1992. The next three rows split the cohort sample according to OBC adoption. On
average, the private carriage share stayed the same for cohorts with low OBC adoption. Among
cohorts with high OBC adoption, the private carriage share increased for those where trip
recorder adoption was high but decreased slightly for those where EVMS adoption was high.
The bottom panel reports results from a similar exercise that analyzes patterns between 1992 and
1997. The private carriage share decreased for the low OBC and high EVMS adoption cohorts
(slightly more for the latter), but increased for high trip recorder adoption cohorts.
In sum, relationships between OBC adoption and organizational change differ for trip
recorders and EVMS. Cohorts with high trip recorder adoption moved toward private carriage
24In earlier versions of this paper, we reported estimates of our main specifications using the subsample of cohorts where the private and for-hire carriage shares are positive in each year. The average cohort size is about double in this subsample, but observations in these cohorts make up only about 35% of the original sample. We showed that our main results do not change.
23
more than cohorts with low OBC adoption. Cohorts with high EVMS adoption moved toward
for-hire carriage slightly more than those with low OBC adoption, but this difference is very
small. Nevertheless, the fact that cohorts with high EVMS adoption did not move toward private
carriage is interesting in light of the fact that EVMS enable the same contractual improvements
trip recorders do. This suggests EVMS’ resource allocation-improving capabilities – which trip
recorders do not have – have organizational implications that offset those of their incentive-
improving ones.
6. Results
Our base specification takes the form:
it it i ity x β φ ε= + +
where yit is the for-hire carriage share in cohort i at time t, xit includes a vector of explanatory
variables, and φi and εit represent unobserved time-invariant and time-varying variables that
affect optimal organizational form. The variables of interest in xit are OBC, the share of trucks
with either class of OBC installed, and EVMS, the share of trucks with EVMS installed. The
coefficient on OBC therefore picks up the relationship between OBCs’ incentive-improving
capabilities and asset ownership and that on EVMS picks up the relationship between EVMS’
coordination-improving capabilities and asset ownership. The control variables in xit are similar
to those in Table 5 in Hubbard (2001a). They include a full set of dummy variables that indicate
the cohort’s trailer type (dry van, refrigerated van, tank truck, etc.), a dummy that equals one if
the cohort is of trucks hauling mixed cargo, and ln(trailer density). Trailer density is the number
of trucks in the state attached to a given trailer type, normalized by the state’s urbanized area,
and is a proxy for local market thickness for hauls using a particular trailer type. We allow the
coefficients on the dry van and auto trailer dummies to vary across years to account for secular
changes in contractual form over time (see Hubbard (1998)).
Most of our results will be from first-difference specifications:
( 1) ( 1)( )it i t it i t ity y x x β η− −− = − +
where ηit = εit - εi(t-1). First differencing mitigates an important class of endogeneity problems
that would appear in cross-sectional analysis. For example, suppose that when shipping patterns

24
are regular, private carriage tends to be used more (perhaps because intermediaries’ efforts are
less valuable) and trip recorders are disproportionately valuable relative to EVMS. This would
lead private carriage and trip recorder use to be correlated in the cross-section even if trip
recorders adoption did not cause truck ownership to change. First differencing effectively allows
us to control for unobserved time-invariant variables that could affect OBC adoption and
organizational form independently, and base inferences on relationships between adoption and
changes in asset ownership rather than levels.25 Thus, if hauls' unobserved regularity is constant
over time, first-differencing eliminates this as a possible endogeneity problem. For simplicity,
our initial discussion of the results will assume ηit to be independent of adoption: that is, we
assume changes in unobserved haul characteristics to be independent of adoption. Later we will
relax this assumption and present instrumental variables estimates of the first-difference
specifications.
Table 3 contains two sets of regression estimates that use cohort data from 1987, 1992,
and 1997. The first column presents levels estimates; the second presents first-difference
estimates. The coefficients on OBC are negative and significant and those on EVMS are positive
and significant in both columns. They are about 40% lower in absolute value when moving from
the levels to the first-difference estimates, but remain statistically significant and economically
important.
These estimates supply evidence consistent with our main propositions. Consistent with
P1, trip recorder adoption is associated with movement from for-hire to private carriage.
Consistent with P2, EVMS adoption is less associated with such movement. Assuming these
reflect causal relationships, they indicate that OBCs’ incentive- and coordination-improving
capabilities affect the make-or-buy margin differently. Their incentive-improving capabilities
move hauls from “buy” to “make;” their coordination-improving capabilities move them from
“make” to “buy.” The former shifts truck ownership from for-hire carriers to shippers; the latter
from shippers to for-hire carriers.
25 The control variables in the first difference specifications only include the dry van and auto trailer dummies and ln(trailer density) because none of the coefficients on the other controls vary over time. Changes in unobserved
25
The first-difference estimates imply that all else equal, cohorts with a 20 percentage point
higher trip recorder adoption rate experienced a 2 percentage point greater increase in their
private carriage share. Likewise, moving 20 percent of trucks from trip recorders to EVMS
corresponds to a 3 percentage point increase in the for-hire carriage share. These magnitudes
suggest the OBCs' incentive- and coordination-improving capabilities have an economically-
important impact on make-or-buy decisions in the aggregate, in light of the industry's recent
history. We discuss magnitudes at more length in a subsection below.
Table 4 breaks these results down further. The top panel reports first-difference estimates
using all cohorts and subsamples of short, medium, and long haul cohorts. The coefficient on
OBC is negative for all three subsamples and statistically significant for medium and long haul
cohorts. The EVMS coefficient is positive and significant for all three subsamples, and of about
the same magnitude. The basic relationships between adoption and changes in asset ownership
hold across hauls of different distances.
The bottom part of the table estimates the coefficients using only 1987 and 1992, then
only 1992 and 1997 data. In the earlier period, the pattern of a negative coefficient on OBC and
a positive one on EVMS only appears within the long haul subsample. In contrast, this pattern
appears strongly and consistently in the later period. In the latter period, the coefficients on OBC
are negative in each subsample, and statistically significant for the short and medium haul
subsample. Those on EVMS are positive and significant in each subsample. The cross-year
differences are interesting because they are consistent with widespread speculation that
organizational changes tend to lag IT adoption, even when they are complementary.
Interactions: Multitasking Tests
In the model, trip recorders affect optimal asset ownership indirectly, by lowering the
agency costs associated with multitasking. If so, then the OBC coefficient should only be
negative for hauls where drivers’ cargo-handling effort is potentially productive. This is the
basis of P3 above. To examine this, we create interactions between OBC adoption and product
categories. One set is between adoption and a dummy variable that equals one if the cohort hauls
cohort characteristics may either reflect true changes or sampling error. See Deaton (1985).
26
processed food or mixed cargo. Trucks hauling processed food or mixed cargo tend to deliver
packaged goods to retail outlets. Drivers’ cargo handling efforts are potentially more valuable
when they haul these goods than other, bulkier goods. The other set is between adoption and a
dummy variable that equals one if the cohort hauls petroleum or chemicals, cargo for which
handling requires certification. We therefore test whether the OBC coefficient is more negative
for these "multitasking" cohorts than others.
Table 5 summarizes the results. The first column uses data from all three years. The
coefficient on OBC alone is small and statistically insignificant. There is no relationship
between OBC adoption and asset ownership when trucks haul goods in the omitted category,
which contains raw materials and bulky goods.26 The interactions on OBC*(food or mixed
cargo) and on OBC*(petroleum or chemicals) are both negative, and the former is statistically
significant. The other two columns report estimates using only two of the years. The OBC own
effects are statistically zero in both periods. Both interactions are negative and significant in the
late period of the sample. The estimates provide support for P3, and are important evidence that
OBCs’ incentive-improving capabilities affect asset ownership through job design. There is no
evidence that incentive improvements affect the make-or-buy decision for hauls where drivers’
handling efforts are rarely productive. When drivers’ handling efforts tend to be productive,
hauls for which trip recorders were adopted moved from for-hire to private carriage.
The first difference estimates are thus consistent with all three of our theoretical
propositions. The following subsection provides additional evidence regarding whether they
indeed reflect causal relationships between adoption and organizational change.
Instrumental Variables Estimates
As noted above, alternative interpretations of the first difference estimates center on the
premise that OBC adoption and organizational changes might be independently affected by some
omitted factor. For example, if hauls' regularity changes over time, and increases more in some

27
cohorts than others, this could lead independently to more private carriage and to trip recorder
adoption. This would make adoption econometrically endogenous in the first-difference
estimates. Similarly, unobserved factors may also explain why EVMS adoption might be
correlated with movements toward for-hire carriage. Suppose unobserved shipper characteristics
change over time; some shippers may both establish more sophisticated logistics practices and
begin to value shipment tracing capabilities. This could lead independently to less private
carriage (because drivers’ handling effort is less valuable) and increased EVMS adoption.
Below we present instrumental variables estimates of the first-difference specifications.
Factors that affect OBC adoption but do not directly affect organizational form are good
instruments. We use four main instruments: the fraction of miles trucks are operated outside of
their base state, the number of weeks per year trucks in the state are in use, and dummy variables
that equal one if the truck is based in a western state (i.e., west of Missouri), or in a New England
state. These are computed at the cohort level; hence, the first two of these are cohort-level
averages. Fraction of miles out of state affects OBC adoption because drivers must keep track of
how many miles trucks are operated in each state. State fuel taxes are paid on this basis. OBCs
let drivers enter in this information on a keypad and lower data entry and processing costs when
trucks’ owners calculate the tax they owe each state. This is more valuable for trucks that spend
more time outside of their base state because they cross state lines more. State averages for
number of weeks in use differ considerably across states, ranging between 35 and 45 weeks, and
reflect differences in the cyclicality of truck shipments. Much of this variation is likely climate-
related, as the bottom five states are Montana, Wyoming, North Dakota, Alaska, and South
Dakota. Trucks are idled more weeks per year, and OBCs' benefits are correspondingly lower, in
areas where shipments are highly cyclical. We assume that statewide averages in the number of
26The most prevalent product classes in the omitted category are fresh farm products, building materials, machinery, and lumber and wood products. About 70% of cohorts are in the omitted category; about 30% are in the "multitasking" categories.

28
weeks trucks are in use are unaffected by OBC adoption.27 The two regional dummies are
included because it is traditionally more difficult for drivers to contact dispatchers quickly in less
densely populated areas. This is one reason why adoption tends to be above average in the west
but below average in New England. We use these four variables and their interactions as
instruments for OBC and EVMS. Table A1 reports estimates from four simple "first-stage"
specifications that regress cohort-level trip recorder and EVMS adoption in the early and late
sample periods on the four instruments and a vector of controls.
Table 6 contains estimates from specifications analogous to that in the first column of
Table 5, but which restrict the interaction terms to be the same across the four “multitasking”
product types. Looking at the first column, the coefficient on OBC is nearly zero; as before,
there is no evidence that trip recorders affect asset ownership for the “non-multitasking” cohorts.
The same is true for the EVMS*Mult interaction: there is no evidence that OBCs’ coordination-
improving capabilities’ impact differs with whether multitasking is potentially productive. The
negative coefficient on OBC*Mult suggests that trip recorders move hauls toward private
carriage more for the multitasking cohorts than the non-multitasking ones. The positive
coefficient on EVMS suggests that EVMS’ coordination improving capabilities move hauls from
private to for-hire carriage. However, these coefficients are not statistically significantly
different from zero because they are not estimated precisely. The noisiness of the estimates
reflects that while three of our instruments are predictors of OBC adoption in general, none of
them shift trip recorder adoption but not EVMS adoption. (See Table A1.) This makes it hard to
distinguish between the organizational effects of OBCs' incentive- and coordination-improving
capabilities in the instrumental variables estimates.
The bottom part of the table contains estimates of (OBC+EVMS) and
(OBC+EVMS)*Mult, which reflect EVMS' overall organizational impact. We can estimate
these more precisely; consistent with our earlier results, EVMS adoption pushes hauls toward
for-hire carriage, but does so less for the multitasking cohorts than the non-multitasking cohorts.
27Individual trucks with OBCs do tend to be used more weeks than those without them, because trucks without OBCs are more likely to be idled when demand is low. But OBC adoption should have a minimal impact

29
The right column restricts the coefficient on OBC to zero for the non-multitasking cohorts, a
restriction suggested by the near-zero point estimates on this coefficient in Table 5. The sign and
significance of the remaining three coefficients are the same as in the first-difference estimates.
In sum, our instrumental variables estimates provide no evidence that our first-difference
estimates reflect non-causal relationships. Although we cannot statistically distinguish between
the impact of OBCs' incentive- and coordination-related capabilities to the same degree, the
qualitative patterns that we are able to identify are similar to those in our earlier results.
Magnitudes
Although not the main focus of the study, the estimates also indicate the degree to which
overall changes in the private carriage share between 1987 and 1997 were due to the diffusion of
OBCs. Table 7 summarizes our analysis. The top line reports the actual private carriage shares
in our sample in each of the three years. The bottom part of the table reports the estimated
shares, absent OBC diffusion, computed using the simple and GMM-IV first difference estimates
from the first column of Table 4 and the right column of Table 6, respectively. The simple first-
difference estimates suggest that OBCs had little overall impact between 1987 and 1992 – the
diffusion of trip recorders and EVMS had offsetting effects – but caused about one percentage
point of the overall 2.9 percentage point decline between 1992 and 1997. The GMM-IV point
estimates imply that OBCs' overall impact was much larger. They indicate that absent OBC
diffusion, the private carriage share would have continued to increase to almost 60% by 1997.
One interpretation is that the organizational impact of EVMS’ coordination-improving effects
worked against a broad increase in the demand for high service levels.
We do not put a large weight on these quantitative conclusions, in large part because the
GMM-IV point estimates in Table 6 are noisy. We are more confident in stating the qualitative
conclusion that overall, OBC diffusion played a significant and possibly large role in inducing
shippers to outsource more during the 1990s.
on number of weeks, averaged across all trucks in a state.

30
7. Conclusion
In this paper, we combine recent theoretical work from organizational economics with a
detailed and disaggregated dataset to gain insight about the interaction between asset ownership,
job design, and information. Of particular importance is our ability to distinguish between
informational changes that lead either to better monitoring of agents, or to better coordination of
activities. We believe that our results—that improved monitoring technologies lead shippers to
vertically integrate into trucking, while technologies that improve coordination lead to more
outsourcing of trucking services—highlight the respective advantages of firms and markets in the
economy, and thus shed light on their roles in the operation and development of economic
systems.
In describing and explaining the development of 19th century capitalism, Chandler
(1977) and others have argued that the development of new communication technologies (e.g.,
the telegraph) enabled the growth of large, integrated firms. Large transportation, manufacturing,
and retailing firms were impossible without a technology that enabled managers to coordinate
large-scale economic activity. Yet we have found exactly the opposite effect in late 20th century
trucking: a new communications technology that improved coordination led to smaller, less
integrated firms. Why the difference?
We believe that our new results arise because we distinguish between informational
changes that improve coordination from those that improve incentives. Such a capability is rare
in empirical work on organizations. Yet it is essential to understanding the true role of firms and
markets as competing mechanisms for organizing economic activity. Hayek (1945) argued that
the true value of the market-based price system is its ability to utilize dispersed information
about resources and coordinate their use in a way that no centrally planned economy (or firm)
ever could. Given this comparative advantage of markets over firms, it is not surprising that a
technological change that mitigates the Hayekian coordination problem should lead to a greater
relative improvement in the efficiency of markets.
Holmstrom and Milgrom (1994) and Holmstrom (1999), by contrast, argue that the true
advantage of firms over markets is their ability to craft delicately balanced incentives for agents
engaged in multiple activities, in a way that the strong incentives generated by markets and asset
31
ownership cannot. Given this comparative advantage for firms, it is again not surprising that a
technological change that mitigates contracting problems should lead to a greater relative
improvement in the efficiency of firms.
Information costs are at the core of nearly all economic theories of organizations. Thus,
all of these theories predict that changes in information technology that change the cost of
contracting and communication will affect the organization of economic activity. We find that
the answer to the question: "Has IT adoption led to larger or smaller firms in trucking?" is "Yes,"
and show how the organizational implications of IT's incentive- and coordination-improving
capabilities systematically differ. Future research will further inform debates regarding the
organizational implications of changes in information costs by investigating whether this
systematic difference in trucking is general.
32
References
American Trucking Associations (1999). U.S. Freight Transportation Forecast…to 2007, Alexandria, VA: American Trucking Associations. Baker, George P. (1992). "Incentive Contracts and Performance Measurement." Journal of Political Economy, 100, 598-614. Baker, George P., and Thomas N. Hubbard (2000). "Contractibility and Asset Ownership: On-Board Computers and Governance in U.S. Trucking." NBER Working Paper #7634, April 2000. Brynjolfsson, Erik, and Lorin Hitt, "Information Technology and Organizational Design: Some Evidence From Micro Data," Stanford University, October 1997. Bureau of the Census (1995). 1992 Census of Transportation: Truck Inventory and Use Survey. Washington, DC: Government Printing Office. Bureau of the Census (1999a). 1997 Census of Transportation: Vehicle Inventory and Use Survey. Washington, DC: Government Printing Office. Bureau of the Census (1999b). 1997 Census of Transportation: Commodity Flow Survey. Washington, DC: Government Printing Office. Deaton, Angus (1985). "Panel Data from Time Series of Cross-Sections," Journal of Econometrics, 30, 109-26. Chandler, Alfred P. (1977). The Visible Hand: The Managerial Revolution in American Business. Cambridge, MA: Belknap. Grossman, Sanford, and Oliver Hart (1986). "The Costs and Benefits of Ownership: A Theory of Vertical and Lateral Integration." Journal of Political Economy, 94, 691-719. Hayek, F. A. (1945). "The Use of Knowledge in Society." American Economic Review, 35, 519-530. Holmstrom, Bengt (1999). "The Firm as a Subeconomy." Journal of Law, Economics, and Organization, 15, 74-102. Holmstrom, Bengt, and Paul Milgrom (1991). "Multitask Principal-Agent Analyses: Incentive Contracts, Asset Ownership, and Job Design." Journal of Law, Economics, and Organization, 7, 24-52.

33
Holmstrom, Bengt, and Paul Milgrom (1994). "The Firm as an Incentive System." American Economic Review, 84, 972-991. Hubbard, Thomas N. (1998). "Governance Structure in the Deregulated Trucking Industry." UCLA, October 1998. Hubbard, Thomas N. (2000). "The Demand for Monitoring Technologies: The Case of Trucking." Quarterly Journal of Economics, 115, 533-576. Hubbard, Thomas N. (2001a). "Contractual Form and Market Thickness in Trucking." Rand Journal of Economics, 32, 369-386. Hubbard, Thomas N. (2001b). "Information, Decisions, and Productivity: On-Board Computers and Capacity Utilization in Trucking." NBER Working Paper #8525, September 2001. Jensen, Michael C., and William H. Meckling (1976). "Theory of the Firm: Managerial Behavior, Agency Costs, and Ownership Structure." Journal of Financial Economics, 3, 305-360. Jensen, Michael C., and William H. Meckling (1992). "Specific and General Knowledge, and Organizational Structure," in Contract Economics, Lars Werin and Hans Wijkander, eds. Cambridge, England: Blackwell. Leavitt, H. J., and T. L. Whisler (1958). "Management in the 1980s." Harvard Business Review, 36, 41-48. Malone, Thomas W., JoAnne Yates, and Robert I. Benjamin (1987). "Electronic Markets and Electronic Hierarchies." Communications of the ACM, 30, 484-497. Milgrom, Paul and John Roberts (1990). "Bargaining Costs, Influence Costs, and the Organization of Economic Activity," in Perspectives on Positive Political Economy, James E. Alt and Kenneth A. Shepsle eds., Cambridge: Cambridge University Press. Milgrom, Paul, and Chris Shannon (1994). "Monotone Comparative Statics." Econometrica, 62, 157-180. Ouellet, Lawrence J. (1994). Pedal to the Metal: The Work Lives of Truckers. Philadelphia, PA: Temple. Thomas, Jim (1998). "Private Fleets: Down But Not Out." Logistics Management and Distribution Report, 37(7), 31-32.

34
Topkis, Donald M. (1978). "Minimizing a Submodular Function on a Lattice." Operations Research, 26, 305-321. Wilson, Rosalyn A. (2001). Transportation in America 2000, with Historical Compendium 1939-1999, Washington, DC: Eno Transportation Foundation.

35
Figure 1Private Carriage Share by Year, Distance of Haul
0%
10%
20%
30%
40%
50%
60%
70%
80%
All Distances Short Medium Long
1987 1992 1997
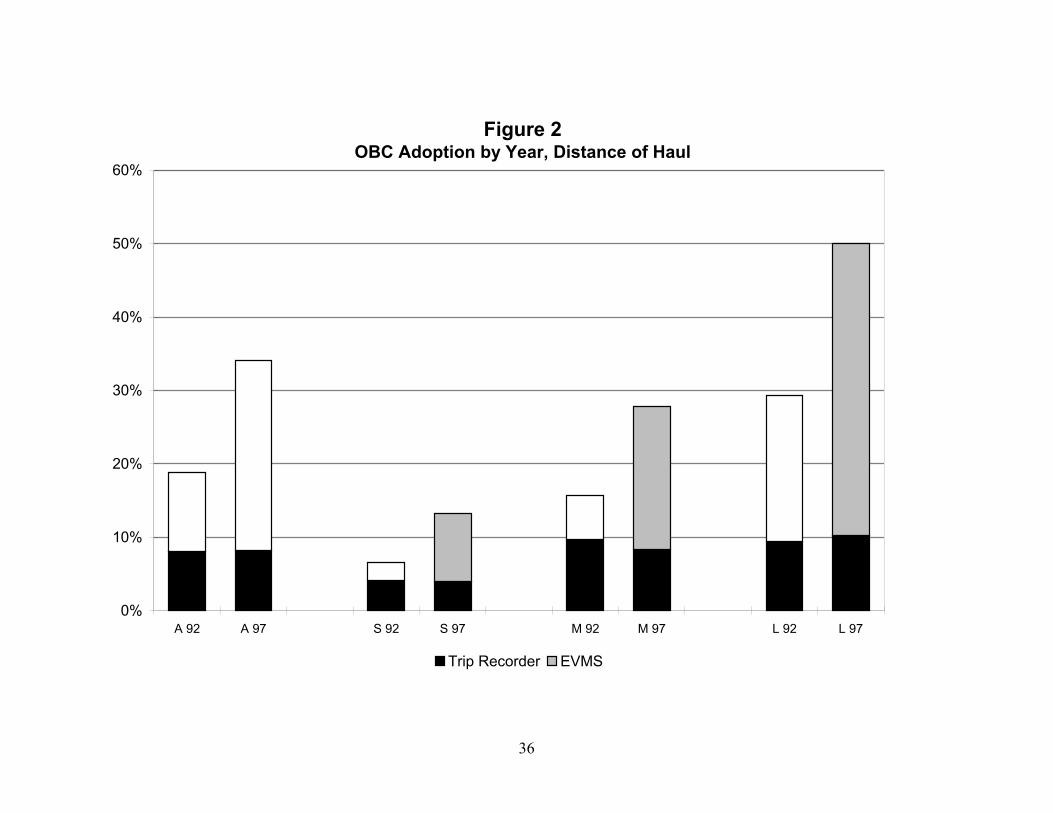
36
Figure 2OBC Adoption by Year, Distance of Haul
0%
10%
20%
30%
40%
50%
60%
A 92 A 97 S 92 S 97 M 92 M 97 L 92 L 97
Trip Recorder EVMS

37
Table 1Cohort Summary Statistics
Positive Number of Observations in:
1987,1992,1997 1987, 1992 1992, 1997
Cohorts 2773 3908 4101
Observations/Cohort, 1987 5.7 4.7Observations/Cohort, 1992 8.3 6.6 6.4Observations/Cohort, 1997 5.1 4.1
Private Carriage Share, 1987 0.50 0.49Private Carriage Share, 1992 0.50 0.50 0.52Private Carriage Share, 1997 0.48 0.50
Trip Recorder Adoption, 1987-1992 0.08 0.08 0.08EVMS Adoption, 1987-1992 0.08 0.09 0.11
Trip Recorder Adoption, 1992-1997 -0.01 0.00EVMS Adoption, 1992-1997 0.16 0.16
Averages are computing using weights, where weight = (numobs87*expanf87 + numobs92*expanf92+ numobs97*expanf97)/3 for samples using all three years.Analogous weights are used for samples that use only two of the three years.
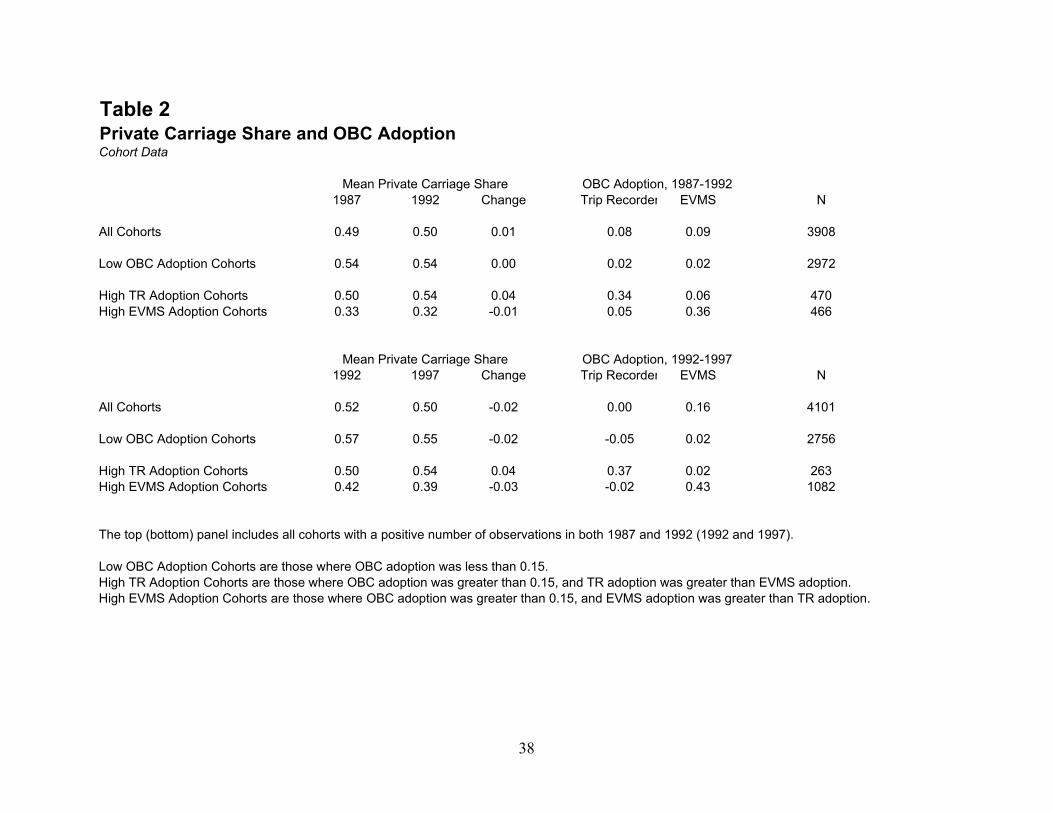
38
Table 2Private Carriage Share and OBC AdoptionCohort Data
Mean Private Carriage Share OBC Adoption, 1987-19921987 1992 Change Trip Recorder EVMS N
All Cohorts 0.49 0.50 0.01 0.08 0.09 3908
Low OBC Adoption Cohorts 0.54 0.54 0.00 0.02 0.02 2972
High TR Adoption Cohorts 0.50 0.54 0.04 0.34 0.06 470High EVMS Adoption Cohorts 0.33 0.32 -0.01 0.05 0.36 466
Mean Private Carriage Share OBC Adoption, 1992-19971992 1997 Change Trip Recorder EVMS N
All Cohorts 0.52 0.50 -0.02 0.00 0.16 4101
Low OBC Adoption Cohorts 0.57 0.55 -0.02 -0.05 0.02 2756
High TR Adoption Cohorts 0.50 0.54 0.04 0.37 0.02 263High EVMS Adoption Cohorts 0.42 0.39 -0.03 -0.02 0.43 1082
The top (bottom) panel includes all cohorts with a positive number of observations in both 1987 and 1992 (1992 and 1997).
Low OBC Adoption Cohorts are those where OBC adoption was less than 0.15.High TR Adoption Cohorts are those where OBC adoption was greater than 0.15, and TR adoption was greater than EVMS adoption.High EVMS Adoption Cohorts are those where OBC adoption was greater than 0.15, and EVMS adoption was greater than TR adoption.
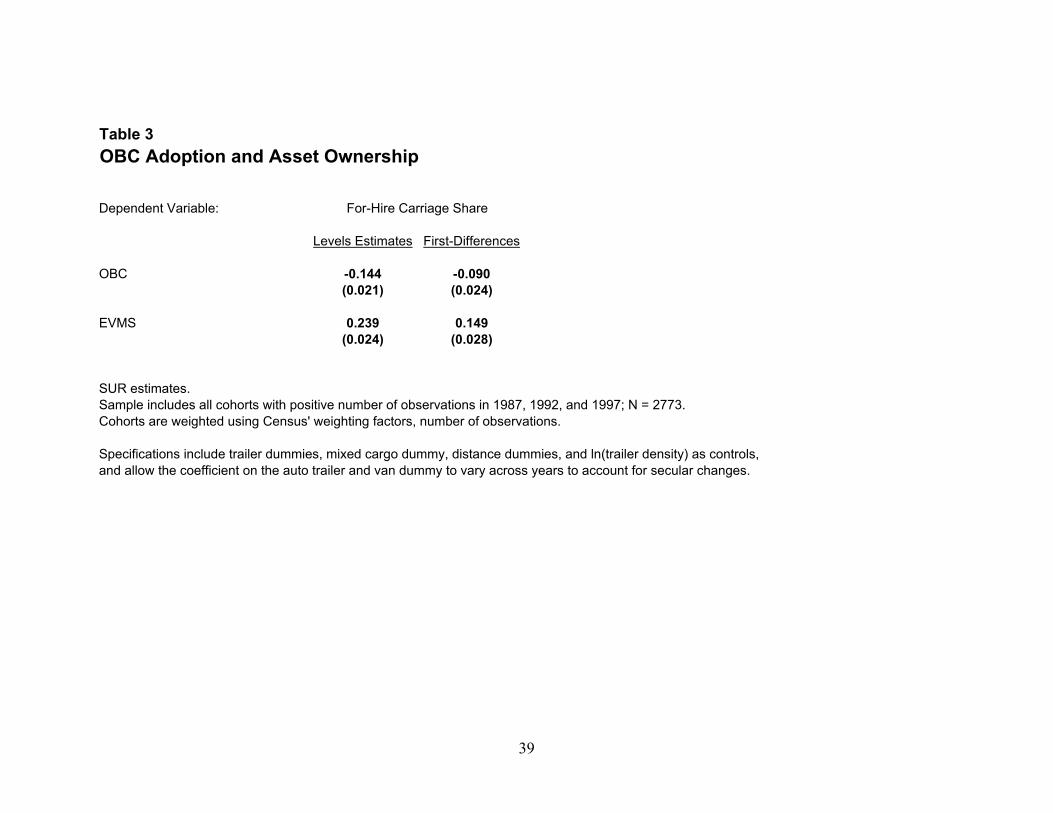
39
Table 3OBC Adoption and Asset Ownership
Dependent Variable: For-Hire Carriage Share
Levels Estimates First-Differences
OBC -0.144 -0.090(0.021) (0.024)
EVMS 0.239 0.149(0.024) (0.028)
SUR estimates.Sample includes all cohorts with positive number of observations in 1987, 1992, and 1997; N = 2773.Cohorts are weighted using Census' weighting factors, number of observations.
Specifications include trailer dummies, mixed cargo dummy, distance dummies, and ln(trailer density) as controls,and allow the coefficient on the auto trailer and van dummy to vary across years to account for secular changes.

40
Table 4OBC Adoption and Asset Ownership
All Short Hauls Medium Hauls Long Hauls
Dependent Variables: Change in For Hire Carriage Shares, 1987-92, 1992-97
OBC -0.090 -0.043 -0.103 -0.113(0.024) (0.049) (0.040) (0.040)
EVMS 0.149 0.183 0.147 0.159(0.028) (0.068) (0.052) (0.043)
N 2773 736 1019 1018
Dependent Variable: Change in For Hire Carriage Share, 1987-92
OBC -0.043 0.226 -0.087 -0.111(0.031) (0.066) (0.052) (0.052)
EVMS 0.048 -0.138 -0.017 0.157(0.043) (0.124) (0.019) (0.062)
N 3908 1115 1405 1388
Dependent Variable: Change in For Hire Carriage Share, 1992-97
OBC -0.087 -0.152 -0.116 -0.058(0.026) (0.055) (0.047) (0.040)
EVMS 0.171 0.125 0.193 0.157(0.029) (0.068) (0.054) (0.042)
N 4101 1097 1531 1473
SUR estimates.Includes all cohorts with positive number of observations in each relevant year.Cohorts weighted by Census' weighting factors times number of observations.
Specifications include change in trailer density and auto trailer and van dummies as controls.and allow the coefficient on the auto trailer and van dummy to vary across years to account for secular changes.

41
Table 5OBC Adoption and Asset Ownership – InteractionsMultitasking Tests
Dependent Variables: Change in For Hire Carriage Share
1987-92-97 1987-92 1992-97
OBC -0.010 0.033 0.009(0.036) (0.046) (0.034)
EVMS -0.066 -0.002 0.088(0.040) (0.057) (0.039)
OBC*(Food or Mixed Cargo) -0.141 -0.131 -0.241(0.054) (0.069) (0.060)
EVMS*(Food or Mixed Cargo) 0.142 0.065 0.164(0.062) (0.094) (0.064)
OBC*(Petroleum or Chemicals) -0.111 -0.091 -0.184(0.074) (0.101) (0.076)
EVMS*(Petroleum or Chemicals) 0.156 0.021 0.166(0.092) (0.171) (0.089)
N 2773 3908 4101
SUR estimates.Includes all cohorts with positive number of observations in each relevant year.Cohorts weighted by Census' weighting factors times number of observations.
Specifications include change in trailer density and auto trailer and van dummies as controls.and allow the coefficient on the auto trailer and van dummy to vary across years to account for secular changes.
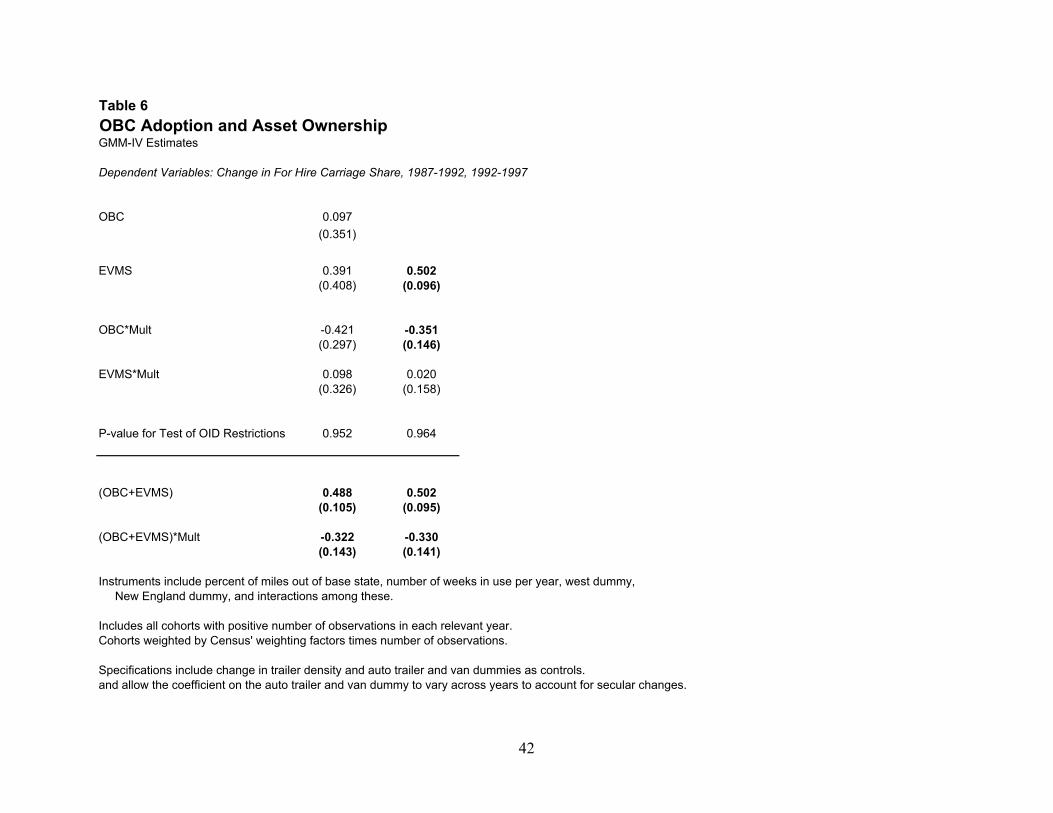
42
Table 6OBC Adoption and Asset OwnershipGMM-IV Estimates
Dependent Variables: Change in For Hire Carriage Share, 1987-1992, 1992-1997
OBC 0.097(0.351)
EVMS 0.391 0.502(0.408) (0.096)
OBC*Mult -0.421 -0.351(0.297) (0.146)
EVMS*Mult 0.098 0.020(0.326) (0.158)
P-value for Test of OID Restrictions 0.952 0.964
(OBC+EVMS) 0.488 0.502(0.105) (0.095)
(OBC+EVMS)*Mult -0.322 -0.330(0.143) (0.141)
Instruments include percent of miles out of base state, number of weeks in use per year, west dummy, New England dummy, and interactions among these.
Includes all cohorts with positive number of observations in each relevant year.Cohorts weighted by Census' weighting factors times number of observations.
Specifications include change in trailer density and auto trailer and van dummies as controls.and allow the coefficient on the auto trailer and van dummy to vary across years to account for secular changes.

43
Table 7OBC Diffusion and the Private Carriage Share
True Share
1987 1992 1997
50.1% 54.6% 51.7%
Estimated Share, Absent OBC Adoption
1987 1992 1997
Table 6 (Right Columns) 50.1% 54.2% 52.6%Table 7 (Right Column) 50.1% 59.7%

44
Table A1First-Stage Estimates: Adoption Equations
TR Adoption TR Adoption EVMS Adoption EVMS AdoptionDependent Variable: 1987-1992 1992-1997 1987-1992 1992-1997
West 0.039 -0.012 0.037 0.002(0.008) (0.012) (0.009) (0.015)
New England 0.015 -0.021 -0.024 0.012(0.028) (0.038) (0.029) (0.050)
Percent Out of Base State 0.061 -0.023 0.127 0.091(0.020) (0.025) (0.021) (0.032)
Weeks in Use 0.004 -0.002 0.007 -0.001(0.002) (0.002) (0.002) (0.003)
N = 2773
All specifications include distance, trailer, and product class dummies and the private carriage share.
Includes all cohorts with positive number of observations in each relevant year.Cohorts weighted by Census' weighting factors times number of observations.