Major infrastructure projects: costs and productivity …€¦ · · 2015-11-23Major...
71
Major infrastructure projects: costs and productivity issues Australian Constructors Association 7 March 2014
Transcript of Major infrastructure projects: costs and productivity …€¦ · · 2015-11-23Major...
Major infrastructure projects: costs and productivity issues Australian Constructors Association
7 March 2014
Major infrastructure projects: costs and productivity issues
Liability limited by a scheme approved under Professional Standards Legislation. Deloitte refers to one or more of Deloitte Touche Tohmatsu Limited, a UK private company limited by guarantee, and its network of member firms, each of which is a legally separate and independent entity. Please see www.deloitte.com/au/about for a detailed description of the legal structure of Deloitte Touche Tohmatsu Limited and its member firms. © 2014 Deloitte Access Economics Pty Ltd
Contents Glossary ..................................................................................................................................... i
Executive Summary .................................................................................................................... i
1 Introduction .................................................................................................................... 5
2 The macroeconomic landscape for construction costs ..................................................... 6
3 The impact of booming demand .................................................................................... 10
3.1 Construction costs and wages ......................................................................................... 10
3.2 Construction productivity ................................................................................................ 13
3.3 ACA members’ views....................................................................................................... 14
4 Construction costs – EBAs ............................................................................................. 19
5 Construction costs – inputs and processes .................................................................... 27
5.1 Road and bridge construction costs ................................................................................. 27
5.2 Specific road and bridge construction processes and input costs ..................................... 31
5.3 ACA members’ views on equipment and materials costs ................................................. 36
6 Construction costs – major projects .............................................................................. 41
7 Construction costs – international comparison .............................................................. 46
7.2 ACA members’ views....................................................................................................... 52
8 Industrial disputes ......................................................................................................... 54
8.1 Broad trends in disputes ................................................................................................. 54
8.2 ACA members’ views and experiences ............................................................................. 57
9 Conclusions ................................................................................................................... 61
References .............................................................................................................................. 63
Limitation of our work ............................................................................................................... 65
Charts Chart 2.1 : Engineering construction as a share of GDP............................................................. 6
Chart 2.2 : Underlying business investment as a share of GDP ................................................... 7
Chart 2.3 : Value of work commenced, resources and non-resources, rolling annual sum ......... 8
Chart 3.1 : Engineering construction costs relative to consumer prices ................................... 10
Chart 3.2 : Engineering construction implicit price deflator, private and public sector ............ 12
Chart 3.3 : Construction wages relative to all wages ............................................................... 12
Chart 3.4 : Construction labour productivity relative to all industry labour productivity ......... 14
Chart 3.5 : Cost shares for public infrastructure projects (%) .................................................. 15
Chart 4.1 : Construction wages growth – WPI and EBAs ......................................................... 19
Chart 4.2 : All industries wages growth – WPI and EBAs .......................................................... 20
Chart 4.3 : EBA and WPI growth over time – construction vs all industries .............................. 21
Chart 4.4 : The ‘EBA gap’ – growth in EBA wages minus growth in WPI ................................... 22
Chart 4.5 : The ‘EBA gap’ by industry, 1997-2013 .................................................................... 23
Chart 4.6 : EBA wage increase, construction vs heavy and civil engineering ............................. 24
Chart 4.7 : EBA wage increase by State, heavy and civil engineering, 2007-2013 ..................... 25
Chart 4.8 : EBA wage increase by union, heavy and civil engineering, 2007-2013 .................... 26
Chart 5.1 : Measures of engineering, road and bridge construction price inflation ................. 28
Chart 5.2 : BITRE road construction and maintenance price index – input shares (%).............. 29
Chart 5.3 : Standard deviation of cost growth for road construction price inputs.................... 31
Chart 5.4 : Price of two lane city highway/freeway and conventional bridge (% annual change)32
Chart 5.5 : Price of excavation and road works (% annual change) .......................................... 33
Chart 5.6 : Price of selected bridgeworks components (% annual change) .............................. 34
Chart 5.7 : Price of bridge reinforcement (% annual change) .................................................. 35
Chart 5.8 : Growth in equipment hire rates (% annual change) ............................................... 36
Chart 6.1 : Average change in cost of completed infrastructure projects ................................ 43
Chart 7.1 : Thermal coal – capital spend to build a tonne of new capacity .............................. 46
Chart 7.2 : Iron ore – Capital spend to build a tonne of new capacity ..................................... 47
Chart 7.3 : International building costs per m2 of internal area – airports, 2013 (USD) ............ 48
Chart 7.4 : International building costs per m2 of internal area – airports, 2013 (PPP)............. 49
Chart 7.5 : Regional comparison of tunnel cost per metre ...................................................... 50
Chart 7.6 : Regional comparison of tunnel cost per cubic metre ............................................. 50
Chart 7.7 : Regional comparison of tunnel cost per metre: transportation .............................. 51
Chart 8.1 : Industrial disputes in the construction industry ..................................................... 54
Chart 8.2 : Industrial disputes across all industries ................................................................. 55
Chart 8.3 : Trade union share of workforce ............................................................................. 56
Chart 8.4 : Working days lost per quarter by sector, average 2008 to 2013 ............................ 57
Chart 9.1 : Australia’s capital stock ......................................................................................... 62
Tables Table 3.1 : Cost shares for public infrastructure projects (%) ................................................... 16
Table 3.2 : Cost change for infrastructure projects over the past two years, 2011 to 2013 (%) . 16

Table 3.3 : Cost change for infrastructure projects over the past five years, 2008 to 2013 (%) . 16
Table 5.1 : Movements in BITRE road construction price index inputs .................................... 29
Table 5.2 : Contribution to movements in BITRE road construction price index (%-points)...... 30
Table 6.1 : Major engineering construction projects completed by year ................................. 42
Table 6.2 : Major engineering construction projects completed by value................................ 44
Table 6.3 : Largest engineering construction projects still underway with cost over-runs ....... 45
Major infrastructure projects: costs and productivity issues
Deloitte Access Economics Commercial-in-confidence
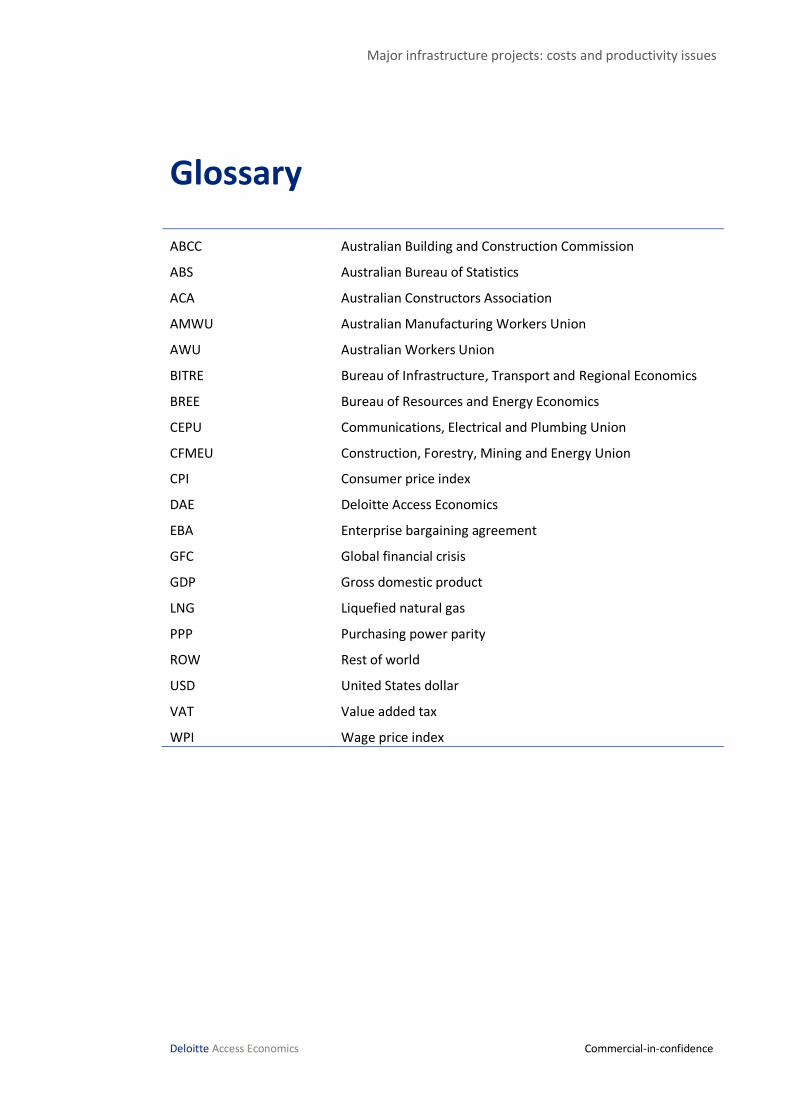
Glossary
ABCC Australian Building and Construction Commission
ABS Australian Bureau of Statistics
ACA Australian Constructors Association
AMWU Australian Manufacturing Workers Union
AWU Australian Workers Union
BITRE Bureau of Infrastructure, Transport and Regional Economics
BREE Bureau of Resources and Energy Economics
CEPU Communications, Electrical and Plumbing Union
CFMEU Construction, Forestry, Mining and Energy Union
CPI Consumer price index
DAE Deloitte Access Economics
EBA Enterprise bargaining agreement
GFC Global financial crisis
GDP Gross domestic product
LNG Liquefied natural gas
PPP Purchasing power parity
ROW Rest of world
USD United States dollar
VAT Value added tax
WPI Wage price index
i Commercial-in-Confidence
Deloitte Access Economics
Executive Summary This report seeks to provide some evidence in relation to construction sector costs and productivity in the delivery of public infrastructure projects to inform the current Productivity Commission inquiry. Deloitte Access Economics has utilised a range of publicly available information and our own analysis in compiling this report, along with responses from ACA members to a questionnaire focusing on a range of cost and productivity issues.
Australia’s construction costs rose rapidly and notably compared to other costs in the past decade. Did that happen because Australia had a large construction cycle over that period?
Or are there other factors also at play?
Engineering construction costs have risen relative to other costs over time. That was especially true from 2003 to 2008 amid a surge in demand that generated a relative swing in costs of more than 20%. The peak in relative engineering construction costs within Australia came just after the global financial crisis (GFC) hit, with a partial unwinding since then.
Moreover, the evidence shows that:
Labour costs are an important component of overall engineering construction costs. Construction wages relative to all sectors also grew notably as major project investment activity in Australian increased.
Business investment as a share of the economy has reached a peak and is now starting to moderate. There has also been some moderation in construction costs relative to general prices. However, it is materials costs which have been largely responsible for that moderation (assisted through to mid-2013 by a high $A reducing the local cost of imported materials and equipment). There has been no pull-back in construction sector wage growth relative to other sectors.
There is some sign that construction sector productivity rose relative to other sectors from 2004 to mid-2012. However, since mid-2012 that productivity boost has been fading (in large part because measured productivity moves with the economic cycle), while the increase in relative construction wages has not.
Hence there has been more going on in engineering construction costs – particularly wages – than just the demand cycles of the past decade.
A key concern for the Australian economy is therefore that the temporary boost to demand provided over recent years via the sharp lift in major project activity may have given rise to something which appears more permanent in terms of a higher construction cost base.
Moreover, the rate of engineering construction cost increase has been notably higher for public sector projects than private sector projects. That is despite the fact that the overwhelming strength in demand since 2009 has been from resources investment, rather than infrastructure investment – a development also consistent with the view that demand isn’t the only factor in play here.
ii Commercial-in-Confidence
Deloitte Access Economics
Enterprise bargaining agreements (EBAs)
This conclusion is backed up by an examination of EBAs (where union impacts are more evident) relative to the wage price index (WPI) for construction. Patterns in wage growth under EBAs point to effects in construction wages over and above the impact of demand cycles. In fact wage rises from EBAs have grown faster than wages in general to a much greater extent in the construction sector than in any other sector. In addition, the period over which this gap has appeared in construction wages shows three distinct phases:
There were steady relative gains in EBA wage outcomes up until the Cole Royal Commission of the early 2000s.
Those gains then slowed through to the change of Federal Government in late 2007.
Since then these relative gains in EBA wage outcomes have been more rapid than ever. Within this more recent period, the gains have been largest in Victoria.
So at a time when the construction cycle has moderated – and forecasters such as Deloitte Access Economics are actively warning of a ‘construction cliff’ – relative construction sector wages have not faded, and the premium paid through EBAs has continued a rapid climb.
In addition to wage outcomes through EBAs which have run ahead of other benchmarks, there often a range of other working conditions and clauses which are negotiated in agreements, and many of these are seen by ACA members as having a negative impact on productivity. This includes inflexible rosters and rostered days off, site access, restrictions on sub-contractors and a range of other matters.
Major project cost over-runs
Another feature of the sharp lift in engineering construction activity seen in Australia over recent years is that it has brought with it a lift in the average size of projects over time.
As individual engineering construction projects have adopted a larger scale, that has presented challenges for delivery and increased the potential for cost over-runs on projects. This is partly as larger projects tend to require more specialised project management, engineering and construction skills, which at times can be hard to find (particularly in times of strong construction demand as we have seen over recent years).
Data from the Deloitte Access Economics Investment Monitor database shows that on average, completed economic infrastructure projects have seen cost over-runs in seven of the past eight years, with that cost over-run averaging 6.5% (lower than for mining projects, but substantial nonetheless). These cost over-runs are particularly seen for larger projects ($1 billion +), where the degree of cost over-run has averaged 12.7%.
While overall engineering construction activity has now peaked, the tendency for cost over-runs on major projects has not yet run its course, with many projects currently underway showing substantial upward cost revisions relative to their initial cost estimates.
iii Commercial-in-Confidence
Deloitte Access Economics
International comparisons
Given the relative rise in engineering construction costs over time in Australia, and the observed tendency for cost over-runs on major projects, how does Australia compare in international comparisons of construction costs?
Many of the comparisons which have been done focus on resources projects rather than public infrastructure, though they do provide some guidance:
The Business Council of Australia (2012) stated that there were higher costs for resources projects constructed in Australia compared to the US Gulf Coast.
Analysis of capital expenditure required to deliver a tonne of new capacity in thermal coal and iron ore show that between 2007 and 2012 costs increased by substantially more in Australia than the rest of the world, opening up a sizeable gap in relative costs.
An international study on airport terminal construction ranks Australia as relatively expensive (based on an exchange rate benchmark similar to current levels for the $A), while an international study on tunnelling costs also showed Australia as among the most expensive countries.
In part, nominal exchange rate movements (specifically, the appreciation of the $A over this period) have played a role in this cost differential (as the comparison is made in $US). However, other factors have also been cited in these studies as being important. These include rising labour costs, changes to tax regimes, and environmental and other regulations, which can raise the cost of construction and project delivery.
While there are limitations in international comparisons of public infrastructure construction costs (including the use of exchange rates and data limitations), available evidence suggests Australia has a higher cost of construction for at least some specific types of infrastructure.
Industrial disputes
One element of that cost base which can be difficult to specifically quantify is the role of industrial disputes, and other on-site action which can affect productivity.
Over the past three decades, industrial disputes in the construction industry have generally trended down. By 2006, days lost per 1000 employees were observed to be near zero. Having settled at these record low levels for a number of years, there has been a shift in the overall trend, and the level of industrial disputes in the construction industry has trended up over the past five years.
ACA respondents were unanimous in stating that, the larger the project by value:
the greater the interest of unions, and
the greater the industrial relations risk, with industrial disputes more likely.
In addition, other on-site industrial actions (which may not be recorded as a dispute in the ABS statistics) were considered to be a source of pressure on project costs, but ACA respondents found it difficult to specifically quantify that cost.
iv Commercial-in-Confidence
Deloitte Access Economics
Conclusions
The shift upwards in engineering construction costs in Australia over recent years, and the persistence of higher costs – particularly wages – in the face of waning demand, will act as a barrier to infrastructure and resources projects in the pipeline going ahead. Those barriers are now combining with less favourable demand conditions to result in what may be a notable downturn in major project spending. Indeed, the slowdown in construction now beginning looks set to slow the growth in Australia’s capital base to the weakest seen in many decades.
That presents the potential for problems further down the track as the resultant decline in the pace of increase in Australia’s capital stock puts a barrier on future productivity growth for the nation.
Deloitte Access Economics
Major infrastructure projects: costs and productivity issues
5 Commercial-in-Confidence
Deloitte Access Economics
1 Introduction The Productivity Commission (the Commission) has been tasked with undertaking a broad-ranging inquiry into public infrastructure, comprising two broad streams of work:
the provision, funding, and financing of major public infrastructure; and
the scope for reducing the costs associated with such infrastructure.
The Australian Constructors Association (ACA) is providing a submission to the Commission’s inquiry and has asked Deloitte Access Economics to investigate a range of issues, focusing on costs, competitiveness and productivity in providing economic infrastructure.
This report seeks to provide some evidence in relation to construction sector costs and productivity in the delivery of public infrastructure projects. Key areas of analysis which follow in this report include:
movements in Australian construction costs over time (with a focus on engineering construction);
the broader demand environment influencing cost movements;
evidence of productivity gains over time;
movements in wage costs, with a focus on EBA outcomes;
trends in overall cost delivery for major projects;
international benchmarks; and
trends in industrial disputes.
Deloitte Access Economics has utilised a range of publicly available information and our own analysis in compiling this report.
In addition, Deloitte Access Economics also asked ACA members to respond to a questionnaire focusing on a range of these cost and productivity issues. Responses to the questionnaire are used within this report to supplement the analysis. Individual responses have been de-identified.
Major infrastructure projects: costs and productivity issues
6 Commercial-in-Confidence
Deloitte Access Economics
2 The macroeconomic landscape for construction costs This chapter outlines the macroeconomic environment for major construction projects in Australia over recent years.
Construction demand surged in Australia across the last decade. In the main it did so because the acceleration in the growth of China and other emerging economies across that period transformed global demand for industrial commodities such as the coal, iron ore, and other minerals that Australia produces, as well as our rich reserves of gas. That has spurred new investment in resources and related infrastructure.
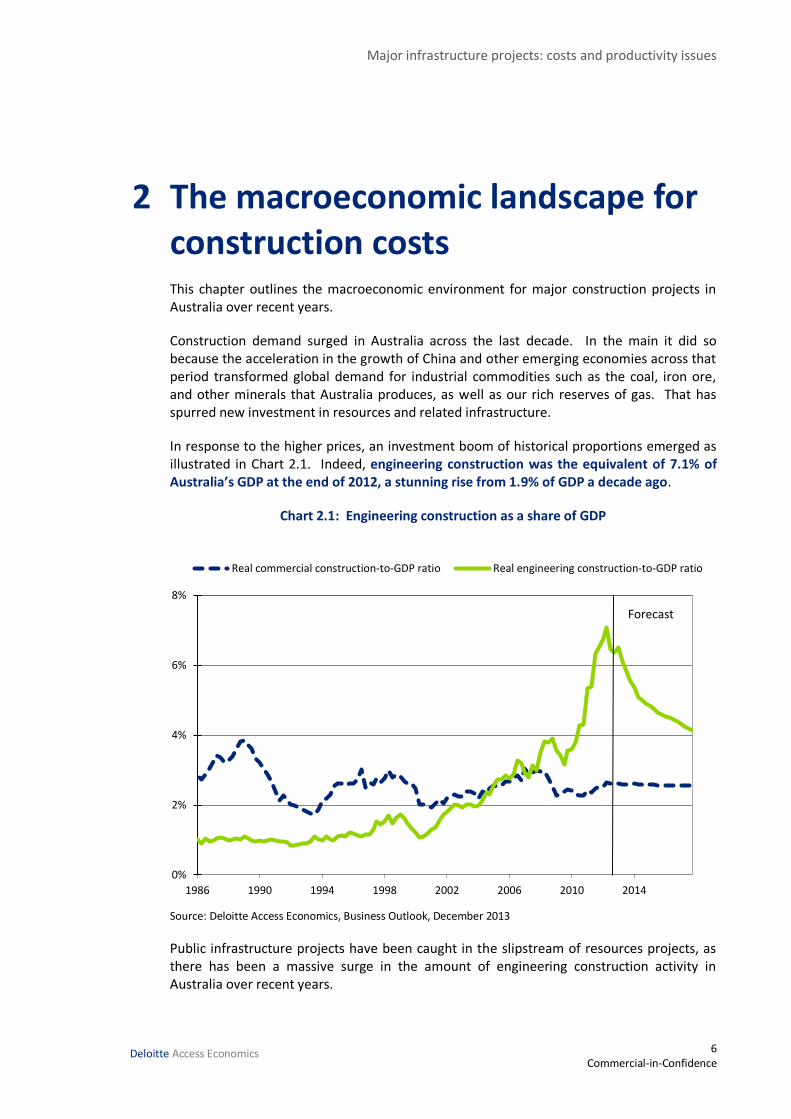
In response to the higher prices, an investment boom of historical proportions emerged as illustrated in Chart 2.1. Indeed, engineering construction was the equivalent of 7.1% of Australia’s GDP at the end of 2012, a stunning rise from 1.9% of GDP a decade ago.
Chart 2.1: Engineering construction as a share of GDP
Source: Deloitte Access Economics, Business Outlook, December 2013
Public infrastructure projects have been caught in the slipstream of resources projects, as there has been a massive surge in the amount of engineering construction activity in Australia over recent years.
0%
2%
4%
6%
8%
1986 1990 1994 1998 2002 2006 2010 2014
Real commercial construction-to-GDP ratio Real engineering construction-to-GDP ratio
Forecast
Major infrastructure projects: costs and productivity issues
7 Commercial-in-Confidence
Deloitte Access Economics
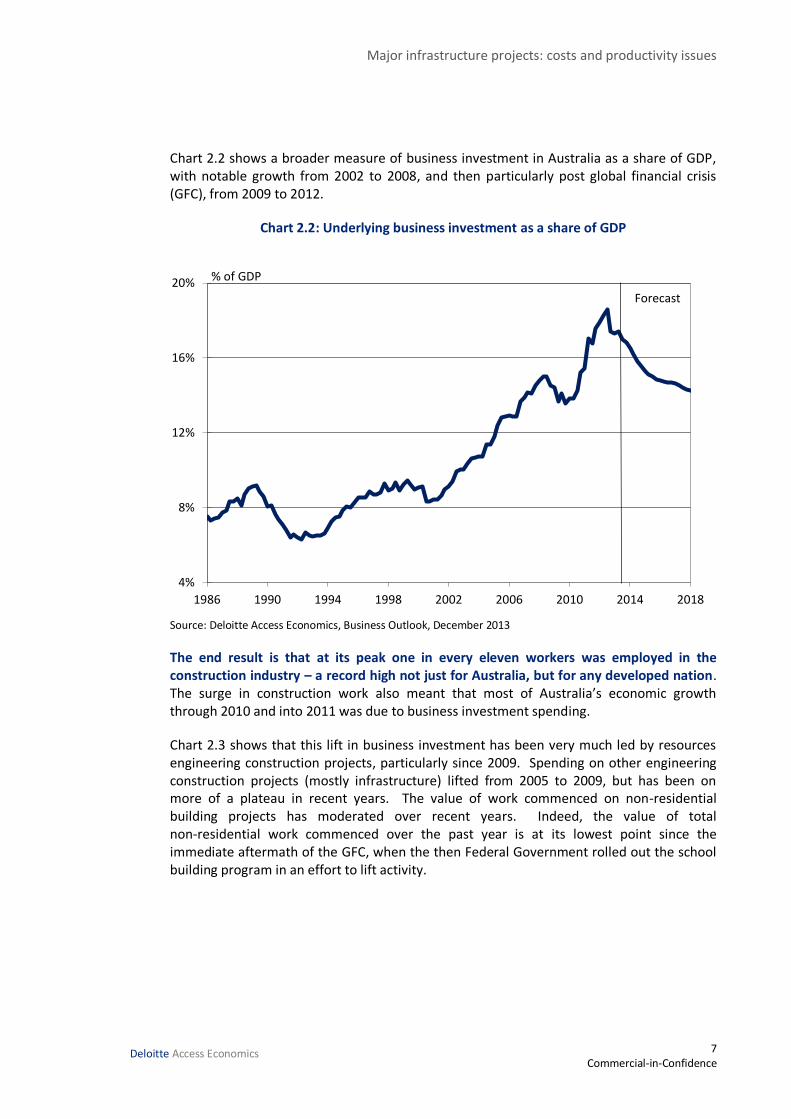
Chart 2.2 shows a broader measure of business investment in Australia as a share of GDP, with notable growth from 2002 to 2008, and then particularly post global financial crisis (GFC), from 2009 to 2012.
Chart 2.2: Underlying business investment as a share of GDP
Source: Deloitte Access Economics, Business Outlook, December 2013
The end result is that at its peak one in every eleven workers was employed in the construction industry – a record high not just for Australia, but for any developed nation. The surge in construction work also meant that most of Australia’s economic growth through 2010 and into 2011 was due to business investment spending.
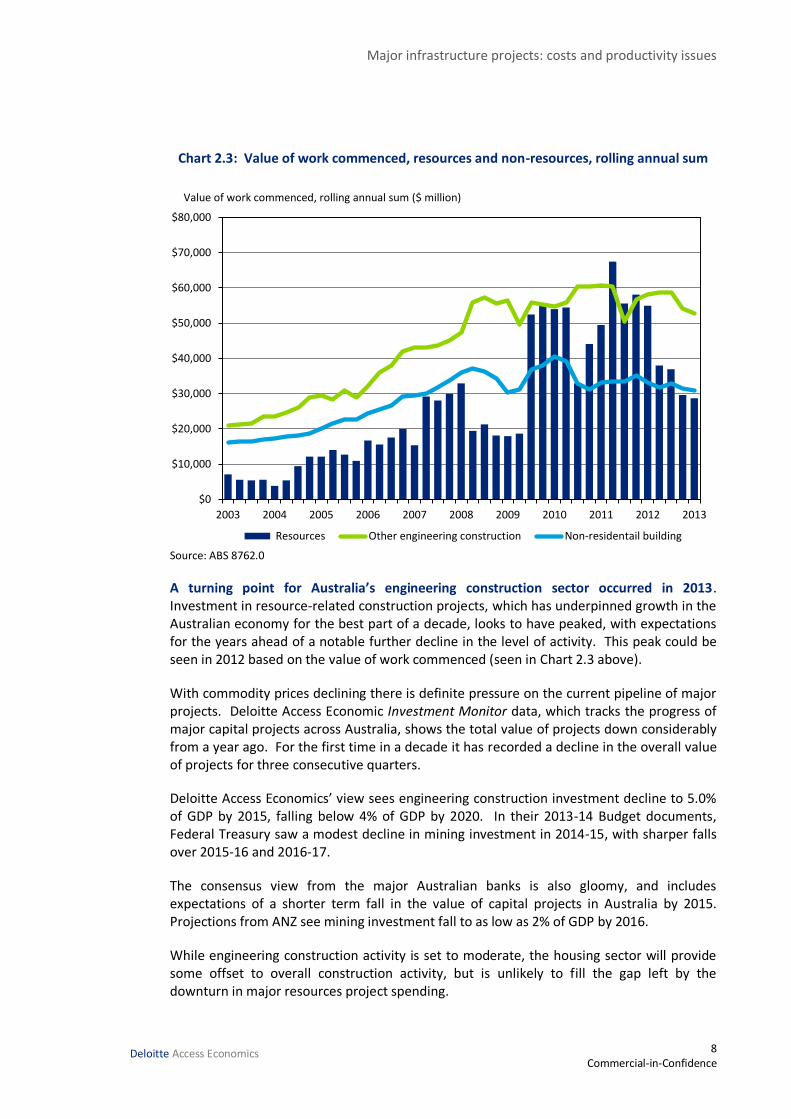
Chart 2.3 shows that this lift in business investment has been very much led by resources engineering construction projects, particularly since 2009. Spending on other engineering construction projects (mostly infrastructure) lifted from 2005 to 2009, but has been on more of a plateau in recent years. The value of work commenced on non-residential building projects has moderated over recent years. Indeed, the value of total non-residential work commenced over the past year is at its lowest point since the immediate aftermath of the GFC, when the then Federal Government rolled out the school building program in an effort to lift activity.
4%
8%
12%
16%
20%
1986 1990 1994 1998 2002 2006 2010 2014 2018
Forecast
% of GDP
Major infrastructure projects: costs and productivity issues
8 Commercial-in-Confidence
Deloitte Access Economics
Chart 2.3: Value of work commenced, resources and non-resources, rolling annual sum
Source: ABS 8762.0
A turning point for Australia’s engineering construction sector occurred in 2013. Investment in resource-related construction projects, which has underpinned growth in the Australian economy for the best part of a decade, looks to have peaked, with expectations for the years ahead of a notable further decline in the level of activity. This peak could be seen in 2012 based on the value of work commenced (seen in Chart 2.3 above).
With commodity prices declining there is definite pressure on the current pipeline of major projects. Deloitte Access Economic Investment Monitor data, which tracks the progress of major capital projects across Australia, shows the total value of projects down considerably from a year ago. For the first time in a decade it has recorded a decline in the overall value of projects for three consecutive quarters.
Deloitte Access Economics’ view sees engineering construction investment decline to 5.0% of GDP by 2015, falling below 4% of GDP by 2020. In their 2013-14 Budget documents, Federal Treasury saw a modest decline in mining investment in 2014-15, with sharper falls over 2015-16 and 2016-17.
The consensus view from the major Australian banks is also gloomy, and includes expectations of a shorter term fall in the value of capital projects in Australia by 2015. Projections from ANZ see mining investment fall to as low as 2% of GDP by 2016.
While engineering construction activity is set to moderate, the housing sector will provide some offset to overall construction activity, but is unlikely to fill the gap left by the downturn in major resources project spending.
$0
$10,000
$20,000
$30,000
$40,000
$50,000
$60,000
$70,000
$80,000
2003 2004 2005 2006 2007 2008 2009 2010 2011 2012 2013
Resources Other engineering construction Non-residentail building
Value of work commenced, rolling annual sum ($ million)
Major infrastructure projects: costs and productivity issues
9 Commercial-in-Confidence
Deloitte Access Economics
The ‘construction cliff’ is the kernel of Australia’s growth challenge through to late 2015. That downswing is being driven by a variety of factors, but costs – including financing costs – loom large among them.
Rising project costs for a number of recently completed projects and projects underway have firmed Australia’s reputation as a high cost place to do business. A consequence of that is likely to have been that a number of potential future Australian resources projects have been pushed further down the global development queue.
A series of major LNG projects have suffered from ongoing cost issues recently, with the $54 billion Gorgon LNG project in Western Australia (originally $43 billion at the time construction commenced in late 2009) leading the way. Other major LNG projects to suffer from upward cost revisions include the Ichthys LNG project in Darwin, Australia Pacific LNG project in Queensland, Curtis LNG project in Queensland and the Gladstone LNG project in Queensland, with combined costs growing by more than $16.8 billion since construction had commenced.
Other sectors have also suffered from major upward cost revision, with Investment Monitor data showing some recently completed projects in the coal sector significantly exceeding original cost expectations. Further information on cost upgrades over time is provided in Chapter 6.
The risk to the cost-effective delivery of public infrastructure projects, and for the Australian economy more broadly, is that the high cost environment for construction activity becomes entrenched, lasting well past the completion of the recent tranche of major resources projects.
Major infrastructure projects: costs and productivity issues
10 Commercial-in-Confidence
Deloitte Access Economics
3 The impact of booming demand A key concern for the Australian economy is that the temporary boost to demand over recent years via the sharp lift in major project activity may have given rise to something which appears more permanent in terms of a higher construction cost base.
A product of all ‘booms’ is an extended period where the demand for goods and services outpaces the supply of those goods and services. When this happens, that is, when demand (spending) runs ahead of supply (output), two things happen – prices lift, and supply starts to respond.
The recent boom for construction services – led by resource-related construction – saw the price of construction labour increase at rates above those for labour in other sectors. That is to be expected and is not necessarily a bad thing. Higher wages attract extra workers into the sector (the supply response) to fill skill shortages to support rising activity levels. Yet eventually those higher wages must be supported by greater levels of productivity for workers in the sector, otherwise those higher wages will end up as inflated prices.
3.1 Construction costs and wages
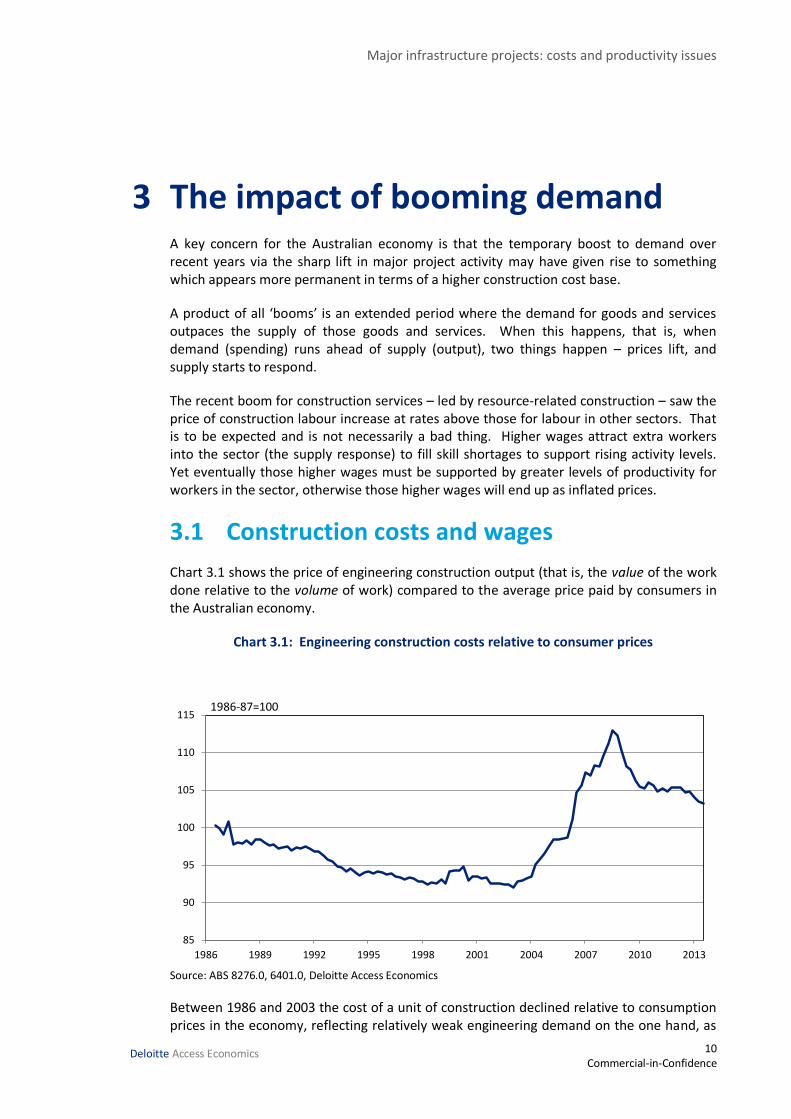
Chart 3.1 shows the price of engineering construction output (that is, the value of the work done relative to the volume of work) compared to the average price paid by consumers in the Australian economy.
Chart 3.1: Engineering construction costs relative to consumer prices
Source: ABS 8276.0, 6401.0, Deloitte Access Economics
Between 1986 and 2003 the cost of a unit of construction declined relative to consumption prices in the economy, reflecting relatively weak engineering demand on the one hand, as
85
90
95
100
105
110
115
1986 1989 1992 1995 1998 2001 2004 2007 2010 2013
1986-87=100
Major infrastructure projects: costs and productivity issues
11 Commercial-in-Confidence
Deloitte Access Economics
well as the effects of innovation, improving work practices and changed regulation of industrial relations. There was a minor deviation in the trends during the pre-Olympic Games period as demand briefly lifted.
However, once the resources investment boom began to drive up demand for construction in the sector, prices began to rise very rapidly, surging by 20% more than underlying price measures across the five years to mid-2008.
That reflects the increase in construction activity generated by the commodity price boom, and the shortage of labour and materials that occurred. Although the shortages themselves were focused on certain States (Western Australia in particular), and in certain sectors (construction and mining), prices for engineering construction work rose across the country in a fairly consistent manner.
The rapid deterioration in global economic conditions, including the slump in some commodity prices from mid-2008, led to a sharp drop in commercial construction costs – illustrating how rapidly the impacts of supply shortages on materials can dissipate.
The recent upturn in engineering construction activity, post-GFC, has not seen the same surge in relative construction costs as was seen pre-GFC. However, as Chart 3.1 shows, relative costs have remained at a higher level than the longer term trend.
The recent surge in construction activity is somewhat different to the previous. Resources projects in the current tranche are generally larger in size, with a large share in the emerging LNG sector. Those LNG projects have a large import component in their cost base, essentially receiving a discount from a higher $A, and providing a partial offset to the lift in the costs of labour and materials from the up-turn in activity. Yet, the overall level of engineering construction costs has remained reasonably high relative to consumer prices.
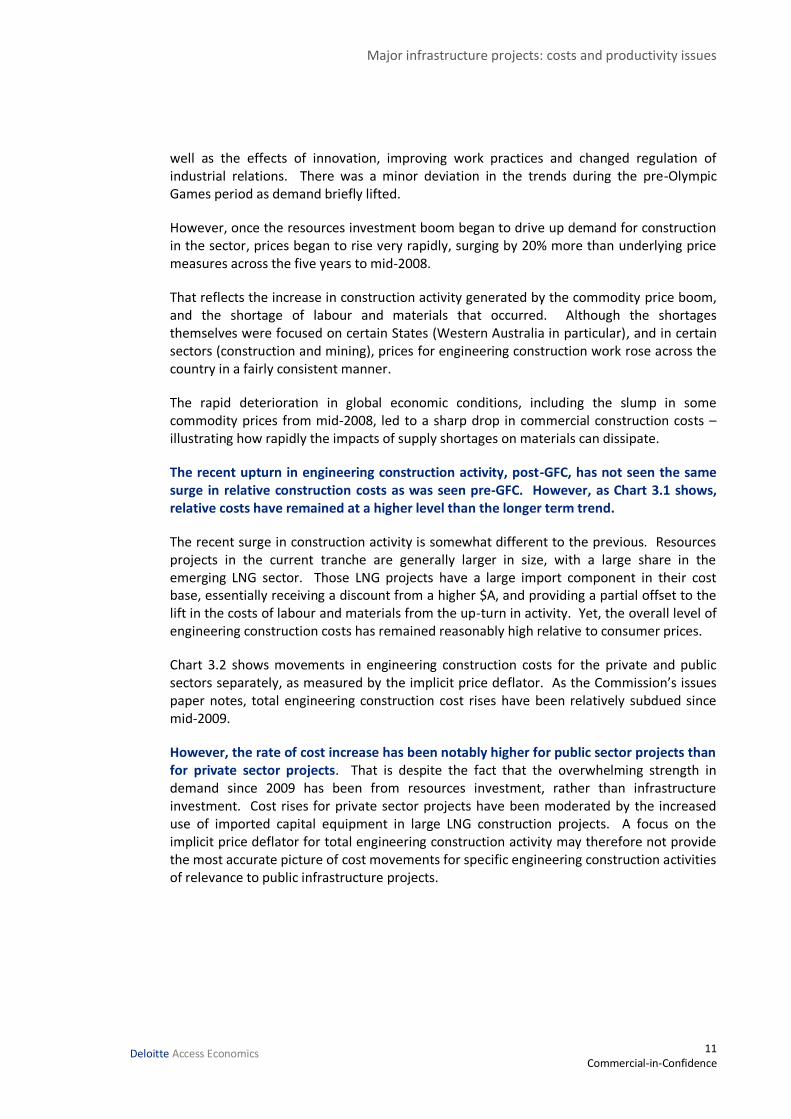
Chart 3.2 shows movements in engineering construction costs for the private and public sectors separately, as measured by the implicit price deflator. As the Commission’s issues paper notes, total engineering construction cost rises have been relatively subdued since mid-2009.
However, the rate of cost increase has been notably higher for public sector projects than for private sector projects. That is despite the fact that the overwhelming strength in demand since 2009 has been from resources investment, rather than infrastructure investment. Cost rises for private sector projects have been moderated by the increased use of imported capital equipment in large LNG construction projects. A focus on the implicit price deflator for total engineering construction activity may therefore not provide the most accurate picture of cost movements for specific engineering construction activities of relevance to public infrastructure projects.
Major infrastructure projects: costs and productivity issues
12 Commercial-in-Confidence
Deloitte Access Economics
Chart 3.2: Engineering construction implicit price deflator, private and public sector
Source: ABS 8762.0
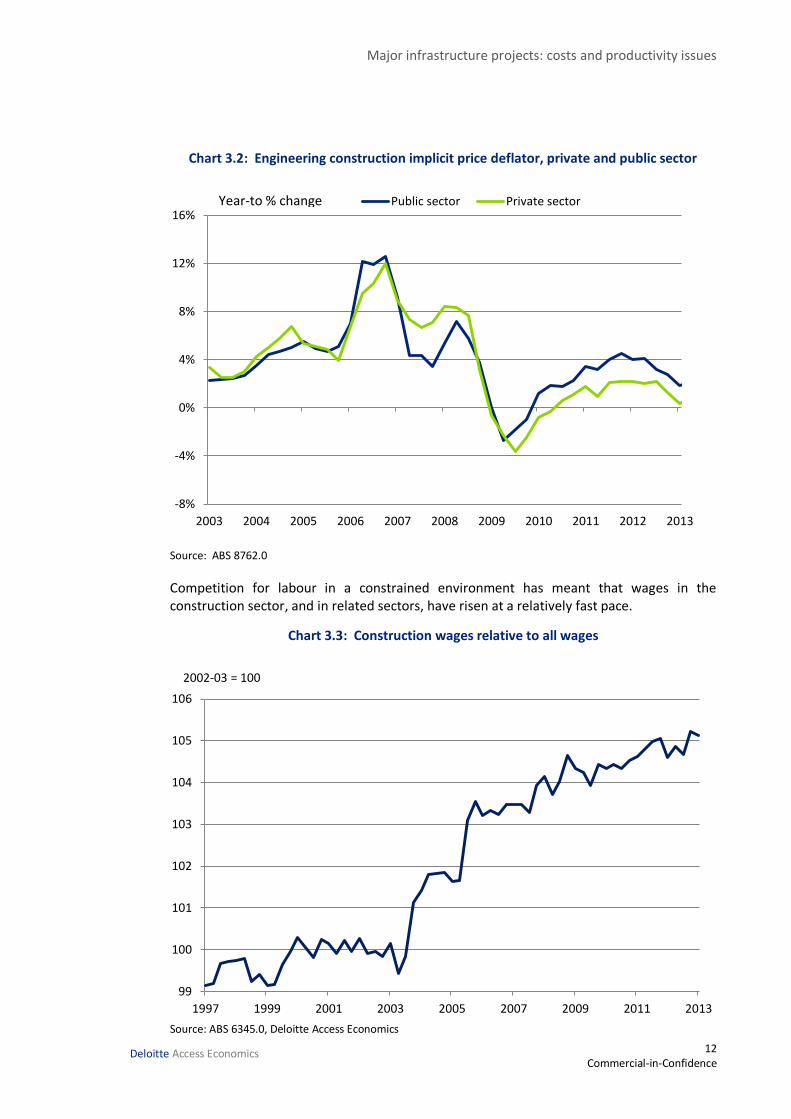
Competition for labour in a constrained environment has meant that wages in the construction sector, and in related sectors, have risen at a relatively fast pace.
Chart 3.3: Construction wages relative to all wages
Source: ABS 6345.0, Deloitte Access Economics
-8%
-4%
0%
4%
8%
12%
16%
2003 2004 2005 2006 2007 2008 2009 2010 2011 2012 2013
Public sector Private sectorYear-to % change
99
100
101
102
103
104
105
106
1997 1999 2001 2003 2005 2007 2009 2011 2013
2002-03 = 100
Major infrastructure projects: costs and productivity issues
13 Commercial-in-Confidence
Deloitte Access Economics
Chart 3.3 looks at construction wages relative to all wages, using the best general measure of labour costs – the Wage Price Index produced by the Australian Bureau of Statistics (ABS). As the chart shows, although relative construction wages took off at about the same time as relative construction costs more generally, they have not seen a subsequent partial retracing of those gains.
However, shifts in wages and cost relativities are rarely permanent. By way of a general backdrop to understanding wage growth over time, note that growth rates in the costs of materials and labour across different industries should not differ much in the longer term.
That is because, if trends in price or wage growth became too different over time, then capital and labour would move to those areas where the return to that capital and labour is higher, effectively increasing supply so as to limit those divergences once more.
However, many of these ‘equilibrating factors’ can be very slow to operate, meaning that divergences in wage growth across industries can potentially persist for long periods. And the current industrial relations structure in Australia acts as a further barrier to these factors self-correcting. That is not so much a factor when demand is high as output and productivity growth generally keep pace (or exceed) growth in wages. But when activity falls, wages can be upwardly sticky if negotiated in broad based, rigid agreements – enterprise bargaining agreement (EBA) wage outcomes relative to broader wage outcomes are discussed in detail in the next chapter.
3.2 Construction productivity
Although relative construction wages took off at about the same time as relative construction costs more generally, they have not seen a subsequent partial retracing of those gains.
Could that be due to a good productivity performance? Chart 3.4 offers some partial support to that. It shows labour productivity in the construction sector relative to that in the Australian economy more generally.
Major infrastructure projects: costs and productivity issues
14 Commercial-in-Confidence
Deloitte Access Economics
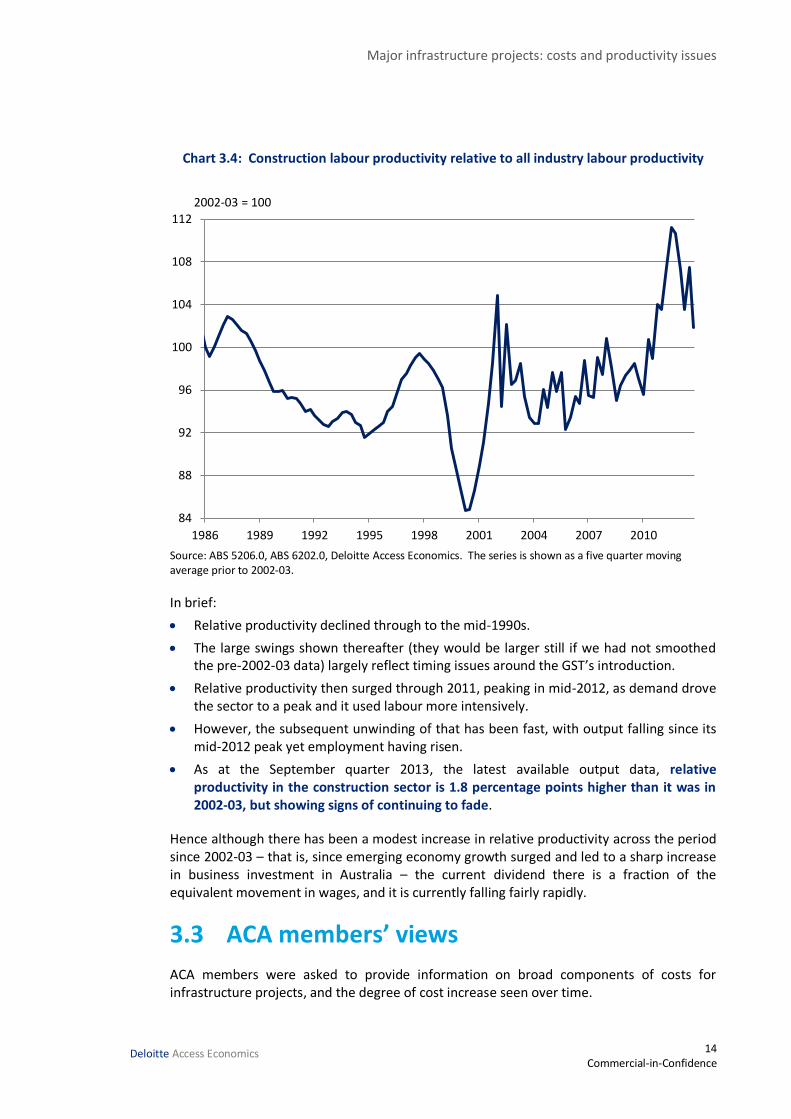
Chart 3.4: Construction labour productivity relative to all industry labour productivity
Source: ABS 5206.0, ABS 6202.0, Deloitte Access Economics. The series is shown as a five quarter moving average prior to 2002-03.
In brief:
Relative productivity declined through to the mid-1990s.
The large swings shown thereafter (they would be larger still if we had not smoothed the pre-2002-03 data) largely reflect timing issues around the GST’s introduction.
Relative productivity then surged through 2011, peaking in mid-2012, as demand drove the sector to a peak and it used labour more intensively.
However, the subsequent unwinding of that has been fast, with output falling since its mid-2012 peak yet employment having risen.
As at the September quarter 2013, the latest available output data, relative productivity in the construction sector is 1.8 percentage points higher than it was in 2002-03, but showing signs of continuing to fade.
Hence although there has been a modest increase in relative productivity across the period since 2002-03 – that is, since emerging economy growth surged and led to a sharp increase in business investment in Australia – the current dividend there is a fraction of the equivalent movement in wages, and it is currently falling fairly rapidly.
3.3 ACA members’ views
ACA members were asked to provide information on broad components of costs for infrastructure projects, and the degree of cost increase seen over time.
84
88
92
96
100
104
108
112
1986 1989 1992 1995 1998 2001 2004 2007 2010
2002-03 = 100
Major infrastructure projects: costs and productivity issues
15 Commercial-in-Confidence
Deloitte Access Economics
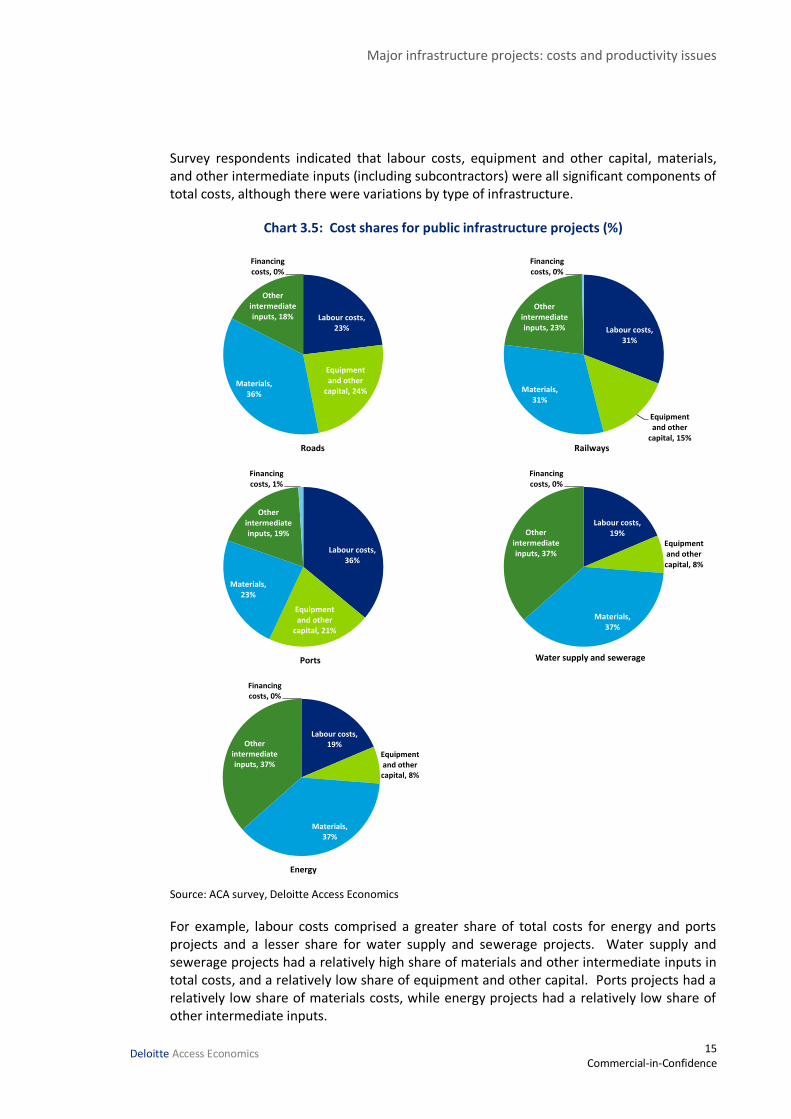
Survey respondents indicated that labour costs, equipment and other capital, materials, and other intermediate inputs (including subcontractors) were all significant components of total costs, although there were variations by type of infrastructure.
Chart 3.5: Cost shares for public infrastructure projects (%)
Source: ACA survey, Deloitte Access Economics
For example, labour costs comprised a greater share of total costs for energy and ports projects and a lesser share for water supply and sewerage projects. Water supply and sewerage projects had a relatively high share of materials and other intermediate inputs in total costs, and a relatively low share of equipment and other capital. Ports projects had a relatively low share of materials costs, while energy projects had a relatively low share of other intermediate inputs.
Labour costs, 23%
Equipment and other
capital, 24%Materials,
36%
Other intermediate inputs, 18%
Financing costs, 0%
Roads
Labour costs, 31%
Equipment and other
capital, 15%
Materials, 31%
Other intermediate inputs, 23%
Financing costs, 0%
Railways
Labour costs, 36%
Equipment and other
capital, 21%
Materials, 23%
Other intermediate inputs, 19%
Financing costs, 1%
Ports
Labour costs, 19%
Equipment and other capital, 8%
Materials, 37%
Other intermediate inputs, 37%
Financing costs, 0%
Water supply and sewerage
Labour costs, 19%
Equipment and other capital, 8%
Materials, 37%
Other intermediate inputs, 37%
Financing costs, 0%
Energy
Major infrastructure projects: costs and productivity issues
16 Commercial-in-Confidence
Deloitte Access Economics
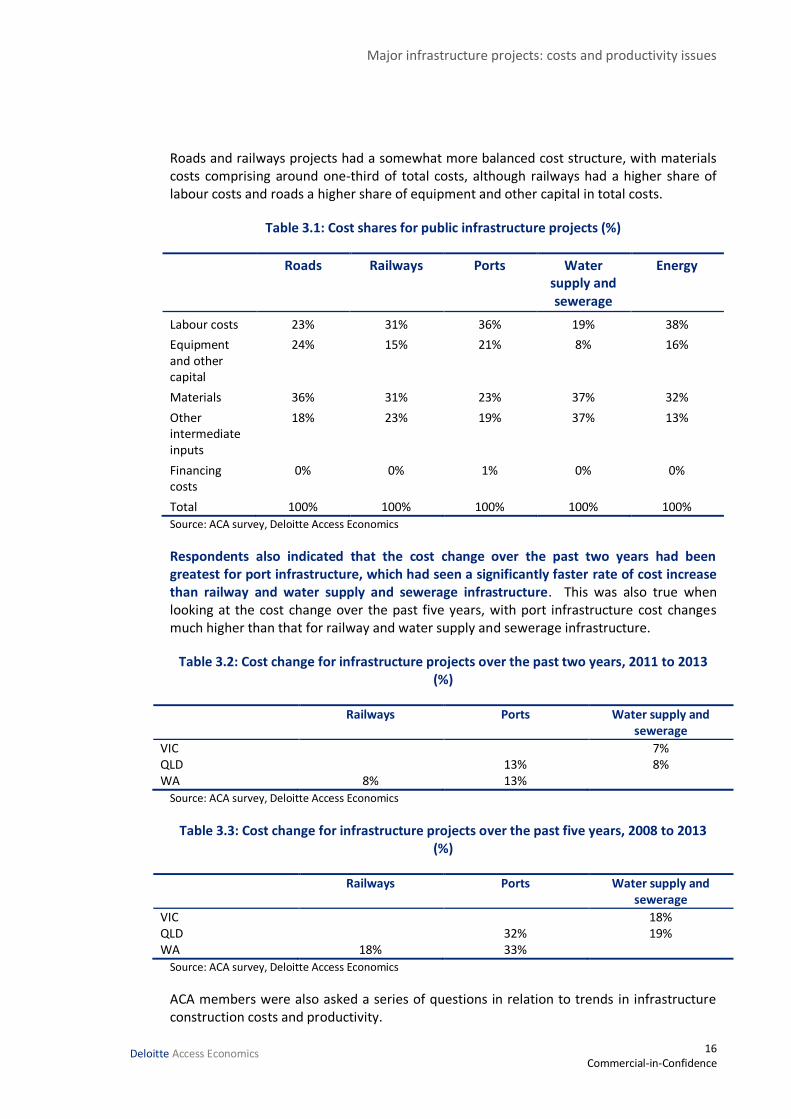
Roads and railways projects had a somewhat more balanced cost structure, with materials costs comprising around one-third of total costs, although railways had a higher share of labour costs and roads a higher share of equipment and other capital in total costs.
Table 3.1: Cost shares for public infrastructure projects (%)
Roads Railways Ports Water supply and sewerage
Energy
Labour costs 23% 31% 36% 19% 38%
Equipment and other capital
24% 15% 21% 8% 16%
Materials 36% 31% 23% 37% 32%
Other intermediate inputs
18% 23% 19% 37% 13%
Financing costs
0% 0% 1% 0% 0%
Total 100% 100% 100% 100% 100%
Source: ACA survey, Deloitte Access Economics
Respondents also indicated that the cost change over the past two years had been greatest for port infrastructure, which had seen a significantly faster rate of cost increase than railway and water supply and sewerage infrastructure. This was also true when looking at the cost change over the past five years, with port infrastructure cost changes much higher than that for railway and water supply and sewerage infrastructure.
Table 3.2: Cost change for infrastructure projects over the past two years, 2011 to 2013 (%)
Railways Ports Water supply and sewerage
VIC 7% QLD 13% 8% WA 8% 13%
Source: ACA survey, Deloitte Access Economics
Table 3.3: Cost change for infrastructure projects over the past five years, 2008 to 2013 (%)
Railways Ports Water supply and sewerage
VIC 18% QLD 32% 19% WA 18% 33%
Source: ACA survey, Deloitte Access Economics
ACA members were also asked a series of questions in relation to trends in infrastructure construction costs and productivity.
Major infrastructure projects: costs and productivity issues
17 Commercial-in-Confidence
Deloitte Access Economics
What are the major drivers of the increase in overall infrastructure construction costs seen in Australia?
Major drivers that were commonly cited by survey respondents were labour costs (including project design costs) which have increased in excess of CPI, and fluctuations in materials costs. One respondent stated that some contractors had absorbed these cost increases in a competitive market, while others had sourced prefabricated assemblies from Asia which had lowered overall construction cost pressure. Similarly another respondent indicated that vendor margins and opportunistic pricing reflected market conditions which vary as the market conditions change.
Other drivers stated by some respondents included rising regulatory / permit requirements, including environmental approvals and safety considerations; complex, expensive and long-duration procurement processes and layers of bureaucratic management, risk profile of projects and allocation of risk to contractor, contracts that had multiple tiers involved in the delivery of work, inappropriate bidding/procurement models, poor project planning, and the location of large projects which are often now in heavily urbanised areas requiring much greater traffic management, stakeholder/community provisions, work hour limitations, and noise constraints.
To what extent may the cost increases noted above be temporary rather than permanent? Why?
The majority of respondents expressed the view that the cost increases appeared to be permanent because the causes of the cost increases would not change without reform and change to existing practices and approaches.
To what extent have labour cost changes been supported by improvements in productivity?
The majority of respondents expressed a very clear view that increases in labour costs, including increased wages in Enterprise Bargaining Agreements, had not been supported by improvements in productivity.
What other factors have been significant in explaining labour cost growth?
Are there impediments that have dampened the potential labour productivity growth achievable? If so, what are they?
Respondents most commonly cited union activity and the prevailing industrial relations regime as the key factors driving labour cost growth and dampening the potential labour productivity growth achievable.
Specifically, this related to the role of unions in negotiating agreements and rates, and the inclusion of clauses in agreements which were deemed to have a negative effect on productivity (e.g. inflexible rosters, lockdown RDOs, restrictions on inclement weather and the mandated engagement of non-working delegates), as well as inclusion of a clause which restricted a contractor’s ability to select and deploy sub-contractors (such as without union’s authorisation or requiring terms no less favourable for sub-contractors). Other
Major infrastructure projects: costs and productivity issues
18 Commercial-in-Confidence
Deloitte Access Economics
such clauses include allowing greater access to site by union officials and clauses legitimising stop work meetings.
One respondent stated that the bargaining and industrial action regime under the Fair Work Act and previous legislation had led to a general rule of thumb that all contractors must have in-term EBAs on all projects as a standard risk mitigation strategy. The bargaining regime and this rule of thumb leads to employers accepting these conditions in order to secure projects.
Another respondent cited industry wide pattern bargaining where unions achieve common outcomes across different enterprises in the construction industry resulting in the adoption of standard agreements, or a specified wage increase. One respondent stated that unions were not prepared to reduce rates/conditions won in previous buoyant economic times. Similarly, another respondent stated that resistance by unions to embrace productivity was a factor, which had been exacerbated by the labour shortages experienced in Australia in recent years, particularly for energy/resources projects. Union demands for wage increases and financial incentives had been progressively increased over the past five years with demands widening to include higher increment percentages, an increase in frequency of pay increment increases and significant increases in demands for other employee incentive schemes and contributions.
Another respondent noted the union use of Occupational Health and Safety pretence as a tool for industrial action, increased strike action and the threat of strike action that is unlawful, and a widespread campaign to increase Right of Entry to site by union officials.
Other factors cited by respondents as driving up labour cost growth included the resources boom and the resultant labour and skill shortages, with fewer tradespeople and specialists available.
Major infrastructure projects: costs and productivity issues
19 Commercial-in-Confidence
Deloitte Access Economics
4 Construction costs – EBAs The previous chapter noted that overall construction sector wage growth has run ahead of that seen for the broader economy. There are also differences in wage outcomes within the construction sector. In particular, this chapter focuses on wage growth seen under enterprise bargaining agreements (EBAs) where union impacts are more evident, relative to the wage price index (WPI) for construction more broadly, looking at how wage outcomes have changed over time.
While the focus in this chapter is on wage increases from construction EBAs, wage agreements are far from the only item set out in EBAs. A range of other working conditions and clauses are included, and ACA members have noted that they see a number of clauses which are negotiated in agreements as having a negative impact on productivity, including through inflexible rosters and rostered days off, site access, restrictions on sub-contractors and a range of other matters.
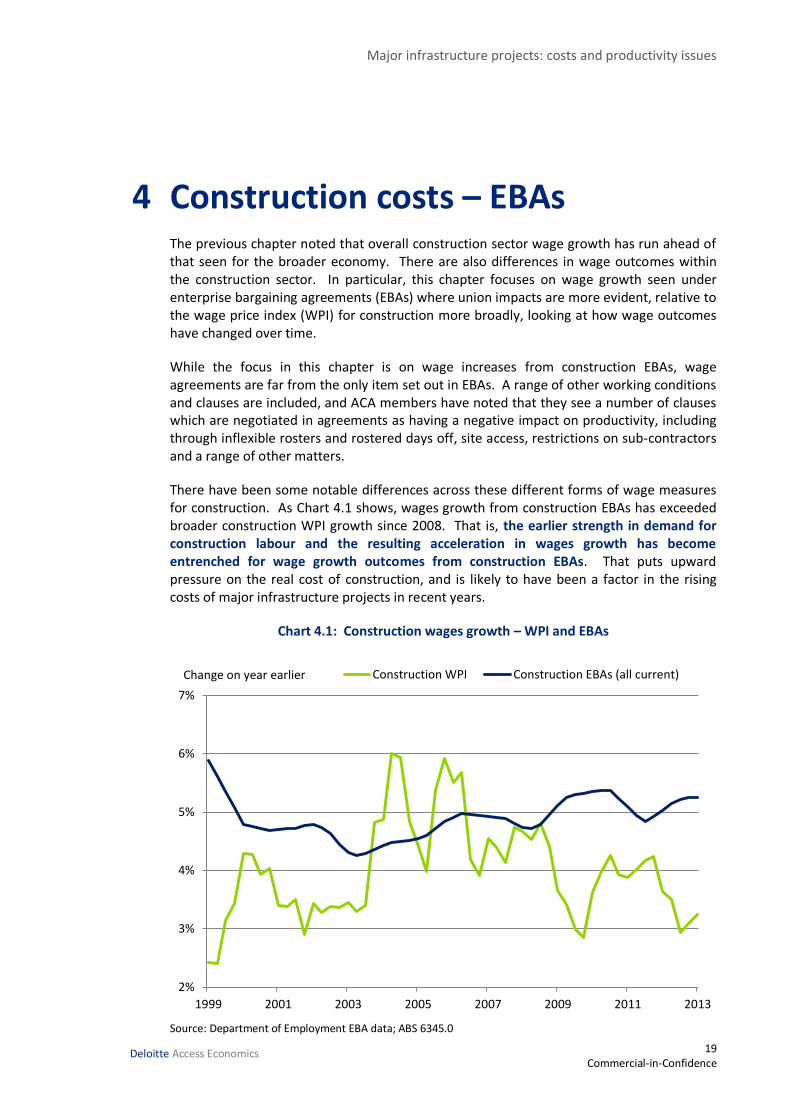
There have been some notable differences across these different forms of wage measures for construction. As Chart 4.1 shows, wages growth from construction EBAs has exceeded broader construction WPI growth since 2008. That is, the earlier strength in demand for construction labour and the resulting acceleration in wages growth has become entrenched for wage growth outcomes from construction EBAs. That puts upward pressure on the real cost of construction, and is likely to have been a factor in the rising costs of major infrastructure projects in recent years.
Chart 4.1: Construction wages growth – WPI and EBAs
Source: Department of Employment EBA data; ABS 6345.0
2%
3%
4%
5%
6%
7%
1999 2001 2003 2005 2007 2009 2011 2013
Construction WPI Construction EBAs (all current)Change on year earlier
Major infrastructure projects: costs and productivity issues
20 Commercial-in-Confidence
Deloitte Access Economics
It is true that across all industries EBA wage growth has tended to be faster than the equivalent WPI wage growth. EBA agreements cover about 22% of the broader workforce, as of September 2013.
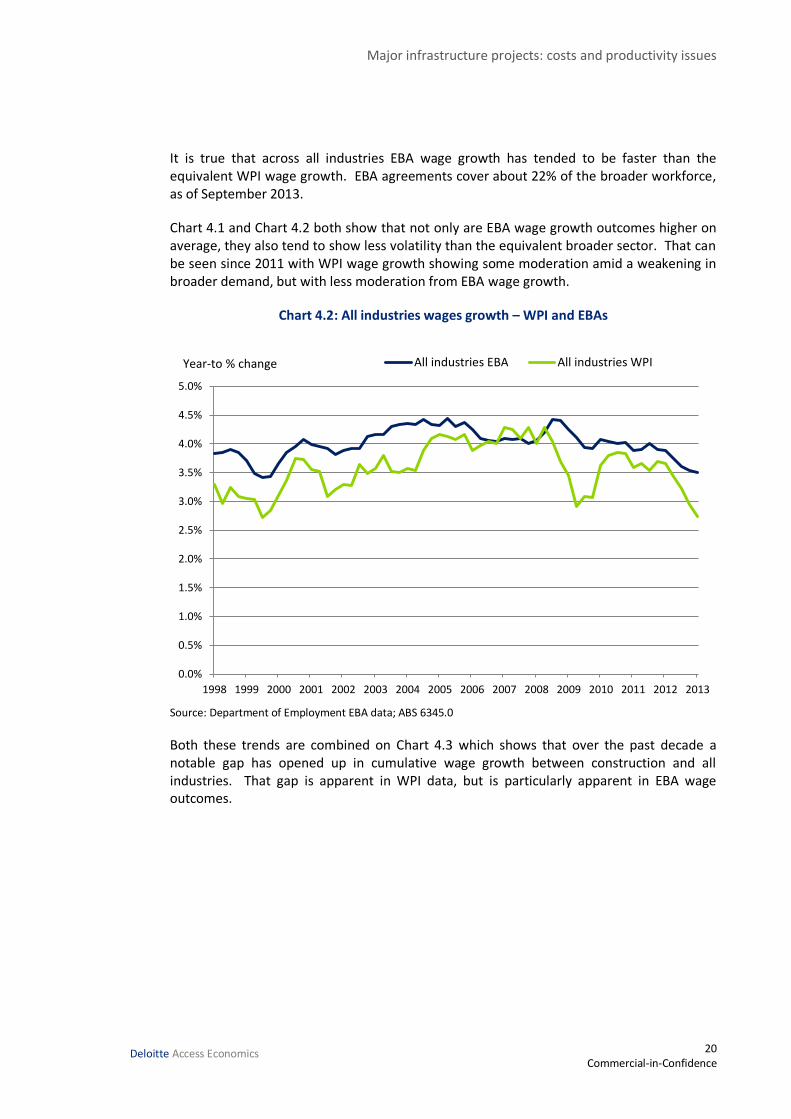
Chart 4.1 and Chart 4.2 both show that not only are EBA wage growth outcomes higher on average, they also tend to show less volatility than the equivalent broader sector. That can be seen since 2011 with WPI wage growth showing some moderation amid a weakening in broader demand, but with less moderation from EBA wage growth.
Chart 4.2: All industries wages growth – WPI and EBAs
Source: Department of Employment EBA data; ABS 6345.0
Both these trends are combined on Chart 4.3 which shows that over the past decade a notable gap has opened up in cumulative wage growth between construction and all industries. That gap is apparent in WPI data, but is particularly apparent in EBA wage outcomes.
0.0%
0.5%
1.0%
1.5%
2.0%
2.5%
3.0%
3.5%
4.0%
4.5%
5.0%
1998 1999 2000 2001 2002 2003 2004 2005 2006 2007 2008 2009 2010 2011 2012 2013
All industries EBA All industries WPIYear-to % change
Major infrastructure projects: costs and productivity issues
21 Commercial-in-Confidence
Deloitte Access Economics
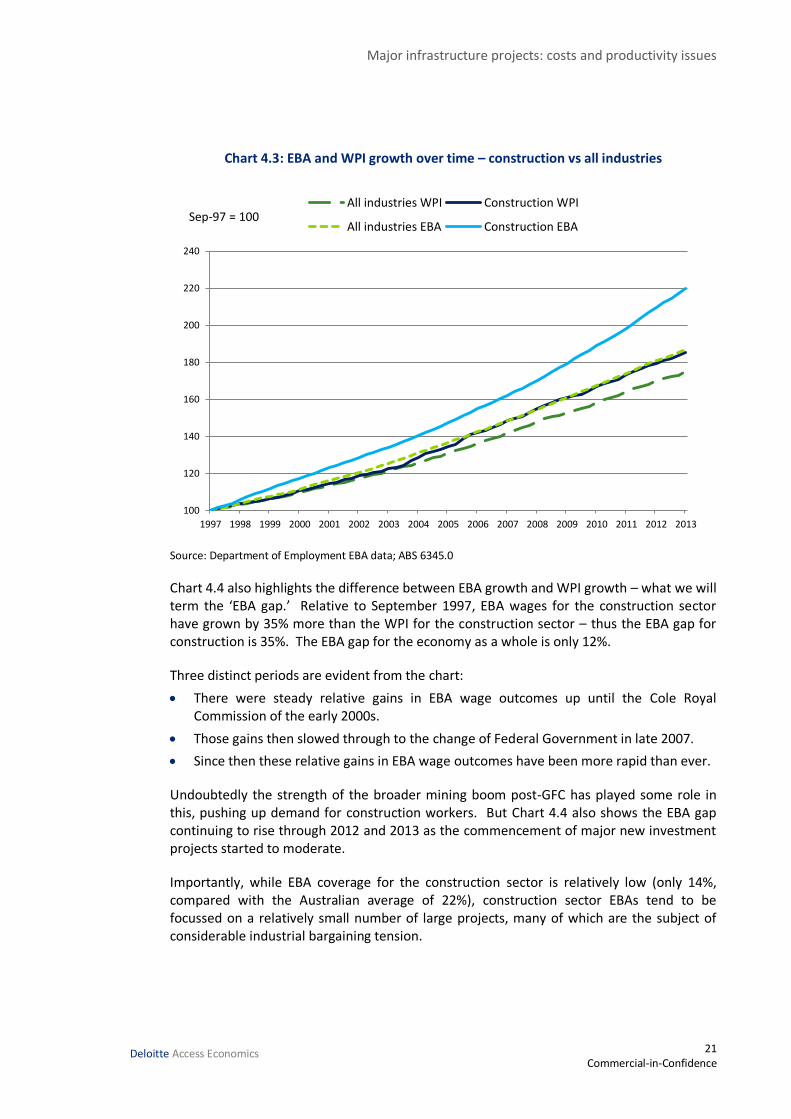
Chart 4.3: EBA and WPI growth over time – construction vs all industries
Source: Department of Employment EBA data; ABS 6345.0
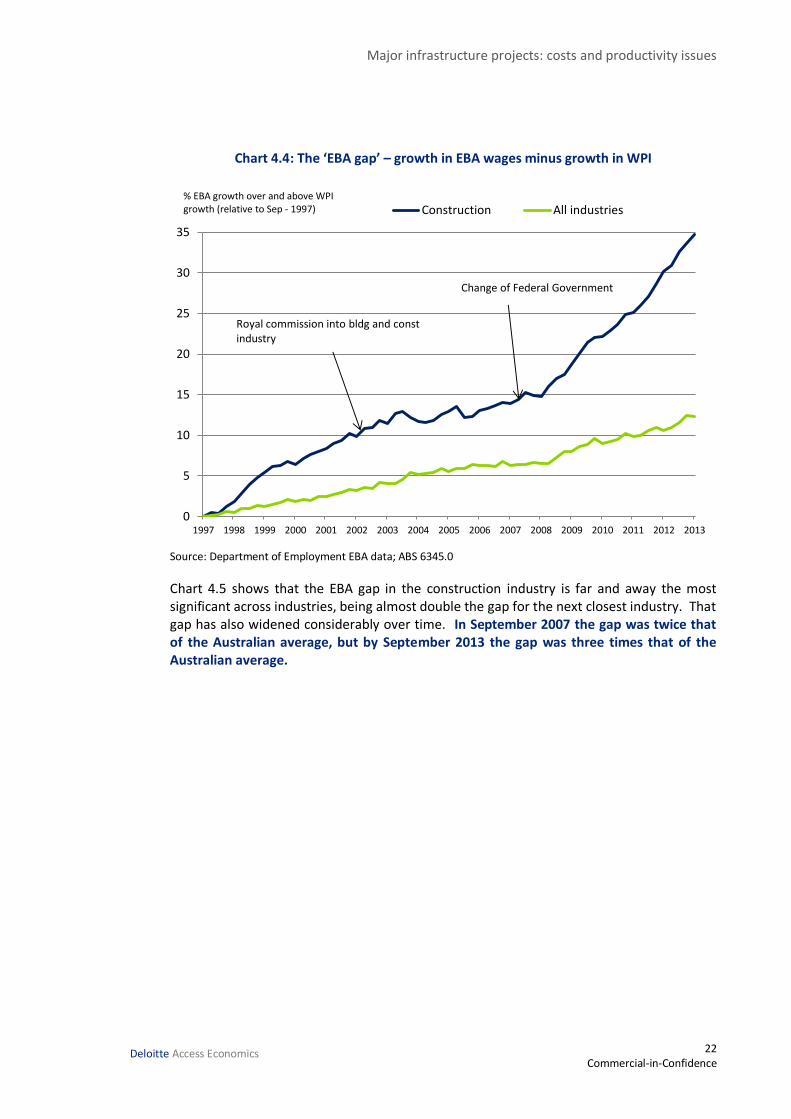
Chart 4.4 also highlights the difference between EBA growth and WPI growth – what we will term the ‘EBA gap.’ Relative to September 1997, EBA wages for the construction sector have grown by 35% more than the WPI for the construction sector – thus the EBA gap for construction is 35%. The EBA gap for the economy as a whole is only 12%.
Three distinct periods are evident from the chart:
There were steady relative gains in EBA wage outcomes up until the Cole Royal Commission of the early 2000s.
Those gains then slowed through to the change of Federal Government in late 2007.
Since then these relative gains in EBA wage outcomes have been more rapid than ever.
Undoubtedly the strength of the broader mining boom post-GFC has played some role in this, pushing up demand for construction workers. But Chart 4.4 also shows the EBA gap continuing to rise through 2012 and 2013 as the commencement of major new investment projects started to moderate.
Importantly, while EBA coverage for the construction sector is relatively low (only 14%, compared with the Australian average of 22%), construction sector EBAs tend to be focussed on a relatively small number of large projects, many of which are the subject of considerable industrial bargaining tension.
100
120
140
160
180
200
220
240
1997 1998 1999 2000 2001 2002 2003 2004 2005 2006 2007 2008 2009 2010 2011 2012 2013
All industries WPI Construction WPI
All industries EBA Construction EBASep-97 = 100
Major infrastructure projects: costs and productivity issues
22 Commercial-in-Confidence
Deloitte Access Economics
Chart 4.4: The ‘EBA gap’ – growth in EBA wages minus growth in WPI
Source: Department of Employment EBA data; ABS 6345.0
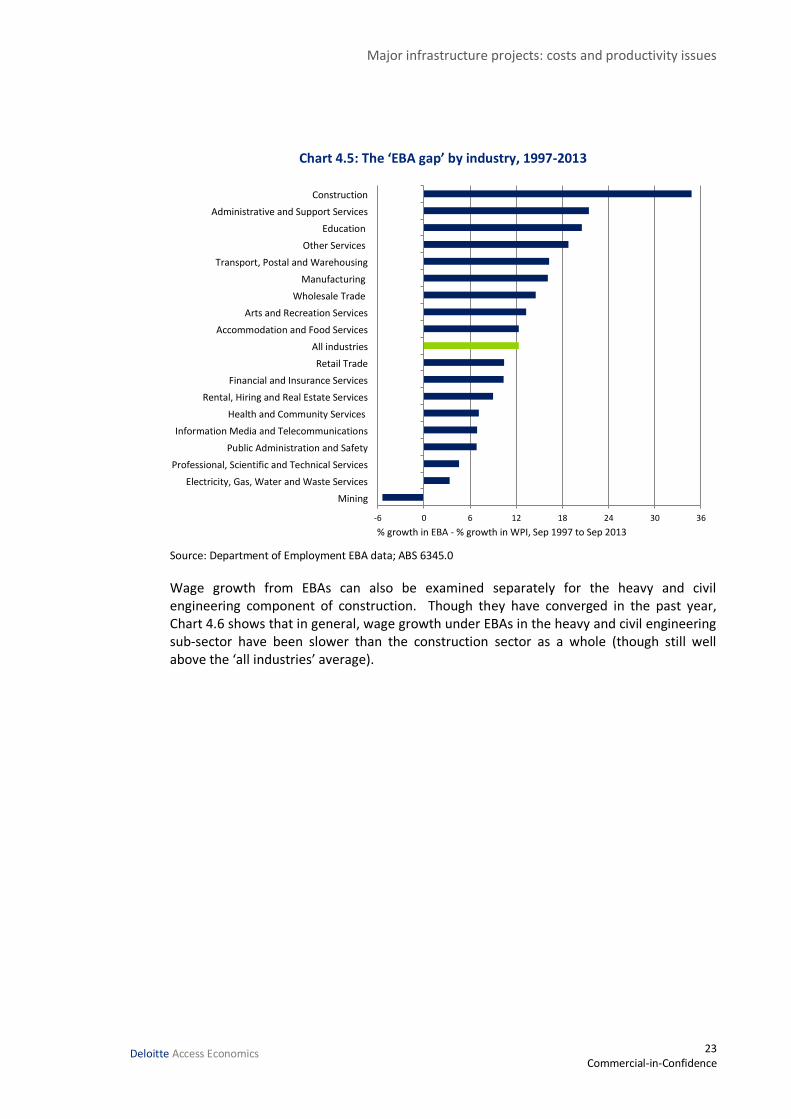
Chart 4.5 shows that the EBA gap in the construction industry is far and away the most significant across industries, being almost double the gap for the next closest industry. That gap has also widened considerably over time. In September 2007 the gap was twice that of the Australian average, but by September 2013 the gap was three times that of the Australian average.
0
5
10
15
20
25
30
35
1997 1998 1999 2000 2001 2002 2003 2004 2005 2006 2007 2008 2009 2010 2011 2012 2013
Construction All industries
Royal commission into bldg and const industry
% EBA growth over and above WPI growth (relative to Sep - 1997)
Change of Federal Government
Major infrastructure projects: costs and productivity issues
23 Commercial-in-Confidence
Deloitte Access Economics
Chart 4.5: The ‘EBA gap’ by industry, 1997-2013
Source: Department of Employment EBA data; ABS 6345.0
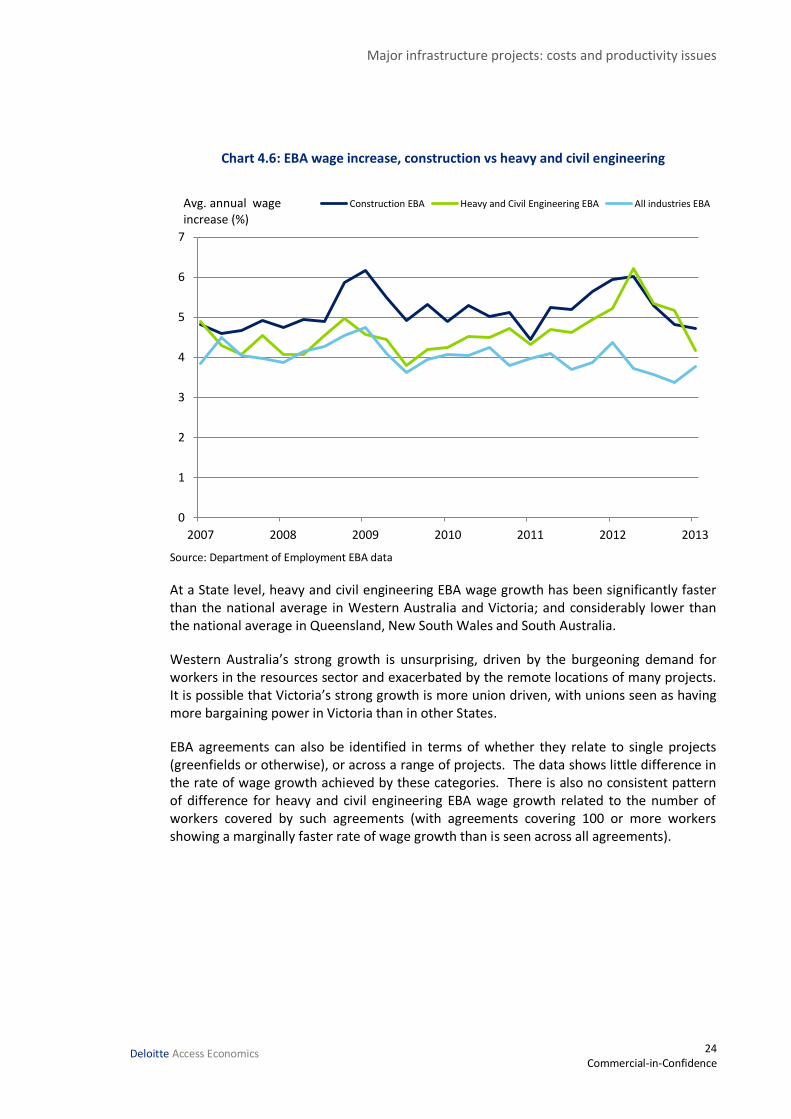
Wage growth from EBAs can also be examined separately for the heavy and civil engineering component of construction. Though they have converged in the past year, Chart 4.6 shows that in general, wage growth under EBAs in the heavy and civil engineering sub-sector have been slower than the construction sector as a whole (though still well above the ‘all industries’ average).
-6 0 6 12 18 24 30 36
Mining
Electricity, Gas, Water and Waste Services
Professional, Scientific and Technical Services
Public Administration and Safety
Information Media and Telecommunications
Health and Community Services
Rental, Hiring and Real Estate Services
Financial and Insurance Services
Retail Trade
All industries
Accommodation and Food Services
Arts and Recreation Services
Wholesale Trade
Manufacturing
Transport, Postal and Warehousing
Other Services
Education
Administrative and Support Services
Construction
% growth in EBA - % growth in WPI, Sep 1997 to Sep 2013
Major infrastructure projects: costs and productivity issues
24 Commercial-in-Confidence
Deloitte Access Economics
Chart 4.6: EBA wage increase, construction vs heavy and civil engineering
Source: Department of Employment EBA data
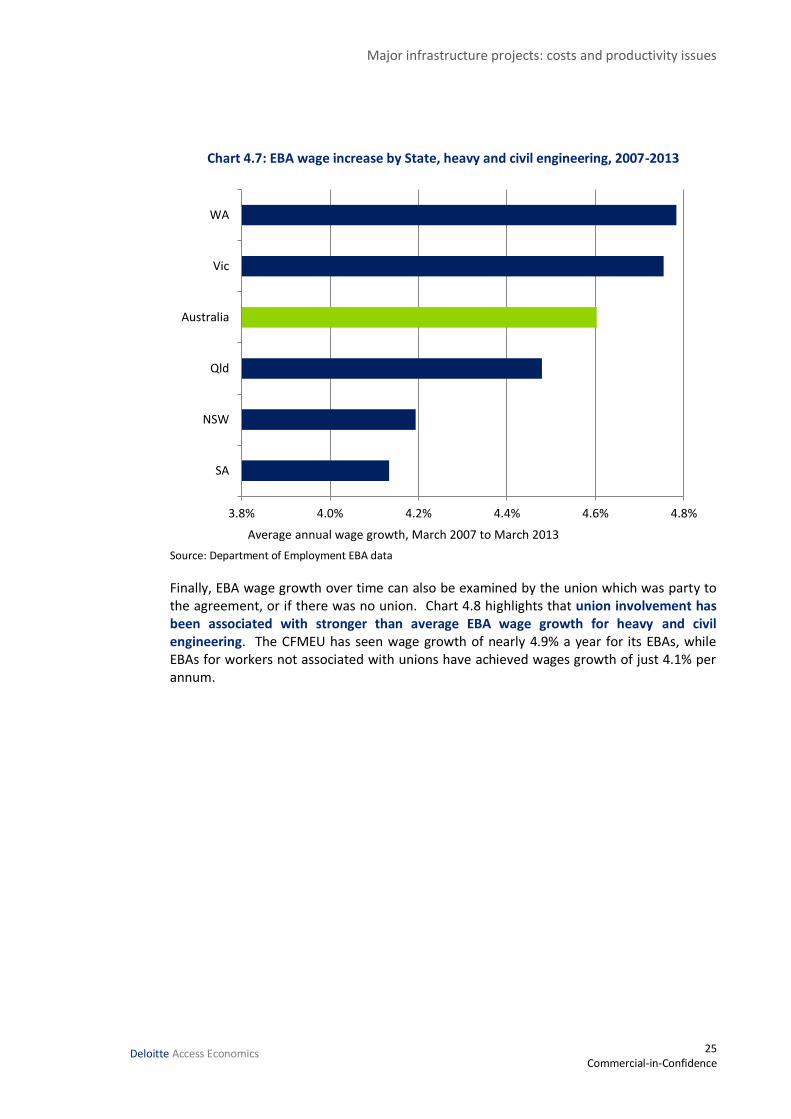
At a State level, heavy and civil engineering EBA wage growth has been significantly faster than the national average in Western Australia and Victoria; and considerably lower than the national average in Queensland, New South Wales and South Australia.
Western Australia’s strong growth is unsurprising, driven by the burgeoning demand for workers in the resources sector and exacerbated by the remote locations of many projects. It is possible that Victoria’s strong growth is more union driven, with unions seen as having more bargaining power in Victoria than in other States.
EBA agreements can also be identified in terms of whether they relate to single projects (greenfields or otherwise), or across a range of projects. The data shows little difference in the rate of wage growth achieved by these categories. There is also no consistent pattern of difference for heavy and civil engineering EBA wage growth related to the number of workers covered by such agreements (with agreements covering 100 or more workers showing a marginally faster rate of wage growth than is seen across all agreements).
0
1
2
3
4
5
6
7
2007 2008 2009 2010 2011 2012 2013
Construction EBA Heavy and Civil Engineering EBA All industries EBAAvg. annual wage increase (%)
Major infrastructure projects: costs and productivity issues
25 Commercial-in-Confidence
Deloitte Access Economics
Chart 4.7: EBA wage increase by State, heavy and civil engineering, 2007-2013
Source: Department of Employment EBA data
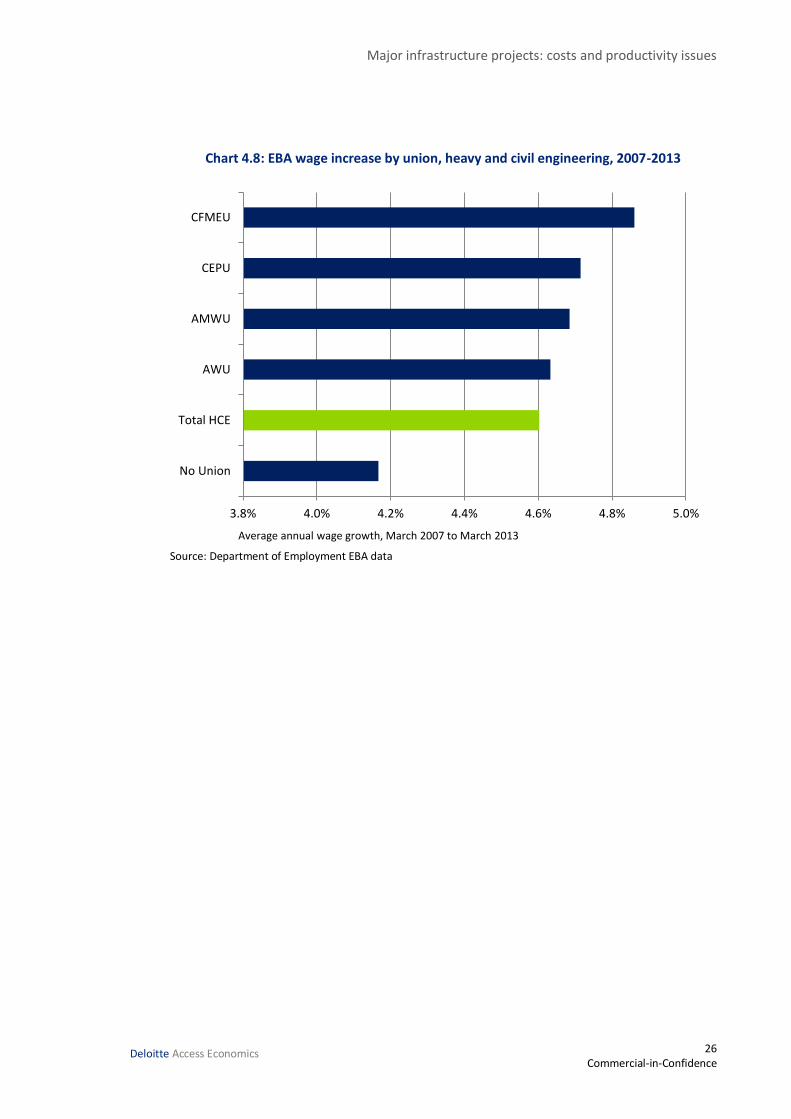
Finally, EBA wage growth over time can also be examined by the union which was party to the agreement, or if there was no union. Chart 4.8 highlights that union involvement has been associated with stronger than average EBA wage growth for heavy and civil engineering. The CFMEU has seen wage growth of nearly 4.9% a year for its EBAs, while EBAs for workers not associated with unions have achieved wages growth of just 4.1% per annum.
3.8% 4.0% 4.2% 4.4% 4.6% 4.8%
SA
NSW
Qld
Australia
Vic
WA
Average annual wage growth, March 2007 to March 2013
Major infrastructure projects: costs and productivity issues
26 Commercial-in-Confidence
Deloitte Access Economics
Chart 4.8: EBA wage increase by union, heavy and civil engineering, 2007-2013
Source: Department of Employment EBA data
3.8% 4.0% 4.2% 4.4% 4.6% 4.8% 5.0%
No Union
Total HCE
AWU
AMWU
CEPU
CFMEU
Average annual wage growth, March 2007 to March 2013
Major infrastructure projects: costs and productivity issues
27 Commercial-in-Confidence
Deloitte Access Economics
5 Construction costs – inputs and processes Wages represent an important component of construction costs, though growth in overall construction costs will also be influenced by the costs of capital equipment, materials costs and, most importantly, the efficiency of processes.
Some information exists on cost growth over time for components of engineering construction activity, particularly in relation to road and bridge construction costs over time (using both public data as well as data from Rawlinsons’ Australian Construction Handbook). This is a significant element of overall public infrastructure provision, and the focus of this chapter.
5.1 Road and bridge construction costs
Over the past five years, road and bridge construction activity has accounted for a significant proportion of public and economic infrastructure construction activity. Specifically:1
around 33% of all economic infrastructure construction work done; and
around 42% of all economic infrastructure construction work done for the public sector
Investigating cost data for road and bridge construction activity therefore provides an informative case study, although information on cost rises for road and bridge construction activity should not necessarily be taken as representative of other engineering construction activities.
There are two price indexes for road and bridge construction published by public agencies:
the ABS produces a price index for road and bridge construction as part of its Producer Price Index; and
the Bureau of Infrastructure, Transport and Regional Economics (BITRE) produces a Road Construction and Maintenance Price Index as well as a number of sub-indexes.
As BITRE explains in its latest publication, the two price indexes are conceptually different. The ABS price index is an output price index that measures changes in the prices (revenues) received by businesses undertaking road and bridge construction less any direct tax paid. In contrast, the BITRE price index is an input price index that measures changes in the prices of inputs used in road construction and maintenance.
Chart 5.1 shows the movements in these two road and bridge construction price indexes as well as the broader engineering construction implicit price deflator over recent years.
1 ABS Engineering Construction Activity (Cat. No. 8762.0).
Major infrastructure projects: costs and productivity issues
28 Commercial-in-Confidence
Deloitte Access Economics
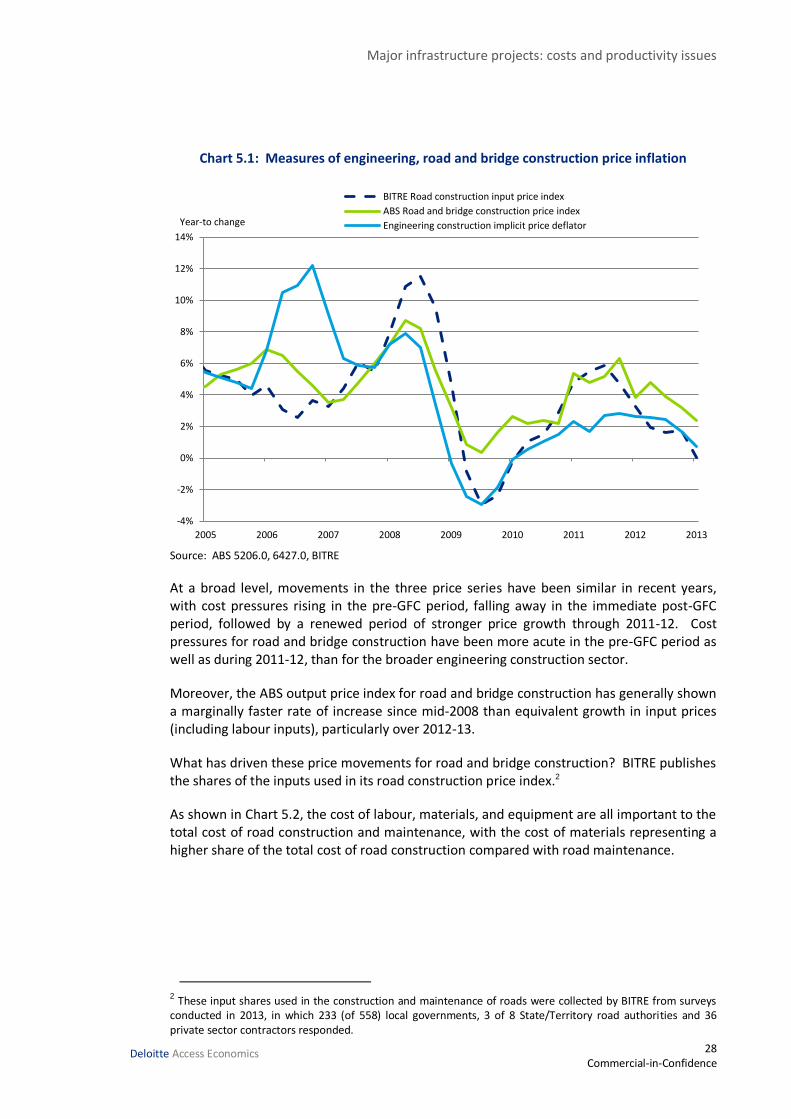
Chart 5.1: Measures of engineering, road and bridge construction price inflation
Source: ABS 5206.0, 6427.0, BITRE
At a broad level, movements in the three price series have been similar in recent years, with cost pressures rising in the pre-GFC period, falling away in the immediate post-GFC period, followed by a renewed period of stronger price growth through 2011-12. Cost pressures for road and bridge construction have been more acute in the pre-GFC period as well as during 2011-12, than for the broader engineering construction sector.
Moreover, the ABS output price index for road and bridge construction has generally shown a marginally faster rate of increase since mid-2008 than equivalent growth in input prices (including labour inputs), particularly over 2012-13.
What has driven these price movements for road and bridge construction? BITRE publishes the shares of the inputs used in its road construction price index.2
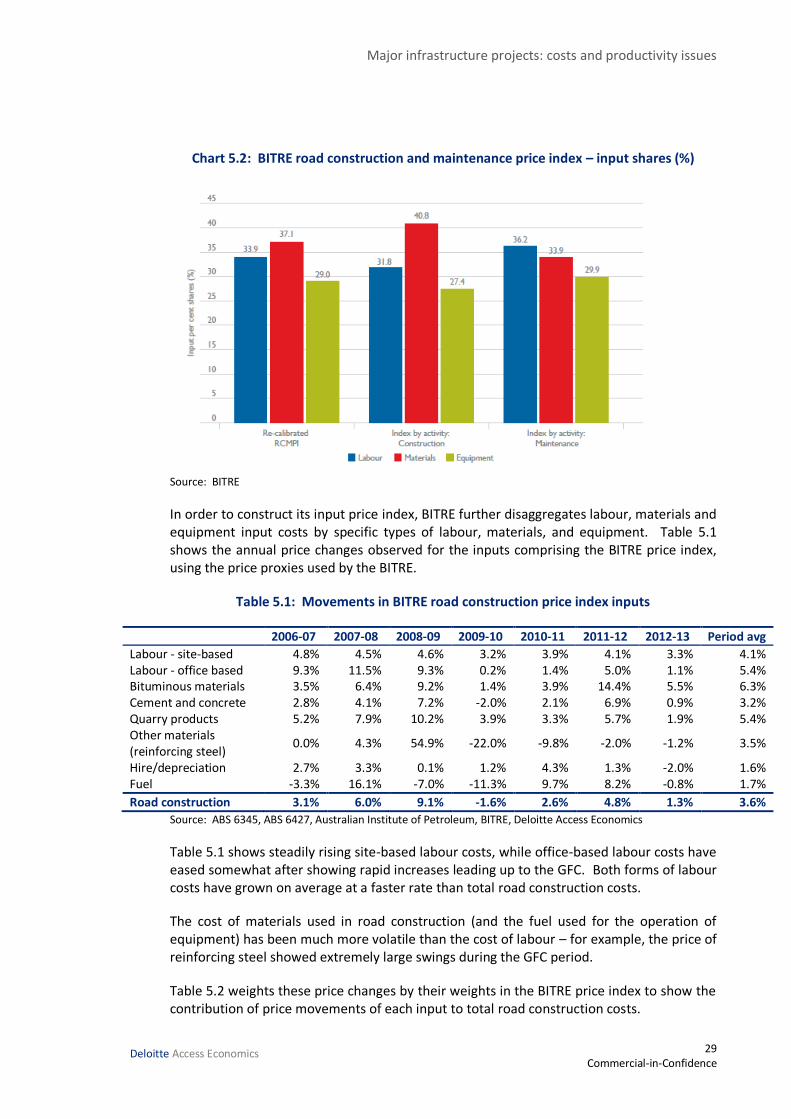
As shown in Chart 5.2, the cost of labour, materials, and equipment are all important to the total cost of road construction and maintenance, with the cost of materials representing a higher share of the total cost of road construction compared with road maintenance.
2 These input shares used in the construction and maintenance of roads were collected by BITRE from surveys conducted in 2013, in which 233 (of 558) local governments, 3 of 8 State/Territory road authorities and 36 private sector contractors responded.
-4%
-2%
0%
2%
4%
6%
8%
10%
12%
14%
2005 2006 2007 2008 2009 2010 2011 2012 2013
BITRE Road construction input price index
ABS Road and bridge construction price index
Engineering construction implicit price deflatorYear-to change
Major infrastructure projects: costs and productivity issues
29 Commercial-in-Confidence
Deloitte Access Economics
Chart 5.2: BITRE road construction and maintenance price index – input shares (%)
Source: BITRE
In order to construct its input price index, BITRE further disaggregates labour, materials and equipment input costs by specific types of labour, materials, and equipment. Table 5.1 shows the annual price changes observed for the inputs comprising the BITRE price index, using the price proxies used by the BITRE.
Table 5.1: Movements in BITRE road construction price index inputs
2006-07 2007-08 2008-09 2009-10 2010-11 2011-12 2012-13 Period avg
Labour - site-based 4.8% 4.5% 4.6% 3.2% 3.9% 4.1% 3.3% 4.1% Labour - office based 9.3% 11.5% 9.3% 0.2% 1.4% 5.0% 1.1% 5.4% Bituminous materials 3.5% 6.4% 9.2% 1.4% 3.9% 14.4% 5.5% 6.3% Cement and concrete 2.8% 4.1% 7.2% -2.0% 2.1% 6.9% 0.9% 3.2% Quarry products 5.2% 7.9% 10.2% 3.9% 3.3% 5.7% 1.9% 5.4% Other materials (reinforcing steel)
0.0% 4.3% 54.9% -22.0% -9.8% -2.0% -1.2% 3.5%
Hire/depreciation 2.7% 3.3% 0.1% 1.2% 4.3% 1.3% -2.0% 1.6% Fuel -3.3% 16.1% -7.0% -11.3% 9.7% 8.2% -0.8% 1.7%
Road construction 3.1% 6.0% 9.1% -1.6% 2.6% 4.8% 1.3% 3.6%
Source: ABS 6345, ABS 6427, Australian Institute of Petroleum, BITRE, Deloitte Access Economics
Table 5.1 shows steadily rising site-based labour costs, while office-based labour costs have eased somewhat after showing rapid increases leading up to the GFC. Both forms of labour costs have grown on average at a faster rate than total road construction costs.
The cost of materials used in road construction (and the fuel used for the operation of equipment) has been much more volatile than the cost of labour – for example, the price of reinforcing steel showed extremely large swings during the GFC period.
Table 5.2 weights these price changes by their weights in the BITRE price index to show the contribution of price movements of each input to total road construction costs.
Major infrastructure projects: costs and productivity issues
30 Commercial-in-Confidence
Deloitte Access Economics
Table 5.2: Contribution to movements in BITRE road construction price index (%-points)
2006-07 2007-08 2008-09 2009-10 2010-11 2011-12 2012-13 Period avg
Labour - site-based 1.2% 1.1% 1.1% 0.8% 1.0% 1.0% 0.8% 1.0% Labour - office based 0.7% 0.9% 0.7% 0.0% 0.1% 0.4% 0.1% 0.4% Bituminous materials 0.4% 0.8% 1.1% 0.2% 0.5% 1.8% 0.7% 0.8% Cement and concrete 0.1% 0.2% 0.3% -0.1% 0.1% 0.3% 0.0% 0.1% Quarry products 0.8% 1.3% 1.6% 0.6% 0.5% 0.9% 0.3% 0.9% Other materials (reinforcing steel)
0.0% 0.3% 4.4% -1.7% -0.8% -0.2% -0.1% 0.3%
Hire/depreciation 0.6% 0.7% 0.0% 0.3% 0.9% 0.3% -0.4% 0.3% Fuel -0.2% 0.9% -0.4% -0.6% 0.6% 0.5% 0.0% 0.1%
Road construction 3.1% 6.0% 9.1% -1.6% 2.6% 4.8% 1.3% 3.6%
Source: ABS 6345, ABS 6427, Australian Institute of Petroleum, BITRE, Deloitte Access Economics
Table 5.2 shows that materials costs (particularly reinforcing steel) were the major contributor to the peak cost pressure for road construction recorded during 2008-09. Site-based labour costs have consistently made a significant contribution to road construction cost rises.
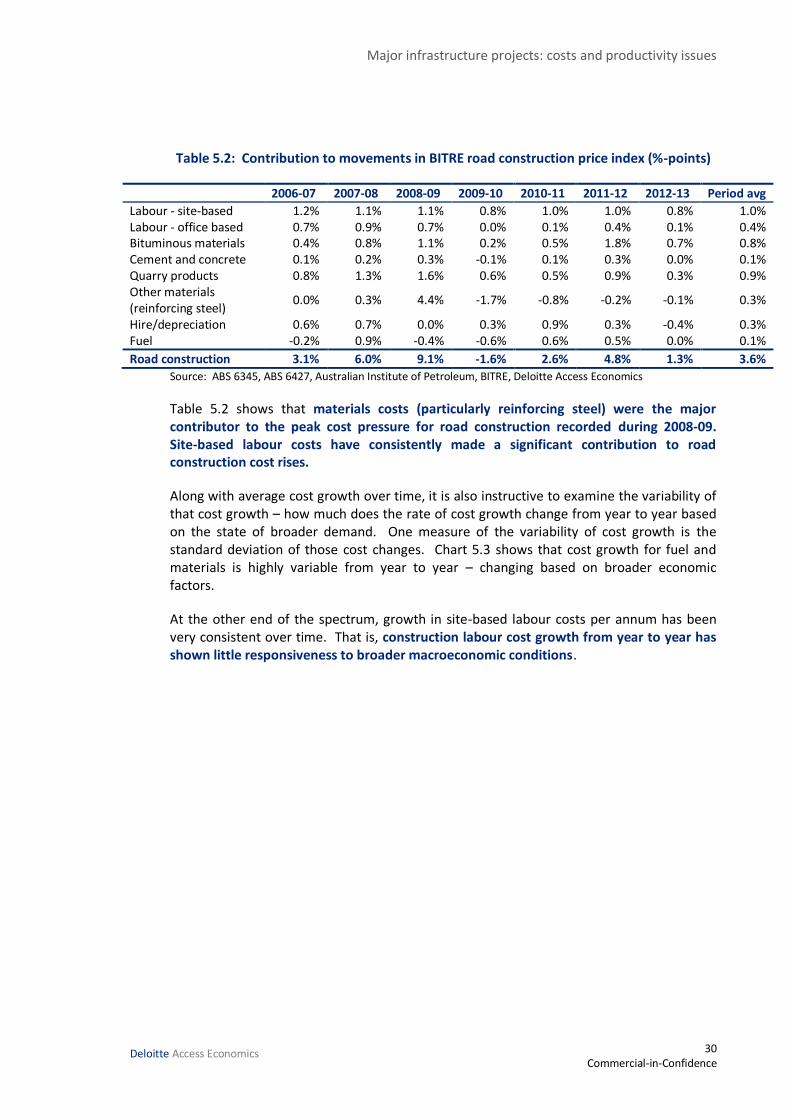
Along with average cost growth over time, it is also instructive to examine the variability of that cost growth – how much does the rate of cost growth change from year to year based on the state of broader demand. One measure of the variability of cost growth is the standard deviation of those cost changes. Chart 5.3 shows that cost growth for fuel and materials is highly variable from year to year – changing based on broader economic factors.
At the other end of the spectrum, growth in site-based labour costs per annum has been very consistent over time. That is, construction labour cost growth from year to year has shown little responsiveness to broader macroeconomic conditions.
Major infrastructure projects: costs and productivity issues
31 Commercial-in-Confidence
Deloitte Access Economics
Chart 5.3: Standard deviation of cost growth for road construction price inputs
Source: BITRE, Deloitte Access Economics
As for any such statistical exercise, there are some limitations to the BITRE input price index that need to be kept in mind. In particular, the price series that are used to show the movements in the prices of the various inputs used in road and bridge construction are generally proxies, which may be used over broader activities than just road and bridge construction.
In particular, the Wage Price Index for the total construction sector (which includes residential and non-residential building) is used as representative of on-site labour costs in road and bridge construction. As detailed in the previous chapter, some elements of construction have seen faster wage growth than represented in the construction WPI.
5.2 Specific road and bridge construction processes and input costs
This section provides further analysis of cost increases for specific road and bridge construction processes using data from Rawlinsons’ Australian Construction Handbook. In doing so, this section sheds further light on the specific sources of price pressure that may have helped to determine the aggregate movements in road and bridge construction prices shown in the previous section.
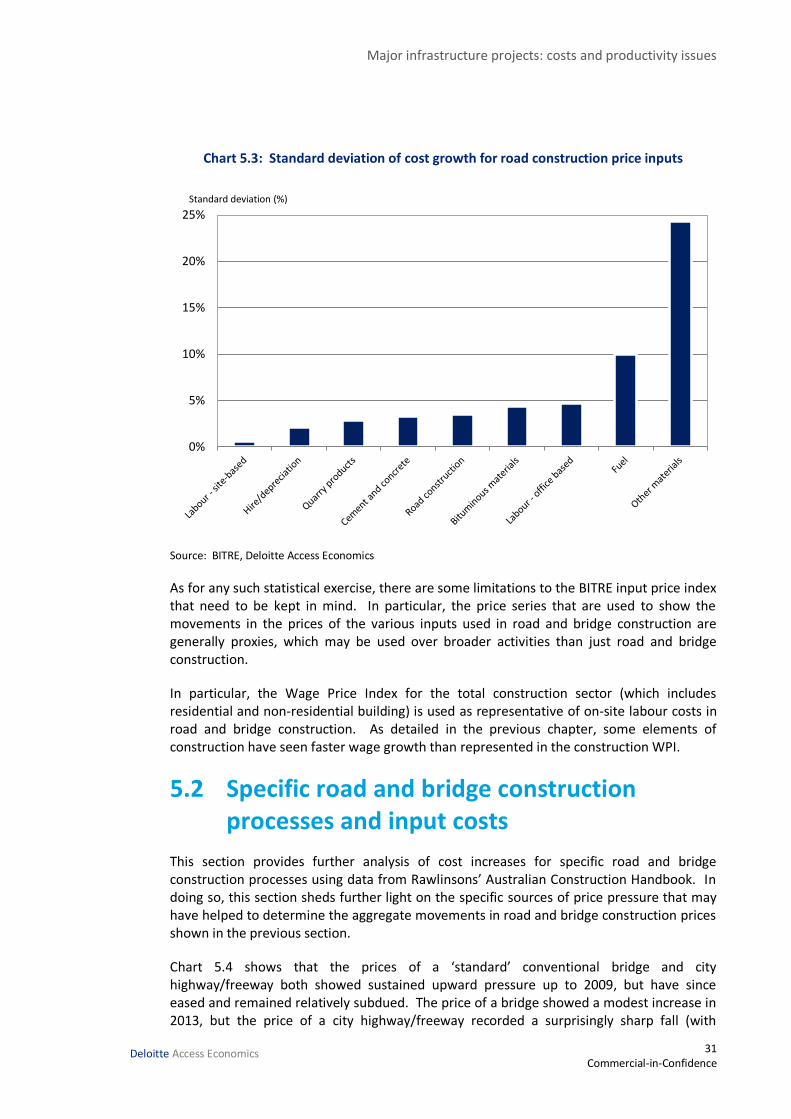
Chart 5.4 shows that the prices of a ‘standard’ conventional bridge and city highway/freeway both showed sustained upward pressure up to 2009, but have since eased and remained relatively subdued. The price of a bridge showed a modest increase in 2013, but the price of a city highway/freeway recorded a surprisingly sharp fall (with
0%
5%
10%
15%
20%
25%Standard deviation (%)
Major infrastructure projects: costs and productivity issues
32 Commercial-in-Confidence
Deloitte Access Economics
Rawlinsons’ data also showing that the price of a standard country highway and suburban road both recorded increases in 2013).
Chart 5.4: Price of two lane city highway/freeway and conventional bridge (% annual change)
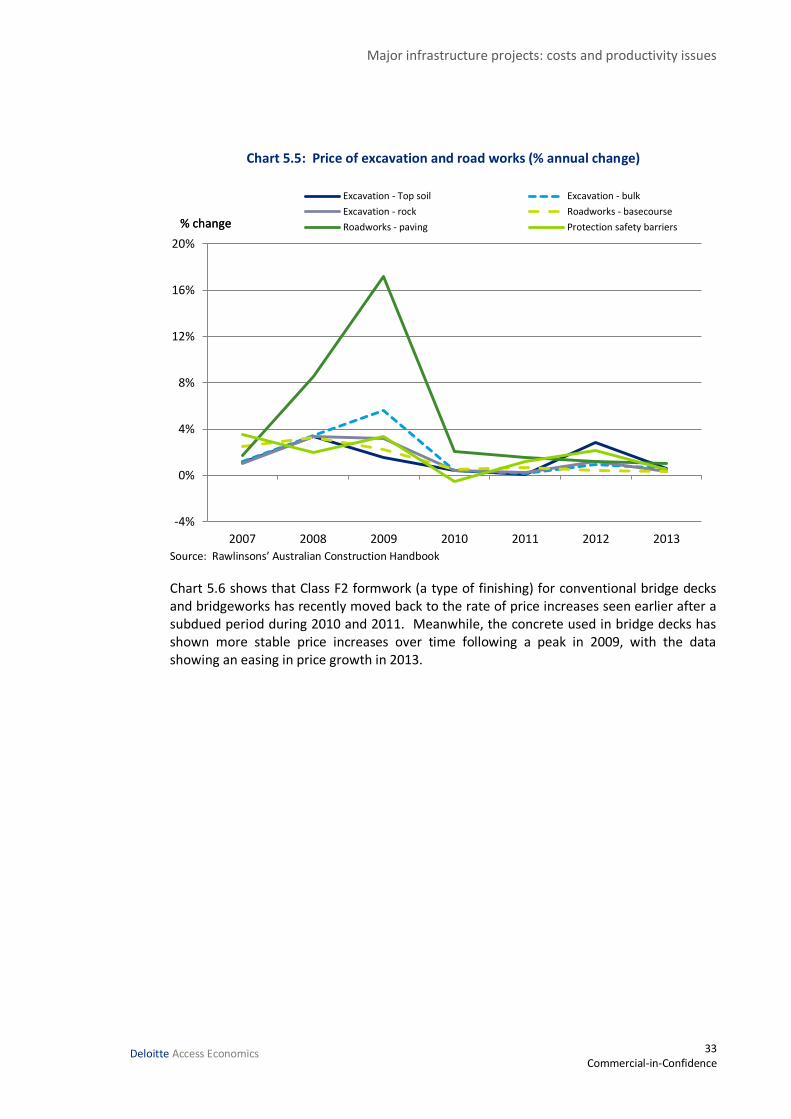
Source: Rawlinsons’ Australian Construction Handbook
Overall, price growth for a conventional bridge has shown a broadly similar movement over time to the price of a highway/freeway, although recent price pressure appears to have been more concentrated in bridge construction.
Chart 5.5 shows that price increases for excavation work have generally been relatively subdued in recent years, although bulk excavation showed a more notable increase in price in 2009. The same relatively subdued price increases have generally also been seen for basecourse road works and for protection safety barriers.
In contrast, hot bituminous concrete paving roadwork showed a very sharp increase in price which peaked in 2009 (and would have contributed to the increase in overall road construction prices during that period), although it has also eased of late.
-8%
-6%
-4%
-2%
0%
2%
4%
6%
8%
2007 2008 2009 2010 2011 2012 2013
Bridgeworks - Two lane 11m wide - conventional
City highway/ freeway with median strip and emergency lanes - duplicate two lane
% change
Major infrastructure projects: costs and productivity issues
33 Commercial-in-Confidence
Deloitte Access Economics
Chart 5.5: Price of excavation and road works (% annual change)
Source: Rawlinsons’ Australian Construction Handbook
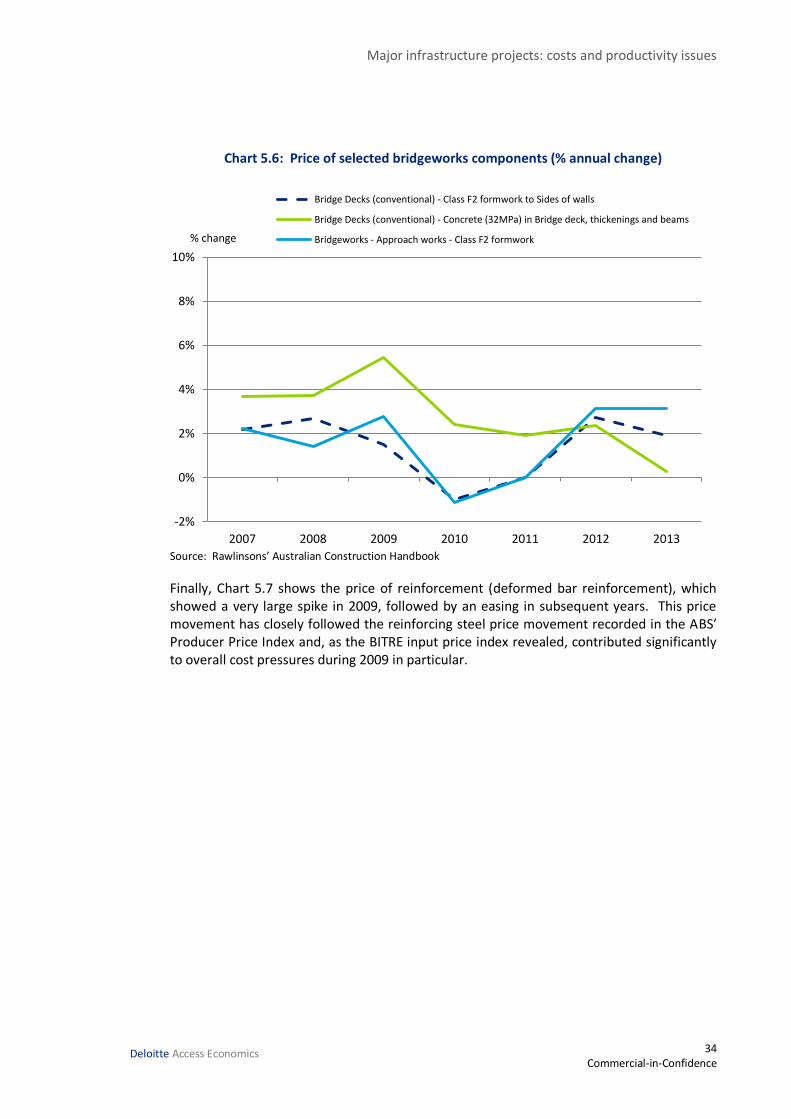
Chart 5.6 shows that Class F2 formwork (a type of finishing) for conventional bridge decks and bridgeworks has recently moved back to the rate of price increases seen earlier after a subdued period during 2010 and 2011. Meanwhile, the concrete used in bridge decks has shown more stable price increases over time following a peak in 2009, with the data showing an easing in price growth in 2013.
-4%
0%
4%
8%
12%
16%
20%
2007 2008 2009 2010 2011 2012 2013
Excavation - Top soil Excavation - bulk
Excavation - rock Roadworks - basecourse
Roadworks - paving Protection safety barriers% change% change
Major infrastructure projects: costs and productivity issues
34 Commercial-in-Confidence
Deloitte Access Economics
Chart 5.6: Price of selected bridgeworks components (% annual change)
Source: Rawlinsons’ Australian Construction Handbook
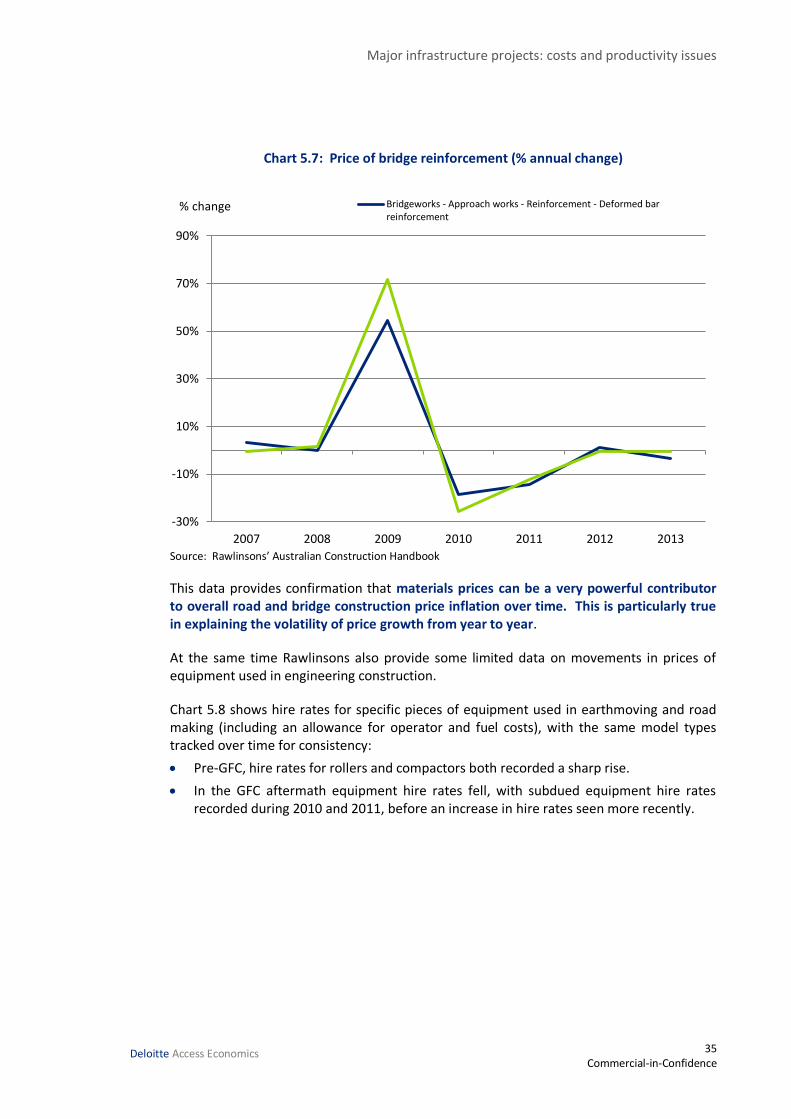
Finally, Chart 5.7 shows the price of reinforcement (deformed bar reinforcement), which showed a very large spike in 2009, followed by an easing in subsequent years. This price movement has closely followed the reinforcing steel price movement recorded in the ABS’ Producer Price Index and, as the BITRE input price index revealed, contributed significantly to overall cost pressures during 2009 in particular.
-2%
0%
2%
4%
6%
8%
10%
2007 2008 2009 2010 2011 2012 2013
Bridge Decks (conventional) - Class F2 formwork to Sides of walls
Bridge Decks (conventional) - Concrete (32MPa) in Bridge deck, thickenings and beams
Bridgeworks - Approach works - Class F2 formwork% change
Major infrastructure projects: costs and productivity issues
35 Commercial-in-Confidence
Deloitte Access Economics
Chart 5.7: Price of bridge reinforcement (% annual change)
Source: Rawlinsons’ Australian Construction Handbook
This data provides confirmation that materials prices can be a very powerful contributor to overall road and bridge construction price inflation over time. This is particularly true in explaining the volatility of price growth from year to year.
At the same time Rawlinsons also provide some limited data on movements in prices of equipment used in engineering construction.
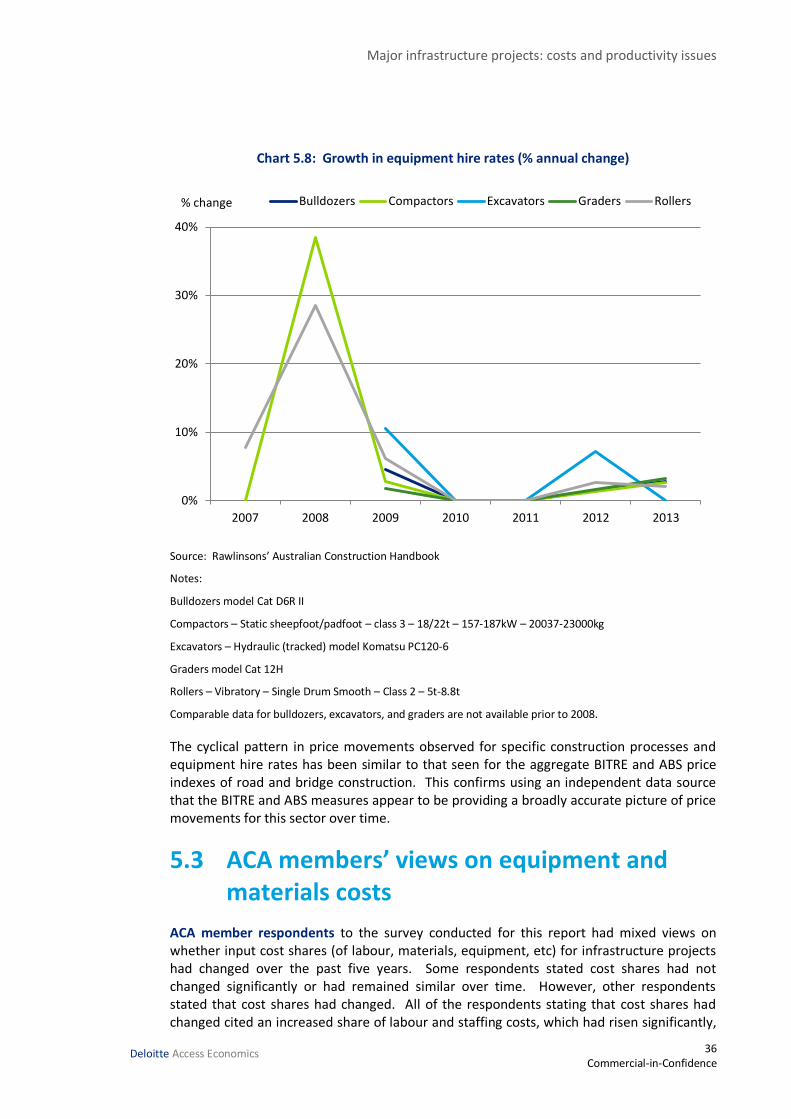
Chart 5.8 shows hire rates for specific pieces of equipment used in earthmoving and road making (including an allowance for operator and fuel costs), with the same model types tracked over time for consistency:
Pre-GFC, hire rates for rollers and compactors both recorded a sharp rise.
In the GFC aftermath equipment hire rates fell, with subdued equipment hire rates recorded during 2010 and 2011, before an increase in hire rates seen more recently.
-30%
-10%
10%
30%
50%
70%
90%
2007 2008 2009 2010 2011 2012 2013
Bridgeworks - Approach works - Reinforcement - Deformed barreinforcement
% change
Major infrastructure projects: costs and productivity issues
36 Commercial-in-Confidence
Deloitte Access Economics
Chart 5.8: Growth in equipment hire rates (% annual change)
Source: Rawlinsons’ Australian Construction Handbook
Notes:
Bulldozers model Cat D6R II
Compactors – Static sheepfoot/padfoot – class 3 – 18/22t – 157-187kW – 20037-23000kg
Excavators – Hydraulic (tracked) model Komatsu PC120-6
Graders model Cat 12H
Rollers – Vibratory – Single Drum Smooth – Class 2 – 5t-8.8t
Comparable data for bulldozers, excavators, and graders are not available prior to 2008.
The cyclical pattern in price movements observed for specific construction processes and equipment hire rates has been similar to that seen for the aggregate BITRE and ABS price indexes of road and bridge construction. This confirms using an independent data source that the BITRE and ABS measures appear to be providing a broadly accurate picture of price movements for this sector over time.
5.3 ACA members’ views on equipment and materials costs
ACA member respondents to the survey conducted for this report had mixed views on whether input cost shares (of labour, materials, equipment, etc) for infrastructure projects had changed over the past five years. Some respondents stated cost shares had not changed significantly or had remained similar over time. However, other respondents stated that cost shares had changed. All of the respondents stating that cost shares had changed cited an increased share of labour and staffing costs, which had risen significantly,
0%
10%
20%
30%
40%
2007 2008 2009 2010 2011 2012 2013
Bulldozers Compactors Excavators Graders Rollers% change
Major infrastructure projects: costs and productivity issues
37 Commercial-in-Confidence
Deloitte Access Economics
generally combined with a reduced proportion of materials costs. One respondent stated that labour cost increases had exceeded the price increases for equipment and plant.
It was also noted that there is significant variation in cost shares between projects as a result of project specific factors such as complexity, scope and location. As project characteristics can differ significantly, so too do the cost components of projects.
In recent years, to what extent has high global demand been pushing up the price of specialised capital equipment (either for purchase or lease) for infrastructure construction? Provide examples if possible.
Respondents had mixed views on the extent of and drivers of price increases for specialised capital equipment. Some stated that significant cost pressures had not been experienced due to this phenomenon, particularly in the last two years where one respondent stated that the second hand market had decreased in price during this period. One respondent stated that it depended on the particular item of equipment, with rail construction equipment now slightly dropping in price, believing that this type of equipment had been rarely required. Moreover, it was stated that crane prices rose in the mid-2000s due to demand in the United Arab Emirates.
Factors other than high global demand have also been important in determining the price of capital equipment, including the high Australian dollar. One respondent stated that Australia’s anti-dumping system and in particular notices regarding power transformers (Notice no, 2013/92) and wind towers (no. 2013/95) will increase the price of fabricated equipment procured from overseas. While anti-dumping tariffs are imposed on particular countries, the price impact is likely to set a precedent for other Asian manufacturers.
One respondent stated that increasing labour rates in China had flown through into prices of specialised capital equipment (which can be more labour intensive), as China is now being heavily used for steel fabrication and hydraulic component manufacture.
In contrast, others stated that the resources boom and strong global demand did significantly push up the price of capital equipment for infrastructure construction, particularly in the years prior to the last two years.
One respondent stated that the larger class of excavators (for example, Liebher 996) and dump trucks have been hard to get globally in recent years (with up to five years waiting time), while crane prices had risen (and had not since fallen) and road headers for tunnel construction had also increased in cost. On the other hand, smaller equipment has remained available (for example, 100 tonne excavators and 50 tonne dump trucks), but hire rates had risen and fallen with demand (sometimes to a 30% premium on typical rates).
It was stated by one respondent that some specialised capital equipment (e.g. transformers and turbines) was highly susceptible to high global demand due to a lack of local manufacturing capability and long manufacturing lead times of up to three years for some component parts of large transformers.
One respondent stated that specialised capital equipment in the telecommunications industry was more susceptible to local demand rather than overall global demand as the equipment was generally more technical (for example ribbon fibre splicing machines).
Major infrastructure projects: costs and productivity issues
38 Commercial-in-Confidence
Deloitte Access Economics
Equipment was procured dependent on the specific project requirements and so price was more sensitive to the number of similar projects locally (for example, the compressed rollout of the NBN has a far bigger impact on equipment prices than global demand).
Another respondent indicated that due to many of the components of specialised equipment being non-standard they tended to be more expensive in a high demand market (for example, hydraulic cylinders and components and large bearings).
To what degree are trends for equipment costs for the construction sector as a whole representative of those for infrastructure construction? If not, what factors explain any differences?
Survey respondents also had mixed views on this issue. One respondent stated that competitive market forces tend to keep inflationary pressure on equipment (excluding specialised equipment) at around CPI. Other respondents also made a distinction between commonly used equipment and specialised equipment.
For example, telecommunications infrastructure was stated to be specialised and not reflective of the construction industry as a whole. Other examples of specialised equipment for infrastructure projects were larger cranes, TBMs, road headers, rail track equipment which were stated to be subject to the demand within infrastructure projects more closely, and the timing of competing projects for the same equipment with continuity of work another factor which influences costs.
One respondent stated that infrastructure tends to require more heavy machinery, which was considered to be a different market to the generally lighter machinery required for construction (with the exception of heavy earthworks and foundations), which means they will experience different trends as to cost.
Elsewhere, trends can be the same due to the raw and converted materials that are required in all projects. For example transformers have aluminium, copper and steel components. They are used on power stations, substations, office buildings, railway stations and schools. Similarly, a number of classes of equipment are common across construction and infrastructure projects, for example excavators, trucks, cranes, rollers, elevated work platforms, and scrapers. The costs for these will depend on the state of overall industry demand.
What have been the main areas of cost pressures for materials and other non-labour input costs (such as power, water and white collar services), and what factors lie behind these pressures?
Respondents consistently stated that the cost of white collar and professional staff were a source of cost pressure, due to skill shortages and the need to attract staff to remote projects. Respondents generally stated that cost pressures for materials have been kept in check to some extent by a combination of relatively flat material demand in construction (which may prove to be temporary) and the importation of manufactured materials from Asia. One respondent stated that prices for materials acquired overseas (such as explosives and copper) faced upward cost pressure due to Australia’s remote location and spend related to the rest of the world which reduced competitive negotiation opportunities. An
Major infrastructure projects: costs and productivity issues
39 Commercial-in-Confidence
Deloitte Access Economics
increase in dealing with the cost of poor quality of material from overseas, particularly where conversion is required (e.g. fabrication of steel) was stated by one respondent.
For other input costs, the cost of power and electricity for construction was stated to have spiked in recent times, with one respondent stating that the carbon tax was a factor. One respondent stated that an increase in regulatory requirements and permit costs for over size or overmass load carrying vehicles as well as an increase in fuel costs had placed pressure on the cost of transportation.
Finally, one respondent made the point that the cost of non-labour related input costs are in fact affected by the labour that is required to produce these inputs, and that white collar labour costs were linked to other labour costs as they maintain some degree of relativity.
To what extent have increased materials and other non-labour input costs placed pressure on total infrastructure construction costs?
Materials and other non-labour input costs were generally considered to be an important source of pressure on total infrastructure costs. However, some respondents did note that in the last five years cost pressure from this source has been less, due to the competitive nature of the market, as well as the fact that cheaper sources of materials from overseas are more commonly used now. One respondent stated that this increased the risk of losses for contractors due to the long lead times for materials as well as increased exposure to fluctuations in the Australian dollar. Another respondent noted that higher costs in one area may drive innovation and pursuit of alternative design and/or products.
What policies might be relevant to lowering the costs associated with land acquisition and access (including reducing delays)?
ACA member suggestions are set out below and focus on streamlining approvals processes:
Taking approvals processes away from local interests and aligning to national economic goals.
Reducing the layers of government and therefore taxes associated with transactions and approvals. (eg stamp duty).
There has been debate in the Australian market about the most efficient acquisition of land – especially for major public infrastructure projects or regional mining and resources exploration/extraction. Passing that responsibility on to the contract delivery organisation also passes additional risk, cost and invariably time, as the organisation must prepare itself to negotiate complex and contentious land access agreements without direct intervention from government.
Government or regulatory authorities, as client, should use their authority and resources to manage all land access to give greater certainty to the end user and taxpayer. During this process, they should ensure detailed collaboration with construction advisors.
An obligation for utilities to allow co-location. Utilities do not readily accommodate telecommunications facilities and generally prolong proceedings unnecessarily. Deployment of telecommunications infrastructure would be faster, less costly and reduce the number of greenfield builds if utilities were required to allow co-locations (assuming that no safety or design issues prevented the co-location).
Major infrastructure projects: costs and productivity issues
40 Commercial-in-Confidence
Deloitte Access Economics
State Crown leasing arrangements need to be reviewed to simplify the land acquisition process and bring under control increasing fee schedules. The Commonwealth could consider imposing national simplified leasing arrangements and a national compensation scheme for all crown land access.
All States to adopt legislation similar to the NSW State Environmental Planning Policy (Infrastructure) (SEPP). In NSW specified facilities are exempt from more restrictive state planning processes such as Development Approval processes (under the SEPP). This provides a fast track deployment of infrastructure projects under the NSW State rules.
The Victorian Governments Major Transport Facilitation Act 2009 gives major transport projects powers to access government land. The purpose of the Act is to facilitate the development of major transport project infrastructure, though the Act appears to be under-utilised.
The development of long term strategic plan for infrastructure based on forecast need coupled with a more detailed delivery strategy allowing for long term stakeholder engagement and land acquisition strategies and plans.
As an example, Singapore has an Urban Redevelopment Authority, which is responsible for long term planning and is part of the land use approval process.
Major infrastructure projects: costs and productivity issues
41 Commercial-in-Confidence
Deloitte Access Economics
6 Construction costs – major projects The sharp lift in engineering construction activity seen in Australia over recent years has brought with it an increase in the average size of projects over time. That has occurred as resources projects (which are generally of a larger scale) have comprised a larger share of overall engineering construction activity, and also as infrastructure projects have on average adopted a larger scale and complexity.
The Deloitte Access Economics Investment Monitor database includes coverage of discrete private and public engineering construction projects with a gross fixed capital expenditure of $20 million or more. The information within Investment Monitor is collected by Deloitte Access Economics from a variety of media, government and private sources. Projects are tracked from initial announcement to completion.
Deloitte Access Economics’ Investment Monitor reveals a change in the composition of the investment pipeline over the past decade towards larger projects. The top 20 projects now account for 52% of the value of the resource and infrastructure investment pipeline, compared with 40% five years ago and 36% ten years ago.
The shift towards larger projects has certainly been evident in resources, but has also been true for infrastructure projects. The average value of an infrastructure project in Deloitte Access Economics’ Investment Monitor database rose from $267 million in 20013 to $834 million in 2013.
The larger scale of individual engineering construction projects over time has presented challenges for delivery and increased the potential for cost over-runs on projects. This arises in part from the complexity of individual projects, which means that more things can go wrong and there can be a higher cost associated with any delay or lack of co-ordination. It is also as larger projects tend to require more specialised project management, engineering and construction skills, which at times can be hard to find (particularly in times of strong construction demand, such as over recent years).
A recent report commission by the Business Council of Australia noted that the fragility of a project increases with project size, and typically, projects that cost more than $2 billion, have a failure rate of over 60%.4
The Deloitte Access Economics Investment Monitor database tracks the lifecycle of major engineering construction projects from the planning phase, through the construction phase, and to completion.
Table 6.1 draws from the database to report on engineering construction projects by their year of completion. For each project, the project cost estimate at completion is compared
3 $313 million in 2011 dollars
4 Independent Project Analysis Inc., The Performance of Australian Industrial Projects, Report prepared for the
Business Council of Australia, May 2012
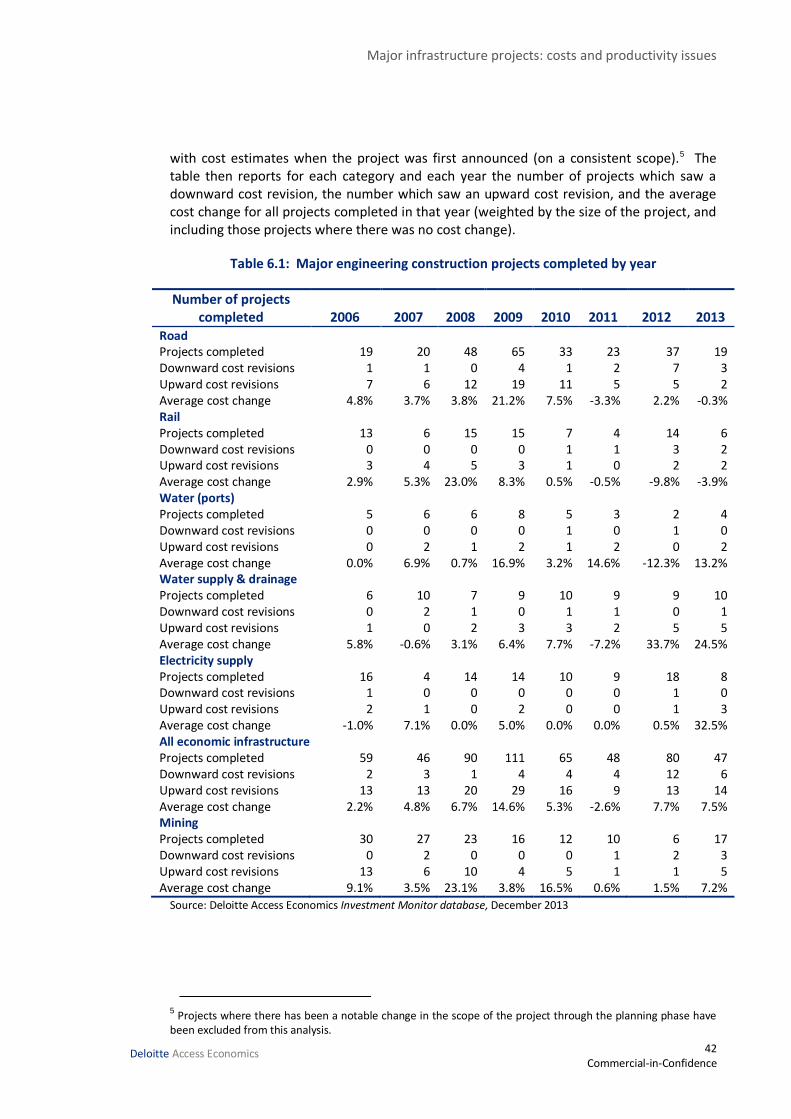
Major infrastructure projects: costs and productivity issues
42 Commercial-in-Confidence
Deloitte Access Economics
with cost estimates when the project was first announced (on a consistent scope).5 The table then reports for each category and each year the number of projects which saw a downward cost revision, the number which saw an upward cost revision, and the average cost change for all projects completed in that year (weighted by the size of the project, and including those projects where there was no cost change).
Table 6.1: Major engineering construction projects completed by year
Number of projects completed 2006 2007 2008 2009 2010 2011 2012 2013
Road Projects completed 19 20 48 65 33 23 37 19 Downward cost revisions 1 1 0 4 1 2 7 3 Upward cost revisions 7 6 12 19 11 5 5 2 Average cost change 4.8% 3.7% 3.8% 21.2% 7.5% -3.3% 2.2% -0.3% Rail Projects completed 13 6 15 15 7 4 14 6 Downward cost revisions 0 0 0 0 1 1 3 2 Upward cost revisions 3 4 5 3 1 0 2 2 Average cost change 2.9% 5.3% 23.0% 8.3% 0.5% -0.5% -9.8% -3.9% Water (ports) Projects completed 5 6 6 8 5 3 2 4 Downward cost revisions 0 0 0 0 1 0 1 0 Upward cost revisions 0 2 1 2 1 2 0 2 Average cost change 0.0% 6.9% 0.7% 16.9% 3.2% 14.6% -12.3% 13.2% Water supply & drainage Projects completed 6 10 7 9 10 9 9 10 Downward cost revisions 0 2 1 0 1 1 0 1 Upward cost revisions 1 0 2 3 3 2 5 5 Average cost change 5.8% -0.6% 3.1% 6.4% 7.7% -7.2% 33.7% 24.5% Electricity supply Projects completed 16 4 14 14 10 9 18 8 Downward cost revisions 1 0 0 0 0 0 1 0 Upward cost revisions 2 1 0 2 0 0 1 3 Average cost change -1.0% 7.1% 0.0% 5.0% 0.0% 0.0% 0.5% 32.5% All economic infrastructure Projects completed 59 46 90 111 65 48 80 47 Downward cost revisions 2 3 1 4 4 4 12 6 Upward cost revisions 13 13 20 29 16 9 13 14 Average cost change 2.2% 4.8% 6.7% 14.6% 5.3% -2.6% 7.7% 7.5% Mining Projects completed 30 27 23 16 12 10 6 17 Downward cost revisions 0 2 0 0 0 1 2 3 Upward cost revisions 13 6 10 4 5 1 1 5 Average cost change 9.1% 3.5% 23.1% 3.8% 16.5% 0.6% 1.5% 7.2%
Source: Deloitte Access Economics Investment Monitor database, December 2013
5 Projects where there has been a notable change in the scope of the project through the planning phase have
been excluded from this analysis.
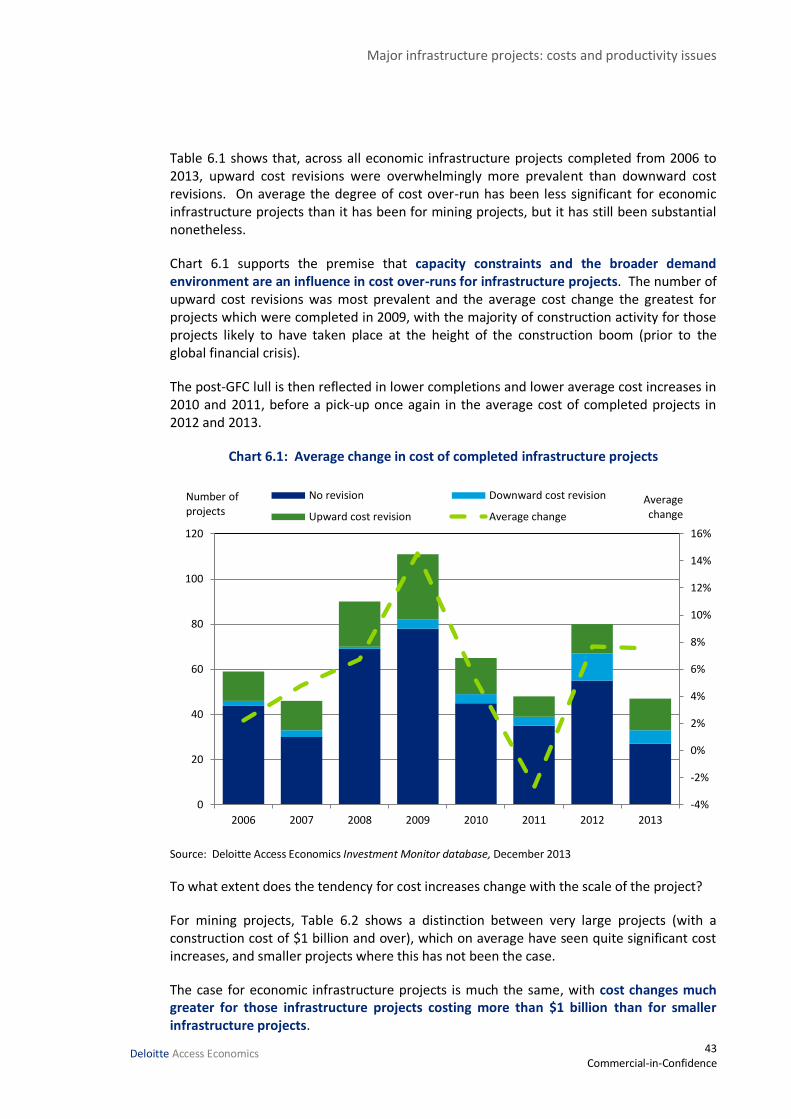
Major infrastructure projects: costs and productivity issues
43 Commercial-in-Confidence
Deloitte Access Economics
Table 6.1 shows that, across all economic infrastructure projects completed from 2006 to 2013, upward cost revisions were overwhelmingly more prevalent than downward cost revisions. On average the degree of cost over-run has been less significant for economic infrastructure projects than it has been for mining projects, but it has still been substantial nonetheless.
Chart 6.1 supports the premise that capacity constraints and the broader demand environment are an influence in cost over-runs for infrastructure projects. The number of upward cost revisions was most prevalent and the average cost change the greatest for projects which were completed in 2009, with the majority of construction activity for those projects likely to have taken place at the height of the construction boom (prior to the global financial crisis).
The post-GFC lull is then reflected in lower completions and lower average cost increases in 2010 and 2011, before a pick-up once again in the average cost of completed projects in 2012 and 2013.
Chart 6.1: Average change in cost of completed infrastructure projects
Source: Deloitte Access Economics Investment Monitor database, December 2013
To what extent does the tendency for cost increases change with the scale of the project?
For mining projects, Table 6.2 shows a distinction between very large projects (with a construction cost of $1 billion and over), which on average have seen quite significant cost increases, and smaller projects where this has not been the case.
The case for economic infrastructure projects is much the same, with cost changes much greater for those infrastructure projects costing more than $1 billion than for smaller infrastructure projects.
-4%
-2%
0%
2%
4%
6%
8%
10%
12%
14%
16%
0
20
40
60
80
100
120
2006 2007 2008 2009 2010 2011 2012 2013
No revision Downward cost revision
Upward cost revision Average change
Number of projects
Average change
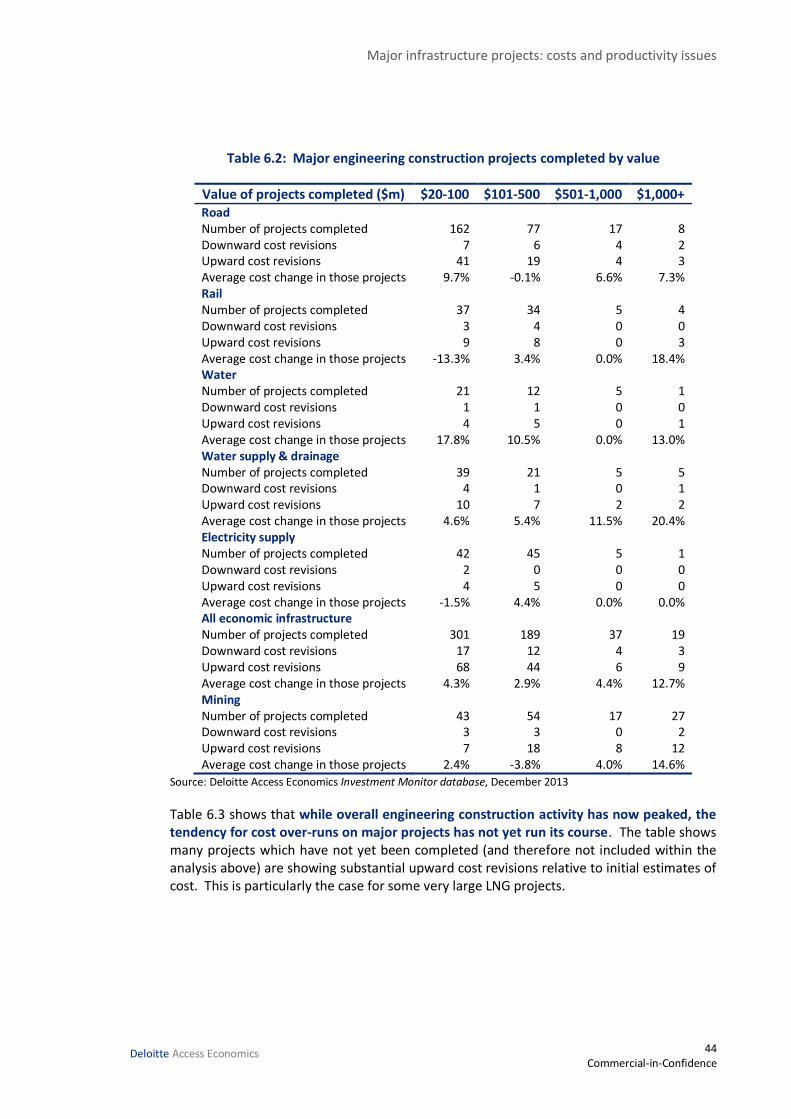
Major infrastructure projects: costs and productivity issues
44 Commercial-in-Confidence
Deloitte Access Economics
Table 6.2: Major engineering construction projects completed by value
Value of projects completed ($m) $20-100 $101-500 $501-1,000 $1,000+ Road Number of projects completed 162 77 17 8 Downward cost revisions 7 6 4 2 Upward cost revisions 41 19 4 3 Average cost change in those projects 9.7% -0.1% 6.6% 7.3% Rail Number of projects completed 37 34 5 4 Downward cost revisions 3 4 0 0 Upward cost revisions 9 8 0 3 Average cost change in those projects -13.3% 3.4% 0.0% 18.4% Water Number of projects completed 21 12 5 1 Downward cost revisions 1 1 0 0 Upward cost revisions 4 5 0 1 Average cost change in those projects 17.8% 10.5% 0.0% 13.0% Water supply & drainage Number of projects completed 39 21 5 5 Downward cost revisions 4 1 0 1 Upward cost revisions 10 7 2 2 Average cost change in those projects 4.6% 5.4% 11.5% 20.4% Electricity supply Number of projects completed 42 45 5 1 Downward cost revisions 2 0 0 0 Upward cost revisions 4 5 0 0 Average cost change in those projects -1.5% 4.4% 0.0% 0.0% All economic infrastructure Number of projects completed 301 189 37 19 Downward cost revisions 17 12 4 3 Upward cost revisions 68 44 6 9 Average cost change in those projects 4.3% 2.9% 4.4% 12.7% Mining Number of projects completed 43 54 17 27 Downward cost revisions 3 3 0 2 Upward cost revisions 7 18 8 12 Average cost change in those projects 2.4% -3.8% 4.0% 14.6%
Source: Deloitte Access Economics Investment Monitor database, December 2013
Table 6.3 shows that while overall engineering construction activity has now peaked, the tendency for cost over-runs on major projects has not yet run its course. The table shows many projects which have not yet been completed (and therefore not included within the analysis above) are showing substantial upward cost revisions relative to initial estimates of cost. This is particularly the case for some very large LNG projects.
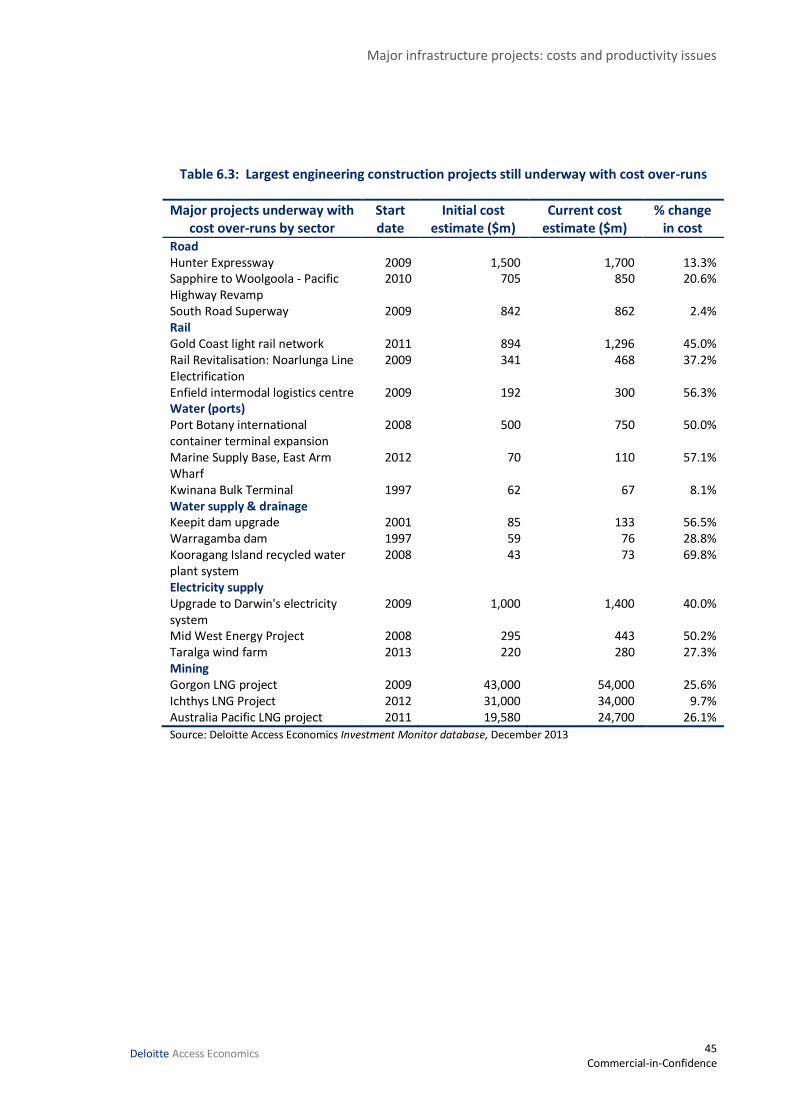
Major infrastructure projects: costs and productivity issues
45 Commercial-in-Confidence
Deloitte Access Economics
Table 6.3: Largest engineering construction projects still underway with cost over-runs
Major projects underway with cost over-runs by sector
Start date
Initial cost estimate ($m)
Current cost estimate ($m)
% change in cost
Road Hunter Expressway 2009 1,500 1,700 13.3% Sapphire to Woolgoola - Pacific Highway Revamp
2010 705 850 20.6%
South Road Superway 2009 842 862 2.4% Rail Gold Coast light rail network 2011 894 1,296 45.0% Rail Revitalisation: Noarlunga Line Electrification
2009 341 468 37.2%
Enfield intermodal logistics centre 2009 192 300 56.3% Water (ports) Port Botany international container terminal expansion
2008 500 750 50.0%
Marine Supply Base, East Arm Wharf
2012 70 110 57.1%
Kwinana Bulk Terminal 1997 62 67 8.1% Water supply & drainage Keepit dam upgrade 2001 85 133 56.5% Warragamba dam 1997 59 76 28.8% Kooragang Island recycled water plant system
2008 43 73 69.8%
Electricity supply Upgrade to Darwin's electricity system
2009 1,000 1,400 40.0%
Mid West Energy Project 2008 295 443 50.2% Taralga wind farm 2013 220 280 27.3% Mining Gorgon LNG project 2009 43,000 54,000 25.6% Ichthys LNG Project 2012 31,000 34,000 9.7% Australia Pacific LNG project 2011 19,580 24,700 26.1%
Source: Deloitte Access Economics Investment Monitor database, December 2013
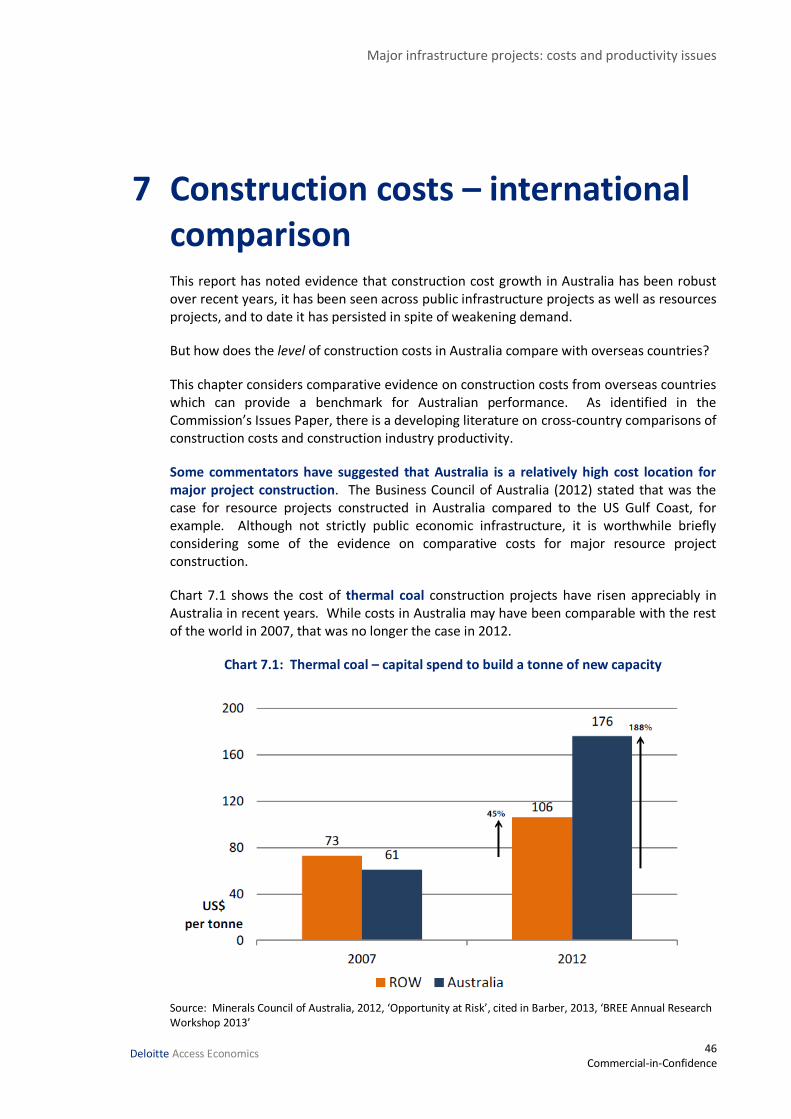
Major infrastructure projects: costs and productivity issues
46 Commercial-in-Confidence
Deloitte Access Economics
7 Construction costs – international comparison This report has noted evidence that construction cost growth in Australia has been robust over recent years, it has been seen across public infrastructure projects as well as resources projects, and to date it has persisted in spite of weakening demand.
But how does the level of construction costs in Australia compare with overseas countries?
This chapter considers comparative evidence on construction costs from overseas countries which can provide a benchmark for Australian performance. As identified in the Commission’s Issues Paper, there is a developing literature on cross-country comparisons of construction costs and construction industry productivity.
Some commentators have suggested that Australia is a relatively high cost location for major project construction. The Business Council of Australia (2012) stated that was the case for resource projects constructed in Australia compared to the US Gulf Coast, for example. Although not strictly public economic infrastructure, it is worthwhile briefly considering some of the evidence on comparative costs for major resource project construction.
Chart 7.1 shows the cost of thermal coal construction projects have risen appreciably in Australia in recent years. While costs in Australia may have been comparable with the rest of the world in 2007, that was no longer the case in 2012.
Chart 7.1: Thermal coal – capital spend to build a tonne of new capacity
Source: Minerals Council of Australia, 2012, ‘Opportunity at Risk’, cited in Barber, 2013, ‘BREE Annual Research Workshop 2013’
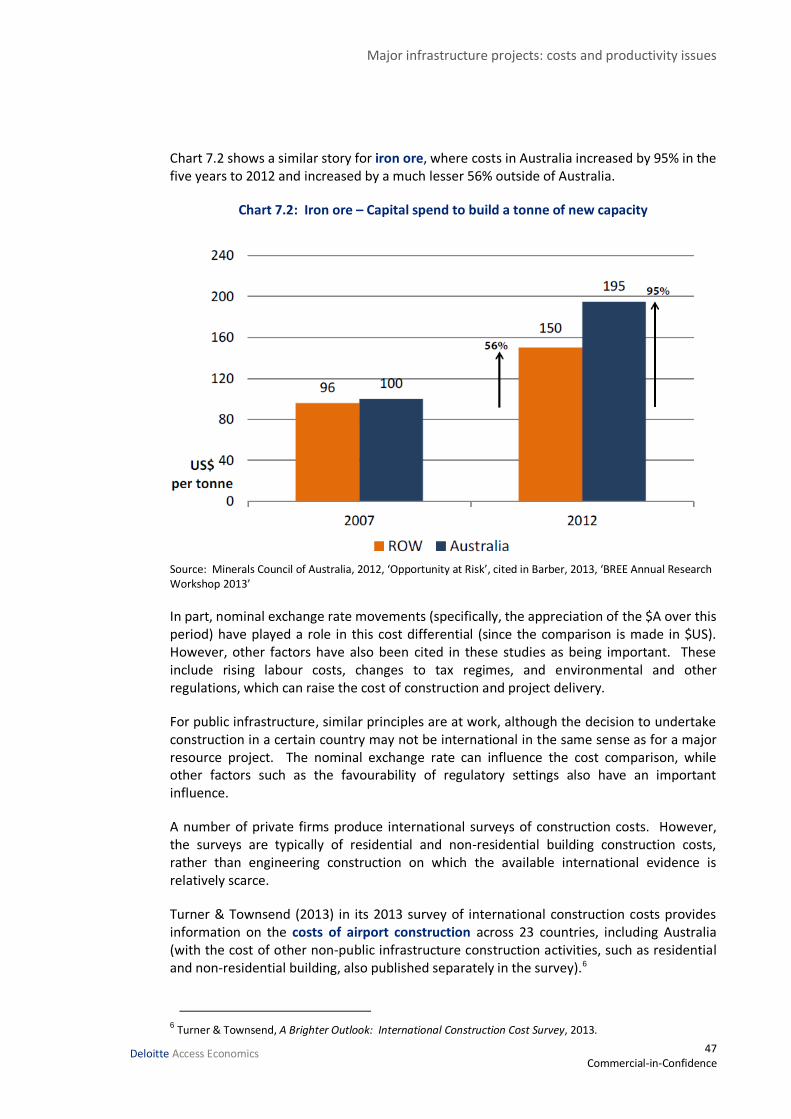
Major infrastructure projects: costs and productivity issues
47 Commercial-in-Confidence
Deloitte Access Economics
Chart 7.2 shows a similar story for iron ore, where costs in Australia increased by 95% in the five years to 2012 and increased by a much lesser 56% outside of Australia.
Chart 7.2: Iron ore – Capital spend to build a tonne of new capacity
Source: Minerals Council of Australia, 2012, ‘Opportunity at Risk’, cited in Barber, 2013, ‘BREE Annual Research Workshop 2013’
In part, nominal exchange rate movements (specifically, the appreciation of the $A over this period) have played a role in this cost differential (since the comparison is made in $US). However, other factors have also been cited in these studies as being important. These include rising labour costs, changes to tax regimes, and environmental and other regulations, which can raise the cost of construction and project delivery.
For public infrastructure, similar principles are at work, although the decision to undertake construction in a certain country may not be international in the same sense as for a major resource project. The nominal exchange rate can influence the cost comparison, while other factors such as the favourability of regulatory settings also have an important influence.
A number of private firms produce international surveys of construction costs. However, the surveys are typically of residential and non-residential building construction costs, rather than engineering construction on which the available international evidence is relatively scarce.
Turner & Townsend (2013) in its 2013 survey of international construction costs provides information on the costs of airport construction across 23 countries, including Australia (with the cost of other non-public infrastructure construction activities, such as residential and non-residential building, also published separately in the survey).6
6 Turner & Townsend, A Brighter Outlook: International Construction Cost Survey, 2013.
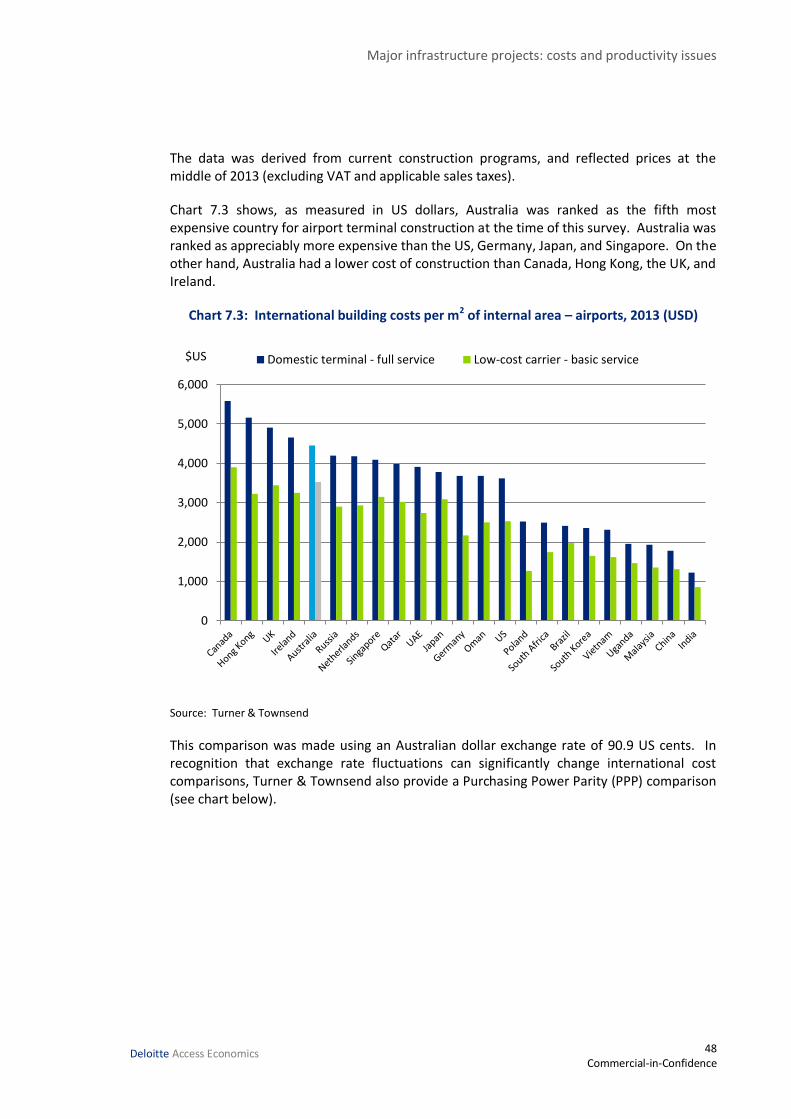
Major infrastructure projects: costs and productivity issues
48 Commercial-in-Confidence
Deloitte Access Economics
The data was derived from current construction programs, and reflected prices at the middle of 2013 (excluding VAT and applicable sales taxes).
Chart 7.3 shows, as measured in US dollars, Australia was ranked as the fifth most expensive country for airport terminal construction at the time of this survey. Australia was ranked as appreciably more expensive than the US, Germany, Japan, and Singapore. On the other hand, Australia had a lower cost of construction than Canada, Hong Kong, the UK, and Ireland.
Chart 7.3: International building costs per m2 of internal area – airports, 2013 (USD)
Source: Turner & Townsend
This comparison was made using an Australian dollar exchange rate of 90.9 US cents. In recognition that exchange rate fluctuations can significantly change international cost comparisons, Turner & Townsend also provide a Purchasing Power Parity (PPP) comparison (see chart below).
0
1,000
2,000
3,000
4,000
5,000
6,000
Domestic terminal - full service Low-cost carrier - basic service$US
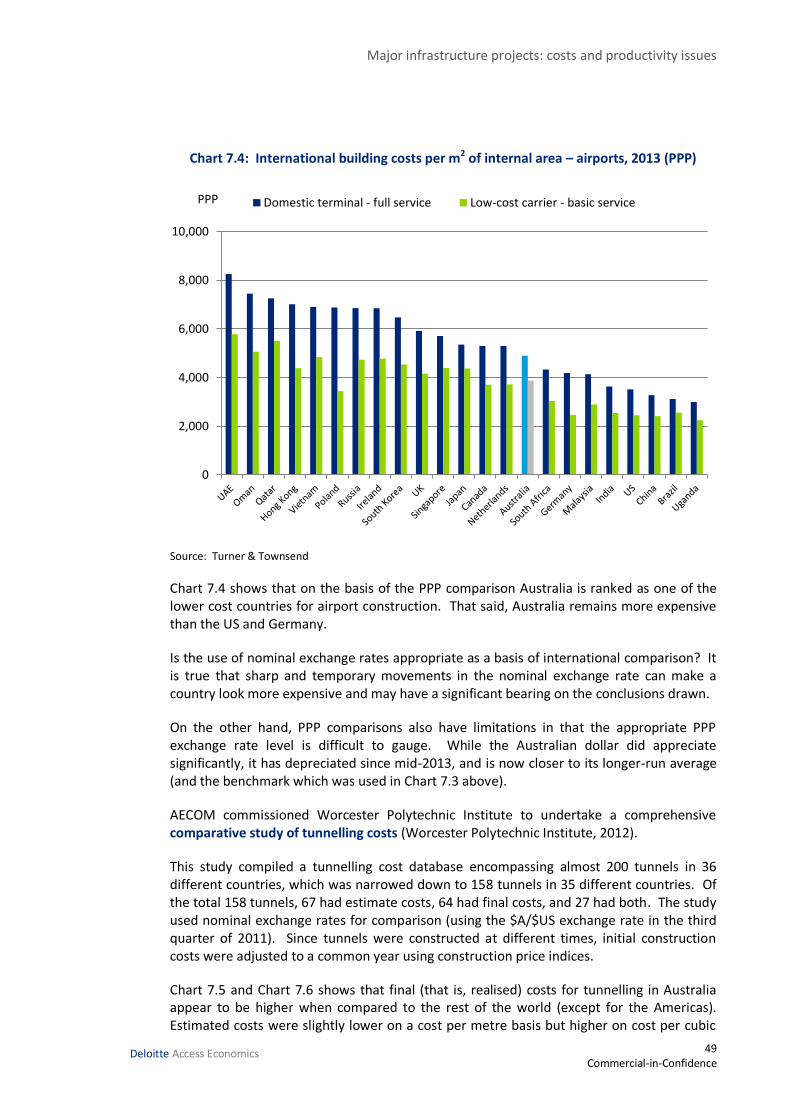
Major infrastructure projects: costs and productivity issues
49 Commercial-in-Confidence
Deloitte Access Economics
Chart 7.4: International building costs per m2 of internal area – airports, 2013 (PPP)
Source: Turner & Townsend
Chart 7.4 shows that on the basis of the PPP comparison Australia is ranked as one of the lower cost countries for airport construction. That said, Australia remains more expensive than the US and Germany.
Is the use of nominal exchange rates appropriate as a basis of international comparison? It is true that sharp and temporary movements in the nominal exchange rate can make a country look more expensive and may have a significant bearing on the conclusions drawn.
On the other hand, PPP comparisons also have limitations in that the appropriate PPP exchange rate level is difficult to gauge. While the Australian dollar did appreciate significantly, it has depreciated since mid-2013, and is now closer to its longer-run average (and the benchmark which was used in Chart 7.3 above).
AECOM commissioned Worcester Polytechnic Institute to undertake a comprehensive comparative study of tunnelling costs (Worcester Polytechnic Institute, 2012).
This study compiled a tunnelling cost database encompassing almost 200 tunnels in 36 different countries, which was narrowed down to 158 tunnels in 35 different countries. Of the total 158 tunnels, 67 had estimate costs, 64 had final costs, and 27 had both. The study used nominal exchange rates for comparison (using the $A/$US exchange rate in the third quarter of 2011). Since tunnels were constructed at different times, initial construction costs were adjusted to a common year using construction price indices.
Chart 7.5 and Chart 7.6 shows that final (that is, realised) costs for tunnelling in Australia appear to be higher when compared to the rest of the world (except for the Americas). Estimated costs were slightly lower on a cost per metre basis but higher on cost per cubic
0
2,000
4,000
6,000
8,000
10,000
Domestic terminal - full service Low-cost carrier - basic servicePPP
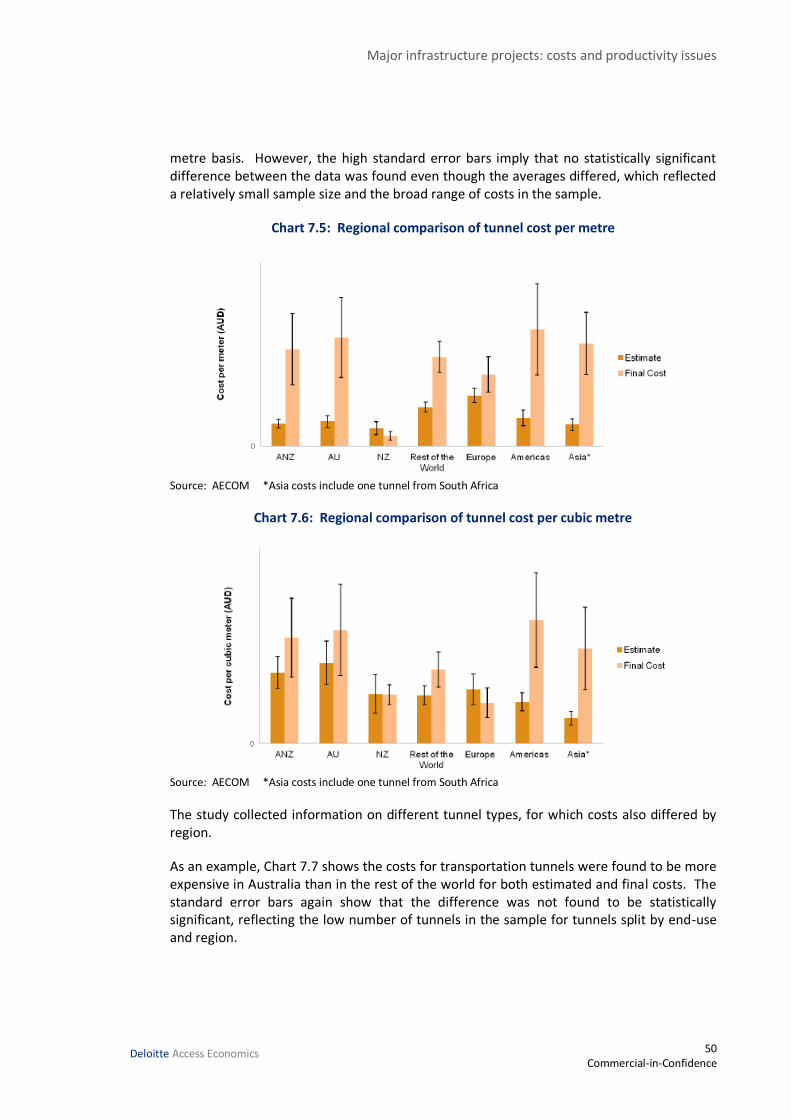
Major infrastructure projects: costs and productivity issues
50 Commercial-in-Confidence
Deloitte Access Economics
metre basis. However, the high standard error bars imply that no statistically significant difference between the data was found even though the averages differed, which reflected a relatively small sample size and the broad range of costs in the sample.
Chart 7.5: Regional comparison of tunnel cost per metre
Source: AECOM *Asia costs include one tunnel from South Africa
Chart 7.6: Regional comparison of tunnel cost per cubic metre
Source: AECOM *Asia costs include one tunnel from South Africa
The study collected information on different tunnel types, for which costs also differed by region.
As an example, Chart 7.7 shows the costs for transportation tunnels were found to be more expensive in Australia than in the rest of the world for both estimated and final costs. The standard error bars again show that the difference was not found to be statistically significant, reflecting the low number of tunnels in the sample for tunnels split by end-use and region.
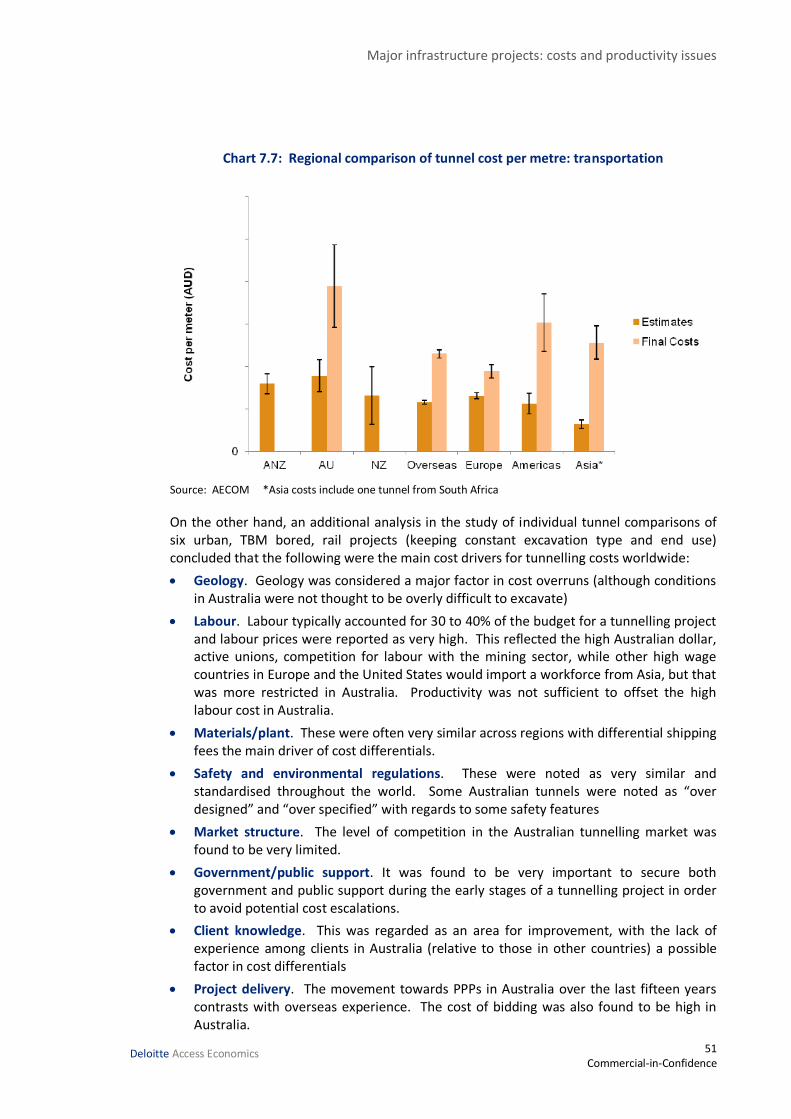
Major infrastructure projects: costs and productivity issues
51 Commercial-in-Confidence
Deloitte Access Economics
Chart 7.7: Regional comparison of tunnel cost per metre: transportation
Source: AECOM *Asia costs include one tunnel from South Africa
On the other hand, an additional analysis in the study of individual tunnel comparisons of six urban, TBM bored, rail projects (keeping constant excavation type and end use) concluded that the following were the main cost drivers for tunnelling costs worldwide:
Geology. Geology was considered a major factor in cost overruns (although conditions in Australia were not thought to be overly difficult to excavate)
Labour. Labour typically accounted for 30 to 40% of the budget for a tunnelling project and labour prices were reported as very high. This reflected the high Australian dollar, active unions, competition for labour with the mining sector, while other high wage countries in Europe and the United States would import a workforce from Asia, but that was more restricted in Australia. Productivity was not sufficient to offset the high labour cost in Australia.
Materials/plant. These were often very similar across regions with differential shipping fees the main driver of cost differentials.
Safety and environmental regulations. These were noted as very similar and standardised throughout the world. Some Australian tunnels were noted as “over designed” and “over specified” with regards to some safety features
Market structure. The level of competition in the Australian tunnelling market was found to be very limited.
Government/public support. It was found to be very important to secure both government and public support during the early stages of a tunnelling project in order to avoid potential cost escalations.
Client knowledge. This was regarded as an area for improvement, with the lack of experience among clients in Australia (relative to those in other countries) a possible factor in cost differentials
Project delivery. The movement towards PPPs in Australia over the last fifteen years contrasts with overseas experience. The cost of bidding was also found to be high in Australia.
Major infrastructure projects: costs and productivity issues
52 Commercial-in-Confidence
Deloitte Access Economics
In short, there are limitations to analysing public infrastructure construction costs internationally. These include the use of exchange rates, and data limitations. Yet, there is available evidence that suggests Australia has a higher cost of construction for at least some specific types of infrastructure. In turn, that drives an increased focus on the drivers of potentially inefficiently high construction costs in Australia. Industrial disputation is one of those costs – discussed in the next chapter.
7.2 ACA members’ views
ACA member respondents stated that labour costs in Australia are generally higher than in overseas markets where the labour market is more deregulated and less unionised, such as Asia. One respondent stated that the labour cost share is lower in overseas countries which have a lower labour cost environment such as South East Asia in general and the Middle East. Three respondents provided specific views on project costs in Australia compared to New Zealand. Two respondents considered that the project cost share for labour was significantly lower in New Zealand (and higher in Australia). Another respondent stated that Australian infrastructure projects have higher shares of tradespersons, labourers, equipment and material costs; and lower shares of professionals, support staff and other intermediate inputs (although, noting that direct comparisons are made difficult due to differential scope and contracting strategies).
It was also stated that the cost of bidding work in New Zealand represents a smaller portion of overall costs than in Australia. This was attributed to the tender process being much simpler in New Zealand compared to the cost of tendering tier 1 contracts in Australia, with Australian authorities requiring much more voluminous tender submissions than in New Zealand. Other respondents also stated that tender costs in Australia were high compared to other countries. This view is consistent with the finding in the Worcester Polytechnic Institute study of a relatively high cost of bidding in Australia compared to other countries.
Meanwhile, in terms of the best comparators for Australia in regard to public infrastructure construction costs, respondents had mixed views, with some pointing to the difficulties involved in the exercise of comparing costs across countries due to the many different variables involved (such as building design, inclusion/exclusion etc). Countries specifically stated included Canada, USA, UK/Europe/Scandinavia, and New Zealand. One respondent specifically stated that Canada was the best comparator country due to the number of similarities between the two countries’ infrastructure construction industries (relatively small population, large land mass and enormous geographic challenge, mining influence, environmental focus, and encouragement towards public-private infrastructure in government schemes).
Provide examples of specific labour cost benchmarks with those seen in comparable overseas countries.
One respondent stated that the indicative level for Australian labour hour cost for a tradesperson working on an urban infrastructure project was around $A65-70/hr. When compared to Eurostat data on labour costs (in EUR/hr) for EU countries, and converted using current market exchange rates, that shows Australia to have higher labour costs than any EU country except Norway.

Major infrastructure projects: costs and productivity issues
53 Commercial-in-Confidence
Deloitte Access Economics
One respondent cited the Mercer 2013 Survey results which indicated that the C&E sector within Australia commanded salary premiums compared to international comparisons including Norway, US, Canada, UK and Brazil.
Another respondent stated that in its own overseas operations, percentage pay increases in countries in Asia, South Pacific, Middle East closely reflected the increases determined in Australia (i.e. were within 1% of the Australian outcome, varying according to performance).
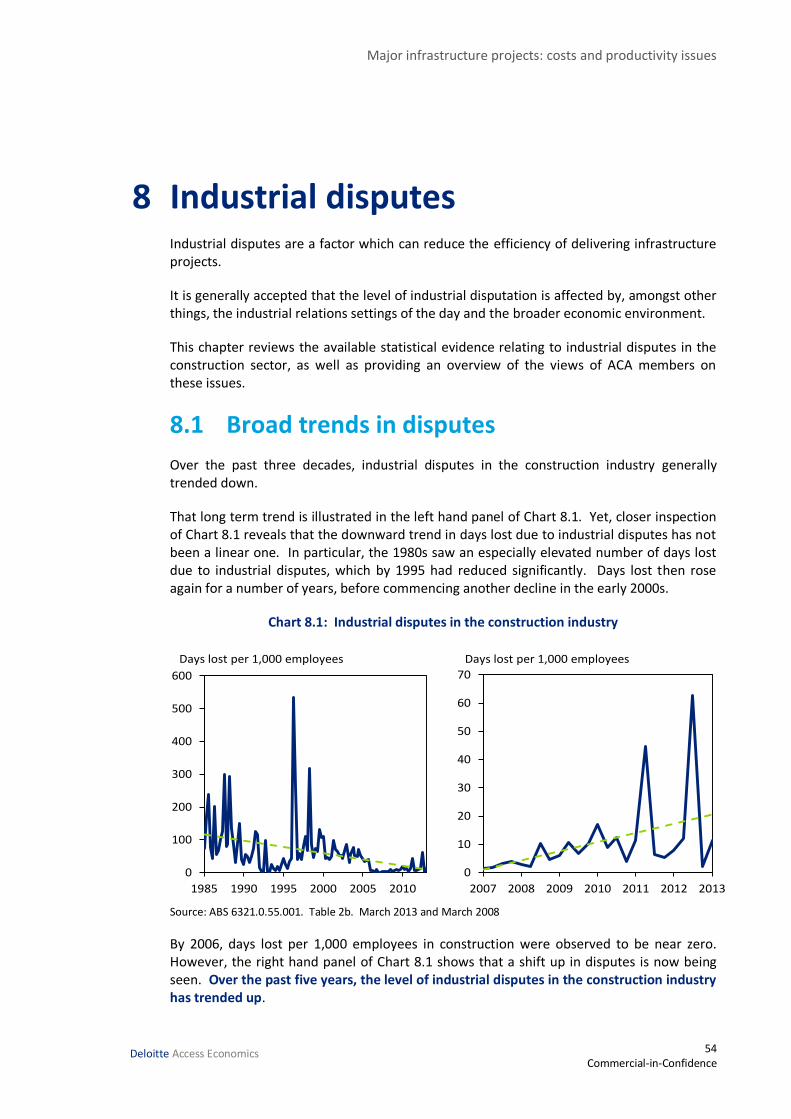
Major infrastructure projects: costs and productivity issues
54 Commercial-in-Confidence
Deloitte Access Economics
8 Industrial disputes Industrial disputes are a factor which can reduce the efficiency of delivering infrastructure projects.
It is generally accepted that the level of industrial disputation is affected by, amongst other things, the industrial relations settings of the day and the broader economic environment.
This chapter reviews the available statistical evidence relating to industrial disputes in the construction sector, as well as providing an overview of the views of ACA members on these issues.
8.1 Broad trends in disputes
Over the past three decades, industrial disputes in the construction industry generally trended down.
That long term trend is illustrated in the left hand panel of Chart 8.1. Yet, closer inspection of Chart 8.1 reveals that the downward trend in days lost due to industrial disputes has not been a linear one. In particular, the 1980s saw an especially elevated number of days lost due to industrial disputes, which by 1995 had reduced significantly. Days lost then rose again for a number of years, before commencing another decline in the early 2000s.
Chart 8.1: Industrial disputes in the construction industry
Source: ABS 6321.0.55.001. Table 2b. March 2013 and March 2008
By 2006, days lost per 1,000 employees in construction were observed to be near zero. However, the right hand panel of Chart 8.1 shows that a shift up in disputes is now being seen. Over the past five years, the level of industrial disputes in the construction industry has trended up.
0
10
20
30
40
50
60
70
2007 2008 2009 2010 2011 2012 2013
Days lost per 1,000 employees
0
100
200
300
400
500
600
1985 1990 1995 2000 2005 2010
Days lost per 1,000 employees
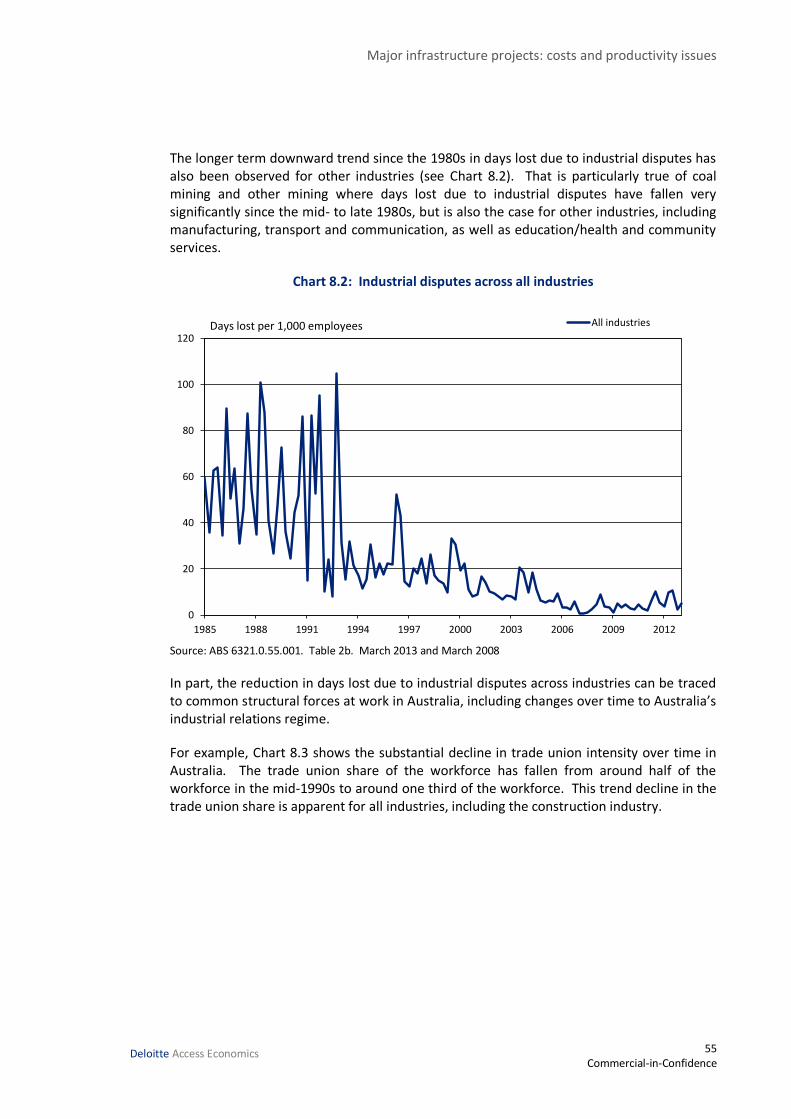
Major infrastructure projects: costs and productivity issues
55 Commercial-in-Confidence
Deloitte Access Economics
The longer term downward trend since the 1980s in days lost due to industrial disputes has also been observed for other industries (see Chart 8.2). That is particularly true of coal mining and other mining where days lost due to industrial disputes have fallen very significantly since the mid- to late 1980s, but is also the case for other industries, including manufacturing, transport and communication, as well as education/health and community services.
Chart 8.2: Industrial disputes across all industries
Source: ABS 6321.0.55.001. Table 2b. March 2013 and March 2008
In part, the reduction in days lost due to industrial disputes across industries can be traced to common structural forces at work in Australia, including changes over time to Australia’s industrial relations regime.
For example, Chart 8.3 shows the substantial decline in trade union intensity over time in Australia. The trade union share of the workforce has fallen from around half of the workforce in the mid-1990s to around one third of the workforce. This trend decline in the trade union share is apparent for all industries, including the construction industry.
0
20
40
60
80
100
120
1985 1988 1991 1994 1997 2000 2003 2006 2009 2012
All industriesDays lost per 1,000 employees
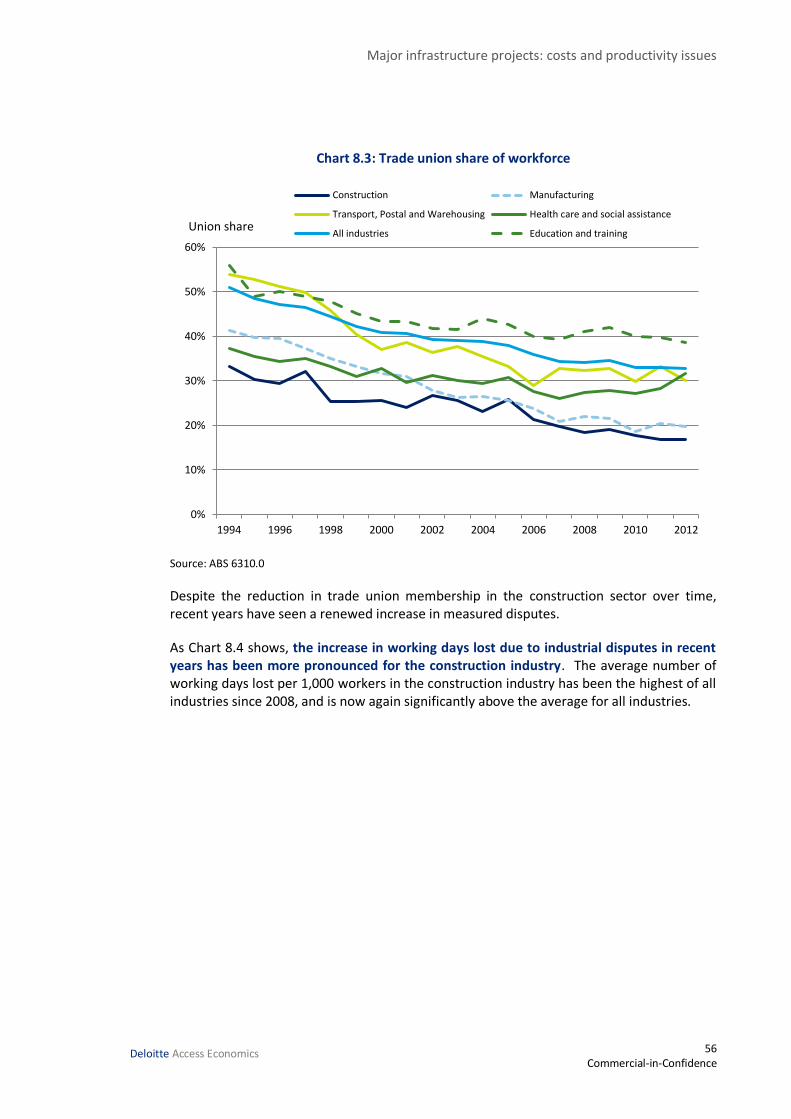
Major infrastructure projects: costs and productivity issues
56 Commercial-in-Confidence
Deloitte Access Economics
Chart 8.3: Trade union share of workforce
Source: ABS 6310.0
Despite the reduction in trade union membership in the construction sector over time, recent years have seen a renewed increase in measured disputes.
As Chart 8.4 shows, the increase in working days lost due to industrial disputes in recent years has been more pronounced for the construction industry. The average number of working days lost per 1,000 workers in the construction industry has been the highest of all industries since 2008, and is now again significantly above the average for all industries.
0%
10%
20%
30%
40%
50%
60%
1994 1996 1998 2000 2002 2004 2006 2008 2010 2012
Construction Manufacturing
Transport, Postal and Warehousing Health care and social assistance
All industries Education and trainingUnion share
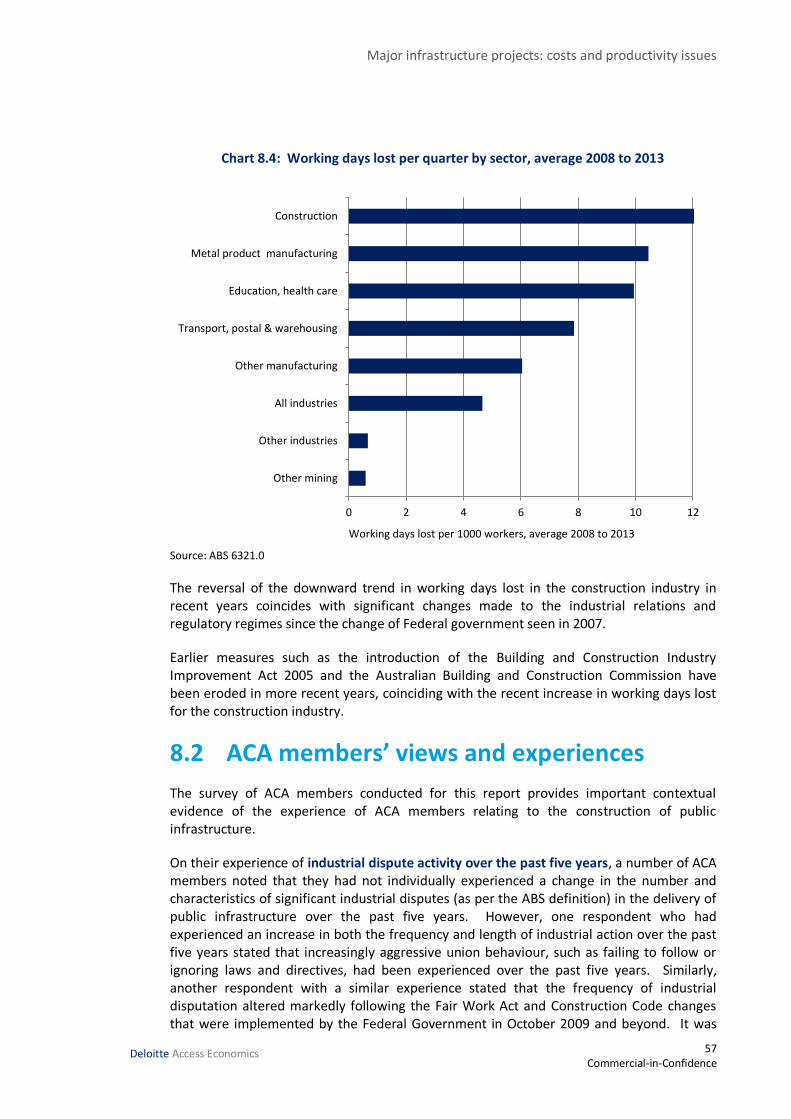
Major infrastructure projects: costs and productivity issues
57 Commercial-in-Confidence
Deloitte Access Economics
Chart 8.4: Working days lost per quarter by sector, average 2008 to 2013
Source: ABS 6321.0
The reversal of the downward trend in working days lost in the construction industry in recent years coincides with significant changes made to the industrial relations and regulatory regimes since the change of Federal government seen in 2007.
Earlier measures such as the introduction of the Building and Construction Industry Improvement Act 2005 and the Australian Building and Construction Commission have been eroded in more recent years, coinciding with the recent increase in working days lost for the construction industry.
8.2 ACA members’ views and experiences
The survey of ACA members conducted for this report provides important contextual evidence of the experience of ACA members relating to the construction of public infrastructure.
On their experience of industrial dispute activity over the past five years, a number of ACA members noted that they had not individually experienced a change in the number and characteristics of significant industrial disputes (as per the ABS definition) in the delivery of public infrastructure over the past five years. However, one respondent who had experienced an increase in both the frequency and length of industrial action over the past five years stated that increasingly aggressive union behaviour, such as failing to follow or ignoring laws and directives, had been experienced over the past five years. Similarly, another respondent with a similar experience stated that the frequency of industrial disputation altered markedly following the Fair Work Act and Construction Code changes that were implemented by the Federal Government in October 2009 and beyond. It was
0 2 4 6 8 10 12
Other mining
Other industries
All industries
Other manufacturing
Transport, postal & warehousing
Education, health care
Metal product manufacturing
Construction
Working days lost per 1000 workers, average 2008 to 2013
Major infrastructure projects: costs and productivity issues
58 Commercial-in-Confidence
Deloitte Access Economics
also noted by some respondents that Queensland had emerged as an industrial relations ‘hot spot’.
On their experience of industrial dispute activity over the past ten years, changes to the regulatory and institutional regime were cited by several respondents as having initially improved the level of industrial dispute activity. Specifically, these changes included the introduction of a revised national code of practice, introduction of the ABCC, and the introduction of the Work Choices industrial relations legislation. One member stated that the economic downturn had reduced industrial dispute activity, while another stated that there had been no change experienced in the past ten years.
The ABS data on industrial disputes noted above is based on stoppages of work of ten working days or more. ACA members were also asked about their experience with on-site industrial actions which would not be defined as an industrial dispute.
On-site industrial actions during the delivery of public infrastructure were considered as a source of pressure on project costs but respondents found it difficult to specifically quantify that cost. Examples of such industrial actions and issues included dealing with union right of entry visits where there is conjecture about whether procedures have been properly complied with, union complaints and allegations about otherwise lawful and allowable changes to work patterns and behaviours, and about the arrangements of properly engaged and legitimate subcontractors.
It was stated that these types of activities placed upward pressure on costs due to:
the need to engage specialist industrial relations resources where they might not otherwise be required;
time spent by managers, supervisors, and others on industrial issues rather than on the core focus of their roles; and
the need to cover industrial relations risk by ensuring EBAs were in place for all projects and all subcontractors (thereby increasing the need to engage with unions).
Similar general observations were made about changes in on-site industrial actions over the past five years, with respondents citing factors such as the watering down of the ABCC (and lack of regulatory accountability), and repeal of the Workplace Relations Act, as examples that led to increased union activity.
Are there differences in how work practices and industrial relations affect different types of construction?
By type of infrastructure (roads, railways, ports, water supply and storage, energy, communications) – respondents generally were in agreement that there were differences by type of infrastructure. Reasons given included that the specific union involved can differ by type of infrastructure (which has an impact on work practices), with one respondent stating that there were far less disputes in road and rail infrastructure works than projects involving building construction. One respondent noted that some types of infrastructure are different as characterised by their scale or nature of construction, while another noted that industrial relations risk is generally higher the less direct delivery undertaken by the head contractor. One respondent also noted that higher profile civil construction draws increased industrial impacts.
Major infrastructure projects: costs and productivity issues
59 Commercial-in-Confidence
Deloitte Access Economics
By the value of the project – respondents were unanimous in stating that the larger the project by value the greater the interest of unions and industrial relations risk, with industrial disputes more likely. It was stated that unions may feel that the ‘stakes are higher’ with a higher profile for a high value project. Disputes may relate to contents of agreements, the use of a project agreement rather than an existing agreement, increased site allowance and many other terms and conditions of employment.
By the project duration? – a minority of respondents stated that there was generally no difference, while others thought that there were differences. The latter stated that longer projects may extend across Government and union leadership terms, with associated changes in industrial relations, while disputes over the content of agreements or their renegotiation were also stated to be more likely for longer projects.
Between different jurisdictions (including urban vs regional projects)? – a majority of respondents stated that there were differences, with urban industrial activity generally more coordinated and CBD projects thought to be more likely to be targeted due to higher visibility. A minority of respondents experienced fewer differences. One respondent stated that Victorian projects cost approximately 20-30% more due to expected terms and conditions for infrastructure projects. Another respondent noted a recent trend of industrial issues also carrying into regional projects, while traditionally urban projects had greater prospect of industrial issues.
For greenfield versus brownfield projects? – the majority of respondents reported that there was generally no significant difference. One respondent stated greenfields projects were inherently more difficult from an industrial relations perspective, particularly given the enterprise bargaining power handed to unions by the Fair Work Act from 2009 onwards.
Potential solutions to reduce the level of industrial disputes
ACA members were asked for their suggestions of potential solutions to reduce the level of industrial disputes and on-site industrial actions in the future (including examples of best practice). ACA member suggestions have been grouped below under broad themes.
Institutional reform
Reintroduction of building and construction industry reforms that were implemented in 2005 following the Cole Royal Commission, including an effective Construction Code and a willing and able regulator such as the Australian Building and Construction Commissioner.
Amendments to the Fair Work Act so that bargaining claims and enterprise agreements should only deal with 'permitted matters' and not any other matters . 'Permitted matters' should be defined as matters that pertain to the relationship between an employer and its employees.
The ABCC to vet all new industrial instruments for prohibited content and code compliance before approval can be given by the Fair Work Commission.
Have a central body involved in overseeing Greenfields Agreements negotiated with employers and unions.
Major infrastructure projects: costs and productivity issues
60 Commercial-in-Confidence
Deloitte Access Economics
Employee representatives/delegates training be overseen by a Government agency with involvement by both union and employer trainers, and paid for by the union with the employer to meet the cost of wages for the duration of the course.
Enforce strict right of access provisions in legislation. Greater penalties for unsanctioned action and provision for recouping loss to contractors for delay and disruption caused by the action.
Right of entry for union officials
Genuine stoppages of work for health and safety issues need to be monitored and overseen by a central body.
The Fair Work Commission should have an active role in removing right of entry permits for union officials who act unreasonably when exercising a right of entry or otherwise disrupt work.
The list of 'unlawful terms' in the Fair Work Act should be expanded to include clauses which impose restrictions or limitations on the engagement of subcontractors, clauses which deal with right of entry for union officials, clauses which provide for union meetings and clauses which provide for union access to inductions.
Introduce a requirement that union officials must provide 24 hours’ notice when exercising a right of entry for WHS purposes and must also provide details of the alleged breaches of WHS laws and why such breaches involve an imminent risk to the health and safety of workers.
Where an enterprise agreement applies to a group of workers and a union is covered by the agreement, only the union covered by the agreement should have the right to enter the premises or notify disputes.
A union official's right to enter should be conditional upon the official acting reasonably and not disrupting work.
Higher level of ‘reference checks' for persons to become authorised Officers to enter premises for inspection of pay breaches and OH&S breaches.
Regulation of union behaviour and other matters
A union official should only be permitted to hold discussions with employees during meal times or other breaks and in a room nominated by the occupier of the premises.
The occupier of the worksite should have the right to determine the location of union meetings provided that the location is reasonable and does not breach a person's freedom of association rites.
Anti-bullying legislation should be applied to union officials.
Simplify unfair dismissal laws, including genuine redundancy definition.
Remove reverse onus of proof and narrow scope of adverse action laws.
Fair Work Commission orders to cease unprotected industrial action must be abided by and immediate breach if ignored. Presently, an employer must go to the Federal Court to enforce the Order at significant financial cost and time to the employer.
There are many more suggestions that could be added but essentially in Australia we need to be aware that on many infrastructure projects our work practices, hours of work and hourly rates of pay for blue collar workers are out of step with other countries in which we operate.
Major infrastructure projects: costs and productivity issues
61 Commercial-in-Confidence
Deloitte Access Economics
9 Conclusions The analysis in this report has highlighted some key trends in the delivery of public infrastructure projects in Australia:
Consistent with the demand cycles of recent years, relative costs in engineering construction rose notably up until the GFC, but have moderated some of their gains since then.
Construction sector wages relative to other sectors grew notably across the same period, but have not fallen back (implying that non-wage costs have seen a more substantial relative decline).
That wage growth has been stronger when one examines EBAs where union impacts are more evident. Wage rises from EBAs have grown faster than wages in general to a much greater extent in the construction sector than in any other sector.
Although there is some sign that construction sector productivity relative to other sectors also rose, it did so to a rather smaller extent than relative wages did. That productivity boost is also now fading (in part because measured productivity moves with the economic cycle), while the increase in relative construction wages has not.
Other things equal, that combination says that there has been more going on in construction sector costs – particularly wages – than just the demand cycles of the past decade.
It is also worth highlighting that the rate of engineering construction cost increase has been notably higher for public sector projects (the focus of the Commission’s review) than private sector projects. Given the significant demand seen for resources investment, and the combination of a rising $A and high import component for resources projects (pushing down local currency costs of imported materials and equipment), one might have thought this would be the other way around.
A loss of competitiveness in delivering infrastructure projects creates difficulties for the Australian economy going forward.
The persistence of higher construction costs will act as a barrier to infrastructure projects in the pipeline going ahead, and are now combining with less favourable demand conditions to result in what may be a notable downturn in major project spending. Indeed, the slowdown in construction now beginning looks set to slow the growth in Australia’s capital base to the weakest seen in many decades.
Chart 9.1 shows the rate of growth in Australia’s capital stock is moderating, and on current trends looks set to move much lower over the coming years.
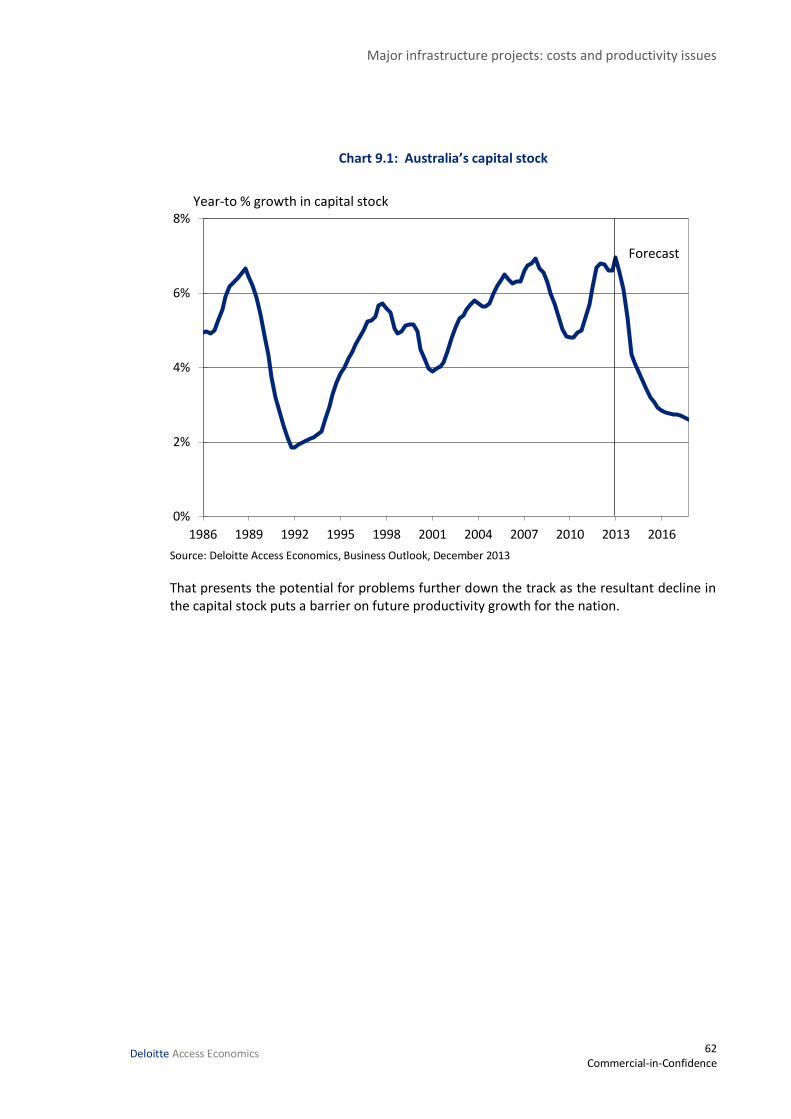
Major infrastructure projects: costs and productivity issues
62 Commercial-in-Confidence
Deloitte Access Economics
Chart 9.1: Australia’s capital stock
Source: Deloitte Access Economics, Business Outlook, December 2013
That presents the potential for problems further down the track as the resultant decline in the capital stock puts a barrier on future productivity growth for the nation.
0%
2%
4%
6%
8%
1986 1989 1992 1995 1998 2001 2004 2007 2010 2013 2016
Y
Forecast
Year-to % growth in capital stock
Forecast
Major infrastructure projects: costs and productivity issues
63 Commercial-in-Confidence
Deloitte Access Economics
References ABS (Australian Bureau of Statistics) 2013a, Australian National Accounts: National Income,
Expenditure and Product, Cat. no. 5206.0.
2013b, Consumer Price Index, Australia, Cat. no. 6401.0.
2013d, Employee Earnings, Benefits and Trade Union Membership, Australia, Cat. no. 6310.0
2013e, Engineering Construction Activity, Australia, Cat. no. 8762.0.
2013f, Industrial Disputes, Australia, Cat. no. 6321.0.55.001
2013g, Labour Force, Australia, Cat. no. 6202.0.
2013h, Producer Price Indexes, Australia, Cat. no. 6427.0.
2013k, Wage Price Index, Australia, Cat. no. 6345.0.
Bureau of Infrastructure, Transport and Regional Economics (BITRE), 2013, BITRE Road Construction and Maintenance Price Index and Sub-Index—2013 update, Information Sheet 49, BITRE, Canberra.
Business Council of Australia 2012, Pipeline of Pipe Dream? Securing Australia’s Investment Future.
Deloitte Access Economics 2013, Business Outlook December 2013.
Deloitte Access Economics 2013, Investment Monitor database December 2013.
Department of Employment 2014, Trends in Federal Enterprise Bargaining September quarter 2013.
Department of Employment 2014, Workplace Agreements Database special data request.
Efron, N, and Read, M 2012, ‘Analysing International Tunnel Costs: An Interactive Qualifying Project’, Worcester Polytechnic Institute, http://www.wpi.edu/Pubs/E-project/Available/E-project-043012-122558/unrestricted/Analysing_International_Tunnelling_Costs_Public_Report.pdf, accessed 30 January 2014.
Independent Project Analysis Inc. 2012, The Performance of Australian Industrial Projects, Report prepared for the Business Council of Australia May 2012.
Minerals Council of Australia 2012, Opportunity at Risk, cited in Barber, 2013, BREE Annual Research Workshop 2013.
Rawlinsons Construction Cost Consultants and Quantity Surveyors 2006, Rawlinsons Australian Construction Handbook 2006, 24th ed, Rawlhouse Publishing, Perth.
Major infrastructure projects: costs and productivity issues
64 Commercial-in-Confidence
Deloitte Access Economics
- 2007, Rawlinsons Australian Construction Handbook 2007, 25th ed, Rawlhouse Publishing, Perth.
- 2008, Rawlinsons Australian Construction Handbook 2008, 26th ed, Rawlhouse Publishing, Perth.
- 2009, Rawlinsons Australian Construction Handbook 2009, 27th ed, Rawlhouse Publishing, Perth.
- 2010, Rawlinsons Australian Construction Handbook 2010, 28th ed, Rawlhouse Publishing, Perth.
- 2011, Rawlinsons Australian Construction Handbook 2011, 29th ed, Rawlhouse Publishing, Perth.
- 2012, Rawlinsons Australian Construction Handbook 2012, 30th ed, Rawlhouse Publishing, Perth.
- 2013, Rawlinsons Australian Construction Handbook 2013, 31st ed, Rawlhouse Publishing, Perth.
Turner & Townsend 2013, A Brighter Outlook: International Construction Cost Survey 2013.
Major infrastructure projects: costs and productivity issues
65 Commercial-in-Confidence
Deloitte Access Economics
Limitation of our work
General use restriction
This report is prepared solely for the use of the Australian Constructors Association. This
report is not intended to and should not be used or relied upon by anyone else and we
accept no duty of care to any other person or entity. The report has been prepared for the
purpose of providing information on costs and productivity issues in relation to major projects. You should not refer to or use our name or the advice for any other purpose.
Major infrastructure projects: costs and productivity issues
Contact us
Deloitte Access Economics ACN: 149 633 116 Level 1 9 Sydney Avenue Barton ACT 2600 PO Box 6334 Kingston ACT 2604 Australia Tel: +61 2 6175 2000 Fax: +61 2 6175 2001 www.deloitteaccesseconomics.com.au
Deloitte Access Economics is Australia’s pre-eminent economics advisory practice and a member of Deloitte's global economics group. The Directors and staff of Access Economics joined Deloitte in early 2011.
About Deloitte
Deloitte refers to one or more of Deloitte Touche Tohmatsu Limited, a UK private company limited by guarantee, and its network of member firms, each of which is a legally separate and independent entity. Please see www.deloitte.com/au/about for a detailed description of the legal structure of Deloitte Touche Tohmatsu Limited and its member firms.
Deloitte provides audit, tax, consulting, and financial advisory services to public and private clients spanning multiple industries. With a globally connected network of member firms in more than 150 countries, Deloitte brings world-class capabilities and deep local expertise to help clients succeed wherever they operate. Deloitte's approximately 200,000 professionals are committed to becoming the standard of excellence.
About Deloitte Australia
In Australia, the member firm is the Australian partnership of Deloitte Touche Tohmatsu. As one of Australia’s leading professional services firms. Deloitte Touche Tohmatsu and its affiliates provide audit, tax, consulting, and financial advisory services through approximately 6,000 people across the country. Focused on the creation of value and growth, and known as an employer of choice for innovative human resources programs, we are dedicated to helping our clients and our people excel. For more information, please visit our web site at www.deloitte.com.au.
Liability limited by a scheme approved under Professional Standards Legislation.
Member of Deloitte Touche Tohmatsu Limited
© 2014 Deloitte Access Economics Pty Ltd