MAIZEWALL. Database and Developmental Gene … and Developmental Gene Expression Profiling of Cell...
25
MAIZEWALL. Database and Developmental Gene Expression Profiling of Cell Wall Biosynthesis and Assembly in Maize 1[W] Sabine Guillaumie, He ´le `ne San-Clemente, Caroline Deswarte, Yves Martinez, Catherine Lapierre, Alain Murigneux, Yves Barrie `re, Magalie Pichon, and Deborah Goffner* Universite ´ Paul Sabatier, Centre National de la Recherche Scientifique, Unite ´ Mixte de Recherche 5546, 31326 Castanet-Tolosan, France (S.G., H.S.-C., C.D., Y.M., M.P., D.G.); Institut National de la Recherche Agronomique (INRA), Unite ´ de Ge ´ne ´tique et d’Ame ´lioration des Plantes Fourrage `res, 86600 Lusignan, France (S.G., Y.B.); INRA-Institut National Agronomique Paris-Grignon, Unite ´ de Chimie Biologique, 78850 Thiverval-Grignon, France (C.L.); and Biogemma, Campus Universitaire des Ce ´zeaux, 63170 Aubie `re, France (A.M.) An extensive search for maize (Zea mays) genes involved in cell wall biosynthesis and assembly has been performed and 735 sequences have been centralized in a database, MAIZEWALL (http://www.polebio.scsv.ups-tlse.fr/MAIZEWALL). MAIZE- WALL contains a bioinformatic analysis for each entry and gene expression data that are accessible via a user-friendly interface. A maize cell wall macroarray composed of a gene-specific tag for each entry was also constructed to monitor global cell wall-related gene expression in different organs and during internode development. By using this macroarray, we identified sets of genes that exhibit organ and internode-stage preferential expression profiles. These data provide a comprehensive fingerprint of cell wall-related gene expression throughout the maize plant. Moreover, an in-depth examination of genes involved in lignin biosynthesis coupled to biochemical and cytological data from different organs and stages of internode development has also been undertaken. These results allow us to trace spatially and developmentally regulated, putative preferential routes of monolignol biosynthesis involving specific gene family members and suggest that, although all of the gene families of the currently accepted monolignol biosynthetic pathway are conserved in maize, there are subtle differences in family size and a high degree of complexity in spatial expression patterns. These differences are in keeping with the diversity of lignified cell types throughout the maize plant. Cell walls play an essential role in determining cell size and shape and, as a result, contribute to functional specialization of different cell types. The physicochem- ical nature of the cell wall is highly dynamic, changing dramatically during cell growth and expansion. During normal growth and development, an expanding cell must have a cell wall that is flexible enough to allow for rapid increase in cell volume, whereas, when expan- sion ceases, the wall must afford rigidity. During the differentiation of specialized cell types, such as fibers and xylem tracheary elements (TEs), in addition to primary walls, secondary walls are subsequently de- posited to ensure additional mechanical strength and solute conduction. Beyond normal cell wall dynamics, during growth and development, wall structure may also change as a function of biotic or abiotic stress. This may occur through a wide variety of mecha- nisms, including lignin (Mitchell et al., 1999) or callose (Rodriguez-Galvez and Mendgen, 1995) deposition, se- cretion of structural proteins (Bestwick et al., 1995), and oxidative cross-linking of existing Pro-rich or Hyp-rich glycoproteins (Bradley et al., 1992; Otte and Barz, 2000). As a first step in obtaining information about indi- vidual cell wall-related gene products and their role in plant growth and development, many genomic approaches have been undertaken. An extensive ge- nomic cell wall database has recently become available in Arabidopsis (Arabidopsis thaliana; Girke et al., 2004). In this Cell Wall Navigator database, more than 5,000 putative cell wall genes coding for enzymes and structural proteins known to be involved in primary wall metabolism have been assembled. It has been predicted that over 100 protein families with over 1,000 members are involved in cell wall-related pro- cesses (Henrissat et al., 2001). As for genomic initia- tives of secondary walls, large expressed sequence tag (EST) and microarray datasets have been generated for agronomic and model species, including cotton (Gos- sypium hirsutum) fibers (Arpat et al., 2004), poplar (Populus tremuloides; Hertzberg et al., 2001) and pine 1 This work was supported by the Ge ´noplante Programme, Institut National de la Recherche Agronomique, and the Centre National de la Recherche Scientifique. * Corresponding author; e-mail [email protected]; fax 33– 562–19–35–02. The author responsible for distribution of materials integral to the findings presented in this article in accordance with the policy described in the Instructions for Authors (www.plantphysiol.org) is: Deborah Goffner ([email protected]). [W] The online version of this article contains Web-only data. www.plantphysiol.org/cgi/doi/10.1104/pp.106.086405 Plant Physiology, January 2007, Vol. 143, pp. 339–363, www.plantphysiol.org Ó 2006 American Society of Plant Biologists 339 www.plantphysiol.org on June 13, 2018 - Published by Downloaded from Copyright © 2007 American Society of Plant Biologists. All rights reserved.
-
Upload
vuongtuong -
Category
Documents
-
view
224 -
download
4
Transcript of MAIZEWALL. Database and Developmental Gene … and Developmental Gene Expression Profiling of Cell...

MAIZEWALL. Database and Developmental GeneExpression Profiling of Cell Wall Biosynthesisand Assembly in Maize 1[W]
Sabine Guillaumie, Helene San-Clemente, Caroline Deswarte, Yves Martinez, Catherine Lapierre,Alain Murigneux, Yves Barriere, Magalie Pichon, and Deborah Goffner*
Universite Paul Sabatier, Centre National de la Recherche Scientifique, Unite Mixte de Recherche 5546,31326 Castanet-Tolosan, France (S.G., H.S.-C., C.D., Y.M., M.P., D.G.); Institut National de la RechercheAgronomique (INRA), Unite de Genetique et d’Amelioration des Plantes Fourrageres, 86600 Lusignan,France (S.G., Y.B.); INRA-Institut National Agronomique Paris-Grignon, Unite de Chimie Biologique,78850 Thiverval-Grignon, France (C.L.); and Biogemma, Campus Universitaire des Cezeaux,63170 Aubiere, France (A.M.)
An extensive search for maize (Zea mays) genes involved in cell wall biosynthesis and assembly has been performed and 735sequences have been centralized in a database, MAIZEWALL (http://www.polebio.scsv.ups-tlse.fr/MAIZEWALL). MAIZE-WALL contains a bioinformatic analysis for each entry and gene expression data that are accessible via a user-friendlyinterface. A maize cell wall macroarray composed of a gene-specific tag for each entry was also constructed to monitor globalcell wall-related gene expression in different organs and during internode development. By using this macroarray, weidentified sets of genes that exhibit organ and internode-stage preferential expression profiles. These data provide acomprehensive fingerprint of cell wall-related gene expression throughout the maize plant. Moreover, an in-depth examinationof genes involved in lignin biosynthesis coupled to biochemical and cytological data from different organs and stages ofinternode development has also been undertaken. These results allow us to trace spatially and developmentally regulated,putative preferential routes of monolignol biosynthesis involving specific gene family members and suggest that, although allof the gene families of the currently accepted monolignol biosynthetic pathway are conserved in maize, there are subtledifferences in family size and a high degree of complexity in spatial expression patterns. These differences are in keeping withthe diversity of lignified cell types throughout the maize plant.
Cell walls play an essential role in determining cellsize and shape and, as a result, contribute to functionalspecialization of different cell types. The physicochem-ical nature of the cell wall is highly dynamic, changingdramatically during cell growth and expansion. Duringnormal growth and development, an expanding cellmust have a cell wall that is flexible enough to allow forrapid increase in cell volume, whereas, when expan-sion ceases, the wall must afford rigidity. During thedifferentiation of specialized cell types, such as fibersand xylem tracheary elements (TEs), in addition toprimary walls, secondary walls are subsequently de-posited to ensure additional mechanical strength andsolute conduction. Beyond normal cell wall dynamics,
during growth and development, wall structure mayalso change as a function of biotic or abiotic stress.This may occur through a wide variety of mecha-nisms, including lignin (Mitchell et al., 1999) or callose(Rodriguez-Galvez and Mendgen, 1995) deposition, se-cretion of structural proteins (Bestwick et al., 1995), andoxidative cross-linking of existing Pro-rich or Hyp-richglycoproteins (Bradley et al., 1992; Otte and Barz, 2000).
As a first step in obtaining information about indi-vidual cell wall-related gene products and their rolein plant growth and development, many genomicapproaches have been undertaken. An extensive ge-nomic cell wall database has recently become availablein Arabidopsis (Arabidopsis thaliana; Girke et al., 2004).In this Cell Wall Navigator database, more than 5,000putative cell wall genes coding for enzymes andstructural proteins known to be involved in primarywall metabolism have been assembled. It has beenpredicted that over 100 protein families with over1,000 members are involved in cell wall-related pro-cesses (Henrissat et al., 2001). As for genomic initia-tives of secondary walls, large expressed sequence tag(EST) and microarray datasets have been generated foragronomic and model species, including cotton (Gos-sypium hirsutum) fibers (Arpat et al., 2004), poplar(Populus tremuloides; Hertzberg et al., 2001) and pine
1 This work was supported by the Genoplante Programme,Institut National de la Recherche Agronomique, and the CentreNational de la Recherche Scientifique.
* Corresponding author; e-mail [email protected]; fax 33–562–19–35–02.
The author responsible for distribution of materials integral to thefindings presented in this article in accordance with the policydescribed in the Instructions for Authors (www.plantphysiol.org) is:Deborah Goffner ([email protected]).
[W] The online version of this article contains Web-only data.www.plantphysiol.org/cgi/doi/10.1104/pp.106.086405
Plant Physiology, January 2007, Vol. 143, pp. 339–363, www.plantphysiol.org � 2006 American Society of Plant Biologists 339 www.plantphysiol.orgon June 13, 2018 - Published by Downloaded from
Copyright © 2007 American Society of Plant Biologists. All rights reserved.
(Pinus sylvestris; Pavy et al., 2005) wood, zinnia (Zinniaelegans) TEs (Demura et al., 2002; Milioni et al., 2002;Pesquet et al., 2005), and Arabidopsis (Zhao et al.,2005). Despite the abundance of genomic informationnow available, the function of the large majority ofthese genes is still unknown.
As compared to Arabidopsis and dicotyledonousplants in general, cell wall research in monocots and,in particular, maize (Zea mays) has been much lessexplored. In the case of primary walls, some isolatedexamples of the role of cell wall enzymes in relation tospecific physiological processes have been reported.For example, the role of cell wall-loosening proteins,including expansins and xyloglucan endotransglyco-sylase/hydrolases (XTHs), in promoting cell elonga-tion during water deficit has been investigated inmaize root tips (Wu et al., 1994, 1996). The inventoryof cell wall proteins in the elongation zone of maizeroots has recently been enlarged through a systematicproteomic approach (Zhu et al., 2006). Interestingly,although many identified proteins are similar to thosepreviously found in dicot primary walls, many maizewall proteins appear to be specific to monocot walls. Itshould be possible, at least to some extent, to extrap-olate information from cell wall genomics in dicotspecies, but, considering the profound differences incell wall structure and composition of monocot anddicot cell walls, it is clear that many biosynthetic andremodeling regulatory mechanisms will not be con-served among these phylogenetically distant taxa. Thegenomic sequence of rice (Oryza sativa) has recentlybeen completed and a comparative approach betweencell wall-related gene families in Arabidopsis and ricewas undertaken (Yokoyama and Nishitani, 2004). Amongthe 32 rice cell wall gene families examined, there wasa great deal of sequence overlap with cell wall genes inArabidopsis, but the structural differences in type I(Arabidopsis) versus type II (rice) walls were indeedreflected in certain families. For example, in Arabi-dopsis pectin is an abundant wall component, whereasin rice it is not. This structural difference was mirroredin the genomic data in that pectin-related gene familieswere much larger in Arabidopsis than in rice.
At the time of this writing, more than 700,000 ESTsfrom maize were available. A comparative genomicsurvey between maize and Arabidopsis revealed thatonly 60% to 70% of the maize sequences matched withArabidopsis sequences, indicating a significant pro-portion of highly diverged or putative maize-specificgenes in the maize genome (Brendel et al., 2002).Although global transcriptomic analysis has been un-dertaken in different physiological contexts, includingroots (Poroyko et al., 2005), kernels in response towater stress (Andjelkovic and Thompson, 2006), ororgan response to UV light (Casati and Walbot, 2004),an in-depth, systematic characterization of the maizecell wall transcriptome has not been examined (to ourknowledge). It should be noted that it is impossible tospeak of a maize cell wall per se because the spatialand temporal distribution of wall components is or-
gan, tissue, and cell specific. In general, as statedabove, there are several major chemical differencesbetween maize primary cell walls as compared to dicotspecies (for review, see Carpita and Gibeaut, 1993;Carpita, 1996). Briefly, as is the case in dicots, maizewalls contain cellulose microfibrils, but instead ofxyloglucan as the main cellulose-tethering molecule,maize is rich in glucuronoarabinoxylans. Maize pri-mary walls are relatively low in pectins, and, based onimmunolabeling experiments with antibodies raisedagainst different pectin structures, they appear to becell type-specific with esterified polygalacturonic acidspreferentially localized in vascular tissues, whereasunesterified polygalacturonic acids are mainly foundin cortical and parenchyma cells (Knox et al., 1990).The primary walls of maize also contain relativelylarge amounts of phenolic compounds and little pro-tein in comparison to dicots.
In relation to silage maize digestibility, the lignifiedsecondary cell wall has been extensively studied at thebiochemical level (Barriere et al., 2003). However,despite the importance of lignin content and structurein determining forage digestibility, biochemical andmolecular regulation of the lignin biosynthetic path-way has been virtually unexplored in maize. That said,expression of a few key genes, including cinnamoyl-CoA reductase (CCR; Pichon et al., 1998), cinnamylalcohol dehydrogenase (CAD; Halpin et al., 1998), andcaffeic acid O-methyltransferase (COMT; Capelladeset al., 1996), have been spatially and temporally cor-related to lignifying tissues. Beyond correlative gene ex-pression data, the function of only two genes, COMTand CAD, has been unambiguously demonstrated(Vignols et al., 1995; Halpin et al., 1998). A well-characterized, naturally occurring mutant, brown mid-rib 3 (bm3), is mutated in the COMT gene, resulting inless lignin, a decrease in syringyl (S) units, and im-proved digestibility (Vignols et al., 1995). COMT maizeantisense lines were also generated and have a similar,yet less severe, phenotype (Piquemal et al., 2002; Heet al., 2003). Similarly, the bm1 mutant, characterizedby altered lignin content and composition, is severelyaffected in CAD expression (Halpin et al., 1998).
Two specific facts concerning lignification in maizeshould also be pointed out. First, maize lignin containsrelatively high amounts of hydroxycinnamyl (H) unitsin addition to the guaiacyl (G) and S units typicallyfound in dicotyledonous angiosperms (Lapierre, 1993).This is also the case in most cereals (Lapierre, 1993).Second, maize organs have a wide diversity of lignifiedcell types. For example, maize internodes are charac-terized not only by sclerenchyma fibers (located both inthe subepidermal cell layers and in close associationwith vascular bundles) and xylem vessel elements, butalso lignified parenchyma cells that represent a veryhigh proportion of the total lignified surface area inolder tissues (M. Pichon, unpublished data). Until now,to our knowledge, data have not been made availableto integrate knowledge of the specifics of cell wallcomposition in relation to gene expression in maize.
Guillaumie et al.
340 Plant Physiol. Vol. 143, 2007 www.plantphysiol.orgon June 13, 2018 - Published by Downloaded from
Copyright © 2007 American Society of Plant Biologists. All rights reserved.

In this article, we provide a user-friendly, maize cellwall database, MAIZEWALL, containing 735 acces-sions associated directly or indirectly with primary andsecondary wall metabolism. MAIZEWALL is com-posed of maize homologs resulting from (1) an exten-sive cell wall-related keyword and BLASTsearch basedon existing knowledge of cell walls in other species; and(2) a BLAST search with ESTs derived from secondarywall-forming in vitro TEs from zinnia (Pesquet et al.,2005). A complete bioinformatic analysis of each gene isprovided. A maize cell wall macroarray consisting ofgene-specific tags (GSTs), each corresponding to the3#-untranslated region (UTR) per gene, was constructed.This study provides an organ-specific fingerprint ofcell wall-related gene expression in maize. Finally, anin-depth transcriptome analysis of the gene familiesencoding enzymes of the lignin biosynthetic pathwayallowed us to identify putative preferential routes forlignin biosynthesis in different organs and throughoutinternode development in maize.
RESULTS
MAIZEWALL: A Bioinformatic and Gene Expression
Database of Cell Wall Genes in Maize
An overview of the strategy used to construct the cellwall gene catalog found in MAIZEWALL is illustratedin Figure 1. First, a cell wall-related keyword list ofnearly 100 words was established based on currentknowledge of cell wall synthesis and assembly genesin plants. When available, maize sequences with theappropriate keyword annotation were retrieved frompublic databases, or, if not, sequences from other plantspecies were subsequently used as bait to identify themost closely related maize sequences. In this search, wealso included genes involved in closely related metab-olism (i.e. general phenylpropanoid and shikimic acidpathways) and those controlling vascular patterningthat have been identified by the characterization ofArabidopsis mutants (for review, see Scarpella andMeijer, 2004). Second, maize sequences were retrievedbased on sequence similarities with zinnia genes ex-pressed during in vitro secondary wall formation(Pesquet et al., 2005). All sequences were then BLASTedagainst the unannotated maize GenoPlanteInfo (GPI)contig database (Samson et al., 2003) to obtain thecorresponding maize contigs. Only contigs with theexpected keyword annotation when BLASTed againstthe public protein databases (SWALL and nonredun-dant [NR]) were retained. Based on these criteria, 735contigs were selected as entries for MAIZEWALL(http://www.polebio.scsv.ups-tlse.fr/MAIZEWALL).The 735 contigs belong to 174 putative gene functions,which were further classified into 19 functional cate-gories. The complete cell wall catalog, along with thenumber of contigs identified for each putative genefunction, is found in Supplemental Table S1.
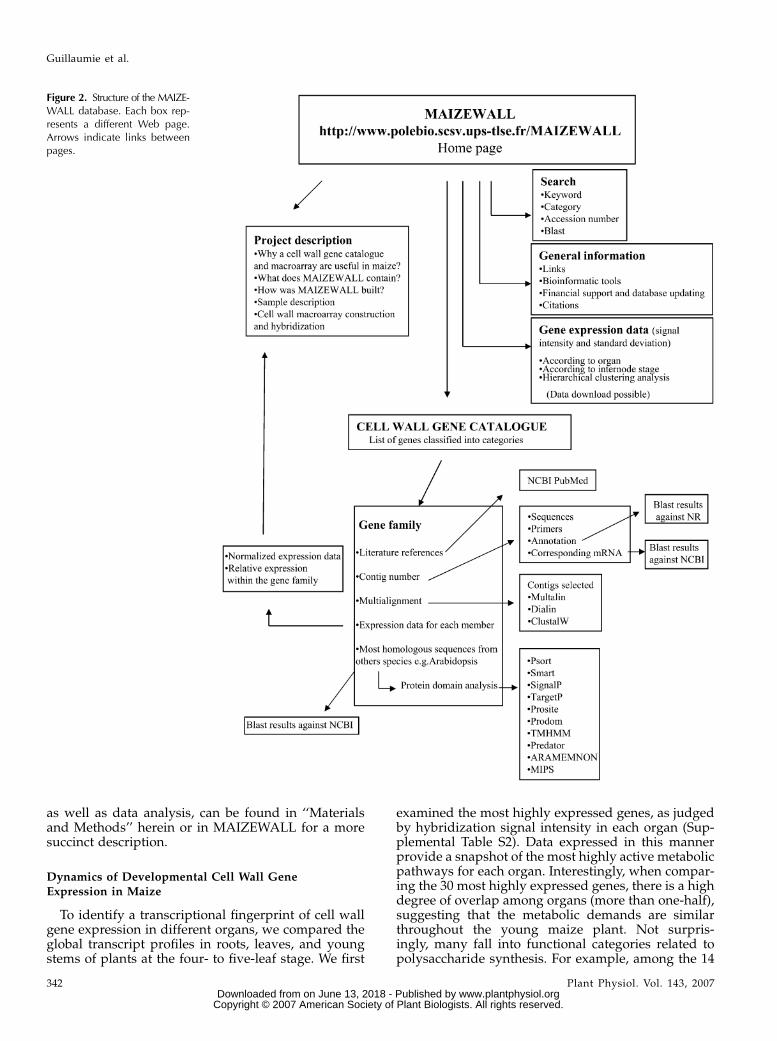
A scheme of the overall structure of the MAIZE-WALL database is summarized in Figure 2. Starting
with the homepage, the user has direct access to theproject description, general information, a versatilesequence search engine, developmental gene expres-sion data, and the cell wall gene catalog. For each genefamily found in the gene catalog, detailed bioinfor-matic analysis has been performed. The user can findcontig sequences corresponding mRNA accession num-bers and sequences, putative function, and the closesthomolog in different plant species, including Arabi-dopsis and rice, etc. An assortment of bioinformaticsoftware is also provided in a user-friendly interface toperform multiple sequence alignments and identifypredicted protein domains and subcellular localiza-tion target sequences. Literature references downloadedfrom PubMed for each family are also available.MAIZEWALL also contains a full set of developmentalgene expression data for 651 of the 735 contigs (thedifference being that PCR amplification was not suc-cessful for all contigs). Gene expression data are ac-cessible either directly from the homepage, as statedabove, with genes being ranked from greatest to leastexpressed per organ and internode stage or from theindividual gene family pages. Genes were also clus-tered to determine those that have overlapping devel-opmental expression profiles. To ensure macroarraysignal specificity among gene family members, GSTsbased on 3#-UTR sequences were spotted for eachcontig. Complete details concerning the design and con-struction of the maize cell wall gene-specific macroarray,
Figure 1. Schematic view of the strategy and content of the cell wallgene catalog found in MAIZEWALL.
Cell Wall Genomics in Maize
Plant Physiol. Vol. 143, 2007 341 www.plantphysiol.orgon June 13, 2018 - Published by Downloaded from
Copyright © 2007 American Society of Plant Biologists. All rights reserved.
as well as data analysis, can be found in ‘‘Materialsand Methods’’ herein or in MAIZEWALL for a moresuccinct description.
Dynamics of Developmental Cell Wall Gene
Expression in Maize
To identify a transcriptional fingerprint of cell wallgene expression in different organs, we compared theglobal transcript profiles in roots, leaves, and youngstems of plants at the four- to five-leaf stage. We first
examined the most highly expressed genes, as judgedby hybridization signal intensity in each organ (Sup-plemental Table S2). Data expressed in this mannerprovide a snapshot of the most highly active metabolicpathways for each organ. Interestingly, when compar-ing the 30 most highly expressed genes, there is a highdegree of overlap among organs (more than one-half),suggesting that the metabolic demands are similarthroughout the young maize plant. Not surpris-ingly, many fall into functional categories related topolysaccharide synthesis. For example, among the 14
Figure 2. Structure of the MAIZE-WALL database. Each box rep-resents a different Web page.Arrows indicate links betweenpages.
Guillaumie et al.
342 Plant Physiol. Vol. 143, 2007 www.plantphysiol.orgon June 13, 2018 - Published by Downloaded from
Copyright © 2007 American Society of Plant Biologists. All rights reserved.
cellulose synthase genes spotted on the array, onlyone contig (QBS7b05.x.g.2.1) is highly expressed in allorgans. Along with this cellulose synthase gene, two ofthe 11 spotted Suc synthase genes are also among themost highly expressed genes, regardless of organlocation. These results suggest that the same actorsare likely to be important in cellulose synthesis duringearly maize development. As for hemicelluloses, amongthe four UDP-Glc-6-dehydrogenase genes, again thesame two genes are highly expressed in all organs ofyoung maize plants. These genes encode central en-zymes of hemicellulose biosynthesis and appear to beessential for cell wall formation in young organs.Interestingly, some conspicuous differences were ob-served among the sugar nucleotide-converting enzymes.GDP-Man-4,6-dehydratase (mur4) and UDP-D-Xyl-4-epimerase (mur1) were among the most highly ex-pressed genes uniquely in the aerial portions of theplant (leaves and young stems).
As a further step toward understanding cell wallgene function, we then searched for genes that exhib-ited differential expression profiles among organs at thefour- to five-leaf stage. A gene was considered differ-entially expressed when its signal intensity was twicethat of one or both of the other two organs examined. Ofthe 651 GSTs spotted on the array, 180 were not ex-pressed in any organ at this stage of developmentunder our hybridization conditions. Among the re-maining 471, 43 were differentially expressed (Table I).Seven genes were preferentially expressed uniquely inyoung stems and three genes only in roots. Interest-ingly, there were no cell wall genes exhibiting exclu-sively leaf-preferential expression. Among the sevengenesexhibitingyoungstem-preferentialexpression pro-files, two of them encoded XTH and three cell wallproteins: a Gly-rich protein (GRP) and two Pro-rich pro-teins (PRPs). Fourteen were expressed preferentially inboth young stems and roots. Among them were fourgenes encoding enzymes of the phenylpropanoid path-way: two Phe ammonia lyases (PALs), a 4-coumarate:coenzyme A ligase (4CL), and a COMT (Table I). Eightgenes were preferentially expressed in the aerial por-tion of the plant—young stems and leaves. Among themare a mur1 equivalent and two genes of the phenyl-propanoid pathway—a ferulate 5-hydroxylase (F5H)and a CAD.
We then examined the cell wall transcriptome dy-namics in internodes at different stages of plant devel-opment. Internodes were chosen for this study becausethey were considered as most suitable to examine bothprimary and secondary wall gene expression. Globalgene expression profiles were obtained at three differ-ent stages: piled-up internodes at the four- to five-leafstage (same as young stems above), and internodes 6(IN6) and 1 (IN1), which correspond, respectively, tothe positions just below the ear and at the base of theplant at silking. Unlike in young plants at the four- tofive-leaf stage in which roughly one-third of the spot-ted genes are not expressed, all of the 651 genes spottedon the array were expressed in at least one internode in
this developmental comparison. The 30 most highlyexpressed genes for each developmental stage arelisted in Supplemental Table S3. Certain genes, suchas two GRPs, a Suc synthase, and a cellulose synthase,which were already among the 30 most highly ex-pressed in young stems (Supplemental Table S2), re-main among the most abundantly expressed genesthroughout internode development, whereas others,such as two UDP-Glc-6-dehydrogenases and a UDP-D-Xyl-4-epimerase, a mur4 equivalent, are only predom-inant during early internode development, most likelyreflecting differences in hemicellulose composition(L. Saulnier, M. Lehaye, M. Pichon, and D. Goffner,unpublished data). In IN6, there is a striking switch ofgene expression toward phenylpropanoid metabolism(three PALs, two caffeoyl-CoA O-methyltransferases[CCoAOMT], one COMT, and one F5H) and hydrox-ylation and O-methylation enzymes (S-adenosyl-Metsynthetase 3 and cytochrome P450s), suggesting a highmetabolic demand for lignin precursors at this stage ofinternode development. In IN1, we also noted that aMedicago truncatula nodulin 21 (MtN21) homolog wasalso highly expressed. An analogy may be made withthe identification of a MtN21 poplar homolog as one ofthe most abundant ESTs in a fiber cell death library(Moreau et al., 2005).
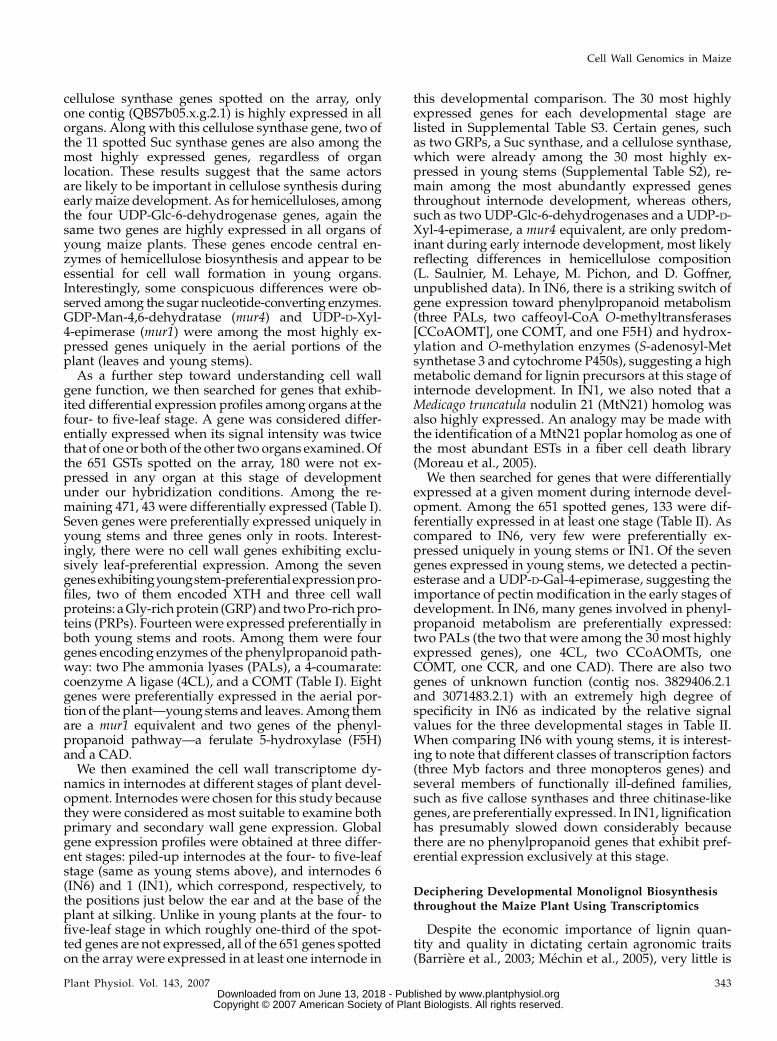
We then searched for genes that were differentiallyexpressed at a given moment during internode devel-opment. Among the 651 spotted genes, 133 were dif-ferentially expressed in at least one stage (Table II). Ascompared to IN6, very few were preferentially ex-pressed uniquely in young stems or IN1. Of the sevengenes expressed in young stems, we detected a pectin-esterase and a UDP-D-Gal-4-epimerase, suggesting theimportance of pectin modification in the early stages ofdevelopment. In IN6, many genes involved in phenyl-propanoid metabolism are preferentially expressed:two PALs (the two that were among the 30 most highlyexpressed genes), one 4CL, two CCoAOMTs, oneCOMT, one CCR, and one CAD). There are also twogenes of unknown function (contig nos. 3829406.2.1and 3071483.2.1) with an extremely high degree ofspecificity in IN6 as indicated by the relative signalvalues for the three developmental stages in Table II.When comparing IN6 with young stems, it is interest-ing to note that different classes of transcription factors(three Myb factors and three monopteros genes) andseveral members of functionally ill-defined families,such as five callose synthases and three chitinase-likegenes, are preferentially expressed. In IN1, lignificationhas presumably slowed down considerably becausethere are no phenylpropanoid genes that exhibit pref-erential expression exclusively at this stage.
Deciphering Developmental Monolignol Biosynthesisthroughout the Maize Plant Using Transcriptomics
Despite the economic importance of lignin quan-tity and quality in dictating certain agronomic traits(Barriere et al., 2003; Mechin et al., 2005), very little is
Cell Wall Genomics in Maize
Plant Physiol. Vol. 143, 2007 343 www.plantphysiol.orgon June 13, 2018 - Published by Downloaded from
Copyright © 2007 American Society of Plant Biologists. All rights reserved.

known about the monolignol biosynthetic pathway inmaize. By mining the maize databases, we have de-termined that, as is the case in dicots, most of themonolignol biosynthetic enzymes are encoded bymultigene families. The first step in assigning a func-
tion to each gene family member is to precisely mapout expression patterns for each in developmentalfashion. In this way, we provide insight into putativepreferred routes of monolignol biosynthesis through-out the maize plant. For each of the monolignol
Table I. Genes exhibiting preferential expression in organs at the four- to five-leaf stage
The organ with the highest expression was assigned an arbitrarily value of 1. The others were calculated as a proportion of this value. R, Roots; YS,young stems; L, leaves. As an example, R/YS 1 L means that gene expression in R is at least twice that of YS and L.
Putative Function Contig No. Maize mRNAMost Homologous
Arabidopsis Sequence
Relative Signal Intensity
R YS L
Preferential expression R/YS 1 LGlucosidase QCT2a11.yg.2.1 CF060569 At5g42260 1 0.44 0.21Wall-associated kinase 2440568.2.1 AY108314 At2g47060 1 0.47 0.39Cys proteinase 2922023.2.1 BT016603 At5g50260 1 0.31 0.32
Preferential expression R/LExpansin AF332180.2.1 AF332180 At1g65680 1 0.55 0.34Wall-associated kinase QAF30a10.yg.2.1 CX129506 At1g56145 1 0.73 0.40Pectinesterase 2448720.2.1 AI629916 At4g12420 1 0.75 0.40Glucosidase 3062418.2.1 BG320059 At3g18080 1 0.76 0.40
Preferential expression YS/R 1 LXTH 2405117.2.2 BQ744978 At5g57550 0.10 1 0.11XTH 2591297.2.1 CK348178 At5g13870 0.49 1 0.37Glucosidase 2306429.2.4 DN205450 At3g18070 0.36 1 0.24GRP 1716296.2.7 BI361221 At2g21660 0.38 1 0.47O-Methyltransferase 2440958.2.1 DT938416 At4g35160 0.22 1 0.23PRP 131537.2.203 AY105945 At4g15160 0.07 1 0.07Pro-rich AGP-like protein MAD56_a5f4.3.2 AY105081 At5g22810 0.39 1 0.47
Preferential expression YS/RLipid transfer protein/TE differentiation
protein 4 (TED4)1738978.2.1 BM382382 At3g18280 0.28 1 0.53
O-Methyltransferase 7987759.3.1 DT652416 At4g35160 0.34 1 0.53UDP-D-Gal-4-epimerase (mur4) 3070703.2.1 BT024099 At4g20460 0.23 1 0.67
Preferential expression YS/LExoglucanase QCK13d03.yg.3.1 AY103742 At5g20950 0.54 1 0.3860S ribosomal protein 1804904.2.3 CF017464 At4g27090 0.57 1 0.38Putative fructokinase II QBH4g04.xg.3.1 AY197773 At4g10260 0.58 1 0.37O-Methyltransferase 131572.2.3 AY103669 At4g35150 0.64 1 0.36
Preferential expression YS 1 L/REmb30 2750663.2.1 BG320107 At1g13980 0.03 0.67 1Pinoresinol reductase 4424526.2.1 U33318 At4g39230 0.29 0.69 1GDP-Man-4,6-dehydratase (mur1) 2621786.2.1 CK985788 At5g66280 0.08 0.73 1F5H1 AX204869 At4g36220 0.04 0.74 1CAD2 3071507.2.1 DV507972 At4g37980 0.29 1 0.65Pectinesterase 3115208.2.1 AY103842 At3g13400 0.41 1 0.79Cytochrome P450 3107376.2.2 AY105992 At2g30750 0.35 1 0.82PRP 3848939.2.1 CO531431 At3g22120 0.40 1 0.84
Preferential expression YS 1 R/LUDP-GlcUA decarboxylase 1738959.2.3 DR831002 At5g59290 0.58 1 0.27UDP-GlcUA decarboxylase 1738959.2.2 AY104952 At2g28760 0.63 1 0.24Argonaute 131537.2.723 CD440332 At5g21150 0.65 1 0.29Calreticulin 131537.2.334 AY103855 At1g56340 0.66 1 0.34PRP 2619346.2.2 Y17332 - 0.72 1 0.32COMT 2192909.2.3 DV551100 At5g54160 0.75 1 0.28S-adenosyl-Met synthetase 3 (SAMT) 2418879.2.3 BG837557 At1g02500 0.89 1 0.36PAL/TAL 2161072.2.1 AY103647 At3g53260 1 0.60 0.13S-adenosyl-Met synthetase 3 (SAMT) 2419471.2.6 BT018468 At4g01850 1 0.66 0.23DnaJ 2192958.2.2 BT016805 At3g44110 1 0.71 0.334CL 3071761.2.1 CF629786 At3g21240 1 0.73 0.35Ser-Thr kinase (pinoid) 2591032.2.1 DR972540 At5g47750 1 0.78 0.39Cellulose synthase 2441542.2.1 AF200533 At5g05170 1 0.80 0.37PAL/TAL 2161072.2.3 BG319893 At3g53260 1 0.99 0.33
Guillaumie et al.
344 Plant Physiol. Vol. 143, 2007 www.plantphysiol.orgon June 13, 2018 - Published by Downloaded from
Copyright © 2007 American Society of Plant Biologists. All rights reserved.
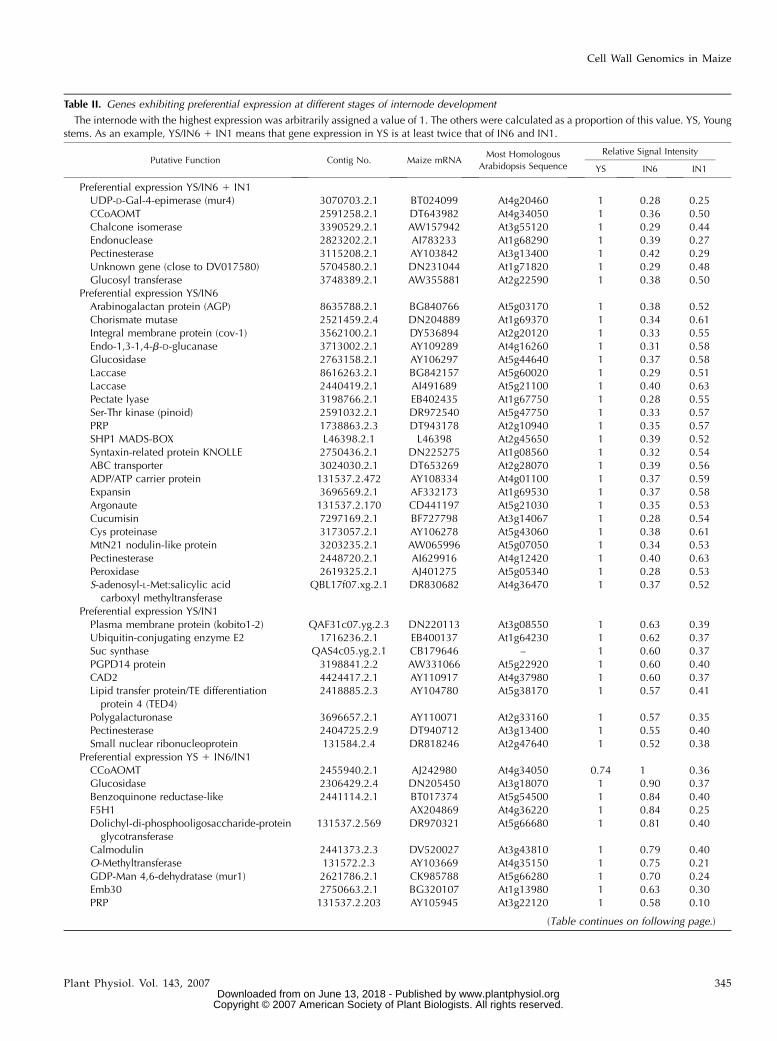
Table II. Genes exhibiting preferential expression at different stages of internode development
The internode with the highest expression was arbitrarily assigned a value of 1. The others were calculated as a proportion of this value. YS, Youngstems. As an example, YS/IN6 1 IN1 means that gene expression in YS is at least twice that of IN6 and IN1.
Putative Function Contig No. Maize mRNAMost Homologous
Arabidopsis Sequence
Relative Signal Intensity
YS IN6 IN1
Preferential expression YS/IN6 1 IN1UDP-D-Gal-4-epimerase (mur4) 3070703.2.1 BT024099 At4g20460 1 0.28 0.25CCoAOMT 2591258.2.1 DT643982 At4g34050 1 0.36 0.50Chalcone isomerase 3390529.2.1 AW157942 At3g55120 1 0.29 0.44Endonuclease 2823202.2.1 AI783233 At1g68290 1 0.39 0.27Pectinesterase 3115208.2.1 AY103842 At3g13400 1 0.42 0.29Unknown gene (close to DV017580) 5704580.2.1 DN231044 At1g71820 1 0.29 0.48Glucosyl transferase 3748389.2.1 AW355881 At2g22590 1 0.38 0.50
Preferential expression YS/IN6Arabinogalactan protein (AGP) 8635788.2.1 BG840766 At5g03170 1 0.38 0.52Chorismate mutase 2521459.2.4 DN204889 At1g69370 1 0.34 0.61Integral membrane protein (cov-1) 3562100.2.1 DY536894 At2g20120 1 0.33 0.55Endo-1,3-1,4-b-D-glucanase 3713002.2.1 AY109289 At4g16260 1 0.31 0.58Glucosidase 2763158.2.1 AY106297 At5g44640 1 0.37 0.58Laccase 8616263.2.1 BG842157 At5g60020 1 0.29 0.51Laccase 2440419.2.1 AI491689 At5g21100 1 0.40 0.63Pectate lyase 3198766.2.1 EB402435 At1g67750 1 0.28 0.55Ser-Thr kinase (pinoid) 2591032.2.1 DR972540 At5g47750 1 0.33 0.57PRP 1738863.2.3 DT943178 At2g10940 1 0.35 0.57SHP1 MADS-BOX L46398.2.1 L46398 At2g45650 1 0.39 0.52Syntaxin-related protein KNOLLE 2750436.2.1 DN225275 At1g08560 1 0.32 0.54ABC transporter 3024030.2.1 DT653269 At2g28070 1 0.39 0.56ADP/ATP carrier protein 131537.2.472 AY108334 At4g01100 1 0.37 0.59Expansin 3696569.2.1 AF332173 At1g69530 1 0.37 0.58Argonaute 131537.2.170 CD441197 At5g21030 1 0.35 0.53Cucumisin 7297169.2.1 BF727798 At3g14067 1 0.28 0.54Cys proteinase 3173057.2.1 AY106278 At5g43060 1 0.38 0.61MtN21 nodulin-like protein 3203235.2.1 AW065996 At5g07050 1 0.34 0.53Pectinesterase 2448720.2.1 AI629916 At4g12420 1 0.40 0.63Peroxidase 2619325.2.1 AJ401275 At5g05340 1 0.28 0.53S-adenosyl-L-Met:salicylic acid
carboxyl methyltransferaseQBL17f07.xg.2.1 DR830682 At4g36470 1 0.37 0.52
Preferential expression YS/IN1Plasma membrane protein (kobito1-2) QAF31c07.yg.2.3 DN220113 At3g08550 1 0.63 0.39Ubiquitin-conjugating enzyme E2 1716236.2.1 EB400137 At1g64230 1 0.62 0.37Suc synthase QAS4c05.yg.2.1 CB179646 – 1 0.60 0.37PGPD14 protein 3198841.2.2 AW331066 At5g22920 1 0.60 0.40CAD2 4424417.2.1 AY110917 At4g37980 1 0.60 0.37Lipid transfer protein/TE differentiation
protein 4 (TED4)2418885.2.3 AY104780 At5g38170 1 0.57 0.41
Polygalacturonase 3696657.2.1 AY110071 At2g33160 1 0.57 0.35Pectinesterase 2404725.2.9 DT940712 At3g13400 1 0.55 0.40Small nuclear ribonucleoprotein 131584.2.4 DR818246 At2g47640 1 0.52 0.38
Preferential expression YS 1 IN6/IN1CCoAOMT 2455940.2.1 AJ242980 At4g34050 0.74 1 0.36Glucosidase 2306429.2.4 DN205450 At3g18070 1 0.90 0.37Benzoquinone reductase-like 2441114.2.1 BT017374 At5g54500 1 0.84 0.40F5H1 AX204869 At4g36220 1 0.84 0.25Dolichyl-di-phosphooligosaccharide-protein
glycotransferase131537.2.569 DR970321 At5g66680 1 0.81 0.40
Calmodulin 2441373.2.3 DV520027 At3g43810 1 0.79 0.40O-Methyltransferase 131572.2.3 AY103669 At4g35150 1 0.75 0.21GDP-Man 4,6-dehydratase (mur1) 2621786.2.1 CK985788 At5g66280 1 0.70 0.24Emb30 2750663.2.1 BG320107 At1g13980 1 0.63 0.30PRP 131537.2.203 AY105945 At3g22120 1 0.58 0.10
(Table continues on following page.)
Cell Wall Genomics in Maize
Plant Physiol. Vol. 143, 2007 345 www.plantphysiol.orgon June 13, 2018 - Published by Downloaded from
Copyright © 2007 American Society of Plant Biologists. All rights reserved.

Table II. (Continued from previous page.)
Putative Function Contig No. Maize mRNAMost Homologous
Arabidopsis Sequence
Relative Signal Intensity
YS IN6 IN1
Preferential expression IN6/YS 1 IN1Alcohol dehydrogenase QAY3d01.yg.3.1 EB399902 At1g49670 0.36 1 0.494CL 3071761.2.1 CF629786 At3g21240 0.33 1 0.27CCR 3012873.2.2 Y13734 At1g15950 0.44 1 0.30CCoAOMT 2430769.2.1 AW231479 At4g34050 0.40 1 0.26CCoAOMT 2455940.2.2 AJ242981 At4g34050 0.41 1 0.42Callose synthase 131612.2.1 AI692047 At5g13000 0.38 1 0.35Cellulose synthase-like (Csl) 2568371.2.1 AI673968 At5g16910 0.40 1 0.44Chalcone isomerase 2647051.2.1 DV550165 At3g55120 0.45 1 0.30Expansin 2478337.2.1 CO532987 At2g45110 0.32 1 0.36Exoglucanase 2762970.2.1 DT642729 At5g20950 0.38 1 0.50Glucosidase 2750951.2.1 BE640554 At3g18080 0.33 1 0.49Glucosidase QCT2a11.yg.2.1 CF060569 At5g42260 0.45 1 0.18COMT 2192909.2.3 DV551100 At5g54160 0.31 1 0.28Pinoresinol reductase 4424526.2.1 U33318 At4g39230 0.50 1 0.37PAL/TAL 2161072.2.3 BG319893 At3g53260 0.19 1 0.16PAL/TAL 2161072.2.1 AY103647 At3g53260 0.11 1 0.20S-adenosyl-Met synthetase 3 (SAMT) 2418879.2.3 BG837557 At1g02500 0.34 1 0.33CAD2 3203838.2.1 CD995201 At4g39330 0.38 1 0.46Xylosidase 5532690.2.1 DV622656 At5g10560 0.38 1 0.45XTH 2405117.2.2 BQ744978 At5g57550 0.49 1 0.11Benzoquinone reductase-like 2441114.2.2 AY104807 At5g54500 0.36 1 0.26Cys proteinase 2922023.2.1 BT016603 At5g50260 0.42 1 0.37Dolichyl-di-phosphooligosaccharide-protein
glycotransferase131537.2.288 AY103792 At5g66680 0.42 1 0.41
Oligopeptide transporter 3204486.2.1 DR957852 At3g54140 0.32 1 0.44Proteinase inhibitor/g-thionin 2494085.2.2 DV495756 At2g02100 0.34 1 0.48Unknown gene (close to DV017148) 3829406.2.1 CF624874 At5g05960 0.07 1 0.11Unknown gene (close to DV017148) 3071483.2.1 AI948098 At5g05960 0.08 1 0.10Expansin QBJ24c04.pg.2.1 AW566451 At1g65680 0.34 1 0.46MtN21 nodulin-like protein QBTB.068P15F020924.3.1 DT648847 At3g18200 0.40 1 0.48Transcription regulatory protein QAF18e02.yg.3.1 CD435681 At1g02080 0.35 1 0.50Histone promoter-binding protein
HBP-1A(C14) transcription factorQBTB.064G21F020918.3.1 DR794027 At4g36730 0.37 1 0.50
Preferential expression IN6/YSMYB transcription factor QBS9a01.xg.2.1 DR809108 At4g01680 0.38 1 0.72MYB-like transcription factor (APL) 5110719.2.1 DV550965 At2g01060 0.37 1 0.62Callose synthase QCH10g11.yg.2.1 AC185276 At4g04970 0.35 1 0.51Callose synthase QCG38e04.yg.2.1 CX129552 At5g13000 0.29 1 0.53Callose synthase 3148257.2.1 AW090958 At4g04970 0.38 1 0.54Callose synthase QCG13d12.yg.2.1 AY107727 At5g13000 0.40 1 0.61Callose synthase QCN28g01.yg.2.1 DV172790 At2g31960 0.33 1 0.65Cellulose synthase-like (Csl) QAH2a02.xg.2.1 AX756398 At3g03050 0.40 1 0.53Chalcone synthase 3802552.2.1 AW400268 At5g13930 0.37 1 0.63Chitinase-like 4679577.2.1 DR819933 At3g54420 0.36 1 0.53Emb30 QCH30c02.yg.2.1 AI691537 At1g13980 0.36 1 0.57XTH 3838024.2.1 BF728605 At5g57560 0.41 1 0.57Expansin 2649891.2.1 AI740146 At2g45110 0.37 1 0.69Galactosyltransferase QCN21b10.yg.2.1 CK369130 At4g21060 0.40 1 0.53Galactosyltransferase QCH13e05.yg.2.1 DY537801 At1g26810 0.40 1 0.60Glucosidase QAY3d02.yg.2.1 DR814197 At1g61820 0.36 1 0.56GRP 1716296.2.7 BI361221 At2g21660 0.39 1 0.72Cellulose synthase-like QCL24b11.yg.2.1 BM380526 At2g21770 0.37 1 0.52Transcription factor (monopteros) 2750753.2.1 AY106228 At5g62000 0.36 1 0.51Transcription factor (monopteros) QCS19f07.yg.2.1 CF059990 At1g19220 0.37 1 0.53Transcription factor (monopteros) QCG16f05.yg.2.1 CF035906 At2g33860 0.36 1 0.58MYB transcription factor QBL16c05.xg.2.1 DY686346 At1g09540 0.34 1 0.52Pectin methyl esterase 3712967.2.1 BF728155 At2g47550 0.38 1 0.64Ser-Thr kinase (pinoid) 4534747.2.1 BE012117 At3g12690 0.38 1 0.53
(Table continues on following page.)
Guillaumie et al.
346 Plant Physiol. Vol. 143, 2007 www.plantphysiol.orgon June 13, 2018 - Published by Downloaded from
Copyright © 2007 American Society of Plant Biologists. All rights reserved.

biosynthetic pathway genes, a complete enzyme-by-enzyme survey of developmental expression pat-terns in different organs and throughout internodedevelopment is described below.
PAL/Tyr Ammonia Lyase
PAL catalyzes the first step in the phenylpropanoidpathway by removing ammonia from L-Phe to pro-duce p-coumaric acid. In maize, PAL also has Tyrammonia lyase (TAL) activity in that the enzyme uti-lizes Tyr in addition to Phe as substrate (Rosler et al.,1997). In all plants analyzed thus far, PAL is encodedby multigene families. In the complete genome ofArabidopsis, four genes encoding PAL proteins havebeen identified (Raes et al., 2003). In maize, one PAL/TAL cDNA has been previously reported, but no dataon gene number or expression patterns are available(Rosler et al., 1997).
Using the sequence previously described by Rosleret al. (1997), a total of five contigs annotated PAL/TAL
were identified with nucleic acid sequence identitiesranging from 57% to 84% among them (SupplementalFig. S4A). Phylogenetic analysis allowed us to definethree classes: classes I, II, and III (Fig. 3A). Class Icontains two sequences: the one originally describedby Rosler et al. (1997) (contig no. 2161072.2.1) andanother with 84% identity at the nucleic acid level(contig no. 2161072.2.3). Class II contains only onemember, and class III contains two members that ex-hibit 77% identity between them. Based uniquely onsequence identity, we were unable to establish anunambiguous relationship with other previously de-scribed PAL genes from other species. For example,the class I maize PAL (contig no. 2161072.2.3) exhibited64% and 66% sequence identity at the protein levelwith Arabidopsis PAL1 and PAL2, respectively. On theother hand, the same maize contig exhibited 89% and71% identity at the protein level with rice PAL1 andPAL2, respectively, suggesting that this maize gene ismost likely the rice PAL1 putative ortholog (Zhu et al.,1995).
Table II. (Continued from previous page.)
Putative Function Contig No. Maize mRNAMost Homologous
Arabidopsis Sequence
Relative Signal Intensity
YS IN6 IN1
Putative glycosyltransferase (quasimodo) 3642920.2.1 AW261329 At5g15470 0.40 1 0.59Putative glycosyltransferase (quasimodo) 3147935.2.1 CF039403 At5g47780 0.36 1 0.59Putative glycosyltransferase (quasimodo) 3064721.2.2 DR958277 At5g47780 0.38 1 0.63Aldehyde dehydrogenase/reduced epidermal
fluorescence (REF1)/Restore fertility (RF2)2621801.2.1 DR822602 At1g23800 0.32 1 0.56
SHP1 MADS-BOX 3829479.2.1 L81162 At4g18960 0.39 1 0.55Sterol methyltransferase 3748535.2.1 AW356027 At5g13710 0.39 1 0.59Wall-associated kinase QCG22g05.yg.2.1 CS226436 At2g37050 0.39 1 0.63
Preferential expression IN6/IN1CAD2 3071507.2.1 DV507972 At4g37980 0.64 1 0.37PAL/TAL 3858636.2.1 CF631905 At3g53260 0.52 1 0.30PRP 2419137.2.4 AI857154 At1g62510 0.57 1 0.33Peroxidase 2440918.2.1 AY106450 At1g05260 0.60 1 0.36Chalcone synthase QBTB.065K11F020919.3.1 DT640793 At5g13930 0.58 1 0.38
Preferential expression IN6 1 IN1/YSATHB-8 HD-zip protein 2521569.2.1 DR784986 At1g52150 0.21 1 0.58Glutathione S-transferase (Bronze-2) 3713091.2.1 AF244704 At1g10370 0.30 1 0.63Chitinase-like 131537.2.387 BG837630 At3g12500 0.26 1 0.64Chitinase-like 131537.2.593 BG837392 At3g12500 0.27 1 0.73Abscisic acid-induced protein 2478113.2.1 CF024514 At5g50720 0.34 1 0.85GRP 131537.2.78 CD441567 At2g21660 0.29 0.64 1
Preferential expression IN1/YS 1 IN6GRP 131537.2.623 AF034945 At2g21660 0.33 0.50 1Extensin QCT19a08.yg.2.1 DR806234 At4g13340 0.23 0.23 1Cytochrome P450 1716424.2.3 AY072298 At3g26280 0.39 0.35 1
Preferential expression IN1/IN6MtN21 nodulin-like protein 3995289.2.1 AW562846 At1g75500 0.53 0.39 1
Preferential expression IN1 1 YS/IN6Arabinogalactan protein (AGP) AB021175.2.1 AB021175 At3g19430 1 0.23 0.54Arabinogalactan protein (AGP) AB021176.2.1 AB021176 At3g19430 1 0.25 0.57Glutathione S-transferase (Bronze-2) 3829517.2.1 AF244682 At2g02390 1 0.24 0.53Cell wall invertase 2943856.2.2 U17695 At3g52600 1 0.20 0.52Endo-1,3-1,4-b-D-glucanase 2493751.2.1 DR797601 At4g26830 1 0.23 0.53UDP-Glc-6-dehydrogenase 2750995.2.1 CF024455 At3g29360 1 0.25 0.51Dihydroflavonol reductase 3184927.2.1 AY109666 At4g35420 0.72 0.31 1
Cell Wall Genomics in Maize
Plant Physiol. Vol. 143, 2007 347 www.plantphysiol.orgon June 13, 2018 - Published by Downloaded from
Copyright © 2007 American Society of Plant Biologists. All rights reserved.

The gene expression of each family was first ana-lyzed globally by summing up the hybridization sig-nal intensities corresponding to all of the identifiedfamily members for each organ and stage of internodedevelopment. This provides a means to assess totaltranscriptional activity for the entire gene family perorgan and developmental stage. The relative contri-bution of each family member was also systematicallyevaluated by determining the percentage of contribu-tion toward total measured transcriptional activity. Asfor the different organs of young plants, the highestglobal PAL gene expression was observed in stemsand roots, with relatively low expression level in leaves(Fig. 3B). A class I PAL (contig no. 2161072.2.3) wasexpressed in relatively equal proportions in the threeorgans, whereas the other class I member (contig no.2161072.2.1) was moderately expressed in stems androots, but totally absent in leaves. Interestingly, theclass II PAL gene (contig no. 3858636.2.1) was propor-tionally the most highly expressed of all the PAL genesin all three young organs. The two class III PAL mem-bers have little to no expression in young plants (Fig.3C). When considering the different stages of inter-node development, global PAL gene family expressionwas highest in IN6 (Fig. 3B). Whereas the class II
member (contig no. 3858636.2.1) was predominantin young stems, the two class I PALs (contig nos.2161072.2.3 and 2161072.2.1) were, by far, the mosthighly expressed in IN6. As is the case for young or-gans, class III members show little to no expression,even in IN6 and IN1.
Cinnamate 4-Hydroxylase
In conjunction with two other key enzymes of thecore phenylpropanoid pathway, PAL and 4CL, cinna-mate 4-hydroxylase (C4H) directs carbon flux intophenylpropanoid metabolism. C4H belongs to theCYP73A group of the cytochrome P450 family andcatalyzes the first oxidative reaction in phenylpropa-noid metabolism, namely, the conversion of trans-cinnamic to p-coumaric acid. This reaction consumesmolecular oxygen and a reducing equivalent fromNADPH delivered via cytochrome P450 reductase(Meijer et al., 1993). In Arabidopsis, C4H is encodedby one gene, which is expressed in all tissues (Mizutaniet al., 1997). In maize, we identified two sequences,C4H1 corresponding to contig number 2521589.2.1and C4H2 cloned by reverse transcription (RT)-PCRin our laboratory. They exhibit 72% identity between
Figure 3. Characterization of the PAL gene familyin maize. A, Phylogenetic analysis. Classes weredefined according to evolutionary distances de-fined by Phylip 3.5 software. B, Gene expressionin organs at the four- to five-leaf stage and IN1 andIN6 at silking. Values indicate the normalizedsignal hybridization intensity for each gene and(2) signifies a below-background signal intensityof #6,000. C, Relative contribution of each geneto total PAL gene expression. R, Roots; L, leaves,YS, young stems, which results from piled-upinternodes at the four- to five-leaf stage. IN6,Internode just below the node bearing the ear atsilking; IN1, basal internode at silking. Note thatequivalent datasets as found in B and C areavailable for all gene entries in MAIZEWALL.
Guillaumie et al.
348 Plant Physiol. Vol. 143, 2007 www.plantphysiol.orgon June 13, 2018 - Published by Downloaded from
Copyright © 2007 American Society of Plant Biologists. All rights reserved.

them at the nucleotide level. At the protein level, bothC4H1 and C4H2 from maize exhibited 75% identity/86% similarity and 81% identity/91% similarity, re-spectively, with Arabidopsis C4H. Both genes areexpressed in all organs and at all stages of internodedevelopment (Table III). C4H1 (contig no. 251589.2.1)is by far the predominant gene in IN6. C4H2, on theother hand, has a tendency to be more highly ex-pressed in all organs of young plants.
4CL
4CL, which catalyzes the formation of CoA esters ofp-coumaric acid, caffeic acid, ferulic acid, 5-hydroxy-ferulic acid, and sinapic acid, plays a pivotal role inchanneling phenylpropanoid precursors into differentdownstream pathways, each leading to a variety offunctionally distinct end products (Harding et al.,2002). This probably explains why 4CL is encoded byrelatively large multigene families. 4CL isoforms inArabidopsis have been extensively characterized atthe biochemical level (Hamberger and Hahlbrock,2004; Costa et al., 2005) and their gene expressionprofiles analyzed (Raes et al., 2003).
To date, only two sequences have been reported inmaize (Puigdomenech et al., 2001; S. Sivasankar, D.Sapienza, and T. Helentjaris, unpublished data). Usingthese maize sequences as bait, we retrieved a total ofseven contigs (Fig. 4A). The percentage of nucleic acididentity among the sequences ranges from 43% to 82%(Supplemental Fig. S4B). Among them, a class I mem-ber (contig no. 3071761.2.1) corresponding to the maizesequence isolated by S. Sivasankar, D. Sapienza, and T.Helentjaris (unpublished data) is a putative orthologto 4CL2 from Arabidopsis (Hamberger and Hahlbrock,2004) and poplar (Hu et al., 1998).
From a quantitative standpoint, global 4CL expres-sion is quite similar in all organs of young plants (Fig.4B). A closer examination of each family memberindicated that the Arabidopsis 4CL2 homolog (contigno. 3071761.2.1) is moderately expressed in youngroots and stems, but absent in leaves (Fig. 4C). Theclass II 4CL gene is constitutively expressed at high
levels in all young organs, but is the dominant form inleaves. This gene is most homologous to 4CL1 fromArabidopsis. Interestingly, a class IV 4CL (contig no.171632.2.2) appeared to be specific to the aerial por-tions of a young plant, whereas a class III 4CL(3106166.2.1) that is most homologous to 4CL-like7 inArabidopsis is the major form expressed in roots. 4CLgene expression was then monitored during internodedevelopment. Global 4CL expression is extremely highin IN6, with all of the 4CL genes expressed at this stageof development. The class I 4CL homolog to 4CL2 inArabidopsis (contig no. 3071761.2.1) is the predomi-nant 4CL gene in IN6.
Hydroxycinnamoyl-CoA Transferase
Hydroxycinnamoyl-CoA transferase (HCT) is themost recently identified actor in monolignol biosyn-thesis and belongs to a large family of acyltransferases(Hoffmann et al., 2003). It catalyzes the conversion ofp-coumaroyl-CoA and caffeoyl-CoA to their corre-sponding shikimate or quinate esters just up anddownstream of p-coumarate 3-hydroxylase (C3H). InArabidopsis, only one gene has been detected in thegenome and it is expressed in all tissues investigated,with the strongest expression in inflorescence stems(Raes et al., 2003). In maize, we identified two HCTcontigs with 64% identity between them at the nucle-otide level. HCT1 (contig no. 2478084.2.1) exhibited52% identity/63% similarity at the protein level withHCT originally isolated from tobacco (Nicotiana tabacum;Hoffmann et al., 2003). HCT2 (contig no. 2619423.2.1)exhibited 58% identity/68% similarity with the tobaccoprotein. HCT2 (contig no. 2619423.2.1) is expressed atrelatively low levels in all young organs and through-out internode development, whereas HCT1 (contig no.2478084.2.1) is only expressed in IN6 (Table III).
C3H
It was originally postulated that this enzyme cata-lyzed the C3 hydroxylation step from p-coumaric tocaffeic acid. More recently, it has been shown that C3Hpreferentially converts the shikimate and quinate es-ters of p-coumaric acid into their corresponding caffeicacid conjugates (Schoch et al., 2001; Franke et al., 2002).C3H belongs to the CYP98 cytochrome P450 family. InArabidopsis, three C3H genes have been identified inthe genome (Raes et al., 2003). One of them, C3H1,clusters with all known C3Hs from other species,whereas C3H2 and C3H3 are more divergent and con-stitute a separate class and do not appear to hydrox-ylate shikimate and quinate esters of p-coumaric acid(Schoch et al., 2001). In maize, we found only onecontig (no. 2643622.2.1) that annotated C3H (Table III).The sequence exhibited 65% identity with the C3H1Arabidopsis gene, with much lower homology toC3H2 and C3H3 (49% identity with each). In maize,C3H exhibited relatively low levels of expression in allorgans studied, with slightly higher levels in IN6.
Table III. Hybridization signal intensities of lignification genesencoded by one or two genes
Numbers in this table represent normalized signal intensity; (2)signifies a below-background signal intensity of #6,000; pcr signifiesthat the cDNA spotted on the macroarray resulted from RT-PCR.
Genes Contig No. RootsYoung
StemLeaves IN6 IN1
C4H1 2521589.2.1 41,797 28,668 23,250 66,372 28,254C4H2 pcr 57,838 34,655 38,742 19,988 30,822C3H 2643622.2.1 6,280 7,892 8,132 10,568 7,621HCT1 2478084.2.1 – – – 11,068 –HCT2 2619423.2.1 10,901 11,005 6,868 14,343 9,178F5H1 pcr – 54,198 73,698 45,662 13,754COMT 2192909.2.3 32,664 43,536 12,054 142,202 39,112
Cell Wall Genomics in Maize
Plant Physiol. Vol. 143, 2007 349 www.plantphysiol.orgon June 13, 2018 - Published by Downloaded from
Copyright © 2007 American Society of Plant Biologists. All rights reserved.

CCoAOMT
CCoAOMT, by catalyzing the methylation of caffeoyl-CoA to feruloyl-CoA and 5-hydroxyferuloyl-CoA tosinapoyl-CoA, plays a pivotal role in determininglignin composition (Zhong et al., 1998; Pincxon et al.,2001). Seven CCoAOMT gene family members withdifferent spatiotemporal gene expression patternswere identified in the Arabidopsis genome (Raeset al., 2003). In maize, two CCoAOMT sequences,CCoAOMT1 and CCoAOMT2, have been previouslydeposited in public databases (Civardi et al., 1999), butto our knowledge no expression data for these geneshave ever been reported. By BLASTing these twosequences in GPI databases, we were able to identifya total of five contigs that fell into three classes (Fig.5A). Class I contains two members (contig nos.2455940.2.1 and 2455940.2.2) that correspond to thepreviously identified CCoAOMT1 and CCoAOMT2,respectively. They exhibited 83% identity at the nucle-otide level (Supplemental Fig. S4C). Class II containsone member (contig no. 2591258.2.1) and class IIIcontains two members (contig nos. 2943966.2.1 and2430769.2.1). In general, global CCoAOMT expressionwas similar in all organs studied, except in IN1, whereexpression was significantly lower (Fig. 5B). In all
young organs, although all five genes are constitu-tively expressed, the class II member (2591258.2.1) isthe most highly expressed (Fig. 5, B and C). At silking,although all five genes are still expressed in IN6 andIN1, contig number 2455940.2.2 (CCoAOMT2) andcontig number 2430769.2.1 account for a large majorityof CCoAOMT expression in IN6. It should be notedthat CCoAOMT1 (contig no. 2455940.2.1) is expressedat low levels in all organs examined, suggesting that itis not the major actor in lignin biosynthesis in maize.In Arabidopsis, among the seven putative CCoAOMTgenes, based on expression patterns, CCoAOMT1 wasconsidered to be the gene most likely involved inconstitutive lignification (Raes et al., 2003). Based onsequence homology alone, it is impossible to deter-mine whether CCoAOMT1 or CCoAOMT2 is thefunctional maize equivalent of this Arabidopsis gene.In any case, based on expression data, CCoAOMT2appears to be more important for constitutive lignifi-cation in maize as compared to CCoAOMT1.
CCR
CCR catalyzes the conversion of hydroxycinna-moyl-CoA esters (p-coumaroyl-CoA, feruloyl-CoA,
Figure 4. Characterization of the 4CL gene familyin maize. A, Phylogenetic analysis. Classes weredefined according to evolutionary distances de-fined by Phylip 3.5 software. Contig numbers2448387.2.1 and 17163.2.2 annotated as 4CL-like;contig numbers 3106166.2.1 and 1716323.2.1annotated as putative 4CL. For 4CL2, a contig wasnot found in the GPI databases. B, Gene expres-sion in organs at the four- to five-leaf stage andinternodes at different developmental stages. Valuesindicate the normalized signal hybridization in-tensity for each gene and (2) signifies a below-background signal intensity of #6,000. Note thatcontig numbers 1716323.2.2 and 2448387.2.1were not included in expression studies becausewe were unable to amplify corresponding GSTs.C, Relative contribution of each gene to total 4CLgene expression. R, Roots; L, leaves; YS, youngstems, which results from piled-up internodes atthe four- to five-leaf stage. IN6, Internode just be-low the node bearing the ear at silking; IN1, basalinternode at silking. Note that equivalent datasetsas found in B and C are available for all geneentries in MAIZEWALL.
Guillaumie et al.
350 Plant Physiol. Vol. 143, 2007 www.plantphysiol.orgon June 13, 2018 - Published by Downloaded from
Copyright © 2007 American Society of Plant Biologists. All rights reserved.
sinapoyl-CoA) into their corresponding cinnamyl al-dehydes and is therefore the first committed enzymeof the monolignol pathway. Two full-length cDNAs,ZmCCR1 and ZmCCR2, have previously been clonedand their expression pattern in different organs char-acterized (Pichon et al., 1998). ZmCCR1 was highlyexpressed along the stalk, suggesting that the corre-sponding enzyme was probably involved in consti-tutive lignification. Using ZmCCR1 to BLAST theGPI database, in addition to ZmCCR1 (contig no.3012873.2.2), six other contigs annotated as CCR/putative CCR were identified (Fig. 6). According tophylogenetic analysis, the seven CCR/putative CCRsformed three classes (Fig. 6A). CCRs exhibited 39% to59% identity with ZmCCR1 (contig no. 3012873.2.2)and 38% to 83% among all family members (Supple-mental Fig. S4D).
In young plants, global CCR expression is higher inroots and stems than in leaves (Fig. 6B). Many CCRgene family members are not expressed during earlyplant development, with essentially two major genes
accounting for the large majority of overall CCR ex-pression in all young organs: ZmCCR1 (3012873.2.2)and the class III putative CCR (contig no. 4695478.2.1).In keeping with previously reported data, CCR2 ismainly expressed in roots (Pichon et al., 1998). Duringinternode development, global CCR expression wasmaximal in IN6 (Fig. 6B). Although all CCR and pu-tative CCR genes are expressed at this stage, ZmCCR1is expressed to a much greater extent than all theothers (Fig. 6C).
F5H
F5H, or coniferaldehyde 5-hydroxylase, is a cyto-chrome P450-dependent monooxygenase (CYP84) anda key enzyme for the production of S-unit lignin indicotyledonous angiosperms (Humphreys et al., 1999).It catalyzes the 5-hydroxylation of coniferaldehydeand/or coniferyl alcohol. In Arabidopsis, two genesencoding F5H have been identified (Raes et al., 2003).F5H1 is expressed in all tissues, with maximal expression
Figure 5. Characterization of the CCoAOMTgene family in maize. A, Phylogenetic analysis.Classes were defined according to evolutionarydistances defined by Phylip 3.5 software. Contignumbers 2591258.2.1, 2430769.2.1, and2943966.2.1 annotated as putative CCoAOMT.B, Gene expression in organs at the four- to five-leaf stage and internodes at different develop-mental stages. Values indicate the normalizedsignal hybridization intensity for each gene. C,Relative contribution of each gene to totalCCoAOMT gene expression. R, Roots; L, leaves;YS, young stems, which results from piled-upinternodes at the four- to five-leaf stage. IN6,Internode just below the node bearing the ear atsilking; IN1, basal internode at silking. Note thatequivalent datasets as found in B and C areavailable for all gene entries in MAIZEWALL.
Cell Wall Genomics in Maize
Plant Physiol. Vol. 143, 2007 351 www.plantphysiol.orgon June 13, 2018 - Published by Downloaded from
Copyright © 2007 American Society of Plant Biologists. All rights reserved.

in developing stems, whereas F5H2 appears to bemore closely associated with earlier stages of plantdevelopment. In maize, there are two F5H genes: F5H1was previously described by Puigdomenech et al.(2001) and F5H2 was identified in this study. Theyexhibited 92% identity between them at the nucleotidelevel. Maize F5H1 and F5H2 exhibit 60% identity/72%similarity and 51% identity/65% similarity, respec-tively, with the Arabidopsis F5H1 gene at the proteinlevel. Expression analysis indicated that F5H1 washighly expressed in young stems and with the highestexpression in leaves. Interestingly, F5H1 transcriptscould not be detected in roots (Table III). On thecontrary, F5H2 was predominantly expressed in rootsand, to a lesser extent, in other organs with the lowestlevels in young stems and IN6 (data not shown).
COMT
COMT was originally thought to be a bifunctionalenzyme that sequentially methylated caffeic and5-hydroxyferulic acids. More recently, it has beenshown that COMT acts downstream in monolignolbiosynthesis by methylating the aldehyde and alcoholbackbones (Osakabe et al., 1999; Parvathi et al., 2001).In maize, a single gene encoding COMT has previ-ously been identified (Collazo et al., 1992). Down-regulation of this gene, both in the bm3 mutant(Vignols et al., 1995) and in antisense transgenic maize(Piquemal et al., 2002), led to a drastic decrease inlignin content and S-unit lignin. In the GPI database,we detected one contig (no. 2192909.2.3) that anno-tated COMT. This contig corresponded to the previ-ously described COMT. In agreement with published
Figure 6. Characterization of the CCR genefamily in maize. A, Phylogenetic analysis.Classes were defined according to evolution-ary distances defined by Phylip 3.5 software.Contig numbers 131555.2.2, 4695478.2.1,2969912.2.1, 3230260.2.1, and 131555.2.3annotated as putative CCRs. For CCR2, acontig was not found in the GPI database. B,Gene expression in organs at the four- to five-leaf stage and internodes at different develop-mental stages. Values indicate the normalizedsignal hybridization intensity for each geneand (2) signifies a below-background signalintensity of #6,000. C, Relative contributionof each gene to total CCR gene expression. R,Roots; L, leaves; YS, young stems, whichresults from piled-up internodes at the four-to five-leaf stage. IN6, Internode just belowthe node bearing the ear at silking; IN1, basalinternode at silking. Note that equivalentdatasets as found in B and C are available forall gene entries in MAIZEWALL.
Guillaumie et al.
352 Plant Physiol. Vol. 143, 2007 www.plantphysiol.orgon June 13, 2018 - Published by Downloaded from
Copyright © 2007 American Society of Plant Biologists. All rights reserved.
expression data (Collazo et al., 1992), this gene wasexpressed in all organs, with the highest levels in IN6and the lowest in leaves (Table III).
CAD
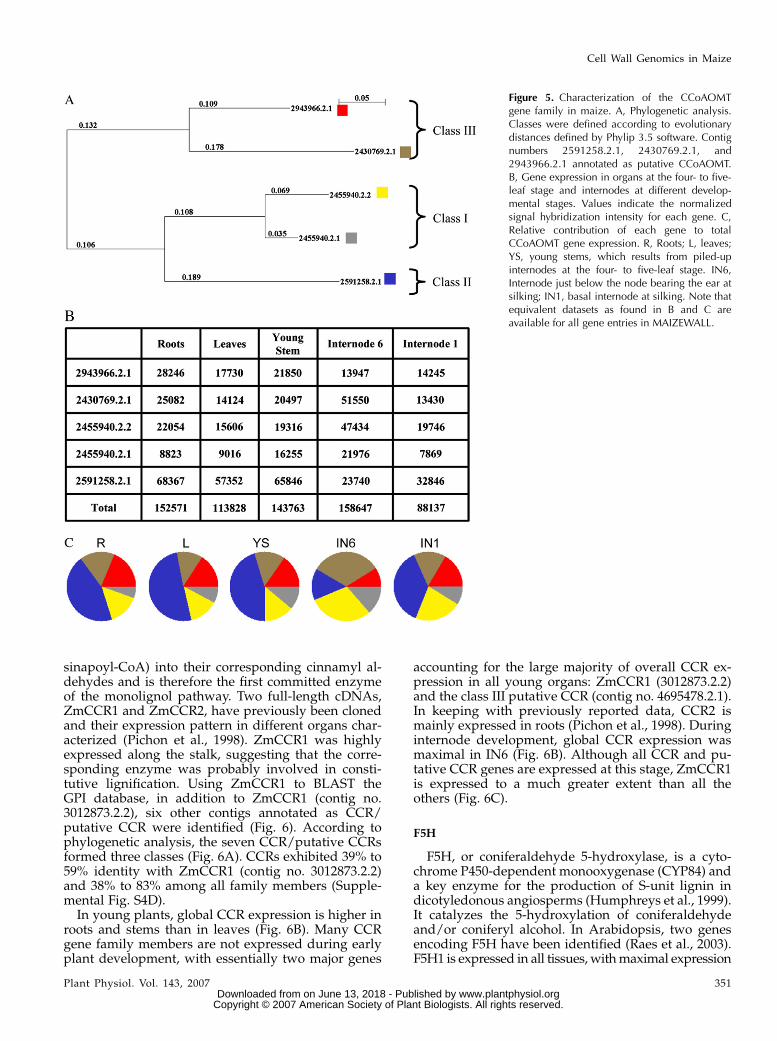
CAD catalyzes the reduction of p-hydroxycinnamal-dehydes into their corresponding alcohols and is thelast enzyme in monolignol biosynthesis. In the Arabi-dopsis genome, nine putative CAD genes have beenidentified (Raes et al., 2003). Whether different CADgenes possess different substrate specificity towardconiferyl and sinapyl alcohol and hence dictate, atleast to some extent, lignin composition in planta hasbeen the subject to debate (Li et al., 2001; Sibout et al.,2005). Because this issue has not been addressed inmonocots (to our knowledge), we chose to classify allcontigs annotating CAD, CAD-like, sinapyl alcoholdehydrogenase (SAD), and SAD-like into one CADfamily.
In maize, one CAD cDNA had previously beencharacterized (Halpin et al., 1998). Its expression wasalso shown to be severely affected in the bm1 mutant,resulting in modified lignin content and structure.Beyond the identification of the previously describedCAD (Y13733), searching the GPI databases enabled usto identify six other CAD family contigs (Fig. 7A). Onecontig (no. 2405118.2.1) exhibited 92% identity at thenucleotide level with the original CAD gene (Supple-mental Fig. S4E). Sequence identities ranged from 39%to 92% among the different family members. Contignumbers 3071507.2.1 and 2949673.2.1 were most sim-ilar to the SAD gene originally characterized in poplarand annotated as such (Li et al., 2001). They exhibit,respectively, 51% and 49% identity at the nucleotidelevel with the poplar SAD gene.
In young plants, maximal CAD expression wasobserved in stems (Fig. 7B). The relative contributionof each contig to total CAD expression is quite differ-ent at this stage (Fig. 7C). In young stems, whereas five
Figure 7. Characterization of the CAD gene fam-ily in maize. A, Phylogenetic analysis. Classeswere defined according to evolutionary distancesdefined by Phylip 3.5 software. Note that contignumber 2485944.3.1 was annotated putativeCAD, contigs numbers 3203838.2.1 and4424417.2.1 were annotated SAD-like, and con-tig numbers 3071507.2.1 and 2949673.2.1 wereannotated SAD. B, Gene expression in organs atthe four- to five-leaf stage and internodes at dif-ferent developmental stages. The values indicatethe signal-normalized hybridization intensity foreach gene and (2) signifies a below-backgroundsignal intensity of #6,000. Note that contig num-ber 2949673.2.1 was not included in CAD ex-pression studies because we were unable toamplify a corresponding GST. C, Relative contri-bution of each gene to total CAD gene expression.R, Roots; L, leaves; YS, young stems, which resultsfrom piled-up internodes at the four- to five-leafstage. IN6, Internode just below the node bearingthe ear at silking; IN1; basal internode at silking.Note that equivalent datasets as found in B and Care available for all gene entries in MAIZEWALL.
Cell Wall Genomics in Maize
Plant Physiol. Vol. 143, 2007 353 www.plantphysiol.orgon June 13, 2018 - Published by Downloaded from
Copyright © 2007 American Society of Plant Biologists. All rights reserved.
of the six spotted genes were expressed at similarlevels, in roots only three were expressed with Y13733,the classic maize CAD, accounting for one-half of totalCAD gene expression. In leaves, contig number4424417.2.1 was the predominant CAD gene. In IN6,total CAD transcriptional activity was high and there-after decreased in IN1 (Fig. 7B). All contigs wereexpressed in IN6, with Y13733 being the most highlyexpressed among them. Furthermore, contig number32038382.1 was only expressed in IN6. In IN1, globalCAD expression was low, with Y13733 continuing tobe the most highly expressed.
Histochemical Analysis Reveals a Large Diversity of
Spatially Regulated, Lignified Cell Types in Maize
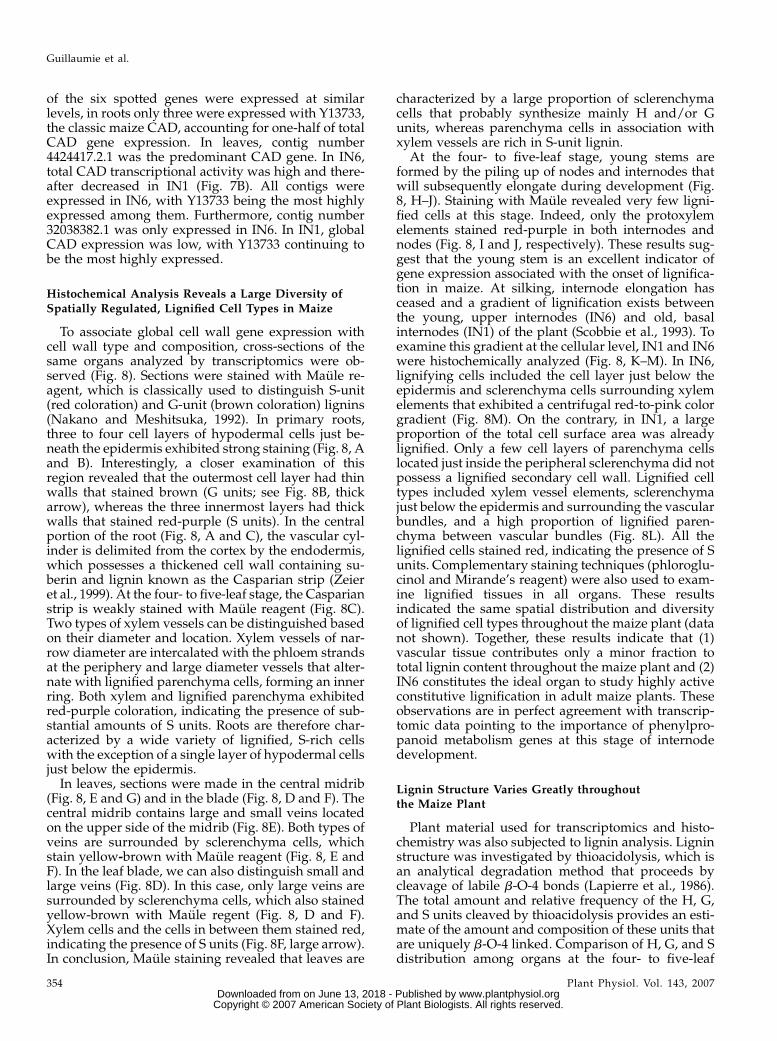
To associate global cell wall gene expression withcell wall type and composition, cross-sections of thesame organs analyzed by transcriptomics were ob-served (Fig. 8). Sections were stained with Maule re-agent, which is classically used to distinguish S-unit(red coloration) and G-unit (brown coloration) lignins(Nakano and Meshitsuka, 1992). In primary roots,three to four cell layers of hypodermal cells just be-neath the epidermis exhibited strong staining (Fig. 8, Aand B). Interestingly, a closer examination of thisregion revealed that the outermost cell layer had thinwalls that stained brown (G units; see Fig. 8B, thickarrow), whereas the three innermost layers had thickwalls that stained red-purple (S units). In the centralportion of the root (Fig. 8, A and C), the vascular cyl-inder is delimited from the cortex by the endodermis,which possesses a thickened cell wall containing su-berin and lignin known as the Casparian strip (Zeieret al., 1999). At the four- to five-leaf stage, the Casparianstrip is weakly stained with Maule reagent (Fig. 8C).Two types of xylem vessels can be distinguished basedon their diameter and location. Xylem vessels of nar-row diameter are intercalated with the phloem strandsat the periphery and large diameter vessels that alter-nate with lignified parenchyma cells, forming an innerring. Both xylem and lignified parenchyma exhibitedred-purple coloration, indicating the presence of sub-stantial amounts of S units. Roots are therefore char-acterized by a wide variety of lignified, S-rich cellswith the exception of a single layer of hypodermal cellsjust below the epidermis.
In leaves, sections were made in the central midrib(Fig. 8, E and G) and in the blade (Fig. 8, D and F). Thecentral midrib contains large and small veins locatedon the upper side of the midrib (Fig. 8E). Both types ofveins are surrounded by sclerenchyma cells, whichstain yellow-brown with Maule reagent (Fig. 8, E andF). In the leaf blade, we can also distinguish small andlarge veins (Fig. 8D). In this case, only large veins aresurrounded by sclerenchyma cells, which also stainedyellow-brown with Maule regent (Fig. 8, D and F).Xylem cells and the cells in between them stained red,indicating the presence of S units (Fig. 8F, large arrow).In conclusion, Maule staining revealed that leaves are
characterized by a large proportion of sclerenchymacells that probably synthesize mainly H and/or Gunits, whereas parenchyma cells in association withxylem vessels are rich in S-unit lignin.
At the four- to five-leaf stage, young stems areformed by the piling up of nodes and internodes thatwill subsequently elongate during development (Fig.8, H–J). Staining with Maule revealed very few ligni-fied cells at this stage. Indeed, only the protoxylemelements stained red-purple in both internodes andnodes (Fig. 8, I and J, respectively). These results sug-gest that the young stem is an excellent indicator ofgene expression associated with the onset of lignifica-tion in maize. At silking, internode elongation hasceased and a gradient of lignification exists betweenthe young, upper internodes (IN6) and old, basalinternodes (IN1) of the plant (Scobbie et al., 1993). Toexamine this gradient at the cellular level, IN1 and IN6were histochemically analyzed (Fig. 8, K–M). In IN6,lignifying cells included the cell layer just below theepidermis and sclerenchyma cells surrounding xylemelements that exhibited a centrifugal red-to-pink colorgradient (Fig. 8M). On the contrary, in IN1, a largeproportion of the total cell surface area was alreadylignified. Only a few cell layers of parenchyma cellslocated just inside the peripheral sclerenchyma did notpossess a lignified secondary cell wall. Lignified celltypes included xylem vessel elements, sclerenchymajust below the epidermis and surrounding the vascularbundles, and a high proportion of lignified paren-chyma between vascular bundles (Fig. 8L). All thelignified cells stained red, indicating the presence of Sunits. Complementary staining techniques (phloroglu-cinol and Mirande’s reagent) were also used to exam-ine lignified tissues in all organs. These resultsindicated the same spatial distribution and diversityof lignified cell types throughout the maize plant (datanot shown). Together, these results indicate that (1)vascular tissue contributes only a minor fraction tototal lignin content throughout the maize plant and (2)IN6 constitutes the ideal organ to study highly activeconstitutive lignification in adult maize plants. Theseobservations are in perfect agreement with transcrip-tomic data pointing to the importance of phenylpro-panoid metabolism genes at this stage of internodedevelopment.
Lignin Structure Varies Greatly throughoutthe Maize Plant
Plant material used for transcriptomics and histo-chemistry was also subjected to lignin analysis. Ligninstructure was investigated by thioacidolysis, which isan analytical degradation method that proceeds bycleavage of labile b-O-4 bonds (Lapierre et al., 1986).The total amount and relative frequency of the H, G,and S units cleaved by thioacidolysis provides an esti-mate of the amount and composition of these units thatare uniquely b-O-4 linked. Comparison of H, G, and Sdistribution among organs at the four- to five-leaf
Guillaumie et al.
354 Plant Physiol. Vol. 143, 2007 www.plantphysiol.orgon June 13, 2018 - Published by Downloaded from
Copyright © 2007 American Society of Plant Biologists. All rights reserved.

Figure 8. Histochemical localization of lignin in maize organs at the four- to five-leaf stage and internodes at different stages ofdevelopment at silking. Sections were stained with Maule reagent. A to C, Transverse sections of primary roots. A, Overall view ofa root section. Red-purple staining in the cells of the hypodermal layers and vascular cylinder indicates the presence of S-unitlignin. B, Close-up of hypodermal layers. The three innermost cell layers stained red-purple and the outermost layer just belowthe epidermis is stained brown, indicating G-unit lignin (large arrow). C, Close-up of the vascular cylinder. The Casparian strip ofthe endodermis and two rows of xylem vessels embedded in parenchyma cells are all stained red-purple. D to G, Transverse
Cell Wall Genomics in Maize
Plant Physiol. Vol. 143, 2007 355 www.plantphysiol.orgon June 13, 2018 - Published by Downloaded from
Copyright © 2007 American Society of Plant Biologists. All rights reserved.

stage revealed striking differences (Table IV). Rootlignin was particularly rich in S units (62.5%), whereas,on the contrary, leaf lignin was particularly rich in Gunits (72.9%). These results are in good agreementwith Maule histochemical staining. When examininginternode development, young stems contain the low-est proportion of S, with slightly more in IN6, followedby IN1. These results suggest that young tissues pref-erentially accumulate G-unit lignin, whereas S-unitlignin content increases with maturity. This has al-ready been observed in other species (Meyer et al.,1998). Interestingly, H units appear to be more abun-dant in younger tissues (7.2% in roots, 5.3% in youngstems, and 5.4% in IN6) as compared to older tissues(2.2% in IN1). Finally, if one uses thioacidolysis yield(Table IV, H 1 G 1 S) as an indicator of lignin content,it may be deduced that IN1 and roots are the mostlignified tissues (83 and 53 mmol, respectively), whereasleaves are the least lignified (34 mmol). This is also inagreement with histochemical data. In conclusion,lignin deposition and composition are highly regu-lated at the spatial level and reflect the extreme diver-sity of lignified cell types throughout the maize plant.
DISCUSSION
MAIZEWALL: A Valuable Tool to Integrate Knowledgeof Cell Wall Biosynthesis and Assembly in Maize
At present, our knowledge of cell wall biosynthesisand assembly, especially in monocotyledons, is frag-mentary. When taking into consideration the extent ofwall polymer diversity, the multitude of ways theyassemble in muro, the high degree of wall specificity indifferent cell types, and the dynamic changes that takeplace during development within a given cell, it ispredicted that several hundreds or even thousands ofgenes are required for proper, coordinated wall for-mation. Cell wall-related genomic and proteomicdatasets are now available in herbaceous model spe-cies, such as Arabidopsis (Zhao et al., 2005; Jamet et al.,2006) and zinnia (Demura et al., 2002; Milioni et al.,2002; Pesquet et al., 2005), and in woody species,including poplar (Hertzberg et al., 2001) and pine(Pavy et al., 2005). Some Web sites are also dedicated
to specific protein families, including expansins(http://www.bio.psu.edu/expansins/index.htm), cel-lulose synthases and cellulose synthase-like genes(http://cellwall.stanford.edu/cesa/index.shtml), andXTHs (http://labs.plantbio.cornell.edu/XTH/overview.htm). In this respect, a large gap exists for monocotspecies in that genomic inventories specifically de-voted to cell walls are lacking. That said, a high-throughput, Fourier transform infrared-based screenhas been set up to identify maize plants with modifi-cations in wall assembly or architecture from theUniformMu maize mutant population developed at theUniversity of Florida (http://www.cellwall.genomics.purdue.edu; Bleecker et al., 2004). In this article, wedescribe the construction of MAIZEWALL, a repertoryof 735 genes complete with in-depth bioinformaticanalysis and a transcriptional fingerprint of cell wall-related gene expression throughout the maize plant.We consider MAIZEWALL to be a significant leap for-ward for maize cell wall research while awaiting thefull genome sequence in public databases.
The 735 sequences of MAIZEWALL are divided into174 families based on known gene annotations. As ouraim was to subsequently use this database and thecorresponding macroarray for a wide range of appli-cations, including mutant analysis, we deliberatelychose to widen the scope of entry annotations to in-clude not only primary and secondary cell wall bio-synthetic and assembly genes, but also genes involvedin closely related metabolism. To provide the mostcomprehensive and original overview of gene families
Figure 8. (Continued.)sections in leaves. D, Leaf blade. E, Midrib. F, Close-up of a vascular bundle from a large vein in the blade. G, Close-up of avascular bundle from a large vein in the midrib. In all cases, note the yellow-brown coloration of the sclerenchyma cells abovethe vascular bundle, indicating the absence of S-unit lignin. H, Longitudinal section through the young stem, resulting frompiled-up internodes of plants at the four- to five-leaf stage. Black lines indicate the positions of transverse sections in internodaland nodal regions shown in I and J, respectively. I, Transverse section in the first internode. J, Transverse section in the node. Onlywalls of the protoxylem are stained red. K, General view of a maize plant at the silking stage grown under greenhouse conditions.White lines indicate the positions of transverse sections of IN1 and IN6 shown in L and M, respectively. L, Transverse sections ofIN1 showing red staining of all lignified tissues, including sclerenchyma, parenchyma cells, and xylem. M, Transverse sections inIN6. Note that sclerenchyma cells are very weakly stained and parenchyma cells are not at all. en, Endodermis; ph, phloem; p,pith; ep, epidermal cells; hp, hypodermal cell; c, cortex; s, sclerenchyma; x, xylem; lv, large veins; sv, small veins; vb, vascularbundle; lp, lignified parenchyma; px, protoxylem; mx, metaxylem. Magnification bars: B, C, and F, 100 mm; A, D, E, G, L, and M,200 mm; I and J, 400 mm.
Table IV. Lignin composition of maize organs at the four- tofive-leaf stage and in internodes at silking
Each measurement represents the mean of two assays with individualvalues varying by ,3% from the mean.
Samples H 1 S 1 G S/G H G S
mmol % % %Roots 53 2.05 7.2 30.4 62.4Leaves 14 0.32 3.9 72.9 23.3Young stem 17 0.40 5.3 67.5 27.3IN6 34 0.71 5.4 55.4 39.2IN1 83 1.02 2.2 48.3 49.5
Guillaumie et al.
356 Plant Physiol. Vol. 143, 2007 www.plantphysiol.orgon June 13, 2018 - Published by Downloaded from
Copyright © 2007 American Society of Plant Biologists. All rights reserved.

in secondary wall formation, we also included maizehomologs of cDNAs derived from our zinnia TEdifferentiation library (Pesquet et al., 2005). The se-quences were organized into functional categories,including cellulose synthesis, noncellulosic polysac-charide synthesis, general phenylpropanoid, lignin/lignan, transcription factors, etc. This classificationwas temporary because an actual proof-of-functionfor any of the MAIZEWALL entries is extremely rare.In our study, as part of the bioinformatic analysis, themost homologous genes in other species have beenprovided in the database, but these data are basedsolely on sequence homology and should not be takenas an indication of equivalent gene function. When themaize genome becomes available, it will be necessaryto update this search.
Transcriptome-Based Identification of Developmental
Marker Genes of Cell Wall Formation in Maize
Global gene expression analysis in different organsand developmental stages of internode developmentprovided us with a fingerprint of the cell wall tran-scriptome throughout the maize plant. In this way, weidentified (1) individual gene family members that arepreferentially expressed in a particular organ or de-velopmental stage, and (2) genes that are spatially andtemporally coregulated. When considering youngplants, the observation that one-third of the genes spot-ted on the macroarray are not expressed at all is, initself, of interest. This implies that the transcriptionalneeds in the early stages of plant development revolvearound a restricted set of metabolic functions. Whenexamining the 30 most abundantly expressed genes inall young organs, it is clear that genes involved inpolysaccharide biosynthesis and modification genesare predominant. Regarding cellulose synthesis, a cel-lulose synthase (QBS7b05.xg.2.1), two isoforms of Sucsynthase (contig nos. 3748394.2.2 and 131537.2.202),and three endoglucanases (contig nos. 2493751.2.1,3713002.2.1, and 2922138.2.1) were identified. Amongthe 14 cellulose synthase genes spotted on the macro-array, only one gene (QBS7b05.xg.2.1) exhibited con-sistently high levels of expression, not only throughoutyoung plants but also during later stages of internodedevelopment. The expression patterns of 12 cellulosesynthase genes (ZmCesA1–12) in maize have beenpreviously reported (Holland et al., 2000; Appenzelleret al., 2004). ZmCesA1 to 9 were considered moreclosely associated with cellulose synthesis in primarywalls, whereas ZmCesA10 to 12 were more closelyassociated with secondary wall cellulose synthesis.QBS7b05.xg.2.1 shares 95% identity with ZmCesA12.The most homologous Arabidopsis gene is irx3, whichhas been clearly shown to be associated with second-ary wall cellulose biosynthesis (Taylor et al., 1999).Detailed functional analysis of QBS7b05.x.g.2.1 inmaize would enable us to determine its role in eitherprimary or secondary wall cellulose metabolism. Sim-ilarly, two of the four spotted contigs annotated UDP-
Glc dehydrogenase were among the most highly ex-pressed genes in all young tissues (but not in IN6 orIN1). UDP-Glc dehydrogenase is a key enzyme thatoxidizes UDP-Glc to UDP-GlcUA and thus directscarbohydrates irreversibly into the cell wall-specificpool of nucleotide sugars. These transcriptomic dataallowed us to identify major actors of cell wall metab-olism in young maize tissues, some expressed organpreferentially and others expressed ubiquitously.
A completely different transcriptome fingerprintwas obtained when examining the 30 most highly andpreferentially expressed genes at midstage internodedevelopment (IN6). Clearly, the most highly abundantand/or preferentially expressed transcripts in IN6 in-clude genes in secondary cell wall synthesis and, moreparticularly, certain gene family members of the ligninbiosynthetic pathway (three PALs, one C4H, one 4CL,two CCoAOMTs, one CCR, one COMT, one F5H1, andone CAD). These transcriptomic data are in perfect agree-ment with cytological observations indicating that IN6is clearly at the onset of lignification. Moreover, theseresults suggest highly coordinated transcriptional co-regulation among many genes along the monolignolbiosynthetic pathway. It is interesting to note that Myband monopteros transcription factors are also prefer-entially expressed in IN6, making them excellentcandidates for transcriptional regulation of lignin bio-synthesis. Myb factors have already been shown toplay a role in the coordinated regulation of lignin genesin several different plant species (Karpinska et al., 2004;Goicoechea et al., 2005).
Toward a Division of Labor among Family Membersof Lignin Biosynthetic Genes in Different Organs
Until now, the known actors involved in dicot ligninbiosynthesis have not been studied in any detail inmaize, with the exception of a few isolated geneexpression studies for COMT (Capellades et al., 1996),CCR (Pichon et al., 1998), and CAD (Halpin et al.,1998). Allelic variations have also been evaluated fortwo CCoAOMT and COMT genes in 34 lines of maizeselected for their varying digestibility (Guillet-Claudeet al., 2004). Herein, we combine cytological, chemical,and transcriptomic approaches as a first step in deter-mining the gene family member for each of the 10enzymatic steps of the monolignol biosynthetic path-way that is most likely involved in lignin formation indifferent organs and stages of internode development.As a general rule, monolignol biosynthetic enzymesthat are encoded by multigene families in Arabidopsisare also encoded by multigene families in maize,although the numbers may vary. A similar observationhas already been made between rice and Arabidopsis(Yokoyama and Nishitani, 2004). Although these dif-ferences in gene number certainly exist among species,the predicted number of genes for a given functionalso depends on the bioinformatic parameters used forgene annotation in the different studies. That said, wedid find some essential differences in gene number
Cell Wall Genomics in Maize
Plant Physiol. Vol. 143, 2007 357 www.plantphysiol.orgon June 13, 2018 - Published by Downloaded from
Copyright © 2007 American Society of Plant Biologists. All rights reserved.
between Arabidopsis and maize. First, C4H and HCTare encoded by single genes in Arabidopsis, whereaswe identified two genes for each of these functions inmaize. Second, in Arabidopsis, C3H is encoded bythree genes, whereas only one was identified in maize.It is possible that other maize C3Hs may be identifiedwhen the complete genome sequence becomes avail-able.
In Supplemental Figure S5, we have compiled geneexpression data for each of the 10 gene families (basedon Figures 3–7 and Table III) to propose the most likelyroutes of monolignol biosynthesis in young organsand during internode development in maize. Thisscheme is based exclusively on relative gene expres-sion levels for each family, and, for this reason, wecannot exclude that the most highly expressed genesmay be involved in the synthesis of other phenylpro-panoid metabolites and not necessarily monolignols.
Is There a Sclerenchyma-Specific Route for G-UnitLignin Synthesis in Leaves?
Lignin analysis of maize plants at the four- to five-leaf stage indicated that leaves were characterized by ahigh proportion of G units. Similar results have al-ready been reported for leaves at the flowering stage(Piquemal et al., 2002). Our cytological observationsrevealed that leaf veins are surrounded by patches ofheavily lignified sclerenchyma cells that account for alarge majority of lignified cells in leaves. These cellsstain yellow-brown with Maule, thereby explainingthe high G-unit lignin content in leaves. To our knowl-edge, G-rich sclerenchyma fibers have not been de-scribed in higher plants. In dicots, it is commonlyaccepted that xylem vessels contain G units, whereasfibers and parenchyma contain both G- and S-unit lig-nin, with the latter predominating in fibers (Donaldson,2001). These results suggest that a novel genetic pro-gram leading to G units in sclerenchyma fiber cellsmay be functional in maize leaves.
When analyzing gene expression data, we notedthat some members of the multigene families of themonolignol pathway exhibited proportionally highlevels of expression in the leaves. In the case of PAL,among the five contigs, three were expressed in leaves,one of which (contig no. 3858663.2.1) contributed tothe large majority of total PAL transcriptional activityin leaves. This class II maize PAL is most homologousto Arabidopsis PAL2. In Arabidopsis, PAL2 is ex-pressed in all organs, although most abundantly inroots and stems (Raes et al., 2003). Based on geneexpression data, Arabidopsis PAL2, along with PAL1,was considered to be most likely involved in consti-tutive lignin biosynthesis in Arabidopsis. Detailedsequence analysis of the promoter region of PAL2indicated the presence of an AC box. Interestingly, theauthors hypothesize that this AC box may be a potentialsignpost of genes involved in G-unit lignin synthesis(Raes et al., 2003). Continuing along the pathway,among the 4CL genes in maize, one of them, 4CL, is the
most highly expressed in leaves. The maize 4CL geneis most homologous to the Arabidopsis 4CL1 gene,which, along with Arabidopsis 4CL2, is considered tobe involved in constitutive lignification. Again, thepresence of an AC box in the promoter region in 4CL1from Arabidopsis was indicative of G-unit synthesis.By combining cytological, biochemical, and transcrip-tome data, it is tempting to speculate that the maizePAL (contig no. 3858663.2.1) and 4CL channel phenyl-propanoid intermediates into a G-rich sclerenchymapathway in maize leaves. However, we cannot excludethat these genes function in a distinct branch ofphenylpropanoid metabolism in leaves. Promoteranalysis of these and laser microdissection techniquescoupled to metabolic profiling would be particularlyuseful to confirm the hypothesis that there is a G-unitmonolignol pathway in the sclerenchyma cells ofmaize leaves.
Finally, transcript profiling of G-rich leaves yieldedsome unexpected results and raises new questions.First, among CAD family members, contig number4424417.2.1 is the most highly expressed in leaves. Thisgene was originally annotated as SAD like. Our ex-pression data are in apparent contradiction with theidea that this branch of the CAD family phylogenetictree is specifically dedicated to S-unit lignin synthesis.Second, F5H1, again normally associated with S-unitlignin synthesis, is among the 30 most highly ex-pressed genes in leaves. This observation obliges us toreexamine the role of this F5H gene in maize leaves. Inany case, all of these genes must be subjected to in-depth biochemical and molecular characterization toprecisely determine their role in planta.
Is There a Root-Specific Pathway to SynthesizeS-Unit Lignin?
A question that should be addressed in detail iswhether lignin biosynthesis occurs via the same suiteof enzymatic steps in all organs and at all develop-mental stages during plant life. This is probably due tothe fact that most biochemical and molecular studieson lignification focus primarily on stems of model,herbaceous plants or wood. Some clues may be ob-tained from the recent characterization of the C3H1mutant in Arabidopsis (Abdulrazzak et al., 2006). Asexpected, the aerial portions of the mutant had lowerlignin content and were almost exclusively composedof H units, with only trace amounts of G and S units.More surprisingly, in roots, lignin contained both Gand S units in significant amounts. These resultssuggest that the hydroxylation step leading to G andS synthesis must occur via a C3H-independent path-way in Arabidopsis roots. In keeping with this hy-pothesis, the unique C3H gene identified in maize isexpressed at barely above background levels in rootsand it would be difficult to imagine that this C3Henzyme could, in itself, account for the total flux ofphenylpropanoid metabolites into G and S units inroots. However, the fact that a relatively high level of
Guillaumie et al.
358 Plant Physiol. Vol. 143, 2007 www.plantphysiol.orgon June 13, 2018 - Published by Downloaded from
Copyright © 2007 American Society of Plant Biologists. All rights reserved.

H-unit lignin was measured in roots, concomitantlywith low C3H expression levels, on the contrary, mayindeed suggest that C3H may be involved in control-ling the channeling of monolignols from the H- toG- and S-unit pathways. It is interesting to note thatoverall C3H expression is relatively low not only inroots but also, to a lesser extent, throughout the maizeplant. Inefficient C3H-mediated channeling may ex-plain, at least in part, the accumulation of H-unit ligninin maize (and in monocots in general) in comparisonto dicot species.
In maize, lignin analysis of roots from plants at thefour- to five-leaf stage indicated an extremely highproportion of S-unit lignin as compared to the otherorgans studied. Maize roots therefore provide aunique opportunity to probe S-unit synthesis in maize.Several studies carried out in dicots underline theimportance of F5H1 in the synthesis of S units inArabidopsis (Meyer et al., 1998; Humphreys et al.,1999; Ruegger et al., 1999), tobacco, and poplar (Frankeet al., 2000). Unexpectedly, transcriptome profiling ofS-unit-rich roots of maize revealed that F5H1, the mostlikely functional homolog of F5H1 from Arabidopsisbased on sequence analysis, was not expressed at all inroots. However, RT-PCR analysis did indicate that adistinct F5H, F5H2, was expressed, but only slightly, inmaize roots (data not shown). These data suggest thatthe hydroxylation of coniferaldehyde and/or coniferylalcohol for S-unit synthesis may occur either via F5H2or perhaps by a totally different pathway in maizeroots. Interestingly, in Arabidopsis, neither of two F5Hgenes is even moderately expressed in roots comparedto the other organs (Raes et al., 2003), raising thequestion as to whether, even in Arabidopsis, F5H isinvolved in S-unit synthesis in roots. It would beinteresting to determine whether lignin compositionof the F5H mutant (fah1) is altered in roots. Takentogether, it is not clear whether roots from all speciesuse a common hydroxylation/methylation pathwayfor G-unit and S-unit lignin synthesis that is differentfrom the aerial portions or whether roots use alterna-tive pathways for G-unit and S-unit lignin synthesis ina species-specific manner. In any case, based on therelatively high proportion of H units typically found inmonocot versus dicot lignin, it is reasonable to assumethat some specificity in terms of the genes and regu-latory mechanisms of hydroxylation/methoxylationpathways exist in monocots.
In the search for clues to explain high S-unit lignincontent in roots, we closely examined the CAD familytranscriptome because it is still unclear as to whetherCAD/SAD isoforms orient G- and S-unit synthesis,respectively. Li et al. (2001) originally identified anenzyme in poplar with high sequence homology to thetraditional CAD gene, but with higher substrate spec-ificity for sinapaldehyde than for coniferaldehyde. Theauthors called this enzyme SAD and proposed thatSAD was required for S-unit biosynthesis, whereasCADs were required for G-unit lignin biosynthesis.However, more recently, Sibout et al. (2005) reported
that, in Arabidopsis, CAD genes were sufficient toproduce S-unit lignin without the requirement forSAD genes. Our results indicate that the classic CAD(Y13733) is by far the predominantly expressed CADin roots. This finding further supports the hypothesisthat CAD is sufficient to produce both S and G units,even in maize.
Above and beyond the benefits for maize ligninresearch, MAIZEWALL is unique in that it contains anin-depth bioinformatic analysis and expression dataon a wide range of cell wall-related families in a mono-cot species within a single interface. It provides thegroundwork to significantly enhance our basic knowl-edge of cell walls in maize and can be of immediateuse for a wide range of agronomic and industrial pur-suits ranging from forage digestibility to bioethanolproduction (Boudet et al., 2003).
MATERIALS AND METHODS
Plant Material
The well-characterized F2 maize (Zea mays) line was used in this study.
Plants were grown in pots with a mixture of sand and compost and irrigated
with nutritive solution in the greenhouse during the spring of 2004 in
Lusignan, France. Plants were harvested when they had four to five expanded
leaves or at silking just before pollen shed. At the four- to five-leaf stage, roots,
piled-up internodes (referred to as young stems throughout the text), and
leaves were harvested. At the silking stage, the basal internode (IN1) and the
internode just below the node bearing the ear (IN6) were sampled. Nodes and
leaf sheaths were eliminated. For transcriptome analysis, all samples were
frozen in liquid nitrogen and conserved at 280�C. Nine plants were divided
into three pools of three plants each for transcriptome analysis and all plants
were pooled for lignin analysis.
Database Construction
The MAIZEWALL database was constructed using two gene sources. The
first was based on a list of nearly 100 keywords from existing knowledge of
primary and secondary cell wall biosynthesis and assembly, and vascular
patterning was established. These keywords fell under different categories:
cellulose synthesis, noncellulose polysaccharide synthesis, nucleotide sugar
synthesis, conversion and transport, cell wall proteins, general phenylpropa-
noid, lignin/lignan, etc. Keywords were used to search the PubMed, Nucleotide,
and Protein resources of the National Center for Biotechnology Information
(NCBI) databases to retrieve all available information related to each key-
word (literature references, nucleotide and protein sequences, respectively).
Searches were first performed using keyword ‘‘AND Zea’’ (to obtain a maize
sequence when available). If a maize sequence was unavailable, keyword
‘‘AND plant’’ was used to obtain a plant sequence that was subsequently used
(see below) as bait to retrieve unannotated sequences in maize databases. The
second source of genes corresponded to maize genes exhibiting homology
with ESTs from a zinnia (Zinnia elegans) subtractive library enriched in genes
expressed during secondary wall formation of in vitro TEs (Pesquet et al.,
2005). Briefly, 232 NR ESTs were generated by suppressive subtractive hy-
bridization carried out on in vitro differentiating TEs of zinnia at several
selected time points corresponding to presecondary cellulose thickening,
prelignification, and early cell death.
All of the protein and nucleotide sequences from the two above-mentioned
strategies were used to search the most homologous maize sequences in the
MaizeGenoplanteContigsVersion2 database (GPI2). The Genoplante database
includes mRNAs retrieved from NCBI and ESTs from the Genoplante pro-
gram, dbEST, and Stanford resources (Samson et al., 2003). A global clustering
of sequences was performed to produce gene-specific contigs. At the time of
this writing, GPI2 contained nearly 60,000 contigs.
An overall scheme for the construction of MAIZEWALL can be found in
Figure 1. MAIZEWALL was written in PHP language (http://www.php.net),
Cell Wall Genomics in Maize
Plant Physiol. Vol. 143, 2007 359 www.plantphysiol.orgon June 13, 2018 - Published by Downloaded from
Copyright © 2007 American Society of Plant Biologists. All rights reserved.

runs on an Apache2 server, and interacts with MySQL (http://www.mysql.
com) to save data in the form of tables and make queries related to the data.
PHP script uses some applications on the GPI secure interface, such as
BLAST2 (Altschul et al., 1997), ClustalW (Thompson et al., 1994), Dialign2
(Morgenstern, 1999), Multalin (Corpet, 1988), eprimer3 (Rozen and Skaletsky,
2000), SWALL (SWISS-PROT, TrEMBL, and new databases), NR protein
database, Genoplante contig databases, and some EMBOSS package programs
(revseq and transeq; Rice et al., 2000). Several programs were also applied to
Arabidopsis (Arabidopsis thaliana) protein sequences that correspond to ho-
mologs of maize-selected contigs to search protein domains, signal peptide
position, transmembrane domains, and subcellular targeting sequences. They
include Aramemnon (Schwacke et al., 2003), MIPS (Schoof et al., 2002), PSORT
(Nakai et Horton, 1999), PROSITE (Sigrist et al., 2002), SMART (Schultz et al.,
2000; Finn et al., 2006), ProDom (Corpet et al., 1998), SignalP (Bendtsen et al.,
2004), TMHMM (Krogh et al., 2001), TargetP (Emanuelsson et al., 2000), and
Predotar (Small et al., 2004).
For zinnia sequences, BLASTn and tBLASTx searches were performed
directly on GPI2. Maize sequences with an e value of e205 from zinnia se-
quences and an e value of e220 from a keywords search that annotated with the
expected putative function against SWALL (SWISS-PROT, TrEMBL, and new
databases) and NR databases were included in MAIZEWALL. In total, 735
contigs met these criteria. All of the MAIZEWALL entries were used to re-
trieve the closest available sequence in other plant species, including rice
(Oryza sativa), pine (Pinus sylvestris), poplar (Populus tremuloides), Arabidopsis,
wheat (Triticum aestivum), barley (Hordeum vulgare), sorghum (Sorghum bicolor),
and Medicago.
To construct the macroarray, we designed specific primer pairs to amplify
gene-specific PCR fragments for each gene. Toward this end, contigs that
annotated with the same putative function (and hence with a high degree of
homology) were multialigned using ClustalW, Dialign2, and Multalin pro-
grams. The 3#-UTRs were defined and specific primer pairs designed using
the eprimer3 program (20 bp, Tm � 58�C–60�C) to amplify GSTs of 150 to
250 bp in length. GST specificity was confirmed by BLAST against GPI2 to
ensure that no hits were detected except for the contig of origin.
Macroarray Construction
To design the macroarray that would guarantee maximal signal specific-
ity and sensitivity, a pilot experiment was carried out on a set of three
O-methyltransferase genes selected for their known expression profiles. The
experiment was designed to optimize the following parameters: (1) quantity
of cDNA spotted on the membrane; (2) source for probe synthesis (total RNA
versus polyA RNA); (3) probe type (reverse-transcribed cDNA versus random
priming); (4) length of GSTs spotted; and (5) relative proportion of 3#-UTR and
coding sequence to ensure hybridization specificity within a multigene family.
The pilot macroarray contained COMT (M73235), CCoAOMT1 (AJ242980),
and CCoAOMT2 (AJ242981). The results of this pilot array enabled us to
define technical parameters for the cell wall macroarray as follows: spotted
PCR products corresponded to the 3#-UTR of 150 to 250 bp in length at a
concentration of 0.25 mg/mL (100 nL/spot); the cDNA probe was generated
from reverse transcription of total RNA.
Six hundred fifty-one GSTs were spotted on the macroarray. The GSTs were
amplified by PCR in 96-well PCR plates in a total volume of 50 mL/well with
25 mL of 2 3 Master Mix PCR (Promega), 4 mL of forward and reverse specific
primers for each GST (10 mM each), 20 mL of ultrapure water, and 1 mL of the
recombinant bacterial culture containing the corresponding plasmid. To obtain
PCR products of genes for which a viable bacterial culture was not available,
RT-PCR was performed on a pool of roots, young stems, and leaves of the F2
line using standard procedures (Promega). All primers were synthesized by
MWG-BIOTECH.
PCR products were transferred to Eppendorf tubes, precipitated in sodium
acetate (0.3 M) and isopropanol overnight at 220�C, and centrifuged for
30 min at 12,000 rpm. Pellets were then rinsed twice in 70% ethanol, dried, and
resuspended in 20 mL of Tris-EDTA buffer (pH 8.0). PCR products were
checked for a single band of the expected size and quantified at 260 nm with a
Biophotometer (Eppendorf) and by electrophoresis on 2% agarose gels. They
were diluted to a final concentration of 0.5 mg/mL. PCR products were then
denatured in 50% DMSO and transferred to 384-well plates. Controls were
added in separate 384-well plates. One plate included 384 Tris-EDTA, pH 8.0
(blank background control), and another plate with 30 NPT II fragments (a
positive hybridization control), 20 pBluescript plasmids (unspecific hybridi-
zation control), and 18 ubiquitin fragments (positive control) prepared as
indicated above (Pesquet et al., 2005). All fragments were then spotted onto a
20- 3 20-cm Nytran SuPerCharge nylon membrane (Schleicher and Schuell)
using a BioGrid spotting robot (BioRobotics) in a 4 3 4 grid organization with
each spotted in duplicate within a grid. Each amplified GST was also spotted
in two different grids, which means that each GST was spotted four times on
each macroarray. All macroarrays were UV cross-linked at 1,200 3 100 mJ/cm2
prior to use.
RNA Extraction and Purification
Total RNA was isolated from 5 g of each sample according to the method
described by Ragueh et al. (1989). After grinding in liquid nitrogen, the
material was resuspended in extraction buffer (200 mM Tris, pH 7.0, 20 mM
EDTA, 100 mM NaCl, 1% SDS) and extracted twice with phenol:chloroform:
isoamylalcohol (25:24:1). Total RNA was precipitated with sodium acetate
(0.3 M) with isopropanol. The aqueous phase was separated by centrifugation
(20 min, 12,000 rpm) and the pellet resuspended in nuclease-free water.
Finally, RNA was extracted with phenol:chloroform:isoamylalcohol (25:24:1)
and twice with chloroform:isoamylalcohol (24:1). After extraction, LiCl (3 M)
was added to the aqueous phase and left overnight at 4�C. RNA was
precipitated by centrifugation (30 min at 12,000 rpm) and the resulting pellet
rinsed with ethanol (100%) and resuspended in sterile, distilled water. Total
RNA was subjected to DNA digestion with 5 units of RNase-free DNase I
(Promega) for 1 h at 37�C. RNA content was measured at 260 mm with a
Biophotometer (Eppendorf) and visualized by electrophoresis on 1.5% aga-
rose gels. RNA concentration was then adjusted to 1 mg/mL for further use. To
obtain polyA RNA, Dynabeads oligo(dT)25 (Dynal Biotech ASA) were used
according to the Dynal Biotech protocol (http://www.invitrogen.com).
cDNA Probe Synthesis and Hybridization
cDNA probe synthesis and membrane hybridization were performed
according to Pesquet et al. (2005) with two slight modifications. First, probes
were synthesized from 10 mg of total RNA for each sample. Second, after
hybridization at 65�C, membranes were washed more stringently at the same
temperature: twice for 15 min in 3 3 SSC/0.5% SDS, once for 15 min in
1 3 SSC/0.5% SDS, once for 15 min in 0.5 3 SSC/0.5% SDS, and once for
15 min in 0.1 3 SSC/0.5% SDS. Membranes were wrapped in cellophane and
placed in a PhosphorImager cassette (Molecular Dynamics, Amersham-
Pharmacia) for 72 h and scanned at 50 mm/pixel by a Storm 820 scanner
(Amersham-Pharmacia).
Statistical Analysis of Gene Expression
Data analysis was performed according to Pesquet et al. (2005). Macroarray
gridding and gene expression levels were measured with ImageQuant 5.0
software (Molecular Dynamics, Amersham-Pharmacia) using 4 3 4 grids.
Grids were adjusted manually and tested with regard to the distance of the
maximal intensity value from the centroid of the measured area in x and y axis.
Expression data for all gene sequences were analyzed using the Microsoft
Excel program. Normalization between samples was established using the
linear slope defined by the blank background, unspecific hybridization, and
positive hybridization controls (Tris-EDTA, pH 8, pBluescript, ubiquitin, and
NPT II, respectively) in the different samples (Supplemental Fig. S1). The
slope defined by the controls indicated a linear correlation factor of R2 close to 1.
Preliminary analyses were first performed to assess the inner-membrane
variation of duplicate spots for each gene on the same membrane and the re-
producibility of spot intensity ratios (expressed as a log10 expression ratio
[LR]) resulting from hybridizations of independent membranes using inde-
pendent probes derived from independent biological samples. The data
obtained were highly reproducible within a given membrane and, even
more importantly, between two independent membranes (Supplemental Fig.
S2). In the experiment illustrated in Supplemental Figure S2, 96% of the values
fell within 60.176 LR of the mean (equivalent to a 1.5-fold difference) and 99%
within 60.3 LR (equivalent to a 2-fold difference). Macroarray reproducibility
was further analyzed by comparing spot intensity values from three inde-
pendent hybridizations performed on three independent membranes with
probes from three independent samples. Linear coefficients of determination
between experiments were calculated, thereby defining high reproducibility
between independent hybridizations with more than 95% of the values
confined within a 2-fold limit (Supplemental Fig. S3). The average signal
value from triplicate hybridizations and SD were calculated for each gene
Guillaumie et al.
360 Plant Physiol. Vol. 143, 2007 www.plantphysiol.orgon June 13, 2018 - Published by Downloaded from
Copyright © 2007 American Society of Plant Biologists. All rights reserved.
(Supplemental Table S4). Genes whose SDs exceed their average signal values
were eliminated from the Microsoft Excel spreadsheet gene list. Taking into
consideration background signal intensities, a gene was considered expressed
when its intensity was greater than 6,000 and, in order for a gene to be con-
sidered as differentially expressed between two hybridizations, the difference
in spot intensities had to be greater than a 2-fold significance threshold.
Phylogenetic Analysis of Lignification Genes
For the construction of phylogenetic trees, contig sequences were aligned
with the ClustalW 1.83 program (Thompson et al., 1994) and the relation
between them was then investigated with the Phylip 3.5 package (http://
evolution.genetics.washington.edu/phylip.html). Sequence alignments were
performed with the Needle program of EMBOSS software suite (Rice et al.,
2000).
Lignin Histochemical Staining
Leaf, stem, and root sections were cut with a vibratome. Maule reactions
were performed according to standard protocols (Nakano and Meshitsuka,
1992). Sections were observed using an inverted microscope (Leitz DMIRBE).
Images were registered using a CCD camera (Color Coolview; Photonic
Science) and treated by image analysis (Image Pro-Plus; Media Cybernetics).
Lignin Analysis
Leaves, roots, and young stems of four- to five-leaf-stage plants and IN1
and IN6 of flowering plants were lyophilized at harvest and ground to a fine
powder. Lignin monomeric composition was determined by thioacidolysis
followed by gas chromatography (GC)-mass spectrometry (MS) of lignin-
derived monomer trimethylsilylated (TMS) derivatives (Lapierre et al., 1986).
Thioacidolysis reagent contained 2.5 mL of BF3 etherate and 10 mL of
ethanethiol, adjusted to a 100-mL volume with dioxane. Each dried and
ground sample fragment (dry weight ranging from 10–30 mg) was added to 10
mL of reagent and 1 mL of a docosane solution (0.1 mg/mL in CH2Cl2 as GC
internal standard) in a glass tube closed with a Teflon-lined screw cap.
Thioacidolysis was performed at 100�C for 4 h. The cooled reaction mixture
was diluted with 30 mL of water and its pH was adjusted to 3 to 4 with
aqueous NaHCO3. The reaction mixture was extracted with CH2Cl2 (3 3 30
mL). Combined organic extracts were dried over Na2SO4 and then evaporated
under reduced pressure at 40�C. The final residue was resolubilized in 1 mL
of CH2Cl2 before silylation and GC-MS analysis as previously described
(Lapierre, 1993). The quantitative determination of the main H-, G-, and S-unit
lignin-derived monomers, analyzed as their TMS derivatives, was carried out
from specific ion chromatograms reconstructed at m/z 239 for the H mono-
mers, 269 for G monomers, and 299 for S monomers after an appropriate
calibration relative to the docosane internal standard. These acids were es-
timated from specific ion chromatograms reconstructed at m/z 338 (FE) and
308 (PC), which respectively corresponds to the molecular ions of their TMS
derivatives.
Supplemental Data
The following materials are available in the online version of this article.
Supplemental Figure S1. Normalization between independent experi-
ments.
Supplemental Figure S2. Scatter plot of duplicate spots from independent
hybridizations.
Supplemental Figure S3. Scatter plot of normalized spots of independent
experiments.
Supplemental Figure S4. Nucleic acid identities of lignin genes.
Supplemental Figure S5. Hypothetical routes of monolignol biosynthesis
in maize.
Supplemental Table S1. Cell wall gene catalog of MAIZEWALL.
Supplemental Table S2. Most highly expressed genes in young plants.
Supplemental Table S3. Most highly expressed genes in stems.
Supplemental Table S4. Statistical analysis of macroarray data.
ACKNOWLEDGMENTS
We sincerely thank Edouard Pesquet for his invaluable help in the initial
phases of database construction and macroarray analysis. We are also
grateful to Odile Barbier for technical support, Brigitte Pollet for thioacidol-
ysis analysis, and Dominique Denoue for growing maize plants. We thank
Mickael Bosio and Jean-Pierre Martinant (Biogemma, Clermont-Ferrand) for
fruitful discussions and David Rouquie (Rhobio, Evry) for providing some of
the EST sequences. Laurent Decousset (Biogemma, Clermont-Ferrand) pro-
vided us with all of the plasmids. For macroarray spotting, we acknowledge
Nathalie Ladouce (Genopole, Toulouse). And, finally, we would like to thank
Alain Michel Boudet for a critical review of the manuscript, and Christophe
Pineau and Philippe Ranocha for helping with database design.
Received July 7, 2006; accepted November 3, 2006; published November 10,
2006.
LITERATURE CITED
Abdulrazzak N, Pollet B, Ehlting J, Larsen K, Asnaghi C, Ronseau S,
Proux C, Erhardt M, Seltzer V, Renou JP, et al (2006) A coumaroyl-ester-
3-hydroxylase insertion mutant reveals the existence of nonredundant
meta-hydroxylation pathways and essential roles for phenolic precur-
sors in cell expansion and plant growth. Plant Physiol 140: 30–48
Altschul SF, Madden TL, Schaeffer AA, Zhang J, Zhang Z, Miller W,
Lipman DJ (1997) Gapped BLAST and PSI-BLAST: a new generation of
protein database search programs. Nucleic Acids Res 25: 3389–3402
Andjelkovic V, Thompson R (2006) Changes in gene expression in
maize kernel in response to water and salt stress. Plant Cell Rep 25:
71–79
Appenzeller L, Doblin M, Barreiro R, Wang H, Niu X, Kollipara K (2004)
Cellulose synthesis in maize: isolation and expression analysis of the
cellulose synthase (CesA) gene family. Cellulose 11: 287–299
Arpat AB, Waugh M, Sullivan JP, Gonzales M, Frisch D, Main D, Wood T,
Leslie A, Wing RA, Wilkins TA (2004) Functional genomics of cell
elongation in developing cotton fibers. Plant Mol Biol 54: 911–929
Barriere Y, Guillet C, Goffner D, Pichon M (2003) Genetic variation and
breeding strategies for improved cell wall digestibility in annual forage
crops. Anim Res 52: 193–228
Bendtsen JD, Nielsen H, von Heijne G, Brunak S (2004) Improved
prediction of signal peptides: SignalP 3.0. J Mol Biol 340: 783–795
Bestwick CS, Bennett MH, Mansfield JW (1995) Hrp mutant of Pseudo-
monas syringae pv phaseolicola induces cell wall alterations but not
membrane damage leading to the hypersensitive reaction in lettuce.
Plant Physiol 108: 503–516
Bleecker T, Carpita N, Koch K, McCann M, McCarty D, Patterson S,
Reiter W-D, Staiger C, Thomas S, Vermerris W (2004) Identification of
cell-wall-mutants of maize and Arabidopsis by Fourier transform mid-
range and near infrared spectroscopies (poster no. 848). In Plant and
Animal Genomes XII Conference, January 10–14, San Diego, CA
Boudet AM, Kajita S, Grima-Pettenati J, Goffner D (2003) Lignins and
lignocellulosics: a better control of synthesis for new and improved
uses. Trends Plant Sci 8: 576–581
Bradley DJ, Kjellbom P, Lamb CJ (1992) Elicitor- and wound-induced
oxidative cross-linking of a proline-rich plant cell wall protein: a novel,
rapid defense response. Cell 70: 21–30
Brendel V, Kurtz S, Walbot V (2002) Comparative genomics of Arabidopsis
and maize: prospects and limitations. Genome Biol 3: 14
Capellades M, Torres MA, Bastisch I, Stiefel V, Vignols F, Bruce WB,
Peterson D, Puigdomenech P, Rigau J (1996) The maize caffeic acid
O-methyltransferase gene promoter is active in transgenic tobacco
and maize plant tissues. Plant Mol Biol 31: 307–322
Carpita NC (1996) Structure and biogenesis of the cell walls of grasses.
Annu Rev Plant Physiol Plant Mol Biol 47: 445–476
Carpita NC, Gibeaut DM (1993) Structural models of primary cell walls in
flowering plants: consistency of molecular structure with the physical
properties of the walls during growth. Plant J 3: 1–30
Casati P, Walbot V (2004) Rapid transcriptome responses of maize (Zea
mays) to UV-B in irradiated and shielded tissues. Genome Biol 5: 1
Civardi L, Rigau J, Puigdomenech P (1999) Nucleotide sequence of two
cDNAs coding for caffeoyl-coenzyme A O-methyltransferase (CCoAOMT)
and study of their expression in Zea mays. Plant Physiol 120: 1026–1113
Cell Wall Genomics in Maize
Plant Physiol. Vol. 143, 2007 361 www.plantphysiol.orgon June 13, 2018 - Published by Downloaded from
Copyright © 2007 American Society of Plant Biologists. All rights reserved.

Collazo P, Montoliu L, Puigdomenech P, Rigau J (1992) Structure and
expression of the lignin O-methyltransferase gene from Zea mays L.
Plant Mol Biol 20: 857–867
Corpet F (1988) Multiple sequence alignment with hierarchical clustering.
Nucleic Acids Res 16: 10881–10890
Corpet F, Gouzy J, Kahn D (1998) The ProDom database of protein domain
families. Nucleic Acids Res 26: 323–326
Costa MA, Bedgar DL, Moinuddin SG, Kim KW, Cardenas CL, Cochrane
FC, Shockey JM, Helms GL, Amakura Y, Takahashi H, et al (2005)
Characterization in vitro and in vivo of the putative multigene
4-coumarate:CoA ligase network in Arabidopsis: syringyl lignin and
sinapate/sinapyl alcohol derivative formation. Phytochemistry 66:
2072–2091
Demura T, Tashiro G, Horiguchi G, Kishimoto N, Kubo M, Matsuoka N,
Minami A, Nagata-Hiwatashi M, Nakamura K, Okamura Y, et al (2002)
Visualization by comprehensive microarray analysis of gene expression
programs during transdifferentiation of mesophyll cells into xylem
cells. Proc Natl Acad Sci USA 99: 15794–15799
Donaldson LA (2001) Lignification and lignin topochemistry—an ultra-
structural view. Phytochemistry 57: 859–873
Emanuelsson O, Nielsen H, Brunak S, von Heijne G (2000) Predicting
subcellular localization of proteins based on their N-terminal amino
acid sequence. J Mol Biol 300: 1005–1016
Finn RD, Mistry J, Schuster-Bockler B, Griffiths-Jones S, Hollich V,
Lassmann T, Moxon S, Marshall M, Khanna A, Durbin R, et al (2006)
Pfam: clans, web tools and services. Nucleic Acids Res 34: D247–D251
Franke R, Humphreys JM, Hemm MR, Denault JW, Ruegger MO,
Cusumano JC, Chapple C (2002) The Arabidopsis REF8 gene encodes
the 3-hydroxylase of phenylpropanoid metabolism. Plant J 30: 33–45
Franke R, McMichael CM, Meyer K, Shirley AM, Cusumano JC,
Chapple C (2000) Modified lignin in tobacco and poplar plants over-
expressing the Arabidopsis gene encoding ferulate 5-hydroxylase. Plant J 22:
223–234
Girke T, Lauricha J, Tran H, Keegstra K, Raikhel N (2004) The Cell
Wall Navigator database. A systems-based approach to organism-
unrestricted mining of protein families involved in cell wall metabo-
lism. Plant Physiol 136: 3003–3008
Goicoechea M, Lacombe E, Legay S, Mihaljevic S, Rech P, Jauneau A,
Lapierre C, Pollet B, Verhaegen D, Chaubet-Gigot N, et al (2005)
EgMYB2, a new transcriptional activator from Eucalyptus xylem, reg-
ulates secondary cell wall formation and lignin biosynthesis. Plant J 43:
553–567
Guillet-Claude C, Birolleau-Touchard C, Manicacci D, Rogowsky PM,
Rigau J, Murigneux A, Martinant JP, Barriere Y (2004) Nucleotide
diversity of the ZmPox3 maize peroxidase gene: relationships between a
MITE insertion in exon 2 and variation in forage maize digestibility.
BMC Genet 5: 19
Halpin C, Holt K, Chojecki J, Oliver D, Chabbert B, Monties B, Edwards
K, Barakate A, Foxon GA (1998) Brown-midrib maize (bm1)—a muta-
tion affecting the cinnamyl alcohol dehydrogenase gene. Plant J 14:
545–553
Hamberger B, Hahlbrock K (2004) The 4-coumarate:CoA ligase gene
family in Arabidopsis thaliana comprises one rare, sinapate-activating
and three commonly occurring isoenzymes. Proc Natl Acad Sci USA
101: 2209–2214
Harding SA, Leshkevich J, Chiang VL, Tsai CJ (2002) Differential sub-
strate inhibition couples kinetically distinct 4-coumarate:coenzyme a
ligases with spatially distinct metabolic roles in quaking aspen. Plant
Physiol 128: 428–438
He X, Hall MB, Gallo-Meagher M, Smith RL (2003) Improvement of forage
quality by down regulation of maize O-methyltransferase. Crop Sci 43:
2240–2251
Henrissat B, Coutinho PM, Davies GJ (2001) A census of carbohydrate-
active enzymes in the genome of Arabidopsis thaliana. Plant Mol Biol 47:
55–72
Hertzberg M, Aspeborg H, Schrader J, Andersson A, Erlandsson R,
Blomqvist K, Bhalerao R, Uhlen M, Teeri TT, Lundeberg J, et al (2001)
A transcriptional roadmap to wood formation. Proc Natl Acad Sci USA
98: 14732–14737
Hoffmann L, Maury S, Martz F, Geoffroy P, Legrand M (2003) Purification,
cloning, and properties of an acyltransferase controlling shikimate and
quinate ester intermediates in phenylpropanoid metabolism. J Biol
Chem 278: 95–103
Holland N, Holland D, Helentjaris T, Dhugga KS, Xoconostle-Cazares B,
Delmer DP (2000) A comparative analysis of the plant cellulose syn-
thase (CesA) gene family. Plant Physiol 123: 1313–1324
Hu WJ, Kawaoka A, Tsai CJ, Lung J, Osakabe K, Ebinuma H, Chiang VL
(1998) Compartmentalized expression of two structurally and function-
ally distinct 4-coumarate:CoA ligase genes in aspen (Populus tremu-
loides). Proc Natl Acad Sci USA 95: 5407–5412
Humphreys JM, Hemm MR, Chapple C (1999) New routes for lignin
biosynthesis defined by biochemical characterization of recombinant
ferulate 5-hydroxylase, a multifunctional cytochrome P450-dependent
monooxygenase. Proc Natl Acad Sci USA 96: 10045–10050
Jamet E, Canut H, Boudart G, Pont-Lezica RF (2006) Cell wall proteins: a
new insight through proteomics. Trends Plant Sci 11: 33–39
Karpinska B, Karlsson M, Srivastava M, Stenberg A, Schrader J, Sterky F,
Bhalerao R, Wingsle G (2004) MYB transcription factors are differen-
tially expressed and regulated during secondary vascular tissue devel-
opment in hybrid aspen. Plant Mol Biol 56: 255–270
Knox JP, Linstead PJ, King J, Cooper C, Roberts K (1990) Pectin esterifi-
cation is spatially regulated both within cell walls and between devel-
oping tissues of root apices. Planta 181: 512–521
Krogh A, Larsson B, von Heijne G, Sonnhammer EL (2001) Predicting
transmembrane protein topology with a hidden Markov model: appli-
cation to complete genomes. J Mol Biol 305: 567–580
Lapierre C (1993). Application of new methods for investigation of lignin
structure. In HG Jung, DR Buxton, RD Hatfield, J Ralph, eds, Forage Cell
Wall Structure and Digestibility. American Society of Agriculture,
Madison, WI, pp 133–166
Lapierre C, Monties B, Rolando C (1986) Thioacidolysis of poplar lignins:
identification of monomeric syringyl products and characterization of
guaiacyl-syringyl lignin fractions. Holzforschung 40: 113–118
Li L, Cheng XF, Leshkevich J, Umezawa T, Harding SA, Chiang VL (2001)
The last step of syringyl monolignol biosynthesis in angiosperms is
regulated by a novel gene encoding sinapyl alcohol dehydrogenase.
Plant Cell 13: 1567–1586
Mechin V, Argillier O, Rocher F, Hebert Y, Mila I, Pollet B, Barriere Y,
Lapierre C (2005) In search of a maize ideotype for cell wall enzymatic
degradability using histological and biochemical lignin characteriza-
tion. J Agric Food Chem 53: 5872–5881
Meijer AH, Lopes Cardoso MI, Voskuilen JT, de Waal A, Verpoorte R,
Hoge JH (1993) Isolation and characterization of a cDNA clone from
Catharanthus roseus encoding NADPH:cytochrome P-450 reductase, an
enzyme essential for reactions catalysed by cytochrome P-450 monooxy-
genases in plants. Plant J 4: 47–60
Meyer K, Shirley AM, Cusumano JC, Bell-Lelong DA, Chapple C (1998)
Lignin monomer composition is determined by the expression of a
cytochrome P450-dependent monooxygenase in Arabidopsis. Proc Natl
Acad Sci USA 95: 6619–6623
Milioni D, Sado PE, Stacey NJ, Roberts K, McCann MC (2002) Early gene
expression associated with the commitment and differentiation of a
plant tracheary element is revealed by cDNA-amplified fragment length
polymorphism analysis. Plant Cell 14: 2813–2824
Mitchell HJ, Hall SA, Stratford R, Hall JL, Barber MS (1999) Differential
induction of cinnamyl alcohol dehydrogenase during defensive lignifi-
cation in wheat (Triticum aestivum L.): characterisation of the major
inducible form. Planta 208: 31–37
Mizutani M, Ohta D, Sato R (1997) Isolation of a cDNA and a genomic
clone encoding cinnamate 4-hydroxylase from Arabidopsis and its
expression manner in planta. Plant Physiol 113: 755–763
Moreau C, Aksenov N, Lorenzo MG, Segerman B, Funk C, Nilsson P,
Jansson S, Tuominen H (2005) A genomic approach to investigate
developmental cell death in woody tissues of Populus trees. Genome
Biol 6: 22
Morgenstern B (1999) DIALIGN 2: improvement of the segment-to-segment
approach to multiple sequence alignment. Bioinformatics 3: 211–218
Nakai K, Horton P (1999) PSORT: a program for detecting sorting signals in
proteins and predicting their subcellular localization. Trends Biochem
Sci 24: 34–36
Nakano J, Meshitsuka G (1992) The detection of lignin. In CW Dence, SY Lin,
eds, Methods in Lignin Chemistry. Springer-Verlag, New York, pp 23–61
Osakabe K, Tsao CC, Li L, Popko JL, Umezawa T, Carraway DT, Smeltzer
RH, Joshi CP, Chiang VL (1999) Coniferyl aldehyde 5-hydroxylation
and methylation direct syringyl lignin biosynthesis in angiosperms.
Proc Natl Acad Sci USA 96: 8955–8960
Guillaumie et al.
362 Plant Physiol. Vol. 143, 2007 www.plantphysiol.orgon June 13, 2018 - Published by Downloaded from
Copyright © 2007 American Society of Plant Biologists. All rights reserved.
Otte O, Barz W (2000) Characterization and oxidative in vitro cross-linking
of an extensin-like protein and a proline-rich protein purified from
chickpea cell walls. Phytochemistry 53: 1–5
Parvathi K, Chen F, Guo D, Blount JW, Dixon RA (2001) Substrate
preferences of O-methyltransferases in alfalfa suggest new pathways
for 3-O-methylation of monolignols. Plant J 25: 193–202
Pavy N, Laroche J, Bousquet J, Mackay J (2005) Large-scale statistical
analysis of secondary xylem ESTs in pine. Plant Mol Biol 57: 203–224
Pesquet E, Ranocha P, Legay S, Digonnet C, Barbier O, Pichon M, Goffner
D (2005) Novel markers of xylogenesis in zinnia are differentially
regulated by auxin and cytokinin. Plant Physiol 139: 1821–1839
Pichon M, Courbou I, Beckert M, Boudet AM, Grima-Pettenati J (1998)
Cloning and characterization of two maize cDNAs encoding cinnamoyl-
CoA reductase (CCR) and differential expression of the corresponding
genes. Plant Mol Biol 38: 671–676
Pincxon G, Maury S, Hoffmann L, Geoffroy P, Lapierre C, Pollet B,
Legrand M (2001) Repression of O-methyltransferase genes in transgenic
tobacco affects lignin synthesis and plant growth. Phytochemistry 57:
1167–1176
Piquemal J, Chamayou S, Nadaud I, Beckert M, Barriere Y, Mila I,
Lapierre C, Rigau J, Puigdomenech P, Jauneau A, et al (2002) Down-
regulation of caffeic acid O-methyltransferase in maize revisited using a
transgenic approach. Plant Physiol 130: 1675–1685
Poroyko V, Hejlek LG, Spollen WG, Springer GK, Nguyen HT, Sharp RE,
Bohnert HJ (2005) The maize root transcriptome by serial analysis of
gene expression. Plant Physiol 138: 1700–1710
Puigdomenech PC, Perez P, Murigneux A, Martinant JP, Tixier MH, Rigau
J, Civardi L, Maes T, inventors. August 2, 2001. Identifying genes
associated with a qtl corn digestibility locus. Patent WO 0155395-A 1,3
Raes J, Rohde A, Christensen JH, Van de Peer Y, Boerjan W (2003)
Genome-wide characterization of the lignification toolbox in Arabidop-
sis. Plant Physiol 133: 1051–1071
Ragueh F, Lescure N, Roby D, Marco Y (1989) Gene expression in Nicotiana
tabacum in response to compatible and incompatible isolates of Pseudo-
monas solonacearum. Physiol Mol Plant Pathol 35: 23–33
Rice P, Longden I, Bleasby A (2000) EMBOSS: the European Molecular
Biology Open Software Suite. Trends Genet 16: 276–277
Rodriguez-Galvez E, Mendgen K (1995) Cell wall synthesis in cotton roots
after infection with Fusarium oxysporum. The deposition of callose,
arabinogalactans, xyloglucans, and pectic components into walls, wall
appositions, cell plates and plasmodesmata. Planta 197: 535–545
Rosler J, Krekel F, Amrhein N, Schmid J (1997) Maize phenylalanine ammonia-
lyase has tyrosine ammonia-lyase activity. Plant Physiol 113: 175–179
Rozen S, Skaletsky H (2000) Primer3 on the WWW for general users and
for biologist programmers. Methods Mol Biol 132: 365–386
Ruegger M, Meyer K, Cusumano JC, Chapple C (1999) Regulation of
ferulate-5-hydroxylase expression in Arabidopsis in the context of
sinapate ester biosynthesis. Plant Physiol 119: 101–110
Samson D, Legeai F, Karsenty E, Reboux S, Veyrieras JB, Just J, Barillot E
(2003) GenoPlanteInfo (GPI): a collection of databases and bioinformat-
ics resources for plant genomics. Nucleic Acids Res 31: 179–182
Scarpella E, Meijer AH (2004) Pattern formation in the vascular system of
monocot and dicot plant species. New Phytol 164: 209–242
Schoch G, Goepfert S, Morant M, Hehn A, Meyer D, Ullmann P,
Werck-Reichhart D (2001) CYP98A3 from Arabidopsis thaliana is a
3#-hydroxylase of phenolic esters, a missing link in the phenylpropa-
noid pathway. J Biol Chem 276: 36566–36574
Schoof H, Zaccaria P, Gundlach H, Lemcke K, Rudd S, Kolesov G, Arnold
R, Mewes HW, Mayer KF (2002) MIPS Arabidopsis thaliana Database
(MAtDB): an integrated biological knowledge resource based on the first
complete plant genome. Nucleic Acids Res 30: 91–93
Schultz J, Copley RR, Doerks T, Ponting CP, Bork P (2000) SMART: a web-
based tool for the study of genetically mobile domains. Nucleic Acids
Res 28: 231–234
Schwacke R, Schneider A, van der Graaff E, Fischer K, Catoni E,
Desimone M, Frommer WB, Flugge UI, Kunze R (2003) ARAMEM-
NON, a novel database for Arabidopsis integral membrane proteins.
Plant Physiol 131: 16–26
Scobbie L, Russel W, Provan GJ, Chesson A (1993) The newly extended
maize internode, a model for the study of secondary cell wall formation
and consequences for digestibility. J Sci Food Agric 61: 217–225
Sibout R, Eudes A, Mouille G, Pollet B, Lapierre C, Jouanin L, Seguin A
(2005) CINNAMYL ALCOHOL DEHYDROGENASE-C and -D are the
primary genes involved in lignin biosynthesis in the floral stem of
Arabidopsis. Plant Cell 17: 2059–2076
Sigrist CJ, Cerutti L, Hulo N, Gattiker A, Falquet L, Pagni M, Bairoch A,
Bucher P (2002) PROSITE: a documented database using patterns and
profiles as motif descriptors. Brief Bioinform 3: 265–274
Small I, Peeters N, Legeai F, Lurin C (2004) Predotar: A tool for rapidly
screening proteomes for N-terminal targeting sequences. Proteomics 4:
1581–1590
Taylor NG, Scheible WR, Cutler S, Somerville CR, Turner SR (1999) The
irregular xylem3 locus of Arabidopsis encodes a cellulose synthase
required for secondary cell wall synthesis. Plant Cell 11: 769–780
Thompson JD, Higgins DG, Gibson TJ (1994) CLUSTALW: improving the
sensitivity of progressive multiple sequence alignment through se-
quence weighting, position-specific gap penalties and weight matrix
choice. Nucleic Acids Res 22: 4673–4680
Vignols F, Rigau J, Torres MA, Capellades M, Puigdomenech P (1995) The
brown midrib3 (bm3) mutation in maize occurs in the gene encoding
caffeic acid O-methyltransferase. Plant Cell 7: 407–416
Wu Y, Sharp RE, Durachko DM, Cosgrove DJ (1996) Growth maintenance
of the maize primary root at low water potentials involves increases in
cell-wall extension properties, expansin activity, and wall susceptibility
to expansins. Plant Physiol 111: 765–772
Wu Y, Spollen WG, Sharp RE, Hetherington PR, Fry SC (1994) Root
growth maintenance at low water potentials (increased activity of
xyloglucan endotransglycosylase and its possible regulation by abscisic
acid). Plant Physiol 106: 607–615
Yokoyama R, Nishitani K (2004) Genomic basis for cell-wall diversity in
plants. A comparative approach to gene families in rice and Arabidop-
sis. Plant Cell Physiol 45: 1111–1121
Zeier J, Ruel K, Ryser U, Schreiber L (1999) Chemical analysis and
immunolocalisation of lignin and suberin in endodermal and hypoder-
mal/rhizodermal cell walls of developing maize (Zea mays L.) primary
roots. Planta 209: 1–12
Zhao C, Craig JC, Petzold HE, Dickerman AW, Beers EP (2005) The xylem
and phloem transcriptomes from secondary tissues of the Arabidopsis
root-hypocotyl. Plant Physiol 138: 803–818
Zhong R, Iii WH, Negrel J, Ye ZH (1998) Dual methylation pathways in
lignin biosynthesis. Plant Cell 10: 2033–2046
Zhu J, Chen S, Alvarez S, Asirvatham VS, Schachtman DP, Wu Y, Sharp
RE (2006) Cell wall proteome in the maize primary root elongation zone.
I. Extraction and identification of water-soluble and lightly ionically
bound proteins. Plant Physiol 140: 311–325
Zhu Q, Dabi T, Beeche A, Yamamoto R, Lawton MA, Lamb C (1995)
Cloning and properties of a rice gene encoding phenylalanine ammonia-
lyase. Plant Mol Biol 29: 535–550
Cell Wall Genomics in Maize
Plant Physiol. Vol. 143, 2007 363 www.plantphysiol.orgon June 13, 2018 - Published by Downloaded from
Copyright © 2007 American Society of Plant Biologists. All rights reserved.


![A Developmental Switch of Gene Expression in the Barley ...oa.upm.es/46343/1/INVE_MEM_2016_255898.pdf · A Developmental Switch of Gene Expression in the Barley ... DDL[SA]DID[HQ]LLDFAS](https://static.fdocuments.us/doc/165x107/5ad10abb7f8b9ae2138e67ab/a-developmental-switch-of-gene-expression-in-the-barley-oaupmes463431invemem2016.jpg)


![Advances in Developmental Biology and Biochem [Vol 13 - Murine Homeobox Gene Ctl] - T. Lufkin (Elsevier, 2003) WW](https://static.fdocuments.us/doc/165x107/613caa579cc893456e1e9702/advances-in-developmental-biology-and-biochem-vol-13-murine-homeobox-gene-ctl.jpg)