MAINTAINING USER DEFINED QOS IN PROPOSED MB · PDF fileIJRRAS 9 (1) October 2011 25...
20
IJRRAS 9 (1) ● October 2011 www.arpapress.com/Volumes/Vol9Issue1/IJRRAS_9_1_04.pdf 25 MAINTAINING USER DEFINED QOS IN PROPOSED MB OFDM COGNITIVE RADIO SYSTEM USING POWER CONTROL AND CHANNEL CAPACITY ANALYSIS AS DESIGN TOOLS FOR SUBCARRIER SELECTION Andre Mayers & G.V.S Raju Dept. of Electrical and Computer Engineering, The University of Texas, San Antonio, Texas 78249 Email: [email protected], [email protected] ABSTRACT The objective of this paper is to study various methods of maintaining user defined Quality of Service (QoS) in a wireless Cognitive Radio (CR) System. The agility of CRs can be used to make adjustments to Bit Error Rate (BER), Bit Rate (BR) and transmit Power Spectral Density (PSD). We present a modified channel capacity analytic formula, methods for a power control algorithm, and methods for decision making on spectrum allocation. We show how parameters such as BER, Signal to Interference Noise Ratio (SINR) thresholds, and analysis and design based on our modified channel capacity formula can be subtly manipulated to affect QoS. The power control algorithm is part of a system that maintains user defined BER and BR in the presence of external user interference. This system is a design tool with which to achieve predictable and consistent QoS. Keywords: Power Control, Cognitive Radio, QoS, MB-OFDM. 1. INTRODUCTION A Personal Area Network (PAN) is a human centered network that connects personal communication devices within a very limited distance (usually less than 20 metres) [1][2]. PANs may consist of devices in an office environment, such as printers, computers, mobile and non-mobile phones. PANs may also form in the home environment and comprise mobile phones, TVs, speakers, DVD players, game consoles, routers, and cable or satellite set top boxes [3]. PANs may also form transitorily in mobile situations such as between five mobile phones and a laptop. Our vision is of tetherless home and office environments. The wireless devices in these environments form PANs which are controlled by a leader or manager. The leader is responsive to the ingress and egress of devices and to time varying channel conditions. The leader also promotes efficient communication by controlling the medium access of member devices. This paper addresses a leader-less environment in which devices are responsible for medium access. This is important because in the absence of a leader, devices must perform efficiently and independently. In addition, the concepts presented in this paper is the foundation upon which our PAN is built. The individual devices can be referred to as Personal Area Devices (PADs) and they each have different requirements in terms of Bit Rate (BR) and acceptable Bit Error Rate (BER). We will henceforth refer to those requirements as user defined Quality of Service (QoS). We introduce a system (see Figure 4) which is used by each device to maintain its user defined QoS, regardless of channel conditions and without external management. This system consists of the combined operation of algorithms and methods which control transmit power, selective bit allocation, the use of underlay and overlay techniques, variable modulation and channel ranking. The channels are ranked using a new approach to calculating channel capacity. In order for this system to be viable, each device needs to be able to sense channel conditions and respond accordingly. The radios in the PAN therefore need to be Cognitive Radios (CRs). We define CRs as wireless devices that have hardware and software that can be reconfigured to respond to changing channel conditions [4]. CRs can perform functions such as those listed below [5]: Spectrum sensing: find used and unused spectrum and give feedback on channel condition. Dynamic spectrum management: make use of the best available spectrum in order to meet QoS needs. Spectrum sharing: Spectrum should be allocated in order to meet the QoS needs of all applications and devices. As we seek to optimize spectrum usage by leveraging the abilities of the CR, we need to be able to guarantee QoS in the presence of incumbent users of the spectrum. It is important that the devices operate efficiently in environments where medium access is competitive. In section 2 we present basic concepts and related work.
-
Upload
truongdang -
Category
Documents
-
view
216 -
download
1
Transcript of MAINTAINING USER DEFINED QOS IN PROPOSED MB · PDF fileIJRRAS 9 (1) October 2011 25...
IJRRAS 9 (1) ● October 2011 www.arpapress.com/Volumes/Vol9Issue1/IJRRAS_9_1_04.pdf
25
MAINTAINING USER DEFINED QOS IN PROPOSED MB OFDM
COGNITIVE RADIO SYSTEM USING POWER CONTROL AND
CHANNEL CAPACITY ANALYSIS AS DESIGN TOOLS FOR
SUBCARRIER SELECTION
Andre Mayers & G.V.S Raju
Dept. of Electrical and Computer Engineering, The University of Texas, San Antonio, Texas 78249
Email: [email protected], [email protected]
ABSTRACT
The objective of this paper is to study various methods of maintaining user defined Quality of Service (QoS) in a
wireless Cognitive Radio (CR) System. The agility of CRs can be used to make adjustments to Bit Error Rate
(BER), Bit Rate (BR) and transmit Power Spectral Density (PSD). We present a modified channel capacity analytic
formula, methods for a power control algorithm, and methods for decision making on spectrum allocation. We show
how parameters such as BER, Signal to Interference Noise Ratio (SINR) thresholds, and analysis and design based
on our modified channel capacity formula can be subtly manipulated to affect QoS. The power control algorithm is
part of a system that maintains user defined BER and BR in the presence of external user interference. This system
is a design tool with which to achieve predictable and consistent QoS.
Keywords: Power Control, Cognitive Radio, QoS, MB-OFDM.
1. INTRODUCTION
A Personal Area Network (PAN) is a human centered network that connects personal communication devices within
a very limited distance (usually less than 20 metres) [1][2]. PANs may consist of devices in an office environment,
such as printers, computers, mobile and non-mobile phones. PANs may also form in the home environment and
comprise mobile phones, TVs, speakers, DVD players, game consoles, routers, and cable or satellite set top boxes
[3]. PANs may also form transitorily in mobile situations such as between five mobile phones and a laptop. Our
vision is of tetherless home and office environments. The wireless devices in these environments form PANs which
are controlled by a leader or manager. The leader is responsive to the ingress and egress of devices and to time
varying channel conditions. The leader also promotes efficient communication by controlling the medium access of
member devices. This paper addresses a leader-less environment in which devices are responsible for medium
access. This is important because in the absence of a leader, devices must perform efficiently and independently. In
addition, the concepts presented in this paper is the foundation upon which our PAN is built. The individual devices
can be referred to as Personal Area Devices (PADs) and they each have different requirements in terms of Bit Rate
(BR) and acceptable Bit Error Rate (BER). We will henceforth refer to those requirements as user defined Quality of
Service (QoS).
We introduce a system (see Figure 4) which is used by each device to maintain its user defined QoS, regardless of
channel conditions and without external management. This system consists of the combined operation of algorithms
and methods which control transmit power, selective bit allocation, the use of underlay and overlay techniques,
variable modulation and channel ranking. The channels are ranked using a new approach to calculating channel
capacity.
In order for this system to be viable, each device needs to be able to sense channel conditions and respond
accordingly. The radios in the PAN therefore need to be Cognitive Radios (CRs). We define CRs as wireless devices
that have hardware and software that can be reconfigured to respond to changing channel conditions [4]. CRs can
perform functions such as those listed below [5]:
Spectrum sensing: find used and unused spectrum and give feedback on channel condition.
Dynamic spectrum management: make use of the best available spectrum in order to meet QoS needs.
Spectrum sharing: Spectrum should be allocated in order to meet the QoS needs of all applications and devices.
As we seek to optimize spectrum usage by leveraging the abilities of the CR, we need to be able to guarantee QoS in
the presence of incumbent users of the spectrum. It is important that the devices operate efficiently in environments
where medium access is competitive.
In section 2 we present basic concepts and related work.

IJRRAS 9 (1) ● October 2011 Mayers & Raju ● Maintaining QoS in Cognitive Radio System
26
In section 3 we present the system architecture.
In section 4 we present the Modified Group Channel Capacity (MGCC) analytic formula for MB-OFDM UWB and
the concept of a minimum constraint on the number of consecutive subcarriers used to transmit an underlay signal.
In section 5 we present methods for allocating PSD to symbols transmitted using underlay.
In section 6 we present the power control algorithm and its components.
In section 7 we detail the simulation parameters.
In section 8 we present results and analysis.
2. PREVIOUS AND RELATED WORK
2.1. MB OFDM UWB
There are different implementations of UWB, one of which is defined by the Multiband Orthogonal Frequency
Division Multiplexing Ultra-wideband (MB OFDM UWB) standard. MB-OFDM UWB defines a system of 14
bands, each 528 Mhz in size. There are four groups of three bands and one group of two for a total of five channels.
Each band is sub-divided into 128 OFDM Subcarriers (SCs) with designated pilot, guard and null subcarriers. Each
subcarrier has a bandwidth of 4.125 MHz.
The inclusion of OFDM brings its legacy of positives to the table. One example is the ability to turn subcarriers on
or off by notch insertion [6]. Other advantages include lower maximum transmission power for lower data rate
multiuser systems [7] and resistance to multipath. A very important aspect of OFDM is the built in division of
spectrum [8]. To facilitate ease of implementation of the CR aspect of our system we require spectrum
segmentation. User noise and signal power spectral density can be calculated over fixed, finite bandwidth intervals.
2.2. Underlay and Overlay
To achieve Interference Avoidance (IA) we make use of underlay and overlay techniques. The spectrum is scanned,
Power Spectral Density (PSD) measured and subcarriers are determined to have been used or unused. SCs 1 and 3 in
Figure 1 are examples of unused spectrum. Unused spectrum describes some predefined bandwidth, in our case, an
OFDM subcarrier, without incumbent user PSD. In this paper we refer to incumbent user PSD as interference.
Overlay describes transmission in unused spectrum by opportunistic users (see Figure 2) [9]. In underlay, the signal
is spread over a wide bandwidth with low PSD and thus causes minimum interference (see Figure 1) to Incumbent
Users (ICU). For pertinent FCC regulations, see [10].
Figure 2. Overlay Subcarrier Allocation
Figure 1. Underlay Subcarrier Allocation

IJRRAS 9 (1) ● October 2011 Mayers & Raju ● Maintaining QoS in Cognitive Radio System
27
Figure 3 illustrates the concepts of incumbent users, unused and underused spectrum. Underlay makes use of
underused spectrum. Underused spectrum is spectrum in which the PSD of the incumbent user is less than the PSD
Limit for the subcarrier. The PSD Limit is the maximum PSD allowed for a given spectral region. In this example
we assume each subcarrier has the same PSD Limit. A device sensing an incumbent user with PSD x, can transmit at
maximum PSD y, where y = PSD Limit - x. This case applies to underlay signals. Overlay signals can transmit at, or,
below the PSD Limit.
2.3. Channel Capacity Analytic Formula
Table 1 contains some of the symbols and definitions used in this section. Shannon‟s capacity formula is used as the
basis for Wu et. al’s MB OFDM capacity formula in which the transmitted power spectral density in the region is
determined by the spectrum usage [9]. Their channel capacity formula is stated in (1). The transmit PSD in an
overlay subcarrier is represented by 1k kCR uW while underlay is represented by
2i iCR pW .
1 2
1 1
0
1
log 1k k i i
i i
N M
CR u CR p
k iSDCR M
p p
i
W W
C W
n W W
(1)
The system proposers also imposed the constraints in (2) to maximize overall channel capacity while minimizing
mutual interference between CR and other users.
Table 1. Symbols and Definitions for Channel Capacity Analytic Formula.
Symbol Definition
iI Interference tolerance level in the ith used subcarrier.
0n AWGN.
N Total number of unused subcarriers in a bandwidth W.
M Total number of incumbent users in bandwidth W.
max Maximum total transmit power permitted for cognitive users in W.
k Maximum transmitted PSD allowed in kth unused subcarrier.
1kCR
CR transmitted PSD in kth unused subcarrier.
2iCR
CR transmitted PSD in ith underused subcarrier.
ip PSD of ith incumbent user.
W Total bandwidth.
kuW
Bandwidth of the kth unused subcarrier.
ipW Bandwidth of ith incumbent user.
Figure 3. PSD Limit
IJRRAS 9 (1) ● October 2011 Mayers & Raju ● Maintaining QoS in Cognitive Radio System
28
2
1
1 2 max
1 1
,
,
i
k
k k i i
CR i i
CR k k
N M
CR u CR p
k i
I
W W
(2)
3. SYSTEM ARCHITECTURE
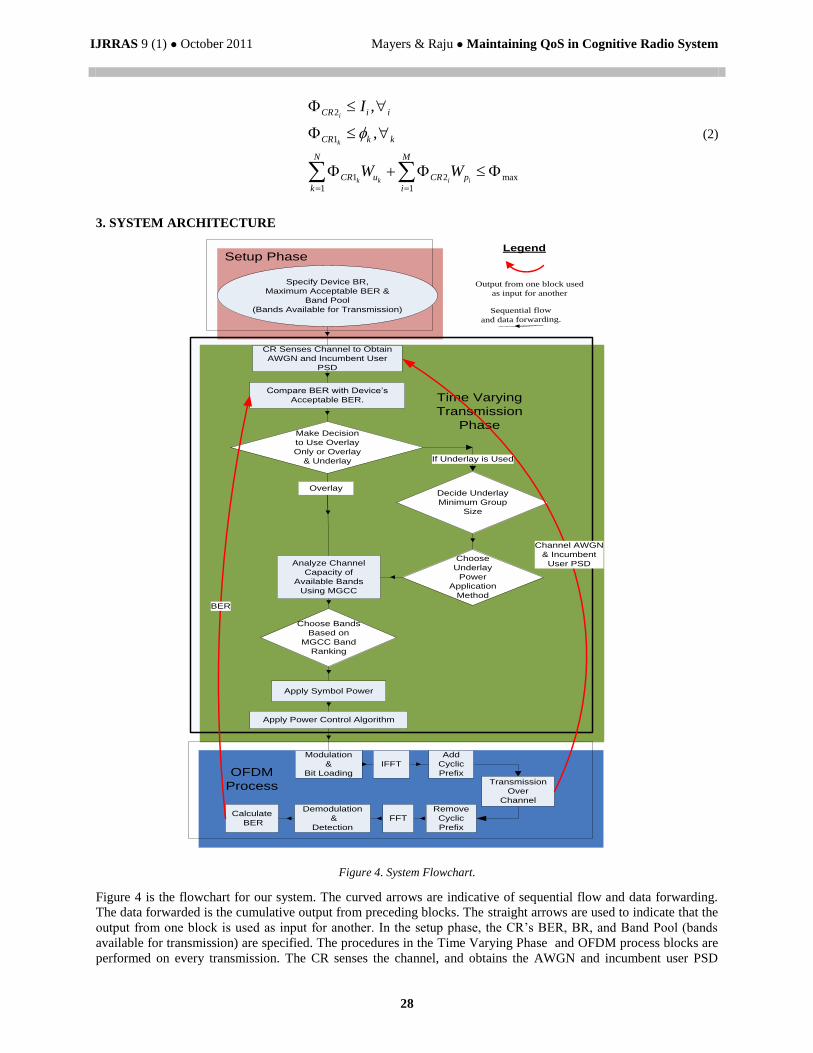
Figure 4 is the flowchart for our system. The curved arrows are indicative of sequential flow and data forwarding.
The data forwarded is the cumulative output from preceding blocks. The straight arrows are used to indicate that the
output from one block is used as input for another. In the setup phase, the CR‟s BER, BR, and Band Pool (bands
available for transmission) are specified. The procedures in the Time Varying Phase and OFDM process blocks are
performed on every transmission. The CR senses the channel, and obtains the AWGN and incumbent user PSD
Figure 4. System Flowchart.
CR Senses Channel to Obtain
AWGN and Incumbent User
PSD
Compare BER with Device’s
Acceptable BER.
Analyze Channel
Capacity of
Available Bands
Using MGCC
Specify Device BR,
Maximum Acceptable BER &
Band Pool
(Bands Available for Transmission)
Setup Phase
Time Varying
Transmission
Phase
If Underlay is Used
Make Decision
to Use Overlay
Only or Overlay
& Underlay
OFDM
Process
Modulation
&
Bit Loading
IFFT
Add
Cyclic
PrefixTransmission
Over
ChannelRemove
Cyclic
Prefix
FFT
Demodulation
&
Detection
Calculate
BER
Apply Power Control Algorithm
Apply Symbol Power
Choose
Underlay
Power
Application
Method
Decide Underlay
Minimum Group
Size
Choose Bands
Based on
MGCC Band
Ranking
Sequential flow
and data forwarding.
Output from one block used
as input for another
Channel AWGN
& Incumbent
User PSD
BER
Overlay
Legend

IJRRAS 9 (1) ● October 2011 Mayers & Raju ● Maintaining QoS in Cognitive Radio System
29
profile for the bands in the Band Pool. BER feedback measured from previous transmissions is compared to the
maximum allowable BER. The result of the comparison, BER, and the Band Pool are used as input to decide
whether to use overlay only, or to include underlay. If underlay is used, underlay group size and power application
methods are chosen and used as input to the channel capacity analysis module. Other input to this module are the
maximum acceptable BER (BER threshold), and the Band Pool. BER threshold is used to calculate minimum
acceptable Signal to Interference Noise Ratio (SINR). SINR includes the interference provided by incumbent users
in addition to AWGN. Channel capacity analysis is then performed on each band individually. The bands are ranked
and selected using this analysis. Power is then allocated to the symbols and the power control module is then
applied. This module makes critical adjustments to maintain balance between acceptable BER, desired BR and
minimum transmit PSD.
After the operations above are performed, regular OFDM process is resumed. Each subcarrier is independently
modulated using Quadrature Phase Shift Keying (QPSK). Information bits are taken two at a time and the symbols
are represented using basis functions 1 2 cos(2 )cf t and
2 2 sin(2 )cf t . fc is the centre frequency
of the subcarrier. There are four symbols which are represented by mt (3).
1 2
2 2cos sinm
m mt E E
M M
(3)
In (3) 1,4m ,E is the energy of the waveform in a subcarrier while M is the total number of symbols in the
modulation scheme. is a variable we use to increase or decrease the amplitude of a symbol in a subcarrier relative
to the amplitude of the last transmission. is equal to 1 on the first transmission. In subsequent transmissions, 0<
2. An IFFT is performed separately on each band, a cyclic prefix is added, and the band symbols are then
transmitted individually. At this point channel sensing occurs and the information is fed to the relevant module in
preparation for the next transmission. On the receiving side of operations, cyclic prefix removal, FFT, and
demodulation are then performed on each band. Bit detection of each symbol is performed, BER is calculated then
fed to the module used for feedback collection.
In communications systems, there are tradeoffs between BER, BR, and transmit PSD. Our system utilizes these
tradeoffs to maintain user defined QoS. System performance is used to cue the selection of the various methods.
Each method offers different benefits. For example, one method might increase BR while increasing BER, another
might reduce BER while increasing PSD. In the following section we introduce and explain the MGCC channel
capacity analytic formula.
4. MODIFIED GROUP CHANNEL CAPACITY ANALYTIC FORMULA (MGCC)
4.1. Introduction to MGCC
In this section, the symbols and definitions from Section 2.3 are used. New symbols are listed in Table 2. In (1) there
are M underused subcarriers. Every underused subcarrier, even the ones with high incumbent user PSD, is included
in Wu et al’s channel capacity analysis. The MGCC analytic formula, (3), is more selective. For example, in Figure
5, subcarrier 3 has relatively high incumbent user PSD and is neighbored by two overlay subcarriers (SCs 2 & 4). If
an underlay symbol is transmitted in subcarrier 3, it has little chance of being correctly detected. In order to increase
SINR, we attempt to reduce noise (and interference) relative to signal power by spreading the symbol over
contiguous underused subcarriers.
Figure 5. Overlay PSD, underlay PSD and subcarrier allocation- initial stage.
IJRRAS 9 (1) ● October 2011 Mayers & Raju ● Maintaining QoS in Cognitive Radio System
30
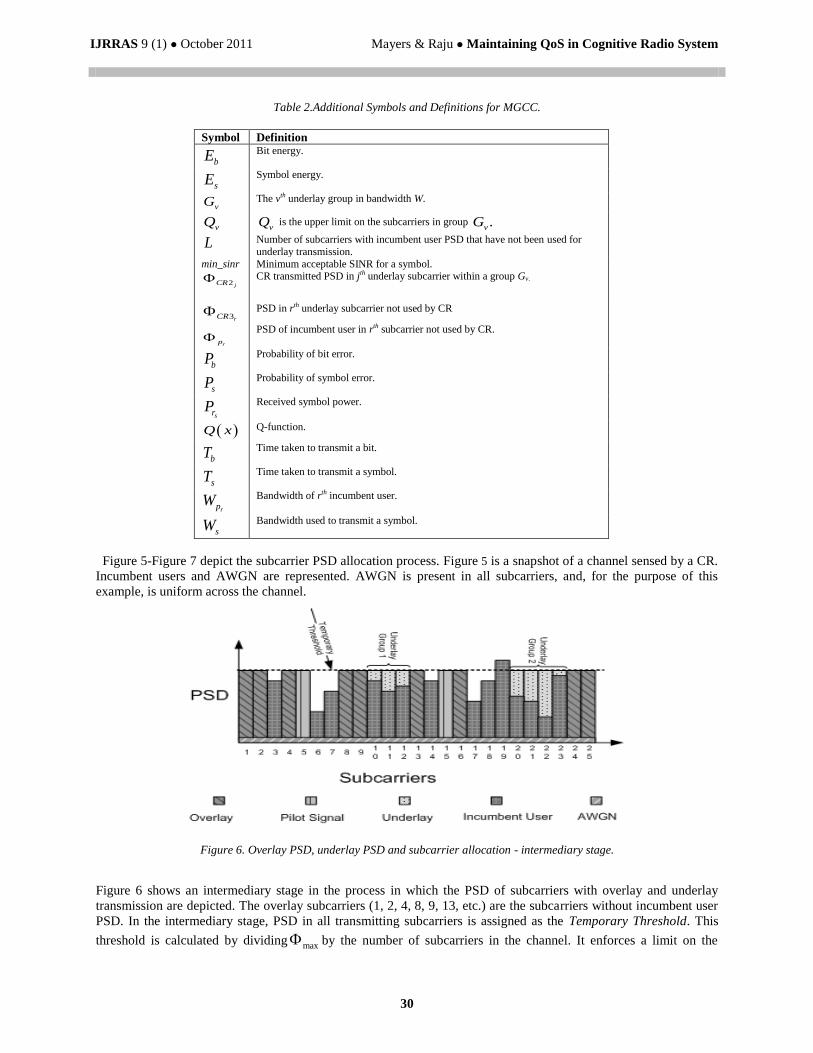
Figure 5-Figure 7 depict the subcarrier PSD allocation process. Figure 5 is a snapshot of a channel sensed by a CR.
Incumbent users and AWGN are represented. AWGN is present in all subcarriers, and, for the purpose of this
example, is uniform across the channel.
Figure 6 shows an intermediary stage in the process in which the PSD of subcarriers with overlay and underlay
transmission are depicted. The overlay subcarriers (1, 2, 4, 8, 9, 13, etc.) are the subcarriers without incumbent user
PSD. In the intermediary stage, PSD in all transmitting subcarriers is assigned as the Temporary Threshold. This
threshold is calculated by dividing max by the number of subcarriers in the channel. It enforces a limit on the
Figure 6. Overlay PSD, underlay PSD and subcarrier allocation - intermediary stage.
Table 2.Additional Symbols and Definitions for MGCC.
Symbol Definition
bE
Bit energy.
sE
Symbol energy.
vG The vth underlay group in bandwidth W.
vQ vQ is the upper limit on the subcarriers in group .vG
L
Number of subcarriers with incumbent user PSD that have not been used for
underlay transmission.
min_sinr Minimum acceptable SINR for a symbol.
2 jCR
CR transmitted PSD in jth underlay subcarrier within a group Gv.
3rCR
PSD in rth underlay subcarrier not used by CR
rp
PSD of incumbent user in rth subcarrier not used by CR.
bP
Probability of bit error.
sP
Probability of symbol error.
srP
Received symbol power.
Q x
Q-function.
bT
Time taken to transmit a bit.
sT
Time taken to transmit a symbol.
rpW
Bandwidth of rth incumbent user.
sW
Bandwidth used to transmit a symbol.

IJRRAS 9 (1) ● October 2011 Mayers & Raju ● Maintaining QoS in Cognitive Radio System
31
cumulative PSD (AWGN, incumbent user, and CR underlay PSD) in any particular subcarrier. It also ensures that
max is not exceeded.
In Figure 6, the minimum group size for underlay subcarriers is three. This means that underlay groups can only be
formed when there are at least three contiguous subcarriers occupied by incumbent users. However, three contiguous
underlay subcarriers do not automatically form a group. Subcarriers 17-19 cannot form an underlay group because
subcarrier 19 exceeds the Temporary Threshold (indicated by the dotted line).
Figure 7 depicts the final stage. The Temporary Threshold is not used in this stage but is left in for comparative
purposes. For example, let 2 be the minimum acceptable SINR. The overlay subcarriers need to transmit at only
twice the PSD of AWGN. The PSD that has been „saved‟ can now be allocated to the underlay groups according to
the selected power allocation method (see Section 4). The transmit PSD of each symbol is now twice that of its
respective noise (explained in the following subsection).
1 2
1 1 1
0
1 1 1
log 1
v
k k j j
v
j j r r
QN G
CR u CR p
k v j
MGCC QG L
p p p p
v j r
W W
C W
n W W W
(4)
In (4), the total PSD for the band is the sum of the PSD of all the overlay subcarriers 1
1
,k k
N
CR u
k
W
plus the
sum of the PSD of the symbols transmitted in the underlay subcarriers2
1 1
.v
i i
QG
CR p
v i
W
The noise PSD for the
band, is the sum of the thermal noise 0n W , the incumbent user PSD in the subcarriers used to transmit underlay
symbols
1 1
v
j j
QG
p p
v j
W
, and the incumbent user PSD in the underused subcarriers that have not been used to
transmit symbols
1
.r r
L
p p
r
W
This SINR is added to 1, the log is taken of the result and multiplied by the
bandwidth of the entire band (W). The MGCC analytic formula, (4), does not yield as large a capacity as the analytic
formulae in [9] and[11], but we have a more accurate assessment of achievable channel capacity.
4.2. MGCC analytic formula and system design
In this subsection, we describe how the MGCC analytic formula is used for system design. BER is lowest when only
overlay subcarriers are used. The use of underlay subcarriers raises capacity at the risk of greatly increasing BER. In
Figure 7. Overlay PSD, underlay PSD and subcarrier allocation - final stage.

IJRRAS 9 (1) ● October 2011 Mayers & Raju ● Maintaining QoS in Cognitive Radio System
32
a system with multiple bands, accurate assessment of band capacity can be used to improve band and subcarrier
selection process. Selective band and subcarrier allocation are important system design tools that CRs possess. We
use the MGCC formula to perform analysis, and also as a tool with which to control BR and BER through band
selection, subcarrier selection and symbol PSD allocation.
In our system, we note that we are given the maximum acceptable BER or Symbol Error Rate (SER) for the CR ((5)
expresses the relationship between BER and SER)). The maximum acceptable BER is used to calculate the
minimum acceptable SINR for each symbol. The PSD necessary for each symbol can then be estimated. This is
achieved by using the formula for calculating received SINR, (8), with the formulae used to calculate error
probability of symbols at the receiver [12]. We note that this formula does not budget for channel coding. In this
example the Quadrature Phase Shift Keying‟s (QPSK‟s) formula for symbol error probability, (6), is used.
2log
sb
PP
M (5)
0
2
s
ss
p
EP Q
N
(6)
2
21
2
tdt
xQ x e
(7)
0 00
min_sinr s
s s s
r s b
p s p s s p bs
s
P E E
W N T W N TW N
W
(8)
sp represents the PSD of the incumbent users in the subcarriers that are used to transmit a symbol. (7) is the
expression for the Q function which is used to calculate error probability in digital systems with Gaussian noise.
Though the noise is not Gaussian, the Q function is used because we only need to estimate the SINR needed. The
system will correct for over or under-estimations. For overlay, one subcarrier is used, while multiple subcarriers can
be used for underlay.
1 2 max
1 1 1
v
k k j j
QN G
CR u CR p
k v j
W W
(9)
1
1
0
1
min_sinrk uk
k
N
CR W
k
N
u
k
n W
(10)
2
1 1
0
1 1 1 1
min_ sinr
v
j j
v v
j j j
QG
CR p
v j
Q QG G
p p p
v j v j
W
n W W
(11)
(9) expresses the constraint that the combined transmit PSD (both overlay and underlay) of the subcarriers in W
must not exceed a specified maximum PSD, max . Now that we have min_sinr, we note that since overlay
subcarriers only have thermal noise to overcome, they can achieve a low BER with relatively low transmit PSD. To
maximize capacity, we can then minimize the power utilized by the overlay subcarriers, while satisfying the
constraint in (10) by transmitting with minimum PSD necessary. The PSD saved is applied to the symbols
transmitted using underlay. The number of underlay groups is maximized, by transmitting with the minimum
acceptable PSD (see (11)) per underlay symbol.

IJRRAS 9 (1) ● October 2011 Mayers & Raju ● Maintaining QoS in Cognitive Radio System
33
0 0
1 1 1
0
1 1 1
min_sinr min_sinr
max log 1
v
k j j j
v
j j r r
QN G
u p p p
k v j
QG L
p p p p
v j r
n W W n W
C W
n W W W
(12)
In (12) we obtain the minimum transmit PSD for underlay by multiplying the AWGN PSD in overlay subcarriers by
min_sinr, and then subtracting total overlay PSD from max . We apply the remaining PSD to the symbols
transmitted using the underlay groups. We multiply the AWGN PSD plus the incumbent users PSD for each
underlay symbol by min_sinr. Thus, the symbols transmitted using underlay are allocated as little transmit PSD as
possible. In the following section, we introduce methods used to allocate transmit PSD to symbols transmitted using
underlay.
5. UNDERLAY POWER ALLOCATION METHOD
Section 4.2 explains the relationship between BER and SINR. Generally stated, BER decreases as SINR rises. We
cannot change the incumbent user and AWGN (noise) PSD in a subcarrier, but we have control over the transmit
PSD of symbols. We explain two methods used to make this choice using Figure 8, and the algorithms in Methods 1
& 2. For this example, we assume that the minimum SINR (min_sinr) is 2.
Figure 8. PSD for subcarriers 1-6 using methods 1 and 2.
Table 3. Symbols and Definitions for Underlay Group Decision Methods.
Symbol Definition
Storage bin for underlay groups that meet criteria.
Potential underlay group.
ni ICU Interference in the ith subcarrier in group.
nr PSD of Incumbent User in reference subcarrier.
NG Total interference of a group in Method 2.
ANG Average Incumbent User PSD in a group (Method 2).
Temporary PSD Threshold.
x Number of subcarriers within a group.

IJRRAS 9 (1) ● October 2011 Mayers & Raju ● Maintaining QoS in Cognitive Radio System
34
Table 3 contains the symbols and definitions relevant to section 5. In Method 1, for each potential underlay group ,
the subcarrier with the highest incumbent user PSD is referred to as the reference subcarrier. The incumbent user
PSD in the reference subcarrier is represented by nr. If n
r exceeds , we do not transmit a symbol in that group. If n
r
is less than or equal to the temporary threshold , we multiply nr by the min_sinr, and use the result as the CR PSD
for each subcarrier in the group. In other words, the CR PSD allocated to each subcarrier in group is the PSD
necessary for the subcarrier with the most noise (nr) to meet min_sinr. This group is included in .
In Method 2, if the reference subcarrier PSD (nr) of a group is greater than or equal to , we move on to the next
group. If not, we take the average incumbent user PSD (ANG) of the group and calculate the per-subcarrier PSD by
multiplying ANG by min_sinr. This group is included in . Reference to Figure 8 shows that in some cases, the
methods result in different PSD profiles. Comparison of Methods 1 and 2 show that the transmit PSD is much higher
in Method 1 than 2. Intuitively, BER is lower if Method 1 is used. The tradeoff is that overall PSD is greater. It also
means that max might be exceeded before transmit PSD is applied to all the symbols that are transmitted using
underlay. If sufficient bands are not assigned to the CR, some symbols will not be transmitted, so BR is reduced.
While the tradeoff may seem like a negative, it actually enables the system to maintain stability by temporarily
increasing or decreasing transmit PSD and BR as needed. In Section 8 we examine the effect of each method on
system performance. In the following section we describe the concepts upon which the power control process is
based.
6. POWER CONTROL ALGORITHMS FOR MGCC
In this section, we describe two power control methods. In response to system performance, we increase or decrease
the transmit PSD of symbols. We know that underlay subcarriers have higher BER than overlay because underlay
has interference from incumbent users while overlay only has to contend with AWGN. It is difficult, however, to
determine the extent to which BER is influenced by overlay and underlay respectively.
To study the problem, we have developed a sophisticated approach, Method 2, to manage the different effects on
BER due to underlay and overlay transmission. We compare this approach with another method that uses Squared
Method 2 – Averaged SNR method
For a potential group of x subcarriers
nr = max ( )PSD
IF nr <=
For i= 1 to x
NG= NG + ni
End ANG = NG/x
For i= 1 to x
iPSD = min_sinr*ANG
End
= ,
Move on to next
ELSE
Move on to next
Method 1 – Max SNR method
For a potential group of x subcarriers
nr = max ( )PSD
IF nr <=
For i= 1 to x
iPSD = min_sinr*nr
End
= ,
Move on to next
ELSE
Move on to next
IJRRAS 9 (1) ● October 2011 Mayers & Raju ● Maintaining QoS in Cognitive Radio System
35
Error (SE) as a design tool. Squared error has often been used in many adaptive systems, including power control
systems, to adjust tap weights [13-15] etc. In this paper we use SE in Method 1 and refer to it as the ideal. SE is
calculated by squaring the difference between the minimum acceptable BER and feedback BER. However, one
problem with SE is that the precision of BER feedback becomes too important. In less than ideal channel conditions
even the pilot signals that are used to calculate BER will become corrupted and return inaccurate figures. Simply
stated BER is difficult to measure, and measuring it exactly is almost impossible [16]. Also with Method 1, there is
no attempt made to differentiate between underlay and overlay transmission. We attempt to solve both problems
with Method 2. In Method 2 we use BER feedback, but eliminate the need for exactitude of the BER feedback.
In both methods we manipulate transmit PSD by changing the value of (see (3)). One of the stated objectives of
this paper is to achieve user defined QoS without external management. Thus we designed our algorithm to self
correct, and avoid drastic fluctuations by self dampening. The power control methods are explained below.
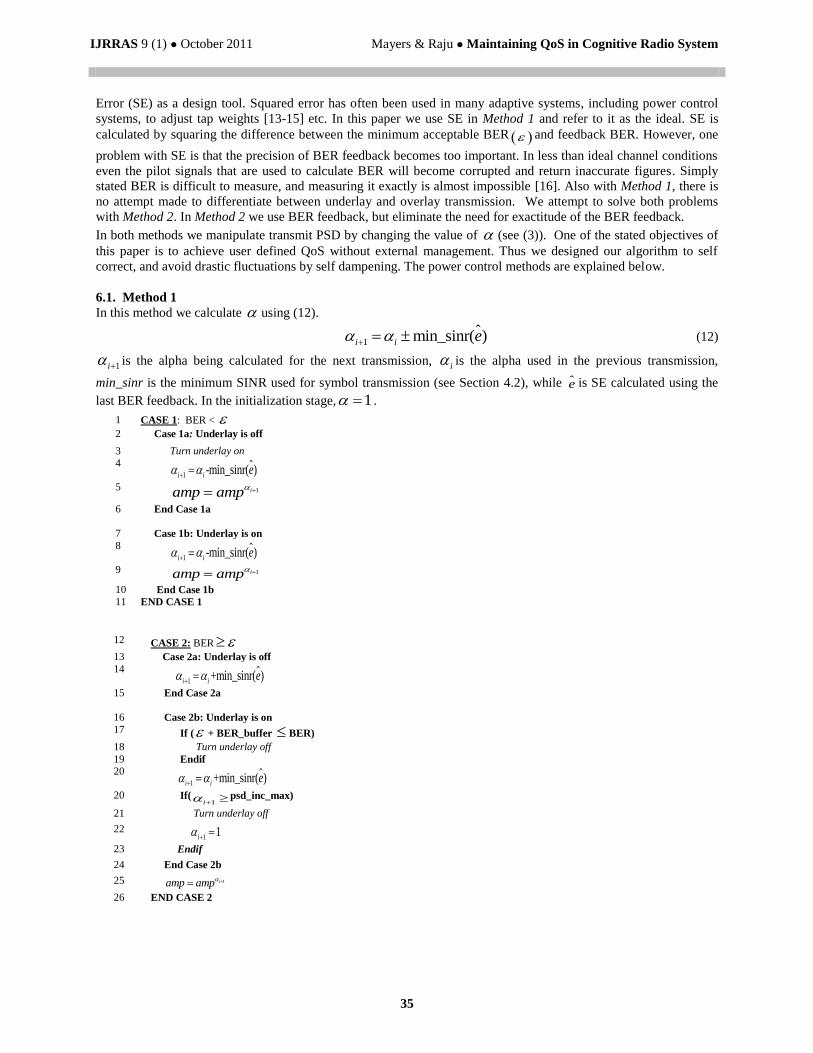
6.1. Method 1
In this method we calculate using (12).
1 min_sinr( )i i e (12)
1i is the alpha being calculated for the next transmission, i is the alpha used in the previous transmission,
min_sinr is the minimum SINR used for symbol transmission (see Section 4.2), while e is SE calculated using the
last BER feedback. In the initialization stage, 1 .
12 CASE 2: BER
13 Case 2a: Underlay is off
14
1 +min_sinr( )i i e
15 End Case 2a
16 Case 2b: Underlay is on
17 If ( + BER_buffer BER)
18 Turn underlay off
19 Endif
20
1 +min_sinr( )i i e
20 If(1i psd_inc_max)
21 Turn underlay off
22 1 1i
23 Endif
24 End Case 2b
25 1iamp amp
26 END CASE 2
1 CASE 1: BER <
2 Case 1a: Underlay is off
3 Turn underlay on 4
1 -min_sinr( )i i e
5 1iamp amp
6 End Case 1a
7 Case 1b: Underlay is on 8
1 -min_sinr( )i i e
9 1iamp amp
10 End Case 1b
11 END CASE 1
IJRRAS 9 (1) ● October 2011 Mayers & Raju ● Maintaining QoS in Cognitive Radio System
36
In Case 1a, if the BER is acceptable is reduced using a proportion (min_sinr) of the distance (SE) between the
feedback BER and the BER threshold ( ) . If underlay is off (Case 1b), it is turned on.
psd_inc_max:
max 1
1 1 1
1 1
( )min_sinr
_ _ max 1
( )min_sinr
v
k k j j
v
j j
QN G
CR u p p
k v j
QG
p p
v j
W W
psd inc
W
(13)
In (13), 1
1k k
N
CR u
k
W
is the total overlay PSD which has already been adjusted using the power control algorithm.
1 1
( )min_sinrv
j j
QG
p p
v j
W
represents the total underlay PSD that has been allocated by applying the minimum transmit
power necessary to meet SINR requirement (see Section 3 for meaning of individual symbols). The adjusted overlay
is added to the pre-adjusted underlay transmit PSD, and subtract the result from max (maximum band PSD). The
result is divided by the total overlay transmit PSD and added to 1. Thus, psd_inc_max sets the upper limit on u ,
and ensures that transmit PSD does not exceed max .
In Case 2a, BER is less than , and underlay is off, so is increased. BER_buffer = 5 (line 17) and is used to
facilitate a quick response if BER is too high. If underlay is on (Case 2b), the system checks to see if the BER is
unacceptably high, and underlay is turned off, if it is being used(line 17 -19). Underlay transmission also gets turned
off if the increase in alpha will cause max to be exceeded. This is done by ensuring 1i < psd_inc_max, which is
calculated using (13).
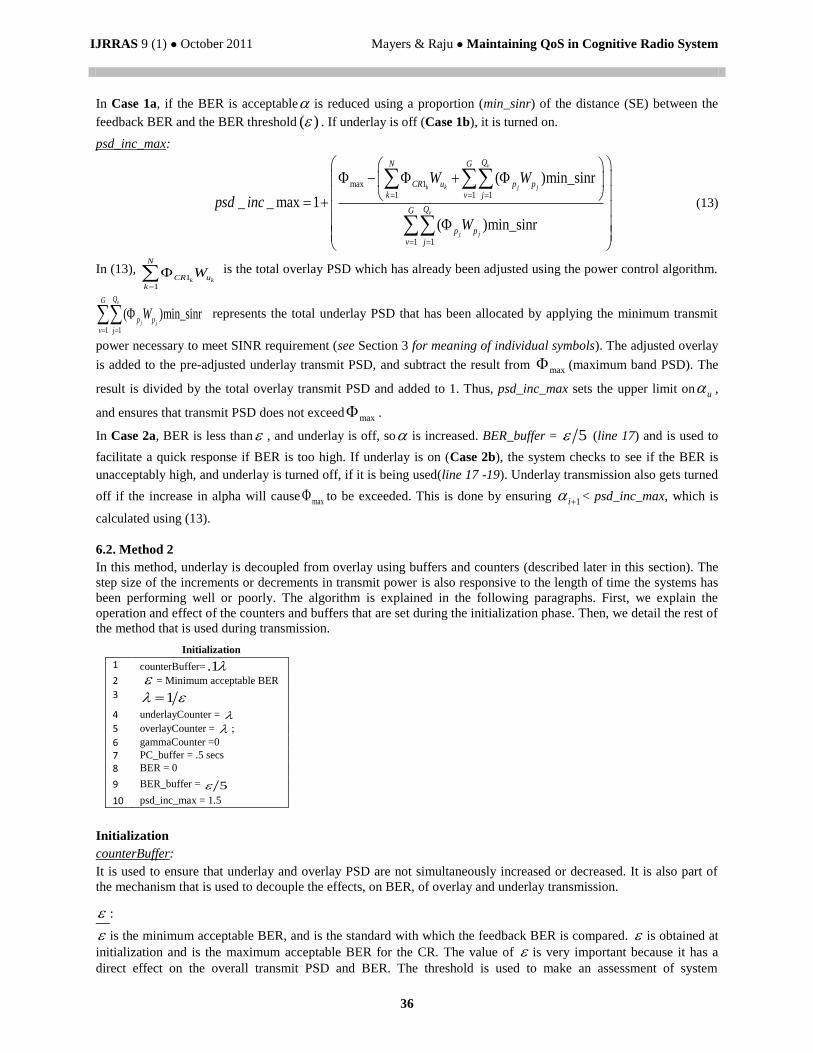
6.2. Method 2
In this method, underlay is decoupled from overlay using buffers and counters (described later in this section). The
step size of the increments or decrements in transmit power is also responsive to the length of time the systems has
been performing well or poorly. The algorithm is explained in the following paragraphs. First, we explain the
operation and effect of the counters and buffers that are set during the initialization phase. Then, we detail the rest of
the method that is used during transmission.
Initialization
counterBuffer:
It is used to ensure that underlay and overlay PSD are not simultaneously increased or decreased. It is also part of
the mechanism that is used to decouple the effects, on BER, of overlay and underlay transmission.
:
is the minimum acceptable BER, and is the standard with which the feedback BER is compared. is obtained at
initialization and is the maximum acceptable BER for the CR. The value of is very important because it has a
direct effect on the overall transmit PSD and BER. The threshold is used to make an assessment of system
Initialization
1 counterBuffer= .1
2 = Minimum acceptable BER
3 1
4 underlayCounter =
5 overlayCounter = ;
6 gammaCounter =0
7 PC_buffer = .5 secs
8 BER = 0
9 BER_buffer = 5
10 psd_inc_max = 1.5

IJRRAS 9 (1) ● October 2011 Mayers & Raju ● Maintaining QoS in Cognitive Radio System
37
performance. This assessment is used to make important decisions such as whether underlay is used, or transmit
power is increased or decreased. Manipulation of transmit PSD affects BER and BR, as does the use (or non use) of
underlay transmission. If is too high, the system does not correct itself quickly enough, and continues transmitting
at unsuitably low power. This results in unacceptable BER for prolonged periods. Also, the system keeps
transmitting for a long time in underlay groups with poor SNR. When is too low, the underlay system almost
never gets turned on, and available capacity is not used. Results are displayed in Section 8.4.
:
2
11
u
underlayCounter
(14a)
2
11
o
overlayCounter
(14b)
(14a)& (14b) were derived as follows. In order to affect transmit PSD based on the relationship between and BER
feedback, two counters called the underlayCounter and overlayCounter are used. These counters are incremented
and decremented according to the relationship between each received BER feedback and . Thus, the value of the
counters at any specific instant hold the memory of all prior BER feedback. Memory is important because it helps
dampen the CRs response to aberrant occurrences in the channel.
u
underlayCounter
(15)
As an aid to comprehension, (14a) can be rewritten as (15). For the rest of this explanation, (14a) is used as an
example because the same procedures and conditions are applicable to (14b). (3) shows that transmit power is
calculated by applying u as an exponent to the amplitude of underlay symbols. When a CR starts transmitting, u
=1. In subsequent transmissions, amplitude is varied by changing .u Eq. 15 acts as a control mechanism with which
u is incrementally adjusted, using 1u as the starting reference. It is important 0,u because the amplitude
of any symbol cannot be 1.
In order to accomplish the goals above, the variable is introduced, and underlayCounter = . Thus, for the first
transmission, u =1. For subsequent transmissions, underlayCounter is incremented or decremented based on
comparison with , and u is calculated using the new value of underlayCounter.
underlayCounter
(16)
As in any control system, stability is ensured by the avoidance of zeros and poles. Zeros occur if the condition in
(16) is met. If (16) is rewritten into the form of the characteristic equation, we obtain (17). 2 0underlayCounter (17)
The solutions to (17) are (18a) and (18b), thus , cannot be equal to 1 or 2.
1
1 1 4
2
underlayCounter
(18a)
2
1 1 4
2
underlayCounter
(18b)
Observation of (14a) and/or (15) shows that the pole is at 0. In order to avoid this, is made sufficiently large
by initializing it as 1 . Setting 1 also tailors system response to each individual CR‟s BER threshold. We
have made mention of changing the step size of the increments or decrements of transmit PSD. This is accomplished
by increasing or decreasing in sufficiently small increments, such as .02 . Table 4 shows an example withiu
=1.017, underlayCounter = 8 and 4 different values of . We can see that as the value of decreases, the step size

IJRRAS 9 (1) ● October 2011 Mayers & Raju ● Maintaining QoS in Cognitive Radio System
38
of the increment increases. is one of the components that contributes to the Methods 2’s ability to self-adjust
to channel conditions.
underlayCounter & overlayCounter:
They are used to track the increase or decrease of BER during transmission. Upon initialization both counters are
set to . Throughout transmission they are used to calculate the values of u and
o ((14a) & (14b)). The counters
are manipulated independently to reflect the respective effects, on BER, of underlay and overlay.
gammaCounter & PC_buffer:
They are used to track the duration of BER increase and/or decrease. gammaCounter works with and PC_buffer
to provide dampening. They prevent the CR from making drastic changes in response to temporary changes in
channel conditions. The range of gammaCounter is from –PC_buffer to PC_buffer. As an example, suppose BER
has been decreasing, and is lower than the BER threshold, . For every decrease in BER gammaCounter is
incremented. gammaCounter increment step size is calculated using (.02) . When gammaCounter = -PC_buffer,
is then decreased, therefore, transmit PSD is decreased in greater increments.
During transmission
Case 1a: BER < , underlay is off
When feedback BER is less than , system performance is satisfactory, and the underlayCounter is set to the
current value of . If system performance has been satisfactory for time Tp, then underlay is turned on,
gammaCounter is reset to 0, and is incremented. This slows the rate at which transmit PSD is decreased (lines 2-
7). This is done because underlay has just been reintroduced, so BER will most likely increase. Therefore the
decreases or increases in transmit PSD is minimized in order to encourage stabilization. u and o are calculated
using (12), and then respectively applied to the amplitude of symbols transmitted using underlay and overlay (lines
8-9 & 29-30). If the system performance has not been satisfactory for long enough, then gammaCounter is increased
and only o is calculated and applied to the amplitude of overlay symbols (lines 29-30).
Case 1b: BER < , underlay is on
underlayCounter is compared to overlayCounter. This comparison controls the rate at which the transmit PSD of
overlay subcarriers is reduced compared to the transmit PSD of overlay subcarriers. counterBuffer is used to
facilitate this comparison. Lines 15–19 ensure that the PSD of more sensitive symbols transmitted using underlay
(because of interference), is reduced at slower rates, and increased at faster rates than overlay. Lines 20-25 calculate
whether needs to be adjusted, then u and o are calculated and respectively applied to the amplitude of symbols
transmitted by underlay and overlay (lines 26-27 & 29-30).
Case 2a: BER , underlay is off
If system performance is poor and underlay is off, overlayCounter and gammaCounter are decreased (lines 33 &
34). The decrease of gammaCounter contributes to tracking the length of time the system has been performing
poorly. The decrease of gammaCounter increases the transmit PSD of symbols in overlay subcarriers so that BER is
reduced. If the BER is unacceptably high, is reduced in order to increase the rate at which transmit PSD is
Table 4. The effect of the value of pole on increment size
iu
Underlay
Counter 1iu
Percentage
Increase of
u
40 1.017 8 1.02 .31
35 1.017 8 1.022 .51
30 1.017 8 1.024 .75
20 1.017 8 1.027 1.02

IJRRAS 9 (1) ● October 2011 Mayers & Raju ● Maintaining QoS in Cognitive Radio System
39
increased (lines 35-37). o is calculated and applied to the amplitude of symbols transmitted using overlay (lines
64-65).
Case 2b: BER , underlay is on
Firstly, if the BER is very poor (line 40), then underlay is turned off and the increment size of the transmit PSD
increase is reduced (line 42). This is done because since underlay has been turned off, BER will decrease drastically,
so the rate at which overlay PSD is increased has to be slowed. o is calculated and then applied to the amplitude of
symbols transmitted using overlay (lines 64-65).
If BER is not unacceptably high (line 44), and the system has been performing poorly for timeTp, then the rate of
PSD increase is accelerated (lines 45-50). The decision to increase the PSD of either underlay or overlay symbols is
made (lines 51-55), and u is calculated. Lines 57-61 ensure that the transmit PSD of an entire band does not exceed
max . If this occurs, underlay subcarriers are not used for transmission. If the maximum PSD is not exceeded, then
u is calculated, and applied to symbols in underlay subcarriers. In both instances, o is calculated and then applied
CASE 2: BER
32 Case 2a: Underlay is off
33 overlayCounter=overlayCounter- (.02) ;
34 gammaCounter= gammaCounter - (.02) ;
35 If( + BER_buffer BER)
36 .1 ;
37 Endif
38 End Case 2a
39 Case 2b: Underlay is on 40 If ( + BER_buffer BER)
41 Turn underlay off
42 .15 ;
43 gammaCounter= gammaCounter - (.02) ;
44 Elseif ( + BER_buffer > BER)
45 If (gammaCounter== -PC_buffer)
46 gammaCounter = 0 ;
47 .1 ;
48 else
49 gammaCounter=gammaCounter- (.02) ;
50 Endif
51 If(underlayCounter+counterBufferoverlayCounter)
52 overlayCounter = overlayCounter + (.02) ;
53 Else 54 underlayCounter = underlayCounter + (.02) ;
55 Endif
56
2
11
u
underlayCounter
57 If(u psd_inc_max)
58 Turn underlay off
59 Else
60 u
u uamp amp
61 Endif
62 Endif
63 End Case 2b
64
2
11
o
overlayCounter
65 o
o oamp amp
66 END CASE 2
During Transmission 1 CASE 1: BER <
2 Case 1a: Underlay is off
3 underlayCounter = ;
4 If (gammaCounter==PC_buffer) 5 Turn underlay on;
6 gammaCounter =0; 7 .1
8
2
11
u
underlayCounter
9 u
u uamp amp
10 else 11 gammaCounter=gammaCounter+ (.02) ;
12 Endif
13 End Case 1a
14 Case 1b: Underlay is on 15 If(underlayCounter+counterBuffer overlayCounter)
16 underlayCounter = underlayCounter - (.02) ;
17 Else
18 overlayCounter = overlayCounter - (.02) ;
19 Endif 20 If (gammaCounter==PC_buffer)
21 .04
22 gammaCounter =0;
23 else 24 gammaCounter=gammaCounter+ (.02) ;
25 Endif
26
2
11
u
underlayCounter
27 u
u uamp amp
28 End Case 1b
29
2
11
o
overlayCounter
30 o
o oamp amp
31 END CASE 1

IJRRAS 9 (1) ● October 2011 Mayers & Raju ● Maintaining QoS in Cognitive Radio System
40
to the amplitude of symbols transmitted using overlay subcarriers. In the following section we present the simulation
parameters used to perform the research.
7. SIMULATION
Our system is based on the MB OFDM standard (see Figs. 1 & 2). We used 14 bands, 528 MHz in bandwidth, each
with 128 subcarriers, 4.125 MHz each. Unless otherwise stated in individual sections, we use a BR of 200Mhz. To
simulate the presence of incumbent users, we generate a fixed number of transmitting subcarriers in each band using
a random Gaussian distribution. AWGN was uniform across all bands and subcarriers. For the subcarriers with
incumbent users, we use a normal distribution, over the range of [0 -max /128 ] to generate incumbent user PSD. The
denominator (128) is chosen because it is the number of subcarriers in each band. The average channel power gain
is assumed to be one. For each simulation we transmit 6Gb of data. Unless explicitly stated, the max SINR PSD
allocation method, and the power control Method 2 are used throughout simulation.
8. RESULTS AND ANALYSIS
In this section we studied the effects on QoS due to the following:
Use of channel capacity as a design tool.
Constraints on the number of bands available for transmission.
PSD allocation methods for underlay groups.
Underlay group size.
Power control methods and choice of BER Threshold.
8.1. Channel capacity analytic formulas
Figure 10. PSD vs SINR. Wu et al’s channel capacity analysis vs MGCC channel capacity
analysis. Comparison of formulae used as design tool.
0 2 4 6 8 100
5
10
15x 10
4
SINR(dB)
PS
D
PSD - Wu vs MGCC
Wu et al
MGCC
Figure 9. BER vs SINR. Wu et al’s channel capacity analysis vs MGCC channel capacity analysis. Comparison
of formulae used as design tool.
0 2 4 6 8 100
0.05
0.1
0.15
0.2
SINR(dB)
BE
R
BER - Wu vs MGCC
Wu et al
MGCC
IJRRAS 9 (1) ● October 2011 Mayers & Raju ● Maintaining QoS in Cognitive Radio System
41
In Figure 9 and Figure 10, we compare Wu et al‟s channel capacity formula to the MGCC formula in terms of BER
and cumulative transmit PSD. The formulae are as design tools. After CRs sense the individual MB-OFDM bands,
we use each formula to assess band capacity, rank them, and use the highest ranked bands. Observation shows that
when the MGCC is used, BER is lower than when the Wu et al formula is used. When Figure 10 is taken into
consideration, we see that the MGCC uses lower transmit PSD to achieve superior BER.
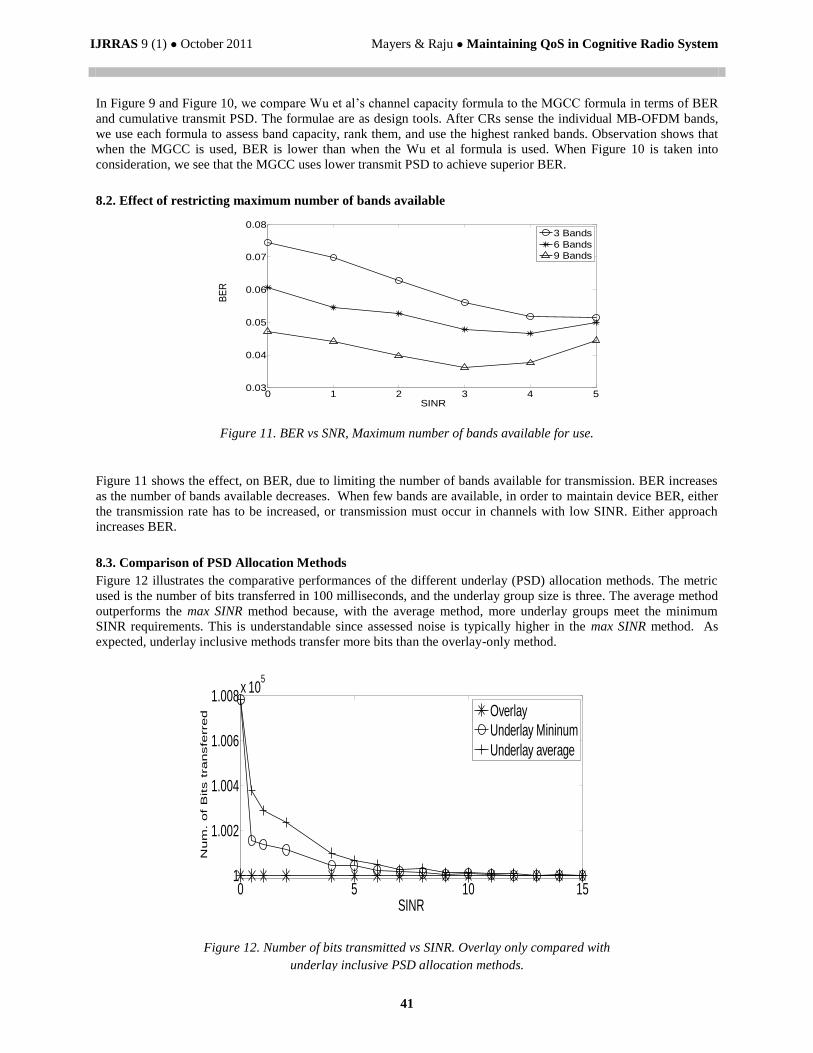
8.2. Effect of restricting maximum number of bands available
Figure 11 shows the effect, on BER, due to limiting the number of bands available for transmission. BER increases
as the number of bands available decreases. When few bands are available, in order to maintain device BER, either
the transmission rate has to be increased, or transmission must occur in channels with low SINR. Either approach
increases BER.
8.3. Comparison of PSD Allocation Methods
Figure 12 illustrates the comparative performances of the different underlay (PSD) allocation methods. The metric
used is the number of bits transferred in 100 milliseconds, and the underlay group size is three. The average method
outperforms the max SINR method because, with the average method, more underlay groups meet the minimum
SINR requirements. This is understandable since assessed noise is typically higher in the max SINR method. As
expected, underlay inclusive methods transfer more bits than the overlay-only method.
Figure 12. Number of bits transmitted vs SINR. Overlay only compared with
underlay inclusive PSD allocation methods.
0 5 10 151
1.002
1.004
1.006
1.008x 10
5
SINR
Num
. of
Bits t
ransfe
rred
SNR vs Number of bits transferred (TOTAL) - Comparison of Underlay SNR calculation formulae, Groupmin = 2, std power
Overlay
Underlay Mininum
Underlay average
Fig.11. Number of bit transferred vs SNR(non-variable power allocation), Underlay
SNR methods comparison
Figure 11. BER vs SNR, Maximum number of bands available for use.
0 1 2 3 4 50.03
0.04
0.05
0.06
0.07
0.08
SINR
BE
RBER - Band pool
3 Bands
6 Bands
9 Bands

IJRRAS 9 (1) ● October 2011 Mayers & Raju ● Maintaining QoS in Cognitive Radio System
42
Figure 13 indicates that BER for almost all SINR values is lowest for overlay only, then the max SINR method, and
lastly the average SINR method. This is because higher PSD per underlay group symbol is allocated with the max
SINR method than with the average SINR method. Overlay-only BER is lowest because of lack of user interference
in overlay subcarrier bandwidth. The results from Figure 12 & Figure 13 illustrate the tradeoff between BER and
BR. The system can use the appropriate methods to improve BR or BER as necessary. For the remaining graphs in
this paper, the max SINR method is used.
8.4. Comparison of Group Size for Underlay Groups
Table 5 shows that BER is lower when underlay symbols are spread over three subcarriers, than when only one
subcarrier is used. The Wu et al (see (1)) analytical formula corresponds to gmin=1, SNR = 0 in Table 5. It is
evident that the GMCC method provides significant improvement (gmin = 3, SNR = 0). These results support our
assertion that in the presence of noise and user interference, spreading the symbol yields better BER performance.
Table 5. Tabular view of BER vs. for max SINR method with group sizes 1 & 3
BER Threshold = .039
Group Size
SINR
db
BER for
Gmin = 1
BER for
Gmin = 3
BER for
Overlay
Only
0 .101534 .068217 .058723
0.3 .083554 .069525 .058652
0.6 .088255 .071491 .056804
1 .080536 .067862 .061182
2 .083202 .056069 .060637
4 .070172 .062047 .060443
5 .070485 .060692 .058748
6 .073248 .062420 .058048
7 .061907 .054860 .062198
8 .066040 .056941 .058614
9 .058432 .054549 .058508
10 .058563 .052208 .062465
Figure 13. BER vs SINR, Overlay only compared with underlay inclusive PSD
allocation methods.
0 5 10 150.028
0.0285
0.029
0.0295
0.03
0.0305
0.031
SINR
BE
R
SNR vs Overall BER - Comparison of Underlay SNR calculation formulae, Groupmin = 2, std power
Overlay
Underlay Mininum
Underlay average
Fig.12. BER vs SNR(non-variable power allocation), Underlay SNR methods comparison

IJRRAS 9 (1) ● October 2011 Mayers & Raju ● Maintaining QoS in Cognitive Radio System
43
8.5. Power Control & BER Threshold
Figure 14 and Figure 15 compares our power control method (Method 2) with the ideal (Method 1).
Method 1 (SE) yields slightly higher BER, and higher transmit PSD than Method 2. The efficacy of the power
control algorithm, when using Method 2, is evident, in that, as SINR rises and BER falls, transmit PSD initially
increases, then levels off.
Figure 16 illustrates the relationship between BER and the value of BER threshold in the method 2 power
control algorithm. Overlay only transmission, and underlay inclusive transmission, with group sizes = 1 and 3, are
compared using variable and non variable transmit power. It is clear that BER is higher for group size 1 than for
group size 3. In the case of variable transmit power, we observe that changes in the BER threshold effects BER
more at some points than others.
Figure 16. BER Threshold vs BER (with max SINR method).
0
0.01
0.02
0.03
0.04
0.05
0.06
0.07
0.08
0.09
Constant Power
Variable Power, BER Threshold =
.029
Variable Power, BER Threshold =
.039
Variable Power, BER Threshold =
.05
B
E
ROverlay Only
Group Min = 1
Group Min = 3
Figure 15. PSD vs SINR Comparison of power control methods.
0 1 2 3 4 5 6 7 81.1
1.15
1.2
1.25
1.3x 10
8
SINR(dB)
PS
D
Power control method - SINR vs Transmit PSD
Method 2
Method 1
Figure 14. BER vs SINR. Comparison of power control methods.
0 1 2 3 4 5 6 7 80.01
0.02
0.03
0.04
0.05
0.06
0.07
0.08
0.09
SINR (dB)
BE
R
Groupsize comparison - SINR vs BER
Method 2
Method 1

IJRRAS 9 (1) ● October 2011 Mayers & Raju ● Maintaining QoS in Cognitive Radio System
44
Figure 17 illustrates the PSD required to transmit 100Gb, for the corresponding BER shown in Figure 16.
Figure 16 and Figure 17 examined together illustrate the effect of the BER threshold on the power control algorithm.
Judicious manipulation of the threshold can be a tool used to influence transmit PSD or BER as the situation
demands. As the BER threshold increases, transmit PSD decreases. Beyond a certain point, however, BER is not
affected by the BER threshold.
9. CONCLUSION
In this paper we proposed concepts and methods with which user defined QoS can be maintained in a CR, without
external management. We introduced a MB-OFDM UWB CR System with which we examined the effects of
underlay group size, methods for underlay PSD allocation, BER threshold and power control. The proposed system
uses band ranking based on using the Modified Group Channel Capacity (MGCC) analytic formula as a design tool.
We introduced an adaptive power control algorithm which we demonstrated is effective in reducing transmit PSD
and BER, and compares favorably with the ideal (SE). Very importantly, we were able to show how the CR‟s
abilities can be used in myriad ways to influence QoS.
10. ACKNOWLEDGEMENT
The authors would like to acknowledge the support received from NSF Grant, CRI-0551501.
11. REFERENCES
[1] T. Zahariadis, “Personal Area Networks,” Communications Engineering, vol. 1, no. 3, pp. 12-15, Jun. 2003.
[2] E. Callaway et al., “Home networking with IEEE 802.15. 4: a developing standard for low-rate wireless personal area networks,”
Communications Magazine, IEEE, vol. 40, no. 8, pp. 70–77, 2002. [3] T. Salonidis, P. Bhagwat, L. Tassiulas, and R. LaMaire, “Distributed topology construction of bluetooth wireless personal area
networks,” Selected Areas in Communications, IEEE Journal on, vol. 23, no. 3, pp. 633–643, 2005.
[4] N. Devroye, M. Vu, and V. Tarokh, “Cognitive radio networks,” IEEE Signal Processing Magazine, vol. 25, no. 6, pp. 12-23, Nov. 2008. [5] I. F. Akyildiz, W. Y. Lee, M. C. Vuran, and S. Mohanty, “NeXt generation/dynamic spectrum access/cognitive radio wireless networks:
a survey,” Computer Networks, vol. 50, no. 13, pp. 2127–2159, 2006.
[6] A. Batra, S. Lingam, and J. Balakrishnan, “Multi-band OFDM: a cognitive radio for UWB,” presented at the Conference Proceeding of IEEE International Symposium on Circuits and Systems(ISCAS), 2006, pp. 4094-4097.
[7] Jiho Jang and Kwang Bok Lee, “Transmit power adaptation for multiuser OFDM systems,” IEEE Journal on Selected Areas in
Communications, vol. 21, no. 2, pp. 171-178, Feb. 2003. [8] C. Y. Wong, R. S. Cheng, K. B. Letaief, and R. D. Murch, “Multiuser OFDM with adaptive subcarrier, bit, and power allocation,” IEEE
Journal on selected areas in communications, vol. 17, no. 10, p. 1747, 1999.
[9] Z. Wu and B. Natarajan, “Interference tolerant agile cognitive radio: Maximize channel capacity of cognitive radio,” in 4th IEEE Consumer Communications and Networking Conference, 2007. CCNC 2007, 2007, pp. 1027–1031.
[10] FCC Notice of Proposed Rule Making, “Revision of Part 15 of the Commission‟s Rules Regarding Ultrawideband Transmission
Systems.” ET-Docket 98-153. [11] V. D. Chakravarthy, “Evaluation of Overlay/Underlay Waveform via SD-SMSE Framework for Enhancing Spectrum Efficiency,”
Wright State University, 2008.
[12] A. Goldsmith, Wireless Communications. Cambridge University Press, 2005. [13] A. Klein, G. K. Kaleh, and P. W. Baier, “Zero forcing and minimum mean-square-error equalization for multiuser detection in code-
division multiple-access channels,” Vehicular Technology, IEEE Transactions on, vol. 45, no. 2, pp. 276–287, 1996.
[14] A. K. Pradhan, A. Routray, and A. Basak, “Power System Frequency Estimation Using Least Mean Square Technique,” IEEE Transactions on Power Delivery, vol. 20, no. 3, pp. 1812-1816, Jul. 2005.
[15] S. Elliott, I. Stothers, and P. Nelson, “A multiple error LMS algorithm and its application to the active control of sound and vibration,”
Acoustics, Speech and Signal Processing, IEEE Transactions on, vol. 35, no. 10, pp. 1423–1434, 1987. [16] S. Ulukus and R. D. Yates, “Stochastic power control for cellular radio systems,” Communications, IEEE Transactions on, vol. 46, no. 6,
pp. 784–798, 1998.
Figure 17. BER Threshold vs required PSD (with max SINR method).
0.00E+00
2.00E+05
4.00E+05
6.00E+05
8.00E+05
1.00E+06
1.20E+06
1.40E+06
1.60E+06
1.80E+06
Constant Power
Variable Power,
BER
Threshold = .029
Variable Power,
BER
Threshold = .039
Variable Power,
BER
Threshold = .05
P
S
D Overlay Only
Group Min = 1
Group Min = 3