Maine Logging Industry and the Bonded Labor Program: An ...
254
Pan Atlantic Consultants/The Irland Group November 18, 1999 Page: 1 Maine Logging Industry and the Bonded Labor Program: An Economic Analysis By 5 Milk Street Portland, Maine 04101 Ph: (207) 871-8622 Fx: (207) 772-4842 RR#2, Box 9200 Winthrop, Maine 04364 Ph: (207) 395-2185 Fx: (207) 395-2188
Transcript of Maine Logging Industry and the Bonded Labor Program: An ...

Pan Atlantic Consultants/The Irland Group November 18, 1999
Page: 1
Maine Logging Industry and the Bonded Labor Program:
An Economic Analysis
By
5 Milk Street
Portland, Maine 04101 Ph: (207) 871-8622 Fx: (207) 772-4842
RR#2, Box 9200 Winthrop, Maine 04364
Ph: (207) 395-2185 Fx: (207) 395-2188
Pan Atlantic Consultants/The Irland Group November 18, 1999
Page: 2
KEY FINDINGS
The report that follows is designed to be an in-depth and comprehensive study of the
logging industry and the H-2 Bonded Labor Program in the State of Maine. As the report
demonstrates, the economic issues and the labor market itself are complex and highly
interrelated. As such, the report is also complex and provides the detail necessary to thoroughly
analyze the relevant facets of the logging industry. The main body of the report is approximately
250 pages in length, and there is yet another volume of supplemental information and
appendices.
To assist the reader of this report, these Key Findings are extracted from the full report.
This section briefly addresses the major issues and concerns that interested parties have
expressed to the Maine Department of Labor over the past year. Please note that, because these
issues are complex and interrelated, we urge the reader not to view the Key Findings or even the
Report Synopsis (following) as the equivalent of the contents of the full report.
The following are the highlights of this report:
* Number of Loggers in Maine: We estimate that there were 3,600 persons employed in the
logging industry in Maine during the 1998-1999 operating season (i.e., from June 1998 through
March 1999). Of this number, an estimated 76% (or 2,700) are US citizens and 24% (or 900) are
citizens of Canada. The 900 Canadians that work in logging in Maine further break down as
follows: 12% (or 450) are Permanent Visa Workers, while the remaining 12% (or 450) are
Temporary Visa Workers (i.e., H-2 bonded workers).

Pan Atlantic Consultants/The Irland Group November 18, 1999
Page: 3
* Imperfect Markets Exist in the Logging Industry in Maine: The North Woods logging industry
is a market characterized by imperfections, including relatively concentrated landownership.
These imperfections limit the extent of market-competition at various levels of the industry, and
have implications for relative bargaining power among industry participants at all levels --
including logging contractors and workers. In this report, we use the term “monopsony” to
describe these imperfect market conditions. The market imperfections are felt most acutely in
northernmost Maine.
* Geography is the Primary Determinant of Imperfect Markets and the Labor Market
Conditions that Exist in the Maine Logging Industry: Geographic realities, including the
location of the international border relative to the local supply of labor, are the primary causes of
labor market imperfections in the Maine logging industry.
* Movement Toward Mechanical Harvesting Will Continue: Though the logging industry in
Maine adopted new technologies relatively slowly in the past, the present mechanization of
logging is gaining momentum -- and is partly a result of a chronic shortage of labor in the North
Woods. Output per worker has been increasing in the logging industry, and will continue to
increase with further mechanization. One result will be fewer logging jobs.
* A Labor Shortage of US Logging Workers Does Exist: At present, the logging capital stock in
Maine drives a demand for workers which cannot be met from domestic sources alone. Thus,
the H-2 program serves a purpose in allowing the Maine logging industry to function as it does
with sufficient labor to generate current levels of output.
Pan Atlantic Consultants/The Irland Group November 18, 1999
Page: 4
* The H-2 Program Does Not Clearly Depress Wages on a Statewide Basis: Although logging
wages do not compare favorably to an estimate for a “perfect” market, logging wage levels on a
statewide basis do not appear to be depressed by the H-2 program. On the other hand, it is likely
that the H-2 program does have a slightly negative effect on the annual incomes of US loggers in
isolated labor markets in far northern Maine, primarily in and around the St. John Valley.
* Raising Wages Would Not Attract Sufficient Workers: There are strong indications that raising
wages would not attract enough US workers to the logging industry to meet current labor
requirements. Demanding working conditions, commuting distances, and other issues mean that
the general population views traditional logging work as unattractive, even when
it would mean a raise in pay relative to jobs in other industries.
* The Certified Logging Professional (CLP) Program Benefits the Logging Industry: CLP
training is positively associated with reduced workplace injuries and has dramatically reduced
Workers’ Compensation costs for employers. Indeed, CLP is now a “prevailing practice” in the
Maine logging industry. However, to continue to benefit both workers and employers, CLP
techniques should be uniformly practiced throughout the State. We recommend that MDOL
adopt CLP practices in their enforcement and audit program for H-2 employers.
* Changes to the Bond Program Can Help US Workers and Contractors in the Short Run:
Several short-term changes should be made to the H-2 program to help it operate more
effectively. In particular, changes to the annual Woods Wage Survey and the establishment of
heavy equipment reimbursement rates will make the H-2 program more efficient in ensuring its
goals. Payroll audits and field inspections are an important component of “leveling the playing
field” for all loggers. In addition, MDOL should more closely monitor the number of bonded
workers actually employed in order to be more aware of changing impacts of the H-2 program.
* Options for the Future: Policymakers should consider policy options regarding the H-2

Pan Atlantic Consultants/The Irland Group November 18, 1999
Page: 5
program which would mediate negative effects on those US workers who are harmed by the
presence of bonded Canadian labor, while bearing in mind that logging in the future will have
fewer, more mechanically oriented jobs and will continue to face the systemic market
imperfections discussed above, at some level.

Pan Atlantic Consultants/The Irland Group November 18, 1999
Page: 6
TABLE OF CONTENTS
I. KEY FINDINGS 2 II. AUTHORS’ NOTES 8 III. INTRODUCTION 9 IV. REPORT SYNOPSIS 12 V. PART ONE- BACKGROUND 28
A. THE ORIGINS OF CANADIAN WOODS LABOR IN MAINE 29 B. SYNOPSIS OF KEY POINTS FROM PRECEDING MAINE WOODS STUDIES 34
VI. PART TWO- THE POLITICAL ECONOMY OF LOGGING IN MAINE 41
A. MAINE FOREST PRODUCTS INDUSTRY ECONOMIC STRUCTURE, CONDITIONS, AND TRENDS 42 B. LABOR MARKET OVERVIEW 53 C. HOW MANY LOGGERS ARE THERE IN MAINE? 57 D. HOW MANY CANADIANS ARE THERE IN THE MAINE WOODS? 59 E. “INDEPENDENT CONTRACTORS” VERSUS “EMPLOYEES” 63 F. THE WORKERS 66 G. WAGES AND COMPENSATION 77 H. THE CONTRACTORS 92 I. HEAVY EQUIPMENT 97 J. PHOTO ESSAY: MODERN LOGGING EQUIPMENT 100 K. A NOTE ON SEASONALITY 104
L. DESCRIPTION OF THE H-2 PROGRAM 106

Pan Atlantic Consultants/The Irland Group November 18, 1999
Page: 7
VII. PART THREE - HYPOTHESES 113 A. HYPOTHESIS 1- DID MAINE EXPERIENCE LATE MECHANIZATION COMPARED TO OTHER U.S. TIMBER-PRODUCING REGIONS? 116 B. HYPOTHESIS 2- DID RAPID TECHNOLOGICAL CHANGE LOWER THE DEMAND FOR LABOR IN LOGGING AND PLACE DOWNWARD PRESSURE ON INCOMES FOR SOME WORKERS? 119 C. HYPOTHESIS 3- DOES MARKET STRUCTURE AT THE LAND- OWNERSHIP AND LOG-BUYING LEVELS AFFECT THE CONDUCT AND PERFORMANCE OF THE LOGGING LABOR MARKET? 125 D. HYPOTHESIS 4- DO INDUSTRYWIDE FACTORS PLACE MAINE LANDOWNERS AND LOGGERS UNDER COST PRESSURES? 137 E. HYPOTHESIS 5- IS GEOGRAPHY THE PRIMARY FACTOR IN EXPLAINING EMPLOYMENT OF CANADIAN WORKERS IN THE MAINE WOODS? 155 F. HYPOTHESIS 6- DOES PUBLIC POLICY AFFECT THE SHAPE OF THE
INDUSTRY? 166 G. HYPOTHESIS 7- HAS THE H-2 PROGRAM REDUCED INCOMES AND EMPLOYMENT LEVELS OF U.S. WORKERS? 170 H. HYPOTHESIS 8- HAS THE H-2 PROGRAM CAUSED NEGATIVE IMPACTS ON THE MAINE ECONOMY? 187 I. HYPOTHESIS 9- WOULD OCCUPATIONAL PREFERENCES BE DIFFICULT TO OVERCOME IN SEEKING TO ATTRACT ADDITIONAL U.S. WORKERS TO THE LOGGING INDUSTRY? 195 J. HYPOTHESIS 10- IS THE SUPPLY OF U.S. LABOR TO THE MAINE
LOGGING INDUSTRY INELASTIC RELATIVE TO THE WAGE RATE? 204 VIII. PART FOUR - PROGRAM REVIEW 215 IX. REPORT ADDENDA: PROJECT TEAM BIOGRAPHIES & SOURCE LISTS 238 A. PROJECT TEAM BIOGRAPHIES 239 B. DIRECTORY OF SECONDARY SOURCES CONSULTED 246 C. STRATEGIC INTERVIEWS 254
AUTHORS’ NOTES
Pan Atlantic Consultants/The Irland Group November 18, 1999
Page: 8
The core Pan Atlantic Consultants/Irland Group (PAC/IRG) team consisted of Patrick
Murphy (Pan Atlantic Consultants); Jennifer Senick (Pan Atlantic Consultants); Eric Bassett
(Pan Atlantic Consultants); Kristina Morse (Pan Atlantic Consultants); Lloyd Irland (The Irland
Group); Dr. Jonathan Goldstein (Bowdoin College); and Kevin Allcroft (Forestree Concepts).
In order to maintain good communication and an ongoing flow of advice, the PAC/IRG
team met monthly with the Project Steering Committee, a group of current and former public
officials from the Maine and US Departments of Labor (MDOL and USDOL) and the Maine
Department of Conservation (MDOC). The Steering Committee included Alan Hinsey (MDOL),
Ray Fongemie (MDOL), Larry Ludwig (USDOL), Ray Lopez (USDOL), George Bourassa
(MDOC), and Gail Backus (former USDOL). At each meeting, historical, statistical, and other
background information were shared for review, issues were discussed, and early results of
interviews were presented. A special thanks also to Valerie Landry, Maine Commissioner of
Labor, for her involvement and support.
PAC/IRG also met regularly with the MDOL-sponsored Logging Industry
Subcommittee, which includes individual loggers, contractors, landowners, and others in order to
be informed about the issues discussed and to be available to answer questions about the
project’s progress and methodologies. PAC/IRG would like to thank the individual members of
the Subcommittee, including James Dube, Jim Farmer, Juan Perez-Febles, Hilton Hafford, Troy
Jackson, Stacy Kelly, Vaughn LeBlanc, Barry Ouellette, Juan Padro, Saul Roman, Cheryl
Russell, and Charles Tardiff.
PAC/IRG would like to thank key contributors to this report, including Roland Roy
(CBR Forest Management Services, New Brunswick), Claire Bolduc, and Karen Boutot. Thanks
also to the MDOL Labor Market Information Services staff, who were invaluable in pointing us
to -- and, in some cases, gathering -- secondary-source information and statistics. Finally, we
owe thanks to the Professional Logging Contractors of Maine for their support in encouraging
logging contractors to participate in our survey.
INTRODUCTION

Pan Atlantic Consultants/The Irland Group November 18, 1999
Page: 9
In March 1999, Pan Atlantic Consultants and the Irland Group (together PAC/IRG)
contracted with the Maine Department of Labor (MDOL) to undertake a study of logging
practices in the Maine Woods. The cost of the study was underwritten by the US Department of
Labor (USDOL), which along with the MDOL continually monitored and guided PAC/IRG’s
research effort.
To wit, the study was to focus on two key areas:
1. Wages and working conditions for logging professionals in Maine; and
2. The effect of the Federal H-2 bonded labor program on Maine woodsworkers* and
the overall Maine economy.
* Please note that, for the purposes of this study, “Maine woodsworkers” incorporates both US-
born and visa-holding Canadian citizens. The status and conditions relevant to Maine
woodsworkers are herein contrasted to those of the “Canadians” who work in the Maine Woods.
In this context, “Canadians” are H-2 bonded laborers only. With regard to their right to work in
Maine, visa-holding Canadians, whether they reside on this side of the border or not, are entitled
to the same rights and privileges as “US workers” under the H-2 regulations.
PAC/IRG’s approach involved over eight months of secondary research; interviews with
industry experts; interviews in the field with loggers and logging contracting firms; telephone
interviews with loggers, non-loggers, and logging contracting firms; and analysis and writing
incorporating thousands of hours of labor. As the reader will note, the results begin with a
thorough background of logging in the Maine Woods and continue with a topic-by-topic
breakdown of the results of the telephone and personal interviews.

Pan Atlantic Consultants/The Irland Group November 18, 1999
Page: 10
The centerpiece of this analysis, however, is a series of 10 hypotheses generated as a
result of so-called “strategic interviews” conducted with influential and representative parties
across the spectrum of the Maine Woods logging economy – landowners, loggers, contractors,
academics, regulators, and relevant association executives. Each of the 10 Hypotheses was
subsequently tested in the field through querying dozens of logging contracting organizations
and hundreds of Maine logging workers; in a few cases, marshaling and analyzing an extensive
body of secondary-source literature was the answer to “testing” a hypothesis. The study
concludes with a series of recommendations and conclusions relevant to MDOL policies and
procedures tied to its administration of the H-2 program.
This study incorporates the findings of a grand total of over 500 interviews and surveys,
including over 20 strategic interviews, 290 logger surveys, 81 contractor surveys, and 125
surveys of non-loggers.
The steps in PAC/IRG’s research methodology are highlighted in the table on the
following page, and are explained in further detail in a section in the appendices concerning
methodology which accompany this report.
Pan Atlantic Consultants/The Irland Group November 18, 1999
Page: 11
Research Methodology Secondary-Source Research. PAC/IRG investigated an extensive series of historical data sources, including MDOL and USDOL records, workers’ compensation premium rate histories, Certified Logging Professional (CLP) program literature, etc. Strategic Interviews. PAC/IRG conducted strategic personal and telephone interviews with landowners, regulators, relevant academics and trade associations, and a small sample of contractors and individual loggers to establish a qualitative “baseline” of facts pertinent to the logging industry in Maine. From these, PAC/IRG was able to establish its hypotheses to test in quantitative field research. Personal Interviews with Logging Contractors and Workers. Though the basis of these interviews was a lengthy series of survey questions centering on employment in the Maine Woods, the face-to-face format of these interviews allowed the opportunity for additional, qualitative commentary as well. PAC/IRG has attempted to faithfully recreate the essence of both the quantitative and qualitative portions of the interviews in these project results. Telephone/Mail Surveys of Logging Contractors, Logging Workers, and Non-Loggers. In order to augment the number of in-person interviews – but in order to also maintain a control on project costs – PAC/IRG conducted 200 worker surveys by telephone and over 50 logging contractor surveys by mail. To establish benchmark data regarding occupational choice and labor supply issues, PAC/IRG interviewed 125 non-loggers in northern Maine towns by telephone. Analysis & Report Writing. With such a large body of existing/background and new data to analyze, a very important component of the study is the digestion of all of the raw data into a form that is more useable (and useful) to policymakers and the general public. Our analysis consists of test hypotheses, basic statistical analysis (i.e., frequencies and cross-tabulations), and econometric analysis to determine the logging labor supply curves (and, by extension, the wage it would theoretically take to bring sufficient US workers into the woods to fill all available logging jobs).

Pan Atlantic Consultants/The Irland Group November 18, 1999
Page: 12
REPORT SYNOPSIS
The issues and controversy surrounding the use of Canadian labor in the Maine Woods
are not new. In fact, this Federally sanctioned practice has endured repeated demonstrations by
US worker coalitions and the scrutiny of at least four major policy studies in only the last forty
years.
This study is the most ambitious in scope to date. It brings to bear extensive secondary
and primary data and analysis regarding logging employment, wages/compensation issues, and
working conditions. Further, it examines economic issues of labor supply and occupational
choice and attempts to define the labor supply curve, including defining the wage that would
theoretically draw sufficient US workers to fill all current woods jobs.
In establishing and testing 10 categorical hypotheses, this study goes beyond a
presentation of relevant variables to establish the causal linkages between them. On this basis,
informed policy decisions regarding the H-2 bonded labor and related programs can be
developed and implemented.
The results of this eight-month study -- The Maine Logging Industry and the Bonded
Labor Program: An Economic Analysis -- are organized into four sections. The first two
sections, “Background” and “The Political Economy of Logging in Maine,” summarize our
findings with respect to employment, wages, working conditions, and the key actors impacted by
the H-2 Program -- the workers and contractors. The third section, “Hypotheses,” gives an
overview of our 10 hypotheses, analyzes key issues, and details our decisions for accepting or
rejecting each of the hypotheses. The fourth and final section contains our primary
recommendations regarding the continuation and administration of the H-2 and related programs.

Pan Atlantic Consultants/The Irland Group November 18, 1999
Page: 13
I. Background
Historians have recorded the presence of Canadians in the Maine Woods for over 150
years. The scale of logging operations -- and consequently of the work crews necessary to
harvest the wood -- has at times been much larger than today’s industry in terms of marshaled
manpower. Wood flows evolved to today’s mix of incoming workers and logs which leave
Maine to supply Canadian sawmills and pulpmills.
In reaction to chronic labor shortages of US workers in the woods, four major studies
were commissioned to examine the impact of Canadian labor on various aspects of Maine’s
economy. The earliest dealt with here, out of Bowdoin College’s Public Affairs Research Center
in 1968, called for an end to the H-2 Bonded Labor Program. Others examined means for
improving the image of the logging industry and facilitating mechanization for the creation of
“better” (if fewer) jobs.
II. The Political Economy of Logging in Maine
The well-being of the logging industry depends on the economic well-being of the
lumber and paper manufacturing industries, which are mature and also cyclical industries,
subject to relatively low profitability. Moreover, it is important to recognize that the evolution
of the logging industry in Maine is somewhat unique.
The proximity of large amounts of labor and horses (followed by skidders) to the
forestlands, in combination with large fixed investments (i.e., mills) created a stasis in terms of
Maine’s logging technology paradigm until the 1970’s. Though much of the rest of the country
had mechanized by that time, Maine only fully left the horse and river-driving era during that
decade. (It is interesting to note that one of our survey respondents still logs with a horse.)

Pan Atlantic Consultants/The Irland Group November 18, 1999
Page: 14
Poor stock market performance in recent years in the forest products sector has increased
management pressures for cost-cutting; that factor plus a weak market for pulpwood in Maine
have combined to create steadily rising cost pressures on landowners, which have translated into
cost pressures on logging contractors and their workers. Indeed, production, logging
employment, and total “covered” wages (i.e., wages subject to unemployment insurance) are
down in the period 1985-98, even as employment in mills and the manufacturing sector have
been increasing.
Most northern Maine counties have seen slow population growth since 1980, with the
exception of Aroostook County, which has seen its population fall continuously since that time.
Aroostook County, of course, is where much of the North Woods logging takes place. During
the same period, Quebec’s unemployment rates have also been high, but falling.
How many loggers are there in Maine? Estimates vary from as few as 2,411 (Census of
Maine Manufactures) to 3,800 (Professional Logging Contractors of Maine). Based on our
analysis, we accept a current figure in the 3,500 to 3,700 range -- a number which is declining
with each year due to retirement of both US and Canadian workers and too few young loggers to
replace them. [Our estimate of this year’s actual bond population in Maine would amount to
between 10% and 12% of the total workforce.] We find it important to note here that there are
varying distinctions as to how US labor law treats Canadian workers. Under US labor law, only
bonded workers are treated differently than US workers, whereas Canadian visa-holders are
accorded the same rights as US workers. Adding “visas,” both those resident in Maine and those
who commute daily or weekly from Canada, would approximately double the number of
“Canadians” in the Maine Woods.
Based on our sample of 173 worker interviews, the average logging worker is in his early
40’s, has worked in the woods for his whole career, has lived in the same area for most of his
life, and has two other family members also in logging. He works an average of 41 weeks a
year, 5 days a week, 10 hours a day, and commutes an hour each way to work -- and for this he
earns on average $31,505 per year in gross logging income.
Regional differences, as well as differences between US and Canadian residents, play a

Pan Atlantic Consultants/The Irland Group November 18, 1999
Page: 15
role in North Woods logging. The following table summarizes the means for loggers by
nationality and according to one of three regions: the northern North Woods (nearest the
Canadian border), the southern North Woods (a strip running across the middle of the state from
New Hampshire to Washington County), and Quebec, Canada.
Geographic Differences -- Augmented Sample
North South Canadian
Number years total experience 19.9 21.7 28.2
Age 40.3 41.9 46.4
Years schooling 12.2 12.2 8.4
Average weeks/year 43 45 37
One-way time to work (mins.) 59 52 79
Nights/week 1.47 0.37 2.73
Percent reporting no overnight 48 85 20
Gross annual income from logging ($k) 33.7 39.6 28.7
Non-overtime wage/hour 11.86 12.00 11.98 N= (46) (38) (11)
Percent CLP 74 82 94
Source: PAC sample of 290 loggers, contacted in person and by telephone.

Pan Atlantic Consultants/The Irland Group November 18, 1999
Page: 16
Placing the average logger’s annual earnings in context involves examining those
earnings’ comparative worth over time. The following chart demonstrates that, for most of the
past 20 years, real wages have steadily declined. Since 1995, however, the wage has actually
increased in real terms, most likely based on the kinds of new, higher-paying jobs attendant to
mechanized logging operations. The second chart demonstrates mechanization’s markedly
increased output per worker for logging and other wood products industries.
Sources: MDOL, Woods Wage Survey; and
Maine Composite Woodsworker
Wage and Real Wage, 1982-98
198283
8485
8687
8889
9091
9293
9495
9697
98
13
12
11
10
9
8
7
6
MDOL Comp. Wage
Real Comp. Wage
Econ. Rept. of the President, Table B-62.

Pan Atlantic Consultants/The Irland Group November 18, 1999
Page: 17
Census of Maine Manufactures
(Tho
usan
ds)
Value of Product Per Worker
1975 1980 1985 1990 1996
32030028026024022020018016014012010080604020
Manufacturing
Durable Goods Lumber & Wood
Logging
Furniture & Fixtures
Paper
The following table indicates one of the key factors in the comparison of Canadians and
US workers -- gross annual income -- and the distinctions in our sample.
Reported Gross Annual Income from Logging ($US)
Canadian US & Dual Below $10,000 1.0% 0.0% $10-20,000 6.0% 30.0% $20-30,000 40.0% 38.0% $30-40,000 35.0% 19.0% $40-50,000 11.0% 2.0% $50,000+ 7.0% 11.0% N= 72 47
Source: PAC Worker Survey.
Pan Atlantic Consultants/The Irland Group November 18, 1999
Page: 18
Loggers of any nationality receive few fringe benefits, with a few key differences
between Canadians and US workers. Canadians are more likely to receive disability coverage,
though twice as many US workers as Canadians report receiving health insurance. US workers
generally receive better vacation, sick leave, holiday, and retirement benefits than their Canadian
counterparts, according to our sample. US workers, in general, appear more likely to perceive
differences between themselves and Canadians in terms of benefits received. Approximately
one-third of US workers surveyed suggest that there are differences. The Canadians surveyed,
meanwhile, believed that everyone is treated similarly with regard to benefits.
Logging workers and non-loggers alike are very unlikely to recommend logging as a
career for their children. Logging contractors, however, are somewhat more optimistic -- fully
one-third of those contractors surveyed did or would have encouraged their children to become
loggers, an approximately 50% greater proportion than that of workers. At the same time, 70%
of these contractors report that their profits have been reduced at least “somewhat” over the
course of the 1990’s.
Finally, new types of heavy equipment are becoming increasingly common in the
mechanized North Woods. The mechanized production paradigms and the heavy equipment
they entail include teams of feller-bunchers, grapple skidders, and delimbers; and cut-to-length
processors and forwarders. The more expensive of these pieces of equipment cost in the area of
$300,000, but firms -- and even individual loggers -- own them.
Pan Atlantic Consultants/The Irland Group November 18, 1999
Page: 19
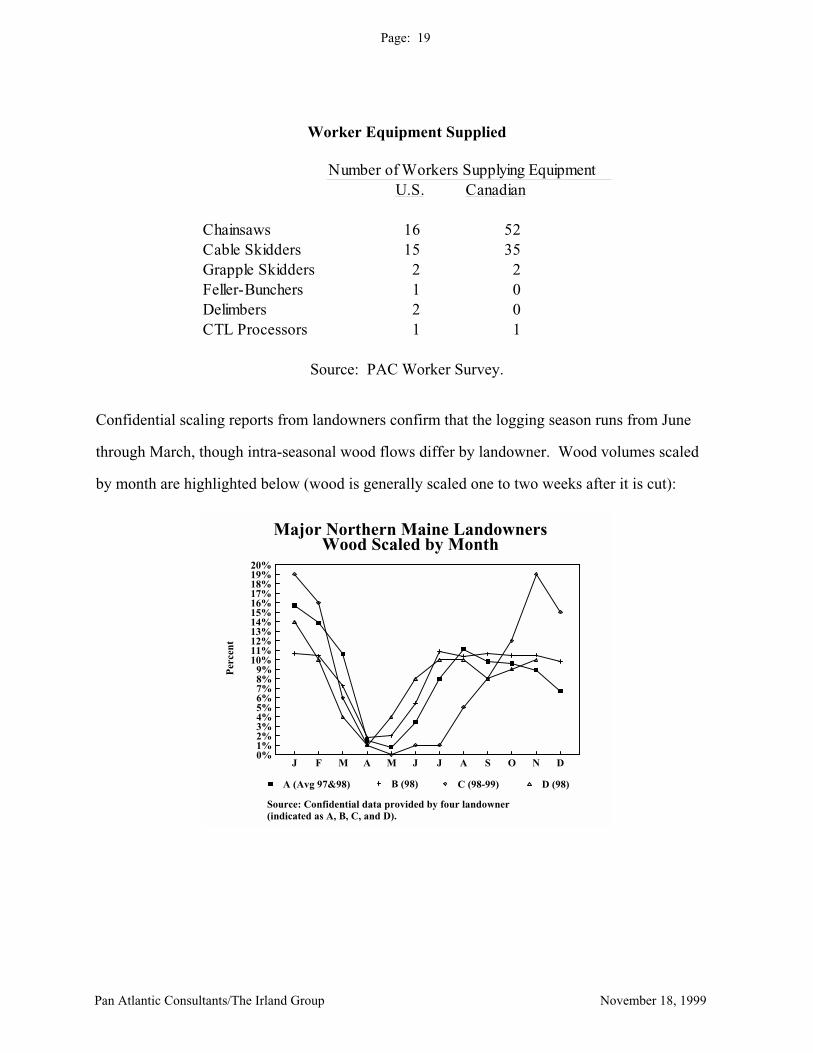
Worker Equipment Supplied
Number of Workers Supplying EquipmentU.S. Canadian
Chainsaws 16 52 Cable Skidders 15 35 Grapple Skidders 2 2 Feller-Bunchers 1 0 Delimbers 2 0 CTL Processors 1 1
Source: PAC Worker Survey.
Confidential scaling reports from landowners confirm that the logging season runs from June
through March, though intra-seasonal wood flows differ by landowner. Wood volumes scaled
by month are highlighted below (wood is generally scaled one to two weeks after it is cut):
Per
cent
Major Northern Maine LandownersWood Scaled by Month
J F M A M J J A S O N D
20%19%18%17%16%15%14%13%12%11%10%
9%8%7%6%5%4%3%2%1%0%
A (Avg 97&98) B (98) C (98-99) D (98)
Source: Confidential data provided by four landowner (indicated as A, B, C, and D).

Pan Atlantic Consultants/The Irland Group November 18, 1999
Page: 20
III. Hypotheses
Whereas Parts I and II of this report provide historical context and descriptive statistics
regarding the Maine logging industry, Part III lays out a series of 10 leading questions
representing categorical hypotheses about the logging industry, including the degree to which the
H-2 program has affected it. Collectively, these hypotheses tell the story of logging in Maine
from a labor economics point of view.
The 10 hypotheses are grouped according to the following topics:
--Hypotheses 1 and 2 address the role of technological change.
--Hypotheses 3 and 4 examine how market structure has set the parameters for
the positions of the major actors in the Maine logging industry today.
--Hypothesis 5 explains the pivotal role of geography.
--Hypothesis 6 analyzes the effects of public policy on the industry, and the
impact of industry structure on public policy.
--Hypotheses 7 and 8 consider the possible effects of the H-2 program on US
workers and the Maine economy.
--Finally, Hypotheses 9 and 10 answer key questions regarding occupational
choice and labor supply with regard to US workers and the logging industry.
The Role of Technological Change
HYPOTHESIS 1: Did Maine Experience Late Mechanization Compared to Other U.S. Timber-
Producing Regions?
The purpose of including this hypothesis is to give the context within which Maine has
experienced extremely rapid and dislocating change.

Pan Atlantic Consultants/The Irland Group November 18, 1999
Page: 21
HYPOTHESIS 2: Did Rapid Technological Change Lower the Demand for Labor in Logging
and Place Downward Pressure on Incomes for Some Workers?
Historically, there has been a clear trend toward fewer loggers earning less income.
While previous studies have also made this point, they have not attempted to analyze the long-
term dynamic by which rapid technological change leads to these outcomes.
On the basis of a high degree of correspondence between changes in logging productivity
and technology, on the one hand, and generally decreasing employment levels and income, on
the other, we provisionally accept that rapid technological change in the industry has lowered
demand for labor while also reducing incomes for some categories of workers.
Market Structure
HYPOTHESIS 3: Does Market Structure at the Landownership and Log-Buying Levels Affect
the Conduct and Performance of the Logging Labor Market?
Issues of importance to the Maine logging industry are inextricably linked with related
industries in the wood products supply chain. The market structure of these intersecting
industries affects the conduct and performance of the logging labor market.
Key in our analysis is evidence that, historically, many market imperfections have
existed. In particular, concentrated markets have resulted in muted competitive pressures.
"Implicit contracting" has tended to yield extremely stable landowner-logger-mill relationships.
The descriptive and statistical evidence supporting this description of the marketplace is,
in our opinion, persuasive.
HYPOTHESIS 4: Do Industrywide Factors Place Maine Landowners and Loggers Under Cost
Pressures?
This hypothesis explores in great detail how, in an environment of severe cost pressures,
concentrated landownership and imperfect markets allow for a double-squeezing of the profits of
logging contractors while also exerting significant downward pressure on the real wages of
loggers.
Pan Atlantic Consultants/The Irland Group November 18, 1999
Page: 22
To document the wage and profit squeeze in the industry, we analyze the inter-
connectedness of costs, pricing decisions, and profits of three relevant economic agents
(landowners, contractors, mills). The economic technique employed is a "mark-up pricing
representation" of the relevant price and cost-profit nexus, and is based on secondary and
primary statistical data.
As a result, it is shown that Maine loggers have felt the effects of a real-wage squeeze
that is large even in comparison to the real-wage declines experienced in the paper and sawlog
industries and in the national economy.
While acknowledging that the causes of this situation are multiple, we accept that
industrywide factors have placed landowners and loggers under severe cost pressures.
Geography
HYPOTHESIS 5: Is Geography the Primary Factor in Explaining Employment of Canadian
Workers in the Maine Woods?
This hypothesis has formed the centerpiece of several previous studies. Statistical and
anecdotal evidence on the historical use of bonds and workers’ willingness to commute or stay
over at distant cutting sights lead us to the conclusion that geography deserves significant weight
as a cause for the Canadian labor situation in the Maine Woods.
It is important to note here that this hypothesis does not attempt to describe a
counterfactual situation of no Canadian bonds in Maine, nor does it suggest a “reserve wage” at
which US workers may be willing to endure greater commuting distances to cutting sites.

Pan Atlantic Consultants/The Irland Group November 18, 1999
Page: 23
Public Policy
HYPOTHESIS 6: Does Public Policy Affect the Shape of the Industry?
This hypothesis considers the role that programs such as Workers’ Compensation (WC)
have played in the evolution of the Maine logging industry.
A. High Workers’ Compensation (WC) rates in the early 1990's created an incentive to
mechanize and eliminate company operations.
B. The effectiveness of social protections, such as OSHA regulations and WC coverage,
is impacted by the shape of the industry.
There are sufficient qualitative, anecdotal, and narrative arguments by which to accept
the hypothesis that WC rates were important contributors to mechanization and the shift toward
more contracting and the near-elimination of company operations. In addition, it appears that the
effectiveness of social programs, such as WC, is impacted by industry structure -- and in logging
by the prevalence of the so-called "independent contractor.”
Effects of H-2
HYPOTHESIS 7: Has the H-2 Program Reduced Incomes and Employment Levels of U.S.
Workers?
Our approach to this complex question is to establish and explore five levels of labor
market effect (LME). Not all arenas of LME are within the scope of this study, so some are only
briefly referenced here. The relevant US labor market is impacted by the following factors:
1. The marginal LME of a single Canadian worker entering the US to work.
2. The total LME of the existence of the H-2 program.
3. The total LME of the admittance of any Canadian workers (visas, dual citizens) to the
United States to work.
4. The LME of Canadian equipment working in the Maine woods.
5. The LME of exported logs.

Pan Atlantic Consultants/The Irland Group November 18, 1999
Page: 24
In the final analysis, we believe that the main hypothesis, that the H-2 program has
reduced incomes and the employment level of US workers, has been true historically. More
specifically, it was true in the 1950’s and 1960’s when the bonded labor workforce represented
one-third to one half of the total logging workforce in Maine. We believe that the H-2 program
at present is a secondary cause of economic harm to workers within select geographies, such as
the St. John Valley. The effects of mechanization and declining demand for woods labor appear
to be more profound causes of economic harm to these workers. Finally, we do not believe that
the H-2 program causes measurable harm to logging workers on a statewide basis.
HYPOTHESIS 8: Has the H-2 Program Caused Negative Impacts on the Maine Economy?
Understanding the effects of the H-2 program on the Maine economy involves different
issues, but some of the same complexities, as understanding the effects on US workers.
The theoretical arguments are similar to those governing our analysis of labor market
effects. Determining if and to what extent the H-2 program injures the Maine economy requires
summing across a number of positive and negative impacts at different market levels.
We find that there is evidence of a net negative effect from the H-2 program on the
Maine economy. For example, one important measure of negative effect is lost wages (# bonds
x annual earnings), an amount equal to less than $13 million per year. Unemployment Insurance
(UI) payments to recipients in Quebec, which exceed industry contributions, also comprise a
welfare loss to the State of Maine. In the aggregate, we can report that these losses do not
constitute a large overall dollar amount, even in relation to the economic activity of Aroostook
County alone. Moreover, these figures cannot be taken as an accurate estimate of the net effect
to Maine if the H-2 program were abolished, as some percentage of bonds’ wages are indeed
spent in Maine, for example. The above-noted welfare losses are constructed in a static sense
only -- that is, on an H-2/no H-2 basis. In reality, if the H-2 program were eliminated, wage
rates would likely change, the amount of wood cut in the State would likely change, and so on,
leading to a different net effect.
An irony worth noting here is that over the past 25 years, as the number of loggers

Pan Atlantic Consultants/The Irland Group November 18, 1999
Page: 25
employed in the North Woods has declined, the bulk of the economic adjustment has been felt in
Quebec (and to a lesser extent in New Brunswick), not in Maine.
Occupational Choice and Labor Supply
HYPOTHESIS 9: Would Occupational Preferences Be Difficult to Overcome in Seeking to
Attract Additional U.S. Workers to the Logging Industry?
One premise of this study is that it is desirable to attract more US workers into the Maine
logging industry. However, occupational choice -- the willingness of various groups of people to
supply their labor to various professions -- is a complex question, not dependent solely on wage
levels.
Based on our survey results, we find that the occupational preferences of potential US
loggers are at odds with attracting them into the industry. In particular, while there are positive
indications among current loggers that they hold their work in high esteem, like the outdoors,
and enjoy applying their physical and manual skills to physically demanding tasks, these factors
are countered by a distaste for seasonal work, nights spent away from home, and requirements
for up-front cash outlays for training and equipment.
Non-loggers would be difficult to recruit for logging based on an aversion to important
factors in logging work, including physical labor, the risk of serious physical injury, and nights
spent away from home. In general, the logging profession would also need to improve its
standing relative to other professions.
HYPOTHESIS 10: Is the Supply of U.S. Labor to the Maine Logging Industry Inelastic Relative
to the Wage Rate?
According to our survey and econometric analysis, the answer to this question is “yes” --
in the long run, the supply of labor to logging is unlikely to change even given a higher wage
rate (i.e., the elasticity of labor supply is not statistically different from 0).
This means that, owing to a variety of factors including geography, it could prove very
difficult to increase the supply of US workers to the Maine logging industry. This situation is
Pan Atlantic Consultants/The Irland Group November 18, 1999
Page: 26
further exacerbated by our occupational choice findings (noted in Hypothesis 9), which indicate
that non-loggers do not generally find the profession attractive.
IV. Program Recommendations
This study contains several recommendations to improve administration of the Federal H-
2 regulations as they apply to logging. Most are specifically targeted to the annual Woods Wage
Survey conducted by the Maine Department of Labor and aim to reflect more of the reality or
“ground-truth” of the logging industry in the administration of policy. These recommendations
include:
• Discontinue surveying for piece rates; setting an equivalent minimum wage should suffice.
Be aware of a bias towards always trending prevailing wage rates upward. Competitive market
forces may periodically dictate downward-trending prevailing wage rates for some job
classifications as well.
Revisit the policy distinction made between “employees” and “contractors” -- this may work in
other industries, but will only create increasing confusion in logging. More importantly, it
will continue to allow hundreds of Maine loggers to go statistically unrecognized in terms of
wage, hour, and employment surveys.
Change select MDOL job classifications. At present, these classifications are misleading in
terms of the business realities faced by logging employers. In similar fashion, job
classifications in the Woods Wage Survey include many which are no longer filled by bonds
at all.
Eliminate or refine the “all-around logger” designation. There is a very common type of logger
acting as a one-man chainsaw/skidder operator for manual felling operations; he is usually
paid on a piece rate. However, mechanized operators are specialists; though they both
operate and perform maintenance on their machines, they do not switch from one type of
machine to another, or from manual cutting to machinery operation.
Change the geographic scope of industry surveys. Upstate New York, Vermont, and New
Hampshire are currently combined with Maine in surveys and findings. In fact, labor market

Pan Atlantic Consultants/The Irland Group November 18, 1999
Page: 27
dynamics in these regions are very different -- a more appropriate designation might be to
subdivide Maine into northern and southern zones.
Improve the sampling process by reviewing lists every three years or so. The Department of
Conservation’s Forest Practices Act reports are a good way to supplement ES-202 employer
listings.
Continue with the reinstituted program of employer audits in conjunction with H-2 enforcement.
Employers who believe they have a one-in-three or one-in-four chance of being audited in
any given year are more likely to follow rules closely.
As a part of a regular auditing program, conduct annual counts of the number of bonded workers
actually employed during the prior logging season. This could be completed through
employer surveys each spring “mud season.”
Terminate the so-called “pooled interview” process for the logging industry. It serves no
practical purpose in recruiting loggers, and wastes employers’ and government time and
money. Word-of-mouth advertising and recruiting potential new loggers at their homes and
schools are the most effective methods; the potential applicant pool, as small as it may be, is
not found at pooled interviews.
Endorse and continue to support the Certified Logging Professional (CLP) Program. CLP has
been an effective means of reducing once-onerous workers’ compensation premium costs,
and seems to be running well without State (or Federal) Government regulation or
intervention. It should not only be left alone but should be officially encouraged in its
mission to improve the levels of safety and training of Maine loggers. We recommend
continuing the MDOL program of full or partial scholarships to the CLP program. In
addition, because CLP can now be stated to be a “prevailing practice” in the logging
industry, MDOL should enforce its implementation among H-2 employers. Such
enforcement could accompany augmented auditing and field inspection efforts to ensure
general H-2 regulatory compliance.

Pan Atlantic Consultants/The Irland Group November 18, 1999
Page: 28
PART ONE
BACKGROUND

Pan Atlantic Consultants/The Irland Group November 18, 1999
Page: 29
THE ORIGINS OF CANADIAN WOODS LABOR IN MAINE
Historians note that Canadians appeared at an early time in Maine logging operations. In
his history covering the 1820-1860 period, Wood notes that “the labor supply consisted for the
most part of native sons, to whom were added men from the neighboring Canadian provinces”
(1961, p. 191). The names of operators mentioned in his book include only a few of obvious
French provenance. Coolidge places the beginning of substantial Canadian employment in the
Maine woods in the 1830’s (1963, p. 521). Others note that the 1850-60’s saw a significant shift
toward using more Canadians. In the early to mid 19th century, workers from New Brunswick,
PEI, and even Newfoundland appeared in the Maine woods, and operations in the northerly
borderlands were only for local markets. Judd quotes an 1850 reminiscence observing that most
of the woodsmen were immigrants from England, Scotland, and Ireland at that time, but quotes a
1904 study showing that in three camps, there were 26 Maine loggers and 91 Canadians (1989,
p. 110). Part of the explanation for this is that operations on the St. John and Allagash, near the
Quebec border, began to accelerate in this period as larger mills were built downstream on the
St. John. But the use of Canadians spread rapidly beyond the border area, as Smith reports:
“most of the bark peelers at Winn in the summer of 1873 were Frenchmen from Madawaska and
Edmunston” (Smith, 1972, p.19). Smith notes that as early as the 1870’s and 80’s, complaints
were seen in editorial columns alleging that the Canadian workers were taking jobs from
Americans.
Speaking generally of northern New England, Pike, without being specific as to dates,
noted that the French Canadians “swarmed into the woods until frequently a camp would not
have an English-speaking woodsman in it” (1967, p. 59). By the mid 1920’s, according to Judd
(1989, p. 195), “about 85% of the men working in the western Aroostook woods were from
Quebec.” The pattern of Canadian contractors bringing along a workforce with them was
established at an early date, solving a recruitment problem for landowners and timber buyers. In
some periods, labor agencies in northeastern cites were used to recruit workers, but the results
were often unsatisfactory (Judd, 1989, p. 193-194).

Pan Atlantic Consultants/The Irland Group November 18, 1999
Page: 30
The scale of the recruiting and management effort involved in woods contracting in the
19th century was substantial. The histories repeatedly mention operators going into the woods
with up to 300 men and 100 horses, all of them needing to be recruited, fed, and transported into
and out of the woods. Camps of 100 men and 40-60 horses were common, and log drives
commonly employed up to 150 men. By organizing and managing these large forces of men and
animals, and all of their support equipment and supplies, the contractors were running large
businesses and relieving landowners and wood users of a substantial managerial task.
After the Civil War, the state of Maine saw a slight reduction in population, and the
farming economy of the regions surrounding the Wildlands began to shrink. Maine farmland
peaked in 1880, and the peak of the Penobscot log drive was 1872. Farming expanded until
much later in the potato country of Aroostook, but on an increasingly mechanized basis. The
shrinkage of farming materially reduced the supply of workers available for winter season
logging work. The impact of this shrinkage is also indicated by the fact that logging operations
operated farms in the wilderness, as at Seven Islands and Grant Farm, to support the horses and
camps, and they imported feed and provisions from Quebec. During this period, the population
of Quebec not only continued to increase but supplied a large volume of immigrants to the
milltowns of Maine and southern New England. As a result, the shift in the composition of the
woods workforce had a basis in demographic factors. As historian Charles Clark observes,
“Yankee farmers and woodsmen moved out faster than French-Canadian and European
immigrants replaced them” (1977, p. 152).
The State’s all-time peak of lumber production was in 1909, coinciding with the national
peak. This occurred at a time when the paper industry was growing rapidly, with its need for
more labor intensive wood bucked commonly to four foot lengths and often peeled in spring.
Thus, labor demand in these years would have been very high.
At a later time, Scandinavians and eastern Europeans were commonly found in the Maine
woods, their numbers dwindling after early 1920’s immigration restrictions were enacted (Pike,
1967, p. 59; Smith, 1972; Judd, 1989, p. 192). During the 1920’s, there was considerable debate
over Canadians in the Maine woods and federal officials were involved (Judd, 1989, p. 194-196).
Pan Atlantic Consultants/The Irland Group November 18, 1999
Page: 31
In the war years, wartime labor shortages led to the extraordinary practice of using prisoners of
war as woodsworkers. Some 2,000-2,500 German prisoners were employed in the Maine woods
during that time. By the time of the Bowdoin PARC study in 1968, it was accepted that the
workforce in the Maine woods was about 75% Canadian. This workforce totaled some 10,000
workers. In addition to the border woods, Canadians were also working in Washington and
Hancock Counties, long distances from Quebec. This suggests that not only geography was
involved.
The historians do not clearly resolve the question of impact on US workers. They note
the controversies over Canadian woodsworkers and the claims that American could fill all
available jobs but do not resolve the question. How much of an increase in wages, or
improvement in working conditions would have been required to fill all of the jobs with Maine
residents? Since the actual numbers of workers in each period is not known with any precision,
it may never be possible to resolve the specific connections between labor needs and
demographic factors.

Pan Atlantic Consultants/The Irland Group November 18, 1999
Page: 32
Figure 1
LOGS AND WORKERS, CHANGING PATTERNS
A: 1840'S B: 1890-1909
= Mills= Logs= Workers
M
M
M
M
M
M
M
M
M
M
To St.
John
LOGS AND WORKERS, CHANGING PATTERNS
C: 1960's D: 1980 - Present
= Mills= Logs= Workers
M
M
"GoldenRoad"
Driveends1967
Driveends1976
M
M
M
M
M
M
M
M
M
M
M

Pan Atlantic Consultants/The Irland Group November 18, 1999
Page: 33
Wood movement out of Maine is a practice with long historical precedent. Rails did not
reach northern Aroostook until 1885, and even then was of little service to the wildlands. Logs
moved northward by river-drives down the Aroostook, Allagash, and St. John to mills on both
sides of the river, as far downstream as St. John, New Brunswick. By 1909’s lumber production
peak, the paper mills had assumed control of much of the supply and rearranged the logistics of
the industry. For a time, shipments of wood from northern Maine went to mills in New York.
By this time, the dominance of Quebec contractors and workers in the Wildlands was complete.
By the 1960’s, the sawmilling industry was fairly small and wood utilization was
dominated by the paper industry. This is indicated by the focus of the Bowdoin study on
pulpwood cutting. At this time, major log exports had not yet arisen, though a sawmill industry
was growing on the Quebec border. In the 1980’s and 1990’s, the pattern of heavy log exports to
Quebec mills, cut and hauled by Canadian crews, was well established. The chips from much of
this wood returned to feed the state’s pulp mills. A large sawmill industry had been
reestablished using highly efficient mills. A lesser flow of wood now moved to New Brunswick,
as part of a complex pattern in movements of sawlogs, pulpwood, chips, biomass, and other
products.

Pan Atlantic Consultants/The Irland Group November 18, 1999
Page: 34
SYNOPSIS OF KEY POINTS FROM
PRECEDING MAINE WOODS STUDIES
An important part of the history of Canadian labor in Maine is the work which has
preceded the present effort to assess the precise impact of Canadians on the economic well-being
of “US workers.” In this case, many articles and reports have shed light on aspects of bonded
labor in Maine, but four studies, spanning over thirty years, stand out in particular. These four
studies are listed below in chronological order, and are then briefly summarized:
1. Bowdoin College Public Affairs Research Center’s Study of Problems Relative to
Obtaining a Continuing Supply of Domestic Workers for Woods Operations in Maine,
June 1968 (herein referred to as PARC).
2. Robert S. Bond’s Bonded Canadian Labor in New England’s Logging Industry,
January 1977 (herein referred to as Bond).
3. Jonathan Falk’s The Organization of Pulpwood Harvesting in Maine, February 1977
(herein referred to as Falk).
4. Richard Donovan’s and Elizabeth Swain’s Maine Woods Labor Study, 1984-85, May
1986 (herein referred to as Donovan & Swain).
A summary of the findings and recommendations from these studies follows, as well as a brief
analysis of similarities and differences across the authors’ sets of conclusions and
recommendations.
PARC (1968)
1. At the Federal level, USDOL policy on the importation of foreign labor should be
internally consistent for all industries and should be clearly stated. A 10-year policy
statement is desirable. Also at the Federal level, the complete elimination of the
bonded worker program within 5 years is recommended.
2. At the State level, job counseling in high schools and vocational schools should be
greatly expanded, emphasizing worker responsibility and enthusiastic work attitudes.

Pan Atlantic Consultants/The Irland Group November 18, 1999
Page: 35
Maine’s manpower policy and needs should be articulated in a 10-year statement, with
annual review. Likewise, Maine planning should focus at least five years ahead rather
than on immediate employment opportunities. Also at the State level, simplify local
office procedures to allow for easier compliance. Finally, the State should encourage
the development of a two-year vocational training program at the University of Maine
School of Forestry.
3. Industry should strengthen in-state and New England area recruiting, increase the
mechanization of harvesting, and work toward a greater integration of the woods and
mill labor force. Additionally, realistic promotional statements on the nature of woods
work need to be developed, and lumber camp life should be improved. Finally, an
inter-industry “permanent community” might be developed in northern Maine to
utilize new town planning concepts and to encourage the formation of an integrated
economic base including wood harvesting, wood products manufacturing, and woods
recreation.
Bond (1977)
1. The Canadian bonded labor program should not be terminated until it can be
established that the Maine timber economy can function without this supplemental
labor force. However, the State should maintain tight control over the program and
continue cooperation with the INS and IRS. Furthermore, the certification process is
too time consuming, and need not involve the regional ETA or USDOL head office.
Maximum certification time should not exceed one month.
2. Newspaper advertisements and listings in unemployment offices are not a part of the
job search in the logging industry and informal contacts should be emphasized instead.
3. The Federal Government should attempt to pass legislation that would restrict
Canadians’ ability to be primary timber harvesting contractors, as alien bonds are most
often hired by Canadian-owned logging firms. Firms employing predominantly
Canadians may unintentionally create an environment that deters domestic workers.

Pan Atlantic Consultants/The Irland Group November 18, 1999
Page: 36
4. The logging labor force is severely undercounted in statistics, and a study should be
undertaken to define the structure and conduct of timber harvesting to identify the
number of people involved in supplying wood that are bonds, visa-holders, and
domestics. An estimate of the economic impact of wages paid to bonds that leave the
state should be included.
5. The lack of adequately trained domestic laborers should be redressed through
encouragement of stability among contracting firms (to encourage long-term
planning), better employee benefits, improvements in the working environment and
mechanization of the more arduous logging tasks, and the implementation of
“alternative living arrangements” such as new towns to permit daily commuting to the
jobsites.
6. Additional timber harvesting training programs similar to one offered at the
Washington County Vocational Technical Institute in Calais should be initiated to
bring qualified new loggers into the trade.
7. The annual wage survey is “suspect” in its methodology in that it uses one week in the
fall of the year to estimate annual wages, which gives a poor projection as to actual
annual wages. A study should be instituted to determine the most efficient and
accurate way to arrive at annual estimates of loggers’ earnings.
8. A study should be initiated to measure the effect of Canadian labor on the wages of
domestic workers to determine “if an unfavorable situation prevails.”
9. The fixed and operating costs of chain saws, skidders, and other equipment owned by
employees and hired by the primary producers should be determined, as they affect
minimum payments received by bonded workers.

Pan Atlantic Consultants/The Irland Group November 18, 1999
Page: 37
10. New England’s timber firms are generally willing to hire domestic labor when it is
available. Recruiting bonds is time-consuming and costly, and improving technology
will increase the attractiveness of woods work to domestic workers. The risks of
eliminating the bonded labor program should be carefully weighed against the benefits
before a decision is taken.
Falk (1977)
1. Logging in Maine continues to be characterized by low wages, dangerous working
conditions, and seasonal employment.
2. The extensive use of Canadian labor in the Maine Woods has slowed improvements in
wages and working conditions by vastly increasing the pool of available labor. The
role of Canadian labor in Maine is analogous to that of blacks in the South, where the
large underemployed rural black population has helped depress wages. In the past,
racial divisions have hindered efforts to organize Southern workers.
3. It is possible that organized loggers may succeed in securing improved wages and
working conditions by a combination of direct demands on employers and pressure on
government agencies to eliminate the use of Canadian labor.
4. Wage rates that are likely to prevail in the immediate future, and continuing inflation
of equipment costs, indicate that a large-scale application of mechanical harvesting
will continue to cost more than conventional harvesting with chainsaws and skidders.

Pan Atlantic Consultants/The Irland Group November 18, 1999
Page: 38
Donovan & Swain (1986)
1. During the last 10 years, logging has become increasingly mechanized. Wherever
possible, logging companies have attempted to replace the chainsaw with feller-
bunchers or feller-forwarders. Where successful, it has been because high production
levels could be achieved and the use of large equipment has been possible. However,
the great versatility of the chainsaw, in combination with a wide range of tractors,
skidders, forwarders, etc., continue to make it a versatile, silviculturally appropriate
and cost-effective tool in wood harvesting.
2. The two principal forces behind mechanization are: 1) the prevalence of clearcutting
in the state due to spruce-fir budworm salvage and new large-scale biomass energy
programs; and 2) high rates per person or employee for workers compensation, which
place labor-intensive harvesting operations at a cost disadvantage.
3. It appears that fewer young people are interested in becoming loggers, particularly
manual “chain saw” system loggers. Thus, when production demand rises, greater
reliance will be placed on Canadian labor and regional labor shortages will appear.
Second, workers compensation rates continue to rise rapidly. Safety also remains a
major problem.
4. The State needs to consider ways of elevating the public image of the woods worker.
It could encourage reduction in workers’ compensation rates through various
programs.

Pan Atlantic Consultants/The Irland Group November 18, 1999
Page: 39
5. There are few, formal private-sector training programs that comprehensively address
technical harvesting, safety and business management skills. Public-sector training
programs exist in the northern part of the state but are largely absent in the south.
However, the public sector programs that do exist (at vo-tech institutes and vocational
high schools) focus almost exclusively on conventional semi-mechanized harvesting
systems (chain saws and skidders). The State should consider setting forth a statewide
harvesting training strategy that creates new training programs, clarifies the roles of
the public and private sectors, incentivizes students to become loggers, and sets forth
safety standards.
Brief Comparative Analysis
• The logging industry continues to suffer from an image problem. One of the
issues touched upon in all of these studies over the last thirty-plus years centers on the
ability of the logging industry to attract new workers. Bond and Donovan & Swain
place particular emphasis on the need to revamp and improve recruiting efforts, not
only for particular jobs with particular firms, but to attract young people to the
industry as a whole. Bond’s suggestion that “traditional” recruiting methods such as
newspaper advertisements and job service center announcements are ineffective has
not given rise to new techniques, and the problem of recruiting continues to plague the
industry 22 years later.

Pan Atlantic Consultants/The Irland Group November 18, 1999
Page: 40
• Arguably, concerns raised in past studies about training, safety, and workers
compensation have been addressed in the 1990’s through CLP. PARC’s concerns
about a lack of vocational training opportunities and Donovan & Swain’s emphasis on
high workers compensation costs seem to have been remediated as much of the
industry has embraced CLP. Interestingly, the success of the CLP Program at
improving injury/fatality rates and sharply reducing WC costs may tend to forestall
further mechanization in the industry, which all four study authors suggest is critical
to attracting new domestic workers. Therefore, it would seem that the relative severity
of the labor shortage in 2000 and beyond will weigh against the costs of further
mechanization in the economic decisionmaking of logging firms. In this context, Falk
notes the pivotal importance of Canadian bonded labor, which tends to alleviate the
market’s labor shortage, thereby making labor more attractive (i.e., cheaper) than
capital in the production mix. In short, achieving the beneficial safety and training
goals of CLP on an industry level may actually be exacerbating the industry labor
shortage in the absence of more effective recruiting methods.
• All four of the previous studies suggest that further mechanization in logging
would improve the prospects of recruiting younger generations, albeit in the
reduced numbers required by a capital-intensive industry. Further
mechanization, it is suggested, will bring the supply of and demand for labor to
equilibrium. Any measure which forestalls mechanization, in this line of reasoning, is
bad for the industry. Drawing the argument out further, some of the studies suggest
that by supplementing the existing tight market for US workers with relatively cheap
Canadian labor, the H-2 program acts to forestall mechanization by making it
economically feasible for labor-intensive logging methods to persist. As a result,
PARC recommends that the H-2 program be abolished.

Pan Atlantic Consultants/The Irland Group November 18, 1999
Page: 41
PART TWO
THE POLITICAL ECONOMY OF LOGGING IN MAINE
Pan Atlantic Consultants/The Irland Group November 18, 1999
Page: 42
MAINE FOREST PRODUCTS INDUSTRY ECONOMIC
STRUCTURE, CONDITIONS & TRENDS
Issues of importance to the Maine logging industry are necessarily and inextricably
linked with the related industries in the wood products supply chain. The fundamentals of these
related industries, such as pulp and paper, as well as their momentary market conditions are the
backdrops against which our analysis of logging must occur.
Lumber and paper manufacturing are cyclical industries. In addition, they are known as
mature industries subject to chronically low profitability compared to other manufacturing
industries. Further, periodic investment cycles create periods of low prices (Figs. 2 and 3) and
profitability. During these periods, such as the one we are experiencing today, downward
pressure is placed on delivered wood costs and on all other raw material costs. Delivered wood
prices are often cut during downturns. Plant operating rates may decline, leading to reduced
volumes of purchases. Quality specifications may be increased, placing added costs or burdens
on loggers. At the same time as the industry’s customers are benefiting from lower prices, its
suppliers are subject to intensified cost squeezes. During such downturns, logging contractors
lose work for equipment and crews but still have heavy payments to make on equipment. Some
machines are financed with “skip” payments, requiring ten instead of twelve per year, to allow
for the normal spring Mud Season shutdowns.
The economic context for the current conditions in the Maine logging industry is
established by the economic position of the lumber and paper industries, its principal markets for
logs. At present, lumber prices have improved compared to 1998, but the pulp market, a good
indicator for the paper industry, is very weak. Large mills in the southern US are being closed,
and pulp production at Westbrook (Sappi) is being halted. The industry’s performance is
mirrored in the stock market (Fig. 4). Poor stock market performance has generated strong
management pressures for cost-cutting.

Pan Atlantic Consultants/The Irland Group November 18, 1999
Page: 43
Figure 2
Dry 2x4 R/L and Green 2x4 R/L,
Source: EQ&C Database.
$/M
bf
del. Boston, Jan. 1990 to May 7, 1999
199091
9293
9495
9697
9899
May 7
600
550
500
450
400
350
300
250
200
Dry Green
Figure 3
Market Pulp -- Bleached Northern
Source: Prudential Securities.
$/M
etri
c T
on
(Th
ou
san
ds)
Softwood, 1977-1999
197778
7980
8182
8384
8586
8788
8990
9192
9394
9596
9798
99
1.0
0.9
0.8
0.7
0.6
0.5
0.4
0.3

Pan Atlantic Consultants/The Irland Group November 18, 1999
Page: 44
Current conditions in lumber and pulp and paper markets are affecting the industry
nationwide, which has not gone unnoticed in securities markets (Fig. 4).
Figure 4
Trends in Production
Maine is located within the “culture hearth” of the continent’s lumber and paper
industries. As such, its millsites are generally among the oldest in North America, though many
have received large doses of investment in paper machines, pulp ends, and energy systems, not
to mention pollution control facilities. The trends in production show that the growth of both
paper and lumber industries is tightly resource-limited, as well as being constrained by
competition from other regions and continents. Maine’s lumber industry is primarily a softwood
industry, while roughly half of its pulpwood usage today is hardwood.

Pan Atlantic Consultants/The Irland Group November 18, 1999
Page: 45
Figure 5
Maine Lumber Production Estimates
Bill
ion
Bd
. Ft.
1954-1997(e)
Total Softwood Hardwood
183949
591869
7989
991904
914
1924
2934
3944
4954
5964
6974
7984
8994
97(e)
1.41.31.21.11.00.90.80.70.60.50.40.30.20.10.0
Source: 1839-1946, Steer's tables 1, 4, and 5 ff; "estimated" values where available.1947 to date, U.S. Dept. of Commerce, as used in various USDA Forest Service sources,and in Current Industrial Reports, MA 24-T (annual). Maine data for 1980-81, andMaine hardwood 1982-85 are author estimates.
Figure 6
Maine Woodpulp and Paper Production
Source: Atlas of the Resources of Maine, Supplement
M T
on
s(T
ho
usa
nd
s)
1900 to 1996
19005
914
1921
2729
3137
4750
5560
6570
7580
8589
9091
9293
9495
96
4.5
4
3.5
3
2.5
2
1.5
1
0.5
0�����
������������
������������
������������������
������
����
���������
���������
���������
������������
����������������
��������������������
��������������������
������������������������
������������������������
������������������������������
�����������������������������������
�����������������������������������
�����������Woodpulp Paper
Feb. 1987, The Forests of Maine; Current Ind. Rept.MA26A(89)-1 to 1989; and Paper 1991-96 from AF&PA.
Pulp data not available after 1989.
During the period since the 1960’s (when bonds were numerous) to the present, lumber
production has risen dramatically, and paper production has also increased.

Pan Atlantic Consultants/The Irland Group November 18, 1999
Page: 46
Trends in Timber Harvesting
The Maine Forest Service data show totals by major product category for softwoods and
hardwoods (Figs. 7 and 8). They illustrate the large increase in hardwood cut, and the heavy
softwood cutting of the 1980’s in response to the budworm outbreak. The softwood harvest,
primarily from northern Maine, declined significantly after its mid 1980’s peak. This
contributed to a weakening of labor demand in logging, and to pressure on revenues for
landowners.
Figure 7
Maine Hardwood Timber Harvest, 1960-97
Source: MFS Assessment, p. 29; and 1992-95 and 1997
Mill
ion
Cor
ds
196065
7075
8085
9192
9394
9596
97
3.43.23.02.82.62.42.22.01.81.61.41.21.00.80.60.40.20.0
Sawlogs Pulpwood Firewood Total
Wood Processor Report; includes exports but not biomass.

Pan Atlantic Consultants/The Irland Group November 18, 1999
Page: 47
Figure 8
Maine Softwood Timber Harvest, 1960-97
Mill
ion
Cor
ds
4.5
4.0
3.5
3.0
2.5
2.0
1.5
1.0
0.5
Sawlogs Pulpwood Total
Source: MFS Assessment, p. 29; and 1992-95 and 1997Wood Processor Report; includes exports but not biomass.
196065
7075
8085
9192
9394
9596
97
Size of the Wood Products Industry
The principal industries relying on Maine forest products generated some $5.4 billion in
product value in 1996, according to the Maine Department of Labor (Figure 10).
Meanwhile, the shrinkage of employment in logging has resulted in a significant decline
in total wages paid. This is demonstrated in covered employment statistics (based on the
MDOL’s unemployment insurance records) from 1985-98 -- where it can be seen that total
wages fell from $78 million to $62 million (Figure 11) over the time period. This 20% decline is
particularly striking in that it comes during a time when wages for covered employment in
sawmills rose by 32%, and for covered employment in manufacturing by 43%. The term
“covered employment” refers to a category established under US employment security law
wherein employers must provide USDOL with quarterly reports of wages and contributions.

Pan Atlantic Consultants/The Irland Group November 18, 1999
Page: 48
One possible explanation for this trend is that the effect is partly due to shifting workers
from “logging” firms to “trucking” firms (another industry) and from shifting workers from
employee (covered) status to that of “subcontractors” (not covered). The data is not decisive on
this point.
Figure 9
Average Annual Employment in Maine
Source: Maine State Dept. of Labor.
(Tho
usan
ds)
by Selected Industries, 1980-98
198081
8283
8485
8687
8889
9091
9293
9495
9697
98
20
19
18
17
16
15
14
13
12
11
10
9
8
7
6
5
4
3
2
1
0
Lumber and Wood Products, exc. Furn.
Logging
Sawmills and Planing Mills
Furniture & Fixtures
Paper and Allied Products
Pulp Mills

Pan Atlantic Consultants/The Irland Group November 18, 1999
Page: 49
Figure 10
Census of Maine Manufacturers by Major Industry and Industrial Groups, 1996
Value of Gross Average Total No.
(SIC) Industry Product $ Wages $ Wages Workers
24 Lumber & Wood Products 1,230,548,648 233,065,538 23,165 10,061 2411 Logging Camps & Contractors 371,706,552 55,859,294 23,169 2,411 242 Sawmills & Planing Mills 427,808,847 67,282,206 26,891 2,502 243 Millwork & Cabinets 86,093,104 22,910,599 22,008 1,041 244 Wood Containers 23,699,344 5,707,727 18,837 303 245 Wood Buildings & Mobile Homes 37,160,453 8,080,307 18,748 431 249 Miscellaneous Wood Products 284,080,348 73,225,405 21,709 3,373
25 Furniture and Fixtures 127,005,676 34,150,214 25,891 1,319
26 Paper 4,113,594,120 649,787,099 46,107 14,093 262 Paper Mills 3,723,579,469 573,407,245 48,759 11,760 2621 Paper Mills 3,723,579,469 573,407,245 48,759 11,760 265 Paperboard Containers & Boxes 106,784,011 17,905,063 31,634 566
5,471,148,444 917,002,851 95,163 25,473
Source: MDOL, Census of Maine Manufactures.
Figure 11

Pan Atlantic Consultants/The Irland Group November 18, 1999
Page: 50
Number of Wood-Products Industry Firms and Plants
The number of firms engaged in this sector has shrunk dramatically over the years, as
mill sizes and capital requirements have increased. At present, only one paper company operates
more than one mill in Maine, though several operate sawmills. In the early decades of the
century, there were 60-70 paper mills in Maine, not all of them making pulp, and not all of them
relying on wood pulp. A number of them made pulp for sale to others (“market pulp”). Today,
there are only about a dozen paper mills in Maine. Several of these sell market pulp to other
firms or ship pulp to other company plants; several produce no market pulp at all, instead buying
their fiber needs on the open market. There are hundreds of sawmills in Maine, though only a
few dozen account for most of the output.
A convenient measure of firm size in logging is employment size. As noted elsewhere,
many smaller firms have no employees as defined in US labor laws. This means that an operator
who can cut wood using exclusively subcontractors, will have no employees on payroll, and not
be captured in the employment statistics. Most Maine logging firms recorded in the Department
of Labor’s ES-202 database, which contains records for covered employment, are quite small:
361 out of 486 firms listed employ 4 workers or less. Only 7 out of 486 firms employ 25 or
more workers, while some record 0 employees (owners are not employees). While there are
certainly small operations not covered in the 202 data, this picture of employment by firm size is
almost certainly accurate for the industry as a whole.
Geography and the Wood Products Industry
The wood products industry spans the entire state, with no county devoid of logging and
wood products employment (Fig. 12). The log and pulpwood production is concentrated in the
larger, heavily forested counties (Fig. 13). Because of the history of log driving to mills,
however, Aroostook County does not have a pulp mill.

Pan Atlantic Consultants/The Irland Group November 18, 1999
Page: 51
Figure 12

Pan Atlantic Consultants/The Irland Group November 18, 1999
Page: 52
Figure 13
Maine W ood Production by County, 1997
Source: MFS, W oodprocessor Report, Jan. 1999.
(Sawlogs & Veneer Logs: MMbf; Pulpwood: M Cords)
Sawlogs & VeneerLogs, StateTotal: 1,021
PulpwoodState Total:3,216
11
306
30
7243
265
9
86
149
118
3
65
22
55
22
64
458
63
250156
13944
34
283
497
523
14
422
102
113
57
Figure 14
Maine Pulpwood Receipts, 1997 (1,000 Green Tons)
Hardwood Softwood Total
Roundwood 2,524 2,806 5,330 Chips 3,284 * 2,082 5,366
TOTAL 5,809 4,888 10,697
* Much of this processed at offsite chip plants.
Source: American Pulpwood Assn., 98-A-8, p. 2.
NOTE: Reported totals in Figures 13 and 14 above differ from summed totals due to rounding.

Pan Atlantic Consultants/The Irland Group November 18, 1999
Page: 53
LABOR MARKET OVERVIEW
Also part of the backdrop to the Maine logging industry and questions of labor supply are
general demographic trends in the region. This section establishes the context of overall
population changes in the specific regions in the Maine North Woods in which logging takes
place. The people in these regions form the “labor market” from which logging employers draw
their workforce.
Population
Counties in the wildlands have shown slow growth and declined in share of Maine
population; Aroostook has lost population continuously since 1980 (Figs. 15 and 16).
Figure 15
Number of Residents, 1980 to 1998
Source: U.S. Census Bureau
(Mill
ions
)
Total Maine and Selected Counties
198081
8283
8485
8687
8889
9091
9293
9495
9697
98
1.3
1.2
1.1
1.0
0.9
0.8
0.7
0.6
0.5
0.4
0.3
0.2
0.1
0.0
Total Maine Selected Counties
* See Figure 16.

Pan Atlantic Consultants/The Irland Group November 18, 1999
Page: 54
The divergent economic forces affecting different geographical areas of the State have
many underlying causes. It is possible that shrinking wood industry employment is one factor.
With the shrinking farm and food processing sector, there is less scope than in the past for
recruiting seasonal workers for winter work.
Figure 16
County Populations, 1980-1988
Source: U.S. Census Bureau
198081
8283
8485
8687
8889
9091
9293
9495
9697
980
20,000
40,000
60,000
80,000
100,000
120,000
140,000
160,000
Aroostook
Washington
Penobscot
Oxford
Franklin
Somerset
Piscataquis
Northern Maine
The labor markets surrounding the wildlands display higher unemployment rates than the
state as a whole (Fig. 17). It is in these labor markets that the most likely “commutershed” for
logging workers in the North Woods will be found. In the 1970’s and 1980’s, northern markets
experienced extremely high unemployment rates compared to the state as a whole; the high rates
of those years have recently declined markedly.

Pan Atlantic Consultants/The Irland Group November 18, 1999
Page: 55
Figure 17
Quebec
The unemployment rate in Quebec labor markets on the Maine border has long been
high. Rates have declined near Montreal but not to the North. Industrial development in the St.
George region has improved the labor market balance there.

Pan Atlantic Consultants/The Irland Group November 18, 1999
Page: 56
Figure 18
Unemployment Rate, Annual Average
Source: Labour Force Historical Review 1998,
Select Quebec Regions, 1988-1997
1988 89 90 91 92 93 94 95 96 97 98
17
16
15
14
13
12
11
10
9
8
7
6
5
4
Bas Saint-Laurent
Chaudiere-Appalache
Estrie
Monteregie
Statistics Canada 71F0004XCB.
Figure 19
1
5
12
16
15
1216
Bas-Saint-LaurentEstrieChaudiere-AppalachesMonteregie
Administrative Divisions of Quebecwith 1998 Unemployment Rate
13.6%
6.6%
10.3%7.7%
Mai
ne
Vermont
St. Lawren
ce River

Pan Atlantic Consultants/The Irland Group November 18, 1999
Page: 57
HOW MANY LOGGERS ARE THERE IN MAINE?
It has long been recognized that the economic censuses and the ES-202 datasets
undercount persons employed in logging. The small size of firms, their seasonal nature, and the
coverage of the labor laws all affect the ability to obtain accurate and complete counts of
workers engaged in this occupation. A detailed discussion of the statistical problems and
sources was given in the 1966 Bowdoin PARC report, which estimated that some 9,000 workers
were engaged during that year in cutting pulpwood alone in Maine.
Estimates from recent years regarding the total number of loggers in Maine include: Census of Maine Manufactures 2,411 American Pulpwood Association 3,235 US Census 3,023 Professional Logging Contractors of Maine 3,800
ES-202
The Department of Labor’s ES-202 data is the basic source for estimates of covered
employment and non-farm wage and salary employment used in the nation’s economic statistics.
The ES-202 file represents the employers covered under employment-security laws. It is
recognized that some logging contractors are not covered under these laws by reason of having
no “employees” as defined in the law. There are in fact three regulatory definitions of
“employees” versus “contractors” relevant to the logging industry -- those for unemployment
insurance, ... and taxes.
The data acquisition and interpretation are the responsibility of the Labor Market
Information Services (LMIS) Division of the MDOL. The Division supplied us with a special
extract from its ES-202 database, showing the fourth quarter of 1997 to the fourth quarter of
1998. This extract yielded the following annual averages for this time period: Maine logging employers 506 Maine logging employees 2,620 Maine logging wages/employee $29,700
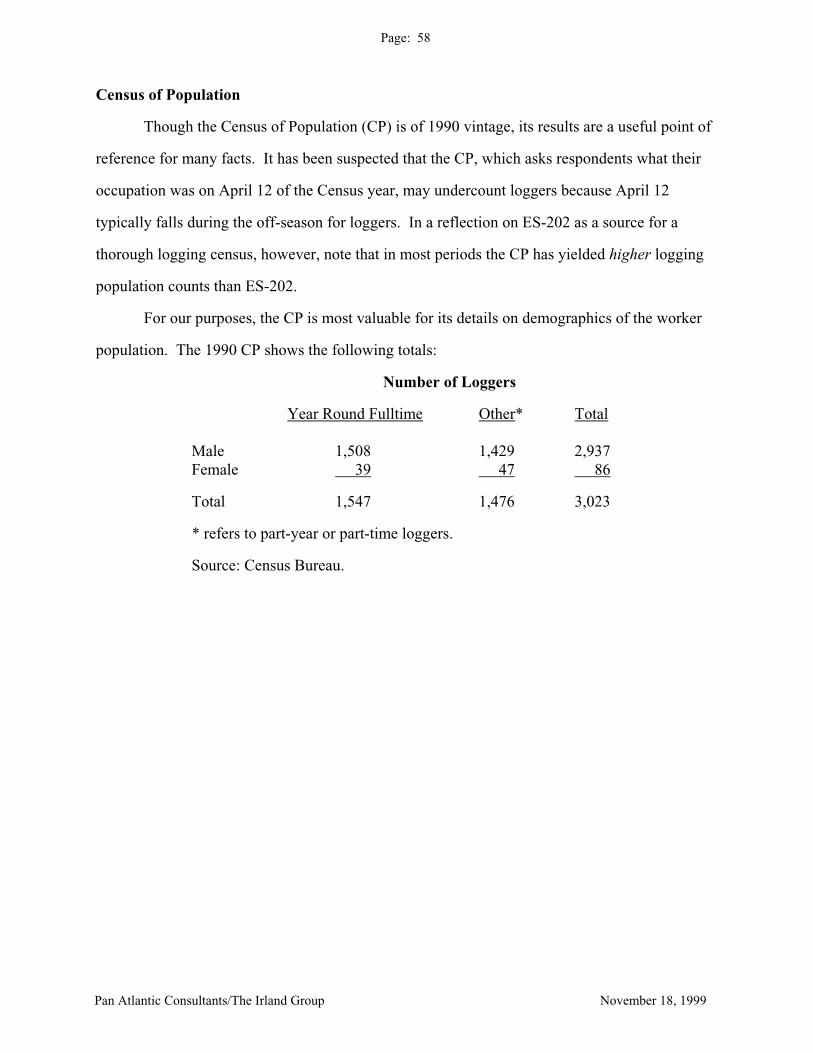
Pan Atlantic Consultants/The Irland Group November 18, 1999
Page: 58
Census of Population
Though the Census of Population (CP) is of 1990 vintage, its results are a useful point of
reference for many facts. It has been suspected that the CP, which asks respondents what their
occupation was on April 12 of the Census year, may undercount loggers because April 12
typically falls during the off-season for loggers. In a reflection on ES-202 as a source for a
thorough logging census, however, note that in most periods the CP has yielded higher logging
population counts than ES-202.
For our purposes, the CP is most valuable for its details on demographics of the worker
population. The 1990 CP shows the following totals:
Number of Loggers
Year Round Fulltime Other* Total Male 1,508 1,429 2,937 Female 39 47 86
Total 1,547 1,476 3,023
* refers to part-year or part-time loggers.
Source: Census Bureau.

Pan Atlantic Consultants/The Irland Group November 18, 1999
Page: 59
HOW MANY CANADIANS ARE THERE
IN THE MAINE WOODS?
Since the focus of this report is the economic effects of Canadian workers in the Maine
Woods, it is important to come to an understanding of how many there are, the kinds of work
they perform, and how these statistics have changed over time.
Who is a “Canadian”? This would seem a simple matter, but it is not. Along the St. John
River, there are number of individuals who enjoy dual citizenship for one reason or another.
They may reside on either side of the border, and may speak more comfortably in French than in
English. Some of these dual citizens have served in the US armed forces. In our interviews,
however, only a small number of dual citizens were encountered.
In addition, there are Canadian citizens who hold visas to work in the US. These visas
are long lasting and in many cases were awarded years ago. At one time, an entire logging camp
in northern Aroostook was staffed almost entirely by visas. There are firms whose workforce
consists almost entirely of visas. A visa worker may reside in Canada (“commuting visa”) or in
the USA (“resident visa”). Considering where many of the H-2 workers are now working,
commuting is feasible for camp workers. There is no information available from US
immigration agencies on the number of these workers in logging or otherwise.
Both dual citizens and Canadian citizens holding visas are considered to have the same
rights as Americans under US labor law (including H-2 regulations), regardless of where they
reside or what language they speak. It is easy to see that this legal position may not coincide
with the public perception of the matter in communities along the border.
Canadian citizens not falling into the above two categories may work in the US under
one of a number of immigration law provisions. Certain professionals and managers may enter
under the H-1 program, which is not of concern in this study.

Pan Atlantic Consultants/The Irland Group November 18, 1999
Page: 60
We have tabulated MDOL figures from a variety of sources to show a time trend in the
number of bonded workers (“bonds”) certified through the H-2 process (Fig 20). These numbers
are weak in that they represent different months from year to year, and the numbers can fluctuate
within the year. MDOL records do not lend themselves to consistent reporting of long-term
trends.
The number of “bonds certified” can be misleading. We do not know about the past, but
in recent years, the actual number of bonds working has been significantly below the numbers
certified. Employers are supposedly not permitted to ask for more bonds than they intend to use,
but in fact they have done so in practice in recent years. The MDOL has no regular means of
determining the actual number of bonds used, by individual employers or in total.
In 1999, 41 companies requested bonds, in total numbers of 446 openings. These
consisted of 190 all-around loggers and 256 others, including truckers, heavy equipment, and
roadbuilding workers. In 1998, 46 firms requested bonds, in total numbers of 696 openings.
These consisted of 383 all-around loggers and 313 others. Therefore, the total number of bonds
requested was down 36% between 1998 and 1999, whereas the number of bonds requested for
the all-around logger category decreased by 50%.
From the 1998 Woods Wage Survey we tabulated the status of the reported workers, for
both H-2 firms and for all respondents (Fig 21). Only 30 of 40 H-2 firms responded to this
survey. There is also a discrepancy in that the results show a few bonded workers working in
non-H-2 firms, which suggests either violations of the rules or misunderstanding in reporting.
Given the potential for semantic confusion between “contractors” and “employees” we may not
be entitled to draw any conclusions as to the presence or absence of true “contractors” in these
figures. Imperfect as they are, they give a partial picture. For the 394 employees of the H-2
employers, 25% were domestics, while more than half were bonds. Commuting visas were 10%
of all the reported workers in responding firms. We may not be justified in interpreting this as a
fair sample, so it should not be assumed that these percentages apply to the entire population,
even of H-2 employers alone.

Pan Atlantic Consultants/The Irland Group November 18, 1999
Page: 61
To illustrate, the 1998 Woods Wage Survey responses (30 of 40 H-2 employers
responding) break down as follows: Total workers 2,094 Domestic workers 76.5% Bonded workers 11.6% Resident visas 1.8% Commuting visas 10.1%
In terms of US labor law, only 11.6% (i.e., the bonded workers) of these employees do
not receive the same rights and benefits as US workers. As a nearby neighbor might see it, as
many as 23.5% (i.e., bonded workers and resident and commuting visa-holding Canadians)
should not receive the same rights and benefits as US workers. In our analysis, we primarily
consider the broader definition, incorporating visa-holders, in summary statistics. The 28 H-2
firms interviewed for this study employed a total of 275 bonds in 1998. Projecting that the
remaining 30% of 1998 H-2 firms employed bonds in similar numbers, the total number of hired
bonds in 1998 would have been approximately 390 workers.
Figure 20
Number of Canadian Bonded Woodsworkers
Source: Maine Dept. of Labor.
No.
of
Bon
ds I
ssue
d
(Tho
usan
ds)
Certified to Work in the Maine Woods, 1954-1999
7
6
5
4
3
2
1
01956
5758
5960
6162
6364
6566
6768
6970
7172
7374
7576
7778
7980
8182
8384
8586
8788
8990
9192
9394
9596
9798
99
*Data was unavailable in 1958, 1977, and 1985-1986.

Pan Atlantic Consultants/The Irland Group November 18, 1999
Page: 62
Figure 21
Survey Estimates of Workers by Residency Status, 1998-99
The data in this table are derived from MDOL’s 1998 Woods Wage Survey, and are illustrative of the level of non-US employment in the Maine Woods. Please note that actual numbers reported for each category of worker are likely underestimated given an incomplete response rate to the survey (see below). Residence Status Employees of Employees of H-2 Firms Only All Logging Firms (% of H-2 Employment) (% of Total Employment) Domestic workers* 98 (24.9%) 1,601 (76.5%) Bonded workers 217 (55.1%) 243 (11.6%) Resident Visa-Holders 7 (1.8%) 38 (1.8%) Commuting Visa-Holders 72 (18.3%) 212 (10.1%) Total 394 (100.0%) 2,094 (100.0%) *Some “domestic workers” may also be dual citizens of the United States and Canada. Please note that 30 of a total of 40 H-2 employers responded to this MDOL survey.

Pan Atlantic Consultants/The Irland Group November 18, 1999
Page: 63
“INDEPENDENT CONTRACTORS” VERSUS “EMPLOYEES”
Linked to the difficulties in accurately tracking the number of loggers in Maine are
differing regulatory requirements regarding how “independent contractors” and “employees” are
defined. Though this issue is not directly germane to the H-2 bonded labor program, we were
requested to consider the attendant industry implications, especially pertaining as to which
loggers receive social protections.
Under US labor law, small employers are provided with exemptions from many
requirements. There are hundreds of thousands of such small contractors in businesses as
diverse as roofing, auto repair, trucking, and logging. These small employers have enormous
political power and want to be exempted from such labor laws. A recent Workers Compensation
Commission report discussed many of these concerns.
In the context of Maine logging, the prevalence of the independent contractor results in
the following situation for the individuals involved.
* No OSHA jurisdiction;
* No workers’ compensation requirement;
* No health plan;
* No withholding for FICA or Medicare;
* No risk of unionization (contractors cannot band together to negotiate);
* Ability to redirect payments to equipment, rather than to wages;
* Long-term commitments are avoided;
* Paperwork is minimized.

Pan Atlantic Consultants/The Irland Group November 18, 1999
Page: 64
Many workers seem to prefer operating this way. Yet it creates disadvantages for them.
They can end up with Internal Revenue Service (IRS) audit problems. They can find themselves
without health coverage when needed, and at the mercy of the charity of their employer or
physician (or worse). It is not inaccurate to say that, from the standpoint of US labor law, these
workers do not exist.
In an industry such as logging, beset by a cost squeeze and with overcapacity relative to
demand, there is every temptation to cut costs wherever possible. Many individual contractors
feel they have no choice but to take advantage of these exemptions in order to survive.
In recent debates on logging and related issues, the independent logger has figured from a
number of standpoints. The “independents” value their independence and bridle at being
required by wood buyers or insurers to take courses like the Certified Logging Professional
(CLP) program. In addition, they fear the implementation of Sustainable Forestry Initiative
(SFI) rules, including CLP, by the large woodbuyers because they fear the costs of compliance
and the additional power it brings to woodbuyers. This is an issue nationally and operators
resisting SFI are using threats of litigation in order to seek leverage.
Large operators, for their part, usually have their workers on a payroll with workers’
compensation, unemployment insurance, and other costs assumed. They fear unfair competition
from what they call “rogue” loggers who assume none of these costs, and from whom their
customers continue to purchase wood.
In effect, the prevalence of contracting has fragmented the industry, and it also means
that statistics on “covered employment” do not in fact cover a significant portion of true industry
employment. This is because the only data available on most industries comes from the ES-202
program, which maintains records for the unemployment insurance program. Covered
employment is a category of the Employment Security Law, wherein employers must file
quarterly records with MDOL for such things as UI contributions, etc. Contractors are not
included in this category.
Pan Atlantic Consultants/The Irland Group November 18, 1999
Page: 65
Following are synopses of the regulatory definitions of “independent contractors”: 1. Unemployment Insurance Definition
• 3-part “ABC Test”; all three parts need to be proven “to the satisfaction of the bureau.”
• Tests involve (1) Service provider’s independence; (2) Service performed is “outside
the usual course of business” or performed outside places of business; (3) Service
provider is customarily engaged in independent work. 2. Workers’ Compensation Insurance Definition
• 8-part test; all eight parts do not need to be proven; WC board looks at whether the
employer exercises the right to control the service provider in the context of their
overall relationship.
Test focuses on (1) Existence of a contract; (2) Assistants employed?; (3) Obligation to
furnish tools; (4) Right to control progress; (5) Relationship of work to employer’s
regular business; (6) Typical independent status; (7) Amount of time; (8) Method of
payment. 3. IRS/Tax Definition
• 20-part test to determine whether the employer exercises or has the right to exercise control.
• Test areas include who directs the work; where it is conducted; whether training is
involved; who pays expenses; whether tools are furnished; investments in facilities;
realization of profit or loss; whether the service is available to the public; and the
right to terminate.

Pan Atlantic Consultants/The Irland Group November 18, 1999
Page: 66
THE WORKERS
In our review of traits of loggers, we rely on our full interview sample, in which as many
as 173 responses are used (58 Canadian, 111 US, 3 Dual). For many questions, the number of
responses was lower. In addition, for a few questions -- particularly those related to income and
demographic factors -- we are able to make use of an “augmented sample” of 290 loggers.
A few averages begin the story. The average logger for our full sample:
-- is 43 years old;
-- has 23.3 years logging experience;
-- reports a mean of 151 cords/week cut (median of 70 cords/week);
-- has lived within 30 miles of his current home for 36 years;
-- has 2.13 family members in logging;
-- has 1.05 children 18 and under;
-- has completed 11 years of schooling;
-- has $31,505 (US) gross annual logging income.
Though we have little independent information for comparisons as to the degree of
representativeness of our sample, we calculate its margin of error to be + 5.90 percent at the 90
percent confidence level. This reported annual income level substantially exceeds the 1998
average annual wage for covered employment, which was $24,609. There is no recent Census
data against which to judge the age and other data.
There is a somewhat higher degree of generational continuity among Canadian than
American loggers. Sixty-four percent of Canadians reported that their father was a logger, and
farming was the second most common occupation among Canadian loggers’ fathers. For
Americans, 56% reported their father to have been a logger, and 6% were from farm families. In
our sample (N=169), 86% were married; percentages were virtually identical for US and
Canadians. These are rooted people, though significantly more so for the Canadians (Figure 22).
Forty-four percent of the Canadians reported living 46 or more years in the same area.

Pan Atlantic Consultants/The Irland Group November 18, 1999
Page: 67
Figure 22
Number of Years Within 30 Miles of Current Residence (N=97)
Canadian
U.S. and Dual
0-15 8 5 16-30 9 13 31-45 15 15 46+ 6 26
Total 38 59
Source: PAC interviews.
Experience in logging differs considerably, with almost half of the Canadians reporting
31 or more years in logging (often starting in their teens); compared to only 11% of the
Americans (Figure 23).
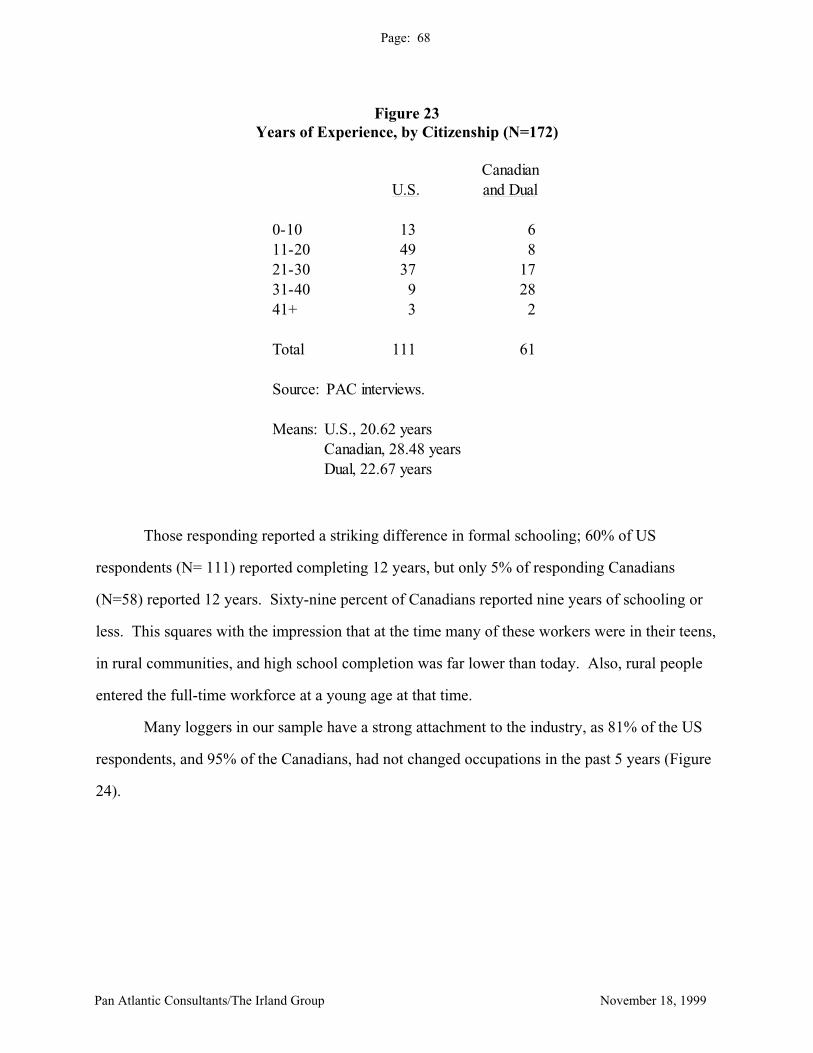
Pan Atlantic Consultants/The Irland Group November 18, 1999
Page: 68
Figure 23
Years of Experience, by Citizenship (N=172)
CanadianU.S. and Dual
0-10 13 6 11-20 49 8 21-30 37 17 31-40 9 28 41+ 3 2
Total 111 61
Source: PAC interviews.
Means: U.S., 20.62 years Canadian, 28.48 years Dual, 22.67 years
Those responding reported a striking difference in formal schooling; 60% of US
respondents (N= 111) reported completing 12 years, but only 5% of responding Canadians
(N=58) reported 12 years. Sixty-nine percent of Canadians reported nine years of schooling or
less. This squares with the impression that at the time many of these workers were in their teens,
in rural communities, and high school completion was far lower than today. Also, rural people
entered the full-time workforce at a young age at that time.
Many loggers in our sample have a strong attachment to the industry, as 81% of the US
respondents, and 95% of the Canadians, had not changed occupations in the past 5 years (Figure
24).

Pan Atlantic Consultants/The Irland Group November 18, 1999
Page: 69
Figure 24
Number of Times Changed Occupation in Last Five Years
No. TimesChanged Occupation
Last Five Years U.S. Canadian Dual Total
0 90 55 2 147 1 10 1 11 2 5 2 1 8 3 3 3 6 1 1 8 1 1 10 1 1
Total 111 58 3 172
Source: PAC surveys.
Work patterns for the sample as a whole (all loggers, US and Canadian) were: Average Median Weeks worked/year 41.2 40 Days worked/week 4.8 5 Hours/day 10.2 10 One-way time to work (minutes) 65.2 60 Cords per week* 151.0 70 Overtime/week 8.02 8 Number in a crew 2.49 2 * That the average cords per week is so much higher than the median cords per week indicates that a few survey responses greatly skewed the total number of cords cut, while 50% of the total number of responses were at or below 70 cords per week.

Pan Atlantic Consultants/The Irland Group November 18, 1999
Page: 70
Patterns of work differ significantly between US and Canadian workers, based on the
higher rate of work in camps by the Canadians (Figs. 25-28). These differences include:
-- Fewer days/week by Canadians.
-- Less variance in hours per day for Canadians.
-- Far fewer nights away from home for Americans.
-- The method of payment is diverse, partly due to differing occupations.
Figure 25
Number of Days Worked/Week Operating Season
Nu
mb
er
1.0 3.5 4.0 4.5 5.0 5.5 6.0 7.0
60
50
40
30
20
10
0 �����������
���
����
Source: PAC Surveys.
U.S.
����
Canadian
Days/Week
(N=168)
Figure 26
Number of Hours Worked/Day Operating Season
Num
ber
5 6 7 8 9 10 11 12 13 14 15 16 18
35
30
25
20
15
10
5
0�����
��������
��������
��� �
Source: PAC Surveys.
U.S.
��Canadian
Hours/Day
(N=170)

Pan Atlantic Consultants/The Irland Group November 18, 1999
Page: 71
Figure 27
Number of Nights Per Week Spent Away from Home
Num
ber
0 1 2 3 4 5 6
90
80
70
60
50
40
30
20
10
0 �������
����
��
�
Source: PAC Surveys.
U.S.
�Canadian
Nights/Week
(N=157)
Figure 28
How Often Does Employer "Settle Up"?
Num
ber
MonthlySeasonally
AnnuallyContract-by
Weekly Any timeVery
irreg,When wood
Twice/MonthEvery two
1817161514131211109876543210����
��������
���
���������
������
������
����
Source: PAC Surveys.
U.S. �Canadian
How Often
-contractif at all is hauled weeks
(N=62)
Note: “Settling up” is the process whereby logging contractors reimburse workers being paid on a piece-rate system for wood that has been scaled. This process occurs some length of time after the wood has been cut. This graph demonstrates the length of time that individual loggers must wait to receive 100% of the value of their cut wood.
Differences Between US and Canadian Workers
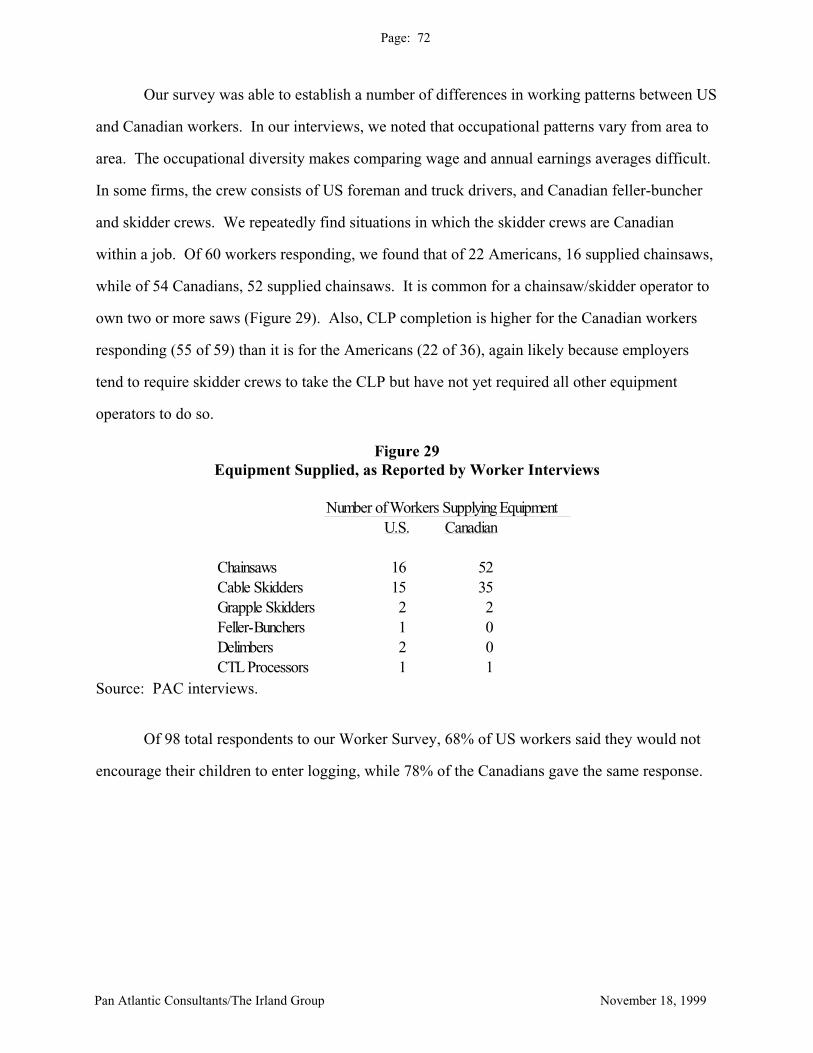
Pan Atlantic Consultants/The Irland Group November 18, 1999
Page: 72
Our survey was able to establish a number of differences in working patterns between US
and Canadian workers. In our interviews, we noted that occupational patterns vary from area to
area. The occupational diversity makes comparing wage and annual earnings averages difficult.
In some firms, the crew consists of US foreman and truck drivers, and Canadian feller-buncher
and skidder crews. We repeatedly find situations in which the skidder crews are Canadian
within a job. Of 60 workers responding, we found that of 22 Americans, 16 supplied chainsaws,
while of 54 Canadians, 52 supplied chainsaws. It is common for a chainsaw/skidder operator to
own two or more saws (Figure 29). Also, CLP completion is higher for the Canadian workers
responding (55 of 59) than it is for the Americans (22 of 36), again likely because employers
tend to require skidder crews to take the CLP but have not yet required all other equipment
operators to do so.
Figure 29 Equipment Supplied, as Reported by Worker Interviews
Number of Workers Supplying Equipment
U.S. Canadian
Chainsaws 16 52 Cable Skidders 15 35 Grapple Skidders 2 2 Feller-Bunchers 1 0 Delimbers 2 0 CTL Processors 1 1
Source: PAC interviews.
Of 98 total respondents to our Worker Survey, 68% of US workers said they would not
encourage their children to enter logging, while 78% of the Canadians gave the same response.

Pan Atlantic Consultants/The Irland Group November 18, 1999
Page: 73
One way to depict experience is by the decade when a worker entered logging (Figure
30). This comparison shows a very large entry of the Canadians in the 1960’s and 1970’s, and a
large entry of US workers in the 1970’s and 1980’s. This data implies that the number of bonded
workers available to work in the Maine Woods is declining through age-related attrition.
Therefore, if current trends continue, the supply of available Canadian woods labor will continue
to diminish.
Figure 30
Workers by Decade Entering Logging (Percent)
US Canadian Total
1950's 5.4% 8.5% 7.3%1960's 5.4% 47.5% 31.3%1970's 40.5% 27.1% 32.3%1980's 40.5% 6.8% 19.8%1990's 8.1% 10.2% 9.4%
Total 100.0% 100.0% 100.0%
N= 37 59 96
Source: PAC interviews.
Experience on equipment differed. In total, 60 Canadians responded to the question
“How many years of on-the-job experience in and out of logging do you have operating heavy
equipment, similar in size to bulldozers, backhoes, skidders, or harvesters?” Of these, 36 (or
60%) claimed 10 or fewer years experience, compared to 16% of US workers reporting the same.
Given the Canadians’ relatively advanced average age and the length of time that the sample
population had been in logging, this result may point cross-training opportunities being afforded
to Canadian workers. On the other hand, it may only reflect the shift toward the one-man
skidder crew from the two-man teams of a decade ago (i.e., chainsaw operators had to learn to
operate skidders, too). The results on this point are inconclusive.

Pan Atlantic Consultants/The Irland Group November 18, 1999
Page: 74
The work schedules differ in terms of weeks worked per year. The average for
Canadians was 37.49 and for Americans 43.18 -- a difference of 5.6 weeks. At a wage of
$11.00, and a 40-week shift, this would be $2,464.00, or about 10% of the average annual
logging wage in 1998 (according to covered employment statistics).
Workers by North/South Region (Augmented Sample)
For available variables, we merged the phone demographics responses with the
interviews for a sample of about 290. We have stratified this sample according to nationality and
residence: “North” (103) “South” (132) Canada (55)
In this instance, we define the “North” as including MDOL Labor Market Areas (LMAs)
numbered 26, 27, 28, 30, 32, 33, 34, and 35, plus the upper halves of LMAs 22, 24, 29, and 31 --
roughly, the area of Maine north of a line drawn between the White Mountain National Forest
(Bethel) near New Hampshire to Houlton in northern Maine. The “South,” then, includes
MDOL LMAs 19, 21, and 23 and the lower halves of LMAs 22, 24, 29, and 31 -- the area south
of the line from Bethel to Houlton. (For a map depicting North and South, see Appendix I.)
This demarcation of “North” and “South” was chosen based on two primary factors:
1. Landownership patterns: Land is more often held in large landholdings in the
North, in small woodlots in the South. This has implications for the number of
landowners that a logging contractor may work for and, apparently, how loggers
are paid (i.e., wage versus piece rate).
2. Presence of Bonds: Bonds only worked in the North during the 1998-99
operating season, our study’s baseline year.

Pan Atlantic Consultants/The Irland Group November 18, 1999
Page: 75
It is important to note that, for the purposes of this study, we exclude Washington County
and “Downeast Maine” from the North Woods because it has relied on no bonds for many years.
The comparisons show a few patterns (Figure 31)
-- Canadians are older.
-- On most indicators, the N-S differences within the US are small.
-- Canadians work a shorter season but report virtually the same hourly wage.
-- Gross annual income is highest in the South.

Pan Atlantic Consultants/The Irland Group November 18, 1999
Page: 76
Figure 31 Geographic Differences -- Augmented Sample
North South Canadian
Number years total experience 19.9 21.7 28.2
Age 40.3 41.9 46.4
Years schooling 12.2 12.2 8.4
Average weeks/year 43 45 37
One-way time to work (mins.) 59 52 79
Nights/week 1.47 0.37 2.73
Percent reporting no overnight 48 85 20
Gross annual income from logging ($k) 33.7 39.6 28.7
Non-overtime wage/hour 11.86 12.00 11.98 N= (46) (38) (11)
Percent CLP 74 82 94
Source: PAC sample of 290 loggers, contacted in person and by telephone.

Pan Atlantic Consultants/The Irland Group November 18, 1999
Page: 77
WAGES & COMPENSATION
Secondary-Source Data
We have compared wages from the Woods Wage Survey with other sources to see how
logging wages compare with other occupations. Generally, the comparisons show that Maine is
a state where wage levels are low for many skilled occupations, not just the operation of
complex logging machinery. Rates at $11.00 per hour for running road graders, processors, or
heavy trucks (Figure 32) would be considered very low in most other states. In the statewide
occupational wage survey (Figure 33), the classification “faller-bucker” (using west coast
terminology here) earns only $10.39, and log truck and other equipment operators earn amounts
very similar to the findings of the woods wage survey. Occupations generally considered to be
skilled, such as carpenters, plumbers, and mechanics, also earn very low wages according to this
survey. Also, the statewide construction wage survey shows quite low wage levels for
occupations similar to those that would be encountered in logging, and shows a sectoral average
lower than what one might expect based on general knowledge of the industry.
While one might consider more thorough comparisons to be useful on this point, these
other data sources on wages in Maine do not suggest, on quick examination, that there is any
general tendency of the logging field, as reflected in the Woods Wage Survey, to pay unusually
low wages compared to other industries using similar skills. Nor is there any indication that
Maine workers require premium wages to work in the woods under remote conditions in jobs
with relatively high accident rates. Further, there does not appear to be any obvious reason
based on these comparisons to suspect an unusual influence of the H-2 program on logging
wages, since they are so closely comparable with wages in related field.

Pan Atlantic Consultants/The Irland Group November 18, 1999
Page: 78
Figure 32 Logging Occupation Wages, 1998 Woods Wage Survey
All-around logger $10.00 Grader 11.00 Processor 11.00 Slasher 10.00 Supervisor 12.00 Flatbed truck driver 8.00 Self-load flatbed 9.00 Log truck driver trailer 8.00 Bulldozer 8.00 Delimber 10.00 Skidder, cable none Loader 10.00 Mechanic 10.00 Grapple skidder 9.50 Weekly rates imply weeks longer than 40 hours. FLTST/LBB All spp 30.00 SW 25.00 HW 24.00
Figure 33 Maine 1997 Occupational Wages: Logging and Other Skilled
Code Job Wage 72002 Supervisor, logging $13.90 73002 Faller-bucker 10.39 73008 Log handling equipment operators 11.04 73011 Log truck operators 11.59 73099 All other logging 11.95 81099 All other supervisors 17.36 85110 Machinery maintenance mechanic 13.10 85314 Mobile heavy equipment maintenance 12.41 87102 Carpenter 11.42 87502 Plumber, etc. 14.58 Source: MDOL, 1997 Maine Occupation Wages, OWS-21.

Pan Atlantic Consultants/The Irland Group November 18, 1999
Page: 79
Figure 34
Average Maine Construction Wages, 1998 Hourly Wage All Construction $11.73 Building Construction Bricklayer $11.42 Plumber $17.00 Crane operator $14.18 Highway Construction Grader Operator $13.44 Special Trades Ironworker, structural $14.64 Truck driver, heavy $9.05 Source: MDOL, Maine Construction Wage Rates, 1998.
Wage Trends
There are several sources of wage data at the 3-digit level; all have their uses. The most
direct source is the Woodsworker Wage Survey conducted annually by the MDOL. In this
survey, a large population of loggers is surveyed to determine wage payments and equipment
rates for a number of different logging activities and occupations (for full description of
methods, see the Methodology section in the appendices). This survey is used by the USDOL to
set wage levels for the bonded labor program. The MDOL calculates a “composite” wage
representing an average of the major occupations for which a large sample of reports is received.
This “composite” has declined in real terms over the years (Figure 35).

Pan Atlantic Consultants/The Irland Group November 18, 1999
Page: 80
Figure 35
Sources: MDOL, Woods Wage Survey; and
Maine Composite Woodsworker
Wage and Real Wage, 1982-98
198283
8485
8687
8889
9091
9293
9495
9697
98
13
12
11
10
9
8
7
6
MDOL Comp. Wage
Real Comp. Wage
Econ. Rept. of the President, Table B-62.
Interestingly, the average weekly logging wage in Maine covered employment does not show
nearly as severe a downtrend in real terms, over a somewhat longer time period. During the
period after 1995 general economic conditions and conditions specific to logging -- namely,
increasing mechanization -- drove the average real logging wage up in tandem with the wage for
the broader 241 SIC category. In addition, output in the broader wood products industry was up
during this period and employment was down. In other words, on average there are fewer
workers producing -- and earning -- more.
Figure 36
Source: MDOL.
1975
Dol
lars
(Th
ousa
nd
s)
197576
7778
7980
8182
8384
8586
8788
8990
9192
9394
9596
9798
11.0
10.5
10.0
9.5
9.0
8.5
8.0
7.5
7.0
6.5
Covered Employment:
Adjusted for InflationMaine Logging Industry Earnings
Current Dollars:
1975: 9.2901998: 24.609

Pan Atlantic Consultants/The Irland Group November 18, 1999
Page: 81
Figure 37
Logging Wages as Percents ofLumber & Wood, Paper, and All Mfg.
Source: Maine Bureau of Labor Standards.
1975 1980 1985 1990 199640%
60%
80%
100%
120%
140%
Per
cen
t
Lumber& Wood Paper
AllMfg.
Figure 38
Census of Maine Manufactures
(Tho
usan
ds)
Value of Product Per Worker
1975 1980 1985 1990 1996
32030028026024022020018016014012010080604020
Manufacturing
Durable Goods Lumber & Wood
Logging
Furniture & Fixtures
Paper

Pan Atlantic Consultants/The Irland Group November 18, 1999
Page: 82
Survey Findings on Wages
The PAC surveys focused on wages for the 1998-99 operating season. As with any effort
to elicit self-reported incomes in survey research, there are many methodological questions. Yet,
as an independent source of comparative information, we present our results.
In this sample, Canadian respondents reported lower annual incomes from logging than
the Americans (Figure 39). Thirty percent of Canadians reported $10,000-20,000 (US) of
income, while only 6% of Americans reported this range. Thirteen percent of Canadians, but
18% of Americans, reported more than $40,000. Does this mean that Canadians are depressing
wages? By itself it does not, because our sample also represents some differences in
occupations. US workers in our sample, though many are engaged in “all-around logging”
activities (i.e., cutting with a chainsaw, skidding, etc.) for which they are paid on piece rate, also
include a mix of foremen and heavy equipment operators who are paid more on a wage or
salaried basis. Canadian workers are nearly all “all-around loggers” paid on a piece rate.
Adjustments for differences in productivity between the two populations must be made before
making a true “apples to apples” comparison of earnings. This level of analysis is done in the
econometric analysis later in the report.

Pan Atlantic Consultants/The Irland Group November 18, 1999
Page: 83
Figure 39 Reported Gross Annual Income from Logging
($US)
Canadian US & Dual Below $10,000 1.0% 0.0% $10-20,000 6.0% 30.0% $20-30,000 40.0% 38.0% $30-40,000 35.0% 19.0% $40-50,000 11.0% 2.0% $50,000+ 7.0% 11.0% N= 72 47
Source: PAC Worker Survey.
Reported wages, piece rates, and weekly and annual income comparisons show ranging
patterns (Figs. 40-43). Response rates for these inquiries were far lower than for the other items.
Figure 40
Worker-Reported Non-Overtime
Dollars Per Cord
No.
Rep
orti
ng
Piece Rate, 1998-99
5.00 10.00 15.00 20.00 24.00
3
2
1
0 ���
���
���
���
���
���
������
���
���
���
���
������
���
������
������
���
���
���
������
���
���
������
���
���
������
���
���
���
���������
������
US �Canadian
N=44
Source: PAC Worker Survey.
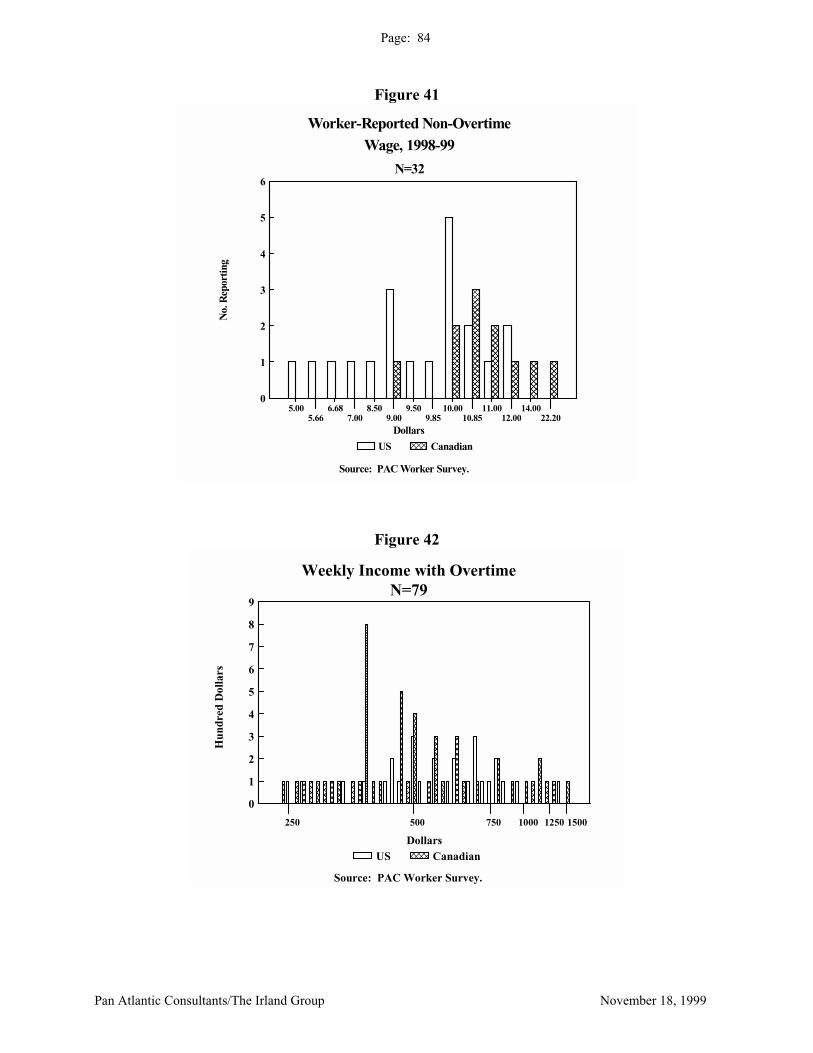
Pan Atlantic Consultants/The Irland Group November 18, 1999
Page: 84
Figure 41
No.
Rep
ortin
g
5.005.66
6.687.00
8.509.00
9.509.85
10.0010.85
11.0012.00
14.0022.20
6
5
4
3
2
1
0 ���
����
�����
����
���
������
���
Dollars
US
�Canadian
Source: PAC Worker Survey.
N=32
Worker-Reported Non-OvertimeWage, 1998-99
Figure 42
Weekly Income with Overtime
250 500 750 1000 1250 1500
9
8
7
6
5
4
3
2
1
0������������������������������
����������
���������
������
������
�������
���������
������
Hun
dred
Dol
lars
US�
Canadian
Source: PAC Worker Survey.
Dollars
N=79

Pan Atlantic Consultants/The Irland Group November 18, 1999
Page: 85
Figure 43
Income Ranges
Num
ber
of R
espo
nden
ts
1000020000
30000 4000050000
60000
26
24
22
20
18
16
14
12
10
8
6
4
2
0 �����������������������������������������������
US��Canadian
Source: PAC Worker Survey.
Gross Annual Income from Logging, 1998
N=74
Somewhat more Americans than Canadians reported 100% of income from logging, while more
Canadians reported that between 75 and 90% of their personal incomes were derived from
logging (Figure 44).
Figure 44
Logging's Percent of Annual Income
Num
ber
of
Res
pond
ents
0 15 25 30 50 60 65 66 70 75 80 85 90 100
26
24
22
20
18
16
14
12
10
8
6
4
2
0 ���� ������� ���
����
���
�����������
Source: PAC Surveys.
U.S.
�Canadian
Percent of Annual Income
(N=93)
Pan Atlantic Consultants/The Irland Group November 18, 1999
Page: 86
In terms of annual incomes, the wide range suggests that a statistically significant
comparison is not obtainable, especially in the absence of complete data on hours worked by
each. In the Canadian responses, there are three small peaks in the data, one at very low levels
of annual incomes, one in the 19,000-22,000 ($US) range, and another in the $29,000 and up
range. These different peaks probably represent different combinations of weeks worked and
types of occupation.
Worker Fringe Benefits
Generally in logging and related occupations, the availability of formal fringe benefit
programs is low. Programs that are legally mandated or required by landowners or insurers have
high participation, at rates that are substantially the same for US and Canadian workers. (Figs.
45-47). There is a large difference in medical provisions, given that Canadians have a socialized
medical system. Yet more Canadian workers than Americans reported receiving disability
benefits, while twice as many Americans as Canadians reported health insurance. In categories
of vacation, sick leave, holidays, and retirement benefits, Americans reported rates that were low
but still higher than Canadians. There was not complete agreement among respondents as to
whether US and Canadian workers received identical benefits. Of Americans, 32% did not
believe benefits were the same, though they may have been referring to Canada’s system of
socialized medicine. Only 9% of Canadian respondents (N=58) disagreed with the statement
that benefits are the same.

Pan Atlantic Consultants/The Irland Group November 18, 1999
Page: 87
Figure 45
Worker-Reported Benefits, 1998-99
Benefit
Per
cent
Rep
orti
ng
N=89-96
WCL-T Disability
S-T DisabilityHealth Insurance
UI
110%
100%
90%
80%
70%
60%
50%
40%
30%
20%
10%
0% ��������������
����
��������������������
US
����Canadian
Source: PAC Worker Survey.
WC = Worker's Compensation; UI = Unemployment Insurance
NOTE: In Figure 45, “L-T Disability” stands for “Long-Term Disability Insurance” and “S-T
Disability” stands for “Short-Term Disability Insurance”
Figure 46
Worker-Reported Benefits, 1998-99
Per
cent
Rep
orti
ng
Vacation Sick Holidays 401(K) Other
60%
50%
40%
30%
20%
10%
0%
����������
����
��������������
��������
Benefit
N=94-96
US
����Canadian
Source: PAC Worker Survey.
Leave Retirement

Pan Atlantic Consultants/The Irland Group November 18, 1999
Page: 88
Figure 47
Per
cent
Rep
orti
ng
Meal Travel Housing Prep. Meals
80%
70%
60%
50%
40%
30%
20%
10%
0%
����
��������
����������������
������
Worker-Reported Benefits, 1998-99
Benefit
N=94-96
US
����
Canadian
Source: PAC Worker Survey.
Allowance Allowance
Of 23 US respondents, 5 (21.7%) reported ever being laid off, while half the proportion
of Canadians reported ever being laid off (5 of 48 = 9.4%).
In general, traditional camps with cooks and cookhouses are on the way out in the North
Woods. More typically, they are now “batch camps,” some of them fairly new. In older camps
the cookhouses are still used by the workers to cook, eat, and socialize in the evenings. Or basic
cooking and food storage is available in individual trailer units or camps. The H-2 program no
longer has camp cooks.
Our worker survey made a number of inquiries about camp life. A somewhat smaller
number of Americans (37) responded to these questions than Canadians (57).
US Canadian Receive meal allowance 13.5% 5.3% Receive travel allowance 45.9% 36.4% Housing provided 21.6% 75.4% Prepared meals 2.7% 15.7%

Pan Atlantic Consultants/The Irland Group November 18, 1999
Page: 89
These responses reflect the low rate of US workers working out of camps, and the shrinking of
the role of the traditional camp facility. They indicate that US workers are more likely to
receive travel allowances and meal allowances than the Canadians. At times, some of the
workers use company vehicles from camp to cutting sites in both instances.
Exchange Rate and Healthcare Differences
For the duration of the 1998-99 operating season, the US Dollar was worth just under
Can$1.50. There is most likely some benefit accruing to Canadians who work in Maine and who
spend most of their income back home in Canada. Offsetting this apparent source of
“advantage” for Canadian workers are the following observations:
• According to our Worker Survey, Canadians on average work fewer weeks per year
than US workers, thereby earning less annual gross income from logging. This is
borne out in our findings on annual earnings for US and Canadian workers.
Because many Canadians (especially bonded workers) spend several nights a week in
employer camps or other housing, they inevitably spend some portion of their income
in the United States.
It is common practice for US citizens living near the Canadian border to cross the border
to shop and otherwise spend income. There is no reason to believe that US workers’
families do not share this practice, thereby benefiting from the favorable US-to-
Canadian exchange rate.

Pan Atlantic Consultants/The Irland Group November 18, 1999
Page: 90
Likewise, Canadian residents are believed to benefit from being able to rely on socialized
Canadian medicine, whereas US workers must pay directly for health insurance. It is very
difficult to estimate what, if any, actual benefit accrues to an individual Canadian worker from
his ability to avail himself of “free” healthcare in his home country. Again, however, we must
observe some pertinent facts about the situation:
• Canadians pay other taxes, including the value-added tax (VAT) and other
nationwide and provincial taxes. It is also worth noting that, on average, Canadians
in our sample reported earning a lower percentage of their total gross annual income
from logging than US workers. In many cases, this means that Canadian loggers earn
income in the off-season in Canada, on which they will pay taxes to Canada. All of
these taxes help to offset the Canadian loggers’ “free-ride” on the Canadian
healthcare system.
Because woodswork takes place in remote US locations and often for US employers, in
the event of an emergency Canadian workers would be taken to a US hospital,
nullifying the Canadian healthcare system’s role. Furthermore, even for non-life-
threatening conditions, Canadians who are living in company-sponsored camps or
housing during the week are also likely to visit US healthcare facilities when
necessary.
Our survey reveals that twice as many US workers as Canadians receive health insurance
benefits from their employers. (Nevertheless, the overall number receiving such
benefits is low.)
There is a limit on the quality and extent of “free” treatments available in Canadian
medicine. More complicated and expensive treatments involve direct payments.

Pan Atlantic Consultants/The Irland Group November 18, 1999
Page: 91
On balance, the exchange-rate differential and the Canadian healthcare system are likely
advantages for Canadian workers. However, the extent of that advantage cannot be measured
without in-depth quantitative analysis not pertinent to this study. Furthermore, neither
“advantage” is isolated to the Canadian bonded labor program -- visa-holders still living in
Canada could avail themselves of the same benefits, as can dual citizens living across the border.

Pan Atlantic Consultants/The Irland Group November 18, 1999
Page: 92
THE CONTRACTORS
Complementing our picture of the workers is an analysis of their employers and
independent counterparts -- the logging contractors. PAC/IRG succeeded in obtaining 81
contractor interviews. We sought interviews with all H-2 contractors (1998-99 logging season),
but a number declined or cooperated only partially.
It is estimated that there are some 1,500 contractors in the state, including a large number
of independent owner-operators and a smaller number which serve a dual role as logging
employers. Given that we concentrated on the North Woods alone, our sample becomes
somewhat more representative. In our sample, 17.3% were Canadian citizens, 3.7% enjoyed
dual citizenship, and 79% were US citizens (Figure 49).
Figure 49
Principal Owner Citizenship
Frequency Percent
Valid US 64 79.0%Canadian 14 17.3%Dual 3 3.7%Total 81 100.0%
Source: PAC Contractor Interviews.
Given the cross-border bilingual culture of northern Maine, it is not surprising that two
fifths of the respondents reported at least some fluency in French (Figure 50). A number of the
Canadian respondents, whose fluency in English was sufficiently limited, were interviewed by
French-speaking interviewers, or with the aid of bilingual associates in their own firms.
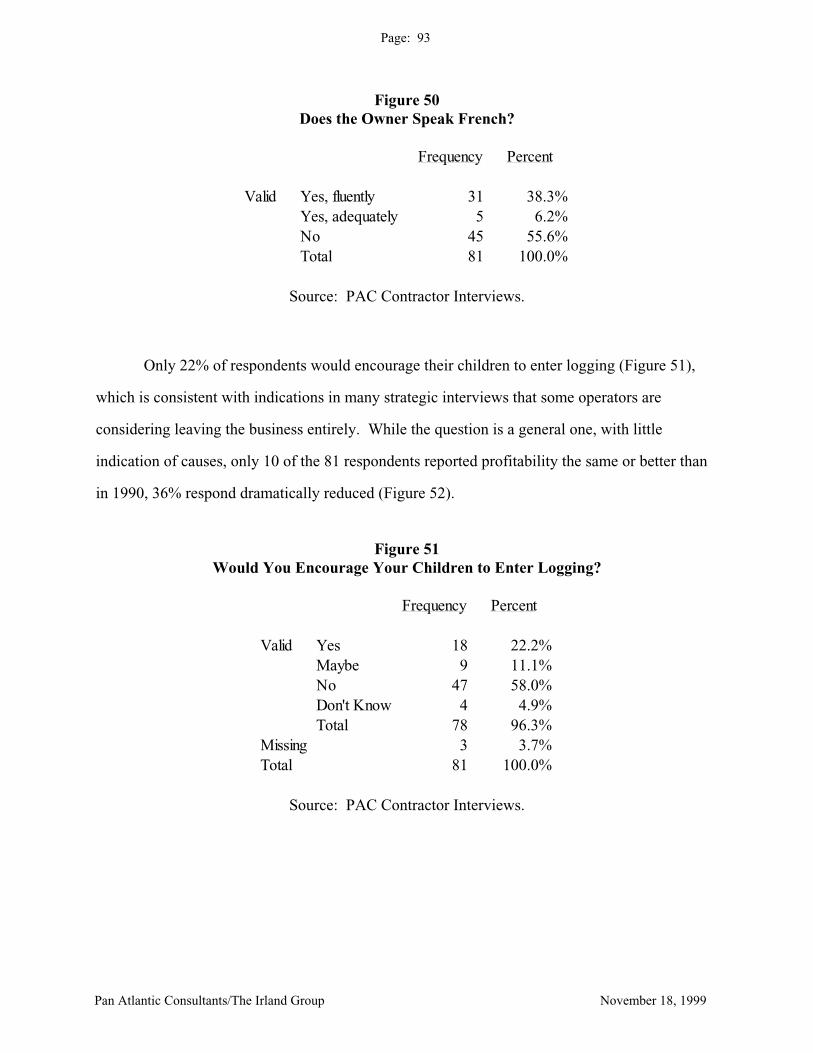
Pan Atlantic Consultants/The Irland Group November 18, 1999
Page: 93
Figure 50
Does the Owner Speak French?
Frequency Percent
Valid Yes, fluently 31 38.3%Yes, adequately 5 6.2%No 45 55.6%Total 81 100.0%
Source: PAC Contractor Interviews.
Only 22% of respondents would encourage their children to enter logging (Figure 51),
which is consistent with indications in many strategic interviews that some operators are
considering leaving the business entirely. While the question is a general one, with little
indication of causes, only 10 of the 81 respondents reported profitability the same or better than
in 1990, 36% respond dramatically reduced (Figure 52).
Figure 51 Would You Encourage Your Children to Enter Logging?
Frequency Percent
Valid Yes 18 22.2%Maybe 9 11.1%No 47 58.0%Don't Know 4 4.9%Total 78 96.3%
Missing 3 3.7%Total 81 100.0%
Source: PAC Contractor Interviews.

Pan Atlantic Consultants/The Irland Group November 18, 1999
Page: 94
Figure 52
How Have Company Profits Changed in the 1990’s?
Frequency Percent
Valid Dramatically reduced 29 35.8%Reduced 28 34.6%Remained same 14 17.3%Increased somewhat 5 6.2%Increased significantly 1 1.2%
Missing 4 4.9%Total 81 100.0%
Source: PAC Contractor Interviews.
For 66 responses, 38 of them purchase some stumpage, indicating that this method has
not totally vanished (Figure 53). Very likely, however, many such purchases are for smaller
volumes.
Figure 53 Do You Purchase Stumpage?
Frequency Percent
Valid No 28 34.6%Yes 38 46.9%Total 66 81.5%
Missing 15 18.5%Total 81 100.0%
Source: PAC Contractor Interviews.

Pan Atlantic Consultants/The Irland Group November 18, 1999
Page: 95
Forty-two percent of those responding work on Contract for Logging Services contracts
(Figure 54), but CLS was much less common 7 years ago (Figure 55).
Figure 54 Do You Work on CLS Contracts?
Frequency Percent
Valid No 32 39.5%Yes 34 42.0%Total 66 81.5%
Missing 15 18.5%Total 81 100.0%
Source: PAC Contractor Interviews.
Figure 55 Current CLS % Production and % CLS 7 Years Ago
CurrentCLS % CLS 7
Production Years Ago
N Valid 33.00 44.00 Missing 48.00 37.00
Mean 80.00 46.59 Median 100.00 45.00 Mode 100.00 0.00
Source: PAC Contractor Interviews.

Pan Atlantic Consultants/The Irland Group November 18, 1999
Page: 96
For 79 respondents, the average season was 40 weeks, and the most common was 43
weeks; 75 % worked 38 or more weeks (Figure 56).
Figure 56 Total Weeks in 1998-99 Season
N Valid 79.00
Missing 2.00 Mean 39.86 Median 40.00
Source: PAC Contractor Interviews.
The duration of contractor relationships with landowners varies (Figure 57) while there
are many examples of extremely long relationships, brief ones are common. The recent high
turnover of landownership is affecting this.
Figure 57
Number of Years with Landowner #1
Source: PAC Contractor Interviews.
Cum
ulat
ive
Perc
ent
N=67
01
23
45
67
89
1012
1314
1516
1718
1920
2530
3233
3844
48
110%
100%
90%
80%
70%
60%
50%
40%
30%
20%
10%
0%
Years
Pan Atlantic Consultants/The Irland Group November 18, 1999
Page: 97
HEAVY EQUIPMENT
As noted previously in the report, the types of capital equipment used in logging in
Maine have changed markedly since the era of the chainsaw and skidder. Mechanization in the
State means higher productivity as well as the ability to selectively harvest trees and to more
readily practice sustainable forestry techniques. The types of machines most commonly
mentioned in the woods at present include feller-bunchers, grapple skidders, and delimbers
(these three often used in conjunction with one another); cut-to-length or CTL processors and
forwarders (also often acting in concert as a production unit); and chippers and loaders. All of
these machines are pictured in the following section, entitled “Photo Essay: Modern Logging
Equipment.”
Firm-Owned Machinery
Based on the Contractor Survey (n=81), immediately below are listed the types of heavy
equipment owned by logging contracting firms. These statistics include (i.e., this list is additive
to the worker-owned equipment list in the section immediately following this one).
-- Approximately 25 contractors own 48 feller-bunchers. Brand names include
Caterpillar, John Deere, Tigercat, Timbco, Timberjack, and Samsung.
-- Approximately 10 contractors own 15 CTL Processors. Brand names include
Timberjack, Timbco, Valmet, Rottne, and Rotobec.
-- At least(*) 5 contractors own 13 forwarders.
-- At least 13 contractors own 48 grapple skidders.
-- At least 3 contractors own 14 delimbers.
-- At least 1 contractor owns 2 chippers.
-- At least 3 contractors own 11 cranes and loaders.
Pan Atlantic Consultants/The Irland Group November 18, 1999
Page: 98
* The phrase "at least" is used because of difficulties that a few respondents appear to have had
in indicating their equipment in appropriate spaces on the survey form. Actual numbers of
contractors owning each type of equipment may be higher than the stated numbers by one or two
contractors.
The figures above indicate that the number of feller-bunchers outweighs the number of CTL
processors among our sample by over 3:1 (about 3.2 to 1). By comparison, another question on
the same Contractor Survey (i.e., "What were the primary wood harvesting technologies
employed by the firm during the 1998-99 operating season?") yields a very similar ratio of the
number of contractors utilizing feller-buncher technologies versus the number of contractors
using processor technology -- just under 3:1 (about 2.8 to 1). The harvesting technology
question reveals that 39 contractors (or 48% of the total 81 respondents) cut with feller-bunchers
and 14 (or 17% of the total 81) cut with CTL processors. Most of the rest cut with chainsaws
and skidders, though a few did not respond to the question. Worker-Owned Machinery
Based on the Worker Survey (n=173), the following pattern of ownership of these types of
machines comes to light:
Feller-Bunchers
-- Employers report that 3 US workers and 1 Visa-Commuter own feller-bunchers.
-- Of the workers, 1 US worker reports ownership.
CTL Processors
-- Employers report that 1 Bond owns a CTL.
-- Of the workers, 1 US worker and 1 Visa-Commuter report ownership.
Pan Atlantic Consultants/The Irland Group November 18, 1999
Page: 99
Grapple Skidders
-- Employers report that 7 US workers and 3 Visa-Residents own grapple skidders.
-- Of the workers, 2 US workers, 2 Visa-Commuters, and 1 Dual Citizen own them.
Other
-- Employers report that 1 Bond owns a Forwarder.
-- Workers report that 2 US workers own Delimbers.
-- Workers report that 1 US worker owns a Loader.
Because our intent was to focus on heavy equipment not currently being monitored in MDOL
surveys, no cable skidders, logging trucks, or roadbuilding equipment are incorporated in this
analysis.
None of the types of heavy equipment mentioned above has been regulated in the Maine
Woods to date in terms of reimbursement (or “rental”) rates paid to equipment-owning
employees by their logging employers. Bearing in mind the confidence levels and expected
margins of error of the Contractor and Worker Surveys (see Appendix – Methodology), we
recommend that MDOL track rates for feller-bunchers, delimbers, grapple skidders, CTL
processors, forwarders, and loaders. All of these are in regular use in the Maine Woods, and
there is evidence that employees take them to work in some cases. Just as MDOL regulates
reimbursement rates for chainsaws and cable skidders, we do not believe that there are reasons to
ignore these “new” categories of heavy equipment. Reimbursement rates are a part of the total
compensation picture for Maine logging workers who rent their equipment. Further, Hypothesis
2 in this report demonstrates industry changes in technology, and explains our position that
mechanization in the North Woods will continue. For recommendations as to rate-setting
methodology, see this report’s final section “Program Operation.”

Pan Atlantic Consultants/The Irland Group November 18, 1999
Page: 100
PHOTO ESSAY: MODERN LOGGING EQUIPMENT
The following pictures present some of the key types of heavy equipment in use in the
Maine Woods today. Logging contracting firms and, in some cases, individual workers,
increasingly own these types of equipment to better compete in today’s logging industry. Not
pictured here but also very important to wood harvesting activities are construction equipment,
including bulldozers and excavators, which are used to build roads.
Delimber. Author photo.The delimber removes limbs from trees cut by a chainsaw or feller-buncher and skidded to landing. It is usuallyaccompanied by a grapple skidder.

Pan Atlantic Consultants/The Irland Group November 18, 1999
Page: 101
CTL "Processor". Hahn Machinery photo.
The processor cuts, delimbs, and "bucks" to specified lengths.
Whole-Tree Chipper. Author photo.
This converts entire trees, including branches, to chips.

Pan Atlantic Consultants/The Irland Group November 18, 1999
Page: 102
Forwarder. Fabtek photo.The forwarder loads logs cut by the CTL Processor and brings them to roadside.
Grapple Skidder. Caterpillar photo.
This machine "skids" (or drags) logs or full trees to the landing.

Pan Atlantic Consultants/The Irland Group November 18, 1999
Page: 103
Feller-Buncher. Tigercat photo.This machine cuts a tree and places it in a "bunch" for skidding.
Tracked Loader. Hyundai photo.Loads logs onto a truck at roadside.

Pan Atlantic Consultants/The Irland Group November 18, 1999
Page: 104
A NOTE ON SEASONALITY
Landowners do not keep data on when wood is cut, but they record when it is scaled.
Four Maine landowners agreed to share indexes of monthly scale volumes for this report. These
scale volumes give an indication of the typical pattern of wood harvesting operations and hint at
the degree of variability between owners. Scale data is usually one to two weeks behind cutting.
Figure 58
Per
cent
Major Northern Maine LandownersWood Scaled by Month
J F M A M J J A S O N D
20%19%18%17%16%15%14%13%12%11%10%
9%8%7%6%5%4%3%2%1%0%
A (Avg 97&98) B (98) C (98-99) D (98)
Source: Confidential data provided by four landowner (indicated as A, B, C, and D).

Pan Atlantic Consultants/The Irland Group November 18, 1999
Page: 105
In part, the logging season is determined by muddy roads and landings in “spring
breakup,” which affects most of the Maine Woods. Also, lower trucking weight limits on state
roads are a factor. It is also possible that contractors and workers desire a “spring break”
themselves, to escape from camp life until school is out. This could account for the fact that
operations in the northerly areas do not leap immediately into full production when roads harden
up again, usually in early June. For the contractors, or employees owning skidders, a two-three
month period of idle machinery is a cash flow problem because the note on the machine very
likely includes only one “skip” payment, but workers can and do draw unemployment during
these months. The long off-season also imposes costs on the mills in terms of financing large
log piles, and on landowners in terms of interrupted monthly cash flow. The desire for as long a
cutting season as possible is one area in which the interests of all actors, from workers to mills
and landowners, are aligned. For more on worker attitudes on seasonality, see later sections on
occupational choice and labor supply.

Pan Atlantic Consultants/The Irland Group November 18, 1999
Page: 106
DESCRIPTION OF THE H-2 PROGRAM
Having examined the historical, economic, and sociocultural environment which
underlies current debates about the labor situation in the Maine Woods, we more fully introduce
the Federal Government program at the heart of the issue: the H-2 Bonded Labor Program.
This section describes the timeline for the H-2 process (Authority: 20 CFR 655.200 –
655.215 “Subpart C—Labor Certification Process for Logging Employment and Non-H-2A
Agricultural Employment.”)
Sample H-2 Timeline
Early March
• Previous year’s logging season ends with the onset of mud season
Logging companies wishing to hire alien bonds make projections as to hiring needs for
next season
Logging companies or their agents file H-2 applications with the MDOL, usually through
the Maine Job Service local office
Applications must be filed a minimum of 80 days before the projected date of first need
(estimated here to be June 1)
MDOL checks application to see that it contains the following required elements:
!"Job offer (same for US and foreign workers), including proof of the following:
# of workers needed
position description/duties
wage rate (piece-rate or hourly)
acceptable housing free of charge
must offer WC or other insurance at no cost to worker
all tools must be provided free (or will reimburse)
3 meals/day at regulated cost (or acceptable kitchen)

Pan Atlantic Consultants/The Irland Group November 18, 1999
Page: 107
employer must pay for transportation to/from work
employer provides daily transportation to worksite
wages guaranteed for ¾ of contract period
!"Estimated date of need (i.e., contract period) – No greater than 11 months
Recruitment plan to find qualified US workers
Description of proposed cutting site and anticipated production
Provisional commitment from buyer of harvested wood
Certifications of all elements in job offer and assurances per regulations
Employer signature
• Immediately upon receiving the application, USDOL must make a determination that
such a job offer would not “adversely effect wages and working conditions” of
similarly employed US workers
If requirements met, MDOL passes to USDOL Regional Administrator in Boston, who
ultimately rules on application
Logging employer then files application I-129 with INS (which awaits conditional
approval from USDOL)
Late March – Early May
• Employers participate in required 60-day recruitment period, during which they must
perform the following activities:
!"Allow the MDOL to advertise locally and nationally through Job Service
offices and on the Internet in Maine Job Bank
Place at least two advertisements in “local newspapers of general circulation,”
(i.e., Waterville and Bangor)
Contact previous US employees
Hanging posters in community areas (e.g., town halls)
Pan Atlantic Consultants/The Irland Group November 18, 1999
Page: 108
Participate in four MDOL “pooled interviews” in Skowhegan and/or Presque Isle
and/or Fort Kent in April and May
Other cooperation with MDOL, as appropriate
Mid-May
• By the 60th
day of the recruitment period, USDOL must grant temporary labor
certification for all H-2s, unless US workers have made themselves available for the
jobs. US workers are ruled to have made themselves available for work when they
have “made a firm commitment to work for the employer,” (or had a commitment
made on their behalf by a family member), when they are “very likely to sign such a
work contract” (according to USDOL), or when they have been rejected for “other
than lawful job-related reasons.”
USDOL makes a final determination as to the availability of US workers 20 days before
the first day of need.
Based on USDOL conditional approval, INS issues “provisional acceptance” I-797s to
petitioning employers (in 1998, 100% of applications approved by USDOL were also
approved by INS)
June 1
• H-2 loggers cross US border to begin work; receive I-94 “Record of
Arrival/Departure” forms
As soon as a bond begins work, his wages for the entire contract period are subject to the
“¾ guarantee,” making his removal and replacement (even in favor of a new domestic
worker) costly for his employer.

Pan Atlantic Consultants/The Irland Group November 18, 1999
Page: 109
November 1
• Assuming a 10-month contract period and according to the “50% rule” (20 CFR
655.203e), November 1 is the first date that the alien bond’s job is no longer open to
any qualified US worker.
As of this date, the H-2 employer is no longer obligated to hire domestic workers for the
jobs filled by bonds. In fact, the employer may have a disincentive to hire new
domestic workers, as he continues to be obligated to pay ¾ of the bonds’ wages under
the ¾ guarantee.
Mid-January
• End of the period covered under the “3/4 guarantee” (20 CFR 655.202b.6.i).
Assuming steady work across the entire 10-month contract period, the alien bond is
guaranteed to receive pay through this date once he began work in June.
March 31
• End of the contract period. Alien bonds must stop work and are returned to Canada at
employers’ expense. Bonds may not transfer to other employers during the contract
period and employers must reapply for bonds for the next cutting season.
Key Issues
“Adverse Effect” – According to the regulations, the “adverse effect rate” is the wage
rate which must be offered and paid to both foreign and US workers for a particular occupation
and/or area “so that the wages of similarly employed US workers will not be adversely affected.”
The USDOL may determine that the prevailing wage rate is the adverse effect rate if the use of
aliens has not depressed wages of similarly employed US workers. This is what has happened in
practice. However, the USDOL may fix a wage rate higher than the prevailing wage rate if it
can be demonstrated that the use of aliens has depressed wages of similarly employed US
workers. This latter policy option would have the effect of forcing H-2 employers to pay all of
their workers a higher wage than the prevailing rate, in effect forcing them not to use bonds and
to import additional US workers or to further mechanize.

Pan Atlantic Consultants/The Irland Group November 18, 1999
Page: 110
“50% Rule” – According to the regulations, each bond’s job must remain open to any
qualified US worker for the first 50% of the duration of the contract. MDOL maintains the job
description on the Maine Job Bank and at local Job Service offices during the first half of the
contract (on a 10-month contract beginning June 1, this would hold the job open through October
of the same year). During the first 50% of a bond’s contract, employers are obligated to hire
qualified domestic workers who apply, but have the choice whether to replace the bond with the
domestic worker or to add the domestic as an additional worker.
“3/4 Guarantee” – The employer which uses alien bonded labor guarantees every worker
on his staff employment for “at least three-fourths of the workdays of the total period during
which the work contract and all extensions thereof are in effect.” PAC’s understanding from the
literature is that the USDOL has interpreted the ¾ guarantee to apply equally to US and alien
bonded workers, and that it applies individually for each worker beginning on his/her date of
hire.
Some Implications of the H-2 Regulations
The ¾ guarantee appears to place hardship on logging employers using bonds, while its
effectiveness in promoting the hiring of domestic workers is open to question. In a legal appeal
made to the USDOL in May 1987 regarding proposed changes to applicable Federal
Regulations, the American Pulpwood Association (APA) argues that the unusual length of the
logging season (9 to 11 months, versus several weeks for other agricultural industries) forces
logging employers to guarantee employment for as long as eight months based on highly
uncertain projections about harvests. The effect is to force some logging employers (i.e., the H-
2s) to guarantee wages for all of their employees for up to eight months’ work, whether they end
up performing the work or not. This leaves H-2 employers exposed to changes in overall
economic conditions which may force them to scale back production but leave them obligated to
pay workers for the majority of the contract period regardless.

Pan Atlantic Consultants/The Irland Group November 18, 1999
Page: 111
In practice, the ¾ guarantee has applied equally to domestic workers and bonds (of H-2
employers). The APA notes that this raises a dilemma for bond employers through the three-
fourths periods of contracts: Should a domestic worker make himself available to be hired
during the first half of a bond’s contract (subject to the 50% rule), the employer must hire the
domestic worker, but has a disincentive to fire the bond because the employer is obligated to pay
the bond three-fourths of his wages for the entire contract. Should a new domestic worker apply
for work during the second half of a bond’s contract (i.e., not subject to the 50% rule), the
employer has a disincentive to hire the domestic because he is no longer obligated to do so but is
still obligated to pay the bond several more months’ wages (under the ¾ guarantee).
There is no evidence to suggest that the ¾ guarantee is extended to any domestic workers
other than those who work for H-2 firms. There would appear to be ample economic
disincentives for offering such a guarantee. The ¾ guarantee would tend to make Canadian
bonded labor a costly labor source for employers and an inefficient one if there were domestic
workers available, particularly when prevailing economic conditions are uncertain.
Nevertheless, employers in northern and western Maine along the Canadian border continue to
use bonds.
Administration of the H-2 Regulations
The H-2 program is being administered by MDOL in accordance with guidelines
developed for other areas of agricultural employment in 1988 or earlier by the USDOL’s
Education and Training Administration (ETA). The policies and procedures followed for
logging are taken from the “H-2A Program Handbook” (Handbook 398) dated January 1988 and
from Handbook 385, dated August 1981. Handbook 385 determines the methodology for the
annual Woods Wage Surveys and determination of the “prevailing wage.” Handbook 398
informs sampling methodologies and determines requirements for the employee portion of the
Woods Wage Survey. Neither Handbook 385 nor 398 was written specifically for the logging
industry, and in fact Handbook 398 applies to 20 CFR 655, Subpart B (H-2A regulations) and
not explicitly to Subpart C, the logging regulations.

Pan Atlantic Consultants/The Irland Group November 18, 1999
Page: 112
The annual Woods Wage Survey is the MDOL’s primary instrument for updating the
prevailing and adverse effect wage rates, while ES-202 employer data is used to determine the
“universe” of logging firms. This universe is then surveyed in two groups, those with four or
less employees and those with five or more. In practice, the group of larger firms requires a
sample size of 100% in order to comply with USDOL policies, while the smaller firms are
sampled at a rate of approximately one-third of their total number. In all, it is estimated that
approximately 60% of logging firms surveyed respond in a given year. Due to budget cuts, the
required number of in-person interviews and the required 10% of employee interviews has not
always taken place (e.g., in 1998).

Pan Atlantic Consultants/The Irland Group November 18, 1999
Page: 113
PART THREE
HYPOTHESES
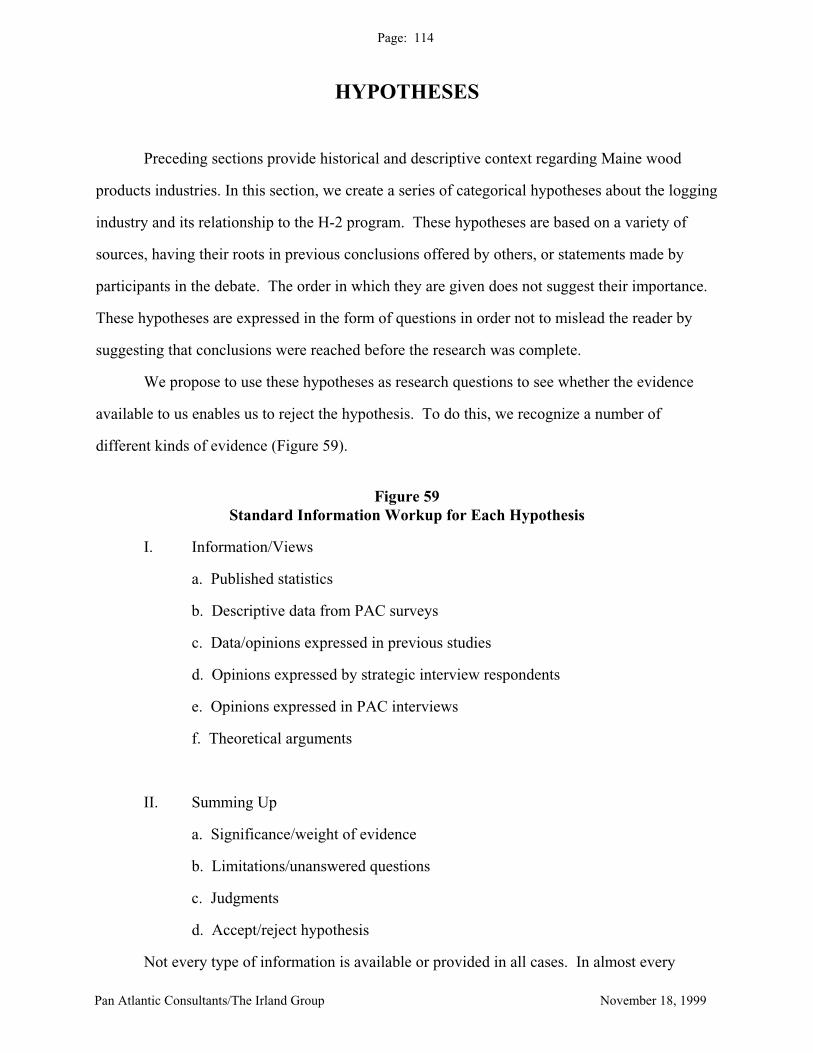
Pan Atlantic Consultants/The Irland Group November 18, 1999
Page: 114
HYPOTHESES
Preceding sections provide historical and descriptive context regarding Maine wood
products industries. In this section, we create a series of categorical hypotheses about the logging
industry and its relationship to the H-2 program. These hypotheses are based on a variety of
sources, having their roots in previous conclusions offered by others, or statements made by
participants in the debate. The order in which they are given does not suggest their importance.
These hypotheses are expressed in the form of questions in order not to mislead the reader by
suggesting that conclusions were reached before the research was complete.
We propose to use these hypotheses as research questions to see whether the evidence
available to us enables us to reject the hypothesis. To do this, we recognize a number of
different kinds of evidence (Figure 59).
Figure 59
Standard Information Workup for Each Hypothesis
I. Information/Views
a. Published statistics
b. Descriptive data from PAC surveys
c. Data/opinions expressed in previous studies
d. Opinions expressed by strategic interview respondents
e. Opinions expressed in PAC interviews
f. Theoretical arguments
II. Summing Up
a. Significance/weight of evidence
b. Limitations/unanswered questions
c. Judgments
d. Accept/reject hypothesis
Not every type of information is available or provided in all cases. In almost every

Pan Atlantic Consultants/The Irland Group November 18, 1999
Page: 115
instance, the information available suffers from limitations. In making judgments as to the
“weight of the evidence” we consider these, and decide how much weight to place on different
kinds of evidence. As the hypotheses are categorical in nature, in most cases precise statements
as to cause and effect are not made.
We believe that collectively these hypotheses tell the “story” of logging in Maine, from a
labor economics viewpoint. As noted in the report’s Executive Summary, the 10 hypotheses are
grouped according to the following topics:
--Hypotheses 1 and 2 address the role of technological change.
--Hypotheses 3 and 4 examine how market structure has set the parameters for
the positions of the major actors in the Maine logging industry today.
--Hypothesis 5 explains the pivotal role of geography.
--Hypothesis 6 analyzes the effects of public policy on the industry, and the
impact of industry structure on public policy.
--The possible effects of the H-2 program on US workers and the Maine
economy are considered in Hypotheses 7 and 8.
--Finally, Hypotheses 9 and 10 answer key questions regarding occupational
choice and labor supply as regards US workers and the logging industry.
Pan Atlantic Consultants/The Irland Group November 18, 1999
Page: 116
Hypothesis 1
DID MAINE EXPERIENCE LATE MECHANIZATION
COMPARED TO OTHER U.S. TIMBER-PRODUCING
REGIONS?
The main purpose of including this hypothesis here is to establish the context within
which Maine, in the early 1970’s, began to experience extremely rapid and dislocating change.
I. REVIEWING THE INFORMATION
a. Published Statistics and Primary Research
There is no published information directly relevant to this point. We summarize our
literature review and primary research on the history of logging in Maine in previous sections.
b. Descriptive Data from PAC Surveys
Data in previous sections indicate the extent to which logging firms and individual
loggers own heavy equipment such as feller-bunchers, cut-to-length processors, and delimbers,
among other types. In the Contractor Survey, approximately two-thirds of the companies
contacted utilize feller-buncher or CTL processor technologies as a chief cutting method, while
the remainder fully rely on the chainsaw-and-skidder technological paradigm.
c. Data and Opinions, Previous Studies
To our knowledge, previous studies have not addressed the comparative technological
position of Maine logging relative to competing regions.
d-e. Opinions of Strategic Interview Respondents & Opinions in PAC Surveys
No information sought.

Pan Atlantic Consultants/The Irland Group November 18, 1999
Page: 117
f. Theoretical Arguments
The river-drive and hand-felling logging method persisted in Maine well past its currency
in other logging regions of the country because of the unique blend of the region’s natural
features with the proximity of a large supply of laborers and their horses. Fueled by continued
demand from regional paper and sawmills, a technological stasis was able to persist, effectively
preventing a change to semi-mechanization until the 1970’s. Indeed, the presence of a large and
willing Canadian laborforce contributed to the forestalled mechanization. That nearby
Canadians were living in a largely agrarian society, with its implications for workers’
willingness to do outdoor work and the presence of horses, contributed to the situation as well.
Thus, Maine was isolated from the forces at work promoting mechanization elsewhere in the
country.
The waning influence of Canadian labor in the Maine Woods, for reasons of generational
changes in Canada and economic incentives up and down the entire wood products supply chain,
means that Maine has been somewhat freer to pursue the second wave of mechanization (and,
indeed, modernization). Like the change-over from horses and axes to skidders and chainsaws,
the current evolution from skidders and chainsaws to harvesters and processors is taking place in
the context of chronic labor shortages and the inability (or unwillingness) of the industry to
attract a new generation of laborers. This second-wave modernization is very much in process.
II. SUMMING UP
a. Significance/Weight of Evidence
For the purposes of this study, the types of evidence presented to support this hypothesis
are more theoretical and narrative than statistical.
b. Limitations and Unanswered Questions
The absence of comparative data on logging equipment in use in different regions leaves
a descriptive approach the only way to analyze this question.

Pan Atlantic Consultants/The Irland Group November 18, 1999
Page: 118
c. Conclusion on Hypothesis
We conclude that Maine did experience relatively late mechanization in comparison with
other timber-producing regions. Therefore, the hypothesis is plausible and can be accepted as
describing historical background for the current situation. It was possible for this change to
occur because machines and methods already existed and needed only to be adapted to Maine
conditions as the demand for the technologies grew.
This hypothesis lays the groundwork for subsequent discussions of the causes and effects
of labor-supply issues in the Maine Woods, in particular the role of mechanization. It also
informs future policy options in terms of the potential to encourage new entrants into the logging
industry.

Pan Atlantic Consultants/The Irland Group November 18, 1999
Page: 119
Hypothesis 2
DID RAPID TECHNOLOGICAL CHANGE LOWER THE
DEMAND FOR LABOR IN LOGGING AND PLACE
DOWNWARD PRESSURE ON INCOMES FOR SOME
WORKERS?
I. REVIEWING THE INFORMATION
a. Published Statistics and Original Research
The available statistics with which to evaluate this hypothesis suffer from several
weaknesses. The restriction of data to workers who are “employees” and the difficulty of
counting small logging firms mean that the number of loggers is underestimated in official
statistics. As noted in the previous section (Part II), there are multiple sources and measures of
“true” loggers’ wages. Available data do appear to indicate a trend, however, towards high
productivity growth, measured in terms of output per worker. Thus, we seek to document how
changes in logging productivity via technological change could have yielded falling demand for
loggers and downward pressure on logging incomes.
CHANGES IN LOGGING PRODUCTIVITY AND TECHNOLOGY
Productivity comparisons over time are problematic because all harvesting systems rely
on auxiliary support that is often not fully accounted for in the comparisons. In the horse
logging days, a crew took care of horses and camp facilities, while today a processor crew
requires mechanics and other support. Further, production systems use different operating
layouts and cut in different types of wood, so comparisons necessarily are less precise than
would be achieved if conducted in adjacent stands of the same wood.
Pan Atlantic Consultants/The Irland Group November 18, 1999
Page: 120
Until the introduction of the skidder, horses (and, in limited areas, oxen) were the
vehicles for moving logs to roadside in Maine. In the North Woods, machines such as Lombard
Log Haulers were used to move wood from roadside to landings for river driving, and then later
for trucking.
Up to the 1950’s and 1960’s, hand saws were widely used. When lightweight and
reliable chainsaws became available, they quickly replaced hand-sawing, but the horse continued
to be used for skidding. Because of river driving, it made sense to operate in the winter, when
horses performed adequately for skidding. An ample supply of horses was available, along with
men accustomed to working with and caring for them. The bulk of the supply was found in
Quebec. So Quebec horse logging crews worked far from home, even in Washington County.
A detailed study of horse logging in the 1940’s showed that on average, in typical North
Woods conditions, the horse and hand-saw system could produce roughly 2 cords per worker
day, or 10 cords a week. The study noted instances in which the workers spent 45 minutes to an
hour walking to work from the camps.
A survey by the USDOL during the 1960’s showed that workers produced an average of
18 cords for a 40-hour week. Though the production system was not described it was
undoubtedly chainsaws and horses. The same report cited an estimate by the Maine employment
agency that the average had been 15.5 cords per week in 1965. Informal estimates for the later
days of horse logging suggested up to 25 cords per man per week, or 4 to 5 cords per day.
On 2 shifts, 100 hrs./week, a CTL processor can realize 500 cords per week. Some
processor operators run 55 hours a week. The equivalent production for 40 hours would be 200
cords.
The processor is supported by a “porter” or forwarder that moves the wood to roadside
and piles it. The ratio between processors and forwarders depends on “skidding” distance, but it
takes two of them to keep up with a processor.
In contrast, a skidder on one shift can yield up to 100 cords.
Often operators working less hours will process 40-50 cords.
The skidder needs no forwarder and can do its own piling.

Pan Atlantic Consultants/The Irland Group November 18, 1999
Page: 121
It is reasonable to expect that man-day production will be as much as 35-40% greater
using a CTL/forwarder than a skidder, in the same wood. (We note that often today they do
work in different conditions).
The shift toward a predominance of one-man skidder crews from 2-man crews makes it
harder to summarize production per man-day. Recently there has been a tendency for skidders to
be used for steep sloped, or partial cutting in big hardwood. This has kept many skidders
working. Yet, the feller-buncher systems or processors can produce more cheaply than can a
skidder, and new models of processors can work anywhere no matter how rough the terrain.
The feller-buncher is usually backed by a grapple skidder, which is needed because it is
skidding whole trees to a landing. Some operations may delimb in the woods by hand; others at
roadside with a “limber.” Best practice operations tote the limbs back into the woods and do not
burn slash roadside. So a typical feller-buncher system includes a feller-buncher, grapple
skidder, and delimber.
Several practical points have favored the fully mechanized systems:
-- Because of air conditioned and heated cabs, they can operate in extreme weather where
a chainsaw-skidder crew would be back at the camp. Result: They get more operating
hours per season.
-- With their higher output, mechanical systems ease a shortage of workers.
-- Further, by working under lights, mechanical systems permit operating on the basis of
two long shifts. Result: This cuts in half the number of machines that have to be
supervised by land managers.

Pan Atlantic Consultants/The Irland Group November 18, 1999
Page: 122
Figure 60
Horses & Handsaws Horses &
Chainsaws
Chainsaw/Skidder, 70's Chainsaw/
Skidder, 90's
CTL Processor FB/Grapple
/Limber
260
240
220
200
180
160
140
120
100
80
60
40
20
0
1015-20
40-50
100
130-140
120-240
Systems Used in Maine, 1940's - Late 1990's
Weekly Production Estimates Per Worker
40 Hour Shift Equivalent, Principal Logging
Cor
ds
b. Descriptive Data from PAC Surveys
In our worker survey, the average reported production per worker was 151 cords
(US=182; Canadian = 96; Dual = 220; N=131), while the median for workers was 70 cords. (We
believe that the median figure is more representative, owing to a number of large outliers in the
sample.)
c. Data and Opinions, Previous Studies
TECHNOLOGY USED IN MAINE NORTH WOODS
There is no data on the total number of logging machines working in the Maine woods, or
for different types. Previous studies emphasize the low wages and incomes in logging but do not
analyze the long-term dynamics in detail.

Pan Atlantic Consultants/The Irland Group November 18, 1999
Page: 123
Therefore, we reconstruct a “conjectural history” through interviews with experienced
land managers. The ratios vary from place to place within the region at any given time. The
most important points are the rapid rate at which established technology systems can be largely
replaced in this industry. New management demands, improved materials and technologies, the
need to improve safety, and the need to improve worker productivity have all contributed to the
rapid pace of change. Equity and debt capital have been available to finance the new equipment.
Horse/ Early FB/ Decade Chainsaw Skidders Mech.* Delimber CTL 1960 100 0 0 0 0 1970 50** 40 10 0 0 1980 0 90 10 0 0 1990 0 50 0 50 0 1999 0 20 0 70 10 * Machines such as Beloit harvesters, later replaced by feller-bunchers. ** Experts recall percentages ranging from 10 to 90. Horses were essentially gone by 1976.
Many anecdotes from individual landowners and contractors support the fact that the
change from skidders to feller-bunchers and less so CTL’s has been extremely rapid. One source
noted that in the town of Jackman today there is not a single skidder owned. Many of the
skidders still running in many areas come over from Quebec. One result of this rapid pace of
change, in recent years, has been a substantial surplus of skidders.
This reconstruction does not apply to the southerly portion of Maine, where most cutting
is on small private woodlots. There, the skidder still dominates, but feller-bunchers and CTL
processors are increasingly seen there.

Pan Atlantic Consultants/The Irland Group November 18, 1999
Page: 124
d. Opinions of Strategic Interview Respondents
In our strategic interviews, we were told repeatedly of the rapid changes in equipment
and methods during the past two decades or so. In one of our interviews, a logging contractor
noted that his workers are working for the same wages in current dollars as they were 20 years
ago.
e. Opinions for PAC Surveys
Not directly addressed in surveys.
f. Theoretical Arguments
Economic arguments would lead us to expect unusually rapid changes in employment
levels and wages whenever rapid technological change occurs in an industry.
II. SUMMING UP
a. Significance/Weight of Evidence
Causal evidence is meager, but the timing and type of technological change correspond
well to declining employment levels and real wages.
b. Limitations and Unanswered Questions
Again, with this kind of evidence there is no certain way of measuring the contribution of
different causes to the observed results.
c. Conclusion on Hypothesis
We provisionally accept the hypothesis that rapid technological change in the logging
industry has reduced demand for workers and placed downward pressure on worker incomes.
Pan Atlantic Consultants/The Irland Group November 18, 1999
Page: 125
Hypothesis 3
DOES MARKET STRUCTURE AT THE LANDOWNERSHIP
AND LOG-BUYING LEVELS AFFECT THE CONDUCT AND
PERFORMANCE OF THE LOGGING LABOR MARKET?
Issues of importance to the Maine logging industry are necessarily and inextricably
linked with the related industries in the woods products supply chain. The market structure of
these intersecting industries affects the conduct and performance of the logging labor market.
I. REVIEWING THE INFORMATION
a. Published Statistics and Descriptive Analysis
MARKET CONTEXT: OWNERSHIP AND TRADE FLOWS
The cross-border movements of workers that are the subject of this study are but a part of
a larger pattern of cross-border ownership of factors of production, and trade in logs, chips, and
end products.
As defined in Figure 61, we can discern ten distinct levels of the marketplace and
business organization, of which movements of workers comprise only one. Within this market,
patterns of vertical integration are complex and changing. Some logging firms are “virtual”
companies, arranging and financing the business, but relying heavily if not exclusively on
contracted equipment and services. Other firms specialize in providing those services to the
“virtual companies.”

Pan Atlantic Consultants/The Irland Group November 18, 1999
Page: 126
We offer an overview of the structure of this market to indicate how supply and demand
for logging workers is tied into a web of business relationships. The market setting is one of
many deviations from the economists’ model of perfect competition, and contains many
asymmetries of bargaining power. In addition, important structural elements have been changing
rapidly. All of these factors pose impediments to narrative efforts to describe and interpret
economic behavior, much less to econometric evaluation of economic relationships.
Figure 61
Market Levels, Ownership, and Trade in Resources, Products and Factors of Production
Item Quebec NB Maine Other USA & World 1. Timberland X X X X Ownership 2. Debt Capital X X X X Provision for Logging 3. Equipment X X X Ownership 4. Logging Workers X X X 5. Logging Business X X X Ownership/ Management 6. Logs Movements in all directions 7. Trucking X X X 8. Mill Ownership X X X X 9. Chips Movements in all directions 10. Finished Paper, Same Wood Products

Pan Atlantic Consultants/The Irland Group November 18, 1999
Page: 127
Not uncommonly, discussions of the “bonded labor issue” focus only on this one level of
the market, and try to understand the impact on US workers of cross-border movements of
workers. In the process, reference is made to ownership of equipment or trade in logs.
We need to reckon with the fact that the cross-border relationships occur at multiple
market levels, often for different reasons. Efforts to change behavior at one market level,
perhaps by changing the ability of Canadian workers to work in the US, or by changing the
ability of owners to export logs, have been advocated, but there has been essentially no
evaluation of the real-world effects of such policies. Such evaluation is made all the more
complex by the fact that such policy changes would induce responses at more than one market
level.
One reasonable premise might be that the behavior of firms in the market will be
conditioned, if not rigidly determined by, the objective structural conditions in the market. If
this premise has any merit, a review of those structural conditions is called for.
MARKET CHARACTERISTICS
Several important traits of these markets affect their economic behavior. Essentially,
none of these markets, except for end product markets, are “perfectly competitive” markets in
the sense of economic theory. Such perfect markets have several traits:
-- standardized product (a “commodity”)
-- large numbers of sellers
-- large number of buyers
-- perfect foresight exhibited by buyers and sellers
-- no artificial restraints on trade
In such a market, changes in prices can be assumed to reflect conditions of supply, demand, and
cost, since no individual firm is in a condition to affect quantity traded or price.

Pan Atlantic Consultants/The Irland Group November 18, 1999
Page: 128
The softwood lumber market is a continental market -- there is no such thing as the US or
the Canadian softwood lumber market. There is one market, though that unity has been modified
somewhat by the action of the Softwood Lumber Quota Agreement. Pulp is an internationally
traded commodity, substantially competitive as a practical matter. Some lines of fine papers are
fairly concentrated, and pricing patterns indicate a degree of market power in the hands of
leading producers. But the markets for logs, logging services, and timber in northern Maine
deviate in a number of major ways from the perfectly competitive model. One reason is that
logging equipment and services, logs, and chips can only travel limited distances in contrast to
spruce lumber that can come from Interior British Columbia to Boston, or hardwood pulp that
can travel by ship from Eastport to customers anywhere in the world. When pulpwood travels
more than about 40 miles, its delivered cost is half freight.
PRODUCT NOT A COMMODITY
Standing timber is not a commodity. It is a raw resource, whose value is affected by
numerous factors. Volume and species mix per acre, topography, location, and wood quality
would be examples. In empirical surveys of stumpage prices, extremely high variation is
observed in stumpage values for the same species, even in the same area. This variation reflects
all of these factors.
Though stumpage is not a commodity, logs often are treated as such. Spruce fir
treelength wood, studwood, and hardwood pulpwood are often sold on a weight basis,
traditionally “per thousand pounds” since the introduction of weight scaling. Some products
such as boltwood, pine logs, and hardwood logs, distinguished by high unit values and high
variation in quality, continue to be “stick-scaled” and sold by volume. A given stand of trees
could in principle contain dozens of distinct products, based on species, log size, and quality.
One major Maine landowner (nonintegrated) sells wood to 41 different mills as a result of this.

Pan Atlantic Consultants/The Irland Group November 18, 1999
Page: 129
COMPETITION AMONG THE FEW
The leading feature of the market is that there are relatively few actors at each market
level. The number of landowners in any given area of the North Woods is very small. The
Maine situation is unique in that most of the land is private, in contrast to the dominance of
Crown lands in adjacent Canada. A large contractor needs a large volume of timber to cut
annually; turning to small private woodlots is really not an option.
As the industry has mechanized, the number of logging contractors has declined
dramatically. The number of sawmills has declined as they have increased in average size and
capital intensity and smaller ones have ceased operations.
While there are many sawmills in the region, the practicalities of hauling costs
mean that only a few offer reasonable markets for wood in a given area.
There are only a small number of paper mills in a given area to which the owner of a
given tract of land can ship its pulpwood, or where a sawmill can send its chips. Lucky indeed is
the sawmill that can choose between more than three mills to buy its chips.
DIVERSITY IN SIZE OF FIRMS
While most of the landowners in the region are large, the average size of holding has
declined in the past few years. Compared to the landowners and the mills, the average size of a
logging contractor is tiny. Within the contracting industry, operations vary widely in size. They
range from individuals owning one used skidder or truck, to several large operators owning
dozens of trucks and several expensive processors and forwarders, and then contracting with still
other owners to operate on their behalf.
Sawmills come in a range of sizes, and there are many small specialty mills sawing a
variety of species, at times on a seasonal basis. A few of the largest contractors have annual
revenues far larger than those of a respectable independent sawmill.

Pan Atlantic Consultants/The Irland Group November 18, 1999
Page: 130
VERTICAL INTEGRATION
A key trait is extensive vertical integration. This means that firms at one market level
often own operations at other market levels. At one time, some landowners conducted logging
operations at least partly with crews consisting of company employees. This has virtually ceased
in this region. One reason is that there is no way that large bureaucratic organizations can
outperform sole proprietorships in these kinds of activities. There is ample capital available to
operators so the large owner’s size confers no advantage in financing equipment. Further,
owner-operators take better care of equipment than employees. Finally, operating through
contractors enables landowners to avoid the consequences of unionization and to avoid
responsibility for a variety of social concerns and fringe benefits. So the former degree of
vertical integration into company logging operations has now disappeared.
Also, as paper companies have sold off timberland, the vertical integration of
manufacturing and landownership has changed. This is not as large a change as it would appear,
as much of the wood cut in the northern Maine woods has traditionally been exported to lumber
mills in Quebec and New Brunswick. That wood was not sawn in company mills anyway,
although traditionally the chips often come back to US paper mills owned by the same
landowners. Interestingly, at the same time as US paper companies have been losing interest in
landownership, the opposite has been occurring for Canadian companies. Since 1980, several
Canadian companies have purchased new or enlarged holdings in the Maine woods. In almost
every instance, the seller was a US paper company.

Pan Atlantic Consultants/The Irland Group November 18, 1999
Page: 131
Vertical integration in sawmilling shows a mixed pattern. The incentive for vertical
integration in sawmilling is diluted by the wide range of species produced by a given property.
Sawmills using pine, hardwood, spruce fir, cedar, and other softwoods often use somewhat
different equipment, operate in different ways, and serve different markets. Even integrated
owners sell significant amounts of log material. Several major paper companies also own
sawmills, which use wood from their own lands, as well as purchased wood, and which in turn
supply residue chips to the paper mills. On the border, however, there are no instances of US
landowners owning the mills in Canada that use their wood. Several Canadian sawmill and
veneer firms own lands in Maine, however, in addition to the larger Canadian paper companies
that are more familiar in this way. Vertical integration in the hardwood sector is limited,
although the Pingree Heirs now own a sawmill, and J. D. Irving, Ltd. now operates two
hardwood sawmills in the area.
CHANGE FROM SURPLUS TO SHORTAGE
Since there is a small number of actors in the marketplace, business relationships are very
stable and occur on this basis rather than on a basis of changing suppliers and customers in order
to save one percent on cost. Traditional vertical relationships in the Maine woods emerged at a
time when there was more than adequate timber available. At times, landowners were virtually
begging mill owners to expand to use it all. Traditional vertical relationships emphasized
stability and predictability rather than fluidity and nickel-squeezing, cutthroat competition.
Market relationships developed during such periods are bound to come under serious strain when
timber supplies are shrinking, as has been true for spruce fir in the past decade, or under
increasing strain, as has been true for hardwood pulpwood. When these conditions occur at
times of low end product prices, as is true at present, the ability to support old business methods
evaporates.

Pan Atlantic Consultants/The Irland Group November 18, 1999
Page: 132
WHO HAS THE BARGAINING POWER?
During times of high pulp and lumber prices, producers enjoy high profits; at market
bottoms, they sustain losses. They have little or no market power in end product markets. The
market power shifts to whomever controls the scarce resource. This is the landowner. One hint
that the land and timber are the scarce resource is the emergence of pools of capital and
individual investors willing to undertake independent ownership of these resources for the first
time. Yet, market power is not the only story here. Nationwide, gains from higher end product
prices and technological improvements are always bid back into timber values, even where
markets are very competitive.
DRAMATIC TECHNOLOGICAL CHANGE
As we note elsewhere, logging technology in the Maine has been anything but stable.
The pace of change has left large numbers of skidders unemployed. These have been sold in
other areas, scrapped, or clutter dealers’ yards. As would be expected, conditions of surplus
capacity have driven down margins in contracting. There is something of a vicious circle here.
Investments intended to cut costs in order to survive end up instead becoming investments to
save money for the landowners. No one has reported to us that contractors have had any ability
to retain benefits of lower WC costs or improved productivity for themselves and their workers.
Even allowing for the vagaries and prejudices of self-reporting that is the source of much of this,
we believe that this story is true.
Somehow -- despite the universal lament that skilled workers are costly to train and in
limited supply -- there is no bargaining power for workers.
IMPLICIT CONTRACTS
In our interviews we uncovered many examples of what labor economists call “implicit
contracting.” Implicit contracting refers to the persistence of long-term working relationships
between firms at different market levels.
One reason for long-term relationships is simply geography. Loggers located in a given

Pan Atlantic Consultants/The Irland Group November 18, 1999
Page: 133
town can conveniently recruit workers in a given area and send to them to cut within a
reasonable distance. In the 19th century when logging camps reigned supreme, workers
expected to spend the season there. After the woods were roaded but still cut in camps, they
often went home for at least occasional weekends. Now that old-style camps with cookshacks
have essentially disappeared, location becomes even more important.
Further, quality and reliability are critical factors in a successful contracting relationship
for services like roadbuilding and timber harvesting. For some of these functions, owners pay a
quality bonus. Roads will last many years, and if badly built will impose costs and generate
environmental violations. Much of the wood cut now in the Maine woods is by some variant of
partial cutting, with residual trees intended to be left to grow for a later harvest. Shoddy
skidding will damage residual trees, and unnecessarily destroy established regeneration which is
need for the next crop. Reliability is also critical. Under CLS contracting, landowners are
committed to deliver certain amounts to mills on prescribed schedules. Failure to do so is
unacceptable. Wood left piled in the woods at the end of the season loses value during breakup
and ties up capital that is needed by the company.
Very likely, the prevalence of implicit contracting in this market reflects cultural factors,
geography, and the structure of the market, and is not in itself an independent determinant of
market behavior.
b. Descriptive Data from PAC Surveys
Discussions by contractors on mobility between landowners support the notion of
“implicit contracting”.
c. Data and Opinions, Previous Studies
Previous studies have emphasized the concentrated nature of the market, and the vertical
integration, as factors endowing landowners with market power in both stumpage and labor
markets.

Pan Atlantic Consultants/The Irland Group November 18, 1999
Page: 134
d. Opinions of Strategic Interview Respondents
Respondents noted the tendency for contractors to work for long periods for a single
owner, supporting the notion of “implicit contracting” in the above analysis.
e. Opinions from PAC Surveys
The opinions of logging contractors on their abilities to negotiate price with landowners
and mill owners would seem to support the balance of power described thus far.

Pan Atlantic Consultants/The Irland Group November 18, 1999
Page: 135
Figure 62
How Negotiable are Contracts with Landowners?
1 "Prices are set"4 "Ease of accessibility"5 "A price is given, some years an increase, some years no increase"6 "We go through a little ceremony but the landowners rarely give"7 "I have a contract that states that I am liable even if they are at fault"8 "Too much competition"9 "If you don't cut it someone else will"
11 "Everytime the price of wood goes up the stumpage rates increase and landowners want top dollar just like everyone else"
13 "This is for service contracts. Historically there has been very little opportunity to influence rates on service contracts. All major landowners have gone to service contracts."
19 "There are many people with equip. that need work (owner operators)"22 "Some loggers have ruined it for others"23 "Equipment rates are predetermined by the landowner and contract is left open to possible
decreasing rates during the year"25 "I have been offered contracts with two large landowners. They would not negotiate price"26 "Mill prices drop. There's not much leeway for everyone to be paid fairly"28 "No loyalty to old hands"32 "The only negotiating done is generally done when no one will do the job, and this is not very often"35 "DOL should have minimum wage at $15/hour- wood buyer should be competitive"36 "It's like going to McDonald's- prices are on sign; it's what you get!"40 "We have to follow the competition, but prices are reasonable; we have no complaints"41 "There is room for negotiation; I set the rules"42 "When there's room to negotiate price, it's because it's a bad lot of wood"43 "Pulp is not negotiable; only exception is to try for snow bonus"44 "Our negotiating position improves after the first year"46 "This year we actually got a letter saying there would be no change in the rate -- take it or leave it."

Pan Atlantic Consultants/The Irland Group November 18, 1999
Page: 136
Figure 63
How Negotiable are Contracts with Mills?
1 "Unless you have a large amount or rare quality, there is no negotiation"2 "Price is given to you"3 "We contract very small volumes and the mills are not hungry"4 "Prices are set for the smaller operator"6 "Contracts with mills are negotiable when the supply is less than the demand. This is not the usual case."9 "CLS contractors are no longer able to sell product from company land"
10 "Usually set a fair price"11 "If you don't get along you get a bad scale or your contract is cut"12 "They dictate price (especially pulp wood prices). If you don't fill it someone will!"13 "We don't have that option. Landowner did all negotiations"14 "It depends on how much they need the wood"15 "The problem is a glut of cheap wood on the market"16 "LMCO's have complete control because they have loggers doing the jobs for nothing!"
f. Theoretical Arguments
The description given in our narrative is based primarily on standard economic theory.
II. SUMMING UP
a. Significance/Weight of Evidence
The evidence supporting this description of the marketplace is persuasive in our opinion.
b. Limitations and Unanswered Questions
Much of the key data, such as trends over time in stumpage realizations and contracting
rates, is not available for public view and even if it were, would be very difficult to evaluate.
c. Conclusion on Hypothesis
We accept that this hypothesis reasonably describes the Maine Woods marketplace. The
labor market is in many respects determined by the concentration of landownership in
northernmost Maine among relatively few large landowing companies. It is important to note,
however, that this hypothesis is not sufficient by itself to describe all market behavior.

Pan Atlantic Consultants/The Irland Group November 18, 1999
Page: 137
Hypothesis 4
DO INDUSTRYWIDE FACTORS PLACE MAINE
LANDOWNERS AND LOGGERS UNDER COST PRESSURES?
THE COST SQUEEZE IN THE WOOD HARVESTING INDUSTRY
In this section, we consider the trends in the wood harvesting industry over the past 25
years, with a particular focus on the welfare of workers in the industry. In order to achieve this
goal and for comparative purposes, we reference the broader situation at the national level.
a-b. Published statistics and descriptive data from PAC surveys
Many economists agree that the economic well-being of workers in the US economy has
deteriorated over the past quarter century. The real hourly wage in private non agricultural
industries declined by 9.4% between 1973 and 1998, while the real hourly wage in
manufacturing declined by 10.1% over the same period.1 These declines occurred despite a 33%
increase in output per hour (productivity) of all employees in the non farm business sector.2
In general, the Maine labor market has bucked the national trend. In particular, real
manufacturing wages rose by 12.2% between 1973 and 1997.3 Yet there is a wide range of
experience across manufacturing industries. In more traditional industries, real wages fell at
rates comparable to the national average: textiles, 1.9%; leather products, 9.8%; lumber and
wood products (including wood harvesting), 12.3%; food and kindred products, 6.8%; and
apparel, 1.0%. Meanwhile, the paper, printing and publishing, and rubber and plastic industries
1 Economic Report of the President, Feb. 1999. US Government Printing Office, p. 382
2 Ibid, p. 384.
3 Maine Employment Statistical Handbook, Maine Department of Labor, various years.

Pan Atlantic Consultants/The Irland Group November 18, 1999
Page: 138
experienced large wage gains.4 The Maine averages benefited from a shift in industry mix as
low-wage sectors shrank.
Beyond the declines in absolute measures of well-being, there have been increases in the
variation of workers’ income at the national level. Such changes are typically associated with
increased economic insecurity. In particular, the distribution of income has shifted dramatically
against workers. Since 1970, workers’ earnings share of total value added in the manufacturing
sector has fallen from 47% to 36% in 1991, and the percent of income attributable to the lowest
40% of all income earners has declined from 17% in 1980 to 15% in 1994.5 In addition, the gap
in the distribution of income between high income and low income workers has widen at the
same time that levels of job security have declined.
LABOR IN THE MAINE WOOD HARVESTING INDUSTRY
The trend in the wood harvesting industry in Maine is far more severe than the national
pattern. As illustrated earlier, between 1973 and 1997, the real wage of wood harvesters
(loggers) declined by 31.8%.6 This occurred despite a productivity gain of 74.4%.7 In addition,
covered employment in the industry decreased from 3,764 to 2,516. Despite the decline in
employment, a chronic shortage of loggers is argued to exist. Understanding the conditions
which underlie these patterns, particularly in light of an apparent labor shortage, is a major focus
of this project.
4 Consistent historical data does not exist for these industries. This discrepancy between traditional and non traditional manufacturing industries is readily explained. The under-developed nature of the non-traditional industries and the rapid growth of these sectors over the past 25 year led to large wage gains. 5 World Development Report, World Bank, various years. 6 Composite hourly all-around logger piece rate wage from Maine woods wage survey conducted by the Maine Department of Labor adjusted for inflation by the consumer price index. 7 Here, productivity is measured as value of shipments deflated by the producer price index and then divided by employment. All calculations are for SIC Code 2411.

Pan Atlantic Consultants/The Irland Group November 18, 1999
Page: 139
As introduced in Hypotheses 1-3, the trend in the economic condition of Maine loggers
deviates dramatically from the national pattern for all workers, and even from the experience of
traditional Maine industries, due to a confluence of distinct structural factors. In addition to the
impact of international competition, the logging industry is characterized by concentrated control
over raw materials (saw logs and pulpwood), a high degree of vertical concentration across
successive stages of production and distribution, and limited competition between employers in
the labor market. Together, these three factors in conjunction with national trends constitute a
powerful force capable of significantly eroding loggers’ economic bargaining power.
Specifically, the combination of concentrated power over raw materials (raw logs) and vertical
integration allows for a double squeezing of the profits of non-integrated logging contractors.
This profit squeeze can exert significant downward pressure on the real wages of loggers.
As previously discussed, in the early 1970’s, the vertical concentration in wood
harvesting largely followed a pattern of integration where all stages of production — raw
materials, harvesting and milling — were controlled by large landowners/paper companies. By
the late 1970’s a transition had occurred. In particular, paper companies gave up their company
(harvesting) crews leaving virtually all harvesting to be done by “independent” contractors.
Possible rationales for this transition were rooted in attempts to resist loggers’ unions,8 to avoid
the higher hourly wage (relative to piece rate wages) demanded by the more highly skilled
operators of mechanized equipment, and to avoid the rapidly increasing workers’ compensation
(WC) rates.
This system of integration went through another transition in the late 1980’s. The
stumpage system of contracting was largely replaced by direct contracting for logging services
(CLS). This latter system allowed landowners to directly negotiate with mills over the price of
lumber instead of contractor negotiations. This transition was precipitated by large future
investments by landowners needed to respond to the spruce-fir budworm devastation.
The transition to CLS allowed landowners to further concentrate their market power, particularly
8 In the firm survey associated with this study only 9.5% and 5.6% of harvesting firms (N = 72) respectively report working under a union contract in the 1998-99 and 1997-98 seasons.

Pan Atlantic Consultants/The Irland Group November 18, 1999
Page: 140
when negotiating with non integrated mill owners. Not only did it lead to lower mill profit
margins, but it also extended more financial control over contractors through the setting of CLS
prices.9
DOCUMENTING THE WAGE AND PROFIT SQUEEZE IN WOOD HARVESTING
In order to document the wage and profit squeeze in the industry, we analyze the
interconnection between the pricing decisions, costs, and thus profits of the three relevant
economic agents (landowners, contractors and mills). In order to achieve this goal, we employ a
mark-up pricing representation of the relevant price, cost and profit nexus. In this approach, a
firm’s price is represented as a mark-up (a multiple) of its variable costs per unit of output:
price = mark-up * (unit variable costs)
The mark-up is a number greater than one and covers or includes the firm’s fixed costs and
profits on a per unit basis. Thus, the firm determines its unit costs and marks those costs up
when determining its price.10
The mark-up along with the volume sold determines the firm’s profit.11 The mark-up is
determined by the market power or degree of competition facing the firm. Thus, monopoly
power, vertical integration, and the degree of international and regional competition all influence
the size of the mark-up and the profitability of the firm/industry.
Variable costs can be decomposed into unit labor costs plus unit material costs. It can
further be noted that unit labor costs are comprised of wages divided by labor productivity, while
unit material costs are equivalently the price of materials times the amount of materials used per
9 Under the stumpage system, stumpage rates were only loosely correlated with lumber prices. Implicit contracts fostering stable relations between economic agents underlie this relationship. The transition to ClS signaled a more vigilant monitoring of contractor’s costs by landowners in order to more fully exploit/capture cost savings originating in the contractor’s economic sphere.
10 Mark-up pricing is a common rule of thumb used by many businesses in the economy.
11 More specifically the mark-up directly determines the share of profits in the value added of the industry.

Pan Atlantic Consultants/The Irland Group November 18, 1999
Page: 141
unit of output. Considering these relations, the above mark-up pricing relation can be rewritten
as:
unit)]per (materials * materials of (price +
typroductivi
wage[ * upmark- = price
Invoking the assumption that materials (logs) used per unit of output have not changed in
the wood harvesting industry over the past 25 years, the key variables which affect the
firm’s/industry’s profitability (mark-up) are the trends in wage costs, productivity, price of
materials, and the firm’s output price, along with the direct determinants of the mark-up
discussed above, and thus profits. In addition, market power in the labor market can limit
increases in wages which can potentially increase a firm’s/industry’s mark-up and profits.12 In
general, whenever a cost component changes, the impact is absorbed either by a price change or
a change in the mark-up, or both. If the mark-up increases (decreases), the firm’s/industry’s
profitability increases (decreases), and worker’s share of the value added decreases (increases).
Thus, shifts in the relative economic well-being of employers and employees can be detected
through changes in the mark-up.
12 This assumes that competitive pressures do not force the firm to pass the lower wage costs on in the form of lower prices. Alternatively, the potential profit gains can be transferred to another economic agent via an increase in that agent’s prices when their output serves as a material input for the firm experiencing lower wage costs. It is argued below that this latter case occurred in that the increased profitability of contractors from their monopsony power was transferred to landowners through higher stumpage rates and/or lower CLS rates.

Pan Atlantic Consultants/The Irland Group November 18, 1999
Page: 142
In order to gain insight into the relative changes in economic welfare in the wood
harvesting industry over the last quarter century, it is necessary to consider the percentage
changes over time of the components in the above pricing equation in their appropriate relation
to one another. Using % ∆ to denote “percentage change,” the relevant changes in the above
pricing relation can be summarized as:
materials of price % _ w + ty]productivi % - wage [% _ w + upmark- % = price % mL ∆∆∆∆∆
where wL and w
m are the shares in percent that labor costs and material costs respectively
comprise of total unit variable costs.13 Given that the % ∆ mark-up is not readily measurable, it
is treated as a residual calculated from data on all other components in the above equation.14
The above equation is considered for the three key economic agents in the interrelated
chain of production that encompasses the sawlog-milled lumber and pulpwood-market pulp
industries. Specifically, we consider landowners as the suppliers of raw materials to harvesting
contractors who sell sawlogs and pulpwood respectively as inputs to sawlog mills and paper
mills. The effects on labor are considered subsequently and consequently.
13 If Workers’ Compensation costs are directly considered, the % wage in the above equation should be replaced by % wage + %(1 + comp. rate). 14 It should be noted that equation (1) is derived from using derivatives (calculus) and is thus only valid for small changes in the variables making up the equation. Given this limitation, equation (1) is approximated in Table 2 by considering the average of the actual percentage change and the change calculated as a percent of the end (last) value of a variable. This method allows large changes to be considered.

Pan Atlantic Consultants/The Irland Group November 18, 1999
Page: 143
It is important to recognize the key interactions between agents that feed across the
pricing equations for each individual agent. For example, if a landowner increases the stumpage
price of logs to the harvesting contractor, the contractor must either pass the increased costs onto
the mills or absorb the higher costs as lost profits or recoup the lost profits by reducing wage
increases or the absolute level of wages. In the case where the contractor raises prices, the mill
owners are now faced with higher costs which lead either to higher pulp or lumber prices, lower
profits or lower wages. The ultimate outcome depends on the relative market/bargaining power
of the four economic agents that interact. Over time, the relative position of each agent can
change. We now turn to an analysis of how the four agents have fared over the past quarter
century in the wood harvesting and related industries.
Table 28 lists the three economic agents for which a price equation is analyzed. The
table also specifies the measures used for each component in the relevant industry pricing
equation and the source of the data. Table 29 reports the percentage change in each component
from 1973 to 1997, the appropriate weights employed (wL and w
m) for the labor and material
components of unit variable costs, and the implied behavior of the industry mark-up. Two
percentage changes are reported in each case: the actual % ∆ and the average % ∆ . The latter is
used to calculate the % ∆ in the mark-up in order to give the best approximation of this change.
Ranges in reported components result from the use of alternative measures for particular
components.

Pan Atlantic Consultants/The Irland Group November 18, 1999
Page: 144
The trends reported in Table 29 support the existence of a double squeeze of logging
contractors’ profits and the resulting squeeze of loggers’ wages. In particular, landowners
exploited their control over the supply of logs through large increases in stumpage rates (285%).
In addition, the landowners’ ability to transfer profits from contractors was further facilitated by
the transition to a new (CLS) contracting system.15 As a result, the landowners’ mark-
ups/profitability increased by as much 169% -- apparent revenue gains exceeded increases in the
cost of maintaining forest lands by this percent. This calculation, however, does not consider the
changing pulpwood-log mix over this period. This shift toward logs increased competition in the
market, as well as improved unit values of the wood. At the same time, smaller logs were used.
On the other hand, focusing on price alone misses the effect of declining harvest volumes after
the late 1980’s on landowner revenues. Accounting for these variables would massively
complicate this analysis, but we can consider the 169% figure to be an upper limit. Nationally,
the dynamic in this industry is that gains from higher end product prices, as well as from
technological improvements, are captured by stumpage values.
15 Not only does the CLS system allow landowners to directly use their control over large volumes of wood when negotiating with mills, but also gives them the ability to more closely monitor logging contractors’ costs. Thus it is easier to transfer contractor cost savings to landowners through the setting of stumpage rates and CLS prices. For example, most contractors argue that the cost savings from lower workman compensation rates were ultimately transferred to landowners through increased stumpage rates and lower CLS payments.
Unfortunately data on CLS contracts are not readily available. It is possible that such data would reveal even steeper increases in the cost of logs or payment for services to contractors.

Pan Atlantic Consultants/The Irland Group November 18, 1999
Page: 145
The impact on logging contractors and workers is evident in the cost-price-profit
interactions of the contractors. In particular, the large increase in material costs (stumpage rates)
over-burdened the contractors’ cost structure. Despite the logging firms’ ability to moderately
raise prices relative to the small price increases realized by mills, these firms barely treaded
water over the period analyzed. In particular, mark-ups marginally increased from 1973-1997 by
13%, but only because workers’compensation (WC) rates declined radically between 1992-
1999.16 During most of the period, from 1973-1992 when WC rates rose, the mark-up basically
stayed constant or declined marginally. In the face of large increases in material costs, logging
contractors limited the decline in profitability or barely maintained their profitability by severely
restricting wage increases and by engaging in the further mechanization of harvesting as another
way to reduce labor costs through productivity increases.
The resulting squeeze of real logging wages is large relative to both the real wage
declines experienced in the paper and sawlog industries and those experienced in the national
economy. In light of the similar or even smaller increases in competitive pressures in harvesting
compared to milling and paper production (discussed below), the significant market power of
contractors and possible wage limiting effects of the H-2 program17 could explain this significant
deterioration of real wages. The absolute decline in real wages is also facilitated by the decline
in union representation, the disbanding of company crews, the displacement of workers as a
result of mechanization and a shift in macro policies leading to higher international competition.
16 It is possible that the increase in the mark-up is overstated due to lower CLS payments, but without CLS contract data this cannot be definitively shown.
17 Monopsony power in the labor market restricts both wages and employment. Later,
we consider directly whether the H-2 program allows employment to be extended at the artificially low prevailing wage.

Pan Atlantic Consultants/The Irland Group November 18, 1999
Page: 146
Only in the sub-periods where the % ∆ in the mark-up was positive did contractors
marginally gain at the expense of workers. The notion that the contractors’ economic condition
was as bleak as the loggers is supported by key survey responses. Seventy-four percent of firms
(N = 77) responded that their profitability had either been dramatically reduced (38%) or
reduced (36%) in the 1990’s, while 64% of firm owners responded that they would not
encourage their children to enter the logging industry.
The market power of landowners that underlies the wage squeeze in logging is best
summarized by the high concentration levels in the ownership of forest lands. Between 1972
and 1999, the largest 4 (later: 8) landowners controlled on average 32% (later: 49%) of forest
land in Maine. If only industrial forest land is considered, the largest four industrial landowners
owned on average 62% of this type of land.18 While the degree of concentration has declined
over the past 25 years, it still remains high.19
The power of landowners over logging contractors is also established by firm survey
responses. In complement to the quotations presented under Hypothesis 3, 88% of contractors
(N = 74) responded that either there was no room for negotiation (42%) -- take it or leave it -- or
little room for negotiation (46%) when contracting with landowners. The median (mean)
number of landowners that firms indicated they could negotiate a contract with was 2.5 (4.95)
indicating that contractors had little competition for their services. This is not surprising, given
their remote geographic locations and the high levels of land concentration.
18 If the less intensively managed but commercially harvested 1.85 million acres held in family trusts are included along with industrial classified land, then the largest four owners controlled 47% of commercially harvested land.
19 The largest four owners had 27% of all land holdings and the largest 4 industrial
owners had 54% of industrial land in 1999.

Pan Atlantic Consultants/The Irland Group November 18, 1999
Page: 147
Turning to the paper and saw mill industries, both industries have experienced moderate
declines in mark-ups/profitability in the range from 13% to 40%. The combination of small
percentage increases in product prices which are closely related to world commodity prices and
larger increases in wages relative to logging wages, although less than the rate of inflation, led to
the decline in profits. Despite the lack of separate data on the degree of vertical integration in
these two industries, it is unlikely that this type of economic power held by the mills was directly
responsible for squeezing the profits and ultimately wages in wood harvesting. Yet the forces
operating to keep mill product prices low underlie a defensive squeeze/limitation on contractor
profits and logging wages enabled by the mills’ market power.
Despite the defensive character of this relation, the firm survey responses show that mills
do exert significant market power. Ninety-two percent of logging contractors (N = 54)
responded that there is either no room (57%) or little room (35%) for negotiation when
contracting with mills, while the average number of mills with which firms could contract was
2.81. Thus, there is little competition for contractor output. These responses suggest that mills
did have enough market power to limit contractor profits through the prices paid for logging
output. Yet, this pressure on contractor profits was limited by the extent of the profit squeeze
initiated by landowners.
Explanations for changes in price-cost mark-ups generally focus on changes in an
industry’s competitive environment and/or changes in the use of market power. Table 30
considers the level/intensity of competition measured by the degree of international and regional
penetration of imports. By examining Table 30, one can see that in wood harvesting
international competition is not a significant factor, but regional competition does play a role in
the form of log exports. Without historical data on regional competition, it is difficult to
definitively assess its impact on the profit and wage squeeze in this industry. In contrast,
international competition plays a significant role in the paper and lumber milling industries
accounting for 19% - 29% of the domestic market. In these sectors, the increases in competition
have been large, particularly in the paper industry.
The competitive environment is also determined by the degree of vertical concentration,

Pan Atlantic Consultants/The Irland Group November 18, 1999
Page: 148
the level of market power in the labor market for loggers, and the market power of landowners.
Direct measures of the degree of vertical concentration are elusive. While the degree of
integration has declined over time, large paper company/landowners are still responsible for a
significant percentage of timber output. The market power of pulpmills and sawmills has been
indirectly established from the answers to survey questions discussed above. The potential
market power of landowners has also been established from concentration levels and survey
responses. Finally, it is difficult to directly measure the extent of market power in the labor
market. Economists typically use the inverse of the elasticity of labor supply with respect to the
wage rate as an indicator. In a subsequent econometric analysis, this elasticity is estimated.
Given the competitive environment, the double-sided squeeze of contractors’ profits and
the resulting squeeze of loggers’ wages can be better understood. In response to significant
increases in the intensity of competition and increased material and labor costs, mills limited the
squeeze of their profits by utilizing their market power as buyers and restricting the prices paid
for contractors’ output (i.e., logging services). Thus, contractors’ profits were also squeezed, on
their supply side. In a defensive response, the contractors exercise their labor market power by
restricting the growth in logging wages. The end result was that contractors’ profitability and
their ability to survive were compromised, while loggers suffered a significant decline in their
standard of living. In contrast, landowners improved their position in the redistribution of
incomes in these three related industries over the past 25 years.
In a forthcoming econometric analysis, the elasticity of labor supply with respect to wage
rates is statistically estimated from data collected in the firm surveys. This exercise serves two
purposes. First, it can establish the existence and extent of market power which has been used
above to justify the severity of the wage squeeze in logging. Second, it will establish the
responsiveness of logger labor supply to the real wage and thus serve as the basis for policy
formation related to the current shortage of loggers.

Pan Atlantic Consultants/The Irland Group November 18, 1999
Page: 149
Table 28 Data Used to Analyze the Price Equation for Three Economic Agents, 1973-1997
Component Agent
Landowners Harvesting Contractors Paper Mills Saw Mills
Output Price Stumpage Prices (ME) (1)
Pulpwood Mill-delivered prices (ME) (3)and PPI (SIC 2411) (2)
Market pulp-bleachedNorthern softwood pricePPI 261, 2611 (2)
PPI (SIC 2421) (2)Framing lumberComposite Index (7)
Wage Forest managementcosts (9)
All-around logger composite hourly wage (ME) (4) andAvg. hourly earnings of production workers (5)(SIC 241)
Avg. hourly earnings of production workers (SIC 261) (5, 8)
Avg. hourly earnings of production workers (SIC 242, 2421) (5)
Productivity N/A For SIC 2411:
Value of shipments (ME) (1)Producer price index (2)employment (ME) (1)
For SIC 2611:
Value of shipments (ME) (1)Producer price index (2)employment (ME) (1)
For SIC 2421:
Value of shipments (ME) (1)Producer price index (2)employment (ME) (1)
Materials price/cost
N/A Stumpage prices (ME) (3) Pulpwood mill-delivered prices (ME) (3)
PPI (SIC 2411) (2)
Other Road maint. (10)Taxes (ME) (6)
Notes: N/A is not applicable. (ME) Denotes data is for Maine; No designation implies national data is used. 1 Census of Maine Manufactures, various years. 2 Bureau of Economic Analysis, U.S. Department of Commerce. 3 Maine Forest Service, various years. 4 Maine Woods Wage Survey, Maine Department of Labor. 5 Bureau of Labor Statistics, U.S. Department of Labor. 6 “Rates of return to forest land in Maine–1961-1986, “D.A. Stevens, master’s thesis, University of ME at Orono, August 1987. Data is extended to 1998 through interviews with Maine landowners. 7 Prudential Securities Data Series. 8 Calculated as a residual from other 3-digit industries (SIC 262, 263, 265, 267) 9 % change in foresters’ and conservationists’ annual earnings from 1970 and 1990 U.S. Census, U.S. Bureau of Census, Department of Commerce. 10 Based on % change in grader/bulldozer operator earnings from 1970 and 1990 U.S. Census and from interviews of construction contractors and heavy equipment dealers. 11 Landowner costs are per acre owned, rather than per acre harvested.

Pan Atlantic Consultants/The Irland Group November 18, 1999
Page: 150
Table 29
Percentage Change in Components of Agent’s Pricing Equations, 1973-1997
Component Agent
Landowners HarvestingContractors Paper Mills Saw Mills
Output price 2853
(187)167-1782
(113-121)108-153(80-107)
100-105(78)
Wage Included in“other”
127-1671
(92-115)257(165)
198-200(132-134)
Wage and WC 127-1677
(92-115)153-1938
(115-138)
Productivity N/A 74(60)
70(47)
85(67)
Materialsprice/cost
N/A 2853
(187)178(121)
167(113)
Other 22010
(165)
LaborWeight (wL)
N/A 564 30/5015 30/5015
Materials/otherweight (wm)
100 44 70/5015 70/5015
UnitVariable cost
22011
(165)-6(18)12
155-177(100-113)(113-126)9
181(120)18315
(120)
151(99)14115
(90)
Mark-up5 2213
169140 to 21[13]6
-13 to 88
[0]6
-13 to -40 -21 to -1215

Pan Atlantic Consultants/The Irland Group November 18, 1999
Page: 151
Notes for Table 29
Notes:WC is workers compensation.Figures in parentheses are an average of %! calculated with respect to starting year values(1973) and ending year values (1997). These figures are used to determine %! in the mark-upbelow.1 The lower figure is Maine composite hourly wage, while the large figure is for national levelwages in SIC 241.2 Lower value: PPI SIC 2411 (national); higher value: pulpwood mill-delivered prices (ME)using 50-50% split between spruce/fir and hardwood prices.3 Weighted average of pulpwood (80%) and sawlog (20%) stumpage prices changes.4 Includes chainsaw and skidder allowances as in labor costs.5 Calculated from equation (1) as %!P - %! unit variable cost using figures in parentheses.6 Most reliable estimate.7 Workman Compensation (WC) rates increase from $15 per $100 payroll in 1973 to a peak of$45-$48 in 1992 and then decline to around $12-$15 in 1998. The firm survey has a mean WCrate of $13.81 for 1998 (N = 59). Thus over the entire period the %! = 0 while the maximum%! = 200 between "973 and "992. These figures are based on the %! wage + %! (" + wc).8 Figures based on maximum %! in WC rates.9 With %! WC included.10 A weighted average of %! in forest management costs, road maintenance costs and taxesusing the respective weights: .40, .37, and .23 (based on cost structure derived from interviewswith landowners).11 %! cost per acre.12 %! cost per cord = %! cost per acre - %! cords per acre. %! cords per acre is estimatedfrom the %! in the volume of harvested wood ("973-"997) under the assumption that the totalof forest/timber acreage did not change substantially over the 1973-1997 period.13 Per acre.14 Per cord.15 Exact weights unknown. Two alternatives are considered.

Pan Atlantic Consultants/The Irland Group November 18, 1999
Page: 152
Table 30Intensity of Competition
Industry % of Penetration of Imports
1973 1997 %!
International Competition
Wood harvesting1
(SIC 2411) 2.0 3.5 68
Saw mills1
(SIC 2421)17.0 29.05 71
Paper mills2
(SIC 2611) 5.2 18.8 262
U.S. (all)3 5.4 9.7 80
U.S. manufacturing1
6.8 18.2 169
Regional Competition4
Wood harvesting
Sawlogs N/A 12 N/A
Pulpwood N/A 30 N/A
Notes:1 Import penetration ratio calculated as imports/(shipments-exports) from U.S. Commodity Exports andImports as Related to Output, Bureau of the Census, Bureau of the Census, U.S. Department ofCommerce, various years.2 Imports a percent of consumption, Prudential Securities, paper and forest products report.3 Imports/(GDP-exports). Data from Economic Report of the President, 1999.4 Imports from regional Canadian provinces, New England, New York and Pennsylvania as a percent ofMaine harvest, Wood Processor Report, Maine Forest Service, 1997.5 Linearly interpolated based on linear trend from 1973-1986. Value in 1986 was .24.
c. Data/Opinions Expressed in Previous Studies
This line of inquiry has not been pursued in other studies.
d. Opinions of Strategic Interview Respondents
The strategic interview respondents all supported the prevalence of extreme cost and
competitive pressures in the industry.

Pan Atlantic Consultants/The Irland Group November 18, 1999
Page: 153
e. Opinions from PAC Surveys
Respondents in the contractor survey reported increasing competitive and cost pressures,
and 74% of respondents reported that their profitability had been reduced or drastically reduced
in the 1990’s.
f. Theoretical Arguments
The underlying arguments for the empirical analysis above are based on
economic/organizational and standard economic theory.
II. SUMMING UP
a. Significance/Weight of Evidence
The evidence is descriptive, theoretical and empirical, although the analysis necessarily
uses data that are proxies for what we would wish to measure. Still, the different forms of
evidence all point in similar directions.
In the past, the concentrated structure of the industry enabled landowners and mills to
engage in practices that would not be supportable under current conditions of more extreme
regional and international competition. At the same time, the increase in stumpage values
indicates that the mills are unable to avoid competing against each other for wood. The recent
land sales will probably increase the market’s competitive behavior.
b. Limitations and Unanswered Questions
The details of how the cost squeeze operates remain partially obscure, partly because
there is no data on the time trend in Contract for Logging Services (CLS) rates.

Pan Atlantic Consultants/The Irland Group November 18, 1999
Page: 154
c. Conclusion on Hypothesis
While recognizing that the sources of the situation are multiple, we accept the hypothesis
as stated. Industrywide factors have placed Maine landowners and loggers under severe cost
pressures, leading them to exercise their market power (established in the previous hypothesis) to
some degree at the expense of logging workers.

Pan Atlantic Consultants/The Irland Group November 18, 1999
Page: 155
Hypothesis 5
IS GEOGRAPHY THE PRIMARY FACTOR IN EXPLAINING
EMPLOYMENT OF CANADIAN WORKERS
IN THE MAINE WOODS?
I. REVIEWING THE INFORMATION
The maps shown in the introductory section of this report indicate the strong pattern of
population in the region surrounding the Maine woods. In addition, they indicate that the use of
Quebec workers in the Maine woods has changed not only numerically but geographically in a
very clear way. The use of bonds has disappeared entirely in parts of Maine most distant from
Quebec, and it has continued only in those areas adjacent to the border where US commuting
distances would be the greatest.
a. Published Statistics
There is little statistical information that would directly answer this question.
b. Descriptive Data from PAC Surveys
In our augmented sample (290), we found that US workers are not presently willing to
stay at camps. Very few of them commute more than 50 minutes one way to work.
The mean commuting time among this sample is approximately 60 minutes. In northern
Maine, the average American drove 569 minutes to work; the Canadian, 79 minutes. Over night
stays away from home on account of one’s logging job is apparently very unusual.
The average worker spent the number of following nights away from home:
N. Maine 1.47
S. Maine .37
Canada 2.73

Pan Atlantic Consultants/The Irland Group November 18, 1999
Page: 156
One of the H-2 contractors illustrates location considerations very well. This contractor
cuts on private lands in Quebec. This landowner also owns a small tract of land adjacent to the
Maine border. The contractor cuts on that tract for perhaps 12 weeks a year, using the same
crews. The location is convenient, the landowner is the same, and the short season of operating
in Maine would not justify this employer attempting to hire Americans to perform this work. It
is not clear whether an American contractor would be interested in moving an operation to this
location for 12 weeks, but it is possible.
This is a specific situation, but illustrates part of the diversity of the market.
c. Data and Opinions, Previous Studies
Several previous studies argued that because of the distance into the woods and the
locations of settlements in the US, geography alone can explain much of the pattern of Quebec
working in the woods. In other words, had there existed no international boundary along
Maine’s northwestern boundary, but only a state line, the pattern of workers in the woods would
have been just what it is.
CHANGING ROLE OF GEOGRAPHY
The history shows that geography plays an important role in determining patterns of
woodsworker employment in Maine. The map prepared by Bond for his 1977 report illustrates
the point (Fig. 64). It is easy to see that Quebec communities are better suited to supply workers
to the Quebec border areas than are the Maine communities to the south and east. Yet, if
geography were the only factor, this would not explain the dominance of Canadian workers in
the woods of Washington and Hancock Counties in the 1960’s and early 1970’s.

Pan Atlantic Consultants/The Irland Group November 18, 1999
Page: 157
A series of maps enables us to depict the changing geographic distribution of the bonded
workers in Maine. A table from the Labor Department provided in the 1968 Bowdoin PARC
study tabulated locations of offices, cutting, and number of workers. The total number of bonds
certified at that time was 3,435, working for 104 employers. This has been plotted here as Fig.
65, where the number of workers is used to plot the location of cutting. The most striking
feature is the extraordinary saturation of the Maine woods with operations using bonds. Such
operations spread over the entire forested portion of the State, and even into the outer limits of
farming areas adjacent to the wildlands. The table also enables us to plot the business locations
of the operations using bonds (Fig. 66). A clear suggestion emerges from this map that it was
predominantly Maine-based operations using bonds at this time, and not only Canadian-based
contractors. There were operators cutting in Maine with New Hampshire business addresses as
well.
For 1976, we reproduce a map drawn from Labor Department data by Professor R. S.
Bond for his report (Fig. 67). In this map, we can plot only the number of operators, not the
number of bonds or the business locations. This map indicates that by 1976 the role of bonded
labor was shrinking geographically, departing almost entirely from Washington County and
Penobscot County, and shrinking significantly in western Maine.
For 1998, a map prepared from program information by MDOL indicates cutting
locations but not the exact number of bonds working in each location (Fig. 68). This map
suggests a rough stability in the area where bonds are being employed between 1976 and 1998.

Pan Atlantic Consultants/The Irland Group November 18, 1999
Page: 158
Figure 64
Communities in Maine and Nearby Quebec, mid 1970’s
Source: R. S. Bond, 1977, p. ...

Pan Atlantic Consultants/The Irland Group November 18, 1999
Page: 159
Figure 65
!"#$%&'()*%+',%-'./0%123(4542/)(%2)67%18((4.9%:'6)(4'.
;<;=
!$
>!
;<
!>
>? "; >?@>
$"!=?;$@$
<$ <
$
!A ?
!AA>@A$ <$ <>A=
A= !?@<? ;?AA@%A?@A!%
A$@A! A? A? ? ;? ;"@;#%
!# ;= !>@<> !> A> !<
!#!# !# >= >; !"@A#
!#"%?< A? # !A !$ A=@A=@
;A != #
!=#;
!> !> !> A=
!; !! A=@A=@
;A #
!!<
< A>@# >!@AAA!<@!#
## >
>!AA # #
##
<
A<@?#AA
<=
A# <
;!A@!>AA@
!>AA!<
?$A=
;A
;=
><
!> !;
A=
> AA
A#
#
!A
# ;#
A
!=A=
!;
!$
$#
>
!$
# >
<"
!=@?$>
!=
?<@#@!#
!$
;!@!?
!> A=
AAAA
Source: Bowdoin PARC.

Pan Atlantic Consultants/The Irland Group November 18, 1999
Page: 160
Figure 66
!"#$%B''/%CD23)('30%-804.200%:'6)(4'.%ECD23)('3%1'/2F
>A
>>
>?@%$!
;;@#?
GHA#@<=@<!@<<@#=-HA;@;>@><@>$@##@#!@#A
-
#"
#<
A$@$=
1
1HAA@;!@;?@>!@>#@<A@<>
G
;A A=
A"
A<@#>
A!@%A>!=!!>
"$??
<;
;<
#;@?A@!==
>;
$>>@<$@"A@">%
"@;=
?<
;$;"
A?
$A<?@#$
<"@## ;#
>"
<
>@!=
>!
!<
!?
!"
!$?@!A
!!
!##
;@!;@"!
!=>
"#
!=;
"<@""
!=AA
?!@";
$"
$;
I
IH!@?;@?>@?$@?"@"?
"=?=
$>
$?
$<
$#@$$
Source: Bowdoin PARC.

Pan Atlantic Consultants/The Irland Group November 18, 1999
Page: 161
Figure 67
+8JK23%)./%:'6)(4'.%'5%:'994.9%CD23)(4'.0%123(4542/%('%LJD*'M%-'./2/%B''/0N'3O230@%
P)M%!"$#%Q%C6('K23%!"$#
!
!!
! ! !
!!AA
!!!!! ! A !
!!! !
!!!!
A ! ! ! !! ! !
! !!
! ;
A
!
! !
!!!!
!!!!
!!
!
!
! !!!!
! !
!
R'8362S%%-'./@%!"$$@%D,%;A,

Pan Atlantic Consultants/The Irland Group November 18, 1999
Page: 162
Figure 68
Planned Cutting Areas, 1998-99 SeasonFirms Requesting Bonds
Areas Noted as Aroostook County: 19Areas Noted as Piscataquis County: 1
Source: Maine Dept. of Labor.

Pan Atlantic Consultants/The Irland Group November 18, 1999
Page: 163
INTERPRETATION: A PRELIMINARY SUMMARY
While geography cannot be ignored, it is not the only factor. Several interacting forces
are at work. One interpretation would run as follows --
a. Availability of the large Quebec workforce and supply of horses facilitated the
continuation of this 19th century technology in Maine until well into the 1960’s, long
after it had been supplanted elsewhere. River movement of wood was a key
component in this technology.
b. The end of river driving undermined the geographic basis for this technology, but
horse logging continued because of its low costs, flexibility, and the established
capital investments in it. This established technology prevented heavy investments
being made in mechanization.
c. Over much of the period from the 1930’s to the late 1970’s, the Maine paper and
lumber industries were in a marginal positions nationally, and many mills were run as
“cash cows.” Corporate priority for investments lay elsewhere. Continued
depopulation of small towns along the fringes of the wildlands eroded the potential
labor supply for woodswork.
d. Very likely, the dominance of woods work by Canadian contractors and workers
during this period contributed to lack of opportunity and continued population
shrinkage in these towns.
e. Over the entire history of the industry in Maine, analysts mention the low wages and
poor working conditions as severe recruitment problems for woods work in Maine.
With desirable paper mill and sawmill jobs available in the communities near the
wildlands, these jobs set a standard that woods work, under prevailing technology,
simply could not meet.
f. The heavy reliance on Canadian labor has meant that the bulk of the social costs of
mechanization in the Maine woods, with the accompanying large reduction in labor
demand, has been felt in Quebec and not in Maine communities.

Pan Atlantic Consultants/The Irland Group November 18, 1999
Page: 164
d. Opinions of Strategic Interview Respondents
In our strategic interviews, we were repeatedly told that American workers do not wish
to live in camps in remote locations. This is less question of distance than of lifestyle, but the
factors occur together and cannot be statistically separated. Moreover, we were told anecdotes
about workers quitting when their employer moved their operation into the more remote areas.
e. Opinions from PAC Surveys
This question was not specifically asked of respondents.
f. Theoretical Arguments
Economic theory predicts that workers consider travel costs and times and non-monetary
aspects of a job’s working conditions, in selecting employment.
II. SUMMING UP
a. Significance/Weight of Evidence
The evidence on the historical distribution of use of bonds, the responses during strategic
and contractor interviews, and the responses of workers as to their willingness to commute all
seem to us to deserve a fair amount of weight.
b. Limitations and Unanswered Questions
Historical relationships alone cannot fully explain what the labor market would have
been like had there been no H-2 program.
Detailed analyses of microdata from the PAC surveys and from the Woodsworker
surveys, beyond the scope of this project, could shed additional light on the role of geographic
factors.
Further, the role of Canadian employment has changed as the technology has changed
and the number of Canadian workers has changed.

Pan Atlantic Consultants/The Irland Group November 18, 1999
Page: 165
c. Conclusion on Hypothesis
We believe the hypothesis as posed can be accepted. While geographic factors are the
primary determinants of the need for Canadian woodsworkers, they are not the only factors
involved.

Pan Atlantic Consultants/The Irland Group November 18, 1999
Page: 166
Hypothesis 6
DOES PUBLIC POLICY AFFECT THE
SHAPE OF THE INDUSTRY?
This is a two-part hypothesis, grouping a number of explicit and implicit policy factors
into a single very general hypothesis.
A. High Workers’ Compensation (WC) rates in the early 1990’s created an incentive to
mechanize and eliminate company operations.
B. The effectiveness of social protections, such as OSHA jurisdiction and WC coverage,
is impacted by the industry shape, or structure.
I. REVIEWING THE INFORMATION
a. Published Statistics and Original Narrative
Few published statistics are directly relevant. Unpublished descriptive data and
qualitative information must be relied on. The crux of this hypothesis hinges on the role that
WC rates have played in the evolution of the Maine logging industry.
WORKER’S COMPENSATION RATES
WC rates in the late 1980’s in Maine reached extreme levels (Fig. 69). Since that time,
WC reforms, improvements in safety efforts, and intensive mechanization have caused WC rates
to decline dramatically. The rate decline is verified by an index derived from rate data supplied
by an insurer.
The WC rate acts as a tax on wages, and is very likely borne more heavily by workers
rather than by employers. Rates in the range of 35-40% are clearly high enough to have
significant effects. They were cited by one company as a major reason for ending company
crews. They were undoubtedly a major cause for accelerated mechanization in the 1990’s.
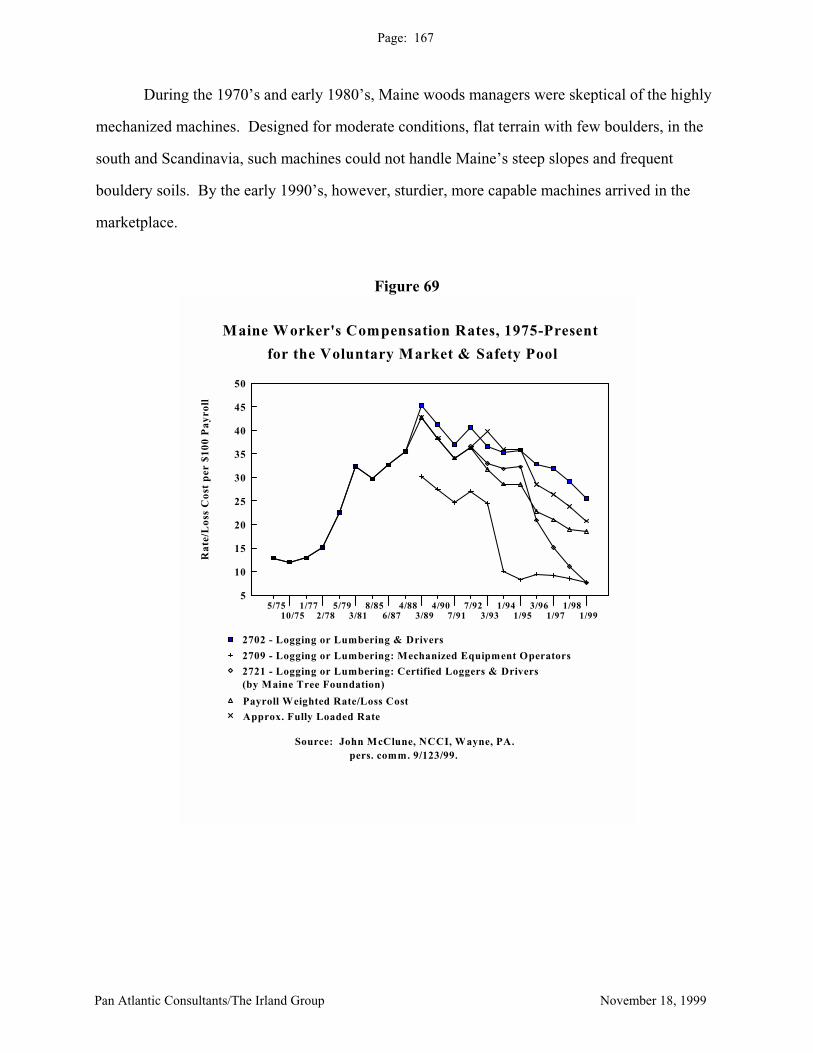
Pan Atlantic Consultants/The Irland Group November 18, 1999
Page: 167
During the 1970’s and early 1980’s, Maine woods managers were skeptical of the highly
mechanized machines. Designed for moderate conditions, flat terrain with few boulders, in the
south and Scandinavia, such machines could not handle Maine’s steep slopes and frequent
bouldery soils. By the early 1990’s, however, sturdier, more capable machines arrived in the
marketplace.
Figure 69
Maine Worker's Compensation Rates, 1975-Present
Source: John McClune, NCCI, Wayne, PA.
Rat
e/L
oss
Cos
t p
er $
100
Pay
roll
for the Voluntary Market & Safety Pool
5/7510/75
1/772/78
5/793/81
8/856/87
4/883/89
4/907/91
7/923/93
1/941/95
3/961/97
1/981/99
50
45
40
35
30
25
20
15
10
5
2702 - Logging or Lumbering & Drivers
2709 - Logging or Lumbering: Mechanized Equipment Operators
2721 - Logging or Lumbering: Certified Loggers & Drivers
Payroll Weighted Rate/Loss Cost
Approx. Fully Loaded Rate
pers. comm. 9/123/99.
(by Maine Tree Foundation)
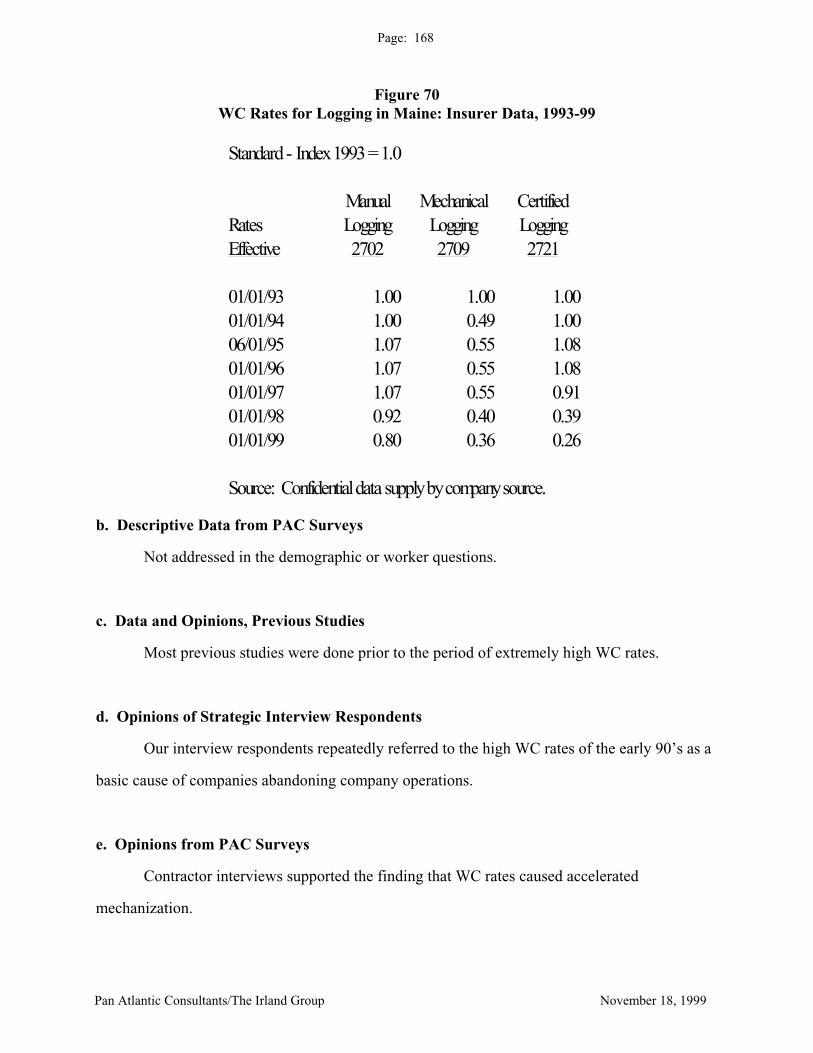
Pan Atlantic Consultants/The Irland Group November 18, 1999
Page: 168
Figure 70 WC Rates for Logging in Maine: Insurer Data, 1993-99
Standard - Index 1993 = 1.0
Manual Mechanical CertifiedRates Logging Logging LoggingEffective 2702 2709 2721
01/01/93 1.00 1.00 1.00 01/01/94 1.00 0.49 1.00 06/01/95 1.07 0.55 1.08 01/01/96 1.07 0.55 1.08 01/01/97 1.07 0.55 0.91 01/01/98 0.92 0.40 0.39 01/01/99 0.80 0.36 0.26
Source: Confidential data supply by company source.
b. Descriptive Data from PAC Surveys
Not addressed in the demographic or worker questions.
c. Data and Opinions, Previous Studies
Most previous studies were done prior to the period of extremely high WC rates.
d. Opinions of Strategic Interview Respondents
Our interview respondents repeatedly referred to the high WC rates of the early 90’s as a
basic cause of companies abandoning company operations.
e. Opinions from PAC Surveys
Contractor interviews supported the finding that WC rates caused accelerated
mechanization.
Pan Atlantic Consultants/The Irland Group November 18, 1999
Page: 169
f. Theoretical Arguments
It is clear theoretically that WC rates are a tax on wages, and that at high rates they would
both depress wages and reduce employment levels.
II. SUMMING UP
a. Significance/Weight of Evidence
The evidence is basically qualitative, anecdotal, and narrative argument.
b. Limitations and Unanswered Questions
Extremely complex primary data gathering and statistical analysis are required to obtain
valid results on policy impact questions like these. Such work was not within the scope of this
project and was not one of the primary questions to be addressed.
c. Conclusion on Hypothesis
High WC Rates
We accept the hypothesis that WC rates were important contributors to mechanization
and the shift toward more contracting and fewer company operations.
Effectiveness of Social Protections
The effectiveness of social protections are almost certainly impacted by industry
structure. In Maine logging, it seems fairly clear that the prevalence of “independent
contractors,” not covered under US labor law, mitigates the effectiveness of social protections
intended to benefit workers. In actuality, only workers whose employers fall into the “covered
employment” category of US labor law, are obligated to provide their workers with WC.
In conclusion, we accept the more basic hypothesis that public policy factors affect the
system and vice versa-- producing intended and, often unintended, effects.

Pan Atlantic Consultants/The Irland Group November 18, 1999
Page: 170
Hypothesis 7
HAS THE H-2 PROGRAM REDUCED INCOMES AND
EMPLOYMENT LEVELS OF U.S. WORKERS?
I. REVIEWING THE INFORMATION
Analyzing the impact of the H-2 program on US workers asking and answering a long
series of more specific questions, and considering a complex quantity of information from our
primary research. In this section, we begin by reviewing our primary data that contrasts H-2
workers with non-H-2 workers. The goal here is to establish if there are noticeable differences
in employment at these two types of logging firms. We then report on contractor perceptions
about bonds compared to Americans. Next, we define the range of labor market effects of the H-
2 program. We then discuss a list of specific ways in which labor market effects might occur,
and relate those to evidence from our research.
COMPARING H-2 AND NON H-2 EMPLOYERS
According to our findings, in 1998 there were 40 H-2 employers. We analyzed our 81
contractor responses to compare the H-2 and non-H-2 employers. We obtained useful responses
from 24 of the H-2 contractors. Of the 24, 10 of the owners of the H-2s were US citizens, 12
were Canadian, and 2 were dual citizens.
Principal Differences
A number of differences emerged between the H-2 and non-H-2 contractors (Figure 71).
Most prominently, the H-2 employers were much larger, on average, than the non-H-2s; cutting
42,500 cords per year compared to 21,300 for the non-H-2;s. They did not have much larger
payrolls, however, since the H-2s had average employment of 10.71 workers, compared to non-
H-2s of 7.77. They also had been with the principal landowner where they cut about twice as
long.

Pan Atlantic Consultants/The Irland Group November 18, 1999
Page: 171
Concerning the loggers:
-- The H-2s worked shorter weeks and fewer hours per day than the non-H-2s.
-- The H-2s reported heavier reliance on skidders: 62% cut 40% or more of their wood
with skidders (N=21) compared to 40% of the non-H-2s cutting more than 40%
with skidders.
Figure 71
Comparisons Between H-2 and Non-H-2 Contractors
Item H-2 Non-H-2 Total
Years in business 23.04 23.42 23.31 1998-99 Cords cut 42,500 21,300 27,700 No. employees 10.71 7.77 8.67 Years w. prin. landowner 15.36 8.62 10.84 Weeks in 98-99 season 37.92 40.71 39.86 Unfilled vacancies 98-99 1.00 0.47 0.64 Days worked / week 4.50 6.33 5.79 hours/day 9.58 11.49 10.93 Ave hrs/week 41.00 47.44 45.48 No. competing firms for wkrs 1.38 2.63 2.26 Percent wkrs return yr to yr 89.50 85.00 86.74 Travel comp. rate/mi. 0.26 0.22 0.24 Travel compens. miles/wkr/wk 121.00 99.00 112.00 Percent prod. processor/fwdr 15.00 8.00 10.00 WC rate/$100.00 14.63 13.31 13.71
Source: PAC contractor interviews
The H-2 Program: Contractor Perceptions
The H-2 contractors offered no example of anyone getting paid the 3/4 Guarantee. One
had never heard of it. Of 18 respondents, 2 believed that the 3/4 Guarantee makes them more
likely to hire US workers, but no respondent said that it affected the decision to hire bonds. One
H-2 contractor (of 18 responding to this question) said it affected labor costs.

Pan Atlantic Consultants/The Irland Group November 18, 1999
Page: 172
Of 24 H-2 contractors responding, 16 require CLP for all employees, 6 for some. Of 22
respondents, 16 H-2s said labor was scarce, 5 said “nonexistent.” No H-2 employer said that
labor was abundant, in contrast to 12 (of 47) non-H-2s who said labor was abundant or adequate.
Reasons for Hiring Bonds
Perceptions by H-2 Contractors on reasons for hiring bonds were queried in depth. Key
comparisons included:
-- Only one (of 22) H-2s agreed that there was a cost advantage
-- 6 of 22 stated that bonds were more productive
-- 20 of 22 stated that a shortage of US workers motivated hiring bonds
-- 16 of 22 H-2s said there were advantages in hiring bonds
-- 3 of 17 agreed that bonds supplying heavy equipment was a consideration
-- H-2 Employers were evenly divided on the statement “bonds are more plentiful”
-- 1 of 17 H-2s agreed that bonds not requiring health insurance was a factor
-- No H-2 employer agreed that “bonds work for lower wages” Interestingly, only 1 (of
40) non H-2 contractors supported that statement.
By 11 to 7, H-2 employers agreed that bonds were better motivated, and by 14 to 6 rated
them as having “a better work ethic.”
Summarizing these responses, it would seem that contractors do not admit to a preference
for bonds on the grounds of costs or bringing equipment. Nor do many contractors, US or
Canadian, believe that “bonds are more plentiful.” Some of them do report a feeling that bonds
have a stronger work ethic and are more motivated. In one of our strategic interviews, an
employer stated that, in his opinion, bonds and Americans are equal on a per hour basis, but the
Canadians will work more hours. Other sources have reported that Canadians are often more
willing to work “tag ends” of less desirable timber and long twitches at the end of a job than
some Americans, who are prone to quit when the best wood is done.
H-2 employers were evenly divided on whether bonds were better trained, and only one
agreed that bonds are less costly to train.

Pan Atlantic Consultants/The Irland Group November 18, 1999
Page: 173
DEFINITION OF LABOR MARKET EFFECT
In this section, we identify and explore every macro- and micro-economic level on which
the H-2 program could be causing harm to US workers or the Maine economy. We term these
levels of analysis levels of labor market effect (LME), and highlight three:
1. The marginal LME of a single Canadian worker entering the United States to work.
This is a decision for USDOL in ruling on a given application.
2. The total LME of the existence of the Bonded worker program.
This is a decision for USDOL in whether or not to continue the program.
3. The total LME of the admittance of any Canadian workers ( visas, dual citizens) to
the US to work.
This is a decision for Congress, which can rule who gets to work in the USA.
In addition, the context of the debate has broadened this question to include two
additional concerns:
4. What is the LME of Canadian equipment working in the Maine Woods?
This is a decision for...Congress?
5. What is the LME of exported logs?
This is a decision for Congress.

Pan Atlantic Consultants/The Irland Group November 18, 1999
Page: 174
MEASURING THE LABOR MARKET EFFECT
Throughout this long-standing debate, impact is typically discussed in terms of workers.
This approach ignores the fact that timberland ownership, logs, equipment, trucks, business
management, and lumber all move across the border as well. Changes in one level of the market
may cause changes at other levels. Also, changing the position of the US worker in the
marketplace could have effects at other market levels that might be negative or positive,
depending on circumstances. A proper understanding of impact will consider those possibilities.
Discussions of impact generally imply a belief that both employment levels of US workers, their
average wages, and their annual incomes would be higher in the absence of the H-2 program.
We assume that the definition of “effect” presumes some counterfactual situation which
we can mentally simulate, to see how the total market would look under a different policy
regime, if, for example, logs from private lands were embargoed from export, or if the bonded
labor program were to end. In most instances, advocates of such policies do not sketch out these
matters in enough detail to examine them for plausibility. Instead, a one-dimensional and static
economy is assumed.
In fact, a policy change such as abolishing the H-2 program would set in motion a
series of responses, some of which are hard to forecast in detail. Once these responses work
themselves out, and a new equilibrium is reached, we could contrast the new situation with the
current one and see if it suggests that US workers would be better off under this new policy, in
terms of numbers of jobs or wage levels.
ABOLISHING THE H-2 PROGRAM -- A COUNTERFACTUAL SCENARIO
If the H-2 program were to be abolished, this would not necessarily create new jobs for
the identical number of US workers. The likely adjustments that would occur in the market take
into account all the preceding factors, which characterize the Maine logging industry.

Pan Atlantic Consultants/The Irland Group November 18, 1999
Page: 175
For instance, it seems to be widely assumed that if bonds no longer can work in the
woods, scarcity will drive up wages, at the same time as employers will hire US workers to fill
the vacancies. Yet, it is well known that the vacancies are primarily in remote regions where US
workers prefer not to work. In fact, good US workers have been known to quit when their crew
is moved to those locations. If indeed wages are driven up, this would reinforce existing
incentives to mechanize, thereby in time reducing job levels once again.
One observer shrewdly suggested that some US workers should “be careful what they
wish for” because they might get it. A careful reading of the MDOL documents on the H-2 wage
findings shows that in some recent years, the wage minimums set by regulation exceeded those
found in the marketplace for some occupations. The USDOL simply refused to permit the
regulated wage level to decline as the skidder surplus, and the effect of high WC premiums,
drove down wages. Also, if the H-2 program is ended, the minimal support that program
provides for skidder rates, and perhaps chainsaw reimbursements, will disappear. The result
would be not only wage losses for skidder owners, working for H-2 employers, but capital losses
on their equipment as well.
Further, for most operations, mechanical equipment is currently cheaper (per cord cut)
than skidders. When asked what they would do if the H-2 program were ended, many persons
interviewed for this project replied that they would accelerate mechanization. This would reduce
employment, especially for loggers owning skidders. It is more than a possibility that an end to
the H-2 program would render some major quantities of equipment unemployed in Quebec.
These might be sold at low costs, or leased, to US operators, facilitating efforts at mechanization.
Whether these are correct forecasts of the market adjustments that would follow the
abolition of the H-2 program is uncertain. The key point is that the market is not a static one,
and conclusions about the effects of labor market policies will be false if they are based on a
faulty understanding of the market.

Pan Atlantic Consultants/The Irland Group November 18, 1999
Page: 176
WAYS THAT HIRING CANADIAN WORKERS MIGHT HARM US WORKERS
1. Depressing Wages through Expanded Supply of Workers
It was almost certainly true that in the 1960’s through the mid 1970’s, when large
numbers of Canadian bonded workers worked in areas of the Maine woods adjacent to settled
areas, including Washington County, US workers’ wages were consequently depressed. Today,
with the degree of geographic segmentation of the labor market that has occurred, and the
demonstrated reluctance of Americans to work in the remote camps, it is far harder to make this
case.
The number of bonds certified compared to the reported private covered employment in
logging has changed dramatically: Bonds per US Worker 1956 1.2 to 1 1967 .56 to 1 1975 .19 to 1 1998 .27 to 1
This comparison is biased by the incomplete coverage of the covered employment data.
But it indicates the sea change in a situation where bonds exceeded the number of Americans
working in the woods to a point where they are a fraction of that number. The labor market
effects of this smaller number of workers would be difficult to detect statistically even with
powerful techniques and a far larger sample size than was possible for this study. Yet as the
number of bonds has fallen, the geographic area involved has shrunk, so that bonded workers
still remain a significant portion of the workforce in the border areas near Quebec. Similarly, the
increase in the bond/US ratio from 1975 to 1998 is probably due to a more stable H-2 workforce
as US employment in the industry fell due to increased mechanization.

Pan Atlantic Consultants/The Irland Group November 18, 1999
Page: 177
One way to see if the H-2 program may be affecting earnings in Maine is to compare
different areas of the state, some likely to be affected by the H-2 program, and others not. Using
a special MDOL tab of annual earnings, we undertook this analysis. Our results take the form of
a scatter-plot showing the relation between earnings in construction and in manufacturing
plotted against logging. The most obvious fact illustrated is that there is no tight relationship
between these sectoral labor markets, at least when measuring outcomes as annual wages. It
would seem intuitively plausible that there would be competition for workers between
construction and manufacturing firms and loggers. If such were true, then there might be a
stronger correlation between wage levels in logging and these sectors. The lack of correlation
suggests a high degree of labor market segmentation, in which some individuals, for whatever
reasons, have preferences for woods work and do not regularly seek opportunities to work in
similar work in other parts of the economy. The segmentation of the market is not absolute,
however. During the 1980’s building boom, abundant construction jobs were believed to be
influencing supply of entry level workers to the woods industry. More recently, logging firms in
southern and western Maine lost workers to the high wage jobs on pipeline construction projects.
The North Woods labor market areas most likely to be affected by the supply effects of
the H-2 program are probably Fort Kent, Presque Isle, Van Buren, Madawaska, and Millinocket.
Most of these markets show above-average annual earnings for loggers (Figures 72-73). If the
H-2 program were strongly affecting earnings, one might expect these areas to fall below the
average lines in the charts. One area does fall below average -- Van Buren.
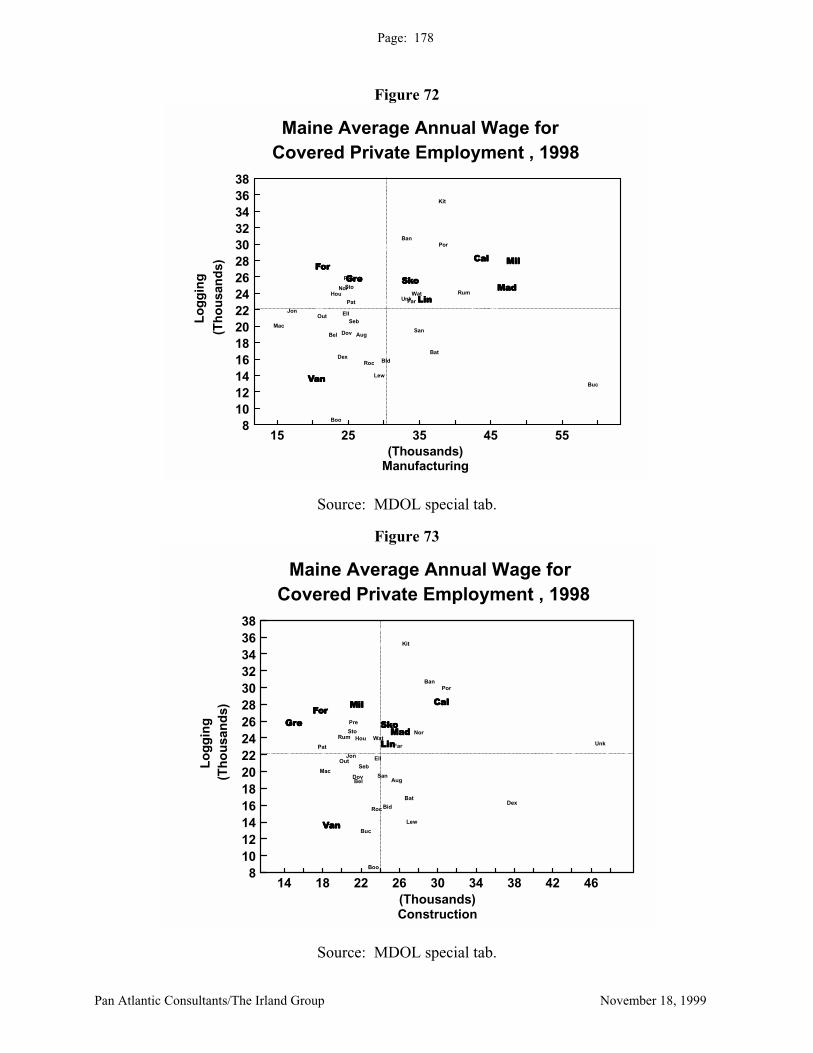
Pan Atlantic Consultants/The Irland Group November 18, 1999
Page: 178
Figure 72
15 25 35 45 55(Thousands)
Maine Average Annual Wage for
Manufacturing
Lo
gg
ing
(Th
ou
san
ds)
Covered Private Employment , 19983836343230282624222018161412108
Aug
Ban
Bat
Bel
Bid
Boo
Buc
CalCalCalCal
Dex
Dov
Ell
Far
ForForForForGreGreGreGre
Hou
Jon
Kit
Lew
LinLinLinLin
Mac
MadMadMadMad
MilMilMilMil
Nor
Out
Pat
Por
Pre
Roc
Rum
San
Seb
SkoSkoSkoSkoSto
VanVanVanVan
WatUnk
Source: MDOL special tab.
Figure 73
14 18 22 26 30 34 38 42 46(Thousands)
Maine Average Annual Wage for
Construction
Lo
gg
ing
(Th
ou
san
ds)
Covered Private Employment , 19983836343230282624222018161412108
Aug
Ban
Bat
Bel
Bid
Boo
Buc
CalCalCalCal
Dex
Dov
Ell
Far
ForForForForGreGreGreGre
Hou
Jon
Kit
Lew
LinLinLinLin
Mac
MadMadMadMad
MilMilMilMil
Nor
Out
Pat
Por
Pre
Roc
Rum
San
Seb
SkoSkoSkoSkoSto
VanVanVanVan
WatUnk
Source: MDOL special tab.

Pan Atlantic Consultants/The Irland Group November 18, 1999
Page: 179
Abbreviations for Figures 72 & 73
Aug AugustaBan BangorBat Bath-BrunswickBel BelfastBid BiddefordBoo Boothbay HarborBuc BucksportCal CalaisDex Dexter-PittsfieldDov Dover-FoxcroftEll Ellsworth-Bar HarborFar FarmingtonFor Fort KentGre GreenvilleHou HoultonJon Jonesport-MilbridgeKit Kittery-YorkLew Lewiston-AubumLin Lincoln-HowlandMac Machias-EastportMad MadawaskaMil Millinocket-East MillinocketNor Norway-ParisOut Outer BangorPat Patten-Island FallsPor PortlandPre Presque Isle-CaribouRoc RocklandRum RumfordSan San fordSeb Sebago LakesSko SkowheganSto StoningtonVan Van BurenWat WatervilleUnk Unknown LMA

Pan Atlantic Consultants/The Irland Group November 18, 1999
Page: 180
2. Reducing Bargaining Power
A common view of the H-2 program is that it gives employers more bargaining power
vis-a-vis US workers. It appears to us that market changes of the past decade have reduced the
bargaining power of both workers and contractors. They have also reduced the bargaining
power of nonintegrated mills. Since they control the key asset -- timber -- the landowners retain
some bargaining power. Yet non-integrated landowners remain price-takers in the markets for
delivered wood, which responds to end product market conditions far more than they respond to
supply conditions. Some landowners have taken dramatic reductions in the harvest volumes, and
have struggled to maintain cash flow by shifting to CLS operations and improving utilization
practices where possible.
The bargaining power argument is plausible on its face. The question is whether it is
applicable today. We have heard many complaints of this nature, yet many contractors who
employ bonds have told us that they receive no inquiries for work from Americans. Many
contractors have only one job opening a year, as they have achieved a fair degree of stability in
workers returning with them each year. The investment in training and teamwork skills that has
been made, and existing residence patterns and family bonds contribute to this. This means that
the entire logging workforce is not changing jobs each year, but only a small fraction of it. So
the opportunity for employers to use H-2s to increase their bargaining power on any large scale
would appear to be limited. It is not clear that workers in these occupations have any bargaining
power to speak of even where the H-2 program is not a factor.
3. Depressing Incomes Through Depressing Weeks Worked
It is possible that even if wage rates are not affected, the H-2 workers could affect
incomes of US workers by reducing their number of weeks worked through the year.
The contrast in weeks worked between US and Canadian workers is large enough to
explain much of the large differences in annual incomes between Canadians and Americans. But
the Americans in Northern Maine work far longer seasons than do the Canadians. It is not
evident that the H-2 program is reducing the work season for US workers.

Pan Atlantic Consultants/The Irland Group November 18, 1999
Page: 181
4. Depressing Market Price for Equipment Services
There are Canadian-owned machines coming across the border, some of them run by H-2
workers. There is apparently no reason why a US contractor could not rent Canadian-owned
equipment in the absence of the H-2 program. So there is no assurance that ending the H-2
program would be a solution to this situation, if indeed it is a problem. In fact, putting Canadian
loggers out of business would not make their machines go away, and they would be motivated to
seek work for them by renting or selling them to other operators, including ones in the US.
In Jackman, Maine, today, there are no skidders owned at all. It is hard to see how
Canadian skidders, then could affect American skidder owners. Did the Canadian skidders drive
the US-owned machines out of the woods? Theoretically this is possible, but we think a more
likely explanation is the cost squeeze of the 1990’s and the high productivity of the larger
mechanical systems.
5. Canadian Workers Could Annex the High-Paying Jobs
If it were true that the best jobs in any given crew were always held by Canadians, and
the lowest-paying jobs by Americans, then a plausible argument could be made that through one
form or another of favoritism, the H-2 program was disadvantaging Americans.
Yet we find no evidence of such a situation. In fact, on any given crew it is more
common for one-man skidder crews to be the Canadians (and the bonds) while other tasks are
performed by Americans. We have not heard any suggestions that working on the one-man
skidder crew is the most desirable of occupations available in the logging field. Moreover, in
our augmented sample, Canadians had almost identical hourly wages to the Americans in
northern Maine.

Pan Atlantic Consultants/The Irland Group November 18, 1999
Page: 182
6. Canadians Could Annex the Best “Cutting Chances”
The “cutting chance” is the quality of the wood being cut as viewed by a logger.
A good “chance” might include heavy volumes of valuable hardwoods and softwood logs,
modest slopes with few streams and bogs, easy skidding conditions, no wet soils, short
“twitching” distances, and landings closest to camp. Such conditions obviously facilitate a
crew’s getting a high production rate in a week.
It is often charged that some employers routinely give bonded workers, who may be
neighbors or family members, better cutting chances. In our sample, 5 out of 25 responding
American contractors agreed that bonds are always or routinely assigned to better cutting
chances. Not surprisingly, Canadian contractors never said that bonds received better chances.
We asked an open-ended question of workers to see if they had observed instances of
discrimination in assignment of cutting chances. Further responses were received.
Figure 74 Instances where US & Canadian Bonded Workers on
Same Site Given Different Cutting Chances
When? How long did it last?1 "Every year" 1 "A few weeks"2 "Over 11 years ago" 2 "All the time"3 "85, 86, 87" 3 "Three years"4 "Within last two years" 4 "Three weeks"5 "Timberlands whole time" 5 "Years during the 80's"6 "85-88" 6 "74-75"7 "74-75" 7 "Ongoing"8 "Within last 5 years" 8 "Four months"9 "1988-90"
10 "All the time"11 "1998"
Source: PAC Worker Interviews.
These responses indicate that some workers believe that such action has occurred with their
direct knowledge.

Pan Atlantic Consultants/The Irland Group November 18, 1999
Page: 183
Comparisons to Other States
We briefly considered comparing Maine logging wages to those in other states. But
when we considered differences in market structures, terrain, tree sizes, wood values,
unionization, and competing labor markets, it seemed that interstate wage comparisons would
probably not provide strong evidence relevant to this study. a. Published Statistics None. b. Opinions of Strategic Interview Respondents
Many strategic interviewees did not seem to believe that the H-2 program is replacing
American workers. A few agreed that this was possible, buy many felt that the H-2s are filling
jobs that would not attract Americans at any reasonable wage. One interviewee believed that the
wood could get cut in the absence of the H-2 program, but did not go into details as to cost or
other impacts. Others noted the disinclination of Americans for camp life and did not feel that
higher wages would overcome this. It would be fair to generalize that most of these
respondents believe that geography determines who works where in the woods, and not the H-2
program itself. c. Opinions from PAC Interviews
In the PAC interviews were heard many statements that the H-2 program contains many
elements that contractors would prefer to avoid, but that without those workers they simply
could not get the job done. d. Theoretical Arguments
The northern Maine logging labor market appears to be segmented along 2 dimensions.
One is occupational: some workers have a preference for woods work versus other occupations.
The other dimension in geographic. American workers take jobs within roughly one hour’s one-
way commute of their homes, while Quebec workers, willing to live in the camps and to
commute there a longer distance, do much of the work closer to the Border.

Pan Atlantic Consultants/The Irland Group November 18, 1999
Page: 184
The international boundary itself is an artificial barrier in an otherwise natural labor
market. The H-2 program is an attempt to overcome this artificial barrier through an
administrative program enabling Canadian citizens to work legally in the US while protecting
American workers. Theoretically, and speaking in a purely static sense, a higher supply of
workers (the H-2 workers) would have to have an effect on either the wage level, the number of
jobs, or both. On theoretical grounds alone, the effect is not determined without empirical
knowledge of the segmentation of the market and the shapes of the relevant supply and demand
curves.
It is noteworthy that a very large reduction in the number of H-2 workers in Maine has
been accompanied by a reduction in the average real wage in logging. This should lead to some
skepticism as to the likelihood that further reductions would somehow cause the real wage rate
to rise. Obviously many factors were at work here; the point is simply that single-factor
explanations will be wrong.
So, theory supports the view that there is an effect, but does not tell us how large that
effect is. Theory also tells us that if the H-2 program were revoked, the market would adjust
through changes in wage rates, changes in mechanization, and possibly changes in stumpage
prices and landowner policies. The multi-layered market, in which cross-border trade is possible
in at several levels and not just concerning the labor market, means that there are a number of
different ways the market could adjust to the elimination of the H-2 program. Most of these
adjustments do not lend themselves to ready predictions. Again, theory alone cannot tell us the
nature or time path of these adjustments. But on theoretical grounds alone it is clear that the 446
jobs held by bonds in 1998 does not represent a one-to-one replacement of American workers.
The actual displacement was probably considerably less.
Complicating such predictions is the information from our interviews showing that the
occupations in which H-2 workers serve are often quite different from those filled by Americans
in the same firm. Thus, the Quebec worker and the American are not really competing for the
same job.

Pan Atlantic Consultants/The Irland Group November 18, 1999
Page: 185
II. SUMMING UP a. Weight of Evidence
The weight of the evidence for judging this hypothesis is incomplete. But we think the
historical review and description of the market we have developed indicate that the primary
reasons for a declining real wage trend are to be found in mechanization and the continually
falling demand for labor and not in the H-2 program. b. Significant Limitations
A study confined to the labor market cannot define with any precision the kinds of
adjustments that would occur in the stumpage market, landownership, in technology used, in
contracting, and in delivered log markets if the H-2 program were to be abolished. The final
impact over time on employment cannot be defined until these other forces are well understood. c-d. Conclusion on the Hypothesis
We believe this hypothesis, that the H-2 program has reduced incomes and the
employment level of US workers, was true at times in the past -- when bonds represented from
one-third to one-half of the Maine logging laborforce. We have not been able to quantify the
present effect here. However, we believe that it is likely true today in localized labor markets,
particularly in or near the St. John Valley. This translates into an effect being felt in MDOL
Labor Market Areas 34 (Fort Kent) and the top sections of LMAs 29 (Skowhegan), 30
(Greenville), and 31 (Dover-Foxcroft). These areas represent the largest concentrations of
bonded workers, and we do not believe that the H-2 program has reduced incomes and
employment levels on a statewide basis. Further, we would again emphasize that we do not
believe that the scale of the program’s economic impact, properly defined, is significant even on
a local basis in Aroostook County.

Pan Atlantic Consultants/The Irland Group November 18, 1999
Page: 186
The natural question, then, is, what would happen if the H-2 program were abolished.
We hope we have raised enough evidence and theoretical argument to show that there is no
ready answer to this question. Studies focused only on the labor market, as this one was, cannot
hope to answer the question fully. We would reiterate that the H-2 program is not causing a
one-for one displacement of Americans. We do not believe the evidence shows that benefits to
American workers would be very large, after all market adjustments had worked themselves out.
In particular, we are confident that American skidder owners would not benefit, because the
likely response to abolishing the H-2 program would not be to hire more American skidders.
Moreover, the elimination of the H-2 program would not address the labor market effect of other
Canadian workers (visas, dual citizens) who in fact comprise the majority of “Canadian” worker
in the Maine Woods.

Pan Atlantic Consultants/The Irland Group November 18, 1999
Page: 187
Hypothesis 8
HAS THE H-2 PROGRAM CAUSED NEGATIVE IMPACTS ON
THE MAINE ECONOMY?
I. REVIEWING THE INFORMATION
INJURY TO THE MAINE ECONOMY
Understanding the effects of the H-2 program on the Maine economy involves different
issues, but some of the same complexities, as does understanding the effects on Maine workers.
Enough has been said above to indicate that multiple market levels are interlinked. There
is concern, for example, that log exports harm the Maine economy. Similar concern has been
expressed on the bonded worker program. It is not clear that the economic issues are any more
different than would apply to New Hampshire or Massachusetts workers coming to work at the
Kittery Shipyard, the United Aircraft plant at Berwick, or wood products plants at Bethel. They
are simply politicized because of the international boundary. One hears no talk of protests over
those cross-border movements of workers.
The availability of Quebec workers to work in the Maine woods brings a number of
advantages to Maine landowners and loggers, some of which can be said to benefit the State.
Measuring these and weighing them against estimates of costs would comprise a very difficult
and complex research project. We are only able to comment on the possibilities here.
The complexity of the undertaking stems from the notion that a proper analysis would
require that we envision a northern Maine economy with no access to the nearby Quebec
workforce. If this were to occur, adjustments in production and prices would occur at a number
of levels in the market. Simulating these adjustments is a difficult matter. The relevant
comparison is between that counterfactual economy and the one we have now. It is not enough
to say that 446 bonds directly substitute for 446 American workers, because that is not reality.
The net effect of halting the H-2 program, after all relevant economic adjustments have
occurred, would be changes in employment, sales revenues, wages and prices, and tax receipts to
the State and to local communities.

Pan Atlantic Consultants/The Irland Group November 18, 1999
Page: 188
Short of fully analyzing all of these effects, we can make a number of observations on the
effects of the H-2 program on Maine’s economy.
First, assume that the number of bonds is correctly estimated at 446 (for 1999). Our
survey shows Canadians (not only bonds) making an average of $28,700 per year. The total
payroll for these workers is then $12.8 million. This is a significant sum, but not very large in
comparison to the economy of the forested parts of northern and western Maine. Further, some
of this payroll does get spent in Maine. This amount is also large in comparison to the total
wages paid in covered employment in logging in Maine, but that reported amount does not
include a large amount of income earned by loggers who are not considered “employees” under
the labor laws.
The workers and businesses employing bonds pay the applicable state and federal taxes.
Data on such payments are not available, and rough estimates that can be made are likely to be
unreliable. Information exists, however, for the UI program, on both the tax and the benefit side.
The logging industry is chronically in deficit in its contributions versus payments. MDOL data
shows that a significant annual payment on UI benefits is made to Canada. Undoubtedly a
portion of this is related to Canadian workers working in the Maine woods.
Artificial Advantages of Canadian Workers
There has been much discussion of artificial advantages of Canadian workers compared
to Americans. The concerns usually involve these issues:
Exchange Rate -- With the Canadian exchange rate at its present levels, one dollar of US
cash buys almost $1.50 in “Loonies.” This potentially could enable a Canadian worker (or
machine owner) to underbid Americans on work in the US But without knowing the full
difference in tax liabilities and in costs of living between the two countries, it is hard to
measure the effect of the exchange rate with any precision.

Pan Atlantic Consultants/The Irland Group November 18, 1999
Page: 189
Socialized Medicine -- it would seem that the Canadian system of socialized medicine
provides a double benefit -- security for medical needs for workers and their families, and
avoidance of needs for costly fringes for employers. These could certainly translate into cost
advantage. But few American employers offer health coverage to their employees. Many
independent American loggers carry little or no health insurance coverage due to its cost for
individuals. And for employers as well as individuals, the cost of the Canadian system appears
in the taxes sent to Revenue Canada.
Grants or Other Subsidies for Equipment -- Despite many inquiries, we have been unable
to discover that any special tax breaks, loans, or grants are available at present, or in recent
years, to Canadian owners of logging equipment. We must observe, however, that not long ago
a major cause of a surplus of skidders in the Maine woods was the ready availability of
government loan assistance programs to assist loggers in financing skidders.
Given the many ambiguities in interpreting these facts, there are factors, primarily the
exchange rate and the socialized medicine system, that can plausibly be viewed as advantages
for Canadian workers. We are not persuaded that there is merit in viewing these as matters of
fairness, nor is it evident to us that their existence has had more than a marginal effect on
logging labor markets in northern Maine, when seen in light of the overall economic and
geographic situation in the region. a. Published Statistics None. b. Descriptive data from PAC Surveys Not within scope of the interviews c. Previous Studies
Several previous studies have concluded that the H-2 program did negatively affect
Maine workers and the economy. Several recommended that it be phased out.
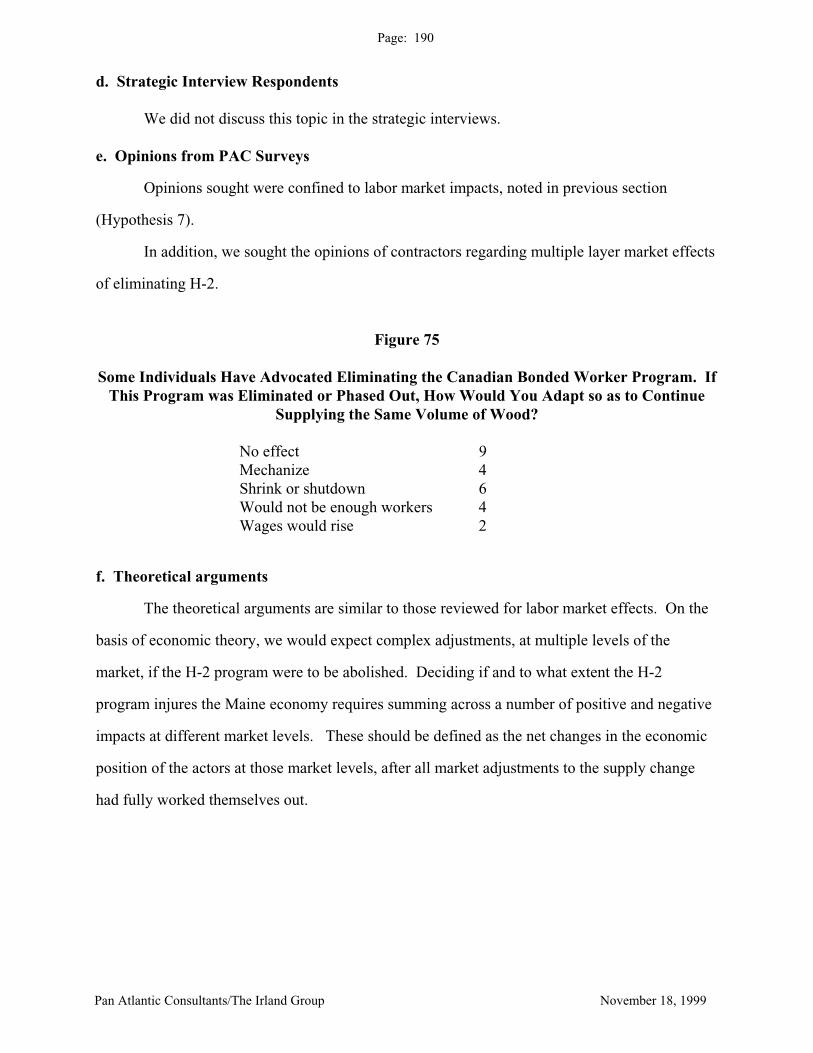
Pan Atlantic Consultants/The Irland Group November 18, 1999
Page: 190
d. Strategic Interview Respondents We did not discuss this topic in the strategic interviews. e. Opinions from PAC Surveys
Opinions sought were confined to labor market impacts, noted in previous section
(Hypothesis 7).
In addition, we sought the opinions of contractors regarding multiple layer market effects
of eliminating H-2.
Figure 75 Some Individuals Have Advocated Eliminating the Canadian Bonded Worker Program. If
This Program was Eliminated or Phased Out, How Would You Adapt so as to Continue Supplying the Same Volume of Wood?
No effect 9 Mechanize 4 Shrink or shutdown 6 Would not be enough workers 4 Wages would rise 2
f. Theoretical arguments
The theoretical arguments are similar to those reviewed for labor market effects. On the
basis of economic theory, we would expect complex adjustments, at multiple levels of the
market, if the H-2 program were to be abolished. Deciding if and to what extent the H-2
program injures the Maine economy requires summing across a number of positive and negative
impacts at different market levels. These should be defined as the net changes in the economic
position of the actors at those market levels, after all market adjustments to the supply change
had fully worked themselves out.

Pan Atlantic Consultants/The Irland Group November 18, 1999
Page: 191
II. SUMMING UP
a. Weight of Evidence
We believe the weight of the evidence is modest, given the complex, multilevel character
of the problem and the likely segmentation of the labor market.
b. Limitations and Unanswered Questions
A study confined to the labor market cannot define with any precision the kinds of
adjustments that would occur at the stumpage market, landownership, contacting, and delivered
log market levels if the H-2 program were to be abolished. Until those adjustments are well
characterized, a precise measure of overall economic impact cannot be obtained.
c. Conclusion on the Hypothesis
We think, on a purely static basis, that there is a negative effect on the Maine economy as
a result of the H-2 program. A rough measure would be the wages lost to the US economy. This
amounts to less than $13 million a year. Payments for UI, which exceed industry contributions,
increase the amount of dollars going to Quebec. In sum, this is not a large amount, even in
relation to annual economic activity in Aroostook County (MDOL statistics report that in 1997
total personal income in Aroostook County amounted to $1.3 billion). But this plainly cannot be
taken as an estimate of the net gain to the Maine if the program were abolished, for the reasons
noted above.
There is an irony here. Because of the large shrinkage in employment of Quebec workers
in the Maine woods over the past 25 years, the bulk of the burden of economic adjustment to
declining logging employment has occurred in Quebec, and to a lesser extent in New Brunswick,
and not in Maine.

Pan Atlantic Consultants/The Irland Group November 18, 1999
Page: 192
Figure 76
Unemployment Benefits: Interstate Liable Payments for the Regular Program, Excluding Dependency CY1997
Total paid outside state 4,571,255 Canada 1,184,173 New Hampshire 741,729 Florida 607,657 Other 2,037,696 Source: MDOL.
Figure 77
Private Covered Unemployment Compensation
(Mill
ions
)
Contributions for Selected Industries, Maine
1975 80 85 90 95 98
3.63.43.23.02.82.62.42.22.01.81.61.41.21.00.80.60.40.2
All Mfg./10 SIC 241 SIC 242 SIC 25
Source: MDOL.

Pan Atlantic Consultants/The Irland Group November 18, 1999
Page: 193
Figure 78
Regular Program Unemployment Compensation
(Mill
ions
)
Benefits Paid for Selected Industries, Maine
1975 80 85 90 95 98
5.0
4.5
4.0
3.5
3.0
2.5
2.0
1.5
1.0
0.5
0.0
All Mfg./10 SIC 241 SIC 242
Source: MDOL.

Pan Atlantic Consultants/The Irland Group November 18, 1999
Page: 194
Figure 79
Private Covered Unemployment Compensation Contributionsfor Selected Industries, Maine
All Mfg. All Mfg/10 SIC 241 SIC 242 SIC 26
1975 12,143,303 1,214,330 719,477 295,649 1,661,485 80 23,485,082 2,348,508 1,340,313 600,154 2,965,099 85 26,026,426 2,602,643 1,733,378 778,603 3,376,472 90 18,089,576 1,808,958 1,132,953 492,550 2,620,198 95 26,613,641 2,661,364 1,468,144 793,783 3,385,846 98 25,790,480 2,579,048 1,566,144 747,290 3,345,682
Regular Program Unemployment Compensation Benefits Paidfor Selected Industries, Maine
All Mfg. All Mfg/10 SIC 241 SIC 242
1975 25,834,051 2,583,405 1,914,881 796,096 80 19,744,097 1,974,410 3,312,345 633,996 85 26,242,450 2,624,245 2,409,524 746,742 90 44,197,016 4,419,702 3,787,987 1,232,651 95 25,877,504 2,587,750 2,912,945 791,796 98 19,543,825 1,954,383 2,279,987 404,956
Benefits Paid Minus Contributions
All Mfg. All Mfg/10 SIC 241 SIC 242
1975 13,690,748 1,369,075 1,195,404 500,447 80 (3,740,985) (374,099) 1,972,032 33,842 85 216,024 21,602 676,146 (31,861)90 26,107,440 2,610,744 2,655,034 740,101 95 (736,137) (73,614) 1,444,801 (1,987)98 (6,246,655) (624,666) 713,843 (342,334)
Source: MDOL.
Pan Atlantic Consultants/The Irland Group November 18, 1999
Page: 195
Hypothesis 9
WOULD OCCUPATIONAL PREFERENCES BE DIFFICULT
TO OVERCOME IN SEEKING TO ATTRACT ADDITIONAL
U.S. WORKERS TO THE LOGGING INDUSTRY?
Occupational choice, and the willingness of various groups of people to supply their
labor to various professions, is a complex question. In the final hypothesis, Hypothesis 10, the
labor elasticity for the logging industry is estimated (on the basis of loggers and non loggers).
Here, we gain a general and contextual sense through analyzing the responses of loggers and
non-loggers to identical survey questions about job preferences and relevant demographic
factors.
a. Published Statistics
Not available to our specific case.
b. Descriptive Data from PAC Surveys
One of the factors governing future occupational choice – and directly relevant to any
recruitment efforts by or for the logging industry – is the perception of social esteem held for
various occupations. In the Worker Survey (US only, N=111), the Logger Demographic Survey
(N=125), and the Non-Logger Demographic Survey (N=125), we asked respondents to present
their perceptions of several occupations which collectively represent a cross-section of their
Northern Maine communities. In all, the list of occupations ranked included sales clerks,
doctors, construction workers, real estate agents, administrative assistants, loggers, lawyers,
school teachers, factory workers, and waitresses (additionally, in the non-logger survey only,
respondents were asked to rank the social status of their own occupation as it differed from one
of the occupations listed).

Pan Atlantic Consultants/The Irland Group November 18, 1999
Page: 196
In both the logger and non-logger populations, doctors and school teachers (in
descending rank order) received the highest mean scores. Similarly, on the low end of the scale
for both populations were sales clerks and real estate agents. It is in the middle ranks of the
occupational group that significant differences between the populations’ perceptions occur. For
their part, loggers see themselves as the third most esteemed profession after doctors and
teachers, followed by construction workers, waitresses, and administrative assistants. Non-
loggers, meanwhile, respect lawyers, construction workers, and factory workers (in descending
order). For the non-loggers, logging was ranked seventh of ten professions, above only the three
sales-oriented professions (real estate agents, waitresses, and sales clerks).
Figure 80
DoctorSchool teacher
LoggerConst. worker
WaitressAdmin. Assistant
Factory workerLawyer
Sales clerkReal Estate
0.001.002.003.004.005.006.007.008.009.00
10.00
Loggers (Worker Survey, US only, N=111)
Non-loggers (Demographic Survey, N=125)
Social Status (1-10; 10 high)
The immediate suggestion from this analysis is that non-loggers hold logging in
relatively low regard, while loggers view themselves as “pillars of the community” behind
doctors and school teachers. This would lead one to search for those reasons which place
logging on a higher plane of social importance in the minds of loggers versus their non-logging
neighbors.

Pan Atlantic Consultants/The Irland Group November 18, 1999
Page: 197
Two possible clues to this difference between loggers and non-loggers in their
perceptions of logging are two demographic statistics: the number of family members currently
in the logging profession and the occupations of loggers’ fathers. Fully 55.6% of the Worker
sample (again, US workers only) had fathers whose primary occupation was logging. No other
profession even comes close. Farming is the second most-often mentioned paternal profession,
and only 5.6% of loggers report that their fathers were farmers.
Figure 81
2.10
0.89
2.13
0.00
1.00
2.00
3.00
Loggers (Worker Survey, US only, N=111)
Non-loggers (Demographic Survey, N=125)
Loggers (Logger Demographic Survey, N=125)
Average Number of Family Members in Logging
The inter-generational nature of the profession in the Maine Woods is borne out by the
difference between the logger and non-logger populations in terms of the number of family
members currently active in logging. The mean number of family members currently in logging
among the loggers not only in the Worker Survey sample, but also in the Logger Demographic
Survey sample, is approximately two. In contrast, the number of non-logger’s families with
logging members is below one.

Pan Atlantic Consultants/The Irland Group November 18, 1999
Page: 198
However, the inter-generational chain which has produced loggers in the North Woods
for perhaps hundreds of years may be strained to the point of breaking on account of recent
changes in working conditions and competing job opportunities in the area. Among loggers in
the Worker Survey (n=111), 76.6% have not or would not encourage their children to enter the
logging profession. In the Logger Demographic sample (n=125), 79.2% have not or would not,
and in the Non-Logger Demographic sample (n=125), fully 82.1% of respondents have not or
would not encourage their children to go into logging. This means that, in the two samples of
loggers, between 21% and 23% have or would at least somewhat encourage their children to
consider logging as a career. Figure 82
YesNo
Maybe
0%
20%
40%
60%
80%
100%
Loggers (Worker Survey, US only, N=111)
Non-loggers (Demographic Survey, N=125)
Loggers (Logger Demographic Survey, N=125)
Encourage Children to Enter Logging
Primary factors influencing the appeal of logging for both current loggers and non-
loggers include characteristics of the work, as well as the risk/discomfort profile inherent in the
job. PAC surveys included two series of questions asking respondents to rate the “appeal” of
various types of work. In one set, respondents were asked to rate the appeal of seven types of
work. These types of work were as follows:

Pan Atlantic Consultants/The Irland Group November 18, 1999
Page: 199
1. A physically demanding job
2. Significant outdoor work
3. The use of heavy equipment
4. Independent problem solving
5. Working with people
6. Room for advancement
7. Part-time or seasonal work
Not surprisingly, loggers in the Worker Survey sample (n=111) prefer outdoor work,
physically demanding jobs, and jobs requiring the use of heavy equipment (listed in descending
order). By contrast, non-loggers (n=125) prefer jobs that involve room to advance, work with
people, and independent problem solving (in descending order). As an interesting side note, the
loggers in this sample had a mean education level of 12 years (i.e., through high school),
whereas the non-loggers had been educated on average 14 years (i.e., had attended some college
or post-secondary technical school). Both populations ranked “part-time or seasonal work” at
the bottom of their preferences list, the non-loggers by a somewhat higher degree than the
loggers.
Figure 83
Outdoor workPhysically demanding
Heavy equipmentRoom to advance
Problem solvingW orking w/ people
Part-time/Seasonal
0.00
1.00
2.00
3.00
4.00
Loggers (Worker Survey, US only, N=111)
Non-loggers (Demographic Survey, N=125)
Appeal of W ork Characteristics (1-4; 4 high)

Pan Atlantic Consultants/The Irland Group November 18, 1999
Page: 200
Another set of survey questions asked respondents in both populations to rate the appeal
of jobs paying $12-$14 per hour (an amount just above most of the prevailing logging wage rates
determined in the most recent Woods Wage Survey conducted by the Maine Department of
Labor). Respondents were asked to rate the appeal of jobs with the following characteristics:
1. A two-hour daily commute
2. Four nights a week away from home
3. Up-front costs of $1,500 to $1,700 for training and equipment
4. Above-average risk of serious physical injury compared to other local jobs
Among respondents for whom a $12-$14 per hour job would be attractive (i.e., it was a
wage as high or higher than they currently receive), both loggers and non-loggers indicated a
willingness to commute two hours daily. The other three factors had a sharply reduced appeal
for both groups by comparison. The loggers, in particular, were very opposed to a job which
required four nights per week away from home, and having to pay an up-front training and
equipment fee was even less popular. For non-loggers, the risk of serious physical injury and the
prospect of spending four nights per week away from home held very little appeal.
Figure 84
2 hr commuteSerious injury risk
4 nights away$1,500-1,700 upfront
0.00
1.00
2.00
3.00
4.00
5.00
Loggers (Worker Survey, US only, N=111)
Non-loggers (Demographic Survey, N=125)
Appeal of $12-14/hour Jobs (1-5; 5 high)
At the onset of their careers, loggers viewed their chief “job-related attribute” as physical

Pan Atlantic Consultants/The Irland Group November 18, 1999
Page: 201
or manual skills (59.5%). Other factors, in order of descending importance, included “ability to
work with others” (21.6%), “reasoning skills” (13.5%), and “artistic talents” (0.9%). The
relative rank was the same among non-loggers, though the margin by which physical skills was
the leading factor was much narrower.
Figure 85
Physical/Manual skillsAbility to work w/ others
Reasoning abilityArtistic talents
0%
10%
20%
30%
40%
50%
60%
Loggers (Worker Survey, US only, N=111)
Non-loggers (Demographic Survey, N=125)
Best Job-Related Attributes Before Starting Work
Finally, another factor which influences both a worker’s willingness to stay in a
profession and (in this case) his desire to switch to another type of job is the variety of other
employment opportunities readily available to him. In an open-ended question to both loggers
and non-loggers, respondents were asked to name their “next best occupational opportunity” if
they were no longer loggers or whatever other profession they currently engage in (in the case of
non-loggers). The lists of responses generated by both loggers and non-loggers are strikingly
similar:
Loggers Non-Loggers
1. Truck Driver 1. Carpenter
2. Carpenter 2. Truck Driver
3. Construction Worker 3. Auto Mechanic and
4. Auto Mechanic Store/Business Owner (tie)
The only difference among the top answers of the two groups is consistent with each
Pan Atlantic Consultants/The Irland Group November 18, 1999
Page: 202
group’s attitude towards jobs which imply a risk of serious physical injury – loggers are more
willing to take on such risks, and are perhaps better able to undertake them given their skill set.
On a related side note, the responses of the Logging Contractor Survey (n=81) shed some
light on logging employees’ willingness and ability to leave the profession in favor of other job
opportunities. On average, contractors estimate that 30% of their workers who quit seek jobs
outside of logging, whereas the other 70% seek logging work on their own or with another
logging firm.
In all, there are positive indications among current loggers that they hold themselves and
their work in high esteem, enjoy outdoor work, and enjoy applying their physical and manual
skills to physically demanding work. These factors, however, are countered by a distaste for
seasonal work, requirements for cash outlays for training and equipment, and nights spent away
from home. Non-loggers would be difficult to recruit for logging based on their relative aversion
to physical labor and the risk of serious physical injury.
c. Data and Opinions, Previous Studies
While not as specific in nature, the data/opinions expressed in previous studies (see the
Literature Review) conform to this view.
d-e. Opinions of Strategic Interview Respondents and Opinions in PAC Interviews
The opinions of our strategic interview respondents also support the views expressed
above. Opinions of PAC interview respondents, as given above.
f. Theoretical Arguments
The theoretical arguments for postulating resistance in matters of occupational choice/labor
supply follow in Hypothesis 10.
Pan Atlantic Consultants/The Irland Group November 18, 1999
Page: 203
II. SUMMING UP
a. Significance/weight of Evidence
The overwhelming weight of evidence is empirical, according to highly targeted
questions about occupational choice.
b. Limitations/unanswered Questions
While the above data provides a good range of possible scenarios through which to
regard the likelihood of a logger or non logger to work in the industry, these scenarios are not
exhaustive. A fuller range of options, with respect to the reserve wage needed to attract workers
to the industry, follows in Hypothesis 10.
c. Judgments
The data herein is a useful and accurate top-line analysis.
d. Conclusion on Hypothesis
We accept the hypothesis, that occupational choice preferences among the Maine
workforce will make it difficult to recruit new logging workers, as stated. In particular, while
there are positive indications among current loggers that they hold themselves and their work in
high esteem, enjoy outdoor work, and enjoy applying their physical and manual skills to
physically demanding work, these factors are countered by a distaste for seasonal work and any
requirement for cash outlays for training and equipment and nights spent away from home. Non-
loggers would be difficult to recruit for logging based on their relative aversion to physical labor
and the risk of serious physical injury.

Pan Atlantic Consultants/The Irland Group November 18, 1999
Page: 204
Hypothesis 10
IS THE SUPPLY OF U.S. LABOR TO THE MAINE LOGGING
INDUSTRY INELASTIC RELATIVE TO THE WAGE RATE?
I. REVIEWING THE INFORMATION
In this section we specify and econometrically estimate the labor supply curve for the
logging contracting firm. This approach facilitates two analyses:
First, it gives an estimate of the degree of monopsony power measured by the inverse
labor supply elasticity. Monopsony power is argued to exist when the firm faces an upward
sloping labor supply curve – a labor supply elasticity dramatically less than infinity (as in the
purely competitive case). Thus, this econometric analysis returns us to the previous discussions
(Hypotheses 3-4) of the market structure and imperfect labor and other markets that characterize
the Maine logging industry.
Second, this analysis provides an estimate of the long-run elasticity of labor supply – the
percentage change in labor supply for a 1% change in the real wage. This estimate is crucial in
the development of a wage policy for attracting more labor to the industry, and for giving a fuller
understanding of the complexity of this undertaking.
This analysis is limited in two respects.
1. The major limitation of the following results is that they are based on a small sample size.
Starting from 81 firms, eliminating unionized firms and dropping firms with missing values left
21 firms as the sample size in the estimated equations.20 The problem with small samples is the
resulting loss of precision in the estimates across alternative specifications and the associated
difficulties determining the statistical significance of coefficients.
20 While the equations reported in Table 1 are the best fitting ones based on an R^2 criteria, they employ more explanatory variables and instrumental variables and thus eliminate more observations due to missing values. Alternative specifications with less variables had sample sizes as high as 28 and produce qualitatively similar results.

Pan Atlantic Consultants/The Irland Group November 18, 1999
Page: 205
2. While this analysis does include major geographic factors, it excludes the previous findings on
occupational choice (Hypothesis 9).
The effects of these limitations on policy choice and their likely effects are returned to in
the conclusion of this section.
Monopsony Market Power
Simply and literally stated, monopsony refers to the market power enjoyed by a single
buyer in a given market. More commonly, monopsony refers to the market power of a limited
number of buyers in the market – a situation more formally described by the awkward term
oligopsony. Monopsony can take two forms: monopsony that results from collusion and from
firm differentiation. Here we formally focus on the latter type, in a particular market – the labor
market. Given that the profit-maximizing behavior of a monopsonist entails a restriction in both
the wage and the number of workers hired (compared to a competitive market) and an
unwillingness to raise wages to attract additional workers, monopsony has been a useful concept
for explaining labor shortages. The classic application has been to the chronic shortage of
nurses.21 Given the shortage of loggers in the Maine wood harvesting industry, the presence of
monopsony can help to explain this situation.
Monopsony associated with firm differentiation can have numerous sources. Often cited
are geographically isolated jobs in sparsely populated areas with few alternative employers. 22 In
addition, differences in non-wage aspects of jobs, the intensity and scheduling of work, and the
quality and safety of the workplace differentiate firms and enhance monopsony power.
Collusive monopsony results from outright collusion, wage standardization programs
facilitated by trade associations, and anti-pirating agreements on hiring among firms.
21 See “monopsony power in the market for nurses,” Daniel Sullivan, Journal of Law and Economics Vol. XXXII, October 1989 pp. S135-S178. 22 A classic example is coal mining. Se “Testing for Employer Monopsony in Turn-of-the-Century Coal Mining,” William M. Boal, Rand Journal of Economics, Vol. 26, No. 3, Autumn 1995, pp. 519-536.

Pan Atlantic Consultants/The Irland Group November 18, 1999
Page: 206
The a priori case for monopsony in Maine’s wood harvesting industry is a strong one.
The vast majority of cutting sites are in isolated, sparsely populated areas where there are few
employers and a limited number of employment opportunities. Most sites are located in
economically underdeveloped portions of the State. Thus, there exists a significant cost
allocated with switching jobs. One of these costs is the large opportunity cost related to
substantial commuting time. Another is the possible need to relocate when taking up with a new
employer. Finally, there is the significant cost associated with lower wages in alternative, non-
logging jobs.
Preliminary Evidence of Monopsony
The firm survey associated with this study offers some preliminary evidence in support of
the monopsony hypothesis. Nearly half of all firms (n=71) 46%, responded that they do not
compete with other firms for labor. When queried about the frequency that the firm lost
employers to other logging firms, 80% of firms (n=66) responded either “rarely” or “never”.
This suggests that employers are spatially separated or that anti-pirating agreements are in effect.
A sign of limited alternative possibilities for workers is the high yearly retention rate of workers.
The mean annual retention rate for firms based on the past three seasons was 87% of all
employees, while the median rate was an astonishing 95%. The implied turnover rates of 13%
and 5% are substantially lower than the national average of 23%-30% for individuals, and rates
of around 150% in the potentially monopsonistic coal-mining and restaurant industries.23 While
high turnover rates need not be evidence against monopsony,24 the low rates in Maine wood
harvesting are certainly indicative of buyer power in the labor market -- workers have few
alternative employment opportunities.
Indirect evidence in favor of monopsony is the existence of a labor shortage. Eighty-six
23 For individual rates, see “Is Job Stability in the United States Falling?,” D. A. Jaeger and A. H. Steven, Mimeo,
Yale University, July 1997. For industry rates, see W. M. Boal Op. Cit. 24 Turnover as a result of movement in and out of the labor force by those with transitory attachments to work, such
as in the restaurant industry, does not constitute evidence contrary to Monopsony.

Pan Atlantic Consultants/The Irland Group November 18, 1999
Page: 207
percent of firms (n=69) characterized the supply of new entrants to wood harvesting as either
“scarce” or “nonexistent”. In addition, when asked if firms (n=74) would be willing to raise
wages by 10% to alleviate such a shortage, 70% responded “no”, 18% “yes” and 12% were
unsure. This response is typical of firms facing an upward sloping labor supply curve.
Thus, the preliminary evidence suggests a strong possibility that monopsony exists in the
Maine labor market for loggers. We now turn to formal econometric tests of monopsony power
and estimates of the wage elasticity of labor supply.
Model Specification
We estimate a standard inverse labor supply curve – wage rates as a function of
employment levels – with two particular modifications. First, it is assumed that labor supply
responses to wage changes are dynamic (i.e., occur over time). In particular, the short-run costs
associated with leaving a job imply that adjustments in supply will be partial, fully working
themselves out over some time period. This realistic extension is modeled by the inclusion of
past employment levels in the equation for the contemporaneous wage. This dynamic
specification allows for both short-run and long-run duration measures of monopsony power and
the wage elasticity of labor supply to be estimated.
Second, the existence of oligopsony instead of pure monopsony requires that the
interaction between competing firms in the labor market be considered. We consider two
alternative interactions: A Bertrand Game where the firm under consideration maximizes profits
taking as given (fixed) all other firms’ wages and a Cournot Game where the firm instead takes
the employment decisions of other firms as given. These alternative interactions are modeled by
respectively incorporating the firm’s competitors’ average wage and the firm’s competitors’
average contemporaneous and past employment levels in the equation to be estimated. It is not
possible on a priori grounds to choose between these alternative specifications.
Given these considerations, the firms’ inverse labor supply curve can be expressed for the
Bertrand case as:

Pan Atlantic Consultants/The Irland Group November 18, 1999
Page: 208
log (wage-f 1998-99) = b0 + b1 log (employment-f 98-99) + b2 Log (employment-f 97-98)
+ b3 Log (wage-c 98-99) + b4 X + b5 Z (1)
Where the f and c subscripts, respectively, denote the firm and the competitors, 98-99 and 97-98,
respectively, refer to the season data was collected for and the prior season, b0 to b5 are
unknown parameters to be estimated, and X and Z are, respectively, vectors of firm-specific and
county/labor market area (LMA-specific) variables that affect the labor supply curve.
For the Cournot case the equation becomes:
log (wage-f 98-99= b0 + b1 log (employment-f 98-99) + b3 log (employment-c 98-99)
+ b4 log (employment-c 97-98) + b5 X + b6 Z (2)
The use of logs in equations (1) and (2) above allows for the inverse labor supply elasticity – the
percentage change in wages resulting from a 1% change in firm employment – to be readily
estimated. In these models, the short-run inverse elasticity is given by b1, while the long-run
inverse elasticity is b1 + b2. In addition, the Lerner Index – the percentage gap between the
marginal revenue product (the contribution of an additional worker to the firm through worker
productivity) and the wage paid to labor in terms of the wage – a measure of exploitation due to
market power is given by b1 + (b2/(1 + r)) where “r” is the firm’s discount rate.
The long-run wage elasticity of labor supply – the percentage change in labor supply for a 1%
change in the firm’s wage rate – the appropriate concept for assessing wage policies is
represented by 1/(b1+b2).
In the results reported below the X vector includes the length of the season, the days
worked per week, the average experience of employees, and the nature of technology (captured
by the percent of production attributable to skidder technology for the firm). The Z vector
includes the log of male population ages 20-49 for the county where the firm’s cutting site is

Pan Atlantic Consultants/The Irland Group November 18, 1999
Page: 209
located and a variable capturing whether the site is in one of the northernmost LMAs (i.e., LMAs
26-28, 30, 32-35). In other equations (not reported) with qualitatively similar results, X included
the percent cut by cut-to-length processors the use of a labor agent by the firm, and the firm
safety record, and Z included the LMA unemployment rate, the LMA wage for construction and
for manufacturing.
All data was derived from the firm survey (n=81) conducted as part of this study. Firm
and competitors’ wages are the average for the firm’s employees directly engaged in timber
harvesting. Employment variables reflect the workers considered in the wage variables.
Competitors’ wages and employment are calculated using all other firms cutting in the same
LMA. The wage is an average of wages, while employment is total employment of competitors.
Equations (1) and (2) are estimated using two-stage least squares with contemporaneous
firm employment treated as endogenous.25 Instrumental variables include the quality of the stand
and terrain at the cutting site, the average years of owners’ logging experience, the number of
trade associations joined, how negotiable contracts with landowners are, and the same variable
as pertains to mills. In alternative equations (not reported) other instruments – the price of fuel
and the number of landowners it would be possible to negotiate a contract with – were used and
produced qualitatively similar results.
The sample of firms used consists of all firms without union contracts, for which there
are no missing data for the relevant variables described above.26
Results
The estimates of the parameters in the Bertrand and Cournot Models, equations (1) and
(2), are reported in Table 1. The results clearly show that a high degree of monopsony exists in
the Maine labor market for loggers. In particular, the short-run average elasticity of labor supply
is 0.75 in the Cournot and 1.20 in the Bertrand Model. In comparison to other estimates of
25 This approach avoids simultaneous covation bias that results when a supply curve is estimated in isolation from a demand curve. 26 Union firms are excluded because it is well known that in monopsonistic markets unions can set fixed wages above the monopsonistic wage, and in so doing can increase worker welfare and employment.

Pan Atlantic Consultants/The Irland Group November 18, 1999
Page: 210
inverse labor supply elasticities for markets characterized as monopsonistic, these estimates are
some of the highest.27 The corresponding Lerner Indices suggest that the market wage is
between 28% - 36% lower than if workers were being paid the full value of their marginal
revenue product, as compared to possible outcomes under a “purely competitive” (i.e.,
theoretical) labor market. It is critical to note that this estimate of suppressed wages relates to a
labor market situation which does not exist -- and indeed could not exist -- in logging in Maine.
No industry in the State is “perfectly” competitive; perfect markets for all practical purposes do
not exist. As a result, because of the logging industry’s imperfect market structure (discussed at
length in Hypothesis 3), Maine logging workers’ wages will always fall short of the “perfectly
competitive” scenario.
In addition, the long-run inverse elasticity of labor supply does not approach zero,
implying that the ultimate working-out of slow/partial adjustments to labor supply are not the
primary reason that monopsony exits. Long-run inverse elasticity’s are 0.19 in both models and
are thus much higher than other industry estimates with the exception of nursing.28
The major limitation of these results, as previously noted, is that they are based on
a small sample size. Starting from 81 firms, eliminating unionized firms and dropping firms
with missing values left 21 firms as the sample size.29 The problem with small samples is the
resulting loss of precision in the estimates across alternative specifications and the associated
difficulties determining the statistical significance of coefficients. The former is evidenced by
the large range in short-run inverse elasticity (0.75 – 1.20). The latter is found in the poor t-
statistics and even signs of coefficients that deviate from theorized signs.30
27 W. M. Boal op.cit. reports various estimates ranging from .79 for nursing, and .38-.59 for fast-food restaurants and .15 - .52 in coal mining. Also he reports leaner indices in the range of 100% - 400% in baseball, 18%-20% in coal mining, and 13% in old age homes. 28 The above equations explain between 34% and 54% of the variation in real wages across logging firms. (R^2). This explanatory power is good for a cross-sectional study and is in line with other monopsony studies. 29 While the equations reported in Table 1 are the best fitting ones based on an R^2 criteria, they employ more explanatory variables and instrumental variables and thus eliminate more observations due to missing values. Alternative specifications with less variables had sample sizes as high as 28 and produce qualitatively similar results. 30 Other studies with far more data have similar problems. In W. M. Boal’s paper on coal mining, his short-run estimates range from 0.15 - 0.52 and he is unable to conclude that the contemporaneous and lagged employment terms in his Cournot equations are statistically significant.
Pan Atlantic Consultants/The Irland Group November 18, 1999
Page: 211
In alternative specifications (not reported), the range of estimates for short-run inverse
elasticity’s is 0.59 – 1.94, and for longer-run elasticities it is 0.13 - 0.51. Despite the wide
ranges, the minimum values in each case imply that a substantial degree of short-term and long-
run monopsony power exists.
The wage elasticity of labor supply can be calculated/estimated as the inverse of the long-
run inverse elasticity of labor supply. Here, too, a range of elasticity estimates resulted, from
2.0-8.0, implying that, at the lowest value, a 1% change in wages results in a 2% increase in
labor supply for a given firm holding the employment or wage decisions of competing firms
constant.
In order to derive the industry wage elasticity of labor supply it is necessary to factor in
the actions of competing firms. For simplicity, we assume that competing firms take the same
actions as the given firm. Thus, if the given firm increases the wage by 1%, the competing firms
do the same.
Under this scenario, the long run wage elasticity of labor supply is not statistically
different than 0. That is, the supply of labor to the Maine logging industry is inelastic relative to
the wage.
In sum, the results strongly indicate the presence of a high degree of both short-run and
long-run monopsony power in this labor market. Despite the small sample size, the monopsony
results are significant in both the Bertrand and Cournot equations, and in all cases of unexpected
signs, the results are indistinguishable from zero.31
Policy Implications
The existence of monopsony power has negative welfare implications for US workers.
Monopsony limits the number of domestic workers hired and lowers the real wage. This wage is
31 With respect to unexpected signs of coefficients, in all such cases the coefficients are statistically indistinguishable from zero, implying that the sign could have been positive or negative. Thus, the negative sign on contemporaneous employment in the Cournot equation can be interpreted as zero, and the positive significant sign on logger employment suggests that wage responses to employment changes occur with a time lag. In addition, the northern LMA variable and the experience variable take on different signs in the two equation but are also statistically insignificant.

Pan Atlantic Consultants/The Irland Group November 18, 1999
Page: 212
estimated to be no more than 28%-36% lower than in a perfectly competitive labor market. In
addition, the dual-sided squeeze of contractors’ profits, discussed previously, ensures that the
potential wage gap will be fully exploited by logging firms.
Nevertheless, whether contractors’ profits increase at the direct expense of workers is
difficult to sort out. If the elasticity of the labor supply curve that includes Canadian workers
increases and the marginal reverse product (MRP) curve is flat, their wages are likely to
increase. If the elasticity decreases and the MRP curve is steep, wages can fall. In either case, it
is likely that the monopoly power of landowners will be used to transfer the additional profits in
their direction.
By these estimates, the elasticity of labor supply into logging is absolutely inelastic
relative to the wage – a situation that is undoubtedly exacerbated by the further mitigating effects
found in the section on occupational choice. As reported in Hypothesis 9, our non-logger sample
reveals that loggers are held in relatively low esteem by the general laborforce. Based solely on
social status, non-loggers would rather be construction or factory workers than loggers.
Similarly, physically demanding and part-time/seasonal work holds little appeal for non-loggers.
Finally, our statistics show that encouraging non-loggers to stay away from home four nights a
week while engaged in a dangerous job with up-front monetary costs will be difficult, even at
wage rates $1.00 to $3.00 per hour above the all-around logging wage in 1999. The combination
of these occupational choice factors would tend to render the labor-supply curve more inelastic
relative to the wage.
In general, policies which are able to increase the elasticity of labor supply can reverse
the negative impacts of monopsony on workers. To that end, three avenues offer potential for
policy change to augment worker welfare. The first policy option is to undertake a public
education effort to improve perceptions of logging as a profession. A key component of this
kind of effort would be to promote what CLP has done to make the industry safer for workers. A
second policy option is to make a concerted effort to augment mechanized harvesting training
opportunities in the State. Mechanization is a fact in the North Woods, and future job growth
will concentrate in this area. As noted elsewhere in this report, CLP already does a good job of
Pan Atlantic Consultants/The Irland Group November 18, 1999
Page: 213
providing training in conventional chainsaw/skidder logging techniques; a competing program
would not be an efficient use of public funds. A third policy option complements and builds
upon the second, and would include providing funds for training and the purchase of safety
equipment for new loggers. Up-front costs appear to be a deterrent factor in terms of attracting
workers to the logging profession.
As indicated in Hypothesis 5, one of the pivotal factors which affects occupational
choice, monopsony, and labor supply issues in general is geography. Unfortunately, this may
also be the most “policy-proof” variable. In many ways, the remoteness of logging jobs, in the
absence of a program to tap into the Quebec labor market, almost predetermines further
mechanization.
II. SUMMING UP
a. Significance/Weight of Evidence
Although based on levels of statistical significance there is some room to assume that an
increase in the wage rate may yield additional workers in logging, the preponderance of the
evidence suggests that, on an industry-wide level, raising the wage would have no effect. Other
forces and factors -- monopsony, geography, and occupational choice considerations --
predominate.
b. Limitations and Unanswered Questions
There is room for further econometric analysis to try to determine more precisely the
effect of all of the varying factors on the elasticity of labor supply. We believe that the overall
trend analysis is sound; additional econometrics would simply utilize all available tools for
quantitatively estimating what the potential labor supply could be.
c. Conclusion on Hypothesis
We accept the hypothesis as stated -- that the supply of labor to the logging industry in
Maine is inelastic relative to the logging wage rate. Because of the unique conditions of the

Pan Atlantic Consultants/The Irland Group November 18, 1999
Page: 214
State’s logging labor market (presented in several of the previous hypotheses), changing the
logging wage will not yield a significant change in the overall supply of labor to the industry.
Indeed, for the most part, logging employers could not afford a sharp change in wages, and
would reduce the number of jobs available (including possibly reducing output) before taking on
a relatively more expensive workforce. In economic terms, the labor elasticity is
“indifferentiable from zero.”

Pan Atlantic Consultants/The Irland Group November 18, 1999
Page: 215
PART FOUR
PROGRAM REVIEW
Pan Atlantic Consultants/The Irland Group November 18, 1999
Page: 216
RECOMMENDATIONS TO IMPROVE THE H-2 PROCESS
The process of developing wage findings and related information for use in administering
the H-2 program has not recently been reviewed by outside parties. While inserting ourselves
into these details is not our primary mission, our interviews and our own judgment have led to a
number of observations on the program that may be useful. We have not attempted to suggest
specific re-drafts of actual legal language and regulations. This is obviously better accomplished
by the Departments’ own specialists. We recognize that some of the issues raised here are firmly
implanted in USDOL tradition and policy and will not easily be changed.
We believe that staff at all levels have been doing their best under trying circumstances
amidst budget cuts and many other changes. It is natural to keep conducting business as usual.
By making these suggestions it is not our intent to suggest that program operation has been lax
or ineffective.
It is our sense that the working conditions issues, related to compliance of camps and
facilities, are not major issues and those will be ignored here. We have visited several personally
and understand that enforcement of camp regulations is not a major problem at present.
The essence is to recognize that the H-2 Program is an effort in government price fixing
in a labor market. It is an attempt to place a floor under wages in particular occupations. This
requires several things:
1. Accurate knowledge of wages prevailing in a market
2. Ability to give clear guidance as to what the minimums are
3. Ability to enforce those guidelines.
The effort to fix wages has been most evident in every instance when “prevailing” wage data
were ignored in favor of setting a higher wage level. This has occurred several times.

Pan Atlantic Consultants/The Irland Group November 18, 1999
Page: 217
Wages Versus Piece Rates
We support the idea that employers be required to pay hourly minimum wages or their
equivalents (if workers are technically paid on a piece-rate system). As they are now, these
hourly minimum wages would be based on prevailing hourly wage rates. This change would
render it unnecessary to attempt to regulate piece rates in minute detail, task by task, job by job.
Employers should be allowed to pay whatever piece rates they want so long as the hourly
earnings requirements are met. Employers can still pay piece rates, but the use of piece rates
would be restricted to the incentivization of top-producing employees, who would subsequently
be paid over and above the minimum for their efforts (as they are today).
Taken literally, this means that there is no need to fix and regulate “prevailing” piece
rates in the market. There is only a need to survey what those rates are, and convert them into
equivalent hourly rates. This is consistent with H-2 regulations for logging, which only mandate
an “adverse effect wage rate” -- not specified as either hourly or piece-rate.
Woods Wage Survey
The Survey results from an incremental accumulation of procedures and rulings. To our
knowledge, there is no official policy document guiding administration of the H-2 program as it
applies to loggers, and the program has been run according to materials developed originally for
H-2a agricultural workers in many instances.
Many of the H-2 policies, procedures and practices make sense upon first glance, but
they also include rigid definitions and procedures that have the effect of discarding useful
information, reducing sample sizes, and materially complicating the achievement of the
program’s actual objectives. Re-examining the detailed approach in terms of its original
objectives would be in order.

Pan Atlantic Consultants/The Irland Group November 18, 1999
Page: 218
“All-Around Logger” Designation
The concern of the survey and program should be to ensure that the established methods
of operating in the Maine woods are reflected. There has been discontent over the “all-round
logger” classification, but no simple solution has emerged. At the moment, workers in this
classification in actual practice are involved in many different tasks (Figure 86). Note that 11 of
the 16 tasks noted are precisely what a “skidder operator” would do; several of the others are
vague.
The survey does not seem to recognize the importance of the one-man skidder crew,
which has largely supplanted the traditional “hand crew” consisting of a driver and a chainsaw
hand. We are not persuaded that, in 1999, there is such thing as an “all-around logger.” We
consider it a prime candidate to drop from the list of classifications in the interest of
simplification. At the very least, drafting a more specific occupational description that reflects
skidder operations primarily would make the “all-around logger” designation more accurately
represent an actual occupational activity in the North Woods.
Figure 86 On Average at the Firm, What Three Primary Activities
Does an “All-Around Logger” Typically Engage In?
1 "Felling" '2 "Skidding/Twitching"3 "Bucking"4 "Delimbing"5 "Operating chainsaw"6 "Cutting"7 "Maintenance"8 "Saw"9 "Hauling"
10 "Operating"11 "Building road"12 "Yarding"13 "Conventional logger"14 "Mechanical logger"15 "Chipping"16 "Safety"

Pan Atlantic Consultants/The Irland Group November 18, 1999
Page: 219
Employee/Contractor Distinction
The distinction between employee and contractor has long been a troublesome one in
logging. The wage and hour laws and safety legislation contain provisions which enable
workers to be considered “contractors” under certain conditions in order to lower employer costs
and responsibilities and reduce the opportunities for unionization.
In actual practice, individual loggers or owners of a machine who “contract” for an
employer are statistical non-persons. This is true for overall wage, hour, and employment
surveys as well as for the Woods Wage Survey.
In logging, the legal distinction results in considerable semantic confusion because in
common discussion workers are often referred to as employees whether they are contractors or
not. Further, actual “employees” often have few or no fringes or other benefits one would
normally associate with an employment relationship.
In logging, however, the distinction between employer and contractor is economically
meaningless. What is important is what people are earning, not whether they are a “contractor”
or “employee.” By restricting its sample only to “employees” the Survey unnecessarily
eliminates much useful information about the market. In the future, for wage sampling purposes,
the Survey should be designed to include all workers, “contractors” or not, who are doing similar
actual work. The information obtained should in sufficient detail to permit “apples to apples”
comparison of actual net earnings.
Following this approach would not only result in capturing much more useful
information about the industry, it would improve sample sizes and hence accuracy of results.
This might reduce the occasional instances where rates fluctuate from year to year due to
sampling differences each year.

Pan Atlantic Consultants/The Irland Group November 18, 1999
Page: 220
Industry Classifications
Current MDOL policies require that occupations be dealt with on an industry basis. This
is an unnecessary constraint. There is no economically meaningful reason why a log truck driver
who works in the trucking subsidiary of a company should have earnings a penny different from
those earned by a worker whose company is classified in the logging industry. Or why a grader
operator working in a company’s construction division should be paid differently from a grader
operator who happens to work, say, on road maintenance, in the logging operation. There are
often legitimate business reasons for businesspeople to organize their operations in different
corporate entities.
In the case of logging, this presents the opportunity to effectively insulate the H-2
process from the realities of the labor market. This can be counteracted if wage inquiries were
not confined to the arbitrary boundaries of industry codes established for entirely different
purposes.
Job Classifications
The Survey attempts to obtain data on too many finely divided distinctions of tasks,
occupations, and payment methods. It results in employers having to make estimates of the
allocation of time between different tasks by individual workers. The demand for such volumes
of detailed information has had several results:
-- Unnecessary reporting burdens on employers.
-- As a result, a higher level of noncompliance than would be desirable.
-- The results regularly fail to produce enough sample units to meet MDOL sampling
standards.
-- There is a suspicion that many responses are little more than guesswork, so the
precision achieved by these numerous fine distinctions is in fact an illusion.

Pan Atlantic Consultants/The Irland Group November 18, 1999
Page: 221
The number of classifications for which information is sought should be reduced, both by
combining similar occupations and by eliminating some entirely. The bonded workforce has
shrunk so much that there are probably many classifications that no longer have positions filled
by bonds.
It is critical that major heavy equipment items have wage findings every year.
Job Classification Issues & Recommended Program Changes
The most commonly heard concern in job classifications are two. First, the all-round
logger and its appropriateness. Second, whether the classifications are up to date with modern
machinery. These are discussed in order of their appearance in MDOL regulations (see
appendices):
1. A key task is to conduct an interim heavy equipment survey by the start of the 2000-
2001 logging season so that there will be no more years in which a key mechanical classification
lacks a wage determination/finding. The Woods Wage Survey which will determine “set rates”
for that season has already been conducted.
2. For all types of equipment -- If separate piece rate and wage rate systems are to
continue to be monitored and enforced, grapple skidders, delimbers, loaders, feller-bunchers,
CTL processors, and forwarders should have piece-rate options in the classifications, to go along
with hourly wage rates.
3. Experts agree that separate classifications for grapple and cable skidders are needed.
Grapple has more hydraulics, needs more skill, and is more costly. Cable is simpler, but more
arduous.
4. MDOL should consider a separate employment classification for drivers of off-road
trucks. They are much bigger, wider, and are often self-loading. In addition, they carry much
bigger loads, as they only run on private roads. The wording of the classification need not be
different, however -- they are still drivers.

Pan Atlantic Consultants/The Irland Group November 18, 1999
Page: 222
5. Classification 61 “operating engineer” is unclear -- it mentions handwheels, levers,
and foot pedals -- the other machines have these as well. Also, many other equipment operators
do at least some front-line maintenance. Bigger operations have full-time mechanics.
6. Skidder operators and all-round logger. It is now common that the skidder crew
consists of one worker, not the driver/chainsaw team we once saw not so long ago. So this
worker is a chainsaw hand and skidder and maybe the equipment owner as well. This situation
needs its own job description. The bottom line is that there are fewer and fewer skidders, and
even fewer workers who do nothing but drive a skidder.
Job Classification Number 75 is the all-round logger. This worker is often an equipment
owner, and is usually paid by piece rates, not usually by the hour. This description allows for
situation of one or two person crews but is not specific as to whether this person also runs the
skidder if in a “one-person crew.” Clarification would help.
In today’s operations, workers tend to be specialized. According to the MDOL
regulations, many loggers perform a variety of tasks. Yet, in practice, it is hard to see this
happening. Feller-buncher operators do perform field-level maintenance on their own machines,
but they typically do not man a delimber for a while, and then drive a load of logs. It is our view
that most operations today do not even have an “all-round logger” in the traditional sense.
There has been concern that employers use the all-round logger classification to take
advantage of a lower wage. If concern continues as to abuse of this classification, its abolition
could be considered. In determining rates and work conditions, the artificial distinction between
employees and subcontractors (for owners of a single skidder) should be ignored.
7. Classification Number 53 “bulldozer operator” should include insertion of the term
“build” before “grade.” Actually constructing roads on a cleared right-of-way would be
somewhat different than merely grading an existing one, especially when it involves following
surveyor stakes or flagging, etc.

Pan Atlantic Consultants/The Irland Group November 18, 1999
Page: 223
8. Classification Numbers 65-68 need to make clear the distinction between a “wheeler”
or triaxle (single-frame) truck versus a tractor-trailer rig which is much larger. Also,
descriptions should make clear whether they are referring to loading logs, heavy equipment, or
something else onto the trucks.
Also, the “flatbed” that hauls heavy equipment is different from the log truck. There are
particular skills needed in loading/unloading equipment like skidders or forwarders.
9. No. 47/85 Log scaler should require a Maine scaler’s certificate or enrollment in a
course to obtain one.
10. Forester-- 48/86. There is no need to include foresters in the survey at all. They
have four-year, or at least two-year, technician training and are an entirely different class of
worker requiring less regulation.
11. There is very little site-prepping in Maine right now, but it would make sense to
expand the “crusher” classification (#83) to include “or other site preparation equipment.” We
know of only two crushers in the state.
12. Feller Buncher, No. 60&72. Change “tractor” to “machine” -- This machine does
not tow or pull anything. The job description should indicate that the operator maneuvers the
machine through the stand as well as positioning the head and doing the other things noted. The
description might also indicate that care in avoiding damage to soil and residual trees is usually
required (actually, this could go in any harvesting machine description).
13. Nos. 81, 89. One reviewer suggested calling this a “Harvester,” though the term
“processor” is often used. Should include the words “cut-to-length” in the description to be
completely clear: “Cut to length harvester” or “Cut-to-length processor.” There are machines
termed “processors” that only delimb and buck trees that have already been felled and bunched.
Pan Atlantic Consultants/The Irland Group November 18, 1999
Page: 224
Heavy Equipment Reimbursement Rate-Setting
Because the Woods Wage Survey has already been completed for the 2000-2001
operating season adverse effect wage rate determination, we recommend that MDOL conduct a
simple survey of heavy equipment ownership during the winter of 1999-2000. Interviewees for
this initial equipment rate-setting survey should include logging contractors, independent owner-
operators, equipment dealers, and associations such as the Professional Logging Contractors of
Maine and the American Pulpwood Association. If there is time and resources to conduct a
public hearing on the issue, MDOL may be able to gather many of these industry participants in
one room simultaneously. For future seasons, equipment rate-setting could be added to the
annual Woods Wage Survey. As previously noted, new types of logging equipment to
incorporate include feller-bunchers, delimbers, grapple skidders, CTL processors, forwarders,
and loaders.
Regional Labor Markets
It is unlikely that labor markets in upstate New York, northern Vermont and New
Hampshire, and parts of southernmost Maine are sufficiently similar to justify using a single
survey and set of findings for all of these areas. In fact, we find that labor market dynamics
within Maine are different even between the southwestern and northernmost parts of the State.
In the future, Woods Wage Survey results should be checked for differences between major
divisions of the sample region.
To the extent that it is possible, categorizing Woods Wage Survey responses by intra-
State regions could better reflect meaningful distinctions in labor market conditions within the
State. For example, the St. John Valley and northwesternmost Maine (including LMA 34 and
the tops of LMAs 29, 30 and 31) could be one region, and our “southern North Woods”
(including some or all of LMAs 19, 21, 22, 23, 24, 29, and 31) could represent another.

Pan Atlantic Consultants/The Irland Group November 18, 1999
Page: 225
Sample Frame
In the course of this project, we used existing MDOL lists on loggers, and supplemented
it with lists obtained from the Department of Conservation’s FPA reports. The Department has
attempted to make use of a variety of information sources on loggers, but has found most of them
unsatisfactory. We suggest a zero-based review of the logger listing using all available
information every three years.
Share Information Across Surveys
The MDOL performs detailed surveys of occupational wages for a number of purposes.
For example, wage information is collected for the Census of Maine Manufactures, the
Occupational Employment Statistics (OES), and the annual Woods Wage Survey. In addition,
MDOL sponsors occasional, ad hoc surveys for special purposes -- such as this study of the
logging industry. This survey proliferation often duplicates efforts and alienates the logging
contracting firms who are required (or encouraged) to respond. The MDOL would be well
served to streamline its approach to the public through one or two primary wage survey
exercises.
Unnecessary Items
The Stem Rate Tables can be dropped. They are in only occasional use and are no longer
needed. There is no need for a separate survey to determine where the H-2 employers are
operating. If an adequate degree of field auditing is to be re-established, this will take care of
itself. The real concern of the H-2 law is to ensure proper wages and working conditions, and
has no bearing on whether a crew is cutting in T2R10 or T2R11. This survey, in our opinion,
does not produce useful information.

Pan Atlantic Consultants/The Irland Group November 18, 1999
Page: 226
Additional Information Needed
The existing forms for the Wage Survey generate some information that is not routinely
captured. For example, employers have been reporting the number of bonds, visa-holders, and
US workers employed, but MDOL has not used the information. In addition, data on the number
of US citizens, bonds, and visa-holders needs to be supplemented by information on dual
citizens. For this project, we did our own tabulation from MDOL survey forms, the results of
which is presented in the section “How Many Loggers Are There in Maine?”
In addition, at the close of each operating year (probably each April or May, during “mud
season”), MDOL should request the actual number of bonds employed from every H-2
employer. This is a basic starting point for continuing to monitor the impact of the H-2 program
on the State. Also, in keeping with efforts to monitor the state of mechanization and equipment
ownership, it would be advisable to require a list of machines by contractor, listed according to
equipment ownership (i.e., firm, employees, other).
Consultative Process
Building on the 1999 Working Group, a consultative process should be used to discuss
these issues and MDOL’s proposed responses.
H-2 PROGRAM PRACTICES AND PROCEDURES
Auditing
The MDOL is re-instituting regular audits of H-2 employers. This is commendable and
should be continued. The issue is one of quality control -- if employers believe they have a one
in three or one in four chance of an audit, they are motivated to make special efforts to comply.
They need not be visited annually, except in the case of problem employers.
The audits will place the MDOL in a position of having more regular communication at
an informal level with at least a sample of the employers each year. In our interviews, employers
supported the idea of regular auditing.
A corollary of increased auditing includes our recommendation to conduct annual counts

Pan Atlantic Consultants/The Irland Group November 18, 1999
Page: 227
of the actual number of bonded laborers used the previous logging season. This could be done
by MDOL during the spring “mud season,” and would involve no more than a simple query of
each H-2 employer of the year before. To date, MDOL has only tracked the number of bonds
certified, but not the number of bonds employed.
Consistent Advice and Information
Complaints are regular, and perhaps unavoidable, about employers receiving inconsistent
guidance on the program’s requirements. Hopefully the many clarifications about policy that are
now being developed can be conveyed in writing, and future questions handled in a more
consistent manner. The shrinking number of H-2 employers should make this easier.
The Departments need to develop procedures to address this issue.
Pooled Interviews
We have interviewed workers and employers to understand the worker recruitment
process. We actually attended two pooled interviews and interviewed several participants on
site. Very few workers show up. The number of hires achieved through this process is
virtually nil and this has been the case for some time. Loggers use many other methods of
recruitment (Figure 87).
We are unable to see any useful purpose served by these pooled interviews. The
requirement should be eliminated.

Pan Atlantic Consultants/The Irland Group November 18, 1999
Page: 228
Figure 87
What Other Methods Do Contractors Use to Find Workers?
1 “Word of mouth” 2 “Newspaper ads not placed by an agent” 3 “Trade magazine ads” 4 “Job fairs” 5 “Unemployment office” 6 “Agent” 7 “Recommendation” 8 “My good reputation” 9 “Unsolicited applications” 10 “Good pay” 11 “Flyers at equipment dealers and service stations”
Comments from the Industry: Bonds & Related Issues In both the Contractor Survey and the Worker Survey, respondents were given the opportunity to provide open-ended comments. Additionally, strategic interviews yielded insights about this study and general conditions in the logging industry. Respondents’ comments are noted below. 1. The problem in my area is that the landowners have used the harvesters’ high production to bid down the prices they will pay to the point where a cable skidder can’t compete. I can do a better job on the woods, but the companies’ only real concern is profit. They care about the state their pocketbook is in. 2. The best help ME can offer is stabilization of prices. Better enforcement of Mill Scalers - “Logs”, “International Rule” takes out ¼. Loggers don’t get paid for all wood. One scale rule in all of ME would be better- “Maine Rule.” “Fairer.” 3. Canadians are difficult to handle, but they do their job if properly supervised. Maine workers just don’t have what it takes. Lost time, poor performance. 4. I think it will be difficult to extrapolate any accurate information from this survey given the small number of participants and the fact that each may interpret what you want differently. Averages are very hard to arrive at given the range of variables in each aspect being quantified. Perhaps it is easier for others than me. For policy makers to use this data for decisions is worrisome for me. 5. Have a state office where we can call to for information on mill prices and markets. See if mills will open markets. 8. 1998-1999 was the last year my company harvested timber. New owners of the land have reduced prices significantly and I am out of the business.

Pan Atlantic Consultants/The Irland Group November 18, 1999
Page: 229
10. Workers running mechanical forestry equipment should be earning $14.00 - $16.00 per hour instead of the $8.00 - $10.00 they now earn. Landowners have colluded to depress prices contractors and loggers receive. 11. When X purchased Y, we didn’t have any negotiations. We were offered a 30% decrease from what we had made with Y for the past 20 years. There wasn’t a second offer, it was basically “take it or leave it.” We believe this was done so that they could hire Canadian labor. We had a perfect record for 35 years. We never fell short of filling our contracts. Now we are forced to travel 2 hours and 40 minutes and stay at camps all week. Previous to the buyout we only traveled 20-30 minutes. Canadians are subsidized when they buy equipment, and because of the exchange rate and health care situation they are cheaper to hire. Irving has taken over, they set the low prices and the competition will follow. The State of Maine needs to protect its people. Logging will never be the same. 13. I was one of the original founding members of the professional logging contractors of ME and currently sit on the board of directors. This study you’re doing here, seems to be pointed strictly at the bonded Canadian issue, which is a far cry from what the real problems are in our industry. I would invite a representative from your dept. to schedule a meeting with the board of directors for the PLCM so that you can get the total picture of the problems and the bleak future facing the forest products industry as a whole. This questionnaire doesn’t begin to deal with the issues at hand. 14. In the next 5 years I will lose many all-around loggers. Most loggers stop at 60 years of age. No new loggers because it does not pay enough.

Pan Atlantic Consultants/The Irland Group November 18, 1999
Page: 230
Other Views
In Figure 88, we present statements by interviewees on these and related issues, in
response to an open-ended survey question.
Figure 88 Loggers’ Suggestions on the H-2 Program
2 "Would not allow them across the border because we can't work over there"3 "Do away with the program completely"4 "Make it easier with the DOL to hire. Time frame too long. Advertise"5 "The required experience needed should be more"6 "DOL should authorize more visas"7 "3/4 guarantee- I get contracted for 1000T, yet he can only move 850T now!
Need to be able to get extra bonds quicker to react to market"8 "Cut CLS which could terminate, would like to change 75 % when not our fault"9 "Period to get a certification- you should be able to apply in a much shorter time"
10 "Paperwork is excessive; advertising costs are very high"12 "Prevailing rates in hardwood are too high"13 "Employers should not have to hire the number of bonds requested"14 "The 3/4 Guarantee is difficult to abide by"15 "MDOL should limit the time for US workers to come onto a crew; it is disruptive to
productivity to alter a crew midway through"16 "The problem with the 3/4 Guarantee is that wood-cutting contracts are not signed during
the H-2 application period, making it difficult to balance work requirements with labor resources. Furthermore, the H-2 hiring period is too long."
17 "US employers should be able to get bonds, but not Canadian contractors"18 "The DOL rate should prevail for all loggers, including US, visa-holders, or bonds."19 "Canadians should be allowed to work in the US by the hour, but should not be permitted to
bring heavy equipment across the border."
Pan Atlantic Consultants/The Irland Group November 18, 1999
Page: 231
THE CLP PROGRAM AND ITS IMPACT ON LOGGING
Synopsis of the Issue
The Certified Logging Professional (CLP) Program is a relatively recent development in
the logging industry. It has been both heralded by its proponents and derided by critics, but as of
1999 an estimated 80% of loggers in the State had completed its certification programs. In
summary, CLP has the following groups of proponents:
• landowners, who have seen improved forest safety drive workers compensation (WC)
insurance premiums down markedly;
WC insurance providers, who have seen claims fall;
foresters, who have seen improvements in sustainable forestry practices overall since the
inception of the program; and
loggers, more than 2,600 of whom have completed CLP training and many of whom have
come to believe that its practices increase safety and help professionalize the industry.
Critics of CLP, the largest group of which includes loggers with decades of experience,
focus their objections on three aspects of the program: its direct and implied costs, its inability
to substitute for years of practical experience, and its “infringement on the rights of individuals”
to earn their living the way they deem appropriate. This group of loggers not only tends to be
very experienced, but also appears to be concentrated in the southern region of the State, where
landholdings are smaller and loggers are more likely to be harvesting their own land.
In our Worker Survey, 80% of our sample (N=98) claimed to be CLP-certified. This
confirms what we had been told in strategic interviews regarding the rate of certification.

Pan Atlantic Consultants/The Irland Group November 18, 1999
Page: 232
Figure 89
CLP Statistics from Logger Interviews Percent N Currently CLP 79.6% 98 Received paid training last ten years 76.5% 98 Employer paid CLP 71.4% 98 Paid wage while training on company 8.2% 97 equipment Source: PAC interviews.
Background
The CLP program operates under the auspices of the Maine TREE Foundation and is
administered in Jackman by Michael St. Peter. The program’s aim has been to increase the
safety and environmental sensitivity of the logging profession, while also helping to establish a
career path for loggers—thus “professionalizing” the industry. CLP began in 1991 and has since
served 2,600 loggers, which is estimated to represent at least two-thirds of the total logger
population in Maine in 1999.
CLP teaches modules on safe and efficient wood harvesting, the “business of logging,”
forest management and silviculture, first aid, and fish and wildlife conservation. The program
involves several days of intensive training in the spring and fall of each year on each of these
topics. The course costs $500 per participant, and course fees are covered either by the logger or
their employer. CLP notes that many of its active members are company employees, rather than
independent contractors. Courses are geared toward loggers in five categories. There are
conventional, mechanical, and supervisor/contractor courses, as well as associate (non-logger)
and apprentice (trained in high school) courses.

Pan Atlantic Consultants/The Irland Group November 18, 1999
Page: 233
Upon completion of the primary course of study at CLP facilities, CLP instructors visit
successful candidates at their work sites within six months. On the work site, the instructors
interview the candidate, observe work practices, and determine whether or not the logger is
adhering to CLP principles. The on-site visits suggest a “quasi-regulatory” nature to some, and
are a source of many objections to the program.
The literature regarding CLP has been overwhelmingly positive in its assessment of the
program’s success. The John D. and Catherine T. MacArthur Foundation’s Sustainable Forestry
Working Group praised CLP in 1998 for successfully confronting the concerns of high injury
rates, an aging logging workforce, loss of training opportunities at the high school and vocational
school levels, and the threat of state regulation of forestry environmental practices. In summary,
the Working Group calls CLP an “unusually successful emerging technique that helps to sustain
resources and development” (page 4-6). Likewise, Maine’s Logger Licensing Technical Review
Committee, reporting in 1998 to the Department of Professional and Financial Regulation, calls
the CLP program “a success story” (page 2). In fact, the Committee recommended against the
State’s instituting either a logger licensing or even a registration policy because, in its view, CLP
has been so effective. The Committee consisted primarily of professional loggers and foresters,
as well as the Director of the Maine Forest Service.

Pan Atlantic Consultants/The Irland Group November 18, 1999
Page: 234
Arguably CLP’s most notable contribution to the logging industry, which has won the
program accolades from the likes of the Maine Employers Mutual Insurance Company
(MEMIC), is the reduction it has brought about in worksite fatalities and major disabling
injuries. In fact, WC rates for CLP loggers are now reportedly up to 74% below rates for a non-
certified conventional logger (1999). WC rates which, until the early 1990’s, exceeded $40 per
$100 in payroll have fallen to $10.50 per $100 in payroll in 1999. CLP literature notes that,
from 1990 (the year before the program’s inception) to 1994, lost workday WC claims fell 45%,
while fatalities declined from six to two. Major landowners, including International Paper (IP),
have begun mandating that all of its logging contractors be CLP-certified. For IP, this became
“law” on January 1, 1998; other landowners have followed suit. As of July 1, 1999, it is reported
that IP will no longer purchase pulpwood from non-CLP-certified loggers except those that are
non-commercial, harvest only their own property, and attempt to sell no more than ten truckloads
annually to IP’s pulpmills.
That portion of the logging population which is “against” CLP base their objections on
several points. One is the program’s direct and indirect or implied costs. Direct costs include
the $500 fee to take the course, and additional fees to maintain active CLP status in subsequent
years. Indirect or implied costs include the costs of CLP-appropriate safety gear as well as
additional maintenance and fuel costs for the chainsaw and other equipment that bear additional
wear-and-tear as a result of more meticulous logging. A second objection to CLP is brought by
loggers with many years—often decades—of experience, who object to the fact that CLP is a
course taught in a few days, perhaps by people with less time in the woods than themselves.
These loggers insist that they, not the academic CLP instructor, know what works and what does
not work on the job site in terms of balancing safety and productivity. Third, CLP’s detractors
dislike the inherently intrusive nature of the on-site inspections, and many feel that their
individual rights to earn a living are compromised by CLP practices which may emphasize safety
at the cost of productivity. Finally, loggers argue that actually implementing time-consuming
CLP safety and environmental practices slows down work and results in productivity (and
compensation) losses, most directly for loggers paid on a piece-rate system.
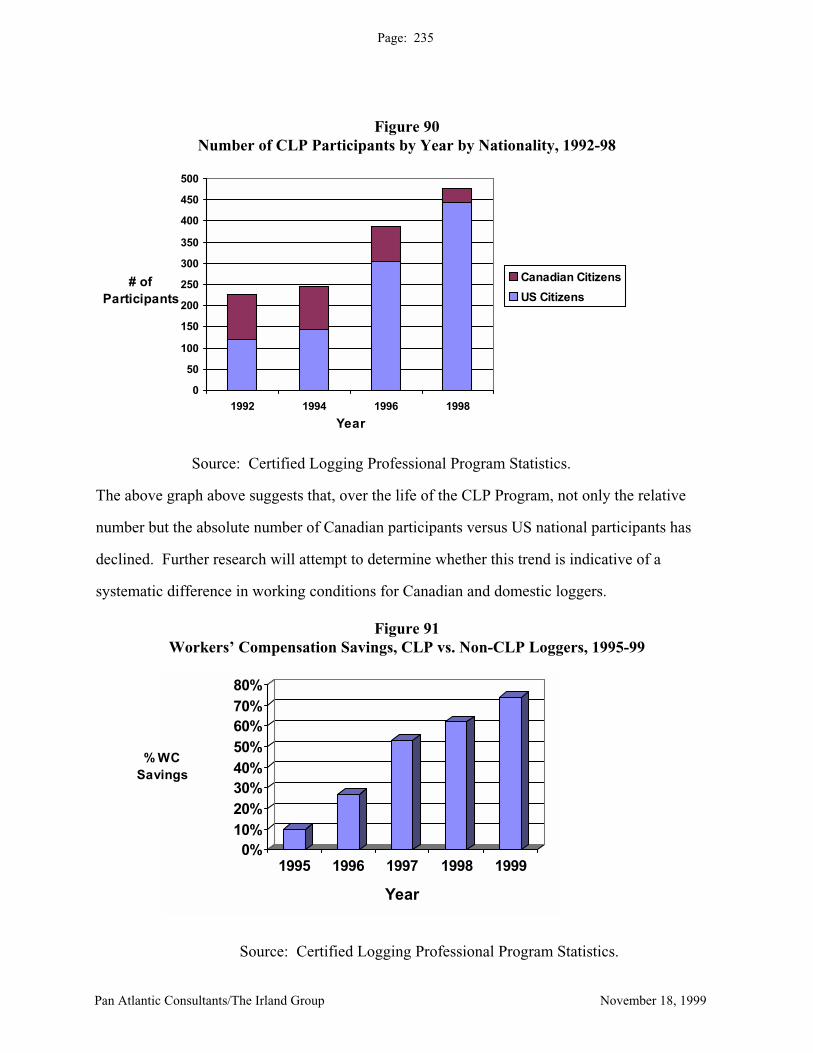
Pan Atlantic Consultants/The Irland Group November 18, 1999
Page: 235
Figure 90 Number of CLP Participants by Year by Nationality, 1992-98
0
50
100
150
200
250
300
350
400
450
500
1992 1994 1996 1998
Year
# ofParticipants
Canadian Citizens
US Citizens
Source: Certified Logging Professional Program Statistics.
The above graph above suggests that, over the life of the CLP Program, not only the relative
number but the absolute number of Canadian participants versus US national participants has
declined. Further research will attempt to determine whether this trend is indicative of a
systematic difference in working conditions for Canadian and domestic loggers.
Figure 91 Workers’ Compensation Savings, CLP vs. Non-CLP Loggers, 1995-99
0%10%20%30%40%50%60%70%80%
% WCSavings
1995 1996 1997 1998 1999
Year
Source: Certified Logging Professional Program Statistics.

Pan Atlantic Consultants/The Irland Group November 18, 1999
Page: 236
In our worker survey, we found 80% claimed CLP certification (N=96). Of these, 76%
has received training paid for by the employer in the past 10 years, and 71% had CLP paid for.
53% received other employer-paid training, primarily first aid.
Contractors reported the following:
-- 87% pay for training and re-certification.
-- 65% require for all on some workers (N=70)
-- 66% are required to have CLP by insurers (N=73)
-- 70% believe CLP improves safety (N=73)
-- 51% said their cut contracts require CLP (N=73)
-- 68% believe CLP lowers WC costs (N=73)
Recommendations
In our interviews and surveys, we heard many different viewpoints on CLP, but were
impressed that the majority were favorable. Positive comments regarding CLP came from
loggers, landowner representatives, foresters, and others close to the industry with extensive
practical experience. Many logging contractors pay for their workers to attend CLP programs
and value its results. While negative feedback is useful and should not be ignored, it is useful to
recall the maxim that “a satisfied customer tells three people, while a dissatisfied customer tells
nine.”

Pan Atlantic Consultants/The Irland Group November 18, 1999
Page: 237
At this time, the vast majority of loggers working in Maine have (or have had) CLP
certification. The CLP program has functioned well over the last eight years to improve safety
and reduce workers’ compensation rates in the logging industry. Furthermore, it has done so
without government regulation at either the State or Federal level. As found by the Logger
Licensing Technical Review Committee in 1998, there does not appear to be solid rationale for
either creating a competing program or for licensing loggers in the state. CLP should be allowed
to run as it has, without government regulation. We believe that the Maine State Government’s
continued support of the program through complete or partial scholarships to attend CLP should
resolve concerns about financial hardship (MDOL has established a fund to pay $250 of the
initial $500 course fee for each new participant in the program).
As of the 1999 operating season, MDOL allows H-2 employers to require H-2
certification of new hires, whether US or Canadian. As such, CLP now has the status of a
“prevailing practice” in the logging industry. Therefore, it should be subject to the same MDOL
auditing procedures as all other wage and working condition factors. MDOL, then, can assist the
CLP program in enforcing CLP standards and practices. Enforcement would tend to “level the
playing field” and ensure that CLP is a true industry standard practice.

Pan Atlantic Consultants/The Irland Group November 18, 1999
Page: 238
REPORT ADDENDA:
PROJECT TEAM BIOGRAPHIES & SOURCE LISTS

Pan Atlantic Consultants/The Irland Group November 18, 1999
Page: 239
PROJECT TEAM BIOGRAPHIES
Patrick O. Murphy
Pan Atlantic Consultants Patrick O. Murphy is the President and founder of Pan Atlantic Consultants, one of Northern New England’s largest and most diversified strategic market research, marketing consulting and business planning consulting firms. He has personally directed over 300 strategic market research, business planning, market development and quantitative and qualitative marketing projects since 1985. His expertise is in advising both private and public sector organizations on business development, research and marketing issues. He has over 20 years experience in the development of markets and promotion of concepts, goods and services in the U.S. and worldwide. Mr. Murphy is a member of the US Small Business Administration (SBA) National Advisory Council and chairs the International Trade Committee. He also serves on the Maine SBA Advisory Council and is a Director of both the Maine International Trade Center and the East/West Highway Association. He was Chairman of the Maine Delegation to the White House Conference on Small Business in June 1995. Mr. Murphy previously held the position of Executive Director with the Irish Trade Board in New York City, as well as other senior assignments with the same organization in Europe and the Middle East. He started his career with Arthur Andersen Consulting. He has B.A. and M.A. degrees in Economics from Trinity College, Dublin University.
Pan Atlantic Consultants/The Irland Group November 18, 1999
Page: 240
Jennifer A. Senick
Pan Atlantic Consultants Jennifer Senick is a Senior Consultant at Pan Atlantic. She joined the firm in 1997. Since then she has managed strategic consulting projects in the US and Europe in industries as diverse as forest products, food ingredients and automotive and mechanical engineering. Jennifer’s expertise is strong in strategic business strategy development, qualitative and quantitative market research and strategic planning. Her previous work experience includes seven years as an international consultant with the Rand Corporation and research and managerial positions at Harvard University and the Woodrow Wilson Institute. At the Rand Corporation, Jennifer played a senior role in numerous projects. Jennifer holds an A. B in Government and Russian from Bowdoin College, an M.A. in Political Science (Comparative Government and Quantitative Methods and Formal Modeling) from the University of California, Los Angeles, and awaits a Ph.D in Political Science from the same. She is an active member of her local community, serving on the directors’ boards of two non-profit organizations.
Pan Atlantic Consultants/The Irland Group November 18, 1999
Page: 241
Eric Bassett
Pan Atlantic Consultants Eric joined Pan Atlantic in 1999, bringing seven years of experience in marketing research, business strategy, and corporate development. To date, his projects with Pan Atlantic have included marketing research and public policy analysis in industries including forestry, automotive components, real estate, and industrial machinery. Independently and with two Washington, DC consulting firms, Eric has managed projects providing strategic planning and corporate development support to Fortune 500 and private companies. His industry experience includes professional and financial services, electric utilities, and consumer and industrial projects. His skills include business and market analysis, primary and secondary marketing research, and facilitation of strategic alliances and joint ventures. In particular, he has assisted companies in finding and developing joint venture/acquisition candidates; analyzing and entering new, particularly international, markets; and segmenting markets to identify business opportunities. Eric’s projects have enabled companies to preempt competitive threats, make profitable joint ventures and acquisitions, and develop new customer relationships in markets worldwide. Eric has worked with clients across the United States and Europe, and has assisted in the development of export markets for companies in Europe, Asia, and Latin America. He has lived in Russia, speaks Russian and some Spanish, and has worked with various international trade organizations including the U.S.-Russia Business Council and the New Zealand Trade Development Board. He also held internships at the US Departments of State and Commerce in Washington, DC. Eric holds an MS degree from Georgetown University in International Business and a BA from Duke University in Russian Language & Literature and History.

Pan Atlantic Consultants/The Irland Group November 18, 1999
Page: 242
Kristina Morse
Pan Atlantic Consultants
Kristina Morse is the Director of Quantitative Research at Strategic Marketing Services (SMS). She is currently responsible for executing and managing a wide range of quantitative market research studies in both the public and private sectors. Kristina has several years of market research, strategic planning and project management experience, and brings to the firm strong market research, analytical, and statistical skills. Ms. Morse was previously employed by Harvard Pilgrim Health Care in Dedham, Massachusetts. There, Kristina was part of a five-person implementation team which developed First Return, Inc., a subsidiary of Harvard Pilgrim Health Care which offers workers’ compensation insurance and services. She supported all aspects of implementation including marketing, operations, and strategic planning. Kristina also was a Teaching Assistant/Tutor and a Statistical Researcher at Bates College, in Lewiston, Maine Kristina graduated Phi Beta Kappa and Magna Cum Laude from Bates College and holds a BA in Sociology. She is proficient in SPSS, WordPerfect, MS Suite, and MS Project.

Pan Atlantic Consultants/The Irland Group November 18, 1999
Page: 243
Dr. Lloyd C. Irland, PhD
The Irland Group
Lloyd C. Irland is President of The Irland Group, a forest economics and marketing consulting firm in Winthrop, Mane. The firm provides resources analysis, cost and economics studies, and market research to private clients a well as evaluation and policy analyses for government agencies. Much of the firm’s work is concentrated in the northern tier states from Minnesota to Maine and n adjacent Canadian provinces. Irland served a an Associate Economist for the USDA Forest Service, Assistant Professor at the Yale School of Forestry and Environmental Studies, and as State Economist for Maine before forming The Irland Group in 1987. His PhD is from Yale University.

Pan Atlantic Consultants/The Irland Group November 18, 1999
Page: 244
Dr. Jonathan Goldstein, PhD
Bowdoin College Jonathan Goldstein received his PhD in Economics from the University of Massachusetts. He has been on the faculty of Bowdoin College since 1979 and currently holds the rank of Professor. He ha also held appointments as Visiting Professor at the University of Massachusetts and as a Resident Scholar at the Jerome Levy Economics Institute at Bard College. Goldstein’s primary research interests are in the areas of macroeconomics and econometrics, particularly as applied to issues concerning the business cycle. He has published numerous articles on this subject and others in academic journals and edited collections including papers in The Journal of Business, The Southern Economic Journal, The Journal of Risk and Insurance, Metroeconomica and The Journal of Post Keynesian Economics. He recently completed a research project on Russian labor markets in transition after spending his 1995-96 sabbatic leave in Russia. This project included a study of the Russian wood harvesting industry. Other research topics include the risk and self-insurance implications of motorcycle helmet use, financial determinants of investment demand and the likelihood of a deficient demand crisis in the coming decade. Goldstein teaches courses in macroeconomics, statistics, econometrics, political economy and the business cycle.

Pan Atlantic Consultants/The Irland Group November 18, 1999
Page: 245
Kevin M. Allcroft
Forestree Concepts Kevin’s fourteen years experience in the forest industry in Maine has required working with many large and small landowners. He has extensive experience with various harvesting techniques, inventory and forest regeneration. His responsibilities have included harvest bidding harvest supervision, inventory, road system layout and road construction supervision. He has practiced in New Brunswick and the States of Mane, Massachusetts, New Jersey and New York. The pat four years he has been working as an interviewer and researcher for The Irland Group. Experience including phone interviewing and on-site visits for data research and current market trends.

Pan Atlantic Consultants/The Irland Group November 18, 1999
Page: 246
DIRECTORY OF SECONDARY SOURCES CONSULTED
Benjamin, Thomas and McCain, Margaret. Temporary Labor Certification Process For Agricultural Workers. Maine Woodsmen Association. September 1979. Bolduc, Claire. Research On Skidder Costs. June 1978. Bond, Robert. Bonded Canadian Labor in New England’s Logging Industry. January 1977. Brigham, Eugene and Smith, Keith. The Cost Of Capital To The Small Firm. Clark, C. E. 1977. Maine: a history. New York: W.W. Norton. 199 pp. Conway, S. 1982. Logging practices: principles of harvesting systems. San Francisco: Miller-
Freeman Publications. 432 pp. Coolidge, P. T. 1963. History of the Maine woods. Bangor: Furbush-Roberts Printing Co., Inc.
805 pp. Cottell, Philip. Human Factors in Logging Productivity. Pulp and Paper Research Institute of Canada. May 1974. Donovan, Richard and Swain, Elizabeth. Maine Woods Labor Study, 1984-85. Prepared for the Maine Department of Conservation. May 1986. Donovan, Richard. Woods Labor Training Needs. Blaine House Conference on Forestry. December 1984. Drushka, K., and H. Konttinen. 1996. Tracks in the forest. Madeira Park, BC: Harbor
Publishing. Einsiedler, Charles. How Great is the Threat from Canadian Labor? Blaine House Conference on Forestry. December 1984. Einsiedler, Jr., Charles and Ayre, Albert. Comments On And Proposed Amendment To Department Of Labor Employment And Training Administration Proposed Rules 20 CFR Parts 654 And 655 Published Tuesday, May 5, 1987. American Pulpwood Association. May 15, 1987. Falk, Jonathan. The Organization of Pulpwood Harvesting in Maine. February 1977. Forintek. History of Eastern Mechanization. Frederic, Paul. Maine-Quebec Lumber Trade: A Discussion. Panel Discussion at the Maine Council for Canadian Studies Conference. April 1983.

Pan Atlantic Consultants/The Irland Group November 18, 1999
Page: 247
Goodwin, Robert and Levine, Louis. Chain Saw Allowance Practices In Logging Industry. September 1965. Goodwin, Robert. Canadian Woodsmen Program. July 1965. Hardison, Mark. A Maine Woodcutter Talks About Safety in the Woods. Blaine House Conference on Forestry. December 1984. Hu, Dianyou. An Econometric Analysis of Maine’s Pulpwood Stumpage Market. May 1999. ⇒ Maine’s Average Daily Pulp and Paper Capacity in Short Tons, 1913-1996. Number of Maine Logging Firms, 1954-1992. Employment in Maine Logging Firms, 1957-1994. Total Employment in Maine Logging Firms, 1957-1994. Spruce/Fir and Hardwood Pulpwood Mill-Delivered Prices in Maine, 1962-1994. Wood Volumes, Wages, Mill Capacities, and US Population. Irland, Lloyd. Future Employment in the Maine Woods: Situation, Forces, and Outlook. Prepared by the Maine State Planning Office for the Blaine House Conference on Forestry. December 1984. Irland, Lloyd. Labor Trends in US Forest Industry: A Statistical Survey. Yale University, School of Forestry and Environmental Studies. May 1974. Irland, Lloyd. Log and Wood Products Trade in the Northeastern Borderlands: Economic Context and Political Tensions. November 1998. Irland, L. C. 1999. “Maine forest land ownership changes and issues.” Talk given at the Pine
Tree State Arboretum, Augusta, Maine. 44 p. Irland, Lloyd and Maxcy, Joel. Maine’s Wood Industry: Value-Added Relationships 1982-1987. From the Forest Products Journal, September 1991. Irland, L. C. 1999. The northeast’s changing forests. Massachusetts: Harvard Forests. 401 pp. Jennings, John. Down East Uprising: Can The Woodsmen Win? New Englander Magazine. February 1976. Judd, R. W. 1989. Aroostook: A Century of Logging in Northern Maine. Orono: Univ. Maine
Press. 351 pp. Krug, Joseph. A Condensed Report of Wood Harvesting at the State’s VTIs and What is a Woodsman? Blaine House Conference on Forestry. December 1984. Levesque, Emilien. Maine Chain Saw Survey. Maine Department Of Manpower Affairs. February 1975. Lutz, Jack. The Logging Industry in Maine: Final Report. December 1989.

Pan Atlantic Consultants/The Irland Group November 18, 1999
Page: 248
Maines, Michael. Proposal for the Forest Operations Institute: A Request for Participation by Maine’s Major Landowners. January 1998. McCain, Margaret. Labor Certification Process For The Temporary Employment Of Aliens In Agriculture And Logging; Requirements As To The Provision Of Meals. 20 C.F.R. 655.202(b)(4). Maine Woodsmen’s Association. September 1980. McCain, Margaret. Suggestions On Ways To Improve The Administration Of Department Of Labor Programs. Maine Woodsmen’s Association. McConnell, Dennis. Letter addressed to Mr. Fongemie. University Of Maine At Orono. November 1979. Meinig, D. W. 1993. The shaping of America: a geographical perspective on 500 years of
history. Vol. 2, Continental America, 1800-1867. New Haven: Yale University Press. Menario, John. Safety and Workers Compensation. Blaine House Conference on Forestry. December 1984. ⇒ An assessment of efforts to regulate workers comp insurance by the legislature. Nader, Ralph. Chapter IV: Pulpwood Peonage. Mid-1970s. Parenteau, Bill. Bonded Labor: Canadian Woods Workers in the Maine Pulpwood Industry, 1940-55. From Forest and Conservation History, July 1993. Pike, R. E. 1967. Tall trees, tough men: an anecdotal and pictorial history of logging and log-
driving in New England. New York: W. W. Norton. 288 pp. Silversides, C. R. 1997. Broadaxe to flying shear: the mechanization of forest harvesting east of
the Rockies. National Museum of Science and Technology, Ottawa, Canada. Transformation Series 6. 174 pp.
Rolston, Kenneth. Statement Before The Subcommittee On Immigration Senate Judiciary Committee. American Pulpwood Association. November 1981. Rummer, Bob. Labor for Forestry Operations: Issues for the 90s. Presentation to the American Society of Agricultural Engineers. December 1992. Sanders, Grover. New England Woods Workers: Survey Findings. Office of Farm Labor Service, Bureau of Employment Security. 1969. St. Peter, Michael. A Brief History of the Northern Woods Logging Association. Blaine House Conference on Logging. December 1984. White, Fred and Musser, Wesley and Oosthuizen, Johannes. Cost Of Capital For American Agriculture: Its Use In Agricultural Policy Formulation. Wille, Margaret. The Threat from Imported Canadian Labor is Alive and Well. Blaine House

Pan Atlantic Consultants/The Irland Group November 18, 1999
Page: 249
Conference on Forestry. December 1984. Williams, M. 1992. Americans and their forests. New York: Cambridge Univ. Press. 599 pp. Wood, R. G. 1961. A history of lumbering in Maine, 1820-1861. Univ. Maine Studies Sec. Ser.
No. 33. 267 pp. + map. Other Sources American Pulpwood Association, Northeastern Technical Division Safety and Training Committee. Professional Mechanical Harvesting Practices. September 1997. Bangor Daily News. Miscellaneous Articles. 1970s to 1999. Bowdoin College Public Affairs Research Center. Study of Problems Relative to Obtaining a Continuing Supply of Domestic Workers for Woods Operations in Maine. June 1968. Census of Maine Manufacturers. Data through 1996. ⇒ Value of Product, Average Wages, Number of Workers, Value/Worker. Certified Logging Professional (CLP) Program.
• Brochures and Factsheets. 1999. Maine Forest Service Press Release Re: $500,000 Grant to CLP Program. March 17,
1999. A Guide for the Maine Logger. CLP Program Training Manual. Spring 1999. Mater, Catherine. Emerging Technologies for Sustainable Forestry: A Case Study from
“The Business of Sustainable Forestry”. John D. and Catherine T. MacArthur Foundation. 1998.
Code of Federal Regulations. 20 CFR 655.200-215 “Subpart C—Labor Certification Process for Logging Employment and Non-H-2a Agricultural Employment.” Employment And Training Administration, Labor. Labor Certification Process For The Temporary Employment Of Aliens In The United States: Methodology For Determining Equipment Reimbursement Rates For New England Loggers. Employment And Training Administration, United States Employment Service. Labor Certification Process For The Temporary Employment Of Aliens In the United States: Provision Of Reimbursement Rates To Be Paid Loggers Who Supply Their Own Equipment To Perform Their Jobs [20 CFR.202 (b) (3)]. October 1979. Logger Licensing Technical Review Committee. Making the Current Laws Work. January 1998. Logging Equipment Reimbursement Rates. Chronology. USES-DLC. January 1980

Pan Atlantic Consultants/The Irland Group November 18, 1999
Page: 250
Logging Equipment Reimbursement Rates. Discussion Issues. November 1980. Machines May Never Efficiently Replace Man, But They May Have To. The Forest Industry’s Future. Maine Department of Conservation, Maine Forest Service.
• Woodflow in Maine as Reported to MFS for 1996 (Sawlogs, Pulpwood, Biomass Chips).
Listing of Harvesting Logging Contractors as Listed on Landowner Permit Applications, 1998-99.
Stumpage Reports, 1997 and (advance) 1998. • Wood Processing Reports, 1997 and (advance) 1998. Silvicultural Reports, 1997 and (advance) 1998. • Timber supply outlook for Maine 1995-2045. Augusta 1998. 39 pp.
Maine Department of Labor.
• Northeast Regional Woods Wage Survey. Early 1980s through 1998. 1998 Woods Wage Survey Instruments (Photocopies). Summary Statistics re: Domestic Hired Workers by Activity, Piece Rate/Wage, Other. History of Composite Average Hourly Wage, Wage Findings, and Wage Settings for
Selected Logging Activities: Annual Northeast Regional Woods Wage Survey 1982-1997.
ES-202 Covered Employment Statistics. Various years, through 4th quarter 1998. Occupational Employment Statistics (OES). Various years, through 1997. H-2 Logging Data, 1996-98. Maine Loggers: Fact Sheet. Bureau of Unemployment Compensation. Employee Vs. Contractor “ABC Test.” Employment Statistics by 2-Digit SIC Code for Select Townships in Northern Maine. Unemployment Rate for Select Townships in Northern Maine, 1990-1997. 1998 H-2a Bonded Labor Applications. 1998 Complaints Received Concerning Canadian Bonded Labor. Labor Market Information Services. Universe of Employers, SIC Code 2411 and Other
Employers Known to be Engaged in Timber Harvesting. August 1998. Fora on Northern Maine Logging Issues. Bangor and Caribou Proceeding Notes.
February-April 1999. H-2 Bond Cutting Locations Map, 1998-99 Season. Survey of Prevailing Practices by Apple Growers.
Maine Employment Security Commission. Wages In Logging In Maine And Other Northeastern States. October & December 1965. Mechanized Logging Equipment Brochures and Videos. Meeting On Maine Woods Certification Program Scheduled For August 31, 1977. Issues Likely To Be Raised. Maine Woodsmen Association. August 1977. New Brunswick Community Colleges.
• Curriculum Plan: Vocational Forest Worker. April 1995.

Pan Atlantic Consultants/The Irland Group November 18, 1999
Page: 251
Curriculum Plan: Professional Forest Worker Certification: Mechanized Forest Operations. September 1997.
Northeast Forest Alliance. The Economic Importance of Maine’s Forest. Appr. 1992. Northeast Regional Logger Training and Education Council. Supporting the Primary Practitioner of the Forest. November 1998. State of Maine Workers’ Compensation Act of 1992. State of Maine Workers’ Compensation Board. Application for predetermination of independent
contractor status to establish conclusive presumption. State of Maine Workers’ Compensation Board. Report of the Workers’ Compensation Board
regarding workers’ compensation laws pertaining to the wood harvesting industry. January 14, 1999.
University of Maine at Orono, School of Forest Resources. An Investigation into Ownership and Usage Costs for Chain Saws and Conventional Skidders Under Maine Conditions. February 1978 (Draft Report) and March 1978 (Final Report). US Department of Commerce, US Census Bureau.
• Maine County Populations, 1980-1998. Number of Residents: Total Maine Versus Forested Counties (1980-1998). Maine State and County Business Patterns, 1992-1996.
US Department of Commerce. US Industry and Trade Outlook 1998: Wood Products. US Department of Labor.
• CPI for All Urban Consumers (US City Average). January 1981-February 1999. CPI for Urban Wage Earners & Clerical Workers (US City Average). January 1981-
February 1999. CPI for All Urban Consumers (Northeast Regional Average). February 1981-February
1999. CPI for Urban Wage Earners & Clerical Workers (Northeast Regional Average). January
1981-February 1999. CPI for All Urban Consumers (Boston-Brockton-Nashua). January 1981-February 1999. CPI for Urban Wage Earners & Clerical Workers (Boston-Brockton-Nashua). January
1981-February 1999. Dictionary of Occupational Titles: Logging & Related Occupations. 1998. ETA Handbook No. 385, pages I-95 – I-170, “Services to Agricultural Applicants and
Employers.” August 1981. • ETA Handbook No. 398, “H-2A Program Handbook.” January 1988. US Department of the Treasury, Internal Revenue Service. Common-Law Factors Employee Vs. Contractor Checklist. Current edition. US Department Of Labor Office Of Administrative Law Judges Washington DC. In The Matter

Pan Atlantic Consultants/The Irland Group November 18, 1999
Page: 252
Of Pelletier & Pelletier, Inc., et al., Employers. Case No. 79-ESA-1. Posthearing Brief Of The US Department Of Labor. July 1979 US Employment Service. Division Of Labor Certification. Northeast Woods Foreign Worker Certification Program. August 1977. US Employment Service. Division Of Labor Certification. Maine Logging Labor Situation. January 1978. US Employment Service. Division Of Labor Certification. Report Of Logging Equipment Survey Findings. April 1978. Woods. Questions and Answers. March 1979.

Pan Atlantic Consultants/The Irland Group November 18, 1999
Page: 253
Directories. • Directory of Certified Logging Professionals. 1998 Edition. Maine Logging Companies Using H-2 Bonded Labor. 1998.
ES-202 Listing, 4th
quarter 1997 through 3rd
quarter 1998. InfoUSA, Inc. Employer Database/Prospect List: Maine Logging Companies. 1999. Maine Forest Service Listing of Logging Contractors Harvesting Landowner Forests,
1998-99 (from Harvest Permit Applications by Landowners).

Pan Atlantic Consultants/The Irland Group November 18, 1999
Page: 254
STRATEGIC INTERVIEWS
During the course of this study, PAC/IRG completed “strategic interviews” with the following list of individuals. As a component of the study, strategic interviews were designed to complement the views expressed by logging contractors and workers in their respective surveys by representing the opinions of other key Maine Woods constituencies, such as landowners and regulators. Some strategic interview contacts, particularly landowners, were interviewed based on personal contacts and declined to be identified in the study.
• John Cashwell (Seven Islands) -- Landowner Mike Dann & Other Foresters (Seven Islands) -- Landowner Bill Sylvester (International Paper) -- Landowner Gaetan Pelletier (Irving) -- Landowner (New Brunswick) Fred Morton (Farm Credit Bank of Maine) -- Equipment Financing Vonda Krukowski -- H-2 Agent & Owner, Stony Brook Logging Michael St. Peter -- CLP Administrator and H-2 Agent Tim Gammell (American Pulpwood Association) -- (Outgoing) Regional Director
• Dick Schneider (Professional Logging Contractors of Maine) -- Former Director Peter Lammert (Maine Department of Conservation) -- Utilization & Marketing Forester
• Peter Beringer (Maine Department of Conservation) -- Maine Forest Service Janas Laster & John Rohde (Maine Workers Compensation Board) – WC Enforcement Valerie Reuillard (Quebec Forest Industries Association) -- Researcher Jacques Allen (Human Resources Development Canada) -- Researcher (Quebec) Jacques Gosselin (DeLoupe, Inc.) – Equipment Manufacturer (Trailers) Hilton Hafford -- Logger/Activist (Northern Maine) Other Individual Loggers Throughout Maine MDOL Contacts -- Craig Holland, Bob Kelley, Vaughn Leblanc, and Others 2 Skowhegan Pooled Interviews (April and May 1999) and NELMA Expo ’99 Northern Maine Logging Industry Subcommittee Meetings, April – July 1999