Main Insight Event 2016 · PDF fileVP Product Marketing 16.10-16.30 Coffee break ... Bosch...
140
Main Insight Event 2016 “Driving Successful Sales In Software Companies: From Theory to Practice’’ Sales strategy, sales operations, sales improvement tools and practical case example. Paleisstraat 6, 2514JA, Den Haag Tel: +31 (0)70 324 3433 www.main.nl
Transcript of Main Insight Event 2016 · PDF fileVP Product Marketing 16.10-16.30 Coffee break ... Bosch...

Main Insight Event 2016
“Driving Successful Sales In Software Companies: From Theory to Practice’’
Sales strategy, sales operations, sales improvement tools and practical case example.
Paleisstraat 6, 2514JA, Den Haag
Tel: +31 (0)70 324 3433
www.main.nl
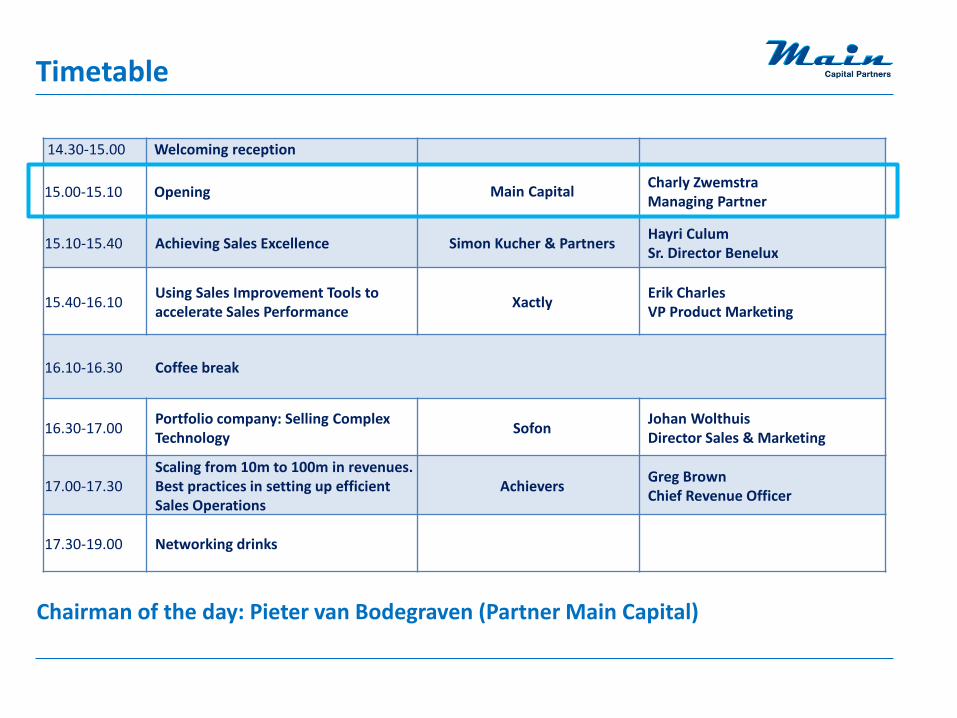
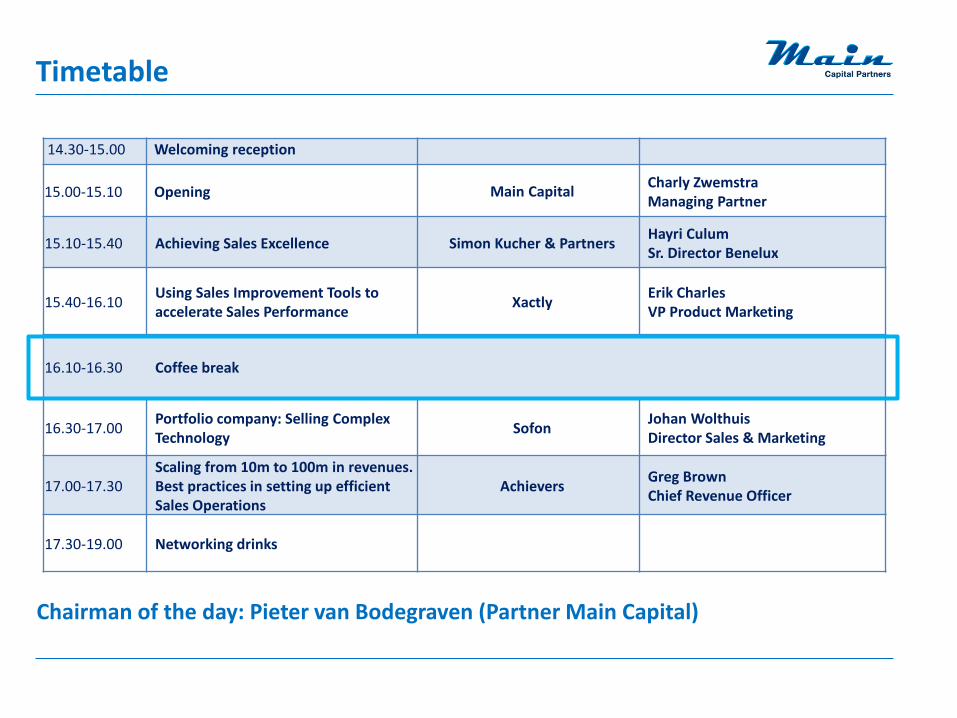
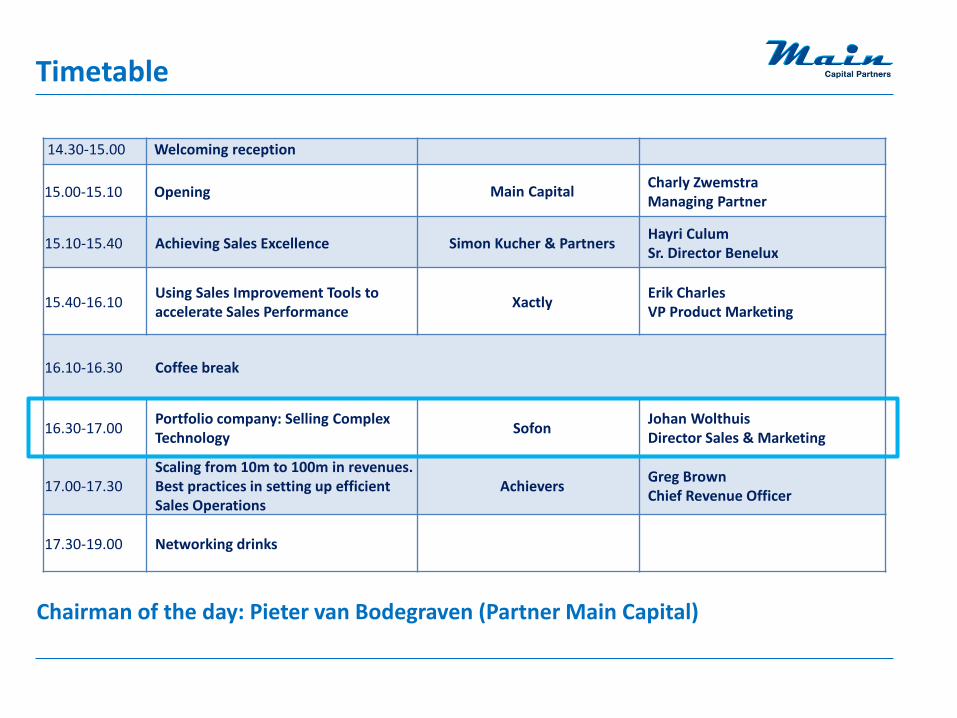
Timetable
Chairman of the day: Pieter van Bodegraven (Partner Main Capital)
14.30-15.00 Welcoming reception
15.00-15.10 Opening Main CapitalCharly Zwemstra Managing Partner
15.10-15.40 Achieving Sales Excellence Simon Kucher & PartnersHayri Culum Sr. Director Benelux
15.40-16.10Using Sales Improvement Tools to accelerate Sales Performance
XactlyErik Charles VP Product Marketing
16.10-16.30 Coffee break
16.30-17.00Portfolio company: Selling Complex Technology
SofonJohan Wolthuis Director Sales & Marketing
17.00-17.30Scaling from 10m to 100m in revenues. Best practices in setting up efficient Sales Operations
AchieversGreg Brown Chief Revenue Officer
17.30-19.00 Networking drinks

Annual industry seminar on key industry topics:
Why Main Insight Event?
Partnerships (2014)
Marketing Automation (2015)
Sales Effectiveness (2016)
Internationalization (2011)
Delivery Models (2012)
Technology (2013)
Transfer of knowledge, network & capital

Main Capital Partners: Business Units
Founded in 2003 EUR 150 million under management
Offices The Hague and Dusseldorf
12 investment professionals
Private Equity Mezzanine finance Debt and M&A advisory
17 portfolio companies in Benelux & Germany.
Investment mode of Main Capital IV
Founded in 2014
Based in Amsterdam
6 investment professionals
Investments of around € 50 million in 10 - 15 loans in the next 2,5 years
5 Mezzanine loans provided thus far
Founded in 1997
Advises and supports management teams and entrepreneurs of SME’s
M&A, arrangement of debt/ equity, and management buy-outs

Added Value Main Capital
Growth Capital and Management Buy-outs
Focus on recurring SaaS based business models and share experience
transformation
Improve reporting & governance structure
Buy & Build strategies: Proprietary and high-quality add-on leads
Events: Main software 50, Main CTO event and Main Insight event
Large network of relations CustomersPartners
Strategic/Financial buyers
Market research and knowledge
Entry
EUR 3m - 20m revenue
Profitable
Strong management team
Strong competitive market position in growth segment
Smaller local players interested
Exit
EUR 20 - 50m revenue, also through add-ons
EBITDA margin >25%
Growth recurring revenue level
Internationalized
Improved operating processes
International strategic and financial players interested
Internationalization and partnership strategies
Bringing companies to a higher league

Main Capital Portfolio
Current portfolio companies
Former portfolio companies

Highlights since Last Main Insight Event 2015
6 new hires in PE and Mezzanine team
Main Capital Partners OrganizationStrategy and deal making activities
4 New Investments Roxit Group Ymor b+m Informatik (DE) Denit
2 Add-on Acquisitions
2 Exits
Mutual agreements on substantial International SaaS investments in June
Great proprietary dealflow in DACH and Benelux
Vision Waves to IFS Zetacom to Gilde Healthcare
Green Valley for Roxit Group Daarwin (DE) for Regas
German team in place;August 1st the office in Düsseldorf will be
operational
Launch of Main Capital V in 2017
Establish U.S. presence in 2017/2018 to support our European portfolio
companies to create access to partners and know-how for U.S. market
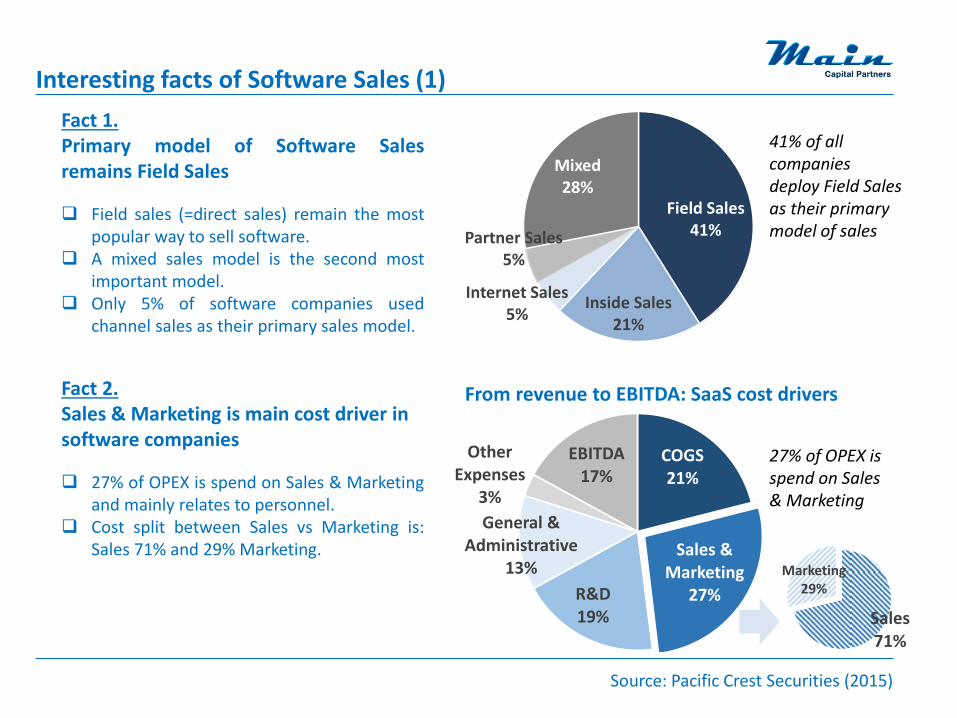
Interesting facts of Software Sales (1)
Field Sales 41%
Inside Sales21%
Internet Sales5%
Partner Sales 5%
Mixed 28%
Primary Mode of Distribution
Source: Pacific Crest Securities (2015)
41% of all companies deploy Field Sales as their primary model of sales
Fact 1.Primary model of Software Salesremains Field Sales
Field sales (=direct sales) remain the mostpopular way to sell software.
A mixed sales model is the second mostimportant model.
Only 5% of software companies usedchannel sales as their primary sales model.
Fact 2.Sales & Marketing is main cost driver in software companies
27% of OPEX is spend on Sales & Marketingand mainly relates to personnel.
Cost split between Sales vs Marketing is:Sales 71% and 29% Marketing.
From revenue to EBITDA: SaaS cost drivers
27% of OPEX is spend on Sales & Marketing
Sales71%
Marketing29%
COGS21%
Sales & Marketing
27%R&D 19%
General & Administrative
13%
Other Expenses
3%
EBITDA 17%
Total Cost Structure

Interesting facts of Software Sales (2)
Source: Pacific Crest Securities (2015)
Sales & Marketing
27%
Fact 3.Importance of Upselling for acceleratingrevenue growth
The larger the company, the higher thepercentage of New ACV* that comes fromUpsells
Largest companies realize >30% of new ACVfrom Upsells.
Also, fastest growing companies tend torely more on Upselling.
Fact 4.Large ACV deals have longer contract periods
Median ACV deal for all SaaS softwarecompanies is USD 21k.
Large ACV deals of 100K have contractperiods of 2-3 years and more, whichincreases the stability and valuation of thecompany significantly.
11%15% 14%
17%21%
16%
32%28%
0%
5%
10%
15%
20%
25%
30%
35%
% o
f N
e A
CV
fro
m U
pse
lls
Business Size (Revenue)
Median = 16%
*ACV = Annual Contracted Value
Fact 5 + Main Capital VisionIncreased emphasis on sales operations
KPI and data driven
Sales effectiveness tools

Timetable
Chairman of the day: Pieter van Bodegraven (Partner Main Capital)
14.30-15.00 Welcoming reception
15.00-15.10 Opening Main CapitalCharly Zwemstra Managing Partner
15.10-15.40 Achieving Sales Excellence Simon Kucher & PartnersHayri Culum Sr. Director Benelux
15.40-16.10Using Sales Improvement Tools to accelerate Sales Performance
XactlyErik Charles VP Product Marketing
16.10-16.30 Coffee break
16.30-17.00Portfolio company: Selling Complex Technology
SofonJohan Wolthuis Director Sales & Marketing
17.00-17.30Scaling from 10m to 100m in revenues. Best practices in setting up efficient Sales Operations
AchieversGreg Brown Chief Revenue Officer
17.30-19.00 Networking drinks

www.simon-kucher.com
How to profitably grow in SaaS?
Achieving Sales Excellence
Amsterdam, May 2016
Hayri Culum
Amsterdam office
Barbara Strozzilaan 380
1083 HN Amsterdam
The Netherlands
Tel. +31 20 75312 53

Source: Simon-Kucher & Partners
Simon-Kucher & Partners:
Worldwide marketing, pricing and sales experts
Strategy
> 400
Sales
> 500
Marketing
> 500
Pricing
> 1,000
Growth and competitive
strategies
Product portfolio
(re-)design
Pricing excellence
Customer value management
Sales channel and sales force
optimization
Global presence
Best consultancy in marketing and sales
>1,000 projects in the last 3 years
AmsterdamBarcelona
BonnBrusselsCologne
CopenhagenFrankfurtIstanbulLondon
Luxembourg
Madrid MilanMunichParisWarsawViennaZurich
TorontoBoston
New YorkSan Francisco
São Paulo
Santiago
Dubai
Beijing
Tokyo
Singapore
Sydney
31 offices worldwide, 900 employees
Atlanta
World leader in giving
advice to companies on how
to price their products
The pricing strategy
specialists
The world’s leading
pricing consultancy
The influence of
Simon-Kucher on the
prices we pay for just about
everything is staggering
BusinessWeek The Economist
William PoundstoneThe Wall Street Journal
World leader in pricing
1 Simon-Kucher & Partners
2 Boston Consulting Group
3 McKinsey & Company
manager magazine
TopLine
Power®
Achieving Sales Excellence 12

Selected references from Simon-Kucher project experience; confidentiality agreements prevent us from naming many other major partners
We advise industry leaders from all sectors
Automotive Consumer & Retail
Alfa Romeo
Audi
BMW
Daimler
Fiat
Kia
Maserati
Michelin
Mercedes-
Benz
Porsche
Renault
Toyota
Volvo
VW
Adidas
Bol.com
Beiersdorf
Coca Cola
Ferrero
FrieslandCampina
Haribo
Henkel
MediaMarkt
Nestlé
Nikon
Office Depot
Pepsico
Warner Music
Company
Energy & Utilities Technology & Software
BP/Aral
Castrol
E.ON
Essent
EVN
Liquigas
Mainova
natGAS
Nordex
Orlen
RheinEnergie
RWE
Shell
Tank & Rast
Yello
Citrix
Fujitsu
Intel
Intuit
Kronos
Microsoft
Novell
Panasonic
Philips
RSA Security
SAP
Semikron
Sony Ericsson
TomTom
Financial Services Telecommunications & Media
Allianz
American Express
ANWB
AXA
Barclays
BNP Paribas
Citi
Credit Suisse
Deutsche Bank
GE Capital
Generali
HSBC
RBS
Virgin Money
Western Union
Betfair
Deutsche
Telekom
PayPal
KPN
Skype
Sanoma Media
T-Mobile
Vodafone
The Economist
Group
Wolters Kluwer
Xbox Live
Travel & Hospitality Manufacturing & Logistics
Accor
British Airways
Center Parcs
Europcar
Hilton
Lufthansa
Navigon
Thalys
Thomas Cook
Travelport
TUI
Virgn Holidays
Bosch
Caterpillar
De Post
DHL Express
Honeywell
La Poste
Osram
Parcelforce
Siemens
Swiss Post
Tetra Pak
TNT
Achieving Sales Excellence
13

Source: Simon-Kucher & Partners
We have deep experience in (SaaS) software
Vertical software
specialists
ERP/B2B
specialistsSMB focus
Select PE/VC relationships
PE / VC relationships
Achieving Sales Excellence 14
Establish and
enhance value
selling culture,
skills and tools
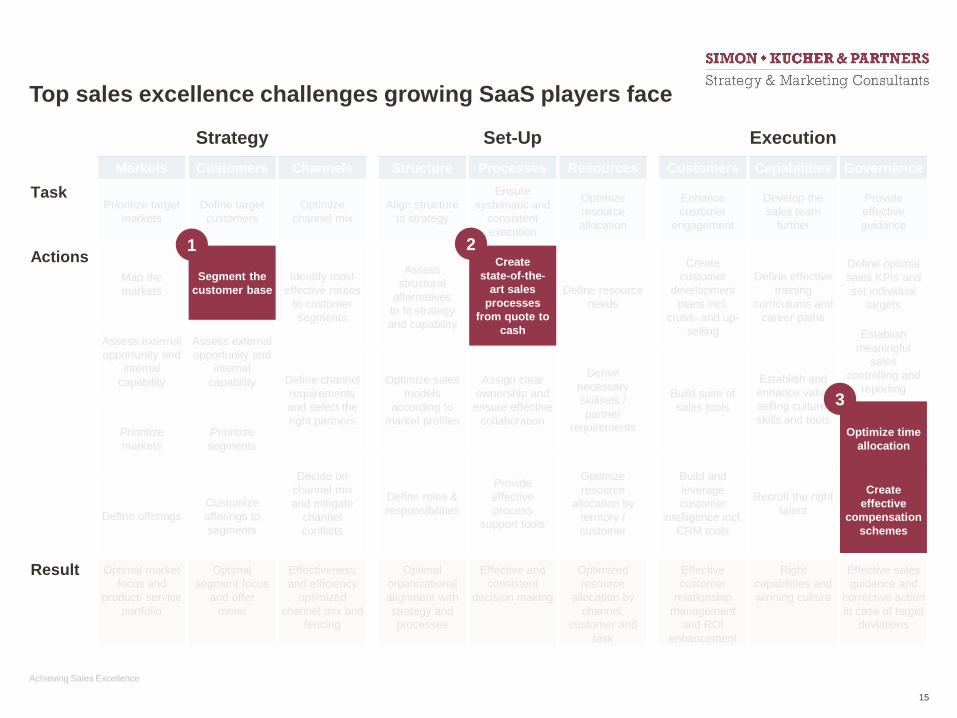
Top sales excellence challenges growing SaaS players face
Markets Customers Channels
Strategy
TaskPrioritize target
markets
Define target
customers
Optimize
channel mix
Structure Processes Resources
Set-Up
Align structure
to strategy
Ensure
systematic and
consistent
execution
Optimize
resource
allocation
Customers Capabilities Governance
Execution
Enhance
customer
engagement
Develop the
sales team
further
Provide
effective
guidance
Actions
Result Optimal market
focus and
product/ service
portfolio
Optimal
segment focus
and offer
menu
Effectiveness
and efficiency
optimized
channel mix and
fencing
Optimal
organizational
alignment with
strategy and
processes
Effective and
consistent
decision making
Optimized
resource
allocation by
channel,
customer and
task
Effective
customer
relationship
management
and ROI
enhancement
Right
capabilities and
winning culture
Effective sales
guidance and
corrective action
in case of target
deviations
Create
customer
development
plans incl.
cross- and up-
selling
Build suite of
sales tools
Build and
leverage
customer
intelligence incl.
CRM tools
Define effective
training
curriculums and
career paths
Recruit the right
talent
Define optimal
sales KPIs and
set individual
targets
Establish
meaningful
sales
controlling and
reporting
Assess
structural
alternatives
to fit strategy
and capability
Optimize sales
models
according to
market profiles
Define roles &
responsibilities
Create
state-of-the-
art sales
processes
from quote to
cash
Assign clear
ownership and
ensure effective
collaboration
Provide
effective
process
support tools
Define resource
needs
Derive
necessary
skillsets /
partner
requirements
Optimize
resource
allocation by
territory /
customer
Define channel
requirements
and select the
right partners
Decide on
channel mix
and mitigate
channel
conflicts
Segment the
customer base
Assess external
opportunity and
internal
capability
Prioritize
segments
Customize
offerings to
segments
Map the
markets
Assess external
opportunity and
internal
capability
Prioritize
markets
Define offerings
Identify most
effective routes
to customer
segments
Create
state-of-the-
art sales
processes
from quote to
cash
Segment the
customer base
1 2
Optimize time
allocation
3
Create
effective
compensation
schemes
Achieving Sales Excellence
15
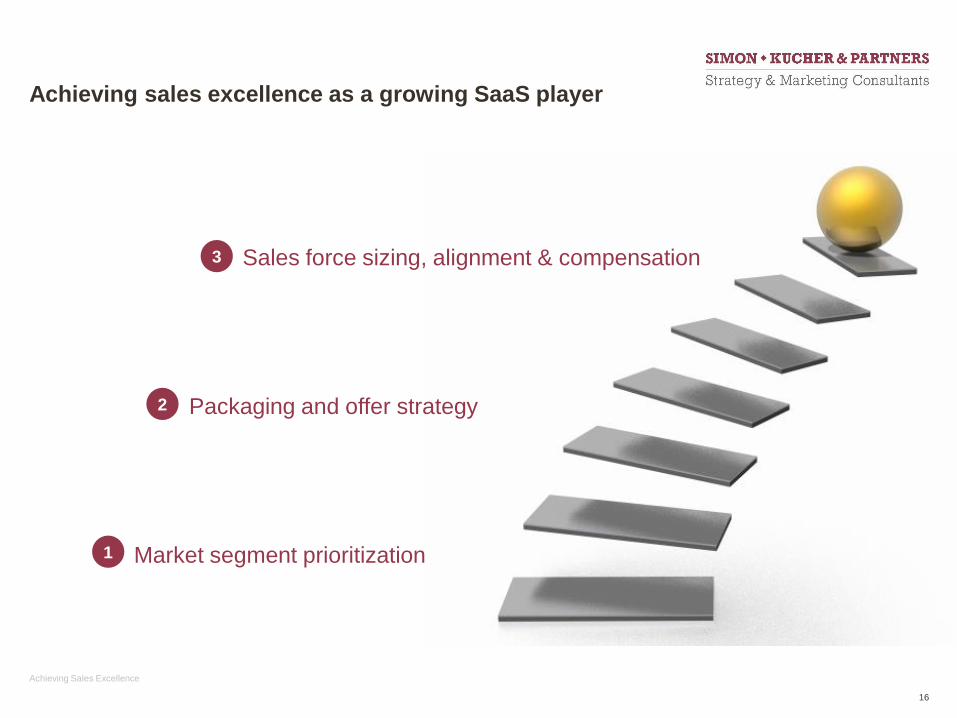
Achieving sales excellence as a growing SaaS player
Market segment prioritization
Packaging and offer strategy
Sales force sizing, alignment & compensation
1
2
3
Achieving Sales Excellence
16

Achieving sales excellence as a growing SaaS player
Market segment prioritization
Packaging and offer strategy
Sales force sizing, alignment & compensation
1
2
3
Achieving Sales Excellence
17

Source: Simon-Kucher & Partners
Create meaningful segments to provide a basis for a
differentiated portfolio, sales and pricing approach
Relative importance of attribute Size of customer segment
0%
5%
10%
15%
20%
25%
30%
35%
40%
Completenessof solution
Customerservice
Integration Datasecurity
Implementation speed
Uptime Price
Want price only
Want no risk
Want it now
Want the best
% of sales
23%
9%
39%
29%
Simon-Kucher
Software Example
1
Achieving Sales Excellence
18

Achieving sales excellence as a growing SaaS player
Market segment prioritization
Packaging and offer strategy
Sales force sizing, alignment & compensation
1
2
3
Achieving Sales Excellence
19

CIO add-on
Source: Simon-Kucher & Partners
Segment-specific packaging creates entry level
offers without sacrificing deal size
Buyer 1
Buyer 3
Buyer 2
Entry Packages Upsell Options
Package 1
Package 2
Enterprise
License
Package 3
Package 4
Package 5
+ Analytics
CIO add-on
Platform:
Basic
Module 1
Module …
Module n
Simon-Kucher
SaaS Example
2
Achieving Sales Excellence
20
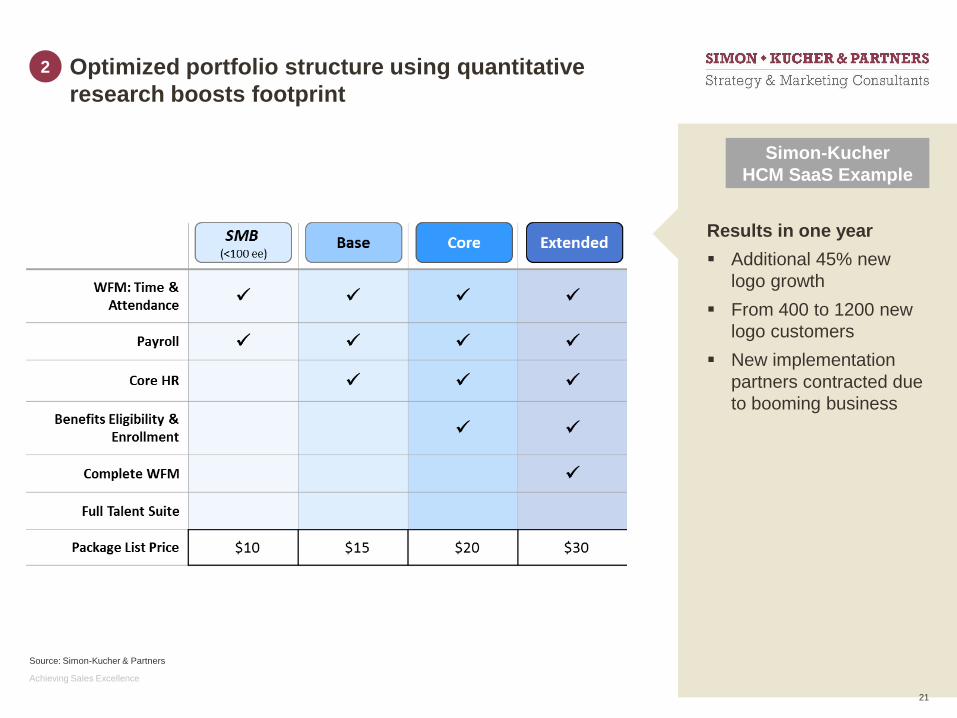
Optimized portfolio structure using quantitative
research boosts footprint
Source: Simon-Kucher & Partners
Simon-Kucher
HCM SaaS Example
Results in one year
Additional 45% new
logo growth
From 400 to 1200 new
logo customers
New implementation
partners contracted due
to booming business
2
Achieving Sales Excellence
21

11$ - 0.5$
Please create your favorite pizza!
Source: Levin et al. 2002; n (group1)=59; n (group2)=56; 12 toppings available
Use vote out instead of vote in
Group 1: vote in Group 2: vote out
2.71 5.29Ø number of
ingredients
For each removed
topping
Additional toppings
$6.35 $7.65Ø price
5$ + 0.5$
2
Achieving Sales Excellence
22

Achieving sales excellence as a growing SaaS player
Market segment prioritization
Packaging and offer strategy
Sales force sizing, alignment & compensation
1
2
3
Achieving Sales Excellence
23

Source: Simon-Kucher & Partners
Improve sales force excellence by optimizing sizing,
alignment & compensation
Sizing Structure Alignment Hiring
Skills &
training
Communication Compensation Attrition
Check if sales reps have
the right skills to achieve
sales objectives
Check if compensation
plan incites enthusiasm
and rewards sales rep
performance
Check if roles,
responsibilities and sales
goals are clearly
communicated to sales
reps
Check reasons for attrition,
and identify if high or low
achievement sales
representatives are leaving
and reasons for leaving
Check for potential
imbalances in terms of
opportunities and
workload between
territories
Check to see if sales
force is the right size to
achieve sales objectives
Check if sales force has
the right structure, roles
and responsibilities to
achieve sales objectives
Check if hiring is done with
sales objectives in mind
and a detailed career path
is in place
3
Achieving Sales Excellence
24
Source: Simon-Kucher & Partners
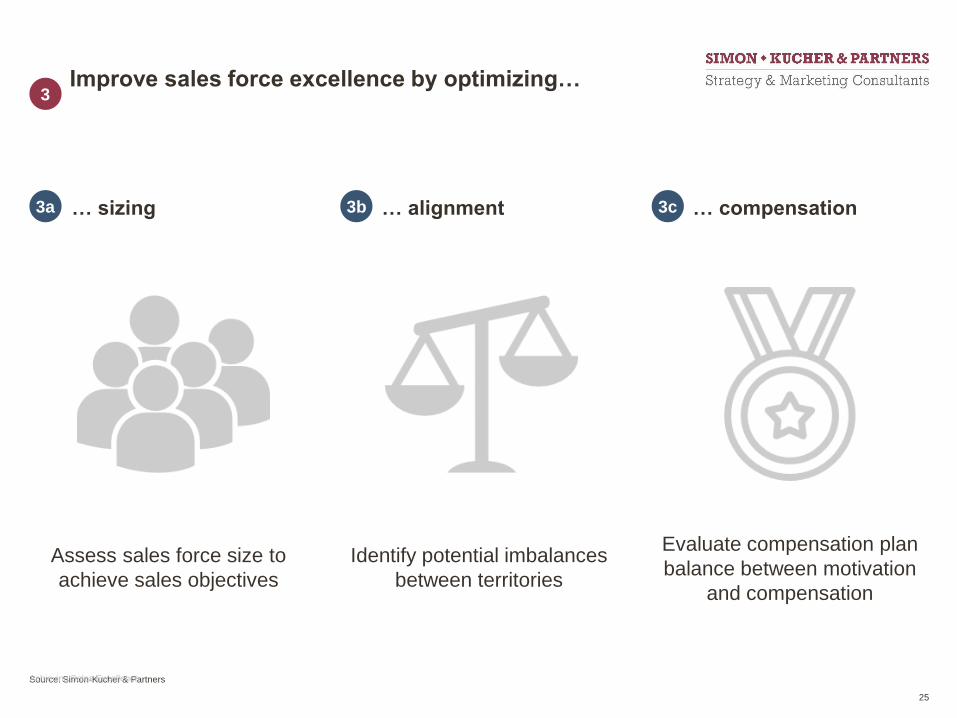
Improve sales force excellence by optimizing…
… alignment
Identify potential imbalances
between territories
… compensation
Evaluate compensation plan
balance between motivation
and compensation
… sizing
Assess sales force size to
achieve sales objectives
3
3a 3b 3c
Achieving Sales Excellence
25

Simon-Kucher sales force sizing methodology
Estimate ROI for additional sales
Assess time misallocations and
resulting time constraints
Estimate additional selling time
needed to close revenue gaps
A
C D
Assess perceived workload and
underlying reasonsB
3a
Source: Simon-Kucher & Partners
Achieving Sales Excellence
26

Output example: Many sales reps spend too
much time on non-selling activities
31%40%
57%
29%
30%
19%
40%30%
24%
0%
10%
20%
30%
40%
50%
60%
70%
80%
90%
100%
Generalists Specialists 1 Specialists 2
Direct selling Indirect selling Non-selling
Time allocation according to selling and non-selling activities per sales rep type
75% = Industry
benchmark
Project Example
3a
∼1.5 months
more than
industry
average per
year
Source: Simon-Kucher & Partners
Achieving Sales Excellence
27

Simon-Kucher sales force alignment methodology
Assess territories balance in terms of
sales potential and/or workload
Assess if territories are balanced in
terms of account prioritization groups
Identify suboptimal sales reps'
locations in territories
A
C D
Compare current alignment with
optimal alignment B
3b
Source: Simon-Kucher & Partners
Achieving Sales Excellence
28

Solution example: By adding 6 new territories a
more balanced opportunity distribution is created
Current alignment (50 territories) New alignment (56 territories)
Accounts
Opportunity
Mapping
# accounts per territory:
Avg.Min. Max.
60 106 198
Range of total aggregated account
opportunity per territory:
Min:
0.69x
Max:
1.41xAvg. opp.
# accounts per territory:
Avg.Min. Max.
75 95 127
Range of total aggregated account
opportunity per territory:
Min:
0.94x
Max:
1.15xAvg. opp.
Project Example
3b
Source: Simon-Kucher & Partners
Achieving Sales Excellence
29

Simon-Kucher sales force compensation
assessment methodology
Assess compensation mix and levels
compared to best practices
Understand if reps feel motivated
towards superior performance
Identify current incentives paid for
performance vs. paid for market potential
A
C D
Understand distribution and range of
commission pay-outsB
3c
Source: Simon-Kucher & Partners
Achieving Sales Excellence
30

Depending on where a company is in the business lifecycle, different sales force considerations apply.
Start-up Decay
Sustaining
Decline
Growth
slow downGrowing
Sales force size:
Revenue
Years
Medium
territories
Large
territories
Sales force downsizingSales force upsizing
Small
territories
Quota based
commission
Commissions
paid from $1
No incentive,
part of base salary
Large
territories
Medium
territories
Single product
responsibilityMultiple product responsibility
Territory alignment:
Incentive scheme:
Product deployment:
Quota w accelerators/
decelerators
Conceptual
Sales force optimization should go hand in hand with
changes in the business lifecycle
3
Source: Simon-Kucher & Partners
Achieving Sales Excellence
31

Achieving sales excellence as a growing SaaS player
Market segment prioritization
Packaging and offer strategy
Sales force sizing, alignment & compensation
1
2
3
Achieving Sales Excellence
32
What makes a sales excellence
project a success?
Source: Simon-Kucher & Partners
OK – Let’s wrap up with a few final tips and tricks
Achieving Sales Excellence
33

Source: Simon-Kucher & Partners
Key ingredients for a successful Sales Excellence
project
Overview
Develop a practical and ‘down to earth’ playbook
as a basis for capability development
Make it tangible and provide a playbook with practical
tools, solutions and best practices to work on daily sales
capability improvements
Co-create with sales champions
Select sales champions, to ensure we leverage the best
practices and ensure buy-in
Ensure early success stories: deliver quick wins
We need to work on early successes as a vehicle to
propagate the sales improvement
A
B
C
Achieving Sales Excellence
34
Source: Simon-Kucher & Partners
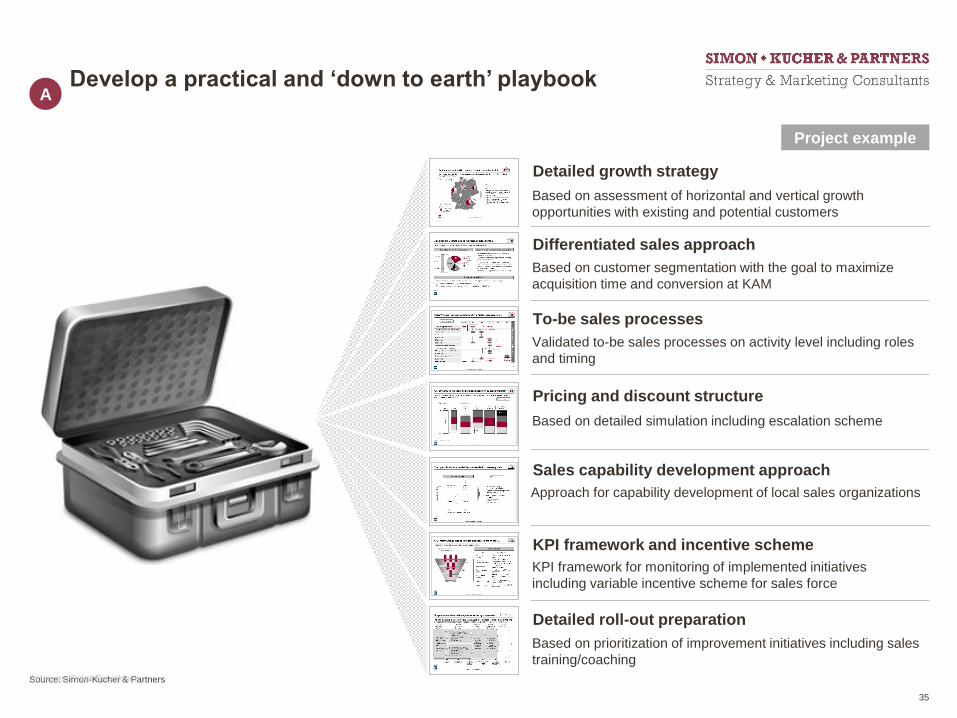
Develop a practical and ‘down to earth’ playbook
Project example
A
Detailed growth strategy
Pricing and discount structure
Differentiated sales approach
To-be sales processes
Sales capability development approach
KPI framework and incentive scheme
Detailed roll-out preparation
Based on assessment of horizontal and vertical growth
opportunities with existing and potential customers
Based on detailed simulation including escalation scheme
Based on customer segmentation with the goal to maximize
acquisition time and conversion at KAM
Validated to-be sales processes on activity level including roles
and timing
Approach for capability development of local sales organizations
KPI framework for monitoring of implemented initiatives
including variable incentive scheme for sales force
Based on prioritization of improvement initiatives including sales
training/coaching
Achieving Sales Excellence
35

Source: Simon-Kucher & Partners
Co-create with sales champions
Sales champions selection Advantages of selecting sales champions
The best practices are taken as a
basis for overall capability
development
The best practices are developed in
cooperation with the best performers
Buy-in from the organization is
eased in the process of spreading
out the resulting solutions
+
+
"WORKHORSES" "CHAMPIONS"
"SURPLUS" "TOUGH NUTS"
Have a key role in
the implementation
phase
Continue to
convince
Involved only if
necessary
Involved in the
operational
aspects of the
implementation
Leadership potential-
-
B
Achieving Sales Excellence
36

Source: Simon-Kucher & Partners
Ensure early success stories
Possible quick-win
Tool to systematically
align gut-feel
The Simon-Kucher Sales Excellence universe will be brought to the table, to benchmark
client’s performance and provide ready-to-use input for quick results
Possible quick-win
Short term sales process
improvements
Possible quick-win
Identification of white spots
for growth
Revenue growth Process improvementPricing optimization
C
Achieving Sales Excellence
37

Our most common project approaches
Determine differences in customer behaviors & key drivers of willingness-to-pay
Classify distinct and actionable segments
Design packaging, pricing, & messaging to align w/ segments
Drive conversion & upsell:
Facilitate product & needs discovery
Ease product selection
Create call to action
Utilize consumer psychology
Create structured discounting process, checks & balances
Improve value selling and negotiation skills
Design effective incentives & controls
Provide value-selling tools
Evaluate competitive positioning,
identify white spaces
Prioritize target markets &
channels
Develop new offerings
Customer Segmentation
Evaluate alternative pricing models
Identify optimal price metrics and contract structures
Test & measure acceptance of new models
Monetization / Price Model
Strategy
Online Sales Dialog
Maximize customer lifetime value
with packaging & pricing by…
Driving customer acquisition
Exploiting differences in customer needs & value
Encouraging up-sell & cross-sell
Packaging Strategy
Sales Force Effectiveness Growth Strategy
Apply learnings from >1,000 studies where multiple research methods were used to triangulate willingness-to-pay
Adapt proven structured interview and survey techniques, including tradeoff / conjoint methods
Price level optimization
(Subs, License, …)
Use systematic process to
identify opportunities to drive
profit, revenue, and sub. growth
Quantify and prioritize business
cases
Align on roadmap for tactical
implementation & value capture
Opportunity
Assessment & Roadmap
Source: Simon-Kucher & PartnersAchieving Sales Excellence
38

Source: Simon-Kucher & Partners
Any questions?
Achieving Sales Excellence
39

Timetable
Chairman of the day: Pieter van Bodegraven (Partner Main Capital)
14.30-15.00 Welcoming reception
15.00-15.10 Opening Main CapitalCharly Zwemstra Managing Partner
15.10-15.40 Achieving Sales Excellence Simon Kucher & PartnersHayri Culum Sr. Director Benelux
15.40-16.10Using Sales Improvement Tools to accelerate Sales Performance
XactlyErik Charles VP Product Marketing
16.10-16.30 Coffee break
16.30-17.00Portfolio company: Selling Complex Technology
SofonJohan Wolthuis Director Sales & Marketing
17.00-17.30Scaling from 10m to 100m in revenues. Best practices in setting up efficient Sales Operations
AchieversGreg Brown Chief Revenue Officer
17.30-19.00 Networking drinks


©2015 Xactly Corporation. All rights reserved. 42
©2016 Xactly Corporation. All rights reserved.
Leading provider of cloud-based incentive compensation
solutions for employee and sales performance management
Company founded in 2005
More than 870 customers worldwide
More than 450 employees
Locations in San Jose, Denver, Washington D.C., UK, and
India
Recognized as a leader in Sales Performance Management by
Gartner for 3 years running
Company Overview
* As of 1/31/15


44
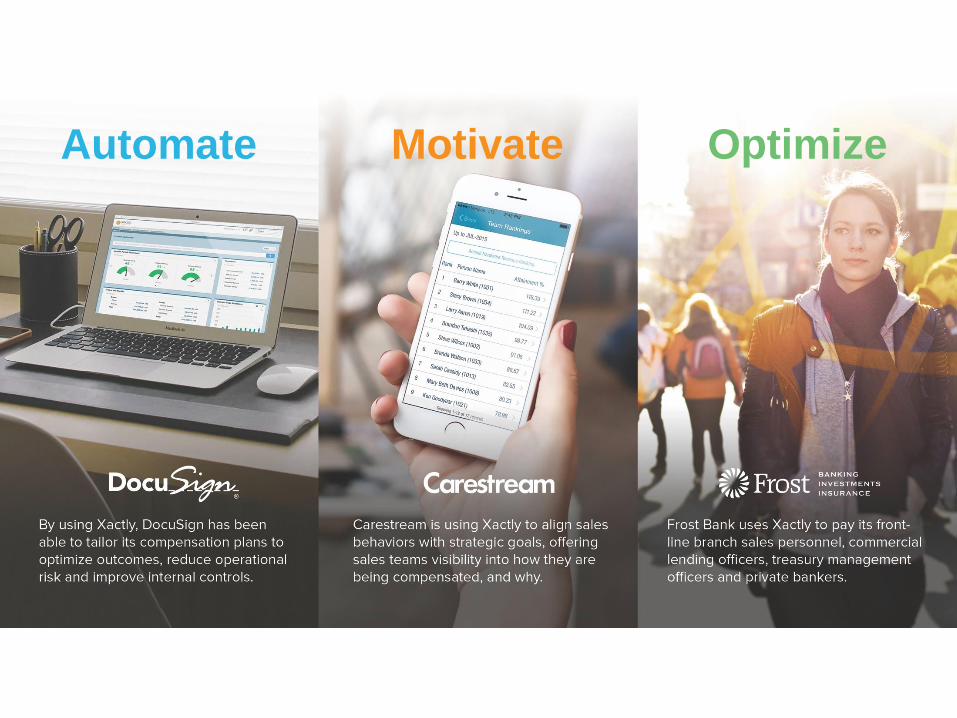
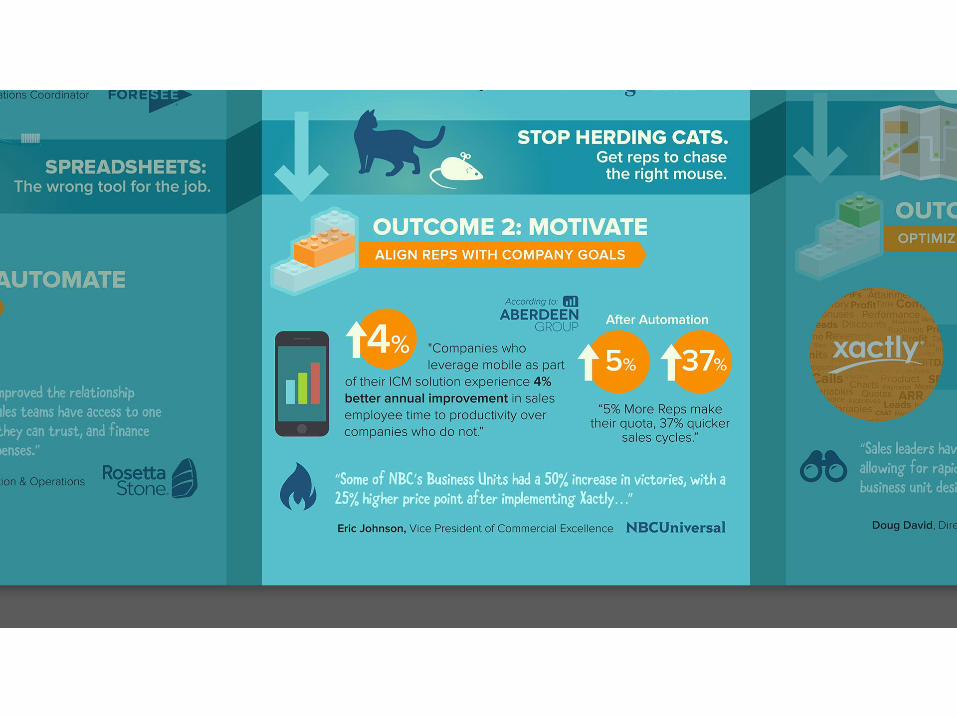
Automate Motivate Optimize
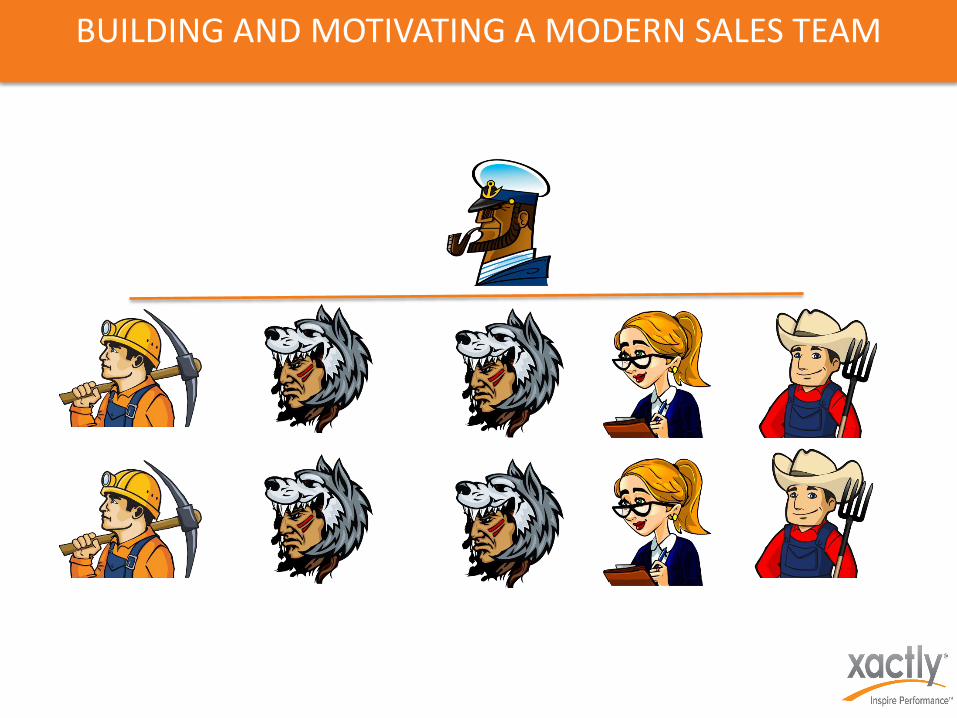
BUILDING AND MOTIVATING A MODERN SALES TEAM
© 2016 Xactly. All rights reserved. Proprietary and Confidential.

Xactly Insights™: Unique and Growing Empirical Data Set
11 Yearsof Data from a
Cross Section of
Industries
Anonymized
and
Aggregated
2 BillionTransactions
per Month
$16 Billionin Incentive
Payments in the
Last Two Years
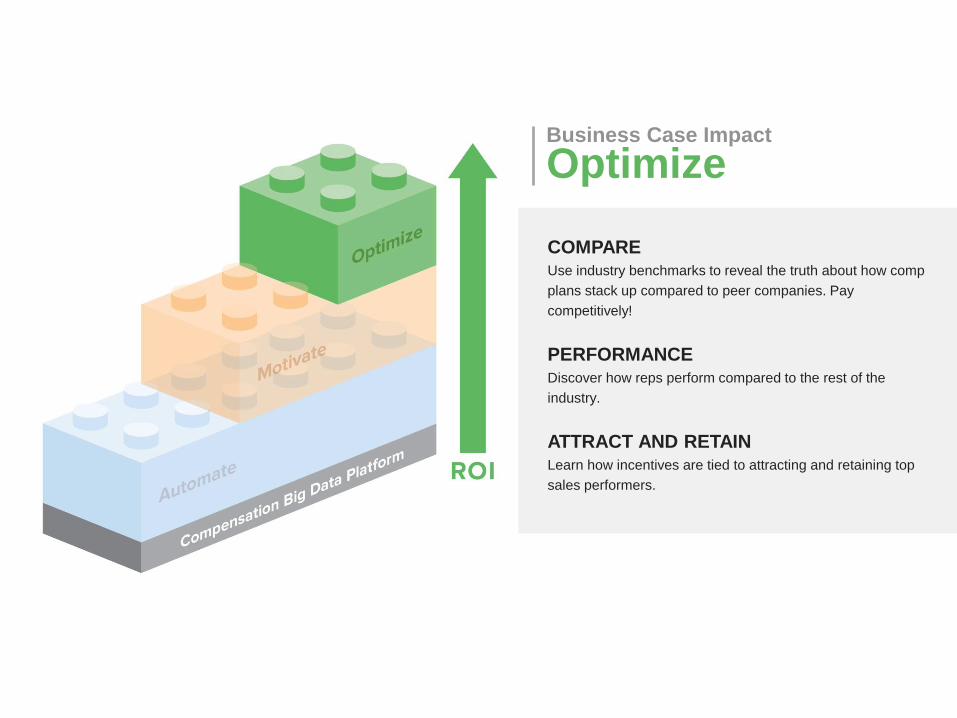
Business Case Impact
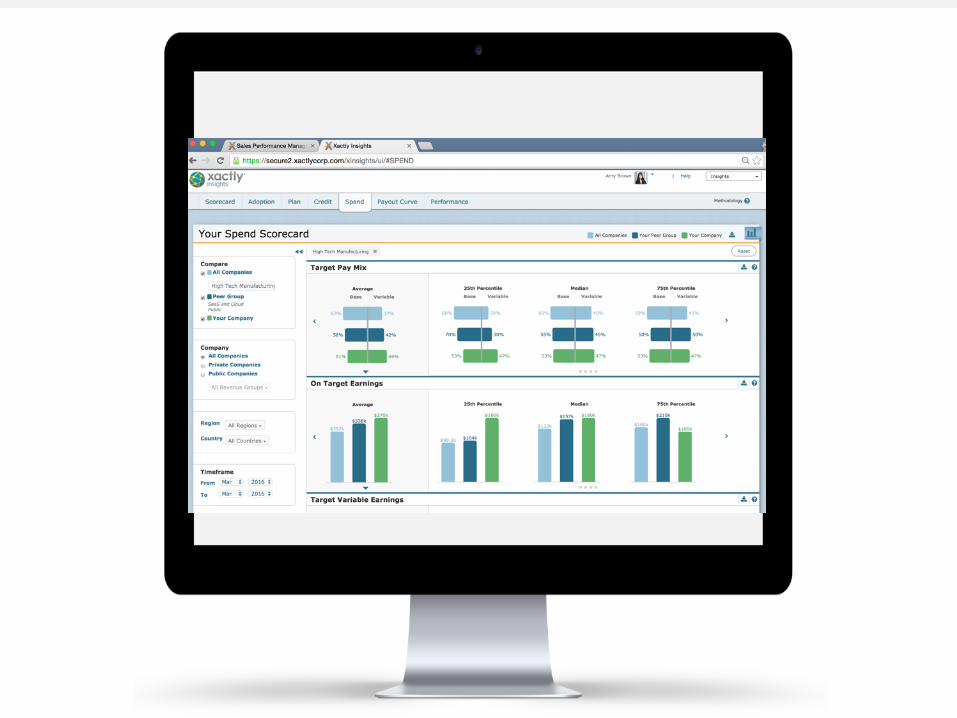
Optimize
COMPAREUse industry benchmarks to reveal the truth about how comp
plans stack up compared to peer companies. Pay
competitively!
PERFORMANCEDiscover how reps perform compared to the rest of the
industry.
ATTRACT AND RETAINLearn how incentives are tied to attracting and retaining top
sales performers.


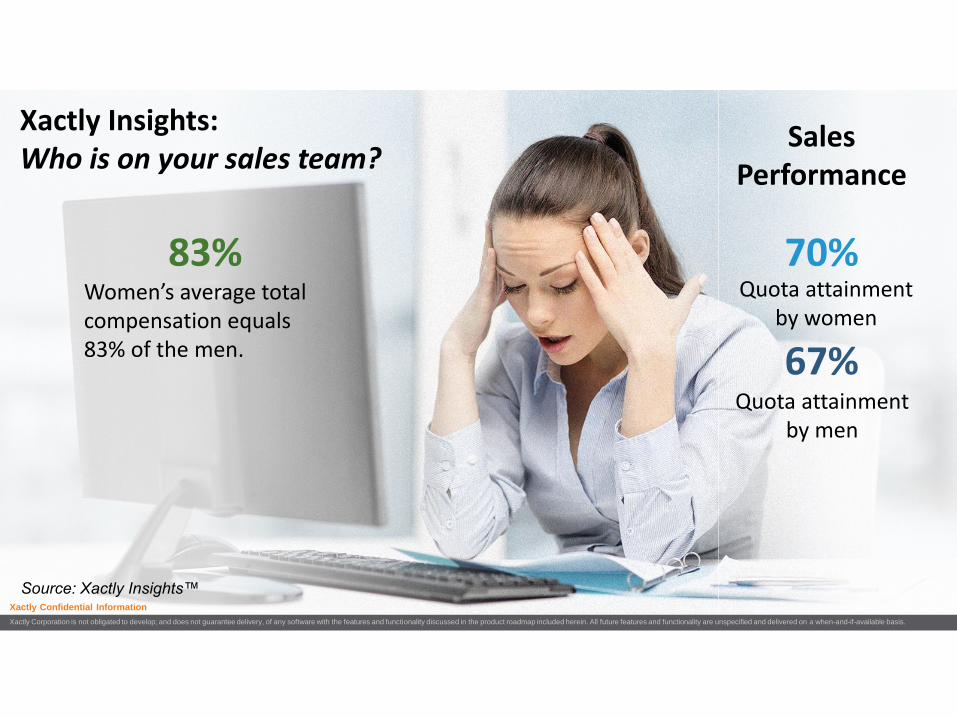
Xactly Insights: Who is on your sales team?
Women’s average total compensation equals 83% of the men.
83%
Sales Performance
Quota attainment by women
Quota attainment by men
67%
70%
Source: Xactly Insights™Xactly Confidential Information
Xactly Corporation is not obligated to develop; and does not guarantee delivery, of any software with the features and functionality discussed in the product roadmap included herein. All future features and functionality are unspecified and delivered on a when-and-if-available basis.


Business Case Impact
Automate
MITIGATE ERRORSSignificantly reduce costly errors associated with
manual processes.
REDUCE ADMINAlleviate pressure on resource constrained
compensation team and allow them to be more
strategic.
REDUCE RISKEnable traceability, audit, forecast, accruals and single
source of truth for data.
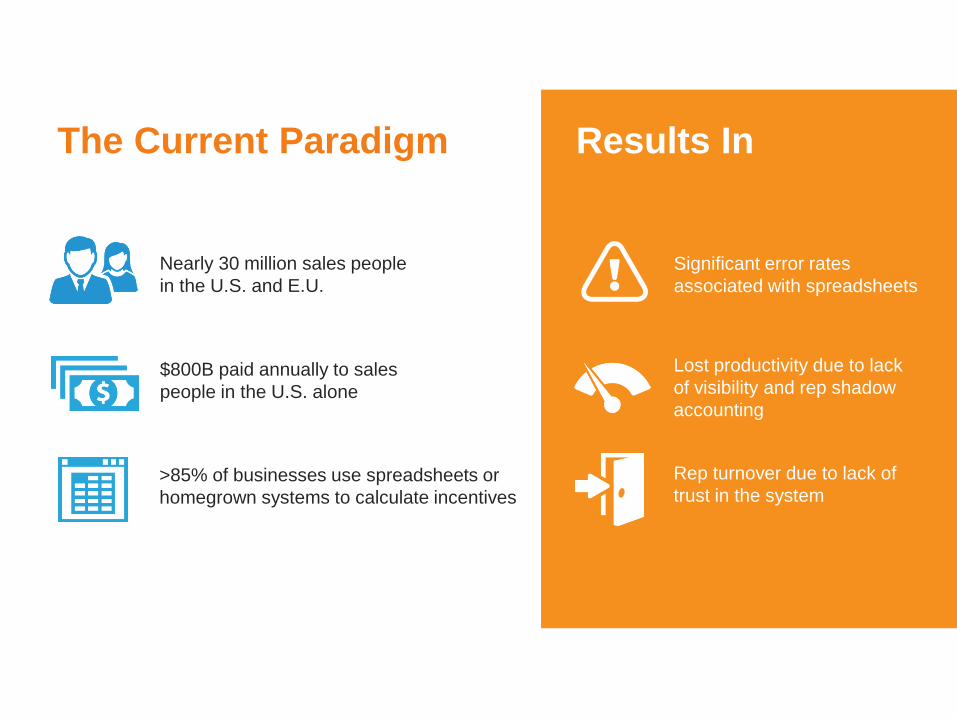
>85% of businesses use spreadsheets or
homegrown systems to calculate incentives
$800B paid annually to sales
people in the U.S. alone
Significant error rates
associated with spreadsheets
Nearly 30 million sales people
in the U.S. and E.U.
The Current Paradigm Results In
Lost productivity due to lack
of visibility and rep shadow
accounting
Rep turnover due to lack of
trust in the system


Business Case Impact
Motivate
MOBILEKeep reps engaged with their incentives in real-time.
ALIGNMENTEnsure your incentives align with your business goals
and improve rep quota attainment.
REDUCE SHADOW ACCOUNTINGBy eliminating reps’ mistrust in their commissions
system, they can spend more time selling.


Gallup: State of the Global Workplace Report (Worldwide)
Engaged
Not Engaged
Actively Disengaged
63%
13%
24%
Gallup Global Survey of the Workplace Employee Engagement is at risk!

© 2016 Xactly. All rights reserved. Proprietary and Confidential.
Locke et al:
Incentives drove a 30% productivity increase
Stajkovic & Luthans:
Incentives drove a 17% performance increase
Condly et al:
Incentives drove a 22% gain in performance
(average of 64 studies)
MOTIVATION: INCENTIVES WORK

VARIABLE PAY AS A % OF SALARY IN THE EU
63% 5% 10% 15% 20% 25% 30% 35% 40% 45% 50% 55%
Industry and services
Mining and quarrying
Manufacturing
Electricity, gas and water supply
Construction
Wholesale and retail trade; Repair Services
Hotels and restaurants
Transport, storage and communication
Financial intermediation
Real estate, renting and business activities

SAAS AND SOFTWARE: HOW MUCH PAY IS AT RISK
53% 50% 52% 50%
47% 50% 48% 50%
Saas (SMB) SaaS (LE) Software (SMB) Software (LE)
Base Salary Target Variable

Provide feedback& guidance
Contests& gamification
Show them wherethey stand
MOTIVATING PERFORMANCE

GETTING STARTED ON BUILDING A COMP PLAN
Compared to our peers:
Do we attract and retain top sales talent?
Do we pay competitively?
Does our pay align with business goals?
How much do we spend to attain quota?
What percentage of our reps make quota?
Do our reps respond to SPIFs and bonuses?
Do our reps perform better or worse?
“By 2017, 15% of
organizations will use
crowdsourced benchmarks
to design their incentive
compensation plans.”
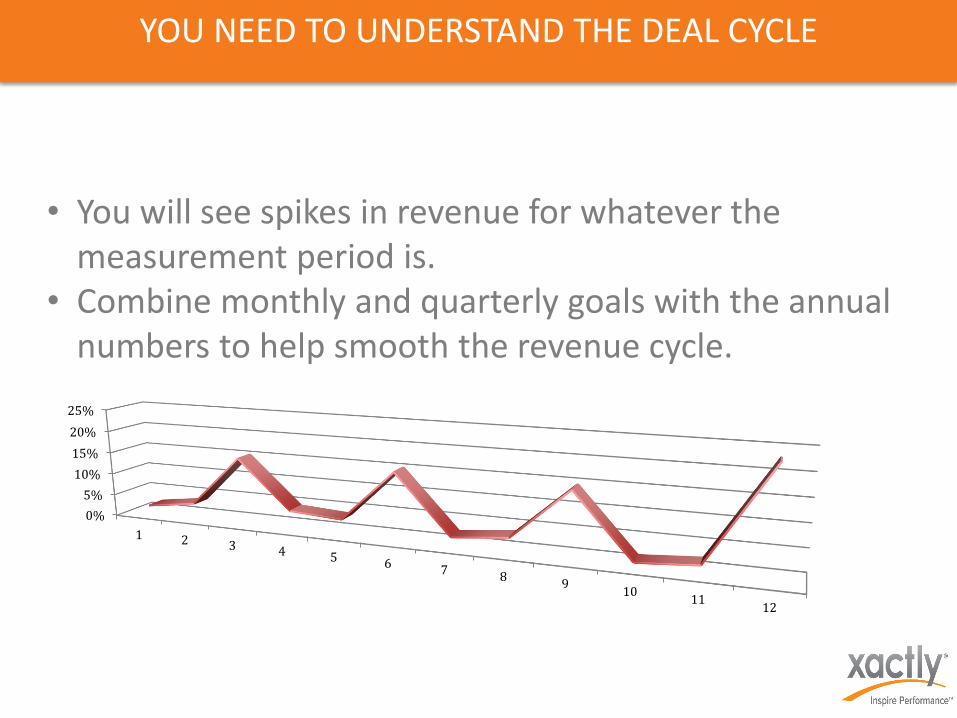
YOU NEED TO UNDERSTAND THE DEAL CYCLE
• You will see spikes in revenue for whatever the measurement period is.
• Combine monthly and quarterly goals with the annual numbers to help smooth the revenue cycle.
0%
5%
10%
15%
20%
25%
1 2 3 4 5 6 78
910
1112

RE-THINK YOUR QUOTA ATTAINMENT GOALS
65%74%
62%72%
Saas (SMB) Saas (LE) Software (SMB) Software (LE)

COSTS MONEYO v e r - C o m p l i c a t i n g
1
2
3
4
5Quota Attainment vs Measures on a plan

Team Credit ing 25% pay 20 or more
VP NA
Area Director
West
Regional
Manager West
Area DirectorEast
Regional Manager East
Acct Manager
1
Acct Manager
2
Acct Manager
3
Acct Manager
4
VP SC’s
Director
SC West
SC Manager
West
Director
SC East
SC Manager
East
SC 1 SC 2 SC 3 SC 4
COSTS MONEYO V E R C R E D I T I N G
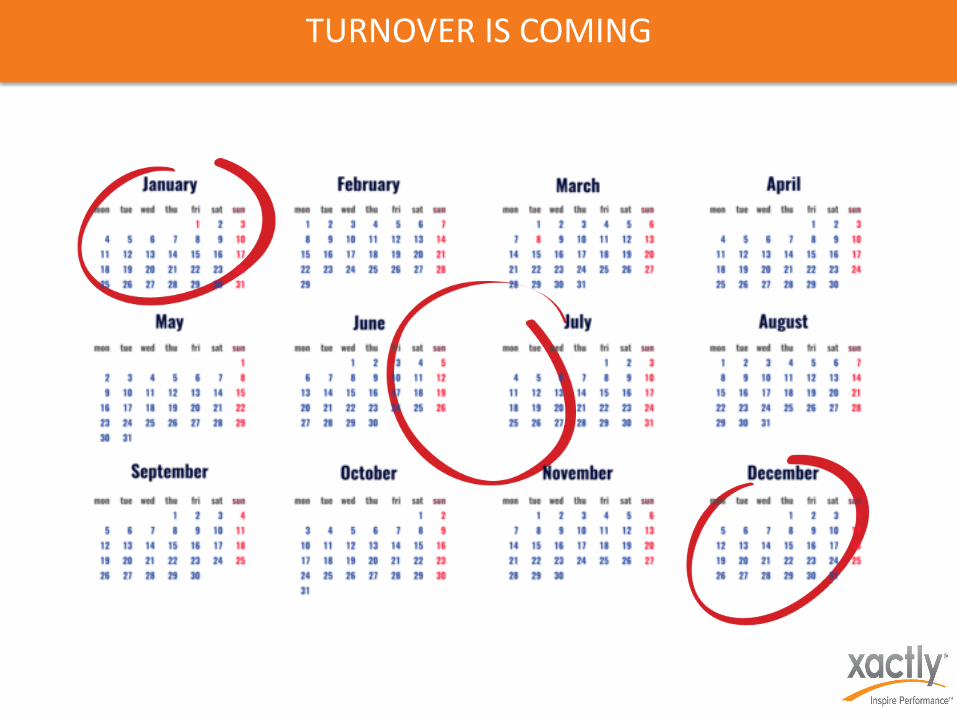
TURNOVER IS COMING

BUILDING THE HUNTER PLAN
Conduct a salary survey to set target pay.
How much of the target pay should be variable?
Pick metrics to base rewards on
that meet corporate goals, focusing
on the most important one.
Build in accelerators to ensure continuous stretch
targets
Calculate how much you’ll spend as a % of sales if
everyone makes quota, or if half make 200% and
half make nothing.

USING FARMER’S FOR FUN AND PROFIT
Make sure you know what line items in a transaction reflect
the appropriate renewal and up-sell revenue the Farmer
owns.
Don’t assign quota based on things the Farmer
does not control. How much will the Farmer make
if the renewal rate stays the same?
What periods should you track? If all of renewals
are at year-end, a monthly quota does not make sense.
Is there room for customer abuse?!
Calculate total payouts as a percent of total renewals at
different renewal levels – worth the cost?

Incent the Right Behaviors
Tactic
al
Stra
teg
ic

“Our users love Xactly, they love the interface, they love the ability to get information on their mobile devices, and the ability to produce results with a much higher level of accuracy.”
“Now we have the ability to scale phenomenally over what we used to do, so my requirement to devote future resources to this has been incredibly minimized.”

FINAL CHECKLIST
Motivate in the now: real-time visibility and easily accessible data access.
Tailor incentives based on team roles. Balance individual rewards with team
recognition. Leverage numerous forms of variable
compensation including commissions, bonuses, MBO’s, contests, and SPIFs.
Use analytics to identify the behavior that is being “rewarded.”
Pay early, pay often, pay accurately.
Erik W. CharlesVice President, Product MarketingXactly Corporationt: 01 949 439 3555w: xactlycorp.come: [email protected]: @erikchaz
Timetable
Chairman of the day: Pieter van Bodegraven (Partner Main Capital)
14.30-15.00 Welcoming reception
15.00-15.10 Opening Main CapitalCharly Zwemstra Managing Partner
15.10-15.40 Achieving Sales Excellence Simon Kucher & PartnersHayri Culum Sr. Director Benelux
15.40-16.10Using Sales Improvement Tools to accelerate Sales Performance
XactlyErik Charles VP Product Marketing
16.10-16.30 Coffee break
16.30-17.00Portfolio company: Selling Complex Technology
SofonJohan Wolthuis Director Sales & Marketing
17.00-17.30Scaling from 10m to 100m in revenues. Best practices in setting up efficient Sales Operations
AchieversGreg Brown Chief Revenue Officer
17.30-19.00 Networking drinks

Main Capital
Create Business Value with Complex Technology
Johan Wolthuis


Philips Healthcare Manufactures systems for
imaging, radiation oncology and patient
monitoring as well as providing information
management and resuscitation products
4000 employees and distributors use Sofon as
Global Catalogue & Quoting platform integrated
with Salesforce and SAP on Microsoft Azure
Cloud (started 2016)
About Philips Healthcare

What did we solve at Philips Healthcare
• From Products to Solution for their customers
• Flexible System to adjust to rapid changing Market
Requirements
• High quality output to Customer
• Relevant information in the right place, at the right
time to the right person
• Stable Product Catalogue for Sales, Flexible for
Supply chain, Correct for ordering from Factory
• 5 Minutes to create initial Commercial Quote
• Multi level Approval Process for technical
validation and margin control

CUSTOMER CENTRICITY IS A STRATEGY

CUSTOMER CENTRICITY AFFECTS ALL ASPECTS OF A BUSINESS

CUSTOMER CENTRICITY IS THE ULTIMATE WEAPON
TO BEAT COMPETITION


WHAT IS OUR DEFINITION OF
WINNING?
• WIN TRUST• MEET AND BEAT EXPECTATIONS
• BE IN CHARGE OF THE SALES PROCESS• SPEED UP THE SALES CYCLE
• SET THE DECISION MAKING CRITERIA• OUR USP’S IN THE LEAD

LISTENING IS EASY
…IF YOU KNOW WHAT YOU WANT TO FIND OUT

Start with a clean Sofon Business Model

Result the Sofon Business Model
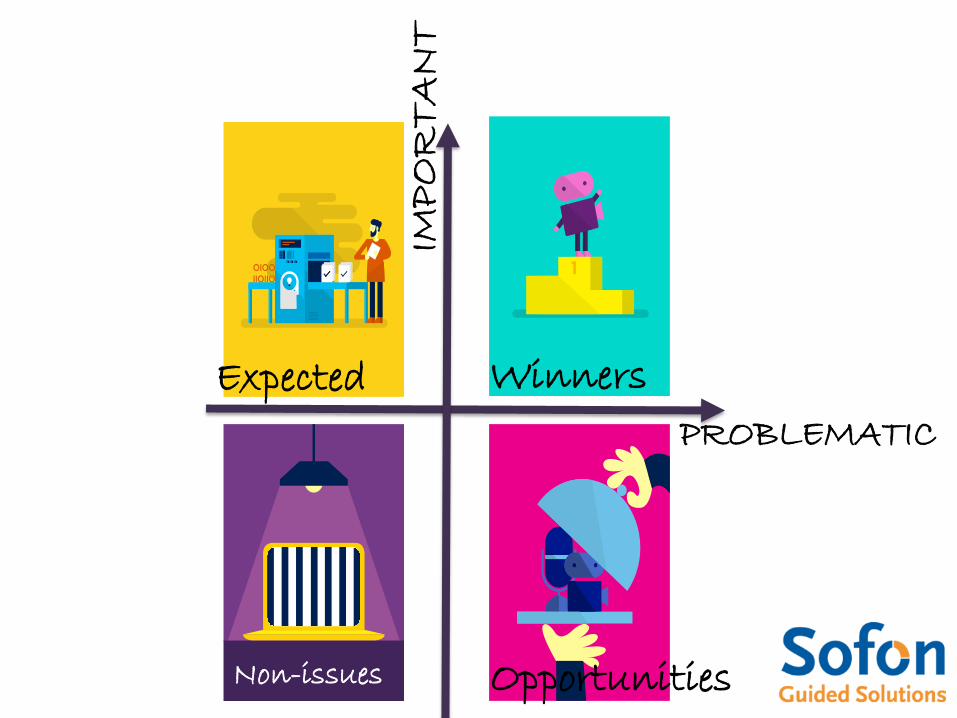
PROBLEMATICIMPORTANT
Opportunities
Winners
Non-issues
Expected
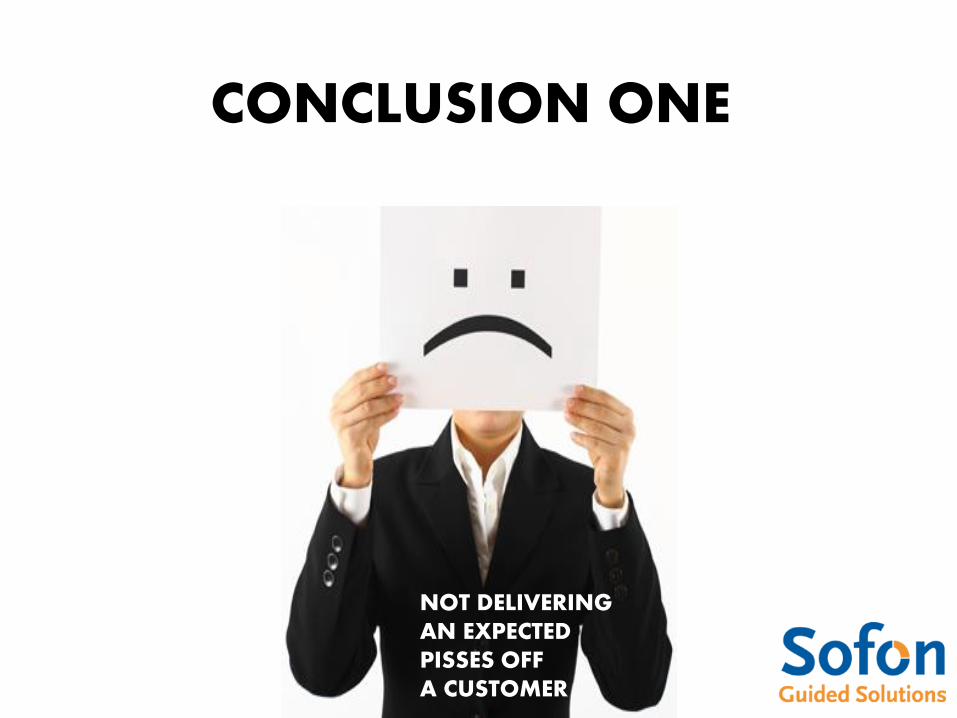
CONCLUSION ONE
NOT DELIVERING AN EXPECTEDPISSES OFFA CUSTOMER

CONCLUSION TWO
ONE CAN LOSE A CASEBY NOT FULFILLING ONE SINGLE EXPECTED

CONCLUSION THREE
ONE CAN LOSE A CASEBY NOT FULFILLING ONE SINGLE EXPECTED
ONE CAN KILL A COMPETITORBY LEAVING ANUNEXPECTED EXPECTED
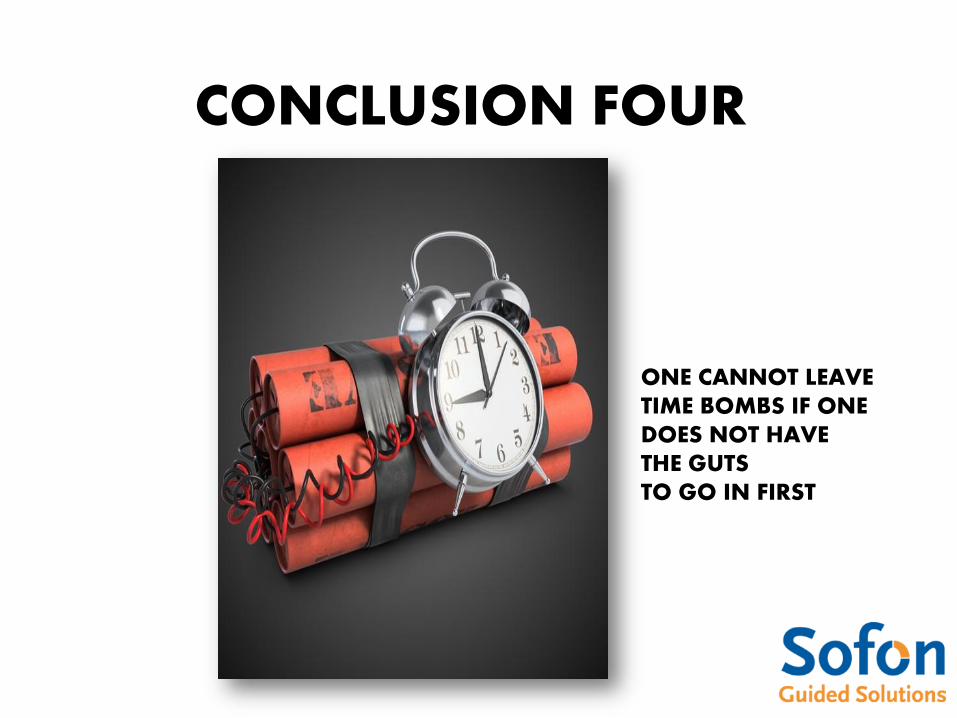
CONCLUSION FOUR
ONE CAN LOSE A CASEBY NOT FULFILLING ONE SINGLE EXPECTED
ONE CANNOT LEAVETIME BOMBS IF ONEDOES NOT HAVE THE GUTSTO GO IN FIRST

CONCLUSION FIVE
LEADERS GO FIRST
ONE CAN LOSE A CASEBY NOT FULFILLING ONE SINGLE EXPECTED
THINK ABOUTTURNING
USP’S INTOTIME BOMBSFOR COMPETITION

THERE IS NO EXCUSE FOR BEING BORING

NON-ISSUES CAN KILL A DEAL

IT IS ALL ABOUT PSYCHOLOGY

GRABTHEGOLDFISH

People will not read all the tekst that is on your slides. They will get lost andyou will loose their attentions and as such you will loose them. You are notpresentening to impress people with a few hundred words on each and everyslide. When people want to read, they will take a book, I guess. What is yourpupose? Do you want your audience to read each and every word on yourslide? Than waht do you do? Shut up? How long? Do you wait for the signs? Or do you read each and every word yourself? What do you try to tell youraudience by doing so? That you think that they can not read? Do you want them to think that they are idiots? Maybe you may consider that pictures maysay more than a thousand words? And that by speaking he words that are noton the slide you might have a conversation? Talking about conversations? Do you talk to your friends making use of long and extensive tekst that you have written on a piece of paper to help the conversation? I cannot believe that. We simply cannot listen and read at the same time. Make a choice. No, you do not have to make a choice. There is no choice. You are presenting. That is, bydefinition: speaking. Hence, your audience is there to listen. Audience. Youcan highlight your message by a few words, not necessarely those that youspeak, and you can illustrate the things you are talking about using pictures, but please do ever never write too many wordson each slide unless you want to make the simple statement that too many words never do whatever youwanted to prove. Like we do on this slide. By the way there is no bottle of champagne waiting for those that are able to read this text while listening towhat I am saying as this is not a contest.

People will not read all the tekst that is on your slides. They will get lost andyou will loose their attentions and as such you will loose them. You are notpresentening to impress people with a few hundred words on each and everyslide. When people want to read, they will take a book, I guess. What is yourpupose? Do you want your audience to read each and every word on yourslide? Than waht do you do? Shut up? How long? Do you wait for the signs? Or do you read each and every word yourself? What do you try to tell youraudience by doing so? That you think that they can not read? Do you want them to think that they are idiots? Maybe you may consider that pictures maysay more than a thousand words? And that by speaking he words that are noton the slide you might have a conversation? Talking about conversations? Do you talk to your friends making use of long and extensive tekst that you have written on a piece of paper to help the conversation? I cannot believe that. We simply cannot listen and read at the same time. Make a choice. No, you do not have to make a choice. There is no choice. You are presenting. That is, bydefinition: speaking. Hence, your audience is there to listen. Audience. Youcan highlight your message by a few words, not necessarely those that youspeak, and you can illustrate the things you are talking about using pictures, but please do ever never write too many wordson each slide unless you want to make the simple statement that too many words never do whatever youwanted to prove. Like we do on this slide. By the way there is no bottle of champagne waiting for those that are able to read this text while listening towhat I am saying as this is not a contest.

HELP THEM SEE WHAT YOU ARE SAYING

NEVERCOMPLICATE

AVOID TOO MANY OPTIONS

• Customer centricity• Disruptiveness• Define the winners• Dialogue• Support the customer in
buying, not selling

Timetable
Chairman of the day: Pieter van Bodegraven (Partner Main Capital)
14.30-15.00 Welcoming reception
15.00-15.10 Opening Main CapitalCharly Zwemstra Managing Partner
15.10-15.40 Achieving Sales Excellence Simon Kucher & PartnersHayri Culum Sr. Director Benelux
15.40-16.10Using Sales Improvement Tools to accelerate Sales Performance
XactlyErik Charles VP Product Marketing
16.10-16.30 Coffee break
16.30-17.00Portfolio company: Selling Complex Technology
SofonJohan Wolthuis Director Sales & Marketing
17.00-17.30Scaling from 10m to 100m in revenues. Best practices in setting up efficient Sales Operations
AchieversGreg Brown Chief Revenue Officer
17.30-19.00 Networking drinks
Change The Way
The World Works
Scaling from 10M to 100M
Greg Brown
Chief Revenue Officer

Agenda
Background
Organization Structure
Sales Leadership
Field Operations (Sales Ops)
– Customer Retention
– Lead Generation
– Compensation
– Forecasting
– Reporting
– Sales Productivity Tools

My Background
• Professional Highlights
– 16 years of Senior Sales
leadership in SaaS companies
– 2 Acquisitions – WebEx & Achievers
– Scaling is where my expertise
and passion lies
• Personal Highlights
– Married 10 years, 2 sons
– Lived in Netherlands for 3 years
– Collegiate athlete


Employee Recognition Platform (SaaS)
• Sequoia Funded
• Acquired by Blackhawk in June 2015
• Approaching 100M in revenue
• 220 employees (Sales/Services - 90 emp.)
• Offices in North America / UK
• Sell to mid-to-large enterprises (1000+ emp.)
• Average Annual Contract Value
– Mid-market - $225,000
– Enterprise - $540,000

Direct
Inside Sales
Customer
Success
EMEA /APAC
Channel
Integrators
Outsource
Emerging
Markets
Platform
Ecosystem
Core Market Focus Geographic Expansion Global Coverage
Go-To-Market Evolution

Organizational Evolution
Get Off The Ground
Cover The Market
Align to Client Drivers
Establish foundation
Validate Product/Mkt fit
2-3 self-sustaining reps
1st Line build out
Rapid sales deployment
Territory & Account
Customer Success
Develop Partner Ecosystem
Install v New
Small v Large
Emerging markets
Vertical specialization
• Never stretch 1st line span of control – critical to scale
• Establish Customer Success team early….retention is imperative
• Global standards critical, even as you scale into emerging markets
• Ongoing training and development is key

Sales/Services Organization Structure
Solutions Consultants
Sales Development
Account
Executives
Professional
Services
Channels /
Alliances
Customer Success
Managers
1st Line Management
2nd Line Management
Field Operations
Americas EMEA APAC LTAM

Organization Chart
CRO
VP Sales
(West)
VP Sales
(East)
VP Professional
Services
VP Customer
Success
Director
Sales Development
Senior Director
Alliances
Director Field
Operations
8 Sales Reps 8 Sales Reps 2 Managers
13 Employees
5 Managers
28 Employees
8 Reps3 Solutions
Consultants
5 Operations
Staff

Core Tenants in Sales Leadership
• Clear vision and strategy
• Create a “team-first” culture
• Pay for performance
• Right People on the Bus
Critical Traits:
- Drive
- Curiosity
- Integrity
- Track record of excellence
o Business
o Life (Sports)
- Likeability
- Compassion

Staffing Ratios
Varies based on Deal Sizes and Lifecycle Stage
Achievers Target Ratios
Job Function Ratio
1st Line Sales/CS Managers 1 to every 7 sales reps
2nd Line Sales/CS Managers 1 to every 5 1st line managers
Channel Reps 1 to every 15 sales reps
Sales Development 1 to every 2 sales reps
Customer Success (Acct Management) 1 to every 10 accounts
Solutions Consultants 1 to every 5 sales reps
Professional Services 1 to every 7 implementation reps
Sales/Services Ops 5 to support 90 employees
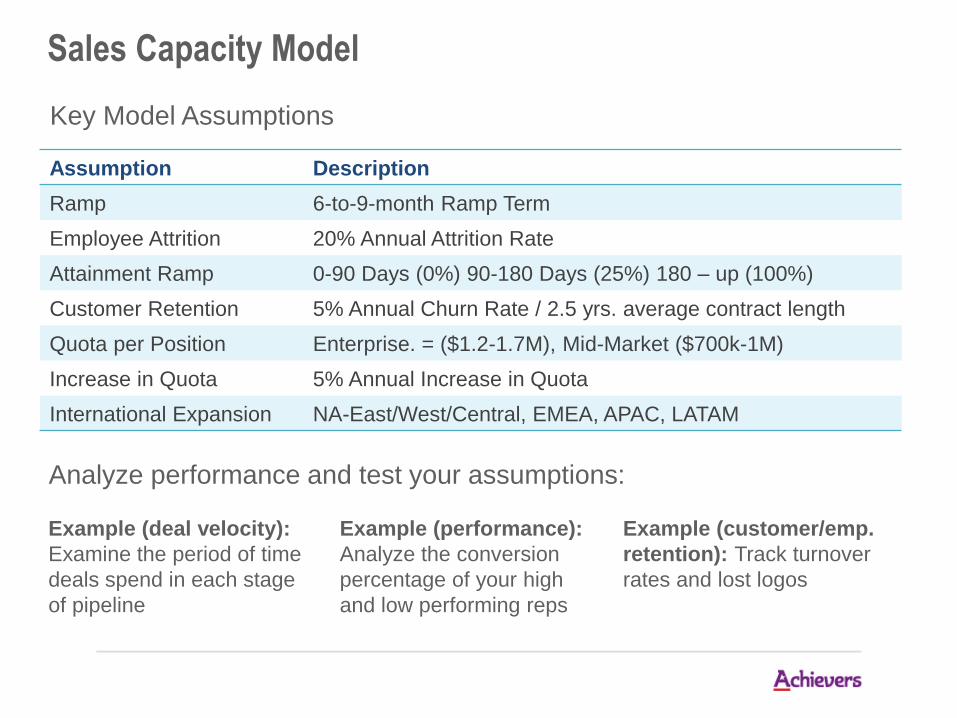
Sales Capacity Model
Key Model Assumptions
Assumption Description
Ramp 6-to-9-month Ramp Term
Employee Attrition 20% Annual Attrition Rate
Attainment Ramp 0-90 Days (0%) 90-180 Days (25%) 180 – up (100%)
Customer Retention 5% Annual Churn Rate / 2.5 yrs. average contract length
Quota per Position Enterprise. = ($1.2-1.7M), Mid-Market ($700k-1M)
Increase in Quota 5% Annual Increase in Quota
International Expansion NA-East/West/Central, EMEA, APAC, LATAM
Analyze performance and test your assumptions:
Example (deal velocity):
Examine the period of time
deals spend in each stage
of pipeline
Example (performance):
Analyze the conversion
percentage of your high
and low performing reps
Example (customer/emp.
retention): Track turnover
rates and lost logos

• Planning
• Forecast & Pipeline
Mgmt.
• Commissions, Quotas,
Account & Territory
deployment ongoing
• 1st line support to Sales
• Complex deal structuring
• Deal approval
• Non-standard
evaluations / margin
analysis
• ROI Support
• Tied heavily to CRO,
CFO, Legal
• Analytics tools
• Standard field reporting
• Sales analysis
• Pipeline, White Space,
Hiring, Productivity
• Sales Planning
• Finance / FP&A
alignment
• Lead to Opportunity
• Process & tools
• Campaign effectiveness
• Sales execution
Operations Deal Structuring Sales Analytics Demand / Inside
Enablement Renewals Operations Quote / Order Management
• Sales Foundation / On Boarding
• Sales Methodology & Process
• On-going talent development
• E-Learning / Curriculum
• Field communications
• Leadership Development
• Renewal management
• Risk analysis
• Quotation, negotiation support
• Process, contract administration
• ‘Quote To Provisioning’
• Quotation process & systems
• Order Management
Field Operations (Sales Ops)
Critical Function - Gets More Complex as You Scale
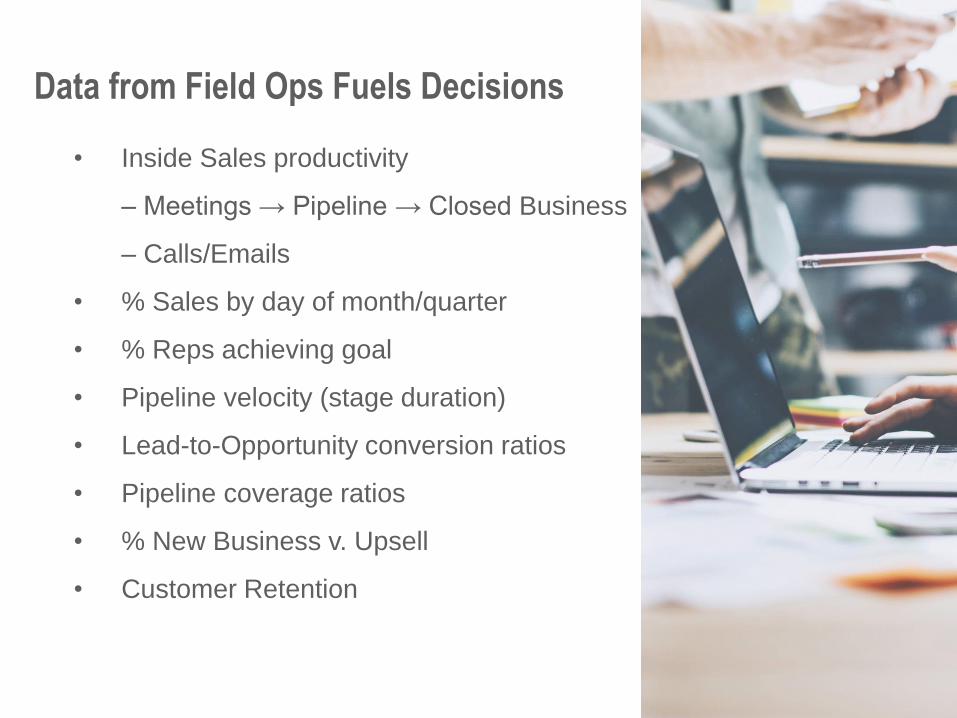
Data from Field Ops Fuels Decisions
• Inside Sales productivity
– Meetings → Pipeline → Closed Business
– Calls/Emails
• % Sales by day of month/quarter
• % Reps achieving goal
• Pipeline velocity (stage duration)
• Lead-to-Opportunity conversion ratios
• Pipeline coverage ratios
• % New Business v. Upsell
• Customer Retention

Churn’s Impact on Revenue Growth
Hypothetical SaaS Company
• $50k in MRR
• 50 customers at $1k ARR each• $1250 in CAC, Sales Efficiency of 0.8
• Growing 15% m/m

Sales and Marketing Spend Required to Double Revenue
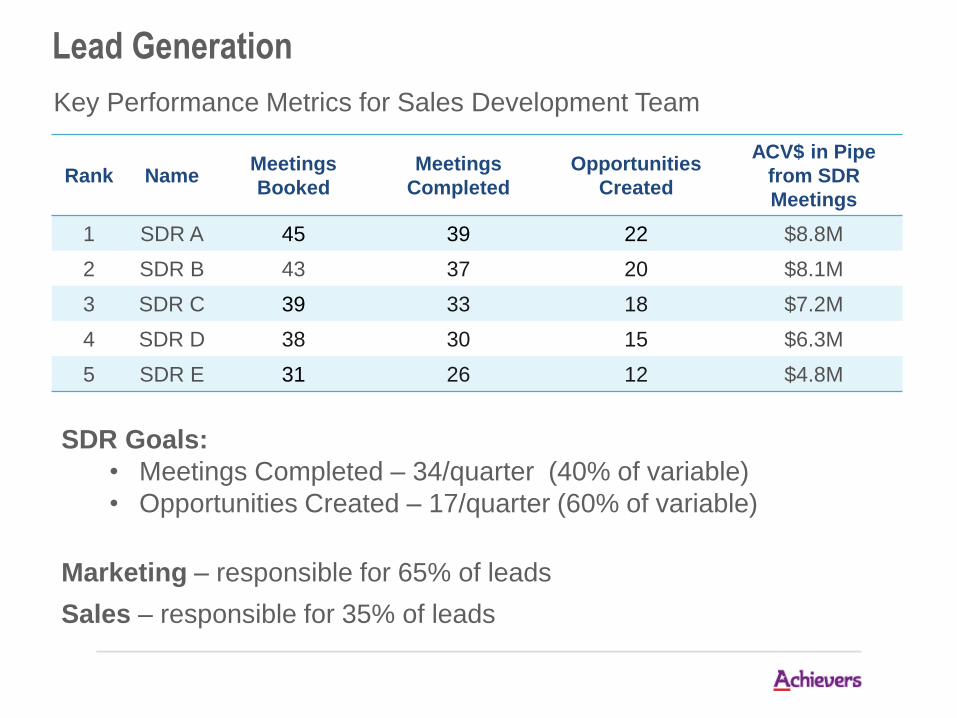
Lead Generation
Key Performance Metrics for Sales Development Team
Rank NameMeetings
Booked
Meetings
Completed
Opportunities
Created
ACV$ in Pipe
from SDR
Meetings
1 SDR A 45 39 22 $8.8M
2 SDR B 43 37 20 $8.1M
3 SDR C 39 33 18 $7.2M
4 SDR D 38 30 15 $6.3M
5 SDR E 31 26 12 $4.8M
SDR Goals:
• Meetings Completed – 34/quarter (40% of variable)
• Opportunities Created – 17/quarter (60% of variable)
Marketing – responsible for 65% of leads
Sales – responsible for 35% of leads
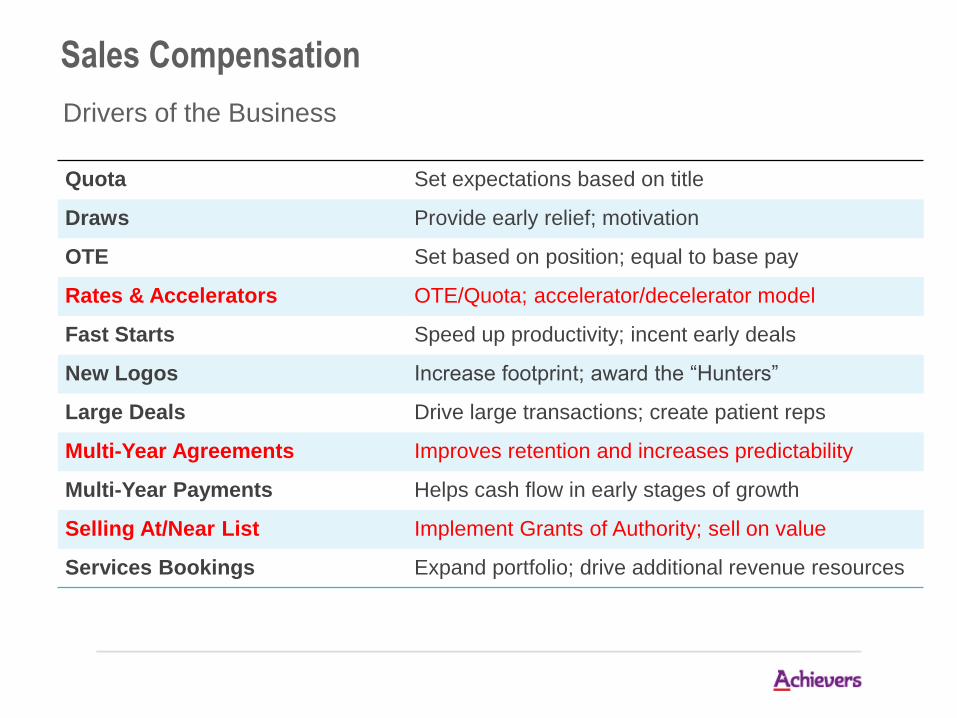
Sales Compensation
Drivers of the Business
Quota Set expectations based on title
Draws Provide early relief; motivation
OTE Set based on position; equal to base pay
Rates & Accelerators OTE/Quota; accelerator/decelerator model
Fast Starts Speed up productivity; incent early deals
New Logos Increase footprint; award the “Hunters”
Large Deals Drive large transactions; create patient reps
Multi-Year Agreements Improves retention and increases predictability
Multi-Year Payments Helps cash flow in early stages of growth
Selling At/Near List Implement Grants of Authority; sell on value
Services Bookings Expand portfolio; drive additional revenue resources

Payout Rates
No Cap on Commission!
0 - 60% of Annual Quota attainment = .50
61 - 80% of Annual Quota attainment = .80
81 - 100% of Annual Quota attainment = 1.00
101% - 125% of Annual Quota attainment = 1.25
126% - 150% of Annual Quota attainment = 1.50
151%+ of Annual Quota attainment = 1.75
• Trued up as the Salesperson reaches a new tier up to 100%
• Accelerators only apply to business closed above 100% of Quota
• Commissions paid monthly

Forecast Discipline

Productivity Technologies
• Salesforce
- Sales Cloud (CRM)
- Service Cloud (Customer Services / Support)
• InsideView (Sales Prospecting)
• LinkedIn Sales Navigator (Sales Prospecting)
• Outreach i.o. (Sales Prospecting)
• Marketo (Marketing Automation)
• Litmus (Learning Management – Customer Training)
• Exactly (Compensation)
• Birst (Analytics)
• Clarizen (Project Management)
• Netsuite (Finance)
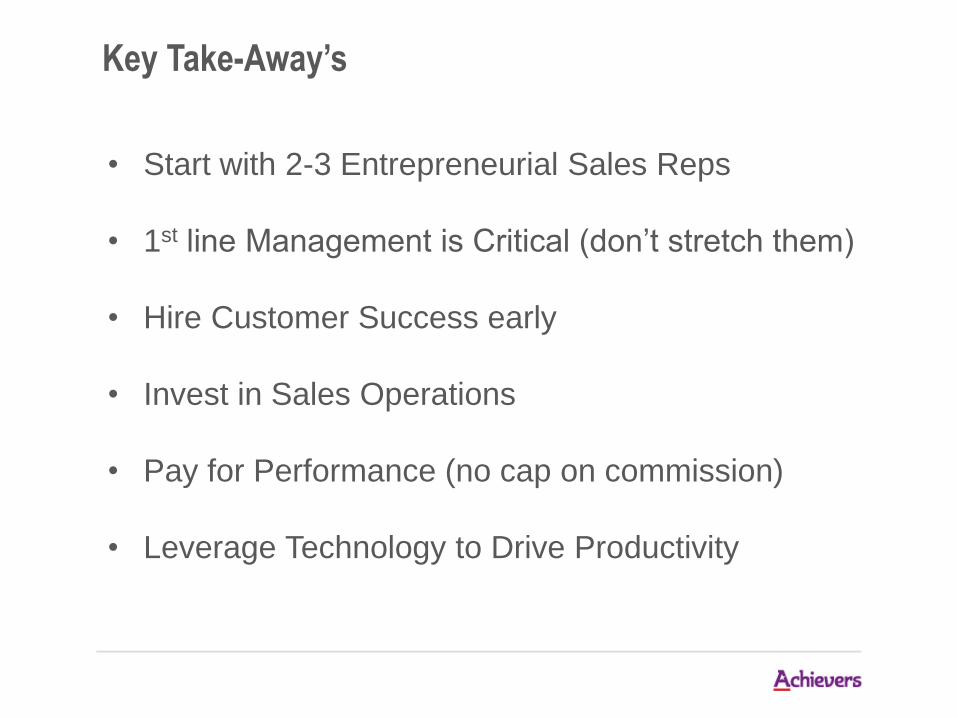
Key Take-Away’s
• Start with 2-3 Entrepreneurial Sales Reps
• 1st line Management is Critical (don’t stretch them)
• Hire Customer Success early
• Invest in Sales Operations
• Pay for Performance (no cap on commission)
• Leverage Technology to Drive Productivity

Thank You
Q&A

Appendix

Weighted Forecast Approach
Example: $100K ACV opportunity with ABC company Unweighted Weighted
Stage 0 (0%) Qualify $100K $-
Stage 1 (20%) Teach $100K $20,000
Stage 2 (40%) Tailor $100K $40,000
Stage 3 (60%) Validate $100K $60,000
Stage 4 (80%) Justify $100K $80,000
Stage 5 (90%) Contract $100K $90,000
Stage 6 (100%) Closed – Won $100K $100,000
Stage 7 (0%) Closed – Lost $100K $-
Stage 8 (0%) Closed – No Decision $100K $-
Pipeline Coverage Goals:
• Total Pipeline – 3x plan
• Weighted Pipeline – 1.2-1.5x plan
Consistently track days in each stage to uncover velocity issues

Forecast Stage Weighting Description Milestones Required to Move to Next Stage
1 Qualify (Lead) 0% A suspect opportunity uncovered by MKTG,
SDR or Sales Rep. Possible interest but not
qualified or accepted.
• Meeting with prospect set by SDR
• SDR to create opportunity
• AE has initial call and qualifies.
2 Teach (Educate) 20% Educate the customer by providing unique
perspective using customer stories. Shape
customers thinking about their needs.
• AE defines evaluation process
• Determines key business drivers
3 Tailor (Demo) 40% Sales team provides a demo to influencers
and/or decision makers. Tailor for resonance.
• Champion confirms budget and need.
• Buying/decision process confirmed
• Business case quantified
4 Validate (Vendor
of choice)
60% Been down selected to final group of vendors
being considered.
• Implementation Date confirmed
• Business Case validated
• Verbal commitment from executive
• Contract review meeting scheduled
5 Justify (Verbal) 80% Verbally agreed to business terms. Moving to
legal review. Decision is final and no risk that
the deal will be closed. Implementation and
Security review process initiated.
• Completed implementation meeting
• Contract signoff process confirmed
• Security review complete
• Redlines received and no show stoppers
6 Contract
(Redlines)
90% Legal redlines received and do not see any
major issues. ProServ has met with customer
and signed off on implementation
requirements and schedule.
• Implementation team assigned and
schedule confirmed
• Contract signed
7 Closed Won 100% Contract is signed and all paperwork
submitted.
• Agreement and order submitted to Sales
Ops and signed by Finance
8 Closed Lost 0% Lost the deal to a competitor • Document reason and competitor
9 Closed
No Decision
0% Deal has died. Customer has decided to stay
with the status quo.
• Document reason

Performance Metrics Q1-15 Q2-15 Q3-15 Q4-15 Q1-16
Total Contract Value Attainment
Total Managed (ACV, Renewal, PS)
Net New ACV Attainment
Sales Quota Achievement
Q/Q Growth
Y/Y Growth
Cumulative Total Customers (Net)
New Customers
Competitive Win Rate
ACV Existing Customer % to Net New
Cumulative ACV Renewal Attainment
Renewal %
Churned Customers
Sales Reps On-Board
Average Productivity per Sales Rep
Sales Rep Annualized Attrition Rate
Total Annualized Attrition Rate
CAC Ratio (Customer Acquisition Cost)
Gross Margin

Timetable
Chairman of the day: Pieter van Bodegraven (Partner Main Capital)
14.30-15.00 Welcoming reception
15.00-15.10 Opening Main CapitalCharly Zwemstra Managing Partner
15.10-15.40 Achieving Sales Excellence Simon Kucher & PartnersHayri Culum Sr. Director Benelux
15.40-16.10Using Sales Improvement Tools to accelerate Sales Performance
XactlyErik Charles VP Product Marketing
16.10-16.30 Coffee break
16.30-17.00Portfolio company: Selling Complex Technology
SofonJohan Wolthuis Director Sales & Marketing
17.00-17.30Scaling from 10m to 100m in revenues. Best practices in setting up efficient Sales Operations
AchieversGreg Brown Chief Revenue Officer
17.30-19.00 Networking drinks