MAGNT Research Report (ISSN. 1444-8939) Vol.2 (3). pp: 107-119
13
MAGNT Research Report (ISSN. 1444-8939) Vol.2 (3). pp: 107-119 The Empirical Study of Perception, Expectation and Satisfaction Level of Consumers regarding Paint Industry in Al-Kharj Region, Kingdom of Saudi Arabia Teg Alam & Mohammad Rishad Faridi College of Business Administration, Salman bin Abdulaziz University, Al Kharj; Kingdom of Saudi Arabia. Abstract: To make an in-depth analysis of consumer satisfaction, marketers are using various appropriate methodologies to gauge the level of customer satisfaction not by just mere figures and diagrams but a comparative systematic analysis of all competitors in a given environment. Marketers have to be agile and responsive to the needs of the consumers. This research paper makes an analysis of paint brands competing in Al Kharj region, Kingdom of Saudi Arabia. In order to improve consumer satisfaction level marketers need to have a thorough understanding of perception and expectation of consumers. This research project present an analysis of how Paint Industries with reference to marketing and sales is performing with finding out the expectation, perception, and satisfaction level of consumer and makes a comparison with various paint players performance in Al Kharj region. The study suggested some strategies for various paint companies so that they can achieve brand leadership and strengthen their core competence. Keywords: Consumers, Expectations, Perceptions, Satisfactions, Quality, Paint Industry 1. Introduction Saudi Arabia is a developing country in the Middle East and has an oil-based strong economy. Kingdom of Saudi Arabia is focusing on encouraging private organization to invest, grow, expand, their respective business which enables employment generation to Saudis. This present study is conducted at Al Kharj region. Al-Kharj city is located in central of Saudi Arabia, which is approximately 100 km from Riyadh, the capital of Kingdom of Saudi Arabia. Al Kharj region is mostly an agriculture belt which produces dates, vegetables and fruits. Industries for processed food and dairy products are manufactured famous brands are Almarai, Al Safi etc. in Al Kharj. Al Kharj has a prestigious University named as “Salman bin Abdulaziz University, Al Kharj”. The total paint business in Saudi Arabia is more than SAR 5 billion. The paint industry is growing rapidly due to construction, expansion of urban area, development of rural area etc. Need for an effective marketing strategy which focuses on customer satisfaction, perception and expectation rethinking beyond use of paint like providing paint solutions to the customers. Paint is not just mere product to protect walls and decorate but depicts the living standard, moods, flair of consumers ‘Beauty and protection’ concept. This research study has been conducted to specifically make an analysis of paint consumer satisfaction, perception and expectation. Following are the paints brands available at Al Kharj, Kingdom of Saudi Arabia which has been analyzed in present research study: Al-Jazeera Paints: Al-Jazeera Paints Company was established in 1979 in Riyadh, Kingdom of Saudi Arabia. Company is produces a diverse array of quality of products. The company covers all areas in the Kingdom with showrooms & technical support. Jotun Paints: Jotun Paints was established in 1926 in Sandefjord, Norway. The industry holds ninth rank globally. Headquarter of Jotun paint is in Sandefjord. Regional headquarters are at Norway, Malaysia, Dubai and China etc. Sigma Paints: Sigma Paints was founded in Dammam in 1981 by an association of eminent Saudi businessmen in cooperation with Sigma Kalon. Hempel Paints: Largest producer and seller in the world is Hempel which brings decorative, protective, marine, container and yacht markets. Hempel works with many leading companies in Saudi Arabia. 2. Literature Review In Today’s business fulfilling the demand and wants of customer is not customer satisfaction. Exceeding the expectation of customers in its products and services is customer satisfaction. Customer satisfaction has been redefined and it is a must for a company to grow and prosper. As per Parker and Mathew (2001) “there are two basic definitional approaches of the concept of customer satisfaction”. In 1983 Westbrook and
Transcript of MAGNT Research Report (ISSN. 1444-8939) Vol.2 (3). pp: 107-119

MAGNT Research Report (ISSN. 1444-8939) Vol.2 (3). pp: 107-119
The Empirical Study of Perception, Expectation and Satisfaction Level of Consumers regarding Paint
Industry in Al-Kharj Region, Kingdom of Saudi Arabia
Teg Alam & Mohammad Rishad Faridi
College of Business Administration,
Salman bin Abdulaziz University, Al Kharj; Kingdom of Saudi Arabia.
Abstract: To make an in-depth analysis of consumer satisfaction, marketers are using various appropriate methodologies to gauge the level of customer satisfaction not by just mere figures and diagrams but a comparative systematic analysis of all competitors in a given environment. Marketers have to be agile and responsive to the needs of the consumers. This research paper makes an analysis of paint brands competing in Al Kharj region, Kingdom of Saudi Arabia. In order to improve consumer satisfaction level marketers need to have a thorough understanding of perception and expectation of consumers. This research project present an analysis of how Paint Industries with reference to marketing and sales is performing with finding out the expectation, perception, and satisfaction level of consumer and makes a comparison with various paint players performance in Al Kharj region. The study suggested some strategies for various paint companies so that they can achieve brand leadership and strengthen their core competence.
Keywords: Consumers, Expectations, Perceptions, Satisfactions, Quality, Paint Industry
1. Introduction
Saudi Arabia is a developing country in the Middle East and has an oil-based strong economy. Kingdom of Saudi Arabia is focusing on encouraging private organization to invest, grow, expand, their respective business which enables employment generation to Saudis. This present study is conducted at Al Kharj region. Al-Kharj city is located in central of Saudi Arabia, which is approximately 100 km from Riyadh, the capital of Kingdom of Saudi Arabia. Al Kharj region is mostly an agriculture belt which produces dates, vegetables and fruits. Industries for processed food and dairy products are manufactured famous brands are Almarai, Al Safi etc. in Al Kharj. Al Kharj has a prestigious University named as “Salman bin Abdulaziz University, Al Kharj”. The total paint business in Saudi Arabia is more than SAR 5 billion. The paint industry is growing rapidly due to construction, expansion of urban area, development of rural area etc. Need for an effective marketing strategy which focuses on customer satisfaction, perception and expectation rethinking beyond use of paint like providing paint solutions to the customers. Paint is not just mere product to protect walls and decorate but depicts the living standard, moods, flair of consumers ‘Beauty and protection’ concept. This
research study has been conducted to specifically make an analysis of paint consumer satisfaction, perception and expectation.
Following are the paints brands available at Al Kharj, Kingdom of Saudi Arabia which has been analyzed in present research study: Al-Jazeera Paints: Al-Jazeera Paints Company was established in 1979 in Riyadh, Kingdom of Saudi Arabia. Company is produces a diverse array of quality of products. The company covers all areas in the Kingdom with showrooms & technical support. Jotun Paints: Jotun Paints was established in 1926 in Sandefjord, Norway. The industry holds ninth rank globally. Headquarter of Jotun paint is in Sandefjord. Regional headquarters are at Norway, Malaysia, Dubai and China etc. Sigma Paints: Sigma Paints was founded in Dammam in 1981 by an association of eminent Saudi businessmen in cooperation with Sigma Kalon. Hempel Paints: Largest producer and seller in the world is Hempel which brings decorative, protective, marine, container and yacht markets. Hempel works with many leading companies in Saudi Arabia.
2. Literature Review
In Today’s business fulfilling the demand and wants of customer is not customer satisfaction. Exceeding the expectation of customers in its products and services is customer satisfaction. Customer satisfaction has been redefined and it is a must for a company to grow and prosper. As per Parker and Mathew (2001) “there are two
basic definitional approaches of the concept of customer satisfaction”. In 1983 Westbrook and

Vol.2 (3). pp: 107-119
Reilly proposed “the value-percept theory” which
defines satisfaction as an emotional response caused by a cognitive-evaluative process, which is the comparison of the product or service to one's values rather than an expectation. Fisk and Young (1985); Swan and Oliver (1985) proposed “the equity theory” that is individuals
compare their input and output ratios with those of others and feel equitable treated. According to Kumar R & Barani (2012) “tangibles, reliability, responsiveness, competence, credibility, accessibility and customer knowledge are positively related to customer satisfaction”. Parasuraman, Zeithaml and Berry (1988) established “multiple-item scale for measuring service quality, known as SERVQUAL”. SERVQUAL is a tool
which measures perceived quality and expectation and does analysis of the gap performance. It is an effective tool to measure consumer behavior. According to the Namkung (2008) “Customer satisfaction is critically important”, because it reflects
subjective customer evaluations of the attribute performance associated with the consumption experience. As per Hallowell (1996) “the customer
satisfaction is the result of a customer’s perception of the value received”. The term customer perception in layman language is how the customers visualizes, feel, sees products and services. William & Prabakar (2012) stated that “the customer
perception of retail service quality is an important segment to the emerging and the existing retailers in the market”. Retail service quality is a dynamic chemistry of gelling customer expectation with meeting customer requirement from the retail perspective. A fight between winning the hearts of customers and defeating competitors Olshavsky and Miller (1972), and Olson and Dover (1979) developed “the assimilation theory”. The Assimilation effect occurs when the difference between expectations and quality is too small to be perceived increasing with expectations. Customer expectation is just not confined to better delivery, better services, better customer relationship but also improving the perception and image of the total ambience of marketing process. In 1993 Zeithaml et al. identified “major antecedents of consumer expectations of services”. According to the
Bitner (1990) and Parasuraman et al. (1985) “the
consumer expectations prior to a service encounter impact customers’ evaluation of service performance
and customer satisfaction”. Customer expectation, perception and satisfaction are all nucleus of creating a customer centric environment which will surely bring long term
relationship and long term loyalty from the customers. 3. Objective of the study
Following are the objectives of this research paper: To make an analysis of perception, satisfaction,
expectation level of customers in Al Kharj region To make comparative analysis of various
variables in paint marketing. To make an overview analysis of present and
future marketing trend and understand the present status of the paint industry
The impact and influence of customer service in paint marketing.
To make an effective channel of distribution, sales department supporting marketing.
3.1 Research Significance:
The research significances are as follows: Enable in making an effective marketing strategy
for various paint companies. Able to Map Strengths, Weaknesses,
Opportunities and Threats in paint industry with reference to marketing and sales.
To suggest print advertisement slogans. To devise strategies for product differential
segment for end consumer. Review distribution strategy in support of
sales/marketing. Understand the buying behavior of consumer. Chalk strategies to improve sales and build
reputation.
4. Research Methodology
The questionnaires developed by Researchers for collecting information. It is purely on primary data, analysis through questionnaires and interviews. Sampling Area - The study conducted on the following respondents i.e. the consumers, in Al Kharj Region. Population: All the consumers using the Paints in Al Kharj Region. Sample size: The research focused on the participants who are willing to participate. Sampling Design: The sample is designed by the convenience sampling method. Sample of customers are taken from end consumer. Interview and questionnaire techniques are used for getting information. Respondents are contacted by research investigators directly to conduct the interview and filling the questionnaire. After completion of data collection, we used the appropriate statistical techniques like graphical presentations, descriptive statistics for analyzing the data.

Vol.2 (3). pp: 107-119
5. Result and Findings
5.1. Demographic Profiling of Respondents
Table 1. Demographic Profiling of Respondents
S. No Demographics Frequency Percentage
1
Age
≤ 30 years 42 42.0
30 - 40 years 27 27.0
40 - 50 years 19 19.0
≥ 50 years 12 12.0
2 Location
Urban 72 72.0
Rural 28 28.0
3 Qualification
School 44 44.0
Graduation 35 35.0
Post-Graduation 10 10.0
Professional 2 2.0
Others 9 9.0
4
Income per month (in SAR)
≤ 5000 44 44.0
5000-10,000 38 38.0
10,000-20,000 13 13.0
≥ 2000 5 5.0
5 Occupation
Employee 51 51.0
Businessmen 11 11.0
Professional 11 11.0
Others 27 27.0
Vol.2 (3). pp: 107-119
5.1.1. Graphical Presentation of Demographic Data
Figure 1: Age group of respondents
igure 2: Places of respondents
Figure 3: Qualification of respondents
Figure 4: Income per month of respondents
Figure 5: Occupation of respondents
The aforementioned table and figures illustrates that the majority age group of customers less than or equal to 30 years. Respondents are mostly from urban area. Mostly respondents are having school level qualification. Most of the respondents income level is less than or equal to SAR 5000 which depicts middle income group. Respondents were mostly employee at various organizations.
5.1.2. Awareness level of Paint Brands
Table 2. Awareness level of Paint Brands
Brands of paints No. of Respondents
%
Al Jazeera 40 40.0
Jotun 25 25.0
Sigma 7 7.0
Hempel 18 18.0
Others 10 10.0
Figure 6. Awareness level of Paint Brands
The above table 2 and figure 6 shows that the top of the mind recall is enjoyed by Al Jazeera paint followed by Jotun and Hempel respectively.
42%
27%
19%
12%
≤ 30 years
30 - 40 years
40 - 50 years
≥ 50 years
72%
28%
Urban
Rural
44%
35%
10% 2% 9% School
Graduation
Post-Graduation
Professional
Others
44%
38%
13% 5%
≤ 5000
5000-10,000
10,000-20,000
≥ 2000
51%
11% 11%
27% Employee
Businessmen
Professional
Others
Al Jazeera Jotun Sigma Hempel Others
40
25
7
18
10
No. of Respondents

Vol.2 (3). pp: 107-119
5.1.3. Consumption Brand Wise
Table 3. Consumption Brand Wise
Brands of paints No. of
Respondents %
Al Jazeera 43 43.0
Jotun 31 31.0
Sigma 9 9.0
Hempel 17 17.0
Others 0 0.0
Figure 7. Consumption Brand Wise
The above table 3 and figure 7 illustrate that the normally high brand awareness outputs high brand sales (well aligned) and this is what depicts in this finding.
5.2. Satisfaction level of Consumers through Various Variables Present in Paints
Table 4. Satisfaction level of Consumers (In percentage) Variables Excellent Good Neutral Bad Very Bad
Customized Product 75 20 5 0 0
Quality 54 35 10 1 0
Price / Value 36 31 24 7 2
Easy to use 40 37 20 3 0
Easily Available 51 32 15 1 1
Wide range of colors with catalogue 49 32 14 5 0
Dealer recommendation 31 32 24 9 4
High Advertisement 26 34 32 7 1
Painter and Contractor recommendation 30 36 25 6 3
Packaging 32 34 25 7 2
Brand Image 40 25 26 8 1
Technical service available 36 28 22 11 3
Customer service / relationship 39 26 23 7 5
Social Responsibility 30 31 27 6 6
Al Jazeera
Jotun Sigma Hempel Others
43
31
9
17
0
No. of Respondents

Vol.2 (3). pp: 107-119
Figure 8. Satisfaction level of Consumers
It is observed from aforementioned table 4 and figure 8 that the consumer needs specific paint color, features, sizes, quality, finish etc. Customer always prefers quality in any respect. Service level, customer service etc. is very much focused by the companies. If a consumer is using a particular paint code till the work is not complete the same paint should be
available all time and every time. Paint in layman symbolizes attractive color. More variety means lot of shades and different finishes. Easy to use, brand image of the brand, customer service and relationship supplements the major factors in influencing brand choice.
Table 5. Descriptive Statistics of Satisfaction level of Consumers
Items Mean Std. Deviation t df Sig. (2-tailed)
Customized Product 1.30 0.56 23.23 99 .000 Quality 1.58 0.71 22.15 99 .000 Price / Value 2.08 1.03 20.16 99 .000 Easy to use 1.86 0.84 22.11 99 .000 Easily Available 1.69 0.84 20.19 99 .000 Wide range of colors with catalogue 1.75 0.88 19.88 99 .000 Dealer recommendation 2.23 1.11 20.11 99 .000 High Advertisement 2.23 0.95 23.43 99 .000 Painter and Contractor recommendation 2.16 1.02 21.13 99 .000 Packaging 2.13 1.01 21.06 99 .000 Brand Image 2.05 1.04 19.74 99 .000 Technical service available 2.17 1.13 19.23 99 .000 Customer service / relationship 2.13 1.16 18.36 99 .000 Social Responsibility 2.27 1.14 19.99 99 .000
0
10
20
30
40
50
60
70
80
Excellent
Good
Neutral
Bad
Very Bad
Vol.2 (3). pp: 107-119
Table 5 shows the mean scores, standard deviation and t-values. It is evident from the table 5 that all the
statements are significantly different from test value (test value=0).
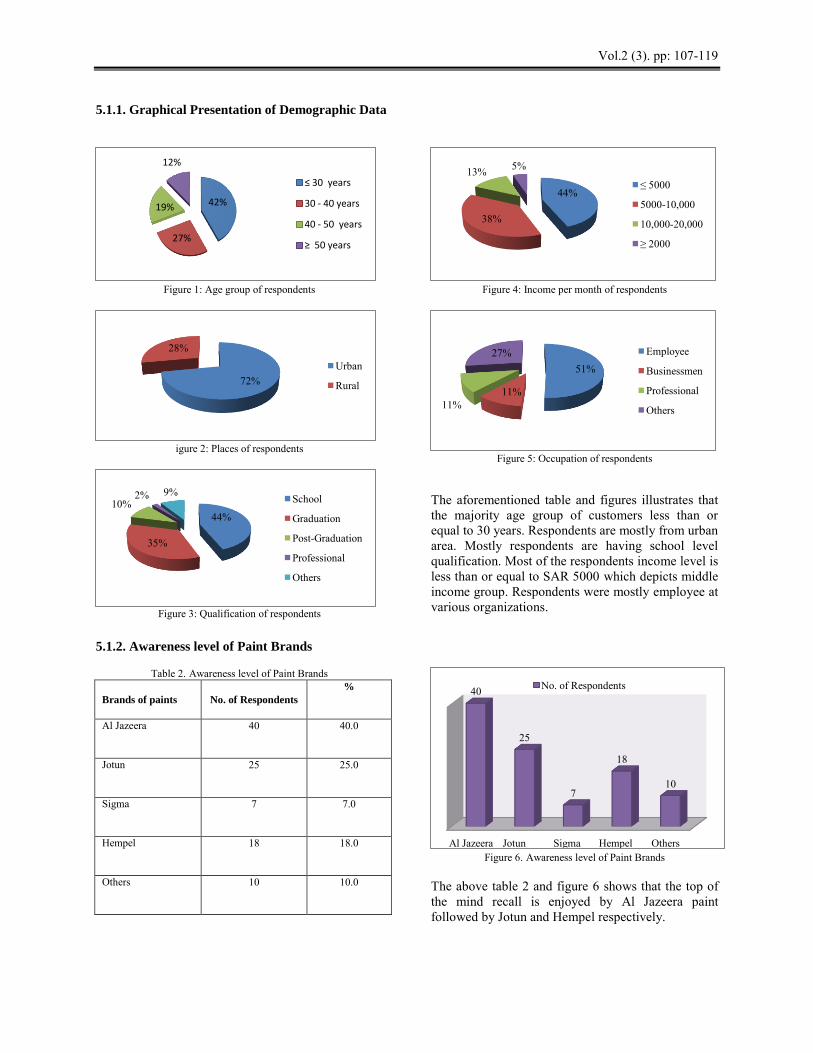
5.3. Brand Perception in Paints
Table 6. Brand Perception in Paints (In percentage) Features Al Jazeera Jotun Sigma Hempel Others
Good Quality / Durability 58 23 6 12 1 Price with Value 40 29 13 15 3 Easy to use 49 27 11 12 1 Easy to Available 53 23 8 14 2 Wide range of colors with catalogue 54 16 13 13 4 Most Popular Brand 48 24 10 13 5 Dealer recommendation 39 27 14 13 7 High Advertisement 44 32 7 9 8 Painter and Contractor recommendation 38 37 9 9 7 Packaging 42 30 15 11 2 Brand Image 37 33 14 13 3 Technical service available 47 22 15 12 4 Customer Service / relationship 49 25 9 11 6 Social Responsibility 54 20 10 9 7
Figure 9. Brand Perception in Paints
Table 6 and figure 9 illustrate that overall customer perceives good quality/durability, best value for the price, easy to use, availability, wide range of colors;
brand image etc. is all in Al Jazeera brand, so brand perception is very high of Al Jazeera brand.
0
10
20
30
40
50
60
Al Jazeera
Jotun
Sigma
Hempel
Others

Vol.2 (3). pp: 107-119
Table 7. Descriptive Statistics of Brand Perception in Paints
Features Mean Std. Deviation t df Sig. (2-tailed)
Good Quality / Durability 1.75 1.08 16.26 99 .000
Price with Value 2.12 1.18 17.92 99 .000
Easy to use 1.89 1.08 17.48 99 .000
Easy to Available 1.89 1.16 16.26 99 .000
Wide range of colors with catalogue 1.97 1.25 15.75 99 .000
Most Popular Brand 2.03 1.25 16.23 99 .000
Dealer recommendation 2.22 1.28 17.29 99 .000
High Advertisement 2.05 1.27 16.19 99 .000
Painter and Contractor recommendation 2.10 1.21 17.35 99 .000
Packaging 2.01 1.10 18.33 99 .000
Brand Image 2.12 1.14 18.60 99 .000
Technical service available 2.04 1.21 16.81 99 .000
Customer Service / relationship 2.00 1.26 15.93 99 .000
Social Responsibility 1.95 1.28 15.21 99 .000
Table 7 shows the mean scores, standard deviation and t-values. It is evident from the table 7 that all the
statements are significantly different from test value (test value=0).
5.4. Expectations of Consumer in Deciding a Brand Purchase
Table8. Expectations of Consumer in Deciding a Brand Purchase (In percentage) Features
Highest Priority Priority Neutral Low Priority Lowest Priority
Quality / Durability 73 13 13 1 0
Price with Value 49 24 26 1 0
Easy to use 48 18 32 2 0
Easy to Available 42 24 25 9 0
Wide range of colors with catalogue 41 29 22 6 2
Most Popular brand 38 30 28 4 0
Dealer recommendation 32 31 33 3 1
High Advertisement 33 28 34 5 0
Painter and Contractor recommendation 25 30 36 7 2
Packaging 32 27 32 6 3
Brand Image 25 25 40 8 2
Technical service available 34 22 32 12 0
Customer Service / relationship 31 25 30 13 1
Social Responsibility 34 15 38 6 7

Vol.2 (3). pp: 107-119
Figure10. Expectations of Consumer in Deciding a Brand Purchase
The results of table 8 and figure 10 highlighted that there is a very strong relationship between variables preferred by consumer in respect to satisfaction and expectation level. As a marketing strategy marketer has to give top priority on quality, durability,
competitive pricing, easy to use, wide range of color, brand image in order to be a preferred brand etc. It is a continuous process of improvement, innovation and customer satisfaction.
Table 9. Descriptive Statistics of Expectations of Consumer in Deciding a Brand Purchase
Features
Mean Std. Deviation t df Sig. (2-tailed)
Quality / Durability 1.42 0.75 18.82 99 .000 Price with Value 1.79 0.87 20.62 99 .000 Easy to use 1.88 0.94 20.11 99 .000 Easy to Available 2.01 1.02 19.71 99 .000 Wide range of colors with catalogue 1.99 1.03 19.32 99 .000 Most Popular brand 1.98 0.91 21.76 99 .000 Dealer recommendation 2.10 0.93 22.66 99 .000 High Advertisement 2.11 0.93 22.67 99 .000 Painter and Contractor recommendation 2.31 0.99 23.29 99 .000 Packaging 2.21 1.06 20.91 99 .000 Brand Image 2.37 1.01 23.43 99 .000 Technical service available 2.22 1.05 21.14 99 .000 Customer Service / relationship 2.28 1.07 21.23 99 .000 Social Responsibility 2.37 1.21 19.56 99 .000
Table 9 shows the mean scores, standard deviation and t-values. It is evident from the table 9 that all the
statements are significantly different from test value (test value=0).
0
10
20
30
40
50
60
70
80
Highest Priority
Priority
Neutral
Low Priority
Lowest Priority

Vol.2 (3). pp: 107-119
5.5.1. Most Preferred Paint Brand
Table 10. Most Preferred Paint Brand
Brands of paints No. of
Respondents %
Al Jazeera 39 39.0
Jotun 20 20.0
Sigma 5 5.0
Hempel 12 12.0
Others 24 24.0
Figure 11. Most Preferred Paint Brand
From table 10 and figure 11 it is concluded that Al Jazeera paints tops as a brand leader. There is a strong relationship between preferred brands with the variables prioritized by the consumers brand
perception in paints. There is indeed a strong correlation between preferred variable in expectation, perception and satisfaction put forth into the preferred brand.
5.5.2.Consumers Consumption Pattern
Table11. Consumers Consumption Pattern
When No. of
Respondents %
< 3 months 20 20.0
3 months – 1 year 35 35.0
1 year – 2 years 28 28.0
2 years – 3 years 17 17.0
> 3 years 0 0.0
Figure 12. Consumers Consumption Pattern
It appears from table 11 and figure 12 that most of the respondents are familiar with the paint buying
process directly or indirectly. It depicts respondents are well aware of paint product and various brands.
Al Jazeera
Jotun Sigma Hempel Others
39
20
5
12
24
No. of Respondents
< 3 months
3 months – 1 year
1 year – 2 years
2 years – 3
years
> 3 years
20
35
28
17
0
No. of Respondents

Vol.2 (3). pp: 107-119
5.5.3. Decision taken in buying a specific brand
Table 12. Decision taken in buying a specific brand
Who No. of
Respondents %
Self 47 47.0
Wife 19 19.0
Children 7 7.0
Dealer 5 5.0
Painter / Contractor 9 9.0
Others 13 13.0
Figure 13. Decision taken in buying a specific brand
Table 12 and figure13 shows that in Commodity, consumer buying process traditionally the decision maker is the head of the family, supplement by the wife occasionally. Painters, contractors, dealers principally influences in the buying process. 6. Recommendation / Strategies
The following are the recommendations / Strategies: Paint brands should focus on improving their
credibility in the eyes of customers by exceeding customer expectation in quality service, technical support etc.
Paint industries should create a data bank of past and existing consumers and communicate regularly to make them believe the company cares and wants to keep a long term relationship for building brand loyalty.
Regular e-surveys should be conducted by the companies to understand the expectations of consumers’ needs and wants of paint as they may change with due to course of time.
Paint Industries should make a micro list of variables or characteristics on preferred ranking basis-region wise and then integrate it to be one list on a macro level at a global or region wise.
Innovation plays a very vital role in differentiating the brands with its competitors. Henceforth organization should invest in research and development in order to improve, modify the existing product. Companies which foresee the trend and capitalise will have an added advantage.
Improving customer service is very important. Paint traditionally was categorised as a
commodity but lately it is quasi blend of a consumer as well as a commodity. The transitioning phase should be well read by the company in order to be a learning organization.
Distribution resource planning with the support of enterprise resource planning will support organization to optimize resources, improve visibility, and improve service level, effective inventory control which will overall reduce supply chain cost.
Paint Industries need to continuously improve their brand equity by adjusting or reforming marketing strategies as per the need of the specific market.
Environment Scanning is essential to understand internal as well as external variables in order to recognise strength, weakness, opportunity and threat of the organization.
Due to advancement of technology. Social media is becoming an effective tool like voice of customers, word of mouth etc. are becoming strong points for consumers. Promotion mix of the company should be a blend of various advertisement tools and methods.
Paint Industry should create awareness of environment sustainability. Green marketing should be more emphasized by creating an image which will be supporting the company to be called as social responsible company.
Marketing can be further deliberated in adopting viral marketing concept like e awareness, e-ordering, e-survey, e-marketing etc.
47
19
7 5 9
13
No. of Respondents

Vol.2 (3). pp: 107-119
7. Conclusion
A collaborative approach between paint industry, paint supplier, dealers, and consumers will create a customer focused environment by reducing cost and improving customer service through aligning company’s vision, goals and objectives. Strategic alliance and synergy should be explored for possible opportunities at national or global level in order to gain a competitive advantage. Paint industry is very well transitioning from commodity marketing to consumer marketing, company which is responsive and agile will reap the fruit of success. Future of paint industry in AlKharj region is very bright due to high level of development in the areas of infra-structure like education, industrialization, highway/roads, housing, sports/recreation, hospitals, agriculture etc. development. 8. Acknowledgement
This present research is a part of research project funded by Deanship of Scientific Research, Salman bin Abdulaziz University, Kingdom of Saudi Arabia. Researchers are grateful to the Deanship of Scientific Research , Salman bin Abdulaziz University, Kingdom of Saudi Arabia for financial support in completing this work.
9. References
[1] Abdeldayem, Marwan Mohamed, Khanfar, Muhannad Radi. (2007), “Consumer
Expectation and Consumer Satisfaction Measurements: A Case Study from India” The Business Review, Cambridge, 8 (2), pp.303-310.
[2] Athanassopoulos, Antreas D. (2000), “Customer Satisfaction Cues to Support Market
Segmentation and Explain Switching Behavior,” Journal of Business Research, 47,pp. 191–207.
[3] Adams, J.S. (1963), "Towards an understanding of inequity", Journal of Abnormal and Social Psychology, Vol. 67, pp.422-36.
[4] Baumgartner, G. , Conftrences, M. , Jolibert, A. and Assistant, M. (1978). The Perception of Foreign Products in France. Advances in Consumers Research, 5, pp.603-605.
[5] Bitner, M.J., Booms, B.H., Tetreault, M.S. (1990), "The service encounter: diagnosing favorable and unfavorable incidents", Journal of Marketing, Vol. 54, pp.71-84.
[6] Cadotte E R, Woodruff R B and Jen kins R L (1987), “Expectations and Norms in Models of
Consumer Satisfaction”, Journal of Marketing
Research, Vol.24, pp. 305 -14.
[7] Cardozo, R.N. (1965), “An experimental study
of consumer effort, expectation and satisfaction”, Journal of Marketing Research,
Vol. 2, pp. 244-9. [8] Cronin, J.J., Taylor, S.A. (1992), "Measuring
service quality: a re-examination and extension", Journal of Marketing, Vol. 56, pp.55-68.
[9] Fisk, R.P. and Young, C.E. (1985), “Disconfirmation of equity expectations: effects
on consumer satisfaction with services”, in
Hirschman, E. and Holbrook, H. (Eds), Advances in Consumer Research, Association for Consumer Research, Provo, UT.
[10] Grönroos, C. (1982), Strategic Management and Marketing in the Service Sector, Swedish School of Economics and Business Administration, Helsingfors.
[11] Grönroos, C. (1984), "A service quality model and its marketing implications", European Journal of Marketing, Vol. 18 No.4, pp.36-44.
[12] Grönroos, C. (1990), Service Management and Marketing: Managing the Moments of Truth in Service Competition, Lexington Books, Lexington, MA.
[13] Hallowell, Roger. (1996), “The Relationship of
Customer Satisfaction, Customer Loyalty, and Profitability: An Empirical Study,” The
International Journal of Service Industry Management, 7 (4), pp. 27–42.
[14] Howard, J.A. and Sheth, J.N. (1969), “The Theory of Buyer Behaviour”, John Wiley & Sons, New York, NY.
[15] Jerry C. Olson and Philip Dover (1976), "Effects of Expectation Creation and Disconfirmation on Belief Elements of Cognitive Structure," in B. B. Anderson, ed., Advances in Consumer Research, Volume III, (Chicago: Association for Consumer Research), pp.168-75.
[16] John William & S. Prabakar (2012), “A Study on Customer Perception on Retail Service Quality In Select Organized Retail Stores in Coimbatore City”, International Journal of Retail Management and Research (ISSN 2277-4750) Vol. 2 Issue 3 Sep 2012, pp.1-10.
[17] Kumar.R & Dr. G. Barani (2012), “Examination of Organized Retailing Service Quality In Attire Specialty Stores In Bangalore City, India”, International Journal of Computing and Business Research (ISSN: 2229-6166) Vol 3 Issue 1 Jan 2012, pp. 1-15.
[18] Mathur, A. (2011), “An Empirical Study of Quality of Paints: A Case Study of Impact of Asian Paints on Customer Satisfaction in the

Vol.2 (3). pp: 107-119
city of Jodhpur” IJMT, Volume 19, Number 2, pp. 84-98.
[19] Miller, J.A. (1977), "Studying satisfaction, modifying models, eliciting expectations, posing problems, and making meaningful measurements", in Hunt, H.K. (Eds),Conceptualization and Measurement of Consumer Satisfaction and Dissatisfaction, Indiana University, Bloomington, IN, pp.72-91.
[20] Namkung Young, Jang Shawn (2008), “Are highly satisfied restaurant customers really different”, Journal of Contemporary Hospitality Management Vol. 20 No. 2, 2008 , pp. 142-155, Emerald Group Publishing Limited 0959-6119.
[21] Parker, C., and Mathews, B.P., (2001), “Customer satisfaction: contrasting academic
and consumers' interpretations”, Marketing
Intelligence and Planning, 19/1, pp. 38-44. [22] Parasuraman, A., Zeithaml, V., Berry, L.L.
(1985), "A conceptual model of service quality and its implications for future research", Journal of Marketing, Vol. 48, pp.41-50.
[23] Parasuraman, A., Zeithaml, V. A., & Berry, L. L. (1988), “SERVQUAL :a multiple-item scale for measuring consumer perceptions of service quality”, Journal of Retailing, 64(1), pp. 12-40.
[24] Richard N. Olshavsky and John A. Miller (1972), "Consumer Expectations, Product Performance, and Perceived Product Quality,'' Journal of Marketing Research, 9, pp. 19-21.
[25] Schniederjans, M. J., Cao, Q., and Olson, J. (2004). Consumer Perceptions of Product Quality: Made in China. Quality Management Journal, 11, pp. 8-19.
[26] Swan, J.E., Trawick, F. (1980), "Satisfaction related to predictive vs. desired expectations", in Hunt, H.K., Day, R.L. (Eds),Refining Concepts and Measures of Consumer Satisfaction and Complaining Behavior, Indiana University, Bloomington, IN, pp.7-12.
[27] Swan, J.E. and Oliver, R.L. (1985) ,“Automobile buyer satisfaction with the
salesperson related to equity and disconfirmation”, in Hunt, H.K. and Day, R.L.
(Eds), Consumer Satisfaction and Complaining
Behavior, Indiana University Press, Bloomington, IN.
[28] Thirumal Azhagan & Dr. P. S. Nagarajan (2011), “Analytical Study On Retail Service Quality Of Organized Retail Sector In Trichy”, Amet Journal of Management, July – Dec 2011, pp. 75-83.
[29] Tolman, E.C. (1932), “Purposive Behavior in Animals and Men, Appleton-Century”, New
York, NY. [30] Tsiotsou, R. (2005), “Perceived Quality Levels
and their Relation to Involvement, Satisfaction, and Purchase Intentions, Marketing Bulletin, 16, pp.1-10.
[31] Westbrook, R. A., & Reilly, M. D., (1983), “Value-Percept disparity: an alternative to the disconfirmation of expectations theory of customer satisfaction, in Bogozzi, P. R. and Tybouts, A. (eds)” Advances in Consumer Research, Association for Consumer Research, 10, Ann Arbor, MI, pp. 256-61.
[32] Zeithaml, V.A., Berry, L.L., Parasuraman, A. (1993), "The nature and determinants of customer expectations of services", Journal of the Academy of Marketing Science, Vol. 21, pp.1-12.
[33] http://en.wikipedia.org/wiki/Saudi_Arabia [34] http://en.wikipedia.org/wiki/Al-Kharj [35] http://www.al-jazeerapaints.com/About%20Us [36] http://www.jotun.com/me/en/corporate/about-
jotun/at-a-glance/ [37] http://www.sigmapaints.com/overview.asp [38] http://www.hempel.sa/en-sa/about-hempel [39] http://sloanreview.mit.edu/article/understanding
-customer-expectations-of-service/ [40] "Saudi Arabia". OPEC. 1995-01-01. Retrieved
2012-09-28. [41] "OPEC Decides Not To Increase Oil
Production", Jeff Brady. NPR. 8 June 2011. Retrieved 19 August 2011
[42] http://www.sama.gov.sa/sites/samaen/ReportsStatistics/ReportsStatisticsLib/5600_R_Annual_En_48_2013_02_19.pdf
[43] "World Bank: Saudi Arabia , strongest Arab economy". Infoprod.co.il. 2010-01-04. Archived from the original on 2010-01-04. Retrieved 2012-09-28
[44] http://www.saudinf.com/main/e521.htm