Magnetotelluric images of the crustal structure of Chyulu ... · Magnetotelluric images of the...
17
Magnetotelluric images of the crustal structure of Chyulu Hills volcanic field, Kenya V. Sakkas a , M.A. Meju a, * , M.A. Khan a , V. Haak b , F. Simpson c a Department of Geology, University of Leicester, University Road, Leicester LE1 7RH, UK b GeoForschungsZentrum Potsdam, Telegrafenberg, 14469 Potsdam, Germany c Institut fur Geophysik, Herzberger Landstr. 180, D-37075 Gottingen, Germany Received 23 January 2001; accepted 26 November 2001 Abstract Electromagnetic experiments were conducted in 1995 as part of a multidisciplinary research project to investigate the deep structure of the Chyulu Hills volcanic chain on the eastern flank of the Kenya Rift in East Africa. Transient electromagnetic (TEM) and broadband (120 – 0.0001 Hz) magnetotelluric (MT) soundings were made at eight stations along a seismic survey line and the data were processed using standard techniques. The TEM data provided effective correction for static shifts in MT data. The MT data were inverted for the structure in the upper 20 km of the crust using a 2-D inversion scheme and a variety of starting models. The resulting 2-D models show interesting features but the wide spacing between the MT stations limited model resolution to a large extent. These models suggest that there are significant differences in the physical state of the crust between the northern and southern parts of the Chyulu Hills volcanic field. North of the Chyulu Hills, the resistivity structure consists of a 10 – 12-km-thick resistive (up to 4000 V m) upper crustal layer, ca. 10-km-thick mid-crustal layer of moderate resistivity ( f 50 V m), and a conductive substratum. The resistive upper crustal unit is considerably thinner over the main ridge (where it is ca. 2 km thick) and further south (where it may be up to 5 km thick). Below this cover unit, steep zones of low resistivity (0.01 – 10 V m) occur underneath the main ridge and at its NW and SE margins (near survey positions 100 and 150 – 210 km on seismic line F of Novak et al. [Novak, O., Prodehl, C., Jacob, A.W.B., Okoth, W., 1997. Crustal structure of the southern flank of the Kenya Rift deduced from wide-angle P-wave data. In: Fuchs, K., Altherr, R., Muller, B., Prodehl, C. (Eds.), Structure and Dynamic Processes in the Lithosphere of the Afro-Arabian Rift System. Tectonophysics, vol. 278, 171– 186]). These conductors appear to be best developed in upper crustal (1 – 8 km) and middle crustal (9 – 18 km) zones in the areas affected by volcanism. The low-resistivity anomalies are interpreted as possible magmatic features and may be related to the low-velocity zones recently detected at greater depth in the same geographic locations. The MT results, thus, provide a necessary upper crustal constraint on the anomalous zone in Chyulu Hills, and we suggest that MT is a logical compliment to seismics for the exploration of the deep crust in this volcanic-covered basement terrain. A detailed 3-D field study is recommended to gain a better understanding of the deep structure of the volcanic field. D 2002 Elsevier Science B.V. All rights reserved. Keywords: Kenya Rift; Off-axis volcanism; Electromagnetic depth sounding; Conductivity imaging 0040-1951/02/$ - see front matter D 2002 Elsevier Science B.V. All rights reserved. PII:S0040-1951(01)00276-1 * Corresponding author. Tel.: +44-116-252-3628; fax: +44-116-252-3918. E-mail address: [email protected] (M.A. Meju). www.elsevier.com/locate/tecto Tectonophysics 346 (2002) 169– 185
Transcript of Magnetotelluric images of the crustal structure of Chyulu ... · Magnetotelluric images of the...

Magnetotelluric images of the crustal structure of Chyulu Hills
volcanic field, Kenya
V. Sakkas a, M.A. Meju a,*, M.A. Khan a, V. Haak b, F. Simpson c
aDepartment of Geology, University of Leicester, University Road, Leicester LE1 7RH, UKbGeoForschungsZentrum Potsdam, Telegrafenberg, 14469 Potsdam, GermanycInstitut fur Geophysik, Herzberger Landstr. 180, D-37075 Gottingen, Germany
Received 23 January 2001; accepted 26 November 2001
Abstract
Electromagnetic experiments were conducted in 1995 as part of a multidisciplinary research project to investigate the deep
structure of the Chyulu Hills volcanic chain on the eastern flank of the Kenya Rift in East Africa. Transient electromagnetic
(TEM) and broadband (120–0.0001 Hz) magnetotelluric (MT) soundings were made at eight stations along a seismic survey
line and the data were processed using standard techniques. The TEM data provided effective correction for static shifts in MT
data. The MT data were inverted for the structure in the upper 20 km of the crust using a 2-D inversion scheme and a variety of
starting models. The resulting 2-D models show interesting features but the wide spacing between the MT stations limited
model resolution to a large extent. These models suggest that there are significant differences in the physical state of the crust
between the northern and southern parts of the Chyulu Hills volcanic field. North of the Chyulu Hills, the resistivity structure
consists of a 10–12-km-thick resistive (up to 4000 V m) upper crustal layer, ca. 10-km-thick mid-crustal layer of moderate
resistivity (f 50 V m), and a conductive substratum. The resistive upper crustal unit is considerably thinner over the main ridge
(where it is ca. 2 km thick) and further south (where it may be up to 5 km thick). Below this cover unit, steep zones of low
resistivity (0.01–10 V m) occur underneath the main ridge and at its NW and SE margins (near survey positions 100 and 150–
210 km on seismic line F of Novak et al. [Novak, O., Prodehl, C., Jacob, A.W.B., Okoth, W., 1997. Crustal structure of the
southern flank of the Kenya Rift deduced from wide-angle P-wave data. In: Fuchs, K., Altherr, R., Muller, B., Prodehl, C.
(Eds.), Structure and Dynamic Processes in the Lithosphere of the Afro-Arabian Rift System. Tectonophysics, vol. 278, 171–
186]). These conductors appear to be best developed in upper crustal (1–8 km) and middle crustal (9–18 km) zones in the areas
affected by volcanism. The low-resistivity anomalies are interpreted as possible magmatic features and may be related to the
low-velocity zones recently detected at greater depth in the same geographic locations. The MT results, thus, provide a
necessary upper crustal constraint on the anomalous zone in Chyulu Hills, and we suggest that MT is a logical compliment to
seismics for the exploration of the deep crust in this volcanic-covered basement terrain. A detailed 3-D field study is
recommended to gain a better understanding of the deep structure of the volcanic field. D 2002 Elsevier Science B.V. All rights
reserved.
Keywords: Kenya Rift; Off-axis volcanism; Electromagnetic depth sounding; Conductivity imaging
0040-1951/02/$ - see front matter D 2002 Elsevier Science B.V. All rights reserved.
PII: S0040 -1951 (01 )00276 -1
* Corresponding author. Tel.: +44-116-252-3628; fax: +44-116-252-3918.
E-mail address: [email protected] (M.A. Meju).
www.elsevier.com/locate/tecto
Tectonophysics 346 (2002) 169–185

1. Introduction
The Kenya Rift is characterised by extensive vol-
canic activity (Fig. 1) and is one of the most intensively
studied magmatic continental rifts (e.g., Gregory,
1921; Baker and Wohlenberg, 1971; Khan and Mans-
field, 1971; Banks and Ottey, 1973; Beamish, 1977;
Rooney and Hutton, 1977; Banks and Beamish, 1979;
Shackleton, 1986; Karson and Curtis, 1989; Smith and
Mosley, 1993; Macdonald et al., 1994; Wheildon et al.,
1994; Birt et al., 1997; Novak et al., 1997a). Rift-
related magmatic activities started in northern Kenya
in the Oligocene (see Morley et al., 1992 and refer-
ences therein), propagated southwards—being initially
restricted to the rift proper and its western flank—and
is still continuing (see Williams, 1978). Large basaltic
fields started to develop on the eastern flank of the rift
in Late Miocene times and Quaternary volcanism was
restricted to the actual rift and the eastern flank (Baker,
1987; Karson and Curtis, 1989; Class et al., 1994;
Macdonald, 1994). A belt of several hundreds of
young volcanic fields formed 100–150 km off the
axis of the rift and are thought to represent the largest
volcanic features related to the rift structure (Bosworth,
1987).
The Chyulu Hills volcanic field in southern Kenya
(Fig. 1) is one of such fields. It is an area of high
magmatic activity and is situated 150 km east of the
southern part of the rift, about 40 km northeast of Mt.
Kilimanjaro. The volcanic chain is located directly on a
preexisting NW–SE striking shear zone in the Proter-
ozoic basement of the Mozambique orogenic belt that
may have served for magma injection into the upper
crust (Smith and Mosley, 1993). The age of volcanism
ranges from 1.4 Ma in the northern part to the recent
(Saggerson, 1963; Haug and Strecker, 1995), with
active volcanism in the last century restricted to the
southern edge of the main ridge. The hundreds of
cones characterising the Chyulu field are aligned in a
NW–SE direction. The metamorphic basement terrain
on which the Chyulu Hills rests is a peneplain with an
average elevation of 1000 m and the enclosed narrow
Quaternary chain of volcanoes attains a maximum
altitude of 2175 m. A smaller volcanic edifice, the
Taita Hills, occurs further south of the Chyulus. The
origin and evolution of the volcanic activities off the
axis of the main rift in the region have attracted
considerable attention (e.g., Bosworth, 1987; Karson
and Curtis, 1989; Smith and Mosley, 1993; Smith,
1994) but are still not well understood.
1.1. Past work and motivation for current studies
The structure and composition of the deep crust and
lithosphere across the Chyulu Hills volcanic field have
been the main focus of recent intensive studies (e.g.,
Henjes-Kunst and Altherr, 1992; Novak et al., 1997a,b;
Ritter and Kaspar, 1997). Geothermobarometric data
on mantle xenoliths suggest an apparent lithospheric
thickness of about 105 km (Henjes-Kunst and Altherr,
1992). The northern part of the Chyulu field especially
east of Selengei (Sel in Fig. 1) contains remnants of the
earliest stage (Early Pleistocene) magmatic activity in
the Chyulus (Saggerson, 1963). There are widely
spaced, partially eroded volcanic cones in this area
and studies of xenoliths in the volcanic rocks show that
magma transport was characterised by rapid ascent
from about 105–110-km depth to the surface without
stagnation in crustal chambers (Henjes-Kunst and
Altherr, 1992). The southern part of the Chyulu Hills
volcanic field contains a steep volcanic ridge (hereafter
referred to as the main ridge) with closely spaced cones
over a distance of 50 km and formed during Late
Pleistocene to recent times (Saggerson, 1963; Omenge
and Okele, 1992). Here, the magma is thought to have
had significant residence time in the crust since the
volcanic rocks contain abundant crustal-derived xen-
oliths but lack lower crustal and mantle-derived xen-
oliths (see Novak et al., 1997b).
Based on these geological and geothermobaromet-
ric considerations, it is to be expected that there will be
differences in the physical state of the crust in the
northern and southern parts of the Chyulu Hills vol-
canic field. The seismic refraction P-wave model of
Novak et al. (1997a, Fig. 8) shows a 9–11-km-thick
upper crust, a < 10-km-thick middle crust, and up to
25-km-thick lower crust with no major lateral varia-
tions over a distance of ca. 275 km along the profile.
The revised interpretative model supported by an
integrated data set (Novak et al., 1997b, Fig. 6)
suggests the presence of a low-velocity body in the
lower crust (30–44 km deep) beneath the volcanic
field. From a tomographic study of the Chyulu Hills,
Ritter and Kaspar (1997) demonstrated the presence of
lateral velocity contrasts of about 5% with a prominent
low-velocity zone located directly beneath the volcanic
V. Sakkas et al. / Tectonophysics 346 (2002) 169–185170

range down to 70-km depth (see also Novak et al.,
1997b, Fig. 7); however, near-surface effects were not
well resolved and there were no major laterally varying
structures in the 3–23-km-depth range in the interpre-
tative models. It is apparent from the foregoing dis-
cussions that further geophysical constraints on the
upper crustal structure of the region are desirable, and
may also help improve our understanding of the
structure and evolution of the Chyulu Hills volcanic
field. Since there was active volcanism in the southern
edge of the main ridge in the last century (Saggerson,
1963; Omenge and Okele, 1992), vestiges of magma
injection in the upper crust may be expected and could
be detected using ideal geophysical depth soundings.
The structure of the upper 25 km of the earth’s crust in
Chyulu Hills will be examined in this paper.
1.2. Adopted methodology and study focus
The magnetotelluric (MT) method is a proven
wavefield electromagnetic technique for deep subsur-
face imaging in volcanic-covered and other crystalline
terrains (e.g., Christopherson, 1991; Jones, 1993;
Simpson et al., 1997; Simpson, 2000; Bai et al.,
2001). The time-domain or transient electromagnetic
(TEM) method is a well-established tool for geological
mapping (e.g., Meju et al., 1999) and mineral explora-
tion in complex terrains (e.g., Peters and de Angelis,
1987 and references therein). The MT method has
capability for probing several tens of kilometers but
the data may be affected by galvanic distortions—
manifesting as frequency-independent static shifts of
the apparent resistivity curves—when small-size surfi-
cial heterogeneities are present (Berdichevsky and
Dmitriev, 1976), as can be expected in the weathered
and volcanic-covered basement terrain of Chyulu
Hills. The TEM technique provides a logical shal-
low-depth ( < 1 km) compliment to MT and also serves
for correction of MT static shifts (e.g., Sternberg et al.,
1988; Pellerin and Hohmann, 1990; Meju, 1996). The
combined TEM–MT approach was therefore selected
as the technique with optimum potential in the Chyulu
Hills crystalline terrain and was incorporated into a
multidisciplinary program aimed at understanding the
process of continental rifting in Kenya (see Simpson et
al., 1997; Sakkas, 1999).
Preliminary analysis of MT data from the region
suggests the presence of significantly enhanced con-
ductivities below the Chyulu Hills (Simpson et al.,
1997); however, no quantitative modelling of the data
was undertaken and the actual physical parameters of
the suggested zone of enhanced conductivities were
not known. An improved TEM-based technique for
static shift correction in MT data from complex geo-
logical terrains was recently suggested (Meju et al.,
1999) and it is highly desirable to develop a quantita-
tive MT model for the upper crustal structure of the
Chyulu Hills volcanic field to compliment the models
of the deep crust and lithosphere from other geo-
physical investigations along the same transect (e.g.,
Novak et al., 1997b; Ritter and Kaspar, 1997). This is
the main focus of our paper. However, it is pertinent to
mention that the TEM–MT station spacings (dictated
by the resources available for this aspect of the multi-
disciplinary project) are much too wide ( > 30 km) in
comparison with the seismic refraction and gravity
station spacings (ca. 2.5 km) on the Chyulu Hills line,
and the present investigation may therefore be best
regarded as a feasibility study of the applicability of the
combined TEM–MT method in this particular vol-
canic field. We note, however, that there have been past
electromagnetic induction studies north of this region
(e.g., Banks and Ottey, 1973; Beamish, 1977; Rooney
and Hutton, 1977; Banks and Beamish, 1979) but these
have different research thrusts; and for those involving
MT measurements, little attention was paid to the
distortion of the MT sounding curves by small-size
surficial heterogeneities. Surficial small-size bodies
cause galvanic distortions of MT apparent resistivity
sounding curves (Berdichevsky and Dmitriev, 1976)
leading to erroneous subsurface models if unaccounted
for (see Jones, 1988; Groom and Bahr, 1992 and
references therein). TEM data have been shown to
solve this problem in simple-layered geological ter-
rains but only provide partial remedies in complex
terrains (see e.g., Sternberg et al., 1988; Pellerin and
Hohmann, 1990; Meju, 1996; Meju et al., 1999). It is
hoped that joint TEM–MT measurements will lead to
improved model identification.
2. Field experiments and data analysis
Eight sounding locations (along the seismic and
gravity line F of Novak et al., 1997a,b) were occupied
in early 1995 as part of the KRISP94-MT project
V. Sakkas et al. / Tectonophysics 346 (2002) 169–185 171

(Simpson et al., 1997). The field experiments have
been described in detail by Simpson et al. (1997) and
only the salient points will be recounted here. The
TEM–MT transect extends from Lukenya (ca. 30 km
south of Nairobi), past the Chyulu Hills, to Mwatate
south of the Taita Hills about 160 km from Mombasa
and the Indian Ocean to the southeast (see Fig. 1). The
northernmost part of the profile is composed of
metamorphic rocks of the Proterozoic Mozambique
orogenic belt (see Saggerson, 1963). Most of the
TEM–MT stations were situated close to the main
seismic shot points of the KRISP94 experiments
(Lukenya is near Athi, the northernmost seismic shot
point ATH; Chyulu North and Chyulu South are
seismic shot points at the NW and SE edges of the
Chyulu Range. Mwatate station is 46 km north of the
seismic shot point RUK of Novak et al., 1997a) and
just south of Taita Hills. The average station spacing
over the Chyulu Hills (the main zone of anomalous
seismic signature) is 33 km, which is greater than the
25-km depth of exploration interest in this paper. The
wide spacing between sounding stations means that
Fig. 1. Geology map of Kenya showing location of TEM–MT stations in the Chyulu Hills volcanic field. The stations are: Lukenya (Luk),
Selengei (Sel), Chyulu North (ChN), Chyulu West (ChW), Chyulu 2 (Ch2), Chyulu South (ChS), Wyandani (Wya), and Mwatate (Mwa).
Fig. 2. Combined MT and TEM apparent resistivity data for Chyulu Hills stations. The MT xy and yx data (shown as round symbols with error
bars in the left-hand and right-hand plots) have been corrected for static shift using the central-loop TEM data (triangular symbols) plotted at
their equivalent frequencies based on Meju (1996). Note that the AMT data with larger error bars overlap with the higher quality long-period
MT data (cf. Table 1).
V. Sakkas et al. / Tectonophysics 346 (2002) 169–185172

V. Sakkas et al. / Tectonophysics 346 (2002) 169–185 173

short wavelengths features will not be resolved in this
pilot experiment.
TEM and high-frequency MT data were not re-
corded at station Wyandani due to a technical problem
at the terminal stage of the field experiments. At every
other station, TEM soundings were performed using
the central-loop and single-loop configurations with a
100-m-sided square loop acting as the transmitter (Tx).
The same loop serves as the receiver in the single-loop
case since in the TEM method, we only measure the
transient responses of the ground to inductive energ-
ization when the Tx is switched off. In the case of
central-loop sounding, the receiver was a small multi-
turn coil with an effective area of 10000 m2 and was
placed at the centre of the Tx loop. The MT measure-
ments employed induction coils and 100-m-long
grounded electric dipoles. The recordings consisted
of two orthogonal horizontal (magnetic north–south
and east–west) components of both the electric and
magnetic fields on the ground surface and the vertical
magnetic field component. The MT electric dipoles
were arranged in an L-shaped configuration and cov-
ered the same ground as the TEMTx loop to ensure that
both methods sampled the same geology, a practical
necessity for accurate static shift correction (Meju,
1996). The MT data cover a frequency band width of
120–0.0001 Hz while the TEM soundings effectively
cover a frequency band of 1000–10 Hz (based on
Meju, 1996, Eq. (1)) as in the examples presented in
Fig. 2. The MT surveys employed a short-period field
system developed at Edinburgh University and long-
period RAP systems developed by Erich Steveling at
the University of Gottingen (see Simpson et al., 1997
for details), and data were recorded in six frequency
sub-bands (Table 1).
The TEM transient voltage responses have been
adjusted for transmitter turn-off effects (Raiche, 1984)
and converted to apparent resistivities using a non-
linear iterative scheme with initial values furnished by
the late-time approximation (Kaufman and Keller,
1983). The MT data were processed using standard
tensorial techniques (Swift, 1967; Egbert and Booker,
1986) with attention being paid also to data sets
affected by power line noise (Fontes et al., 1988).
The resulting impedance tensor elements were used to
compute the apparent resistivities, phases, azimuths,
induction arrows, and other geoelectrical indices
(Parkinson, 1959; Swift, 1967; Bahr, 1988, 1991;
Groom and Bailey, 1989, 1991; Groom and Bahr,
1992) necessary for subsurface structural interpreta-
tion. We obtained the apparent resistivities in the
measurement directions (xy or north–south, and yx
or east–west polarisations) for preliminary assess-
ments and corrected them for static shift using cen-
tral-loop TEM data since they look fairly similar in
shape at most stations (see Fig. 2). Note the good
overlap between the AMT (128 Hz to < 100 s) data
and the higher-quality, long-period MT data (40–
>1000 s). The gross features of these MT curves
suggest a simple resistive –conductive– resistive
sequence underneath variable overburden evinced by
the TEM response.
2.1. Distortion analysis and regional geoelectrical
strike
In order to determine whether Groom and Bailey
(1989) decomposition was necessary for the MT data
sets, the data have been analysed for telluric distortion
and classified using the methods described in Bahr
Table 1
Classification of telluric distortions in the Chyulu Hills data subsets (six frequency bands) using the method of Bahr (1991)
Stations 128–16 Hz 16–2 Hz 2 Hz–4 s 4–32 s 40–1000 s >1000 s
Lukenya 3 1 3 – 7 7
Selengei 1 1 7 7 7 7
Chyulu North 7 7 7 7 7 –
Chyulu West – – 2 7 3 –
Chyulu 2 1 – 7 7 – –
Chyulu South 7 1 – – 3 –
Mwatate 1 1 7 7 7 7
The first four frequency bands refer to short period (AMT) measurements while the last two refer to long period (LMT) measurements using
different field equipment (cf. Fig. 2).
V. Sakkas et al. / Tectonophysics 346 (2002) 169–185174

(1991). The resulting classifications (1–7) are given in
Table 1. Some of the data bands show characteristics of
weak local distortion (class 3) with the high-frequency
bands showing classes 1 and 2 features, and can be
interpreted using conventional methods. However, the
data at most sites fall into class 7 (especially at long
periods), with skew values (Swift, 1967) greater than
0.3 suggesting a regional 3-D structure, for which the
superimposition model (Groom and Bailey, 1989) is
inappropriate. Interestingly, the Groom–Bailey de-
composition method yielded fairly consistent regional
geoelectrical strike (NE–SW or NW–SE) directions
for the neighbouring stations as in the examples pre-
sented in Fig. 3 for selected frequencies, and we may
elect to interpret the MT profile data using a 2-D
approximation.
Fig. 3. Pictorial representation of regional geoelectric azimuths determined using the Groom–Bailey (1989) method for selected periods for the
MT data. The azimuths are indicated by the site-centred dark bars and are superimposed on the regional fault fabric (re-drawn from Smith and
Mosley, 1993).
V. Sakkas et al. / Tectonophysics 346 (2002) 169–185 175

The ratios of the vertical-to-horizontal magnetic
fields from MT records are often displayed graphically
as ‘induction arrows’ (Parkinson, 1959, 1983). These
facilitate a qualitative areal assessment of the degree of
conductivity variations in the subsurface. In an area
with a dominant structural trend, the induction arrows
will be orthogonal to and point towards anomalous
current concentrations such as that which will be
induced in a linear conductive body (Jones and Price,
1970). The Parkinson induction arrows for Chyulu
Hills are of small magnitudes and unstable (i.e., do
not define a dominant trend at all frequencies) for the
seven stations shown in Fig. 4 but appear to point to the
presence of linear conductors near stations ChN and
Fig. 4. Real Parkinson induction arrows for (a) 34 Hz, (b) 7 Hz, (c) 0.04 Hz, and (d) 0.001 Hz superimposed on the regional fault fabric. Station
Wya is not shown since there are no high-frequency recordings at this site.
V. Sakkas et al. / Tectonophysics 346 (2002) 169–185176
Ch2. It is noteworthy that away from the main ridge
(stations ChN, ChW, and Ch2), the induction arrows at
low frequencies (ca. 0.001 Hz) seem to suggest the
presence of a NW–SE conductive axis to the east of
the Chyulu Hills. Simpson et al. suggested that this
may be the signature of the NW–SE basement struc-
tural lineations (Shackleton, 1986), some of which
possibly controlled the localisation of the volcanic
chain (Smith and Mosley, 1993). It would thus appear
that the interpretation of the composite (high and low
frequency) data set in terms of a regional 2-D model
could be fraught with difficulties since the composite
MT data seem to show 3-D characteristics over the
main ridge. However, full-domain 3-D modelling
(Druskin and Knizhnerman, 1988; Mackie et al.,
1993; Smith, 1996a,b) is beyond the scope of the
present pilot study and more importantly, it will be
more appropriate for 3-D data arrays. Our single
survey line with poor spatial coverage does not justify
a rigorous 3-D modelling approach since the resulting
model cannot be unequivocal. For consistency with the
2-D seismic refraction and gravity models for the
region (Novak et al., 1997a,b), a 2-D approach will
be adopted in this pilot study. For 2-D modelling, MT
responses were obtained in the NW–SE (N40jW)
direction and for the orthogonal direction (N50jE),which for notational simplicity will be respectively
termed the transverse magnetic (TM) and transverse
electric (TE) modes data here. The sounding curves for
the TE and TM modes have been respectively cor-
rected for static shift using central-loop and single-loop
TEM data as suggested by Meju et al. (1999, Fig. 6).
3. 2-D MT data inversion for deep crustal
structure
For 2-D MT data inversion, we have used a popular
nonlinear conjugate-gradient, finite-difference-based
inversion program (Mackie, 1996; Mackie et al.,
1988; Mackie and Madden, 1993). The TE and TM
apparent resistivities and phases (1496 data points) and
their associated standard observational errors consti-
tute the data for inversion; the threshold rms data misfit
was set at 1.4. Two kinds of inverse modelling studies
were undertaken—one involving the use of structured
initial models derived with the aid of constraints
furnished by 1-D inversion of TEM and MT data sets
and available seismic models, and the other using only
featureless (half-space or smooth) models. The under-
girding philosophy is that any common features in the
resulting 2-D models are warranted by the data and
may be deemed geologically significant.
3.1. Inversion for maximum structure
We first inverted the MT data using a starting model
derived by joint 1-D inversion of TEM and MT data
(cf. Meju, 1996) and augmented with the middle–
lower crustal-layered aspects furnished by the seismic
model for this line (Novak et al., 1997b, Fig. 6). Note
that there was no attempt to force the MT model into
conformity with the seismic model; the iterative
parameter update scheme was free to modify our initial
model as appropriate to match the field data. The
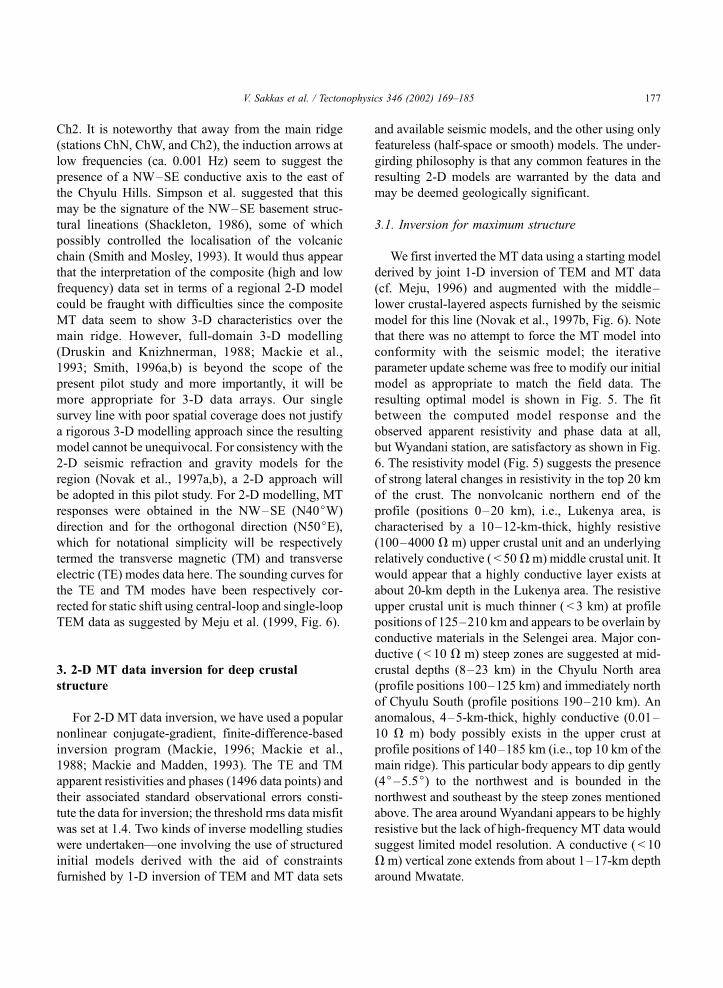
resulting optimal model is shown in Fig. 5. The fit
between the computed model response and the
observed apparent resistivity and phase data at all,
but Wyandani station, are satisfactory as shown in Fig.
6. The resistivity model (Fig. 5) suggests the presence
of strong lateral changes in resistivity in the top 20 km
of the crust. The nonvolcanic northern end of the
profile (positions 0–20 km), i.e., Lukenya area, is
characterised by a 10–12-km-thick, highly resistive
(100–4000 V m) upper crustal unit and an underlying
relatively conductive ( < 50Vm) middle crustal unit. It
would appear that a highly conductive layer exists at
about 20-km depth in the Lukenya area. The resistive
upper crustal unit is much thinner ( < 3 km) at profile
positions of 125–210 km and appears to be overlain by
conductive materials in the Selengei area. Major con-
ductive ( < 10 V m) steep zones are suggested at mid-
crustal depths (8–23 km) in the Chyulu North area
(profile positions 100–125 km) and immediately north
of Chyulu South (profile positions 190–210 km). An
anomalous, 4–5-km-thick, highly conductive (0.01–
10 V m) body possibly exists in the upper crust at
profile positions of 140–185 km (i.e., top 10 km of the
main ridge). This particular body appears to dip gently
(4j–5.5j) to the northwest and is bounded in the
northwest and southeast by the steep zones mentioned
above. The area around Wyandani appears to be highly
resistive but the lack of high-frequency MT data would
suggest limited model resolution. A conductive ( < 10
Vm) vertical zone extends from about 1–17-km depth
around Mwatate.
V. Sakkas et al. / Tectonophysics 346 (2002) 169–185 177
3.2. Inversion for minimum structure
An effective practical strategy when inverting a
scanty set of noisy field data is to seek the smoothest
model that can reproduce the main features of the data
(e.g., Constable et al., 1987; Smith and Booker, 1988;
deGroot-Hedlin and Constable, 1990; Meju and Hut-
ton, 1992). For the Chyulu Hills 2-D data inversion
problem, the subsurface was discretised into a large
number of rectangular blocks of initially constant
resistivity (i.e., a half-space initial model) and we
sought an optimum model with minimized differences
between the resistivities of adjacent blocks in both the
vertical and horizontal directions using the Twomey–
Tikhonov (Twomey, 1963; Tikhonov, 1963) deriva-
tive regularisation measures. In the ideal situation
with a dense network of measurement stations, only
those features that are essential for fitting the field
data will be retained or recovered in the resulting
optimal model. In the present case with widely spaced
stations, only those features in the neighbourhood of
the sounding stations may be accepted as justified by
the data. The use of different half-space starting
models (cf. Bai et al., 2001) provides a simple con-
sistency check for model resolution.
The TE and TM modes data were simultaneously
inverted using various half-space initial models and
Twomey–Tikhonov smoothness constraints. For brev-
ity, only the resulting models for the 100 and 500 V m
half-spaces (Fig. 7a and b) will be discussed here. For
these 2-D models, the fit between the calculated and
observed apparent resistivity and phase data is margin-
ally better than that shown in Fig. 6. The model
generated from the 100-V m starting model (Fig. 7a)
appears to suggest the presence of major conductivity
anomalies in the areas of Late Pleistocene volcanism;
note the conductive ( < 10V m) zones in the upper and
middle crusts with associated narrow steep zones
underneath the main ridge and near its margins. The
model obtained from the 500-V m half-space initial
Fig. 5. A resistivity model derived by 2-D inversion with a structured initial model. The numbers at the top of the section are the distances in km
along the coincidentally located seismic line of Novak et al. (1997a).
V. Sakkas et al. / Tectonophysics 346 (2002) 169–185178

Fig. 6. A comparison of the actual field data and the computed response curves for the 2-D model of Fig. 5.
V.Sakka
set
al./Tecto
nophysics
346(2002)169–185
179

Fig.6(continued).
V. Sakkas et al. / Tectonophysics 346 (2002) 169–185180

Fig. 7. Examples of 2-D models generated by regularised inversion using different smooth initial models. Shown are the models from (a) 100 V
m and (b) 500 V m initial half-space models. These models are statistically equivalent and highlight the nonuniqueness of models constructed
from scanty field observations. Only those features common to both models are constrained by the data.
V. Sakkas et al. / Tectonophysics 346 (2002) 169–185 181

model is shown in Fig. 7b and suggests a somewhat
layered aspect with relative enhancements of the resis-
tive features seen in the other models. The resistive
upper crustal unit is clearly shown to vary laterally; it is
more than 10 km thick in the Lukenya area, about 5–9
km thick over the volcanic field, less than 1 km around
profile position 112 km (ChN station), and about 5 km
thick near Mwatate. The thickness of the resistive
cover unit is not well resolved underneath the main
ridge. It would appear that the upper crust contains
conductive bodies in its bottom part around profile
positions 60 and 250 km. The middle crust (9–20-km
depth) appears to be anomalously conductive ( < 10 V
m) southward from Selengei.
The main features common to these models (and to
the model of Fig. 5) are therefore: (i) the resistive
upper crust which is thinnest over profile positions
100–150 km, (ii) the horizontal conductive ( < 10 V
m) zones in the upper crust across the Chyulu Hills
and north of Mwatate, and (iii) the steep anomalous
deep-reaching conductive zones near profile positions
100–150 and 175–225 km (i.e., bordering the main
ridge). These low-resistivity anomalies may be geo-
logically significant and could be vestiges of the
magmatic activities that took place in the region; the
steep zones bordering the main ridge may be faults or
magma conduits.
4. Discussion
The seismic refraction P-wave model of Novak et
al. (1997a, Fig. 8) shows a simple-layered crustal
structure with prominent refractors at 9–10-km depth
and at 19–21-km depth above a 22–23-km-thick
lower crust with no major lateral variations but their
revised interpretative model (Novak et al., 1997b, Fig.
6) suggests the presence of a low-velocity body in the
lower crust (30–44 km deep) beneath the volcanic
field. There is thus a good agreement between the
depth to the base of the resistive upper crustal and
conductive mid-crustal geoelectric units in the electro-
magnetic transect and the independently obtained
depths to the crustal refractors of Novak et al.
(1997a). Ritter and Kaspar (1997) also demonstrated
the presence of lateral velocity contrasts of about 5%
with a prominent low-velocity zone located at profile
positions of 100–150 km, directly beneath the vol-
canic range down to 70-km depth; Novak et al. (1997b,
Fig. 7b) show two low-velocity zones around profile
positions of 100 and 150–175 km. Despite the wide
spacings between our TEM–MT stations which
limited model resolution to a large extent, the con-
structed resistivity models strongly suggest that there
are major laterally varying structures in the top 20 km
of the crust and more significantly, that the area around
profile positions 100–200 km contains major low-
resistivity bodies at depths of about 4 km down to at
least 19 km in the 2-D models.
We suggest that the low-resistivity features in the
MT models are related to the low-velocity zones
detected at greater depth in the same geographic
location by the abovementioned investigators. If this
contention is correct, then our MT results provide a
necessary upper crustal constraint on the structure of
the anomalous zone in Chyulu Hills. Note that Novak
et al. (1997b) favoured an interpretation of the anom-
alous seismic signature in terms of partial melt (or
magma chambers) in the lower crust or upper mantle.
Since the volcanic rocks on the surface contain abun-
dant crustal-derived xenoliths but lack lower crustal
and mantle-derived xenoliths (see Novak et al.,
1997b), we speculate that the conductors found below
the main ridge especially around profile positions
100–200 km could be magma chambers or conduits.
This geographical location is also associated with a
low gravity signature (see Novak et al., 1997b, Fig. 8).
The other conductive anomaly south of the Chyulu
Hills may be a hallmark of the volcanic activity of the
past century (Saggerson, 1963). Overall, there is good
agreement between the seismic, gravity, and MT
models for the Chyulu Hills and we may suggest that
MT will be a logical compliment to seismics in the
exploration of the deep crust in this terrain.
5. Conclusion and suggestions for further studies
The results of quantitative interpretation of the
invariant and rotated MTapparent resistivity and phase
sounding curves suggest that the top 25 km of the
earth’s crust in the Chyulu Hills volcanic field com-
prises three main geoelectric units. The topmost unit is
highly resistive and shows a progressive southward
thinning; it is thickest in the Lukenya area located 30
km south of Nairobi, and thinnest around Mwatate
V. Sakkas et al. / Tectonophysics 346 (2002) 169–185182

located 160 km north of Mombasa. Directly beneath
the Chyulu Hills, the uppermost and the underlying
geoelectric units have been dissected by zones of low
resistivities ( < 10Vm) interpreted as possible vestiges
of faulting or magmatic activities in the area. The
southern and northern edges and the midsection (near
Chyulu West) of the main range contain anomalous
steep conductors in the depth range of 1–19 km which
may be deep conduits for magma migration in Late
Pleistocene to recent times. It is possible that the
anomalous conductive (0.01–1 V m) body directly
beneath Chyulu West and Chyulu Range stations may
be an upper crustal magma chamber.
This study was severely hampered by the lack of
dense spatial coverage of the field measurements, thus
militating against any rigorous 3-D EM modelling. It
will be unrealistic to undertake 3-D modelling of our
current data sets acquired along a single profile.
Therefore, it is recommended that a detailed 3-D field
survey be undertaken in this region involving broad-
band (1000–0.00001 Hz) MT and TEM soundings
with station spacings not exceeding 2–5 km (as for
the seismic and gravity components of the KRISP94-
MT collaborative project). Three-dimensional TEM–
MT modelling will be appropriate for the resulting
dense network of observations. Using an available 3-
D modelling code (Mackie et al., 1993), Simpson
(2000) recently produced an MT model for southern
Kenya Rift emphasising the influence of the preexist-
ing NW–SE shear zones (suggested by Smith and
Mosley, 1993) on the MT responses recorded along
another profile running east–west across the main rift.
Although simplistic due to the scanty data set avail-
able, the model is a useful step towards understanding
the deep structure of the region. It will be desirable to
undertake a similar study for the Chyulu Hills line but
with additional depth soundings and with the 3-D
modelling interpretation adequately incorporating the
known geological features of the area.
Acknowledgements
This study was conducted as part of the KRISP94-
MT project and was funded by the European Union
Human Capital and Mobility program under contract
ERBCHRXCT930308. We thank P. Denton, M. Eisel,
P. Denny, S. Onacha, B.P. Ouma, C. Birt, and S.
Sundqvist for assistance with the fieldwork. We are
grateful to the UK Natural Environment Research
Council Equipment Pool for a loan of the S.P.A.M.
Mk 2B field equipment. The field studies benefited
from the use of the Sirotem Mk2 equipment belonging
to Leicester University and RAP LMT data loggers
belonging to GeoForschungsZentrum Potsdam. We
thank the Kenyan Government for permission to
undertake this study.
References
Bai, D.B., Meju, M.A., Liao, Z., 2001. Magnetotelluric images of
deep structure of the Rehai geothermal field near Tengchong,
southern China. Geophys. J. Int. 147, 677–687.
Bahr, K., 1988. Interpretation of the magnetotelluric impedance
tensor: regional induction and local telluric distortion. J. Geo-
phys. 62, 119–127.
Bahr, K., 1991. Geological noise in magnetotelluric data: a classi-
fication of distortion types. Phys. Earth Planet. Inter. 66, 24–38.
Baker, B.H., 1987. Outline of the petrology of the Kenya Rift
alkaline province. In: Fitton, J.G., Upton, B.G.J. (Eds.), Alka-
line Igneous Rocks. Geol. Soc. Publ., vol. 30, pp. 293–312.
Baker, B.H., Wohlenberg, J., 1971. Structure and evolution of the
Kenya Rift Valley. Nature 229, 538–542.
Banks, R.J., Beamish, D., 1979.Melting in the crust and uppermantle
beneath the Kenya Rift: evidence from Geomagnetic Deep
Sounding experiments. J. Geol. Soc. (London) 136, 225–233.
Banks, R.J., Ottey, P., 1973. Geomagnetic deep sounding in and
around the Kenya Rift Valley. Geophys. J. R. Astron. Soc. 36,
321–335.
Beamish, D., 1977. The mapping of induced currents around the
Kenya Rift: a comparison of techniques. Geophys. J. R. Astron.
Soc. 50, 311–332.
Berdichevsky, M.N, Dmitriev, V.I., 1976. Distortion of magnetic
and electrical fields by near-surface inhomogeneities. Acta
Geod., Geophys. Mont. Hung. 11, 447–483.
Birt, C.S., Maguire, P.K.H., Khan, M.A., Thybo, H., Keller, G.R.,
Patel, J., 1997. The influence of pre-existing structures on the
evolution of the southern Kenya Rift Valley—evidence from
seismic and gravity studies. In: Fuchs, K., Altherr, R., Muller,
B., Prodehl, C. (Eds.), Structure and Dynamic Processes in the
Lithosphere of the Afro-Arabian Rift System. Tectonophysics,
vol. 278, pp. 211–242.
Bosworth, W., 1987. Off-axis volcanism in the Gregory Rift, East
Africa: implications of the models of continental rifting. Geol-
ogy 15, 397–400.
Christopherson, K.R., 1991. Application of magnetotellurics to pe-
troleum exploration in Papua New Guinea: a model for frontier
areas. Geophysics: The Leading Edge of Exploration 10, 21–
27.
Class, C., Altherr, R., Volker, F., Eberz, G., McCulloch, M.T., 1994.
Geochemistry of Pliocene to Quaternary alkali basalts from the
Huri Hills, northern Kenya. Chem. Geol. 113, 1–22.
V. Sakkas et al. / Tectonophysics 346 (2002) 169–185 183

Constable, S.C., Parker, R.L., Constable, C.G., 1987. Occam’s in-
version: a practical algorithm for generating smooth models
from electromagnetic sounding data. Geophysics 52, 289–300.
deGroot-Hedlin, C., Constable, S., 1990. Occam’s inversion to gen-
erate smooth two-dimensional models from magnetotelluric da-
ta. Geophysics 55, 1613–1624.
Druskin, V.L., Knizhnerman, L.A., 1988. A spectral semi-discrete
method for the numerical solution of 3-D nonstationary prob-
lems in electrical prospecting. Phys. Solid Earth 24, 63–74.
Egbert, G.D., Booker, J.R., 1986. Robust estimation of geomagnetic
transfer functions. Geophys. J. R. Astron. Soc. 87, 173–194.
Fontes, S.L., Harinarayana, T., Dawes, G.J.K., Hutton, V.R.S.,
1988. Processing of noisy magnetotelluric data using digital
filters and additional data selection criteria. Phys. Earth Planet.
Inter. 52, 30–40.
Gregory, J.W., 1921. The Rift Valleys and Geology of East Africa.
Seely Service, London, 479 pp.
Groom, R.W., Bahr, K., 1992. Corrections for near-surface effects:
decomposition of the magnetotelluric impedance tensor and
scaling corrections for regional resistivities: a tutorial. Surv.
Geophys. 13, 341–379.
Groom, R.W., Bailey, R.C., 1989. Decomposition of magnetotellu-
ric impedance tensors in the presence of local three-dimensional
galvanic distortion. J. Geophys. Res. 94, 1913–1925.
Groom, R.W., Bailey, R.C., 1991. Analytic investigations of the
effects of the near surface three-dimensional galvanic scatters
on MT tensor decompositions. Geophysics 56, 496–518.
Haug, G.H., Strecker, M.R., 1995. Volcano-tectonic evolution of the
Chyulu Hills and implications for the regional stress field in
Kenya. Geology 23, 165–168.
Henjes-Kunst, F., Altherr, R., 1992. Metamorphic petrology of xen-
oliths from Kenya and northern Tanzania and implications for
geotherms and lithospheric structures. J. Petrol. 33, 1125–1156.
Jones, A.G., 1988. Static shift of magnetotelluric data and its re-
moval in a sedimentary basin environment. Geophysics 53,
967–978.
Jones, A.G., 1993. Electromagnetic images of ancient and modern
subduction zones. Tectonophysics 219, 29–45.
Jones, F.W., Price, A.T., 1970. The perturbations of alternating geo-
magnetic fields by conductivity anomalies. Geophys. J. R. As-
tron. Soc. 20, 317–334.
Karson, J.A., Curtis, P.C., 1989. Tectonic and magmatic processes
in the eastern branch of the East African rift and implications for
magmatically active continental rifts. J. Afr. Earth Sci. 8, 431–
453.
Kaufman, A.A., Keller, G.V., 1983. Frequency and Transient
Soundings. Elsevier, Amsterdam.
Khan, M.A., Mansfield, J., 1971. Gravity measurements in the
Gregory Rift. Nature 229, 72–75.
Macdonald, R., 1994. Petrological evidence regarding the evolution
of the Kenya Rift Valley. In: Prodehl, C., Keller, G.R., Khan,
M.A. (Eds.), Crustal and Upper Mantle Structure of the Kenya
Rift. Tectonophysics, vol. 236, pp. 373–390.
Macdonald, R., Williams, L.A.J., Gass, I.G., 1994. Tectonomag-
matic evolution of the Kenya Rift Valley: some geological per-
spectives. J. Geol. Soc. (London) 151, 879–888.
Mackie, R.L., 1996. Two-dimensional inversion of magnetotelluric
data: Software. Internet site: MTNET http://nazca.cg.emr.ca/
mtnet/mtnet.html.
Mackie, R.L., Madden, T.R., 1993. Conjugate direction relaxation
solutions for 3-D magnetotelluric modelling. Geophysics 58,
1052–1057.
Mackie, R.L., Bennett, B.R., Madden, T.R., 1988. Long period
magnetotelluric measurements near the central California coast:
a land-locked view of the conductivity structure under the Pa-
cific Ocean. Geophys. J. R. Astron. Soc. 95, 181–194.
Mackie, R.L., Madden, T.R., Wannamaker, P.E., 1993. Three-di-
mensional MT modelling using difference equations—theory
and comparison to integral equation solutions. Geophysics 58,
215–226.
Meju, M.A., 1996. Joint inversion of TEM and distorted MT sound-
ings: some effective practical considerations. Geophysics 61,
56–65.
Meju, M.A., Hutton, V.R.S., 1992. Iterative most-squares inversion:
application to magnetotelluric data. Geophys. J. Int. 108, 758–
766.
Meju, M.A., Fontes, S.L., Oliveira, M.F.B., Lima, J.P.R., Uluger-
gerli, E.U., Carrasquilla, A.A., 1999. Regional aquifer mapping
using combined VES–TEM–AMT/EMAP methods in the
semi-arid eastern margin of Parnaiba Basin, Brazil. Geophysics
64, 337–356.
Morley, C.K., Wescott, W.A., Stone, D.M., Harper, R.M., Wigger,
S.T., Karanja, F.M., 1992. Tectonic evolution of the northern
Kenya Rift. J. Geol. Soc. 149, 333–348.
Novak, O., Prodehl, C., Jacob, A.W.B., Okoth, W., 1997a. Crustal
structure of the southern flank of the Kenya Rift deduced from
wide-angle P-wave data. In: Fuchs, K., Altherr, R., Muller, B.,
Prodehl, C. (Eds.), Structure and Dynamic Processes in the
Lithosphere of the Afro-Arabian Rift System. Tectonophysics,
vol. 278, pp. 171–186.
Novak, O., Ritter, J.R.R., Altherr, R., Garasic, V., Volker, F., Kluge,
C., Kaspar, T., Byrne, G.F., Sobolev, S.V., Fuchs, K., 1997b. An
integrated model for the deep structure of the Chyulu Hills
volcanic field, Kenya. In: Fuchs, K., Altherr, R., Muller, B.,
Prodehl, C. (Eds.), Structure and Dynamic Processes in the
Lithosphere of the Afro-Arabian Rift System. Tectonophysics,
vol. 278, pp. 187–209.
Omenge, J.M., Okele, R.E., 1992. Geology of the Chyulu-Oloito-
kitok area. Kenya Mines and Geology Department, Nairobi,
Geological Survey of Kenya, Report No. 112.
Parkinson, W.D., 1959. Directions of rapid geomagnetic fluctua-
tions. Geophys. J. R. Astron. Soc. 2, 1–14.
Parkinson, W.D., 1983. Introduction to Geomagnetism Scottish
Academic Press, Edinburgh, 433 pp.
Pellerin, L., Hohmann, G.W., 1990. Transient electromagnetic in-
version: a remedy for magnetotelluric static shifts. Geophysics
55, 1242–1250.
Peters, W.S., de Angelis, M., 1987. The Radio Hill Ni–Cu massive
sulphide deposit: a geophysical case history. Explor. Geophys.
18, 160–166.
Raiche, A.P., 1984. The effect of ramp function turnoff on the TEM
response of a layered earth. Bull. Aust. Soc. Explor. Geophys.
15, 37–42.
Ritter, J.R.R., Kaspar, T., 1997. A tomography of the Chyulu Hills,
V. Sakkas et al. / Tectonophysics 346 (2002) 169–185184

Kenya. In: Fuchs, K., Altherr, R., Muller, B., Prodehl, C. (Eds.),
Structure and Dynamic Processes in the Lithosphere of the Afro-
Arabian Rift System. Tectonophysics, vol. 278, pp. 149–169.
Rooney, D., Hutton, V.R.S., 1977. A magnetotelluric and magneto-
variational study of the Gregory Rift Valley, Kenya. Geophys. J.
R. Astron. Soc. 51, 91–119.
Saggerson, E.P., 1963. Geology of the Simba–Kibwezi area. Geol.
Surv. Kenya, Rep. 58, 70 pp.
Sakkas, V.A., 1999. Combined transient electromagnetic and mag-
netotelluric study of the southern Kenya Rift Valley. PhD thesis,
University of Leicester, UK, 250 pp.
Shackleton, R.M., 1986. Precambrian collision tectonics in Africa.
In: Coward, M.P., Ries, A.C. (Eds.), Collision Tectonics. Geol.
Soc. London, Spec. Publ., vol. 19, pp. 329–349.
Simpson, F., 2000. A three-dimensional electromagnetic model of
the southern Kenya Rift: departure from two-dimensionality as a
possible consequence of a rotating stress field. J. Geophys. Res.
105, 19321–19334.
Simpson, F.L., Haak, V., Khan, M.A., Sakkas, V., Meju, M.A.,
1997. The KRISP-94 magnetotelluric survey of early 1995: first
results. Tectonophysics 278, 261–271.
Smith, M., 1994. Stratigraphic and structural constraints on mech-
anisms of active rifting in the Gregory Rift, Kenya. In: Prodehl,
C., Keller, G.R., Khan, M.A. (Eds.), Crustal and Upper Mantle
Structure of the Kenya Rift. Tectonophysics, vol. 236, pp. 3–23.
Smith, J.T., 1996a. Conservative modeling of 3-D electromagnetic
fields: Part I. Properties and error analysis. Geophysics 61,
1308–1318.
Smith, J.T., 1996b. Conservative modeling of 3-D electromagnetic
fields: Part II. Biconjugate gradient solution and an accelerator.
Geophysics 61, 1319–1324.
Smith, J.T., Booker, J.R., 1988. Magnetotelluric inversion for mini-
mum structure. Geophysics 53, 1565–1576.
Smith, M., Mosley, P., 1993. Crustal heterogeneity and basement
influence on the development of the Kenya Rift, East Africa.
Tectonics 12, 591–606.
Sternberg, B.K., Washburne, J.C., Pellerin, L., 1988. Correction for
the static shift in the magnetotellurics using transient electro-
magnetic soundings. Geophysics 53, 1459–1468.
Swift, C.M., 1967. A magnetotelluric investigation of electrical
conductivity anomaly in the southwestern United States. PhD
Thesis, M.I.T. In: Vozoff, K. (Ed.), 1986, Magnetotelluric Meth-
ods, SEG, 1986.
Tikhonov, A.N., 1963. Regularization of ill-posed problems. Dokl.
Akad. Nauk SSSR 153, 1–6.
Twomey, S., 1963. On the numerical solution of Fredholm integral
equations of the first kind by the inversion of the linear system
produced by quadrature. J. Assoc. Comput. Man. 10, 97–101.
Wheildon, P., Morgan, P., Williamson, K.H., Evans, T.R., Swan-
berg, C.A., 1994. Heat flow in the Kenya Rift zone. In: Prodehl,
C., Keller, G.R., Khan, M.A. (Eds.), Crustal and Upper Mantle
Structure of the Kenya Rift. Tectonophysics, vol. 236, pp. 131–
149.
Williams, L.A.J., 1978. Character of Quaternary volcanism in the
Gregory Rift Valley. In: Bishop, W.W. (Ed.), Geological Back-
ground to Fossil Man. Scottish Academic Press, Edinburgh, pp.
55–69.
V. Sakkas et al. / Tectonophysics 346 (2002) 169–185 185