Magnetocardiography measurements with 4He vector optically ...
14
HAL Id: cea-01560997 https://hal-cea.archives-ouvertes.fr/cea-01560997 Submitted on 12 Jul 2017 HAL is a multi-disciplinary open access archive for the deposit and dissemination of sci- entific research documents, whether they are pub- lished or not. The documents may come from teaching and research institutions in France or abroad, or from public or private research centers. L’archive ouverte pluridisciplinaire HAL, est destinée au dépôt et à la diffusion de documents scientifiques de niveau recherche, publiés ou non, émanant des établissements d’enseignement et de recherche français ou étrangers, des laboratoires publics ou privés. Magnetocardiography measurements with 4 He vector optically pumped magnetometers at room temperature S. Morales, M.C. Corsi, W. Fourcault, F. Bertrand, G. Cauffet, C. Gobbo, F. Alcouffe, F. Lenouvel, M. Le Prado, F. Berger, et al. To cite this version: S. Morales, M.C. Corsi, W. Fourcault, F. Bertrand, G. Cauffet, et al.. Magnetocardiography measure- ments with 4 He vector optically pumped magnetometers at room temperature . Physics in Medicine and Biology, IOP Publishing, 2017, 10.1088/1361-6560/aa6459. cea-01560997
Transcript of Magnetocardiography measurements with 4He vector optically ...

HAL Id: cea-01560997https://hal-cea.archives-ouvertes.fr/cea-01560997
Submitted on 12 Jul 2017
HAL is a multi-disciplinary open accessarchive for the deposit and dissemination of sci-entific research documents, whether they are pub-lished or not. The documents may come fromteaching and research institutions in France orabroad, or from public or private research centers.
L’archive ouverte pluridisciplinaire HAL, estdestinée au dépôt et à la diffusion de documentsscientifiques de niveau recherche, publiés ou non,émanant des établissements d’enseignement et derecherche français ou étrangers, des laboratoirespublics ou privés.
Magnetocardiography measurements with 4He vectoroptically pumped magnetometers at room temperatureS. Morales, M.C. Corsi, W. Fourcault, F. Bertrand, G. Cauffet, C. Gobbo, F.
Alcouffe, F. Lenouvel, M. Le Prado, F. Berger, et al.
To cite this version:S. Morales, M.C. Corsi, W. Fourcault, F. Bertrand, G. Cauffet, et al.. Magnetocardiography measure-ments with 4He vector optically pumped magnetometers at room temperature . Physics in Medicineand Biology, IOP Publishing, 2017, �10.1088/1361-6560/aa6459�. �cea-01560997�

Home Search Collections Journals About Contact us My IOPscience
Magnetocardiography measurements with 4He vector optically pumped magnetometers at
room temperature
This content has been downloaded from IOPscience. Please scroll down to see the full text.
Download details:
IP Address: 132.168.159.47
This content was downloaded on 15/03/2017 at 15:43
Manuscript version: Accepted Manuscript
Morales et al
To cite this article before publication: Morales et al, 2017, Phys. Med. Biol., at press:
https://doi.org/10.1088/1361-6560/aa6459
This Accepted Manuscript is: © 2017 Institute of Physics and Engineering in Medicine
During the embargo period (the 12 month period from the publication of the Version of Record of this
article), the Accepted Manuscript is fully protected by copyright and cannot be reused or reposted
elsewhere.
As the Version of Record of this article is going to be / has been published on a subscription basis,
this Accepted Manuscript is available for reuse under a CC BY-NC-ND 3.0 licence after a 12 month embargo
period.
After the embargo period, everyone is permitted to use all or part of the original content in this
article for non-commercial purposes, provided that they adhere to all the terms of the licence
https://creativecommons.org/licences/by-nc-nd/3.0
Although reasonable endeavours have been taken to obtain all necessary permissions from third parties to
include their copyrighted content within this article, their full citation and copyright line may not be
present in this Accepted Manuscript version. Before using any content from this article, please refer to
the Version of Record on IOPscience once published for full citation and copyright details, as
permissions will likely be required. All third party content is fully copyright protected, unless
specifically stated otherwise in the figure caption in the Version of Record.
When available, you can view the Version of Record for this article at:
http://iopscience.iop.org/article/10.1088/1361-6560/aa6459

Magnetocardiography measurements with 4He vector
optically pumped magnetometers at room temperature
S. Morales 1*
, M.C. Corsi1*
, W. Fourcault
1, F. Bertrand
1, G. Cauffet
2, C. Gobbo
1,
F. Alcouffe1, F. Lenouvel
1, M. Le Prado
1, F. Berger
1,
G. Vanzetto
3,4 and E. Labyt
1
1. CEA, LETI, MINATEC Campus, F-38054 Grenoble, France 2. Univ. Grenoble Alpes, G2Elab, F-38000 Grenoble, France; CNRS,
G2Elab, F-38000 Grenoble, France 3. Department of Cardiology, University Hospital, Grenoble, France 4. INSERM U1039, Bioclinic Radiopharmaceutics Laboratory, Grenoble, France
* These authors contributed equally to this work
E-mail: corresponding author [email protected]
In this paper, we present a proof of concept study which demonstrates for the first time the
possibility to record magnetocardiography (MCG) signals with 4He vector optically-pumped
magnetometers (OPM) operated in a gradiometer mode. Resulting from a compromise between
sensitivity, size and operability in a clinical environment, the developed magnetometers are
based on the parametric resonance of helium in zero magnetic field. Sensors are operated at
room-temperature and provide a tri-axis vector measurement of the magnetic field. Measured
sensitivity is around 210 fT/√Hz in the bandwidth [2 Hz; 300 Hz]. MCG signals from a
phantom and two healthy subjects are successfully recorded. Human MCG data obtained with
the OPMs are compared to reference electrocardiogram (ECG) recordings: similar heart rates,
shapes of the main patterns of the cardiac cycle (P/T waves, QRS complex) and QRS widths
are obtained with both techniques.
Keywords: Optically Pumped Magnetometers (OPM), helium, Magnetocardiography (MCG)
1. Introduction
Magnetocardiography is a contactless, non-invasive imaging technique which consists in measuring
the magnetic fields generated by the heart, about one million times smaller than the Earth's magnetic
field. Electrocardiography (ECG) and magnetocardiography (MCG) both demonstrate a high temporal
resolution. However, discontinuities of the electrical conductivity in body tissues (bones, fat layer) act
as a low pass spatial filter of electrical cardiac signals recorded in ECG. As a result, a current flowing
from a localized cardiac region produces an ECG effect at almost all surface electrodes. Consequently,
it is difficult to interpret spatial information like QT dispersion in ECG while multi-channels MCG
should allow a more sensitive assessment of the cellular dispersion of ventricular repolarization
(Antzelevitch et al., 1998). Multi-channels MCG are also useful to detect precordial magnetic fields
originating from many sites over the heart with a high signal to noise ratio and a good spatio-temporal
resolution (Ikefuji et al., 2007). Another advantage of MCG is its ability to detect the magnetic field
produced by intracellular and extracellular currents in cardiac tissue, while ECG only detects the
effects of currents flowing through the body tissue (Wikswo and Barach, 1982)(Koch and Haberkorn,
2001). Recent clinical trials have reported that MCG mapping is useful for identifying spatial current
dispersion patterns, as well as for characterizing and discriminating Brugada syndrome and complete
right bundle branch block (Kandori et al., 2004). MCG mapping has also been reported to provide a
higher statistical sensitivity than ECG, giving the opportunity to better diagnose cardiac arrhythmia
and coronary artery diseases (Fenici et al., 2013)(Kwong et al., 2013)(Park et al., 2005). MCG can
also play a critical role in the diagnosis of long QT syndrome in fetuses (Cuneo et al., 2013). MCG
systems are currently based on the use of ultra-sensitive Superconducting Quantum Interference
Devices (SQUIDs), with only one magnetic sensitive direction characterized by a magnetic sensitivity
Page 1 of 12 AUTHOR SUBMITTED MANUSCRIPT - PMB-104536.R1
123456789101112131415161718192021222324252627282930313233343536373839404142434445464748495051525354555657585960
Acc
epte
d M
anus
crip
t

of about 1-10 fT/√Hz (Sternickel and Braginski, 2006). Nevertheless, dissemination of this imaging
technique is hindered by the high cost of SQUID equipment both in terms of initial investment (more
than one M€), as well as operational constraints and maintenance cost (more than 100 k€/year).
Moreover due to the cryogenic cooling system based on helium, a thermal insulation layer of a few
centimeters is required between the skin and the detector: magnetic signal strength is thus reduced. As
a result, despite its clinical interest, SQUID based magnetocardiography is not widespread in
hospitals.
Several emerging sensors dedicated to the measurements of low magnetic fields have been
developed during the past few years (Pannetier-Lecoeur et al., 2011) (Livanov et al., 1981). Among
them, cryogenic-free Optically-Pumped Magnetometers (OPM) have emerged as a promising
alternative to SQUIDs detector (Knappe et al., 2010). High sensitivity OPMs tested in the past are all
based on a vapor of alkali atoms and exploit the optical and magnetic properties of paramagnetic
alkali atoms. The most commonly used architectures of alkali OPM in the MCG field are Mx
magnetometers (Bison, 2004) and the so-called Spin-Exchange Relaxation-Free (SERF)
magnetometers (Wyllie et al., 2012), (Shah and Wakai, 2013). Both of them have only one sensitive
axis. MCG mapping has been carried out with an array of 83 Mx magnetometers in a second-order
gradiometer configuration: achieved sensitivity is around 1 pT/√Hz in the frequency range 1-10 Hz
(Bison et al., 2009) (Bison et al., 2010) (Lembke et al., 2014). Better sensitivities are demonstrated in
the SERF regime at the expense of the dynamic range of the sensor (since SERF regime is attained
only close to zero magnetic field) and higher operating temperature – typically around 150°C which
imposes a thermal insulation layer between the sensor and the skin (Xia et al., 2006). In real clinical
environment, demonstrated sensitivity of SERF prototypes is comprised between 10-100 fT/√Hz in
the frequency range of interest for MCG (0.5-50 Hz). Fetal MCG measurements have recently been
performed with an array of these alkali OPMs (Alem et al., 2015) (Wyllie, 2012).
In this paper, the possibility to record MCG signals with room-temperature vector OPMs based on
helium atoms is demonstrated for the first time. A significant advantage of helium 4 is that it does not
require cooling nor heating to be in a gas phase as needed for sensor operation. This avoids the use of
thermal insulation and, consequently allows reducing the distance between the sensor and the subject.
So, the signal strength is increased. The vector measurement should also allow recording magnetic
fields coming from all cardiac source orientations. This should solve one of the current limitation of
multichannel MCG systems (with only one magnetic sensitive direction) which are more sensitive to
tangential cardiac sources while multichannel ECG mapping is more sensitive to radial and posterior
cardiac sources (Mäntynen et al., 2014). In order to demonstrate the potential of 4He optically-
pumped magnetometers, we recorded simulated MCG signals generated by a phantom and real MCG
signals from two healthy subjects. Human MCG data have been cross-validated with ECG recordings
with comparison of the main features of the cardiac cycle namely heart rate, QRS width and QT
interval. This proof-of-concept study - with two 4He magnetometers operated in a gradiometer mode –
paves the way towards the development of a MCG system based on an array of 4He optically pumped
magnetometers dedicated to MCG imaging.
2. Materials and methods : 4He optically pumped magnetometer
2.1. Physical principle
The physical principle of operation of our OPM – based on optical pumping and parametric
resonance of 4He metastable atoms in a near-zero magnetic field – is sketched in Figure 1 (Le Prado,
2014). A HF discharge brings 4He atoms from the fundamental state, insensitive to the Zeeman effect,
to the 23S1 metastable state, where radiative decay back to the fundamental level is forbidden, which
makes this state relatively long-lived. The magnetic field B0 splits the 23S1 level into three Zeeman
sublevels. At the thermodynamic equilibrium, metastable atoms are almost equally distributed within
the three sublevels and no resonance signal can be detected. In order to amplify and measure the
resonance signal, an alignment of magnetic moments is created by optical pumping with a linearly
Page 2 of 12AUTHOR SUBMITTED MANUSCRIPT - PMB-104536.R1
123456789101112131415161718192021222324252627282930313233343536373839404142434445464748495051525354555657585960
Acc
epte
d M
anus
crip
t

polarized light tuned on the D0 line (wavelength of 1083 nm): in this configuration, the alignment is
collinear to the field of the light polarization.
Figure 1: Simplified principle of operation of 4He optically pumped magnetometer.
At low magnetic fields ( with the relaxation rate of metastable atoms and γ the
gyromagnetic ratio of 4He atoms), and when the alignment direction is transverse to the field, a
narrow resonance is observed when sweeping around the zero field value (a phenomenon known as
the Hanle effect (Cohen-Tannoudji et al., 1970b)). The maximum transmitted light through the vapor
cell is measured when the magnetic field is strictly equal to zero. Similar resonances can be detected
when a radio-frequency (RF) magnetic field - transverse to the pumping direction set by the direction
of the polarization - is added. These resonances, called parametric resonances, are sensitive to first
order only to the component of collinear to the RF (Cohen-Tannoudji et al., 1970a)(Dupont-Roc et
al., 1969). To measure the three components of the magnetic field, Dupont-Roc pioneered a
configuration based on two orthogonal RF magnetic fields and , both transverse to the
pumping direction (Dupont-Roc, 1971).
The 4He magnetometer described in this publication is based on this configuration. The two RF
fields and - with frequencies and - are respectively
applied along the X and Y axis and are orthogonal to the linear polarization of the pump beam
applied along z-axis. The frequencies of the RF fields are chosen so as to satisfy the following
condition with the Larmor pulsation of the near-zero external magnetic field
(the modulation must be fast enough so that the spins cannot adiabatically follow the modulation).
Frequencies are also chosen so as to reduce the intensity noise of the pump laser beam which is
minimum between 4 kHz – 45 kHz. To provide a wide dynamic range, a compensation field
opposed to the ambient magnetic field - is applied through a closed-control-loop system that
locks the magnetometer to the precisely equal zero magnetic field. The error signal is provided by
demodulation of the transmitted laser light at the pulsations , and as explained in (Dupont-
Roc, 1970). The value and direction of the field are deduced from the current injected in the
compensation coils.
2.2. Description of the experimental layout
Figure 2.a describes the experimental setup: magnetometers are operated inside a magnetic shielded
room and a gradiometer configuration with two 4He OPMs is used. One sensor (hereinafter referred to
as OPM1) is placed just above the chest of the subject. It measures the MCG signal of interest and the
residual field inside the magnetic shielded room. The second sensor (hereinafter referred to as OPM2),
Page 3 of 12 AUTHOR SUBMITTED MANUSCRIPT - PMB-104536.R1
123456789101112131415161718192021222324252627282930313233343536373839404142434445464748495051525354555657585960
Acc
epte
d M
anus
crip
t

located 30 cm away from the first, measures only the residual field. All the MCG measurements
presented here have been obtained along the Y-axis, since the magnetic field of the heart is mainly
orthogonal to the chest. Synchronous demodulations at , and are performed at the level of
each sensor by a dedicated analog electronic card. Demodulated signals are recorded and subtracted by
the OROS 3-Series/NVGate® acquisition software (OROS, 2009). This gradiometer configuration
allows monitoring and removing the ambient residual magnetic field inside the magnetic shielded room.
A single 4He magnetometer is shown in Figure 2.b. The cylindrical glassblown cells - with 1cm height
and diameter - are filled to 20 Torrs of high purity helium. The optimal pressure is determined using a
numerical model (Rutkowski et al., 2014). Compensation field and RF fields are applied using tri-axis
square Helmholtz coils (outside dimensions 1.7 cm). The amplitudes of the applied RF fields are
adjusted so as to optimize the sensitivity of the magnetometer and set to 1.5 µTpp for the 40 kHz RF
field and 120 nTpp for the 9 kHz RF field.
The whole system is designed to minimize the distance between the source (i.e. the heart) and the
sensitive element of the magnetometer (i.e. the gas cell). The cubic support for the field coils is
inserted in an opening of a printed circuit board, so as to minimize as much as possible the distance
between the sensitive element of the sensor and the heart. Thanks to this optimized configuration, the
average distance between the center of the gas cell and the skin is less than 1 cm, and the distance
between the bottom part of the cubic support and the skin is less than 5 mm. This is substantially
shorter that the distance between a SQUID coil and the skin. This compact configuration – permitted
by the lack of heating or cooling system – is one of the advantages of 4He OPM over other available
technologies (i.e. SQUID or alkali based OPM).
Figure 2: a. Schematic drawing of the tested configuration. The bold (thin) line represents optical (electrical) connections. b. Overview of a
single magnetometer containing a 1 cm sided glass blown cell, filled with 20 Torrs of high purity 4He (helium discharge inside the gas cell is maintained at about 40 mW of forward HF power) and structure of the RF/compensation coils (tri-axis square Helmholtz coils).
The pump laser is a key sub-system of the sensor. It relies on a fiber laser architecture including a
pump laser diode, a Wavelength Division Multiplexer (WDM), an Yb doped Fiber Bragg Grating
(FBG), an optical isolator and a splitter to allow a feedback control (Fourcault et al., 2010). A noise
reduction feedback loop is implemented resulting in a relative intensity noise (RIN) in the order of
between 4 kHz – 45 kHz. The power of the pump beam is optimized to 1.25
mW and the diameter of the collimated pump beam inside the gas cell is set to 5.4 mm.
The analog electronic card and the laser are set outside the magnetic shielded room and connected to
the sensitive element through electrical harnesses and multimode optical fibers. The depolarized pump
beam at the output of the collimator is linearly polarized by a linear polarizer located at the input of the
gas cell resulting in an atomic alignment of the vapor.
Page 4 of 12AUTHOR SUBMITTED MANUSCRIPT - PMB-104536.R1
123456789101112131415161718192021222324252627282930313233343536373839404142434445464748495051525354555657585960
Acc
epte
d M
anus
crip
t
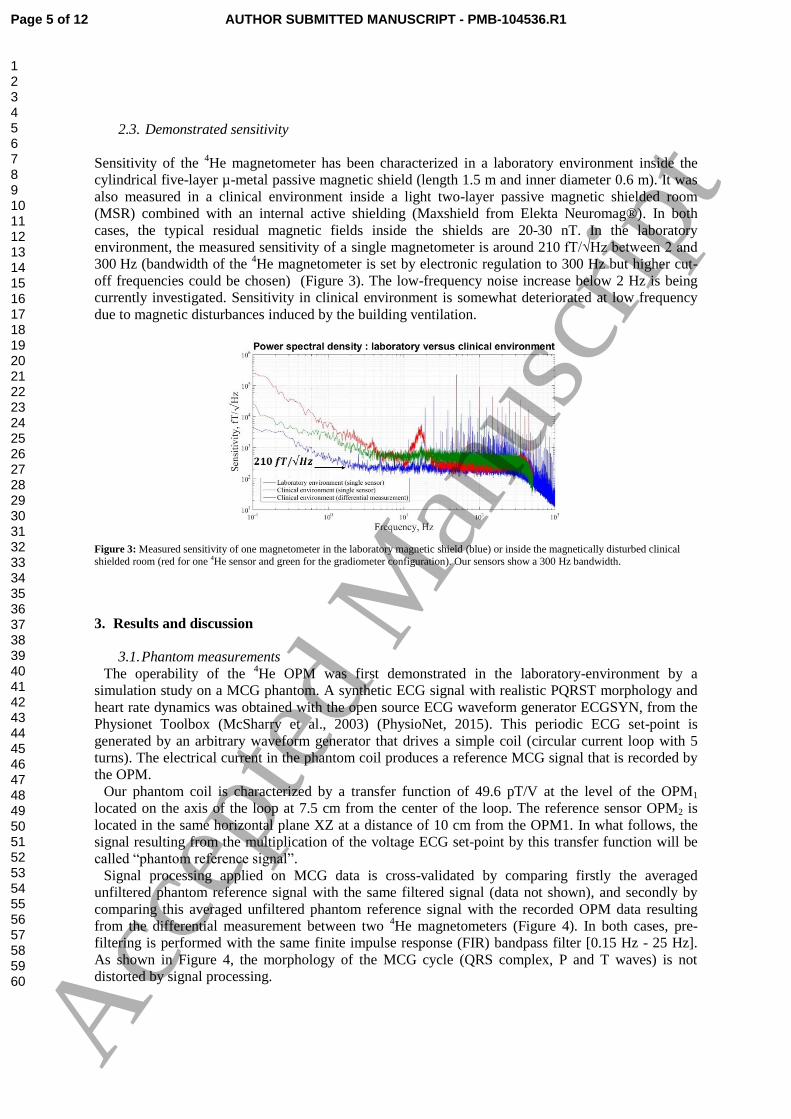
2.3. Demonstrated sensitivity
Sensitivity of the 4He magnetometer has been characterized in a laboratory environment inside the
cylindrical five-layer µ-metal passive magnetic shield (length 1.5 m and inner diameter 0.6 m). It was
also measured in a clinical environment inside a light two-layer passive magnetic shielded room
(MSR) combined with an internal active shielding (Maxshield from Elekta Neuromag®). In both
cases, the typical residual magnetic fields inside the shields are 20-30 nT. In the laboratory
environment, the measured sensitivity of a single magnetometer is around 210 fT/√Hz between 2 and
300 Hz (bandwidth of the 4He magnetometer is set by electronic regulation to 300 Hz but higher cut-
off frequencies could be chosen) (Figure 3). The low-frequency noise increase below 2 Hz is being
currently investigated. Sensitivity in clinical environment is somewhat deteriorated at low frequency
due to magnetic disturbances induced by the building ventilation.
Figure 3: Measured sensitivity of one magnetometer in the laboratory magnetic shield (blue) or inside the magnetically disturbed clinical
shielded room (red for one 4He sensor and green for the gradiometer configuration). Our sensors show a 300 Hz bandwidth.
3. Results and discussion
3.1. Phantom measurements
The operability of the 4He OPM was first demonstrated in the laboratory-environment by a
simulation study on a MCG phantom. A synthetic ECG signal with realistic PQRST morphology and
heart rate dynamics was obtained with the open source ECG waveform generator ECGSYN, from the
Physionet Toolbox (McSharry et al., 2003) (PhysioNet, 2015). This periodic ECG set-point is
generated by an arbitrary waveform generator that drives a simple coil (circular current loop with 5
turns). The electrical current in the phantom coil produces a reference MCG signal that is recorded by
the OPM.
Our phantom coil is characterized by a transfer function of 49.6 pT/V at the level of the OPM1
located on the axis of the loop at 7.5 cm from the center of the loop. The reference sensor OPM2 is
located in the same horizontal plane XZ at a distance of 10 cm from the OPM1. In what follows, the
signal resulting from the multiplication of the voltage ECG set-point by this transfer function will be
called “phantom reference signal”.
Signal processing applied on MCG data is cross-validated by comparing firstly the averaged
unfiltered phantom reference signal with the same filtered signal (data not shown), and secondly by
comparing this averaged unfiltered phantom reference signal with the recorded OPM data resulting
from the differential measurement between two 4He magnetometers (Figure 4). In both cases, pre-
filtering is performed with the same finite impulse response (FIR) bandpass filter [0.15 Hz - 25 Hz].
As shown in Figure 4, the morphology of the MCG cycle (QRS complex, P and T waves) is not
distorted by signal processing.
Page 5 of 12 AUTHOR SUBMITTED MANUSCRIPT - PMB-104536.R1
123456789101112131415161718192021222324252627282930313233343536373839404142434445464748495051525354555657585960
Acc
epte
d M
anus
crip
t
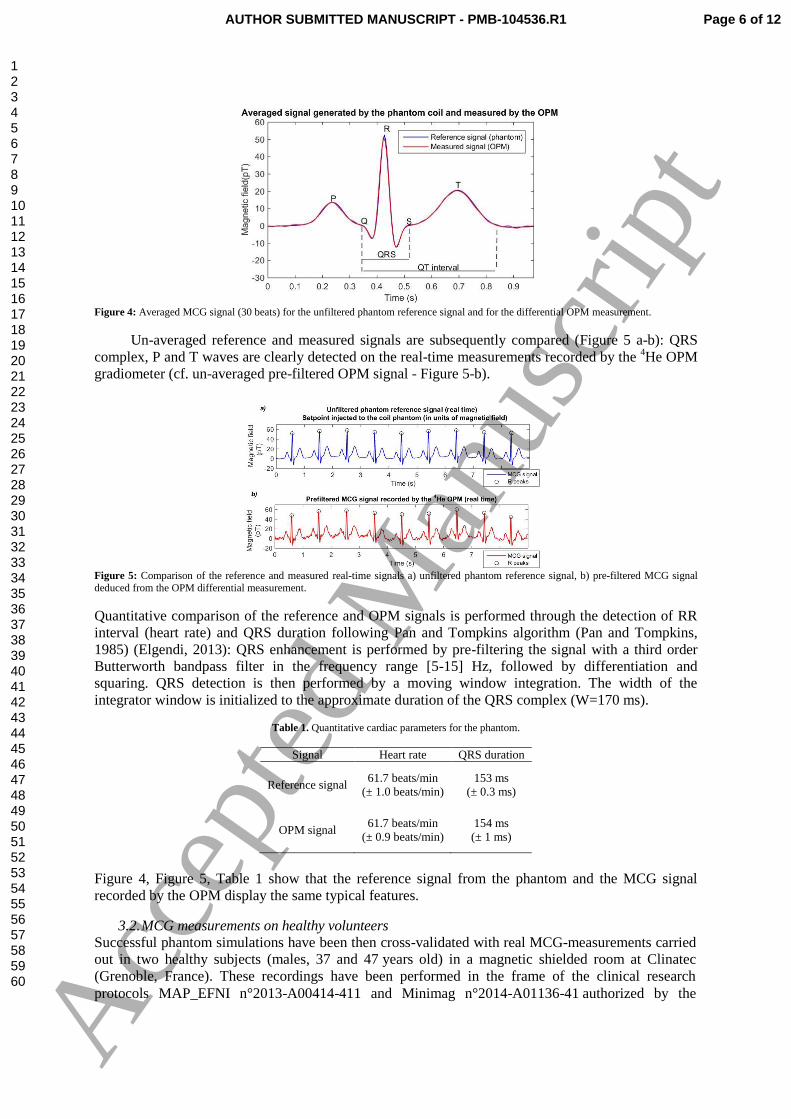
Figure 4: Averaged MCG signal (30 beats) for the unfiltered phantom reference signal and for the differential OPM measurement.
Un-averaged reference and measured signals are subsequently compared (Figure 5 a-b): QRS
complex, P and T waves are clearly detected on the real-time measurements recorded by the 4He OPM
gradiometer (cf. un-averaged pre-filtered OPM signal - Figure 5-b).
Figure 5: Comparison of the reference and measured real-time signals a) unfiltered phantom reference signal, b) pre-filtered MCG signal
deduced from the OPM differential measurement.
Quantitative comparison of the reference and OPM signals is performed through the detection of RR
interval (heart rate) and QRS duration following Pan and Tompkins algorithm (Pan and Tompkins,
1985) (Elgendi, 2013): QRS enhancement is performed by pre-filtering the signal with a third order
Butterworth bandpass filter in the frequency range [5-15] Hz, followed by differentiation and
squaring. QRS detection is then performed by a moving window integration. The width of the
integrator window is initialized to the approximate duration of the QRS complex (W=170 ms).
Table 1. Quantitative cardiac parameters for the phantom.
Signal Heart rate QRS duration
Reference signal 61.7 beats/min
(± 1.0 beats/min)
153 ms
(± 0.3 ms)
OPM signal 61.7 beats/min
(± 0.9 beats/min)
154 ms
(± 1 ms)
Figure 4, Figure 5, Table 1 show that the reference signal from the phantom and the MCG signal
recorded by the OPM display the same typical features.
3.2. MCG measurements on healthy volunteers
Successful phantom simulations have been then cross-validated with real MCG-measurements carried
out in two healthy subjects (males, 37 and 47 years old) in a magnetic shielded room at Clinatec
(Grenoble, France). These recordings have been performed in the frame of the clinical research
protocols MAP_EFNI n°2013-A00414-411 and Minimag n°2014-A01136-41 authorized by the
Page 6 of 12AUTHOR SUBMITTED MANUSCRIPT - PMB-104536.R1
123456789101112131415161718192021222324252627282930313233343536373839404142434445464748495051525354555657585960
Acc
epte
d M
anus
crip
t
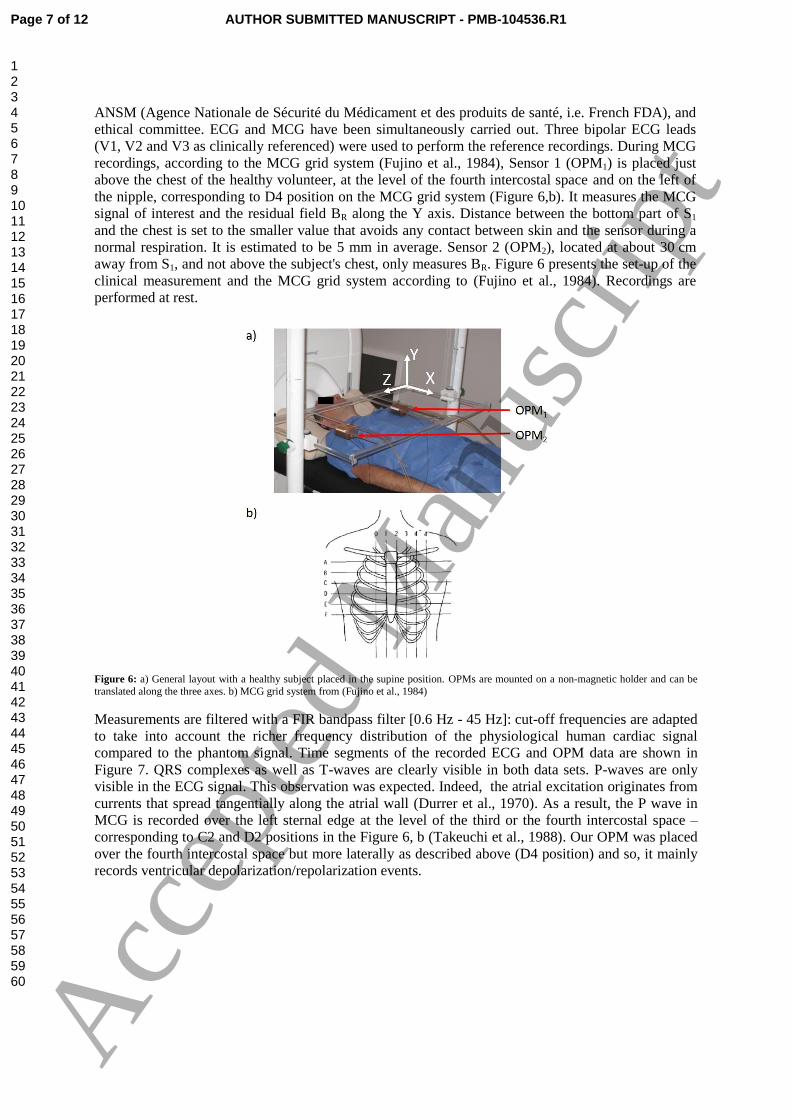
ANSM (Agence Nationale de Sécurité du Médicament et des produits de santé, i.e. French FDA), and
ethical committee. ECG and MCG have been simultaneously carried out. Three bipolar ECG leads
(V1, V2 and V3 as clinically referenced) were used to perform the reference recordings. During MCG
recordings, according to the MCG grid system (Fujino et al., 1984), Sensor 1 (OPM1) is placed just
above the chest of the healthy volunteer, at the level of the fourth intercostal space and on the left of
the nipple, corresponding to D4 position on the MCG grid system (Figure 6,b). It measures the MCG
signal of interest and the residual field BR along the Y axis. Distance between the bottom part of S1
and the chest is set to the smaller value that avoids any contact between skin and the sensor during a
normal respiration. It is estimated to be 5 mm in average. Sensor 2 (OPM2), located at about 30 cm
away from S1, and not above the subject's chest, only measures BR. Figure 6 presents the set-up of the
clinical measurement and the MCG grid system according to (Fujino et al., 1984). Recordings are
performed at rest.
Figure 6: a) General layout with a healthy subject placed in the supine position. OPMs are mounted on a non-magnetic holder and can be
translated along the three axes. b) MCG grid system from (Fujino et al., 1984)
Measurements are filtered with a FIR bandpass filter [0.6 Hz - 45 Hz]: cut-off frequencies are adapted
to take into account the richer frequency distribution of the physiological human cardiac signal
compared to the phantom signal. Time segments of the recorded ECG and OPM data are shown in
Figure 7. QRS complexes as well as T-waves are clearly visible in both data sets. P-waves are only
visible in the ECG signal. This observation was expected. Indeed, the atrial excitation originates from
currents that spread tangentially along the atrial wall (Durrer et al., 1970). As a result, the P wave in
MCG is recorded over the left sternal edge at the level of the third or the fourth intercostal space –
corresponding to C2 and D2 positions in the Figure 6, b (Takeuchi et al., 1988). Our OPM was placed
over the fourth intercostal space but more laterally as described above (D4 position) and so, it mainly
records ventricular depolarization/repolarization events.
Page 7 of 12 AUTHOR SUBMITTED MANUSCRIPT - PMB-104536.R1
123456789101112131415161718192021222324252627282930313233343536373839404142434445464748495051525354555657585960
Acc
epte
d M
anus
crip
t

Figure 7: Real-time cardiac signal of the 37 years old healthy subject detected simultaneously with a) ECG electrodes and b) 4He OPM operated in a gradiometer mode.
Heart-rate - determined from the RR intervals on ECG and MCG data– are compared using the
simultaneously ECG and OPM recordings on 180 s: both measurements are perfectly superimposed as
shown in Figure 8. This is confirmed by a Student t-test (α=0.05): a p-value of 98% was determined
which confirms that there is no statistical difference between the heart rate determined with ECG and
MCG.
Figure 8: Heart rate determined from simultaneously ECG and OPM recordings.
One heart beat cycle of the real-time pre-filtered ECG/MCG signals and signal-averaged MCG are
shown in Figure 9. For the OPM-based data, averaging the cardiac waveform over 15-20 heart beats
clearly enhance the signal to noise ratio.
Figure 9: ECG and MCG signals of the healthy 37 years old volunteer. a) Real-time filtered un-averaged ECG signal (one heart beat cycle),
b) Real-time filtered un-averaged MCG signal (one heart beat cycle), c) 5 beats averaged MCG signal, d) 20 beats averaged MCG signal.
Quantitative cardiac parameters (heart rate, QRS duration, QT intervals and corrected QT intervals)
determined for both healthy volunteers are summarized in Table 2. As previously, detection of QRS
duration is based on Pan and Tompkins algorithm (the width of the integrator window is set to 130
ms). QT interval is determined manually using the maximum slope intercept method to define the end
of the T wave (Malik and Batchvarov, 2000). QT interval which represents the electrical
depolarization and repolarization of the ventricles is dependent on the heart rate (QT lengthens at
Page 8 of 12AUTHOR SUBMITTED MANUSCRIPT - PMB-104536.R1
123456789101112131415161718192021222324252627282930313233343536373839404142434445464748495051525354555657585960
Acc
epte
d M
anus
crip
t

slower heart rates) thus a heart-rate corrected QT interval (noted ) is commonly defined. Here, the
corrected QT interval is determined using the Bazett’s formula: with RR the interval
from the onset of one QRS complex to the onset of the next one, measured in seconds.
Table 2: Quantitative cardiac parameters for both healthy volunteers determined with ECG and OPMs.
Subject 1
(male, 47)
Subject 2
(male, 37)
ECG MCG (OPM) ECG MCG (OPM)
Heart rate 67beats/min
(± 3.8 beats/min)
67 beats/min
(± 3.3 beats/min)
51.2 beats/min
(±2 beats/min)
QRS duration 101 ms
(±0.2 ms)
105 ms
(±3.8 ms)
122 ms
(±0.2 ms)
122 ms
(±3 ms)
QT interval 370 ms 371 ms 452 ms 453 ms
391 ms 392 ms 417 ms 419 ms
Normal varies between 350 ms and 400 ms, and a long QT syndrome in males is defined for a
above 450 ms. For the 37 years old, the borderline ( ) is
representative of a nonspecific intraventricular conduction delay, which was confirmed by the clinical
examination of the patient carried out before the beginning of the clinical trial.
Statistical analysis of the QRS duration is performed with a Student t-test (α=0.05) on ECG and
OPM-based MCG data for the 37-years old volunteers. A p-value of 78% is obtained which shows
that there is no statistical difference on QRS duration between the ECG and the MCG signal measured
with 4He magnetometers.
All these data confirm that the room-temperature vector 4He OPM can record MCG signals and
provide reliable information about cardiac activity.
4. Conclusion
MCG measurements performed in a clinical environment on two healthy volunteers confirm that a 4He vector magnetometer operated in a gradiometer mode is a promising sensor to record real-time
human MCG signals. An important advantage of 4He OPMs is the possibility of operating the sensor
at room temperature without thermal insulation, with a reduced “sensor-subject” distance and a better
signal strength. Another key characteristic of the developed 4He OPM is the possibility to record with
the same sensor the three components of the MCG signal.
Sensitivity of the 4He OPM is currently limited by the excess noise of our fiber laser at 1083 nm
(depending on the frequency and optical power, the RIN is 10-20dB above the RIN shot noise). We
expect that sensitivity of our gradiometer will be significantly improved by the ultra-low noise 1083
nm laser diode currently developed. In parallel, future work will concentrate on designing an OPM
array dedicated to multichannel MCG/MEG recordings enabling mapping approaches.
This work was supported by the French National Research Agency (ANR) through Carnot funding. The authors
thank A. Palacios-Laloy for fruitful discussions on the manuscript.
References:
Alem, O., Sander, T.H., Mhaskar, R., LeBlanc, J., Eswaran, H., Steinhoff, U., Okada, Y., Kitching, J.,
Trahms, L., Knappe, S., 2015. Fetal magnetocardiography measurements with an array of
Page 9 of 12 AUTHOR SUBMITTED MANUSCRIPT - PMB-104536.R1
123456789101112131415161718192021222324252627282930313233343536373839404142434445464748495051525354555657585960
Acc
epte
d M
anus
crip
t

microfabricated optically pumped magnetometers. Phys. Med. Biol. 60, 4797–4811.
doi:10.1088/0031-9155/60/12/4797
Antzelevitch, C., Shimizu, W., Yan, G.X., Sicouri, S., 1998. Cellular basis for QT dispersion. J.
Electrocardiol. 30 Suppl, 168–175.
Bison, G., 2004. Development of an optical cardio-magnetometer (Dissertation).
UniversitÄatsdruckerei Freiburg.
Bison, G., Castagna, N., Hofer, A., Knowles, P., Schenker, J.-L., Kasprzak, M., Saudan, H., Weis, A.,
2009. A room temperature 19-channel magnetic field mapping device for cardiac signals.
Appl. Phys. Lett. 95, 173701. doi:10.1063/1.3255041
Bison, G., Stumpf, M., Lembke, G., 2010. Design of a 57 Channel Optical Biomagnetometersystem.
Biomed. Tech. 55, 72–4. doi:10.1515/BMT.2010.293
Cohen-Tannoudji, C., Dupont-Roc, J., Haroche, S., Laloë, F., 1970a. Diverses résonances de
croisement de niveaux sur des atomes pompés optiquement en champ nul II. Applications à la
mesure de champs faibles. Rev. Phys. Appl. 5, 102–108.
doi:10.1051/rphysap:0197000501010200
Cohen-Tannoudji, C., Dupont-Roc, J., Haroche, S., Lalöe, F., 1970b. Diverses résonances de
croisement de niveaux sur des atomes pompés optiquement en champ nul I. Théorie. Rev Phys
Appl 5, 95–101.
Cuneo, B.F., Strasburger, J.F., Yu, S., Horigome, H., Hosono, T., Kandori, A., Wakai, R.T., 2013. In
utero diagnosis of long QT syndrome by magnetocardiography. Circulation 128, 2183–2191.
doi:10.1161/CIRCULATIONAHA.113.004840
Dupont-Roc, J., 1971. Étude théorique de diverses résonances observables en champ nul sur des
atomes “ habillés ” par des photons de radiofréquence. J. Phys. 32, 135–144.
doi:10.1051/jphys:01971003202-3013500
Dupont-Roc, J., 1970. Détermination par des méthodes optiques des trois composantes d’un champ
magnétique très faible. Rev. Phys. Appliquée 5, 853–864.
doi:10.1051/rphysap:0197000506085300
Dupont-Roc, J., Haroche, S., Cohentan.c, 1969. Detection of Very Weak Magnetic Fields (10-9gauss)
by 87rb-Zero-Field Level Crossing Resonances. Phys. Lett. A A 28, 638–&.
doi:10.1016/0375-9601(69)90480-0
Durrer, D., van Dam, R.T., Freud, G.E., Janse, M.J., Meijler, F.L., Arzbaecher, R.C., 1970. Total
excitation of the isolated human heart. Circulation 41, 899–912.
Elgendi, M., 2013. Fast QRS Detection with an Optimized Knowledge-Based Method: Evaluation on
11 Standard ECG Databases. PLOS ONE 8, e73557. doi:10.1371/journal.pone.0073557
Fenici, R., Brisinda, D., Venuti, A., Sorbo, A.R., 2013. Thirty years of clinical magnetocardiography
at the Catholic University of Rome: diagnostic value and new perspectives for the treatment of
cardiac arrhythmias. Int. J. Cardiol. 168, 5113–5115. doi:10.1016/j.ijcard.2013.07.238
Fourcault, W., Leger, J.M., Costes, V., Fratter, I., Mondin, L., 2010. ATHERMAL FIBER LASER
FOR THE SWARM ABSOLUTE SCALAR MAGNETOMETER. Presented at the ICSO
2010, International Conference on Space Optics, Rhodes, Greece.
Fujino, K., Sumi, M., Saito, K., Murakami, M., Higuchi, T., Nakaya, Y., Mori, H., 1984.
Magnetocardiograms of patients with left ventricular overloading recorded with a second-
derivative SQUID gradiometer. J. Electrocardiol. 17, 219–228.
Ikefuji, H., Nomura, M., Nakaya, Y., Mori, T., Kondo, N., Ieishi, K., Fujimoto, S., Ito, S., 2007.
Visualization of cardiac dipole using a current density map: detection of cardiac current
undetectable by electrocardiography using magnetocardiography. J. Med. Investig. JMI 54,
116–123.
Kandori, A., Shimizu, W., Yokokawa, M., Noda, T., Kamakura, S., Miyatake, K., Murakami, M.,
Miyashita, T., Ogata, K., Tsukada, K., 2004. Identifying patterns of spatial current dispersion
that characterise and separate the Brugada syndrome and complete right-bundle branch block.
Med. Biol. Eng. Comput. 42, 236–244.
Page 10 of 12AUTHOR SUBMITTED MANUSCRIPT - PMB-104536.R1
123456789101112131415161718192021222324252627282930313233343536373839404142434445464748495051525354555657585960
Acc
epte
d M
anus
crip
t
Knappe, S., Sander, T.H., Kosch, O., Wiekhorst, F., Kitching, J., Trahms, L., 2010. Cross-validation
of microfabricated atomic magnetometers with superconducting quantum interference devices
for biomagnetic applications. Appl. Phys. Lett. 97, 133703. doi:10.1063/1.3491548
Koch, H., Haberkorn, W., 2001. Magnetic field mapping of cardiac electrophysiological function.
Philos. Trans. R. Soc. Lond. Math. Phys. Eng. Sci. 359, 1287–1298.
doi:10.1098/rsta.2001.0831
Kwong, J.S.W., Leithäuser, B., Park, J.-W., Yu, C.-M., 2013. Diagnostic value of
magnetocardiography in coronary artery disease and cardiac arrhythmias: a review of clinical
data. Int. J. Cardiol. 167, 1835–1842. doi:10.1016/j.ijcard.2012.12.056
Le Prado, M., 2014. Conception, réalisation et application d’un magnétomètre atomique vectoriel
(Dissertation). Université de Franche-Comté UFC.
Lembke, G., Erné, S.N., Nowak, H., Menhorn, B., Pasquarelli, A., 2014. Optical multichannel room
temperature magnetic field imaging system for clinical application. Biomed. Opt. Express 5,
876–881. doi:10.1364/BOE.5.000876
Livanov, M.N., Koslov, A.N., Sinelnikova, S.E., Kholodov, J.A., Markin, V.P., Gorbach, A.M.,
Korinewsky, A.V., 1981. Record of the human magnetocardiogram by the quantum
gradiometer with optical pumping. Adv. Cardiol. 28, 78–80.
Malik, M., Batchvarov, V.N., 2000. Measurement, interpretation and clinical potential of QT
dispersion. J. Am. Coll. Cardiol. 36, 1749–1766. doi:10.1016/S0735-1097(00)00962-1
Mäntynen, V., Konttila, T., Stenroos, M., 2014. Investigations of sensitivity and resolution of ECG
and MCG in a realistically shaped thorax model. Phys. Med. Biol. 59, 7141–7158.
doi:10.1088/0031-9155/59/23/7141
McSharry, P.E., Clifford, G.D., Tarassenko, L., Smith, L.A., 2003. A dynamical model for generating
synthetic electrocardiogram signals. IEEE Trans. Biomed. Eng. 50, 289–294.
doi:10.1109/TBME.2003.808805
OROS, 2009. NVGate®, Sofware Platform for OROS 3-Series, Technical specifications,
www.oros.com.
Pan, J., Tompkins, W.J., 1985. A Real-Time QRS Detection Algorithm. IEEE Trans. Biomed. Eng.
BME-32, 230–236. doi:10.1109/TBME.1985.325532
Pannetier-Lecoeur, M., Parkkonen, L., Sergeeva-Chollet, N., Polovy, H., Fermon, C., Fowley, C.,
2011. Magnetocardiography with sensors based on giant magnetoresistance. Appl. Phys. Lett.
98, 153705. doi:10.1063/1.3575591
Park, J.-W., Hill, P.M., Chung, N., Hugenholtz, P.G., Jung, F., 2005. Magnetocardiography predicts
coronary artery disease in patients with acute chest pain. Ann. Noninvasive Electrocardiol. 10,
312–323. doi:10.1111/j.1542-474X.2005.00634.x
PhysioNet, 2015. ECGSYN: A realistic ECG waveform generator
(https://www.physionet.org/physiotools/ecgsyn/).
Rutkowski, J., Fourcault, W., Bertrand, F., Rossini, U., Getin, S., Le Calvez, S., Jager, T., Herth, E.,
Gorecki, C., Le Prado, M., Leger, J.M., Morales, S., 2014. Towards a miniature atomic scalar
magnetometer using a liquid crystal polarization rotator. Sens. Actuators -Phys. 216, 386–393.
doi:10.1016/j.sna.2014.05.003
Shah, V.K., Wakai, R.T., 2013. A compact, high performance atomic magnetometer for biomedical
applications. Phys. Med. Biol. 58, 8153–8161. doi:10.1088/0031-9155/58/22/8153
Sternickel, K., Braginski, A.I., 2006. Biomagnetism using SQUIDs: status and perspectives.
Supercond. Sci. Technol. 19, S160–S171. doi:10.1088/0953-2048/19/3/024
Takeuchi, A., Watanabe, K., Nomura, M., Ishihara, S., Sumi, M., Murakami, M., Saito, K., Nakaya,
Y., Mori, H., 1988. The P wave in the magnetocardiogram. J. Electrocardiol. 21, 161–167.
Wikswo, J.P., Barach, J.P., 1982. Possible sources of new information in the magnetocardiogram. J.
Theor. Biol. 95, 721–729.
Wyllie, R., IV, 2012. The development of a multichannel atomic magnetometer array for fetal
magnetocardiography (Dissertation). University of Wisconsin-Madison.
Page 11 of 12 AUTHOR SUBMITTED MANUSCRIPT - PMB-104536.R1
123456789101112131415161718192021222324252627282930313233343536373839404142434445464748495051525354555657585960
Acc
epte
d M
anus
crip
t

Wyllie, R., Kauer, M., Smetana, G.S., Wakai, R.T., Walker, T.G., 2012. Magnetocardiography with a
modular spin-exchange relaxation-free atomic magnetometer array. Phys. Med. Biol. 57.
doi:10.1088/0031-9155/57/9/2619
Xia, H., Baranga, A.B.-A., Hoffman, D., Romalis, M.V., 2006. Magnetoencephalography with an
atomic magnetometer. Appl. Phys. Lett. 89, 211104. doi:10.1063/1.2392722
Page 12 of 12AUTHOR SUBMITTED MANUSCRIPT - PMB-104536.R1
123456789101112131415161718192021222324252627282930313233343536373839404142434445464748495051525354555657585960
Acc
epte
d M
anus
crip
t