Magnetic Resonance Force Microscopy - EECS · Magnetic Resonance Force Microscopy By: ... • The...
48
Magnetic Resonance Force Microscopy By: Jaspreet Wadhwa Stephanie Teich-McGoldrick Zeinab Mousavi
Transcript of Magnetic Resonance Force Microscopy - EECS · Magnetic Resonance Force Microscopy By: ... • The...
Magnetic Resonance Force Microscopy
By:Jaspreet Wadhwa
Stephanie Teich-McGoldrickZeinab Mousavi

Purpose
• Imaging mechanisms have many uses in our society– Common
• X-Ray, MRI– Specialized
• AFM, Electron Microscopy, NMR
• Better resolution can open up new possible applications– Quantum computing, Molecular imaging
Atomic Force Microscopy
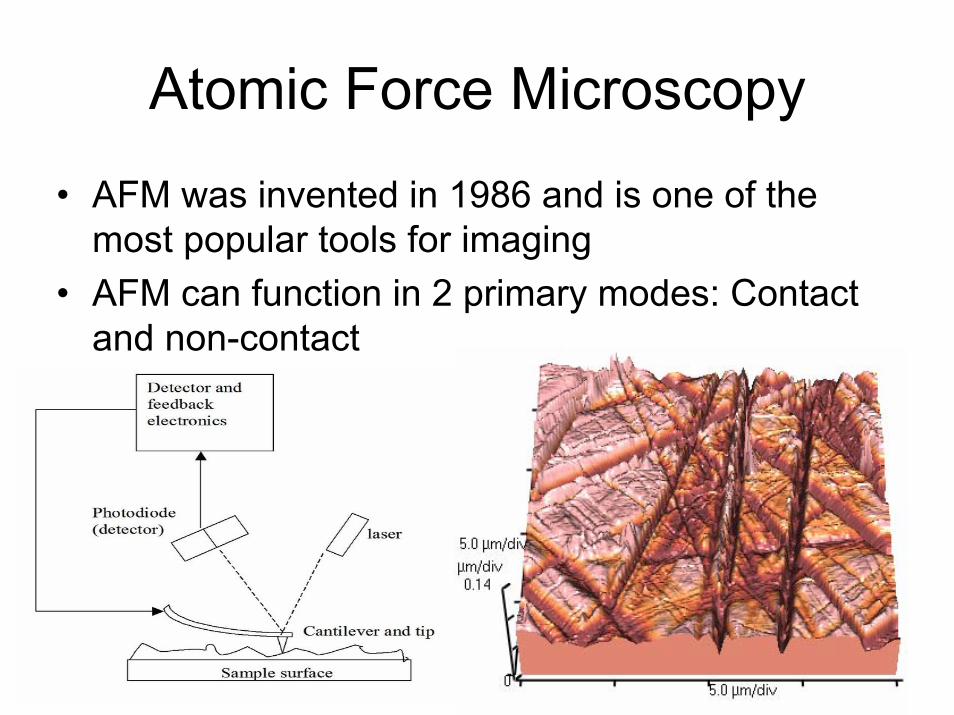
• AFM was invented in 1986 and is one of the most popular tools for imaging
• AFM can function in 2 primary modes: Contact and non-contact
Problems with AFM• Contact mode AFM techniques cannot be used
for imaging at a scale that is needed to detect single spins
• The contact between the needle and the surface can damage both if not used with extreme care
• Although many competing imaging techniques have been developed, AFM is still a robust technique
• AFM can only scan the top surface of the sample, thus limiting its use in sub-surface imaging.
Origins of MRFM• MRFM was originally proposed in the early 1990s
– “as a means of obtaining three-dimensional images of individual biological molecules”
• This technique showed potential of imaging at a single spin level but was limited by the apparatus
• Recent advances in ultra sensitive Cantilever-based force sensors and better understanding of the physical processes have made Single Spin detection possible
• Using MRFM, the authors report that they were able to observe a 25nm spatial resolution
Principles behind MRI and MFRI
• MRI and MFRI are both based on the same physics of the sample – Spin of electrically charged particles
• They differ in the technique used to measure the spin– MRI utilizes induction – MRFI utilizes mechanical force
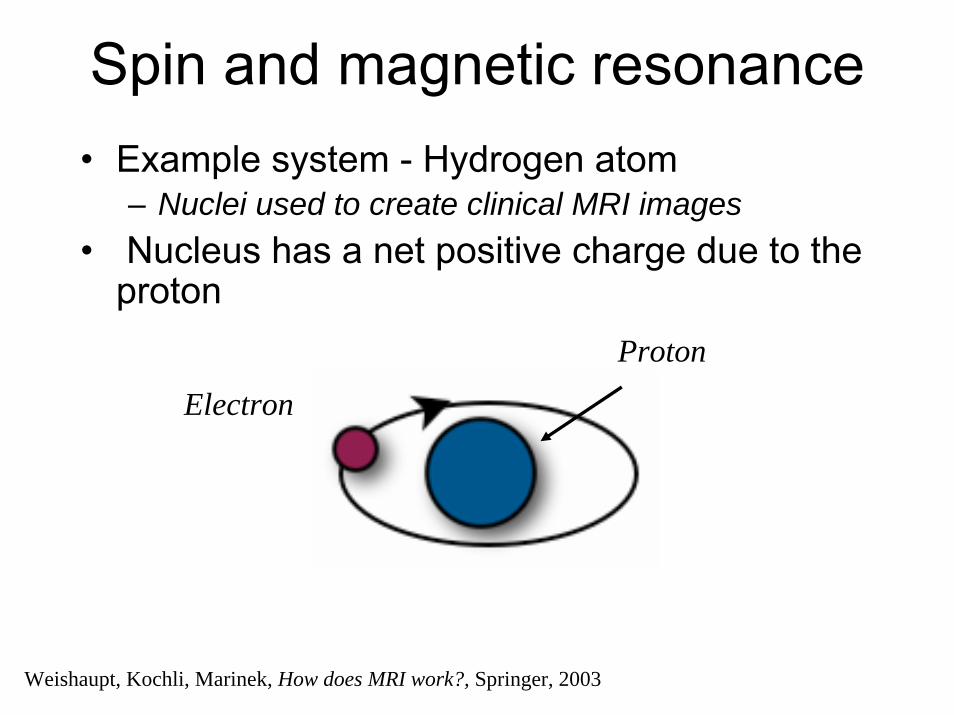
Spin and magnetic resonance • Example system - Hydrogen atom
– Nuclei used to create clinical MRI images• Nucleus has a net positive charge due to the
proton
Electron
Proton
Weishaupt, Kochli, Marinek, How does MRI work?, Springer, 2003
B
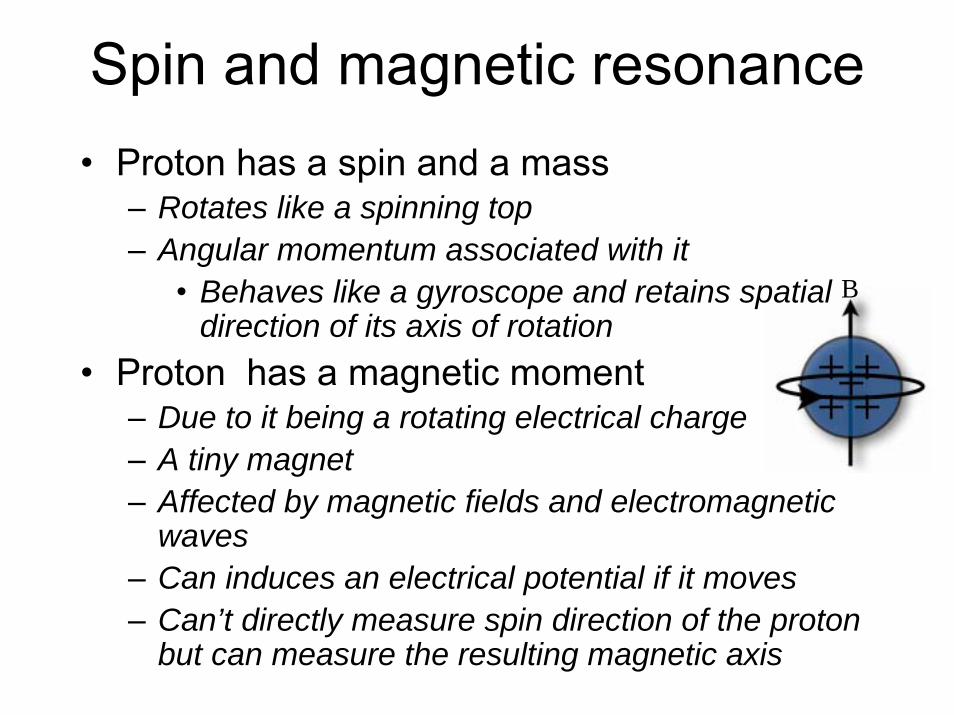
• Proton has a spin and a mass– Rotates like a spinning top– Angular momentum associated with it
• Behaves like a gyroscope and retains spatial direction of its axis of rotation
• Proton has a magnetic moment– Due to it being a rotating electrical charge– A tiny magnet– Affected by magnetic fields and electromagnetic
waves– Can induces an electrical potential if it moves– Can’t directly measure spin direction of the proton
but can measure the resulting magnetic axis
Spin and magnetic resonance
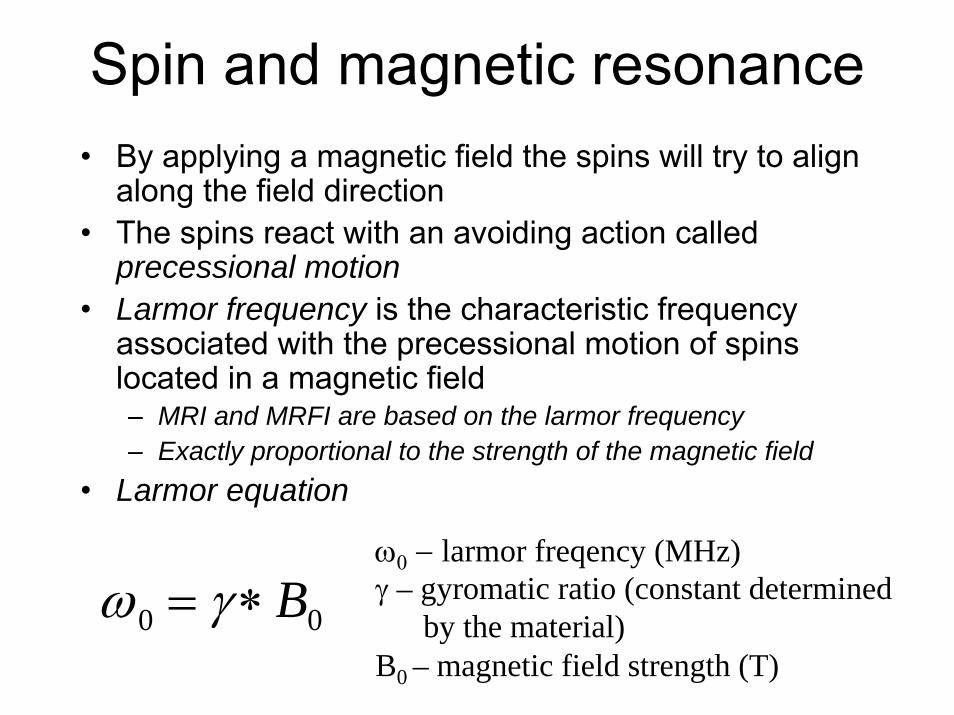
Spin and magnetic resonance • By applying a magnetic field the spins will try to align
along the field direction• The spins react with an avoiding action called
precessional motion• Larmor frequency is the characteristic frequency
associated with the precessional motion of spins located in a magnetic field– MRI and MRFI are based on the larmor frequency – Exactly proportional to the strength of the magnetic field
• Larmor equation
ω0 = γ ∗B0
ω0 − larmor freqency (MHz)γ – gyromatic ratio (constant determined
by the material)B0 – magnetic field strength (T)
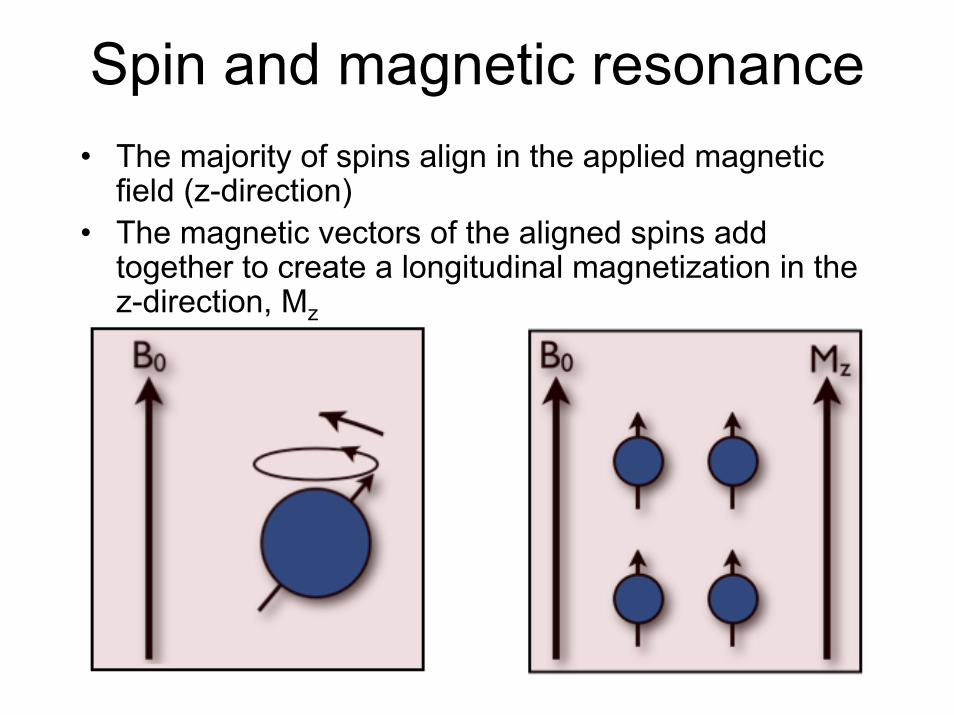
Spin and magnetic resonance • The majority of spins align in the applied magnetic
field (z-direction)• The magnetic vectors of the aligned spins add
together to create a longitudinal magnetization in the z-direction, Mz
Spin and magnetic resonance
• Possible to flip the spin direction• An electromagnetic wave having the
same frequency as the Larmorfrequency, ω0, can be used to transfer energy to the spins– Resonance condition
• Applying a RF pulse with the correct pulse and duration can cause the spins to flip
• As the spins flip so does their longitudinal magnetization, Mz

Spin and magnetic resonance
Spins align in direction of magnetic field
RF changes alignment of spins
Magnetization of spins now in xy-plane (transverse magnetization Mxy)
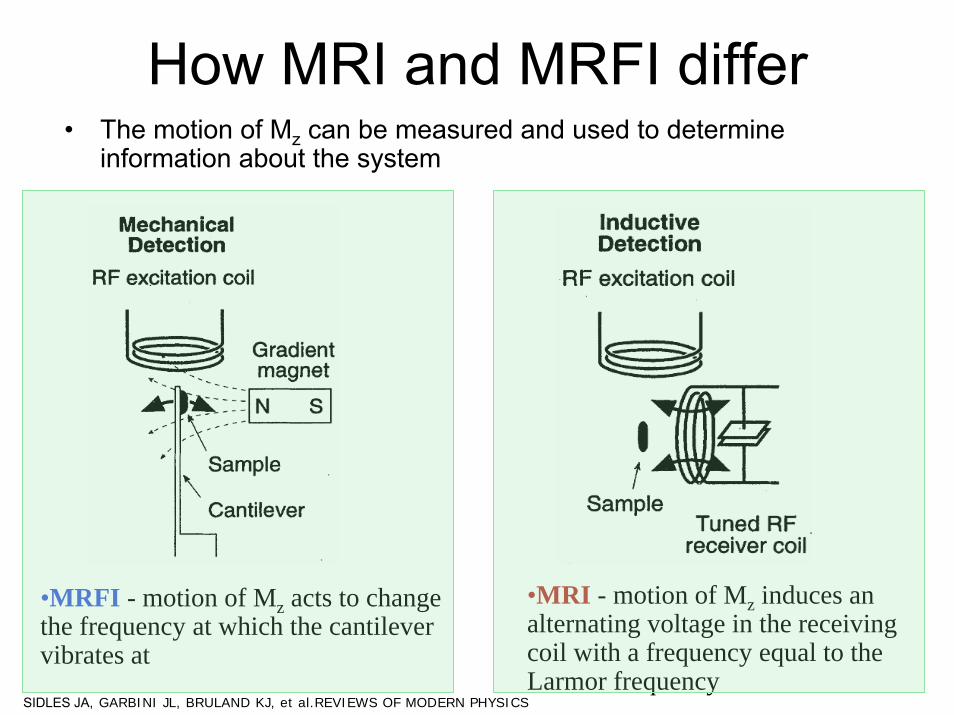
How MRI and MRFI differ• The motion of Mz can be measured and used to determine
information about the system
•MRI - motion of Mz induces an alternating voltage in the receiving coil with a frequency equal to the Larmor frequency
•MRFI - motion of Mz acts to change the frequency at which the cantilever vibrates at
SIDLES JA, GARBINI JL, BRULAND KJ, et al.REVIEWS OF MODERN PHYSICS
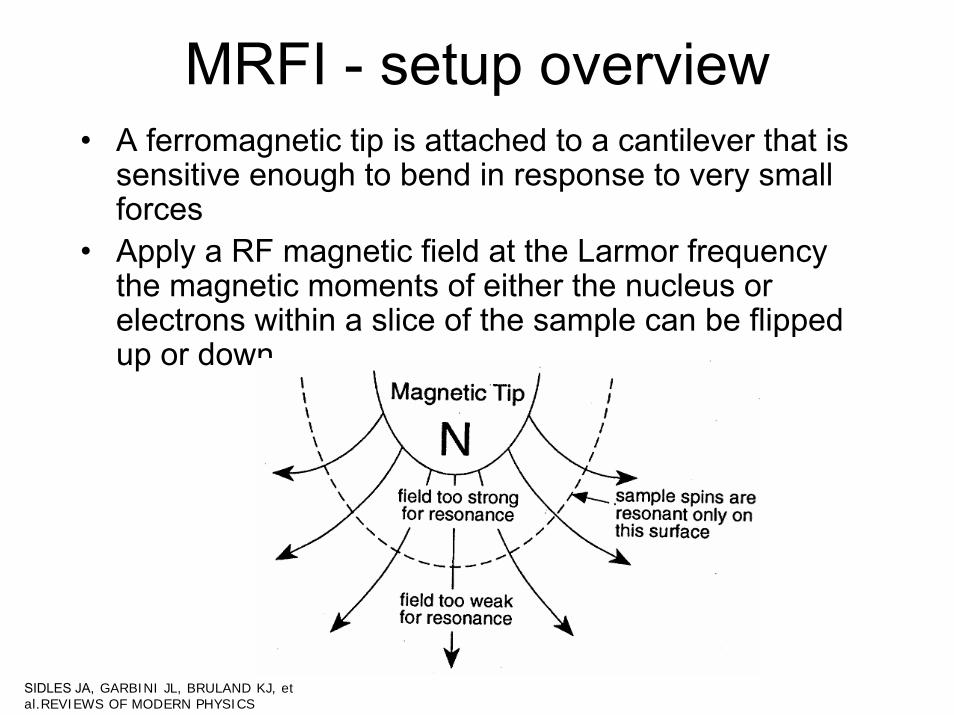
MRFI - setup overview • A ferromagnetic tip is attached to a cantilever that is
sensitive enough to bend in response to very small forces
• Apply a RF magnetic field at the Larmor frequency the magnetic moments of either the nucleus or electrons within a slice of the sample can be flipped up or down
SIDLES JA, GARBINI JL, BRULAND KJ, et al.REVIEWS OF MODERN PHYSICS
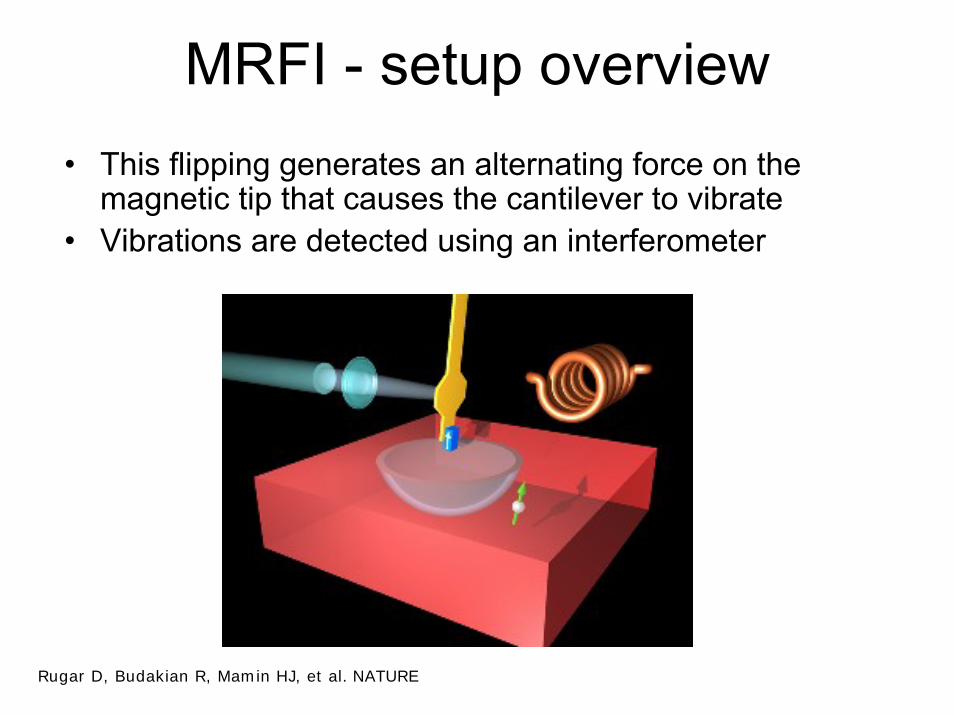
MRFI - setup overview • This flipping generates an alternating force on the
magnetic tip that causes the cantilever to vibrate• Vibrations are detected using an interferometer
Rugar D, Budakian R, Mamin HJ, et al. NATURE
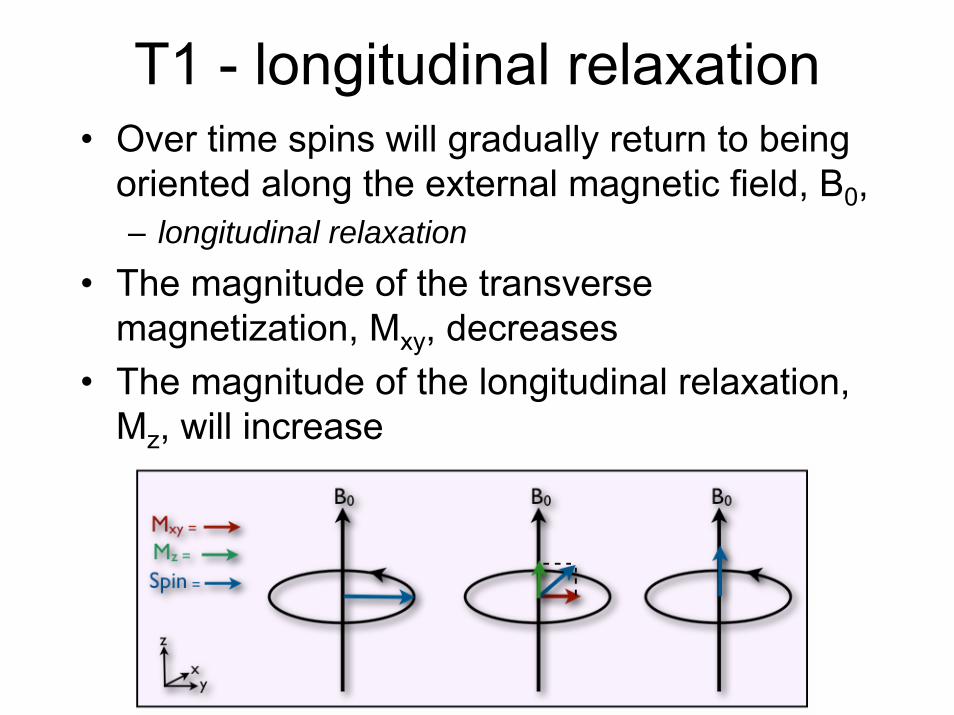
T1 - longitudinal relaxation• Over time spins will gradually return to being
oriented along the external magnetic field, B0,– longitudinal relaxation
• The magnitude of the transverse magnetization, Mxy, decreases
• The magnitude of the longitudinal relaxation, Mz, will increase
T1 - longitudinal relaxation
• Energy is emitted into the surroundings • T1 - time constant of longitudinal
relaxation– Independent of strength of B0 and internal
movement of molecules• Determines how fast the spins will
return to their original starting positions oriented along B0 and be able to be excited again
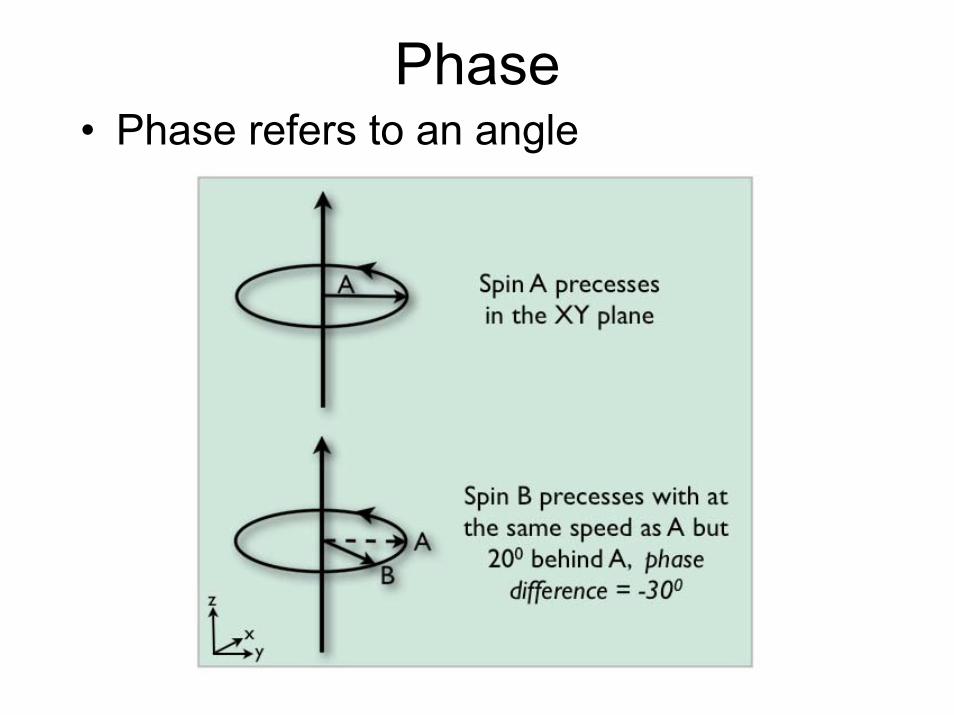
Phase• Phase refers to an angle

Phase coherence• Directly after excitation all spins are in phase
– Phase coherence• Phase coherence vanishes following excitation• Individual magnetic vectors cancel each other out• The transverse magnetization vector Mxy becomes
smaller and eventually vanishes
T2 - transverse relaxation• Loss of transverse magnetization, Mxy,
due to loss of phase coherence • No energy emission to the surroundings• Energy is exchange between spins
– Neighboring spins set up local magnetic fields, BL
– The precession frequency of a spin changes based on BL
– Phase coherence is lost
Advantages of MRFM
• The review article by Sidles et al. summarized the appeal of MRFM in 3 simple for very important points:– The magnetic imaging is non-contact and specific to
electron and nuclear spins– The imaging magnetic field is 3-Dimensional and
reaches below the scanned surface allowing for imaging of subsurface structures
– The mathematics and theory behind magnetic resonance is well understood and the algorithms involved in image deconvolution are well conditioned
Using MRFM• The fundamental challenge to achieving single-
spin sensitivity is the magnitude of the force exerted by an electrons– This force is measured in attonewton (1 aN = 10-18
Newtons)• In comparison to the AFM, force is 1 Million
times smaller• MRFM can be used to scan beneath the
topographic surface of a sample (100nm)• Successful application at this scale requires very
sensitive equipment and small tolerances
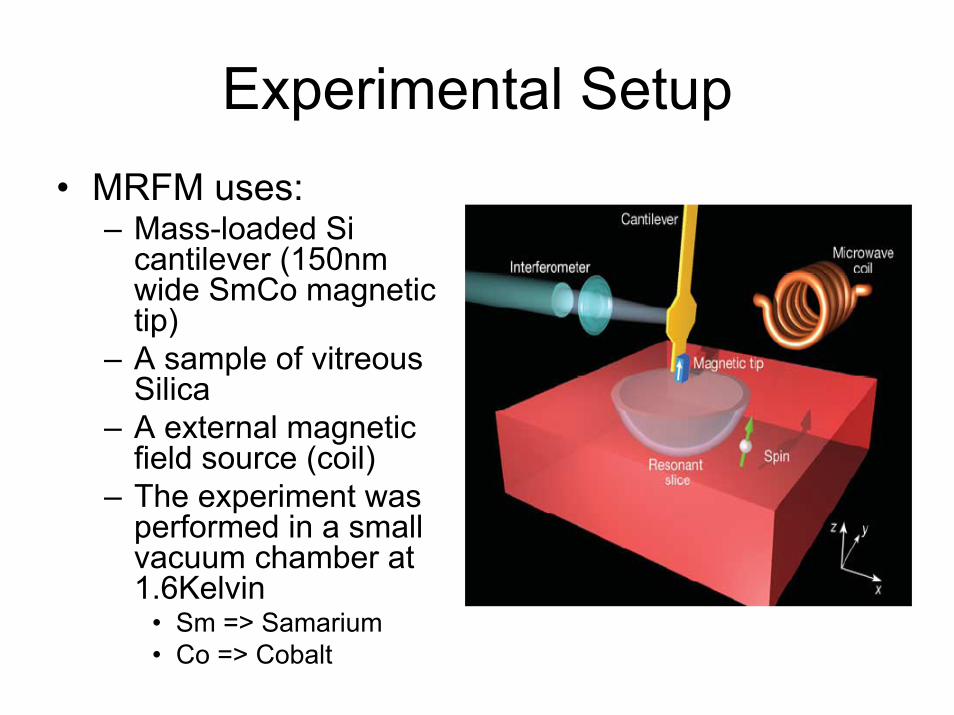
Experimental Setup• MRFM uses:
– Mass-loaded Sicantilever (150nm wide SmCo magnetic tip)
– A sample of vitreous Silica
– A external magnetic field source (coil)
– The experiment was performed in a small vacuum chamber at 1.6Kelvin
• Sm => Samarium• Co => Cobalt
Procedure• At first, the sample is irradiated with 2-Gy dose of Co60
gamma rays– This produces a small concentration of dangling bonds
containing unpaired electrons• The estimated concentration of spins is approx. 1014 cm-
3
– For simplification, it is assumed that the unpaired electrons are far enough to not interfere with each other
• An external microwave magnetic field is applied to the system to create a resonant slice within the sample
• The spin must be slightly in front or slightly behind the tip in the x direction to create a noticeable change in the cantilever (for a vertical tip)
Resonant Slice• Due to the deposit of SmCo on the tip, the tip has a
magnetic field (Btip(x,y,z))• A static magnetic field (Bext(z)) is applied to the system• A “resonant slice” is formed at the position where the
sum of the two magnetic fields is equal to the condition for electron spin resonance
• B0(x,y,z) = 106 mT and Bext = 30 mT
• The thickness of the slice is inversely proportional to the gradient of the magnetic field
• Typically, the resonant slice is a surface that extends 250nm below the tip
Force Microscopy
• map force gradients near surfaces w/o contact• Force gradients are detected as shifts in the resonant
frequency of the mechanical vibration of a cantilever that is positioned near the surface of interest
• Common detection schemes: – Cantilever is driven at a constant frequency– Force gradient detected as variation in amplitude or phase
of the cantilever vibration.
Improvements on Force Microscopy
• Signal to noise ratio (S/N) and sensitivity can be increased by increasing Q of cantilever
• High Q means smaller max available BW• Small BW means a slow system
Need an improved detection method that increasessensitivity through high Q w/o decreasing BW
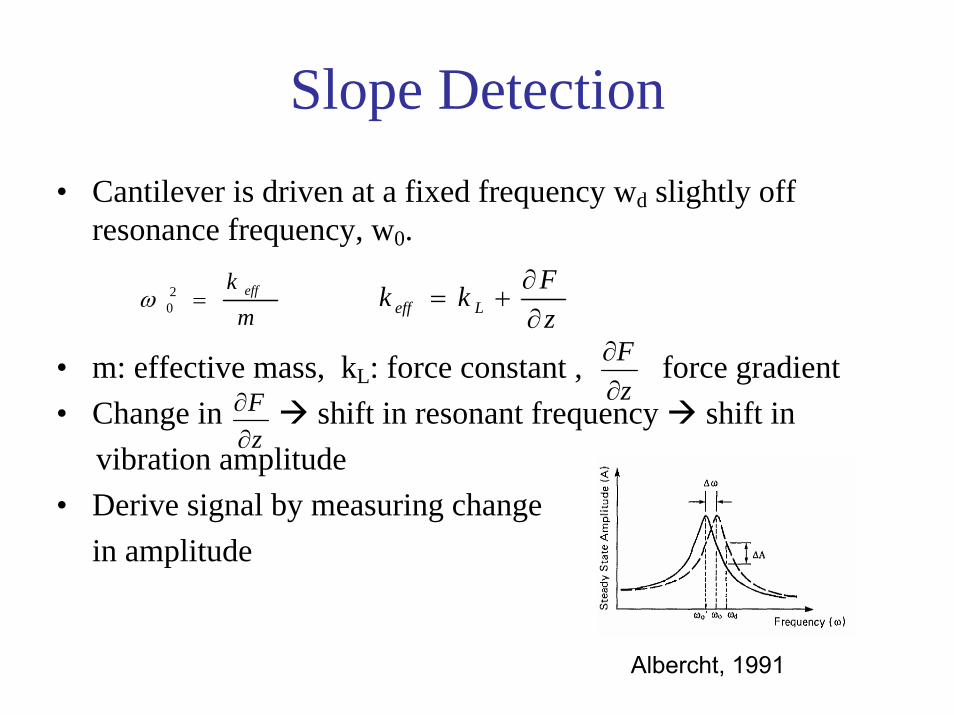
Slope Detection• Cantilever is driven at a fixed frequency wd slightly off
resonance frequency, w0.
• m: effective mass, kL: force constant , force gradient• Change in shift in resonant frequency shift in
vibration amplitude• Derive signal by measuring change
in amplitude
mk eff=2
0ωzFkk Leff ∂
∂+=
zF∂∂
zF∂∂
Albercht, 1991
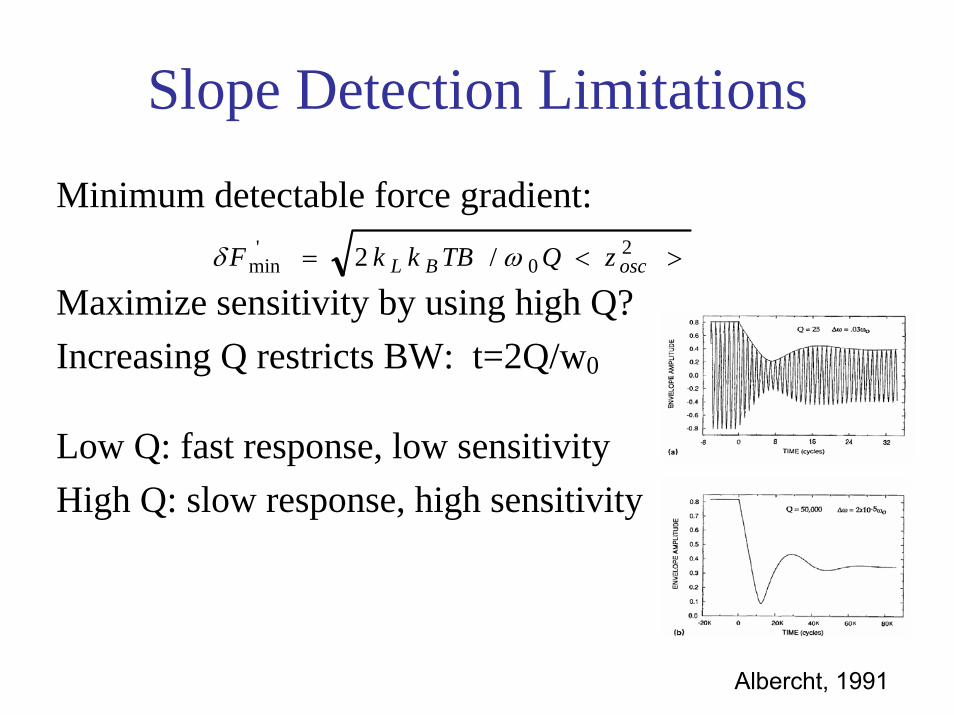
Slope Detection Limitations
Minimum detectable force gradient:
Maximize sensitivity by using high Q?Increasing Q restricts BW: t=2Q/w0
Low Q: fast response, low sensitivityHigh Q: slow response, high sensitivity
><= 20
'min /2 oscBL zQTBkkF ωδ
Albercht, 1991
Frequency Modulation Technique
• Cantilever serves as frequency-determining element (constant amplitude)
• The frequency of the cantilever is instantaneously modulated by variations in the force gradient acting on the cantilever
• S/N for a given BW depends on Q • BW is governed only by the characteristics of the FM
demodulator• Can increase Q w/o decreasing BW
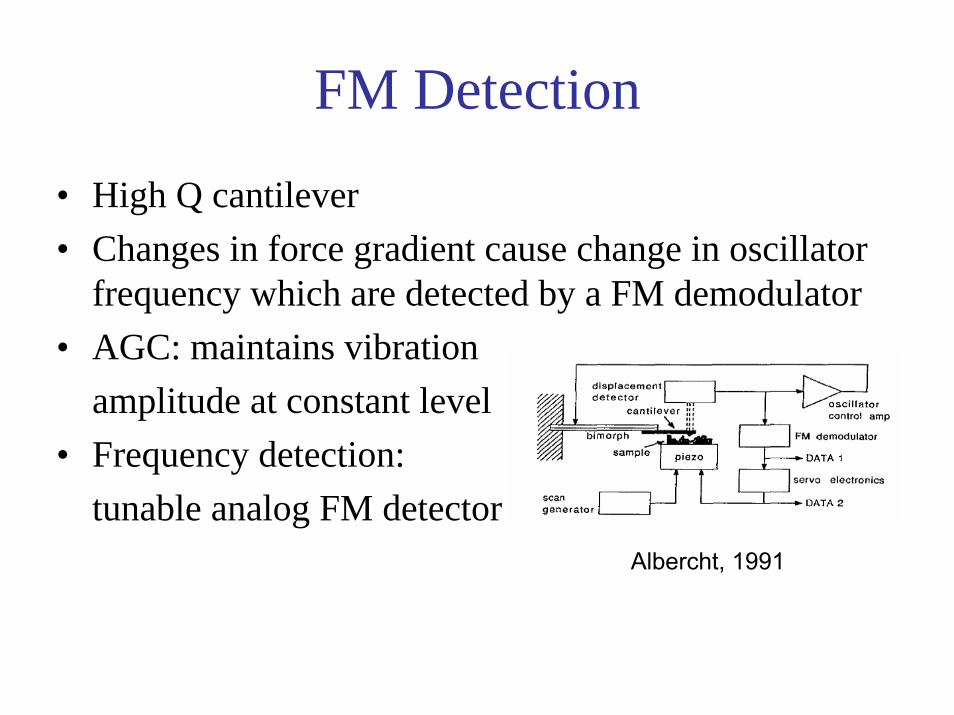
FM Detection
• High Q cantilever • Changes in force gradient cause change in oscillator
frequency which are detected by a FM demodulator• AGC: maintains vibration
amplitude at constant level• Frequency detection:
tunable analog FM detectorAlbercht, 1991
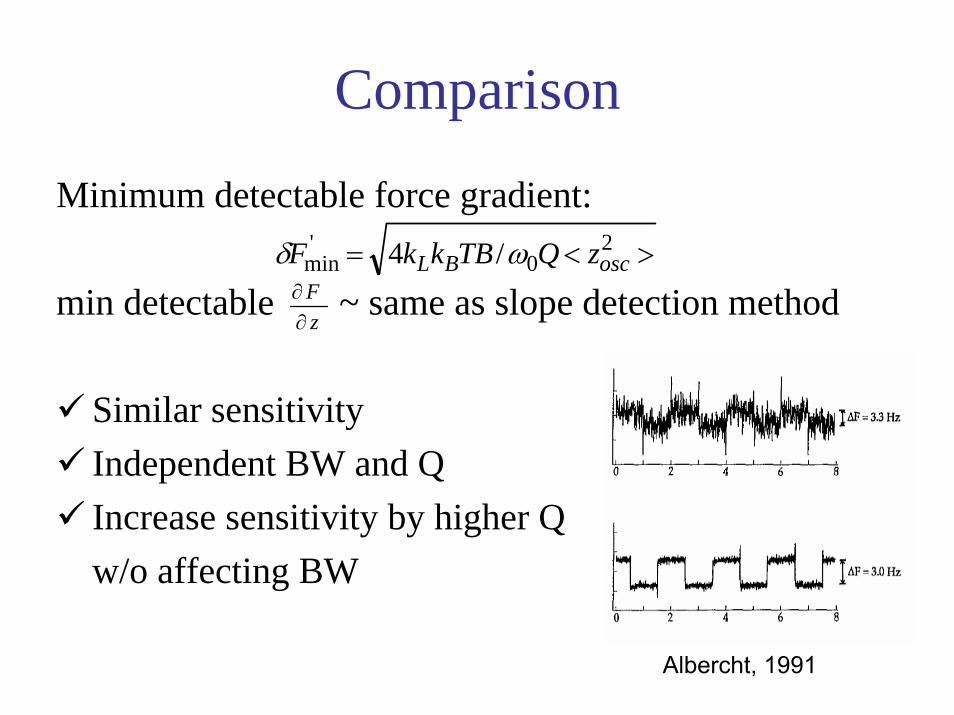
Comparison
Minimum detectable force gradient:
min detectable ~ same as slope detection method
Similar sensitivityIndependent BW and QIncrease sensitivity by higher Q w/o affecting BW
><= 20
'min /4 oscBL zQTBkkF ωδ
zF∂∂
Albercht, 1991
OSCAR
Oscillating Cantilever-driven Adiabatic Reversals• Cantilever acts as frequency determining element • Gain-controlled positive feedback loop drives the
cantilever to oscillate at a set amplitude.• As the cantilever vibrates, position of resonant slice
oscillates through a region of the sample• Spins in the resonant slice cyclically invert due to the
effect of adiabatic rapid passage
OSCAR
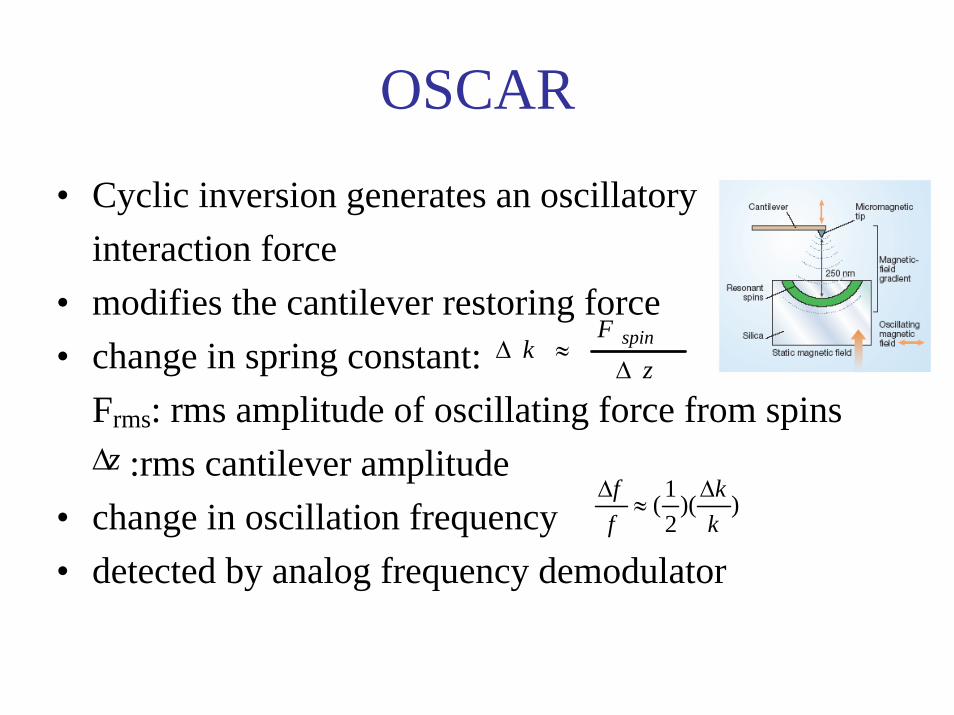
• Cyclic inversion generates an oscillatory interaction force
• modifies the cantilever restoring force• change in spring constant:
Frms: rms amplitude of oscillating force from spins:rms cantilever amplitude
• change in oscillation frequency• detected by analog frequency demodulator
zF
k spin
Δ≈Δ
zΔ))(
21(
kk
ff Δ≈
Δ
OSCAR
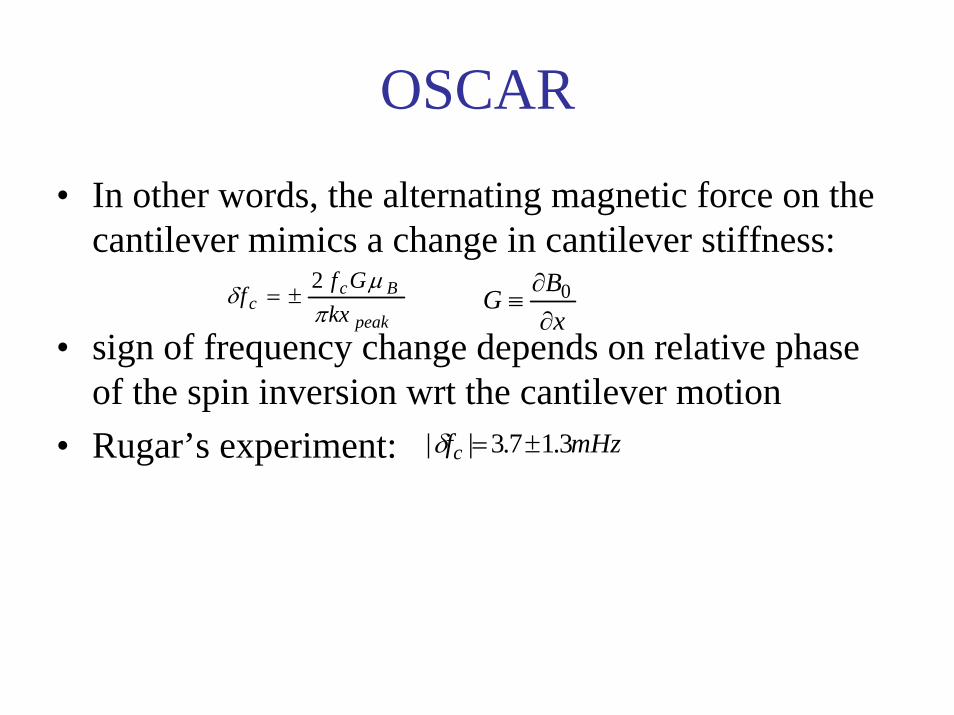
• In other words, the alternating magnetic force on the cantilever mimics a change in cantilever stiffness:
• sign of frequency change depends on relative phase of the spin inversion wrt the cantilever motion
• Rugar’s experiment:
peak
Bcc kx
Gffπ
μδ
2±=
xBG∂∂
≡ 0
mHzfc 3.17.3|| ±=δ
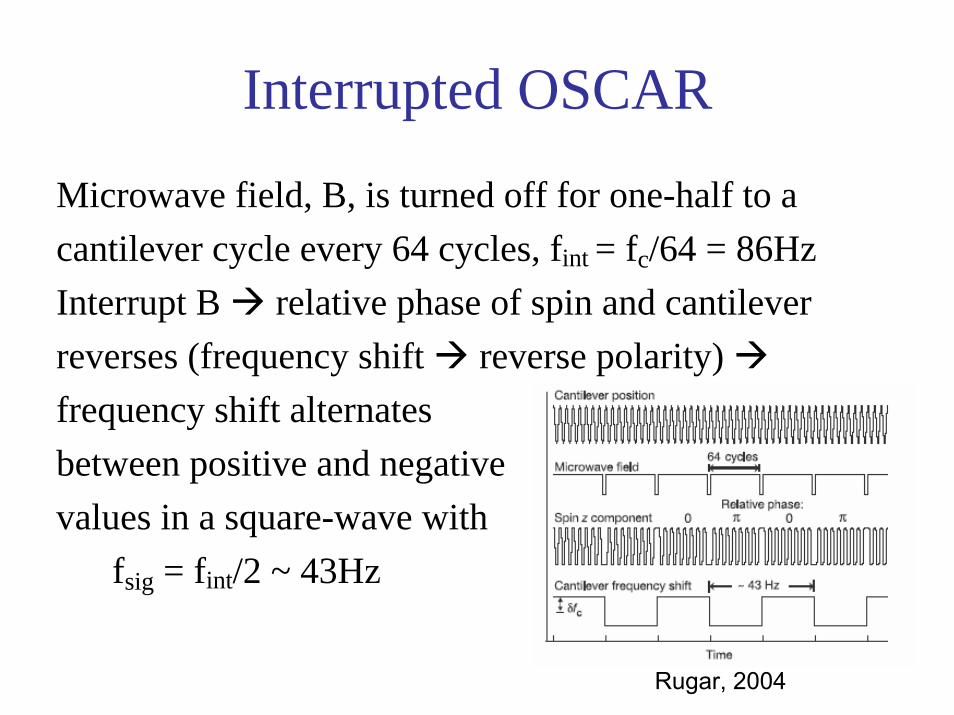
Interrupted OSCAR
Microwave field, B, is turned off for one-half to acantilever cycle every 64 cycles, fint = fc/64 = 86HzInterrupt B relative phase of spin and cantilever reverses (frequency shift reverse polarity) frequency shift alternates between positive and negativevalues in a square-wave with
fsig = fint/2 ~ 43Hz
Rugar, 2004
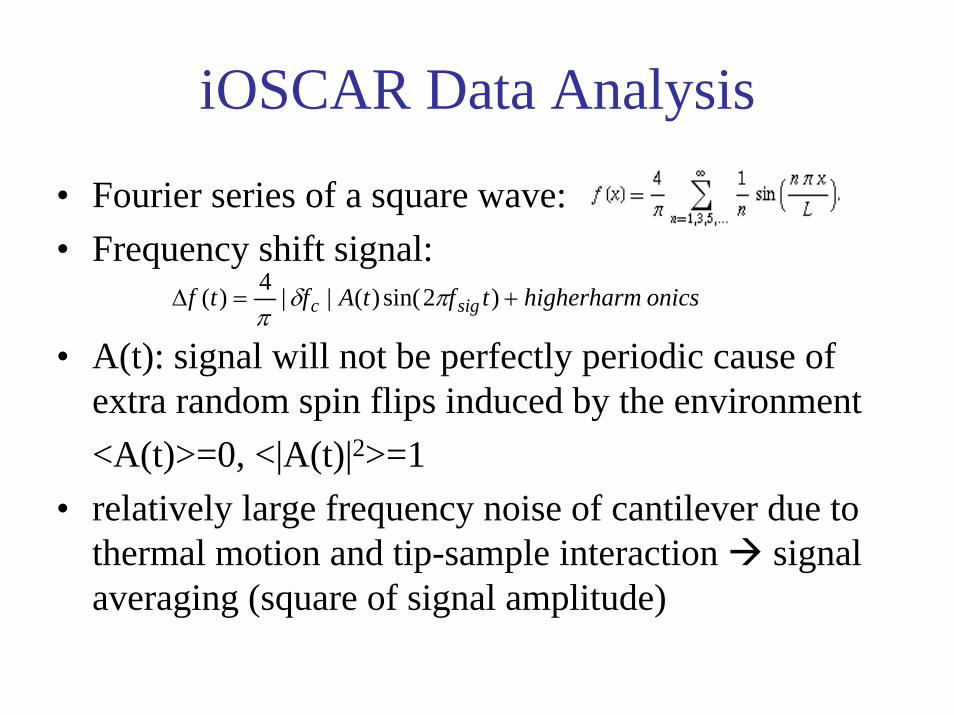
iOSCAR Data Analysis
• Fourier series of a square wave:• Frequency shift signal:
• A(t): signal will not be perfectly periodic cause of extra random spin flips induced by the environment<A(t)>=0, <|A(t)|2>=1
• relatively large frequency noise of cantilever due to thermal motion and tip-sample interaction signal averaging (square of signal amplitude)
onicshigherharmtftAftf sigc +=Δ )2sin()(||4)( πδπ
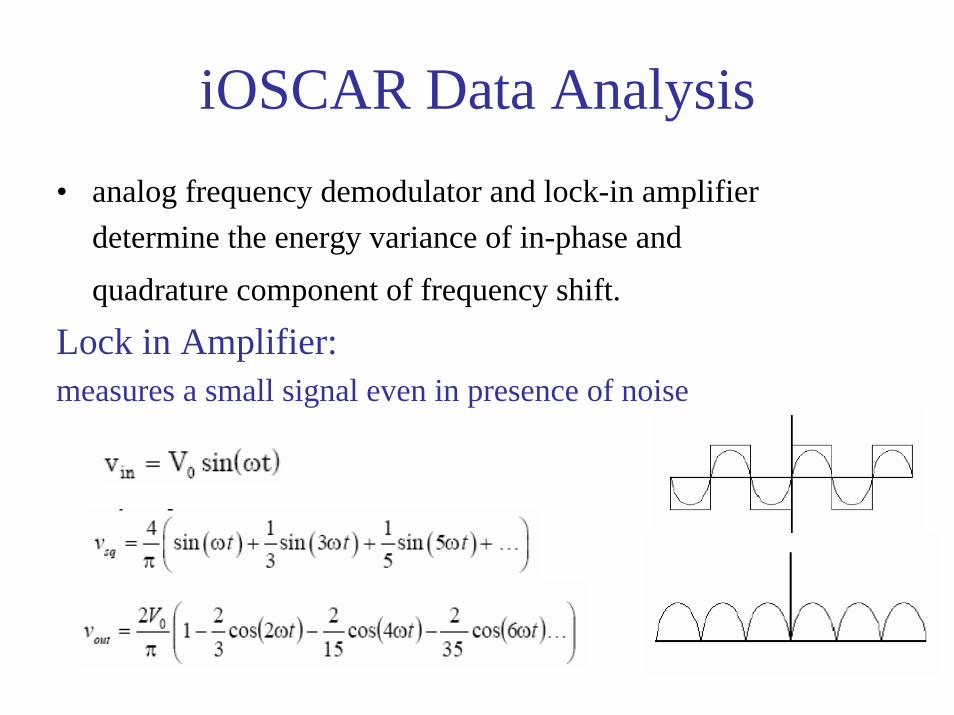
iOSCAR Data Analysis• analog frequency demodulator and lock-in amplifier
determine the energy variance of in-phase and
quadrature component of frequency shift.
Lock in Amplifier:measures a small signal even in presence of noise
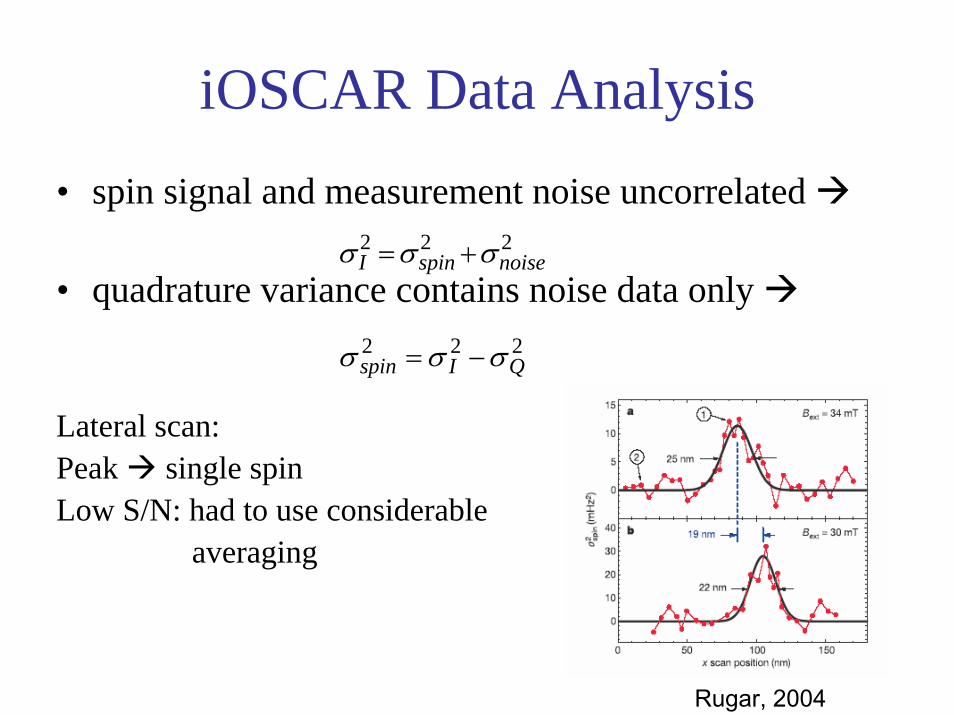
iOSCAR Data Analysis• spin signal and measurement noise uncorrelated
• quadrature variance contains noise data only
Lateral scan:Peak single spin Low S/N: had to use considerable
averaging
222noisespinI σσσ +=
222QIspin σσσ −=
Rugar, 2004
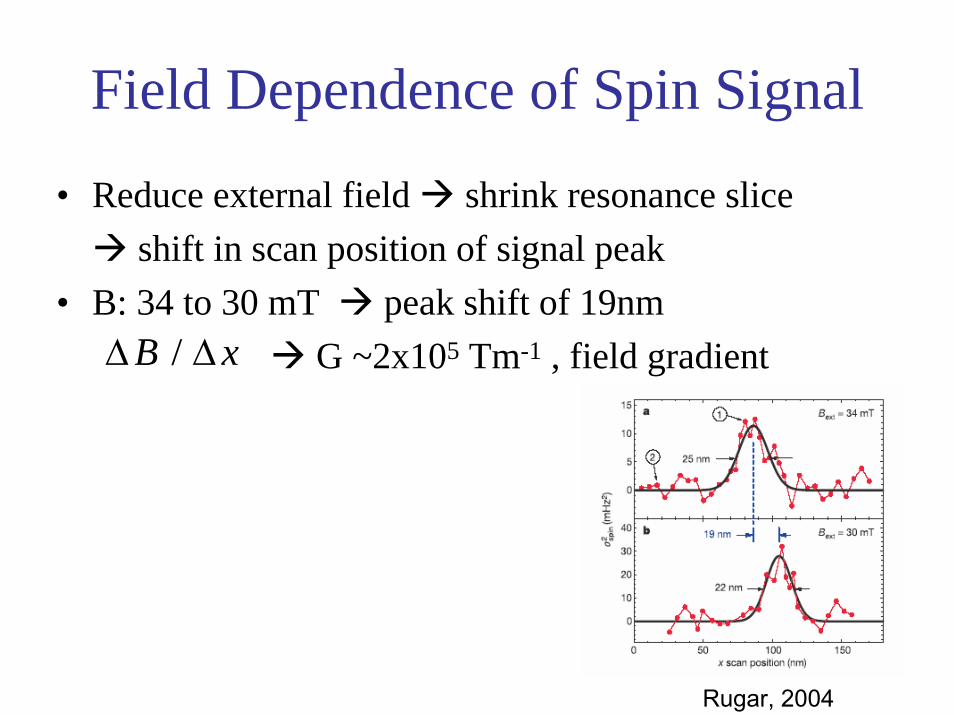
Field Dependence of Spin Signal
• Reduce external field shrink resonance slice shift in scan position of signal peak
• B: 34 to 30 mT peak shift of 19nmG ~2x10⁵ Tm-1 , field gradientxB ΔΔ /
Rugar, 2004
Magnetic Resonance Dependence
• signal disappeared if the microwaves were absent orturned on continuously
• varying the timing of microwave interruptions different outcome
• signal disappeared if the starting time of interruption was shifted by ¼ of the cantilever cycle
• signal disappeared when the interruption duration was a full cantilever cycle
Single Spin Detection
Spatial isolation of the spin signal single spin Low spin density: 1013 to 1014 cm-3
– 200 to 500 nm spacing between spins– most sample locations have no spin interacting with the
resonant slice zero baseline in previous plot
A spin signal sample was scanned through ~30 independent locations in order to locate a well-positioned spin and hence obtain a strong signal.
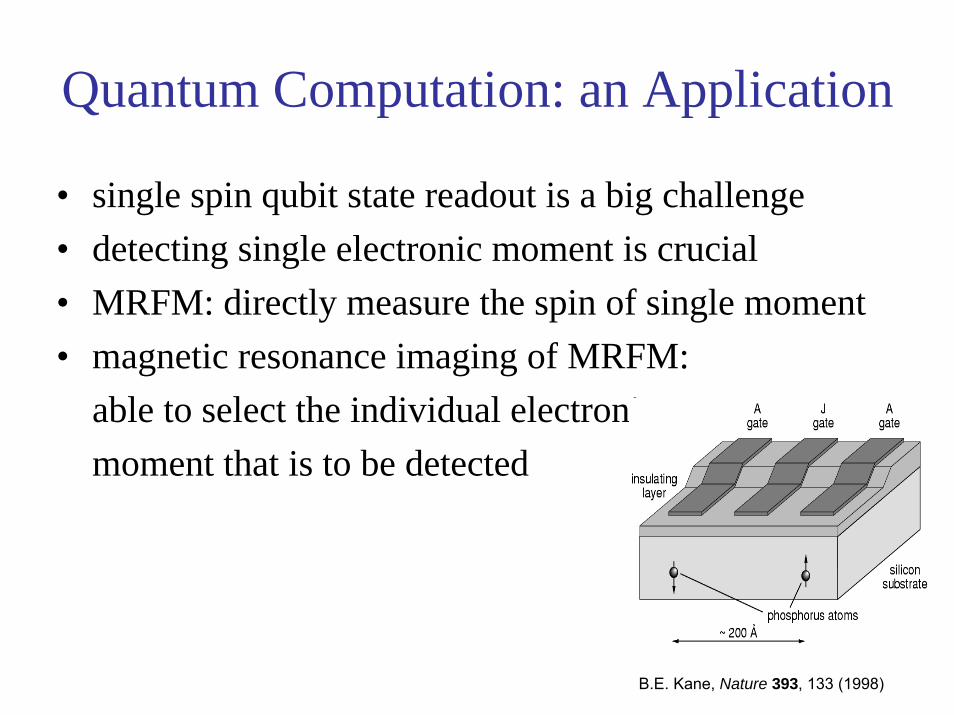
Quantum Computation: an Application
• single spin qubit state readout is a big challenge• detecting single electronic moment is crucial• MRFM: directly measure the spin of single moment• magnetic resonance imaging of MRFM:
able to select the individual electronicmoment that is to be detected
B.E. Kane, Nature 393, 133 (1998)
ReferencesAlbrecht, T. R., Grutter, P., Horne, D. Rugar, D. Frequency modulation detection using high-Q cantilevers for enhanced
force microscopy sensitivity. J. Appl. Phys. 69, 668-673 (1991).Hammel, P. C. Seeing single spins. Nature. 430, 300-301 (2004).Rugar, D. Budakian, R. Mamin, H. J. Chui, B. W. Single spin detection by magnetic resonance force microscopy.
Nature. 430, 329-332 (2004). Stipe, B. C., Mamin H. J., Yannoni C. S., Stowe T. D. , Kenny, T. W., Rugar, D. electron spin relaxation near a Micron-
size ferromagnet. Phys. Rev. Lett. 87, 277602 (2001).
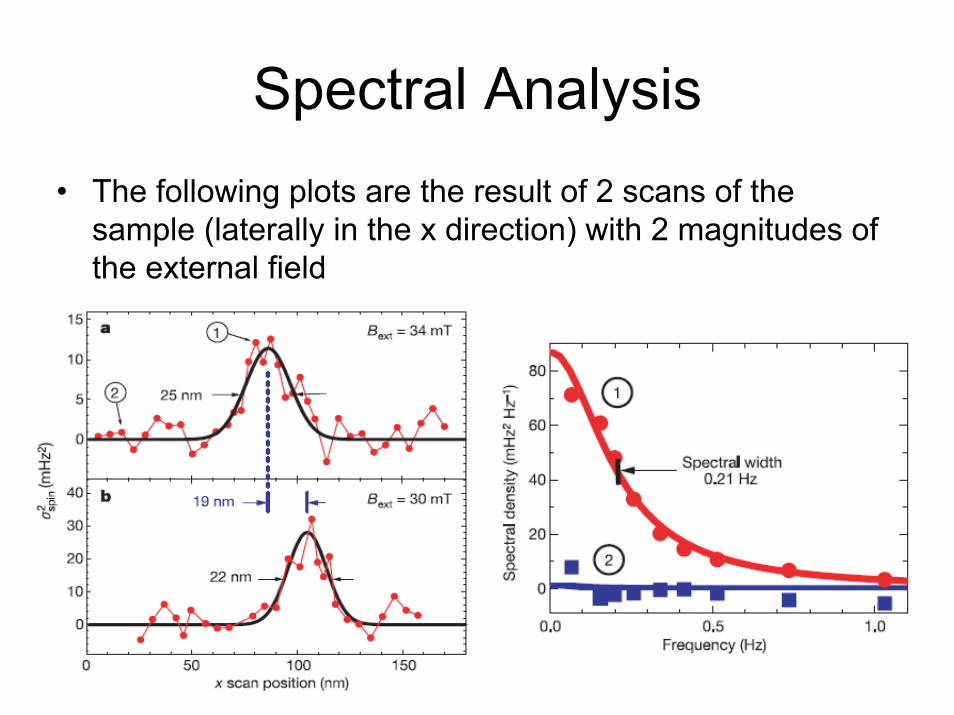
Spectral Analysis• The following plots are the result of 2 scans of the
sample (laterally in the x direction) with 2 magnitudes of the external field
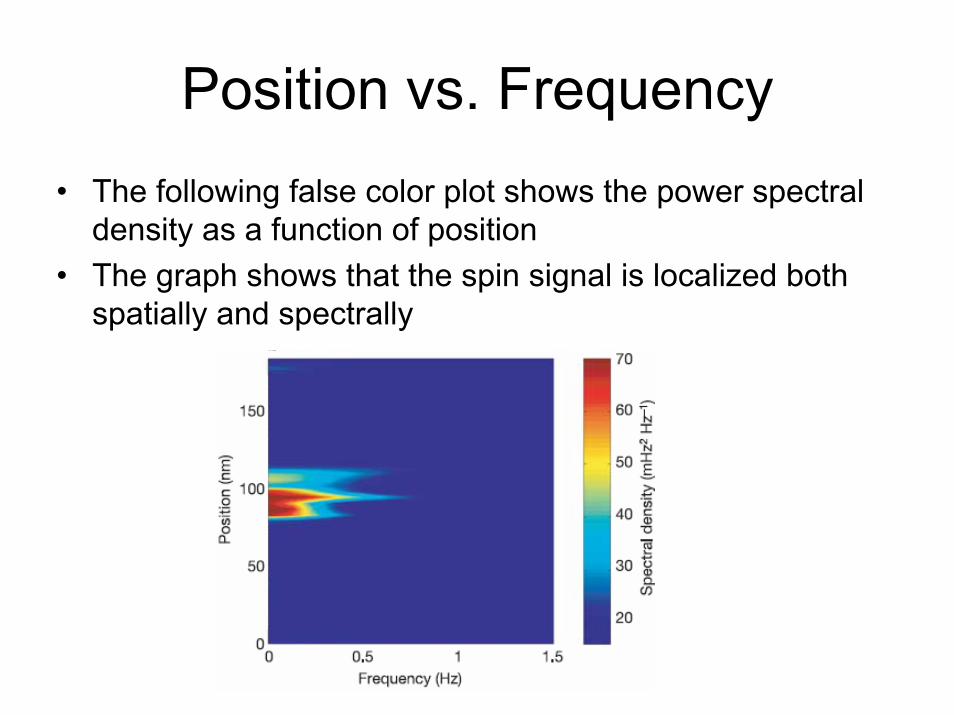
Position vs. Frequency• The following false color plot shows the power spectral
density as a function of position• The graph shows that the spin signal is localized both
spatially and spectrally
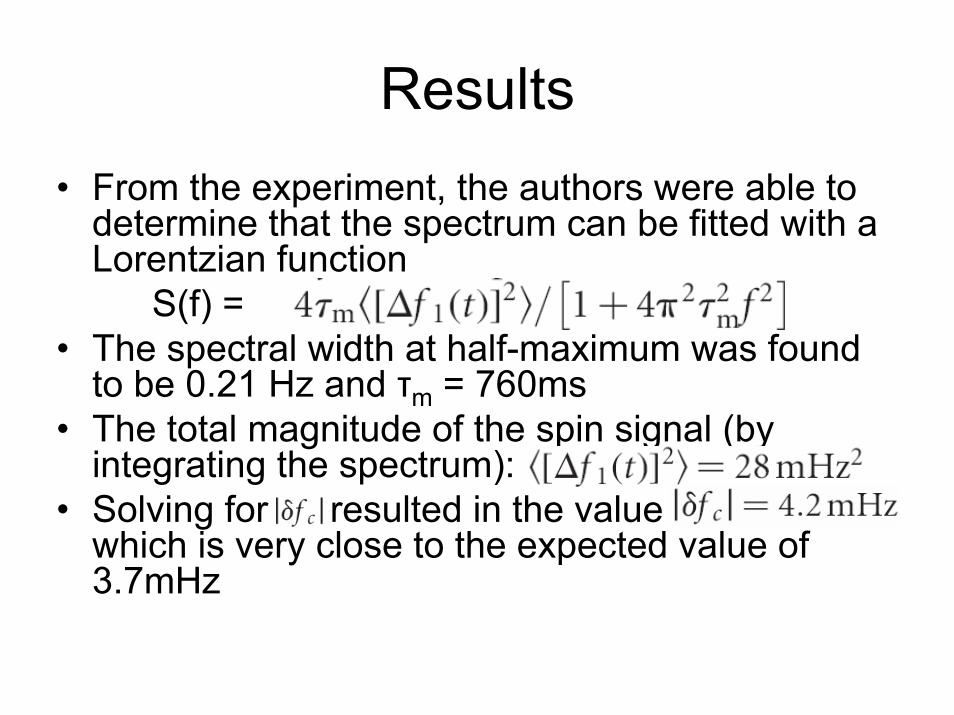
Results• From the experiment, the authors were able to
determine that the spectrum can be fitted with a Lorentzian function
S(f) = • The spectral width at half-maximum was found
to be 0.21 Hz and τm = 760ms• The total magnitude of the spin signal (by
integrating the spectrum):• Solving for resulted in the value
which is very close to the expected value of 3.7mHz
Improvements• Although the results are an astounding success, further
improvements are still possible (and in some cases, needed)
• The authors suggest that the following improvements are needed:– A higher field gradient, resulting in a dramatic speed increase in
the acquisition time (possibly enabling 2-D and 3-D imaging)– A decrease in the measurement time to below Tm allowing for a
real time readout of the spin quantum state– Extension to single nuclear spin detection – requires a 1,000 fold
improvement in magnetic moment sensitivity