Magnetic elds and ionized gas in nearby late type · PDF fileMagnetic elds and ionized gas in...
10
Astronomy & Astrophysics manuscript no. 4236 c ESO 2006 November 2, 2006 Magnetic fields and ionized gas in nearby late type galaxies * K.T. Chy˙ zy 1 , D.J. Bomans 2 , M. Krause 3 , R. Beck 3 , M. Soida 1 , and M. Urbanik 1 1 Astronomical Observatory, Jagiellonian University, ul. Orla 171, 30-244 Krak´ ow, Poland 2 Astronomisches Institut, Ruhr-Universit¨ at-Bochum, 44780 Bochum, Germany 3 Max-Planck-Institut f¨ ur Radioastronomie, Auf dem H¨ ugel 69, 53121 Bonn, Germany Received date/ Accepted date ABSTRACT Aims. In order to analyze the importance of the star formation rate in generating and amplifying magnetic fields in the interstellar medium we perform a deep continuum polarization study of three angularly large, late type spiral galaxies. Methods. We obtained deep total power and polarization maps at 4.85 GHz of NGC 4236, NGC 4656 and IC 2574 using the 100-m Effelsberg radio telescope. This was accompanied by imaging in the Hα line. We also observed these objects at 1.4 GHz to obtain their integrated fluxes at this frequency and to determine their radio spectra. Results. All galaxies were found to possess weak but detectable total power emission at 4.85 GHz, coincident with regions of recent star formation as traced by bright Hα regions. The surface brightness of the radio-strongest object of our sample (NGC 4656) is comparable to the radio-weakest objects in a sample of more than 50 normally star-forming spiral galaxies for which measurements at 4.8 GHz with the Effelsberg radio telescope are available. The surface brightness of the two other objects is even three times smaller. The fractional polarization of the 2 galaxies of our sample is less than 2%, significantly lower than for spiral galaxies of intermediate types, suggesting that the magnetic fields are not only weaker, but also less ordered than in spiral galaxies. The radio spectra of galaxies in our small sample are indicative of a substantial fraction of thermal emission, with a higher thermal fraction than in spirals with high star formation rates (SFR), while the nonthermal emission in our sample is relatively weak compared to spiral galaxies. We propose an equipartition model where the nonthermal emission increases ∝ SFR ≈1.4 and the ratio of nonthermal to thermal emission increases ∝ SFR ≈0.4 . The objects of our sample still follow the radio-FIR correlation of surface brightness of the total emission, extending it towards the lowest values measured so far. Key words. Galaxies: individual: NGC 4236, NGC 4656, IC 2574 – Galaxies: magnetic fields – Radio continuum: galaxies 1. Introduction The generation of galactic magnetic fields requires strong dynamo action (Beck et al. 1996) driven by Coriolis forces caused by rapid disk rotation. As suggested by Chy˙ zy et al. (2000) rotation alone is not the only agent in gener- ating the large-scale regular and random magnetic fields. In the classical dynamo theory as well as in more recent dynamo concepts (e.g. Blackman 1998, Schekochihin et al. 2004) the energy input from interstellar turbulence is required. Turbulence itself is believed to be powered by star-forming processes. A promising mechanism to gener- ate quickly strong magnetic fields, even with weak Coriolis forces, is the dynamo mechanism based on the Parker in- stability (Kowal et al. 2003, Hanasz et al. 2004, Moss et al. 1999). This process depends directly on the formation of massive stars, because the instabilities grow due to the pressure of cosmic rays (CR) produced by supernovae. This model explains very well the stronger magnetic fields in rapidly star-forming spirals. On the other hand, this may mean that in galaxies forming stars very slowly the insta- bilities cannot produce widespread magnetic fields. Send offprint requests to : K.T. Chy˙ zy Correspondence to : [email protected] * Based on the observations with the 100-m telescope at Effelsberg operated by the Max-Planck-Institut f¨ ur Radioastronomie (MPIfR) on behalf of the Max-Planck- Gesellschaft. The above relation seems to be supported by ob- servations of the low surface brightness irregular galaxy NGC 6822 by Chy˙ zy et al. (2003). This very slowly star- forming galaxy shows only weak signs of global magnetic fields. Until now no detailed radio continuum study of such objects was made. In particular it is not known whether at the low end of the surface brightness distribution the mag- netic field strength decreases continuously in some propor- tion to the star formation rate or drops suddenly to zero below a certain threshold of star-forming activity. In a search for such a threshold we undertook a study of three late type galaxies – NGC 4236, NGC 4656, IC 2574 – showing rotational and other properties intermediate be- tween spirals and irregulars (Tab. 1). We have chosen galaxies of substantial inclination to ensure a long path- length through the disk and hence a higher observed surface brightness. They all have rather low surface brightnesses with different star-forming properties. While NGC 4236 has a star-forming activity symmetrically distributed over the disk, NGC 4656 shows almost all star formation concen- trated in one of the disk halves. The third galaxy, IC2574, has a very low star formation level, restricted to one re- gion in the disk outskirts. NGC 4236 and IC 2574 belong to the M81 group and both show similar color-magnitude diagrams (Karachentsev et al. 2002). IC 2574 seems to be optically very diffuse and does not reveal any obvious nu- cleus (Ho et al. 1998). NGC 4656 belongs to the group of
Transcript of Magnetic elds and ionized gas in nearby late type · PDF fileMagnetic elds and ionized gas in...

Astronomy & Astrophysics manuscript no. 4236 c© ESO 2006November 2, 2006
Magnetic fields and ionized gas in nearby late type galaxies∗
K.T. Chyzy1, D.J. Bomans2, M. Krause3, R. Beck3, M. Soida1, and M. Urbanik1
1 Astronomical Observatory, Jagiellonian University, ul. Orla 171, 30-244 Krakow, Poland2 Astronomisches Institut, Ruhr-Universitat-Bochum, 44780 Bochum, Germany3 Max-Planck-Institut fur Radioastronomie, Auf dem Hugel 69, 53121 Bonn, Germany
Received date/ Accepted date
ABSTRACT
Aims. In order to analyze the importance of the star formation rate in generating and amplifying magnetic fields in theinterstellar medium we perform a deep continuum polarization study of three angularly large, late type spiral galaxies.Methods. We obtained deep total power and polarization maps at 4.85 GHz of NGC 4236, NGC 4656 and IC 2574using the 100-m Effelsberg radio telescope. This was accompanied by imaging in the Hα line. We also observed theseobjects at 1.4 GHz to obtain their integrated fluxes at this frequency and to determine their radio spectra.Results. All galaxies were found to possess weak but detectable total power emission at 4.85 GHz, coincident with regionsof recent star formation as traced by bright Hα regions. The surface brightness of the radio-strongest object of oursample (NGC 4656) is comparable to the radio-weakest objects in a sample of more than 50 normally star-forming spiralgalaxies for which measurements at 4.8 GHz with the Effelsberg radio telescope are available. The surface brightness ofthe two other objects is even three times smaller. The fractional polarization of the 2 galaxies of our sample is less than2%, significantly lower than for spiral galaxies of intermediate types, suggesting that the magnetic fields are not onlyweaker, but also less ordered than in spiral galaxies. The radio spectra of galaxies in our small sample are indicativeof a substantial fraction of thermal emission, with a higher thermal fraction than in spirals with high star formationrates (SFR), while the nonthermal emission in our sample is relatively weak compared to spiral galaxies. We proposean equipartition model where the nonthermal emission increases ∝ SFR ≈1.4 and the ratio of nonthermal to thermalemission increases ∝ SFR ≈0.4. The objects of our sample still follow the radio-FIR correlation of surface brightnessof the total emission, extending it towards the lowest values measured so far.
Key words. Galaxies: individual: NGC 4236, NGC 4656, IC 2574 – Galaxies: magnetic fields – Radio continuum: galaxies
1. Introduction
The generation of galactic magnetic fields requires strongdynamo action (Beck et al. 1996) driven by Coriolis forcescaused by rapid disk rotation. As suggested by Chyzy etal. (2000) rotation alone is not the only agent in gener-ating the large-scale regular and random magnetic fields.In the classical dynamo theory as well as in more recentdynamo concepts (e.g. Blackman 1998, Schekochihin etal. 2004) the energy input from interstellar turbulence isrequired. Turbulence itself is believed to be powered bystar-forming processes. A promising mechanism to gener-ate quickly strong magnetic fields, even with weak Coriolisforces, is the dynamo mechanism based on the Parker in-stability (Kowal et al. 2003, Hanasz et al. 2004, Moss etal. 1999). This process depends directly on the formationof massive stars, because the instabilities grow due to thepressure of cosmic rays (CR) produced by supernovae. Thismodel explains very well the stronger magnetic fields inrapidly star-forming spirals. On the other hand, this maymean that in galaxies forming stars very slowly the insta-bilities cannot produce widespread magnetic fields.
Send offprint requests to: K.T. ChyzyCorrespondence to: [email protected]∗Based on the observations with the 100-m telescopeat Effelsberg operated by the Max-Planck-Institut furRadioastronomie (MPIfR) on behalf of the Max-Planck-Gesellschaft.
The above relation seems to be supported by ob-servations of the low surface brightness irregular galaxyNGC 6822 by Chyzy et al. (2003). This very slowly star-forming galaxy shows only weak signs of global magneticfields. Until now no detailed radio continuum study of suchobjects was made. In particular it is not known whether atthe low end of the surface brightness distribution the mag-netic field strength decreases continuously in some propor-tion to the star formation rate or drops suddenly to zerobelow a certain threshold of star-forming activity.
In a search for such a threshold we undertook a study ofthree late type galaxies – NGC 4236, NGC 4656, IC2574 –showing rotational and other properties intermediate be-tween spirals and irregulars (Tab. 1). We have chosengalaxies of substantial inclination to ensure a long path-length through the disk and hence a higher observed surfacebrightness. They all have rather low surface brightnesseswith different star-forming properties. While NGC 4236 hasa star-forming activity symmetrically distributed over thedisk, NGC 4656 shows almost all star formation concen-trated in one of the disk halves. The third galaxy, IC2574,has a very low star formation level, restricted to one re-gion in the disk outskirts. NGC 4236 and IC 2574 belongto the M81 group and both show similar color-magnitudediagrams (Karachentsev et al. 2002). IC 2574 seems to beoptically very diffuse and does not reveal any obvious nu-cleus (Ho et al. 1998). NGC 4656 belongs to the group of

2 K.T. Chyzy et al.: Magnetic fields and ionized gas in late type galaxies
NGC 4236 H_alpha line
DE
CL
INA
TIO
N (
J200
0)
RIGHT ASCENSION (J2000)12 18 00 17 45 30 15 00 16 45 30 15 00 15 45
69 34
32
30
28
26
24
22
Fig. 1. The Hα image of NGC 4236 with the optical continuumsubtracted
NGC 4631, to which the distance is only 47 kpc and in whichdirection some H i filaments are observed (Rand 1994).
The galaxies are angularly large, with D25 ranging from13′ to 23′ (see Tab. 1). Their expected radio surface bright-ness is too low to be detectable at centimeter wavelengthswith the VLA even with the most compact configuration.On the other hand, they are large enough to be resolved at4.85GHz with 2.′5 HPBW resolution of the Effelsberg tele-scope which enables to identify large-scale star formationdistributions. We decided to use this instrument and fre-quency for our study. To obtain detailed information ontheir star-forming properties, the galaxies were mappedin the Hα line with the 1-m telescope at Mt. LagunaObservatory. This kind of study also brings informationabout the ionized gas properties in slowly star-forming,late-type spirals and especially about the thermal free-freeemission. To make another estimate of their thermal emis-sion from the radio spectrum we measured also their in-tegrated flux densities at 1.4GHz with the Effelsberg tele-scope. Confusion by unresolved background sources is se-vere at this frequency, but high resolution data are avail-able at 1.49GHz (NVSS, FIRST, Condon 1987), enablingthe subtraction of point sources unrelated to galaxies fromour measurements.
2. Observations and data reduction
2.1. Hα images
The optical data for our galaxies were taken with the 1-m telescope at Mt. Laguna Observatory (operated by theSan Diego State University, California) using a Loral/Lesser20482 pixel CCD. The data reduction techniques were thesame as described by Chyzy et al. (2003) and performedin the standard way using the IRAF package. We appliedsmall kernel Gaussian filters to both the Hα and the Rimage to match the slightly different point spread functions.
After this step the continuum subtraction was performed,as described in e.g. Bomans et al. (1997). The maps werecalibrated to the absolute scale and corrected for the N ii
contribution.
2.2. Radio continuum
The total power and polarization observations were per-formed at 4.85GHz with 2.′5 HPBW resolution using thetwo-horn system in the secondary focus of the Effelsberg100-m MPIfR telescope (Schmidt et al. 1993). The tele-scope pointing was corrected by making cross-scans ofbright point sources at time intervals of about 1.5 hour.The flux density was calibrated on the highly polarizedsource 3C286. A total power flux density at 4.85GHz of7.47Jy was adopted using the formulae by Baars at al.(1977). The polarized flux density was calibrated using thesame factors as for total power, yielding a degree of polar-ization of 10.5% for 3C286, which is in good agreementwith other published values (Tabara & Inoue 1980). At4.85GHz we observed NGC 4236, NGC 4656 and IC2574in the azimuth-elevation frame with field sizes of 40′ × 30′,46′× 30′ and 46′× 36′, respectively. The pixel size and sep-aration between scans of 1′ fulfill the necessary (Nyquist)sampling requirement. The scaning velocities were 30′/minfor NGC 4236 and NGC 4656, and 50′/min for IC2574. Weused the NOD2 data reduction package (Haslam 1974). Bycombining the information from the two horns, using the“software beam switching” technique (Morsi & Reich 1986)followed by restoration of total intensities (Emerson et al.1979), we obtained I, Q and U maps for each coverage ofa given galaxy. Those channel maps with an excess sig-nal along the scanning direction were removed from furtheranalysis, resulting in 47 total power and 36 polarized chan-nel maps for NGC 4236, 19 and 19 maps for NGC 4656, and20 and 19 maps for IC2574, respectively. All good mapswere then combined using the spatial-frequency weightingmethod (Emerson & Grave 1988), followed by a digital fil-tering process, that removed the spatial frequencies cor-responding to noisy structures smaller than the telescopebeam. Finally the I, Q and U images were combined intothe maps of total power, polarized intensity, polarizationdegree and polarization position angles. The r.m.s. noiselevels in the final maps of total intensity are 0.4mJy/b.a.,0.7mJy/b.a. and 0.4mJy/b.a. for NGC 4236, NGC 4656and IC 2574, respectively. The corresponding noise levelsin polarized intensity are 0.04mJy/b.a., 0.07mJy/b.a. and0.08mJy/b.a.
At 1.4GHz we used the single horn system in the pri-mary focus of the Effelsberg 100-m telescope. IC2574 wasobserved in a single band at 1.400 GHz with a bandwidthof 20 MHz, whereas for NGC 4256 and NGC 4656 the bandwas splitted into two independent channels centered on1.395 GHz and 1.408 GHz, respectively, with a bandwidthof 14 MHz each. We obtained 21 good quality coverages forNGC 4236 and 14 coverages for NGC 4656 with field sizesof 84′ × 84′, respectively. For IC 2574 we got 12 coverageswith a field size of 60′ × 60′. The maps were scanned inalternating directions along R.A. and Dec. The pixel sizeand separation between the scans were set to 3′. The scan-ning velocity was 4◦/min for NGC 4236 and NGC 4656, and2◦/min for IC2574. We obtained total power maps of thegalaxies with an angular resolution of 9.′3 HPBW and an

K.T. Chyzy et al.: Magnetic fields and ionized gas in late type galaxies 3
Table 1. Basic properties of NGC 4236 NGC 4656 and IC 2574 (mainly from the LEDA database)
NGC 4236 NGC 4656 IC 2574
R.A.2000 12h16m43.s1 12h43m58.s2 10h28m21.s5Dec.2000 +69◦27′51′′ +32◦10′14′′ +68◦24′41′′
Inclinationa 75◦b 83◦c 77◦d
Position Angle 162◦ 35◦ 50◦
Morphol. Type SBdm SBm SABmOptical diameter D25 23.′4 13.′5 13.′5Distance [Mpc] 4.45e 7.5c 4.02e
B-magnitude 10.m06 11.m35 10.m80Absolute B-magnitude −18.m01 −20.m57 −16.m95Mean surface brightness [mag/arcsec2 ] 24.m61 24.m27 24.m52H i mass [M�]c 1.5 × 10⁹ 5 × 10⁹ 6.7 × 10⁸
Rotation velocity (from H i [km/s]) ≈ 85b≈ 75c 67d
a 0◦ = face-onb Honma & Sofue (1997)c Rand (1994)d Martimbeau et al. (1994)e Karachentsev et al. (2002)
NGC 4236 4.85 GHz Total Power + Pol.Int B-vectors
DE
CL
INA
TIO
N (
J200
0)
RIGHT ASCENSION (J2000)12 17 30 00 16 30 00 15 30 00
69 34
32
30
28
26
24
22
Fig. 2. Total power contours and B-vectors of polarized inten-sity of NGC 4236 at 4.85 GHz superimposed onto the Hα image.The contour levels are (3, 5, 8, 12, 18, 26) × 0.3 mJy/b.a. Avector of length of 1′ corresponds to a polarized intensity of0.25 mJy/b.a. The map resolution is 2.′5 HPBW.
r.m.s noise of 5mJy/b.a., 7 mJy/b.a. and 8mJy/b.a. forNGC 4236, NGC 4656 and IC 2574, respectively.
3. Observational results
Below we present the radio data separately for the indi-vidual galaxies. To find possible background sources con-tributing to the integrated flux densities we compared ourtotal power maps at 4.85GHz with high-resolution ones at1.49GHz from Condon (1987), NVSS and FIRST. In our1.4GHz data the contribution from all point sources notobviously related to the galaxy was subtracted from our
NGC4236 4.85 GHz Pol.int+Bvectors of Pol.deg+DSS D
EC
LIN
AT
ION
(J2
000)
RIGHT ASCENSION (J2000)12 17 30 00 16 30 00 15 30 00
69 34
32
30
28
26
24
22
Fig. 3. Contours of polarized intensity and B-vectors of polar-ization degree of NGC 4236 at 4.85 GHz superimposed onto theblue image from DSS. The contour levels are (2, 4, 8, 16, 32) ×
0.04 mJy/b.a. A vector of length of 1′ corresponds to a polar-ization degree of 6.6%. The map resolution is 2.′5 HPBW.
integrated flux densities. At 4.85GHz we applied the “bestsubtraction” (Chyzy et al. 2003) at the positions of back-ground sources to estimate their contribution at 4.85GHz.These values were then used to derive the background-freefluxes at this frequency, listed in Tab. 2.
3.1. NGC 4236
NGC 4236 shows two groups of large H ii regions at bothends of the disk (Fig. 1). They are embedded in diffuse Hα

4 K.T. Chyzy et al.: Magnetic fields and ionized gas in late type galaxies
NGC 4656 H_alpha line
DE
CL
INA
TIO
N (
J200
0)
RIGHT ASCENSION (J2000)12 44 15 10 05 00 43 55 50 45 40 35
32 14
13
12
11
10
09
08
07
06
05
Fig. 4. The Hα image of NGC 4656 with the optical continuumsubtracted
NGC4656 4.85 GHz Total power + H_alpha
DE
CL
INA
TIO
N (
J200
0)
RIGHT ASCENSION (J2000)12 44 15 00 43 45 30
32 14
12
10
08
06
04
Fig. 5. Total power contours of NGC 4656 at 4.85 GHz super-imposed onto the Hα image. The contour levels are (3, 5, 8, 12,18, 26)× 0.65 mJy/b.a. The map resolution is 2.′5 HPBW.
emission. The centre of the galaxy contains only small H ii
regions and much less diffuse emission. Some of the ionizedgas clumps are found as far as 3′ or 3.7 kpc (inclinationcorrected) from the disk plane. This is too far to belongto the disk. Hence, NGC 4236 clearly possesses extraplanarHα emission from regions up in the halo.
The radio emission in NGC 4236 at 4.85GHz has a cen-tral peak in the region where no large groups of H ii regionsare found (Fig. 2). The NW cluster of H ii regions corre-
NGC4656 4.85 GHz Pol. Int +B-vectors
DE
CL
INA
TIO
N (
J200
0)
RIGHT ASCENSION (J2000)12 44 30 15 00 43 45 30
32 16
14
12
10
08
06
04
Fig. 6. Map of polarized intensity of NGC 4656 at 4.85 GHz withB-vectors of the same quantity overlaid upon the DSS red image.The contour levels are (2, 3, 4, 8, 16)× 0.08 mJy/b.a. A vector of1′ length corresponds to a polarized intensity of 0.59 mJy/b.a.The map resolution is 2.′5 HPBW.
IC 2574 H_alpha line
DE
CL
INA
TIO
N (
J200
0)
RIGHT ASCENSION (J2000)10 29 15 00 28 45 30
68 29 00
28 30
00
27 30
00
26 30
00
25 30
00
24 30
00
Fig. 7. Hα image of IC 2574 with the optical continuum sub-tracted. The map covers the most intense star formation regionsin the northern part of the galaxy.
sponds to a radio extension while the SE one is associatedwith a separate source. The gap between this feature andthe central peak corresponds to a region particularly defi-cient in Hα emission.
The polarized sources at R.A.2000 = 12h15m30s,Dec.2000 = 69◦24′ and at R.A.2000 = 12h15m30s, Dec.2000 =69◦34′ are composed of four point sources visible inCondon’s (1987) and NVSS maps. They are certainly back-ground objects. They do not interfere with the galaxy mea-

K.T. Chyzy et al.: Magnetic fields and ionized gas in late type galaxies 5
IC2574 4.85 GHz Total Power + DSS+H_alpha
DE
CL
INA
TIO
N (
J200
0)
RIGHT ASCENSION (J2000)10 29 30 15 00 28 45 30 15 00 27 45 30 15
68 30
28
26
24
22
20
18
Fig. 8. Contour map of IC 2574 at 4.85 GHz superimposed ontothe blue DSS image. The contour levels are (3.2, 7, 12, 14)×0.35 mJy/b.a. The map resolution is 2.′5 HPBW. The insertedfigure represents the same contour map overlaid on our Hα mapcovering the northern part of the galaxy.
surements at 4.85GHz but had to be removed from the1.4GHz integrated flux. The polarized extension NE of thenorthernmost star-forming clump turned out to be a back-ground source, as well. It was deleted in our integratedflux density determinations at both frequencies. The onlydetectable polarized signal not attributed to backgroundsources comes from the central region of NGC 4236 (Fig. 3).
We note that Turner & Ho (1994) found three pointsources in the central region of NGC 4236 which may beradio supernovae. They may at least partly explain the po-larization in the central region.
Integration of the total power map in a polygonal regionencompassing the detectable emission (without backgroundsources) yields an integrated flux density of NGC 4236 at4.85GHz of 23±3mJy. Integration of the map of polarizedintensity in the same area yields a polarized flux density of0.37 ± 0.13mJy which means 3-sigma detection. The cen-tral peak gives 13mJy/b.a. in total intensity and 0.18mJyin polarized intensity which means detection at 4.5 sigmaconfidence level. Integration of the 1.4GHz map yields atotal flux density (corrected for background sources) of48± 6 mJy.
3.2. NGC 4656
In NGC 4656 almost all Hα emission is concentrated in theNE part of the disk (Fig. 4). This region of the galaxy ispopulated by large groups of giant H ii regions surroundedby diffuse emission. At the northeastern end of the diskthey make a hook-like appendix, extending by more than1′ to the east. The SW part of the disk shows very weakHα emission and very few small H ii regions. We also notea weak ridge of Hα emission running parallel to the disk
plane at a distance of about 1′ towards the SE. In the NEhalf of the disk, the space between this ridge and the diskplane is filled with faint diffuse spurs.
The total power radio continuum of NGC 4656 at4.85GHz (Fig. 5) shows two basic components: an elon-gated feature coincident with the NE part of the disk con-taining clusters of large H ii regions and a bright unresolvedsource in the SW disk located within the optical limits ofthe galaxy. This source is found to be a very small object(less than few arcseconds in size) as its flux density fromNVSS (with 50′′ HPBW resolution) and from FIRST (res-olution 10 times better) is almost the same. It is likely tobe a very compact source with no optical counterpart atits well-measured (arcsec accuracy) position from FIRST.We assumed it to be a strong background source and wedropped it from further analyses.
The only obviously polarized feature in NGC 4656 isthe peak of polarized intensity east of the northern diskboundary, south of the hook-like Hα and optical extension(Fig. 6). In this disk region we identified in the FIRST sur-vey three background sources, coinciding with the polarizedpeak. The whole polarization from this region was assumedto be due to background sources and dropped from furtheranalyses, only the upper limit of the integrated polarizedflux after its subtraction has been estimated. Integration ofthe total power map in the polygonal area encompassing allthe visible radio emission yields an integrated flux densityof NGC 4656 at 4.85GHz of 42 ± 5mJy. Integration of themap of polarized intensity over the same area as for thetotal power power emission yields only an upper limit forthe polarized flux of 0.44mJy at 2-sigma confidence level.At 1.4GHz we obtain an integrated background-free fluxdensity of 92± 8 mJy.
3.3. IC 2574
The Hα emission in IC 2574 is almost entirely concentratedNE of the optical disk centre (Fig. 7). Its distribution cor-responds very well to the optically bright star-forming re-gions. There is not much diffuse Hα emission in our map.
The area around the galaxy has a relatively low confu-sion level (unresolved background sources), thus we couldattain an r.m.s. noise of 0.4mJy/b.a. The distribution ofthe radio continuum at 4.85GHz in IC 2574 is highly asym-metric with almost all radio emission concentrated in thevicinity of the NE star-forming clump (Fig. 8). Down to thementioned r.m.s. level no emission has been found from themain galaxy’s body.
In the case of IC 2574 there was no need to account ourintegrated flux densities for a contribution from backgroundsources. Integration of the total power map in a polygonalarea yields an integrated flux density of IC 2574 at 4.85GHzof 9.5± 1.4mJy. Integration of the map of polarized inten-sity in the same area results only in an upper limit of thepolarized flux density of 0.46mJy at 2-sigma confidencelevel. At 1.4GHz we obtain an integrated, background-freeflux density of 19± 8 mJy.
4. Discussion
4.1. The thermal emission
We determined the thermal emission from the galaxies inour sample in two ways. First, we determined their radio
6 K.T. Chyzy et al.: Magnetic fields and ionized gas in late type galaxies
spectral indices from the background-free integrated fluxdensities. Then we used a standard procedure of separat-ing thermal and nonthermal emissions in the way similar tothat described by Chyzy et al. (2003). We assumed the non-thermal spectral index αnt subsequently equal to 0.8, 0.9or 1.0. The results: flux densities Stot at 4.85 and 1.4 GHz,observed spectral index αobs, the assumed nonthermal oneαnt as well as radio and optically derived thermal fluxes Sth
and thermal fractions fth are collected in Tab. 2.We also determined the thermal flux and the thermal
fraction using the calibrated Hα maps in the same wayas in Chyzy et al. (2003). To correct the Hα fluxes of ourgalaxies for absorption we used the total (galactic and inter-nal) extinction corrections in B and/or in V-colour as wellas the reddening EB−V from the LEDA database. Theyare computed using the most recent data also includingcorrections for local anomalies. In converting them to theabsorption in the red domain we compared several meth-ods. First, we converted independently the EB and EV intoER using the appropriate “dust colours” from the NEDdatabase (assuming the colour of total absorption similarto that in our Galaxy). Alternatively we scaled EB and EV
to ER using the extinction ratios from Schlegel et al. (1998).Additionally, we applied the statistical analyses of absorp-tion by Cardelli et al. (1989) to EB−V taken from LEDA.The above variety of methods yielded thermal fractions inthe range 0.45 – 0.63 (NGC 4236), 0.5 – 0.9 (NGC 4656)and 0.62 – 0.78 for IC 2574. The mean values averagedover all methods, together with r.m.s. method-to-methodscatter, are given in Tab. 2.
Niklas et al. (1997) gave the mean thermal fraction at10.45GHz fth = 30%±5% with 15% of the galaxies in theirsample of 74 galaxies having fth ≥ 45%, independent ofmorphological type. They found a mean nonthermal spec-tral slope αnt = 0.83 for their sample of spiral galaxies. Thisimplies a mean fth ' 24% at 4.85GHz. Soida et al. (2001,1996) simulated the radio spectra composed of assumedfractions of thermal and nonthermal emission with the slopeof the latter adjusted to obtain the observed spectral in-dex. They conclude that for the rapidly star-forming spi-rals NGC 3627 and NGC 4254 the model spectrum poorlyfits observations if fth at 10.55GHz is higher than 40%.This implies thermal fractions of these objects at 4.85GHzconsiderably lower than 25%.
The uncertainties of both, the radio and optical methodare quite large, because of a poor knowledge of nonthermalspectra and optical extinction. We note, however, that fortwo objects: NGC 4656 and IC 2574 the lowest thermalfractions obtained for various estimates of optical extinc-tion are comparable to the radio-derived fth for the steepestnonthermal spectra. In NGC4236 the ranges of the opti-cally and radio-determined fth overlap, the optical ones alsobeing somewhat higher. All this seems to favourize rathersteep nonthermal spectra. Both the radio-derived thermalfractions assuming αnt ≥ 0.9 and lowest values from theHα line are consistently higher by a factor of ≥ 1.9 thanthe mean for radio-bright spirals studied by Niklas (1997).To make our estimates similar to those for normal spiralswe would need to assume simultaneously that the nonther-mal spectrum has a slope of 0.65 – 0.70 (considerably flatterthan for normal spirals) and that all our absorption esti-mates are too high by a factor of two. We consider such acoincidence as rather unlikely. It seems that the radio emis-sion of our galaxies really shows a considerably increased
� ��� ��� ��� � � � � � � � ��� ����������������������� !�"�$#����%���&���������('�) *
�
�
�
�
� �
+ ,-. /012-3 45 6 71889 :; <=2?>/ >@
ACBED�FHGJILK MON P%QSRUTWVT
α
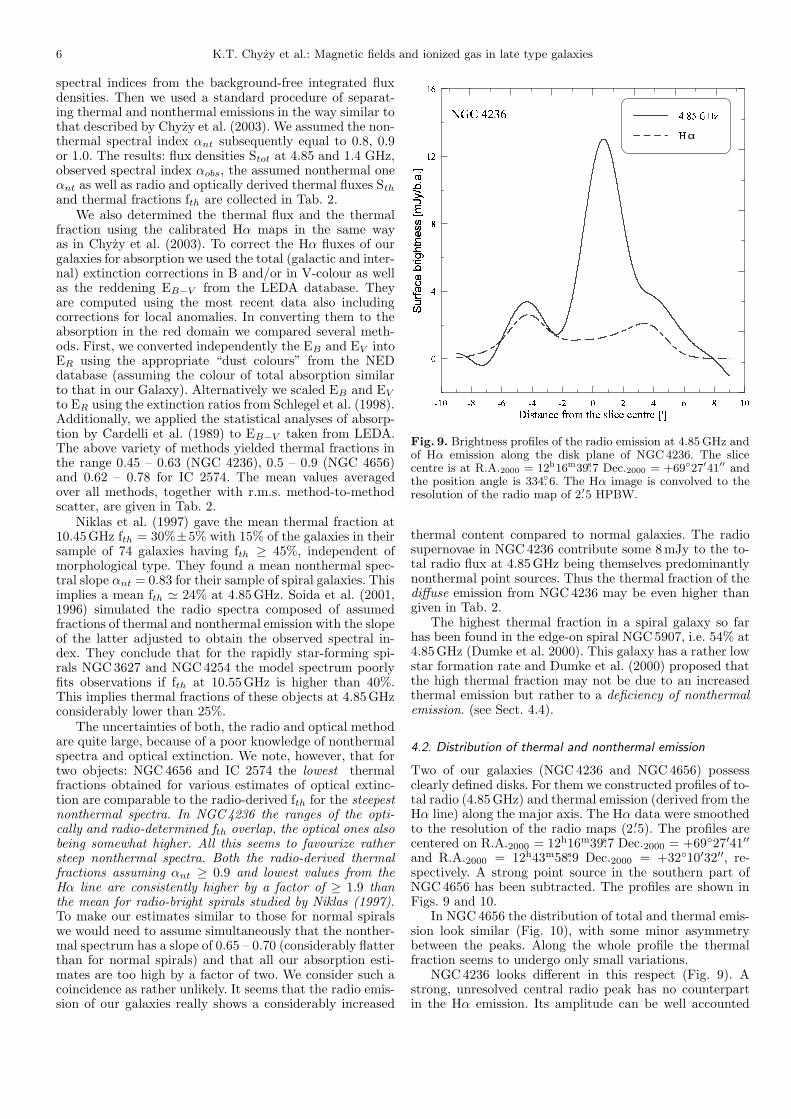
Fig. 9. Brightness profiles of the radio emission at 4.85 GHz andof Hα emission along the disk plane of NGC 4236. The slicecentre is at R.A.2000 = 12h16m39.s7 Dec.2000 = +69◦27′41′′ andthe position angle is 334.◦6. The Hα image is convolved to theresolution of the radio map of 2.′5 HPBW.
thermal content compared to normal galaxies. The radiosupernovae in NGC 4236 contribute some 8mJy to the to-tal radio flux at 4.85GHz being themselves predominantlynonthermal point sources. Thus the thermal fraction of thediffuse emission from NGC 4236 may be even higher thangiven in Tab. 2.
The highest thermal fraction in a spiral galaxy so farhas been found in the edge-on spiral NGC 5907, i.e. 54% at4.85GHz (Dumke et al. 2000). This galaxy has a rather lowstar formation rate and Dumke et al. (2000) proposed thatthe high thermal fraction may not be due to an increasedthermal emission but rather to a deficiency of nonthermalemission. (see Sect. 4.4).
4.2. Distribution of thermal and nonthermal emission
Two of our galaxies (NGC 4236 and NGC 4656) possessclearly defined disks. For them we constructed profiles of to-tal radio (4.85GHz) and thermal emission (derived from theHα line) along the major axis. The Hα data were smoothedto the resolution of the radio maps (2.′5). The profiles arecentered on R.A.2000 = 12h16m39.s7 Dec.2000 = +69◦27′41′′
and R.A.2000 = 12h43m58.s9 Dec.2000 = +32◦10′32′′, re-spectively. A strong point source in the southern part ofNGC 4656 has been subtracted. The profiles are shown inFigs. 9 and 10.
In NGC 4656 the distribution of total and thermal emis-sion look similar (Fig. 10), with some minor asymmetrybetween the peaks. Along the whole profile the thermalfraction seems to undergo only small variations.
NGC 4236 looks different in this respect (Fig. 9). Astrong, unresolved central radio peak has no counterpartin the Hα emission. Its amplitude can be well accounted

K.T. Chyzy et al.: Magnetic fields and ionized gas in late type galaxies 7
Table 2. Confusion-corrected fluxes, spectral indices, observed and assumed nonthermal, as well as thermal fluxes and fractionsof observed galaxies at 4.85 GHz
Galaxy Stot Stot αobs αnt Sth(4.85) fth(4.85) Sth(4.85) fth(4.85)4.85 1.4 radio radio opt opt
[mJy] [mJy] [mJy] [mJy]NGC 4236 23 48 0.59±0.15 0.8 9.0 0.39 11.7 0.51±0.07
0.9 11.6 0.501.0 13.6 0.59
NGC 4656 42 92 0.63±0.12 0.8 13.7 0.33 26.9 0.64±0.140.9 18.9 0.451.0 22.9 0.55
IC 2574 9.5 19 0.56±0.36 0.8 4.2 0.45 6.5 0.68±0.060.9 5.2 0.551.0 6.0 0.63
Note: the uncertainties of optically derived fth result from various estimates of total extinction
� � � � � � � � � � � � ������� �������������������� � �!�"���#���$����&%(' )
�
�
�
* �
* �
+ ,-. /012-3 45 6 71889 :; <=2?>/ >@
ACBEDGFIHIJKH L�M NPORQTSVUS
α
Fig. 10. Brightness profiles of the radio emission at 4.85 GHzand of Hα emission along the disk plane of NGC 4656. The slicecentre is at R.A.2000 = 12h43m58.s9 Dec.2000 = +32◦10′32′′ andthe position angle is 221◦. The Hα image is convolved to theresolution of the radio map of 2.′5 HPBW.
for by the “radio supernovae” found there by Turner & Ho(1994). In the remaining disk (e.g. at the distance of 5′
in Fig. 9) the thermal fraction may be very high, reachingsome 70%. This supports our conjecture from Sect. 4.1 thatNGC 4236 may be dominated by thermal emission, havingvery weak global magnetic fields. We conclude that mech-anisms producing the total magnetic fields in the presenceof weak star formation are rather inefficient.
4.3. Integrated properties
Fig. 11 shows the positions of our galaxies on a radio/FIRcorrelation between the surface brightness at 60µm and at
4.85GHz derived for a sample of normal spirals, measuredat this frequency by Gioia et al. (1982, GGK). The fluxesat 60µm are taken from Helou & Walker (1995) and if notpresent there from Moshir et al. (1990). The values of FIRand radio mean surface brightness have been obtained bydividing the corresponding integrated flux densities (in Jy)by the area within the extinction and inclination-correctedgalaxy radius in the B band at 25mag/arcsec2 taken fromthe LEDA database. No correction for thermal emissionhas been made at this stage. As both the radio and FIRbrightness are random variables we used the orthogonal fitto determine the slope of the best-fit line. In such case sim-ple regressions of FIR vs. radio and radio vs. FIR give theminimum and maximum slope allowed by the data scatter,forming so-called “regression scissors”. We used them aslower and upper limits to the slope of the best-fit line.
Our objects significantly extend the radio/FIR corre-lation at 4.85GHz towards the low surface brightness re-gion. They follow well the correlation line with a slope of0.96±0.06 derived from the GGK sample alone. This meansthat the total (i.e. thermal and nonthermal) emission ofour galaxies of low surface brightness follow the same cor-relation law as normal star-forming, radio and FIR-brightspirals.
It is difficult to say whether the galaxies would lie belowthe correlation line for bright galaxies if only the nonther-mal emission were considered. This needs a larger sample ofgalaxies spanning a broad range of star-forming activities,with radio spectra and Hα data analyzed in a homogeneousway. Such a systematic study is under consideration.
The mean degrees of nonthermal polarization (or theirupper limits) of all galaxies of our sample are given inTab. 3. We compared these rather low values with thoseof other highly-inclined spiral galaxies of similar angularsize measured with the same angular resolution, hence in-fluenced by beam depolarization in a similar way. Theseobjects were observed at 4.85GHz with the 100-m radiotelescope by one of us (MK) in other works. Our compari-son spirals: NGC 891, NGC 3628, NGC 4565 NGC 5907 andNGC 4631 have nonthermal polarization degrees of 3.2%,5.3%, 13.7%, 3.2% and 4.9%, respectively, assuming amean thermal fraction for spirals of 20% at 4.85GHz (seeSect. 4.1). Adopting for NGC 4565 and NGC 5907, whichhave relatively low star formation, thermal fractions as high

8 K.T. Chyzy et al.: Magnetic fields and ionized gas in late type galaxies
� � � � � � � � � � � � � � � � � � � � � � � � �� � � �� � � �
� � � �
� � �
� � �
� � � �
� � � �
� � � �
� ��� �
�
� �� �� � �
� �µ �
� � ! " # $ % & ' ( ) * $ + + # , $ - " ) & , *. / 0 1 2 3 4 " * 5 6 7 8µ
9 : ; < = >
? @ A B C
D > ; E F
D > F < F
Fig. 11. Positions of the galaxies studied on the correlation dia-gram between the face-on corrected surface brightness at 60µmand at 4.85 GHz (in Jy/arcsec2). Small stars show the normallystar-forming galaxies from the sample by Gioia et al. (1982),crossed dots – our objects. The solid line shows the orthogo-nal fit (slope 0.96) to objects from Gioia et al. (1982), dashedlines (slopes of 0.90 and 1.04) are the lower and upper limits tothe best-fit slope (see text). A thick, encircled cross marks theposition of NGC 5907, compared in the text to our galaxies.
as 60% at 10.45GHz (Niklas et al. 1997) which yields 40%at 4.85GHz, we obtain their nonthermal degrees of polar-ization ' 17% and 4%, respectively. The mean degree ofpolarization in NGC 4236 and the upper limit for NGC 4656(Tab. 3) are below all these values. In NGC 4236 the polar-ization degree may be even lower if the bulk of polarizationis due to the radio supernovae (see Sect. 3.1). We suggestthat these two galaxies may have less ordered magneticfields (hence regular fields weaker compared to total ones)than other more rapidly star-forming edge-on spirals. Thismeans that also the mechanism producing regular magneticfields may be less efficient in weakly star-forming galaxies.We note, however, that in case of IC 2574, a weak totalpower emission leads to a yet inconclusive upper limit forthe polarization degree.
4.4. Magnetic fields
We computed the equipartition magnetic field strengths inour galaxies from the nonthermal surface brightnesses (ac-cording to Beck & Krause 2005) in two ways. First, weused the mean value of the nonthermal surface brightnessat 4.85GHz integrated over the whole extent of radio emis-sion or (in case of IC 2574) over the optical extent. As asecond approach, we took the mean nonthermal emissionwithin the area delineated by 5% of the maximum signal orthe area with emission above 2 r.m.s. map level, taking thelarger of these thresholds. We assumed a proton-to-electronenergy ratio of 100. For each galaxy we used the nonthermalspectral index that yielded the best agreement between the
Table 3. Magnetic field strengths and degree of nonthermalpolarization in the observed galaxies.
Galaxy Bt Breg Pol. degree[µG] [µG] [%]
NGC 4236 total 4.4 ± 1.1 0.6 ± 0.2 1.7±1.0NGC 4236 5% 4.7 ± 1.1 0.7 ± 0.2 1.6±0.9
NGC 4656 total 4.7 ± 1.1 < 0.9 ± 0.3 < 2.1a
NGC 4656 2 r.m.s. 4.9 ± 1.2 < 1.0 ± 0.3 < 2.0a
IC 2574 total 4.0 ± 1.1 < 1.2 ± 0.3 < 9.3a
IC 2574 2 r.m.s. 4.3 ± 1.1 < 1.3 ± 0.3 < 8.4a
a upper limit at the 2σ level of integrated flux density uncer-tainty
radio and optically determined thermal fraction in Tab. 2.A synchrotron face-on disk thickness of 1 kpc was assumed.We determined the average brightness of the radio emittingregion in IC 2574 by taking it roughly spherical with a di-ameter of 4.5 kpc. The resulting total and regular magneticfield strengths as well as the mean degree of nonthermal po-larization (corrected for polarized background sources) areshown in Tab. 3. Their errors include the 50% uncertaintiesof the above parameter values.
Our galaxies have relatively low total mean mag-netic field strengths (in the range 4.0 to 4.9µG)when compared to normal spirals (for which themean value depending on the galaxy sample is8 − 10 µG; Beck et al. 1996). In NGC 4236 the meantotal “diffuse” magnetic field may be even weaker if the“radio supernovae” discussed by Turner & Ho (1994) andin Sect. 4.1 are removed.
The galaxies of our sample belong to objects with theweakest total fields so far measured in galaxies. Other spi-rals with weak total and regular magnetic fields are e.g.NGC 5907 (Dumke et al. 2000) and the Sombrero galaxyM104 (Krause et al. 2006). Although the former is a latetype spiral and the latter an early-type spiral, both havelow star formation rates. Furthermore, like the galaxies ofour sample, NGC 5907 has a high thermal fraction whichmay be due to a deficiency of synchrotron emission, whichin turn indicates a low magnetic field strength. A similardeficiency of synchrotron emission seems to be present ingalaxies studied in this work.
According to Dumke et al. (2000) a higher star forma-tion activity may lead to a much more significant increaseof the number density of relativistic electrons and a moreeffective amplification of the magnetic fields, and thereforeto a higher fraction of nonthermal (synchrotron) radiationthan for galaxies with a low star-formation rate (SFR). Amore efficient magnetic field generation is predicted e.g. bythe model of the dynamo process driven by Parker-typemagnetic instabilities boosted by star-formation (Hanaszet al. 2004). The pressure of cosmic rays produced by su-pernovae accelerates the instabilities which in turn leadsto a rapid amplification of both total and regular mag-netic fields (the latter by fast reconnection). This scenariowould be consistent with the situation in the galaxies in oursample: they all have a high thermal fraction, weak totalemission, and low star formation activity. Indeed, Niklas et

K.T. Chyzy et al.: Magnetic fields and ionized gas in late type galaxies 9
al. (1995) found that the lowest thermal fractions occur ingalaxies with the highest SFR.
Niklas & Beck (1997) explained the radio–FIR corre-lation by a simple model where the energies of turbu-lent gas motions, magnetic fields and cosmic rays are inequipartition. As a result, the field strength Bt increases asBt ∝ SFR1/(2N) where N is the exponent of the Schmidtlaw (SFR ∝ ρN , Schmidt, 1959), and the nonthermal sur-face brightness Inth increases as Inth ∝ SFR (3+αnt)/(2N).For N ' 1.4 and αnt = 0.9 we get Inth ∝ SFR ≈1.4. Asthe thermal radio surface brightness is expected to increaselinearly with SFR, the ratio of nonthermal to thermal emis-sion increases with SFR ≈0.4. This simple model can ba-sically explain our result that the nonthermal radio emis-sion and the ratio of nonthermal to thermal emission arenonlinear functions of the star-formation rate. Below somethreshold in star-formation activity, the dynamo may notwork efficiently anymore, and the nonthermal emission maydrop further. Below some low value of SFR, the radio emis-sion may be almost completely thermal, but the radio–FIRcorrelation is still valid. A detailed study of these correla-tions is in preparation.
5. Summary and conclusions
We observed the three angularly large, late-type, slowlystar-forming nearby galaxies NGC 4236, NGC 4656 andIC 2574 with the Effelsberg radio telescope at 4.85GHz inorder to check whether they still host widespread magneticfields. Observations at 1.4GHz were also made to determinethe radio spectra. Our results were carefully accounted forpossible background sources. We also observed these galax-ies in the Hα line to study the distribution of recent starformation and to estimate thermal fractions independentof the radio spectrum. The most important results are asfollows:
– The galaxies possess a very clumpy distribution ofthe Hα-emitting gas. The H ii regions are very non-uniformly distributed being concentrated in selectedparts of the galaxies in a very asymmetric way.NGC 4236 shows even some extraplanar Hα emission.
– A reasonable agreement between mean thermal frac-tions determined from the radio spectrum and from theextinction-corrected Hα line was attained. The galaxiesshow thermal fractions at 4.85GHz considerably higherthan most normal spirals, reaching 0.5 – 0.7 (dependingon the assumptions). This effect is most pronounced forthe radio-weakest objects.
– The galaxies clearly show diffuse nonthermal emissionindicative of widespread magnetic fields. Their mean to-tal surface radio brightness is however smaller than inmost normally star-forming intermediate-type spirals.
– The fraction of nonthermal emission in our objects issmaller than for normally star-forming spirals whichsuggests that magnetic fields are even weaker than onecould expect from their low radio brightness. Their to-tal magnetic fields have mean strengths of 4.0 – 4.9 µG.This result can be explained in terms of the equipar-tition model between turbulent gas motions, magneticfields and cosmic rays, in which the nonthermal emis-sion increases faster than linearly with the SFR (∝SFR ≈1.4) and that the ratio of nonthermal to thermalemission increases with SFR ≈0.4.
– The galaxies still fall on the radio-FIR correlation forthe total surface brightness, following the same slope of0.96± 0.06 as radio-bright spirals. Our sample extendsthe correlation to the lowest values observed so far.
– Weak polarization at 4.85GHz attributable to thegalaxy has been detected only in NGC 4236. Even inthis case it can be due to few young supernova rem-nants. Two galaxies (NGC 4236 and NGC 4656) have anonthermal polarization degree below values measuredfor other edge-on spirals at 4.85GHz with a similar res-olution. The degree of magnetic field regularity of thesetwo weakly star-forming spirals is lower than that ofnormally star-forming and rapidly rotating edge-on spi-rals. The third object (IC 2574) is too weak for anydefinite constraints.
In this work we demonstrated that the slowly rotatingand weakly star-forming spirals observed by us may pos-sess widespread magnetic fields. The field generation mech-anism, especially that of the regular magnetic field, seems tobe less efficient in these objects than in rapidly star-formingspirals. This gives arguments for magnetic field generationtheories involving unstable processes (like Parker instabil-ities) energized by star-forming processes. To what extentthese results apply to slowly star-forming galaxies in gen-eral will be a subject of future projects dealing with a largersample of objects.
Acknowledgements. The authors, (K.Ch., M.S. and M.U.) are in-debted to Professor Richard Wielebinski from the Max-Planck-Institut fur Radioastronomie (MPIfR) in Bonn for the invitationsto stay at this institute where substantial parts of this work weredone. A large part of the work has been done in the framework ofthe exchange program between the Jagiellonian University and Ruhr-Universitat Bochum. We are grateful to Dr. Elly Berkhuijsen for valu-able comments and careful reading of the manuscript. We also wouldlike to thank an anonymous referee for his comments. We acknowl-edge the usage of the HyperLeda database (http://leda.univ-lyon1.fr),the NRAO VLA Sky Survey (NVSS) and Faint Images of the RadioSky at Twenty-cm (FIRST) survey. This work was supported by agrant no. PB0249/P03/2001/21 from the Polish Research Committee(KBN).
References
Baars, J. W. M., Genzel, R., Pauliny-Toth, I. I. K., & Witzel, A. 1977,A&A, 61, 99
Beck, R., Brandenburg, A., Moss, D., Shukurov, A., & Sokoloff D.1996, AR A&A, 34, 155
Beck, R., & Krause, M. 2005, Astr. Nachr., 326, 414Blackman, E. G., 1998, ApJ, 496, L17Bomans, D. J., Chu, Y. H., & Hopp, U. 1997, AJ, 113, 1678Cardelli J.A., Clayton G.C., & Mathis J.S., 1989, ApJ 345, 245Chyzy, K. T., Beck, R., Kohle, S., Klein, U., & Urbanik, M. 2000,
A&A, 355, 128Chyzy, K. T., Knapik, J., Bomans, D. J., Klein, U., Beck, R., Soida,
M., & Urbanik, M 2003, A&A, 405, 513Condon, J. J. 1987, ApJS, 65, 485Dumke, M, Krause, M., & Wielebinski, R. 2000, A&A, 355, 512Emerson, D. T., & Grave R. 1988, A&A, 190, 353Emerson, D.T., Klein, U., & Haslam, C. G. T. 1979, A&A, 76, 92Gioia, I. M., Gregorini, L., & Klein, U. 1982, A&A, 116, 164Hanasz, M., Kowal, G., Otmianowska-Mazur, K., & Lesch, H. 2004,
ApJL, 605, L33Haslam, C. G. T. 1974, A&AS, 15, 333Helou, G., & Walker, D. W. 1995, IRAS Small Scale Structure CatalogHo, L.C., Filippenko, A.V., & Sargent, W.L. 1998, ApJS, 98, 477Honma, M., & Sofue, Y. 1997, PASJ, 49, 539Karachentsev, I. D., Dolphin, A. E., Geisler, D., et al. 2002, A&A,
383, 125Klein, U., Weiland, H., & Brinks, E. 1991, A&A, 246, 323

10 K.T. Chyzy et al.: Magnetic fields and ionized gas in late type galaxies
Kowal, G., Hanasz, M., & Otmianowska-Mazur K. 2003, A&A, 404,533
Krause, M., Wielebinski, R., & Dumke, M. 2006, A&A, 448, 133Martimbeau, N., Carigman, C., & Roy, J.-R. 1994, AJ, 107, 543Morsi, H. W., & Reich, W. 1986, A&A, 163, 313Moshir, M., Copan, G., Conrow, et al. 1990, IRAS Faint Source
Catalogue, version 2.0, Vizier Online Data Catalog, 2156, 0Moss, D., Shukurov, A., & Sokoloff, D., 1999, A&A, 343, 120Niklas, S., 1995, Ph.D. Thesis, University of BonnNiklas, S., Klein, U., & Wielebinski, R. 1997, A&A, 322, 19Niklas, S., & Beck, R. 1997, A&A, 320, 54Rand, R. J. 1994, A&A, 285, 833Schekochihin, A. A., Cowley, S. C., Taylor, S. F., Maron, J. L., &
McWilliams, J. C. 2004, ApJ, 612, 276Schmidt, M. 1959, ApJ, 129, 24Schmidt, A., Wongsowijoto, A., Lochner, O., et al. 1993, MPIfR
Technical Report No. 73, MPIfR, BonnSchlegel, D. J. Finkbeiner, D. P., & Davis, M. 1998, ApJ, 500, 525Soida, M., Urbanik, M., & Beck, R. 1996, A&A, 312, 409Soida, M., Urbanik, M., Beck, R., Wielebinski, R., & Balkowski, C.
2001, A&A, 378, 40STabara, H., & Inoue M. 1980, A&AS, 39, 379Turner, J. L., & Ho, P. T. P. 1994, ApJ, 421,122