Magnetic circular dichroism of matrix-isolated group IVb diatomic oxides
16
Chemical Physics 58 (1981) 355-370 North-Holland Publishing Company MAGNETIC CIRCULAR DICHRCDISM OF MATRIX-ISOLATED GROUP JS’b DIATOMIC OXIDES David POWELL*, Robert BRITTAIN* and Martin VALA Depament of Chemistry, University of Florida, Gainesuille, Rorida 32611, USA Received 15 December 1980 The absorption and magnetic circular dichroism spectra of the diatomic group IVb metal oxides have been measured in argon matrices_ Temperature independent MCD spectra for the three oxides TiO. ZrO, and HfO confirm the assigoments of their ground states to the magoetically nondegenerate ‘Al. ‘Z’, and *Xc states, respectively. The observed MCD spectra for the three oxides consist of A terms, B terms, or no MCD signal. From simple selection ruIe azmsiderations. the appearance (or nonappearance) of particular MCD terms has been used to assign a number of heretofore unknown states and to confirm known assignments. Transitions due to the atomic Ti and Zr species codeposited with the corresponding oxide have also been observed. Temperature dependent C term behavior enabled a straightfonvard differentiation of the atomic bands from the temperature independent molecular bands. Assignments of the atomic transitions consistent with the observed C term signs are reported. I. Introduction En recent papers [I. 21 we have reported on the use of magnetic circular dicbroism in the assignment of electronic transitions in matrix- isolated high temperature atomic and molecular species. In the present paper, we report on the eiectronic-vibronic transitions of the diatomic oxides of the group IVb metals (Ti, Zr, Hf) and, where encountered, their atomic counterparts. Although titanium is relatively abundant in the earth’s crust (0.6%) [3] and TiO is one of the most stable compounds known [4], TiO is seldom encountered on earth. Its preferred form is Ti02 which occurs in the minerals rutile, anatase, and brookite. Nevertheless, TiO has been extensively studied spectroscopically. This wide interest is due to two major factors. First, except for ScO, TiO’is the simplest transition metal oxide known which has d electrons * Present address: Environmental Science Engineering, Inc., Gainesville. FJL, USA. i- Present address: SRI, International. Menlo Park, CA 94025. USA. 0301-0104/81/0000-0000/S02.50 @ North-Holland involved in chemical bonding. It is therefore of interest theoretically since any adequate theory of chemical bonding must be able to account for the role that d electrons play. Second, the spec- tra of the relatively cool class M and S stars are dominated by absorption lines attributabie to TiO. The rotational profile of TiO may be used to determine the temperatures of stellar atmospheres. Thus, any theories of the thermo- dynamics of stellar atmospheres must include the role of TiO. The visible spectrum of TiO has been studied by many workers since the early work of Lowater [5] on the y band system and Christy [6] on the a system. Tracing the changes in several :;tate assignments from that time to the present demonstrates the complexity of the spectral analysis for this simple oxide. In the late 1920’s, the Q system was assigned to a ‘II- 311 transition, and the y system to ‘X-?I. In the early 1950’s, Phillips revised [7] the assignment of the y system to 3A-311. Then, in 1954, based on a comparison with the ZrO spectrum, UhIer suggested [S] that the ground state of TiO should be 3Ar. The assignments were revised
-
Upload
david-powell -
Category
Documents
-
view
214 -
download
1
Transcript of Magnetic circular dichroism of matrix-isolated group IVb diatomic oxides

Chemical Physics 58 (1981) 355-370 North-Holland Publishing Company
MAGNETIC CIRCULAR DICHRCDISM OF MATRIX-ISOLATED GROUP JS’b DIATOMIC OXIDES
David POWELL*, Robert BRITTAIN* and Martin VALA Depament of Chemistry, University of Florida, Gainesuille, Rorida 32611, USA
Received 15 December 1980
The absorption and magnetic circular dichroism spectra of the diatomic group IVb metal oxides have been measured in argon matrices_ Temperature independent MCD spectra for the three oxides TiO. ZrO, and HfO confirm the assigoments of their ground states to the magoetically nondegenerate ‘Al. ‘Z’, and *Xc states, respectively. The observed MCD spectra for the three oxides consist of A terms, B terms, or no MCD signal. From simple selection ruIe azmsiderations. the appearance (or nonappearance) of particular MCD terms has been used to assign a number of
heretofore unknown states and to confirm known assignments. Transitions due to the atomic Ti and Zr species
codeposited with the corresponding oxide have also been observed. Temperature dependent C term behavior enabled a straightfonvard differentiation of the atomic bands from the temperature independent molecular bands. Assignments of
the atomic transitions consistent with the observed C term signs are reported.
I. Introduction
En recent papers [I. 21 we have reported on the use of magnetic circular dicbroism in the assignment of electronic transitions in matrix- isolated high temperature atomic and molecular species. In the present paper, we report on the eiectronic-vibronic transitions of the diatomic oxides of the group IVb metals (Ti, Zr, Hf) and, where encountered, their atomic counterparts.
Although titanium is relatively abundant in the earth’s crust (0.6%) [3] and TiO is one of the most stable compounds known [4], TiO is seldom encountered on earth. Its preferred form is Ti02 which occurs in the minerals rutile, anatase, and brookite. Nevertheless, TiO has been extensively studied spectroscopically. This wide interest is due to two major factors. First, except for ScO, TiO’is the simplest transition metal oxide known which has d electrons
* Present address: Environmental Science Engineering, Inc.,
Gainesville. FJL, USA. i- Present address: SRI, International. Menlo Park, CA
94025. USA.
0301-0104/81/0000-0000/S02.50 @ North-Holland
involved in chemical bonding. It is therefore of interest theoretically since any adequate theory of chemical bonding must be able to account for the role that d electrons play. Second, the spec- tra of the relatively cool class M and S stars are dominated by absorption lines attributabie to TiO. The rotational profile of TiO may be used to determine the temperatures of stellar atmospheres. Thus, any theories of the thermo- dynamics of stellar atmospheres must include the role of TiO.
The visible spectrum of TiO has been studied by many workers since the early work of Lowater [5] on the y band system and Christy [6] on the a system. Tracing the changes in several :;tate assignments from that time to the present demonstrates the complexity of the spectral analysis for this simple oxide. In the late 1920’s, the Q system was assigned to a ‘II- 311 transition, and the y system to ‘X-?I. In the early 1950’s, Phillips revised [7] the assignment of the y system to 3A-311. Then, in 1954, based on a comparison with the ZrO spectrum, UhIer suggested [S] that the ground state of TiO should be 3Ar. The assignments were revised

356 D. Paweil et al. / MCD of matrix-isolated diatomic oxides
again. The presently accepted assignment for the (Y system is C 3&X 3& The MCD results presented here confirm this assignment.
Carlson and Moser [9] and Carlson and Nesbet [lo] carried out the first ab initio caIculations on a heteronuclear molecule containing a transition metal, i.e., TiO. These calculations supported Uhler’s predictions that the ground state of TiO was 3hr and had a (6~) electronic configuration.
The prediction of a ‘h, ground state was confirmed by Weltner and McLeod ‘,I11 in the first matrix isolation study of TiO in 1965. By employing ‘so-substitution and comparing their bands with gas phase transitions, they were able to establish the (0,O) band positions and vibra- tional progressions for the Q, 7, y’, systems in neon and argon matrices.
Like TiO, ZrO has been widely studied because of its astrophysical importance in class S stars [IZ]. One of the characteristic differences between the low surface temperature R and S stars is the predominance of ZrO bands over TiO features in S stars. In the 1950’s, two ZrO singlet bands (designated A and B) were first identified [13, 141 in gas phase spectra. Six triplet emission systems were also observed. In 1957, Akerrind showed [15] that the A and B transitions do not involve a com- mon upper or lower state. Then, in 1965, Weltner and McLeod [ll] carried out a matrix isolation study of ZrO. Until this work, the ground state of ZrO had been considered to be ‘rl., like TiO. However, since at the low temperatures employed, only transitions originating from the %’ state were observed, the ground state designation was changed to ‘1*. The ground states of both ZrCl and HfO are now known [16] to be Ix+. The reversal of the ground state confi,mation of (So) for TiO to (cr)’ for ZrO and HfO is presumed to be due to a cbmbination of heavy atom properties and electron correlation effects [ll]_
Only five years after the discovery of the element hafnium, Meggers [17] published the first study of HfO. This report was followed by investigations by King [lS] and by Shaw and Ketcham f19]. No deiailed state assignments
were made in these studies however. In 1951, Krishnamurti [ZO] published a preliminary note on HfO and, later, Gatterer et al. [a:] reported spectra and preliminary assignments for 9 sequences. The A, F and G systems show fea- tures typical of ‘%‘H transitions, while the B, D, and E systems are typical of ‘&‘2 tran- sitions. Weltner and McLeod [ll] published a matrix isolation study on HfO in which they determined the (0,O) positions for six band systems in neon and argon matrices at 4 and 20 K. By correlating the vibrational frequencies for certain band systems of ZrO with those for HfO, Weltner and McLeod assigned the D, E, and F states to ‘II, III, and l2, respectively. These assignments are in agreement with the gas phase designations of Gatterer et al. [21]. Edvinsson and Nylen [22] later examined the A through G systems and refined the gas phase analyses. SubsequentIy, Edvinsson [23] revised the assignments of the A and I3 systems to the %I0 and ?I1 multiplet levels of a triplet state.
2. Experimental procedures
The magnetic circular dichroism and absorp- tion spectrometers used in this investigation have been described previously [24, 1, 21. A brief description follows. Tantalum or tungsten Knudsen ceiIs containing the triatomic oxide (TiOz, ZrOz, IifOz: Alpha, 99 + c/o optical grade) were resistively heated to 2200, 2630 and 2120 K for TiO, ZrO, and I-If0 production, respectively. The effusive beam was combined with an argon stream (Matheson, research grade; flow rates =2.5 mmoijh) and deposited on a CaF, optical window held at 14 K by a closed-cycle helium cryostat. (Aii Products Dis- plex Model CS-202).
After deposition the sample window was rotated within its permanently-positioned outer shroud and aIigned in the MCD optical train. Radiation from a xenon source (Eiiac, 300 W) was dispersed by a 0.75 m monochromator (Spex) and then converted to alternating (at 50 kHz) circularly polarized light by a photo- elastic modulator (Morvue, PEM3) and linear
D. PoweU et al. f MCD of matrix-isolated diatomic oxides 3.57
polarizer (Lambrecht). The magnetic field was produced by a small electromagnet (0.55 T). The radiation transmitted through the sample cryostat impinged on a photomultiplier tube (EM1 9683QB), whose dc signal was kept constant by a gain-feedback circuit. The ac signal was detected by a lock-in amplifier (Ithaca Model 391) referenced to the PEM’s 50 kH2 oscillation frequency. The output from the lock-in was fed to a strip chart recorder for immediate inspection and to a microcomputer (PET-2001) via an A/D interface for digital storage of the data. The microcomputer also served to advance the monochromator wavelength drive via a stepper motor contro1 and to control the dc voltage applied to the PEM so that its A/4 retardation was constant throughout the wavelength region of interest.
Absorption spectra were run on the same sample/matrix with a pseudo-double beam absorption apparatus. The magnet was rolled away and the PEM-polarizer combination replaced by a dual-slotted chopper disc, which modulated the focused image of the mono- chromator’s exit slit at 150 Hz (top half) and 270 Hz (bottom half). The top beam was reflected around the sample cryostat via a set of mirrors while the bottom beam traversed the sample. Both beams were combined at the PM tube, whose output signal was fed to two lock- ins (referenced to 150 and 270 Hz) and finally sent to a logarithmic/ratio module (Analog Devices 757N). Its output [log (lo/l): the desired absorbance] was routed to the stripchart recorder and to the A/D converter and micro- computer. Spectra were saved in digital form on magnetic tape cassettes.
3. Prediction of MCD terms
Mag;letic circular dicbroism is the difference in the absorbance of Ieft- and right-hand circularly-polarized light.
Asp=&-&. (I)
The theoretical expression which relates :he macroscopic observable, A&, to the microscopic
properties of the absorbing species is [ZS]:
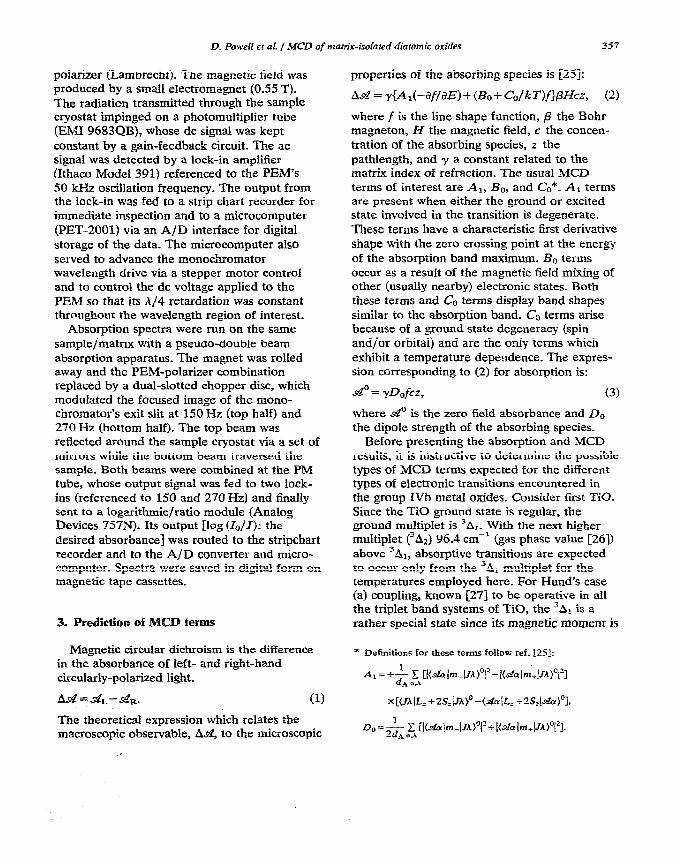
A.& = y{A I(-af/aE) + (Bo -i C,/kT)fJ@kz, (2)
where f is the line shape function, @ the Bohr magneton, H the magnetic field, c the concen- tration of the absorbing species, z the pathlength, and y a constant related to the matrix index of refraction. The usual MCD terms of interest are Al, Bo, and Cc*. AI terms are present when either the ground or excited state involved in the transition is degenerate. These terms have a characteristic first derivative shape with the zero crossing point at the energy of the absorption band maximum. B. terms occur as a resuh of the magnetic fieId mixing of other (usually nearby) electronic states. Both these terms and Cc terms display band shapes similar to the absorption band. Cc terms arise because of a ground state degeneracy (spin and/or orbital) and are the only terms which exhibit a temperature dependence. The expres- sion corresponding to (2) for absorption is:
se0 = yD&.z, (3)
where sB” is the zero field absorbance and Do the dipole strength of the absorbing species.
Before presenting the absorption and MCD results, it is instructive to determine the possible types of MCD terms expected for the different types of electronic transitions encountered in the group IVb metal oxides. Consider first TiO. Since the TiO ground state is regular, the ground multiplet is 3A.. With the next higher multiplet (3A2) 96.4 cm’ (gas phase value [26]) above 3AI, absorptive transitions are expected to occur only from the 3A1 multiplet for the temperatures employed here. For Hund’s case (a) coupling, known [27] to be operative in all the triplet hand systems of TiO, the 3Ar is a rather special state since its magnelic momenr is
* Definitions for these ten-m follow ref. [25!:
A,=+-$ ~,[!(sloIm_l~A)“!~-I(~~Im+l~A)“~~]
x[(~~IL,+2S,(~)~-(~/t,+2S:l~~)~I,

358 D. Powell el al, / MCD of manix-isolared diaiomic oxides
zero. This results from the cancellation of the orbital and spin angular momenta along the molecular axis. Thus, although the ground multipiet displays spin and orbital degeneracies, it will not split in a magnetic field and no C term* is expected. For diatom&, the electric dipole seiection rule [29] is AR = 0, kl so that absorptive transitions from a 3A ground state are allowed to ‘A, 311, and ‘@ excited states. For case (a) behavior, transitions to the 3& and *Tic multiplets are allowed in MCD. Calculation of the expected A terms yields t2 for Al/Do for both transitions. Transitions to a ‘Al excited state are forbidden in MCD since the state does not split. These predictions are based on the case (a) selection rules: A&fJL = 3~1, laMr = 0. In the extreme of large spin-orbit coupling case (c) behavior may be expected. The MCD selection rule is then A&&= *I. The only change that enhanced spin-orbit imeraction has on the predicted MCD terms is to make the 3A1e3A, and ?Izt ‘Ai mukiplet transitions allowed.
Consider next the similar cases of 30 and HfO. Both have 1x+ ground states thereby pre- ciu-ding any C term acrivity. Possible allowed absorptive transitions may occur to ‘Z’ and ‘II
excited states. However, MCD transitions are predicted to occur only to ‘fl states with a positive A term (Al/Do is calculated as +2 for case (a) coupling)_ No MCD or possibly B terms are expected for transitions to ‘8’ states. Thus, for simple case (a) coupling, the observation of either a positive A term or no MCD (or a B term) can lead to the assignment of ‘H or ‘C+ excited states, respectively. Strong spin-orbit coupling will not alter these expectations.
4. Results and discussion
4.1. TiO
The absorption and MCD spectra of TiO in argon at 14 K are given in figs. l-4. The band
* FolIowin~ the practice of Schati and co-workers (see for example ref. [28D, we will use nonsubscripted capital letters (e.g., A, B, C) to denote the type of experkental MCD bands observed and reserve subsctipted Ietters (e.g. Al) for the theoretical quantities.
I.I’,,..,.,..,‘...,.‘..‘...‘, .“““‘.‘.I”’ 350 um 4%lm 550 600 6!50 -x0 En
WAVELENGTH / nm
Fig. 1. Absorption (top) and LMCD (bottom) spectra of TiO in an argon matrix at 14 K in the 3X-780 nm range. The ordinate in the top panel is absorbance (a) and in the lower panel is A (absorbance) = Ld = S&-S&, where S& is the absorbance due to left-hand circularly polarized light.
+
i3A 0
I
TiO&r:l4K
I. * 9 * 8 1 1 * ’ ,
620 624 628 632
‘SAVELENGTHhm
fig. 2. Expanded portion of the B %I (0,O) MCD transition of TiO in argon at 14 K showing the three A terms asso- ciated with three lattice sites. A broad A tern cm be seen underlying the sharp features.

D. PoweN e? al. / MCD of matrix-isolated diatomic oxides 359
E’iI + X’A
TiO/Ar:I4K
WAVELENGlH/nm
Fig. 3. MCD spectrum of the E ?I system of Ti0 in argon at 14 K. Three positive A terms due to site effects can be seen in the 837-841 nm region.
positions, vibrational spacings, and observed MCD terms are listed in table 1. The y and y’ band systems (cf. fig. 1) each display a three- member vibrational progression with charac- teristic A term shape of positive sign*. The MCI) spectrum is temperature independent as expected for a 3A~ ground state. The observa- tion of positive A terms for both band systems is confirmatory evidence for their assignment to 311 c 3A (y’ system) and ‘Q, + ‘A (y system) transitions. Under higher resolution the MCD bands of the y’ system can be seen to be composed of several components. Fig. 2 shows that the y’ (0,O) band contains three sharp, positive A terms and one broad, overlapping positive A term.
One possible interpretation of this structure is that it results from transitions to the spin-orbit split 3&,r,z multiplets. Although the forbidden 311r+3AI transition has been observed [26] in the gas phase, and the spacings between the sharp peaks is close to the observed gas phase multiplet splittings, the MCD transitions to the 3111 and %& levels are predicted to display negative A terms. However, the observed structure contains clearcut positive A terms. A more probable explanation, a site effect, is supported by the following observations: the
* We use the convention [253 that a positive (negative) A term has a negative (positive) lobe followed by a positive (negative) lobe as energy increases.
AA
I I I I Ti,TiO/Ar:i4K
250 300 350
WAVELENGTH/m
Fig. 4. Near ultraviolet region (250-370 nm) of absorption (top) and MCD (bottom) spectra of TiO in argm (14 K). Atomic Ti transitions are marked in the figure: their assignments are given in table 2.
sharp structure was not observed in all matrices prepared and the relative intensities of the component peaks changed upon annealing the matrix. We conclude that the sharp structure results from the B ‘no+- X 3AI transition of TiO molecules in slightly different matrix environ- ments. It is of interest to note that the sharp site structure was not discernible in the absorp- tion spectrum (cf. fig. 1) even under higher resolution.
The (L band system in the region 450-550 nm (cf. fig. 1) shows somewhat broader absorption bands than the y or y’ systems, but strikingly
shows no MCD spectrum. This system has been assigned [26] to a C ‘AreX ‘AI transition and the absence of an MCD signal is confirmatory evidence for this assi,anment. This absence is also strong evidence for case (a) behavior, since for strong spin-orbit coupling, the 3A2 + 3A1 transition is no longer forbidden, and should

360 D. Powell et a!. / MCD of matrix-isolated diatomic oxides
Table 1 Visible absorption and MCD bands of TiO in an argon matrix at 14K
Band D’ I (nm) IX., (cn-‘) hG..+l,l Obseerved assignment (cm-1) MCD
term =’
E3fI 0 839.0 11919 -+A !E system) 1 779.5 12829
910
? 816.0 12255 A39 0 725.4 13785 iA (y system: 1 683.7 i4626
841
2 646.9 15458 832
3 613.5 16300 842
B%K 0 625.4 15990 +A (-/system) 1 594.0 16835
845
2 565.5 17683 848
3 540.0 18519 836
C3& 0 524.1 19080 no MCD (a system) 1 502.4 19904
824
2 482.6 20721 817
3 463.4 215SO 817
4 448.0 22321 741
‘) Vibratioaal members of an electronic band displayed the same MCD activity as the origin band.
have been observed. The small positive MCD peak at 483.5 nm is due to the presence of Ti atoms in the matrix, vide infra. This transition
has-been observed by Gruen and Carstens [30] in their matrix isolation study of Ti atoms. Their assignment of 3D1 +- 3F2 is consistent with the positive sign of the MCD signal and with the temperature dependent behavior expected for a C term characteristic of a 3F2 ground state.
The very weak E system was first observed in matrices by McIntyre et al. [31] and assigned by them to the E 311 t X ‘A transition. The MCD spectrum of the (0,O) band of this band system is shown in fig. 3. (A reliable absorption spec- trum was not obtained for this difficult near IR region due to experimental diiculties.) The more sensitive MCD spectrum shows three positive A terms in this region. We interpret this structure in a similar manner to the y’ system structure: a matrix site effect. In other runs, under slightly different conditions of deposition, the relative peak intensities of these bands varied, though usually the central one remained dominant. The observation of positive
A term behavior is consistent with the 3n c 3A assignment.
The near ultraviolet region, shown in fig. 4, is very congested due to the fact that both Ti atomic and TiO moIecular transitions occur in this region. It has proven possible, however, to differentiate the source of each transition in the MCD spectrum by searching for the tempera- ture independent derivative-shaped molecular bands (A terms) among the temperature dependent single-signed atomic bands (C terms). The Ti atomic bands which are more intense than the TiO bands in this region cor- relate well with the Ar matrix spectrum of Ti analyzed by Gruen and Carstens [30]. The sign of the observed C terms can be used to check the assignments given by these authors. Table 2 lists the Ti atomic transition energies, proposed assignments, observed MCD signs, and predic- ted signs of the C term values based on the proposed assignments. It can be seen that al1 the assignments are consistent with the observed MCD signs with two exceptions. The 287.4 nm band shows a negative C term which is incompatible with the positive value predicted for a 3F2 excited state. We reassign this tran- sition to ‘Fzc3F,, which is observed in the gas phase at 293.4 nm. The strong peak at 255.0 nm displays a strong positive C term which would be forbidden if t%e 3Fa assignment were correct. The MCD indicates that the excited state is probably the ‘D2 located at 263.3 nm in the gaseous spectrum. Three other medium intensity bands, not observed by Gruen and Carstens [30], were found at 298.5 nm, 284.2 nm, and 280.8 nm with positive, positive, and negative C term behavior, iespectively. Their assignment to Ti atomic transitions is given in table 2.
The molecular transitions observed in this region (cf. table 3) all display positive A term activity which eliminates a 3A assignment, but does not differentiate between a ‘TT or “@ assignment, a choice originally suggested by Wendnk and Spindler [32]. Pathak and Palmer [33] have observed a triplet-triplet emission spectrum in thii region in-flames containing TiO which they designated D-X 3A.. Vibrational progressions could not be assigned because of
D. Powell et al. 1 MCD of matrix-isolated diatomic oxides 361
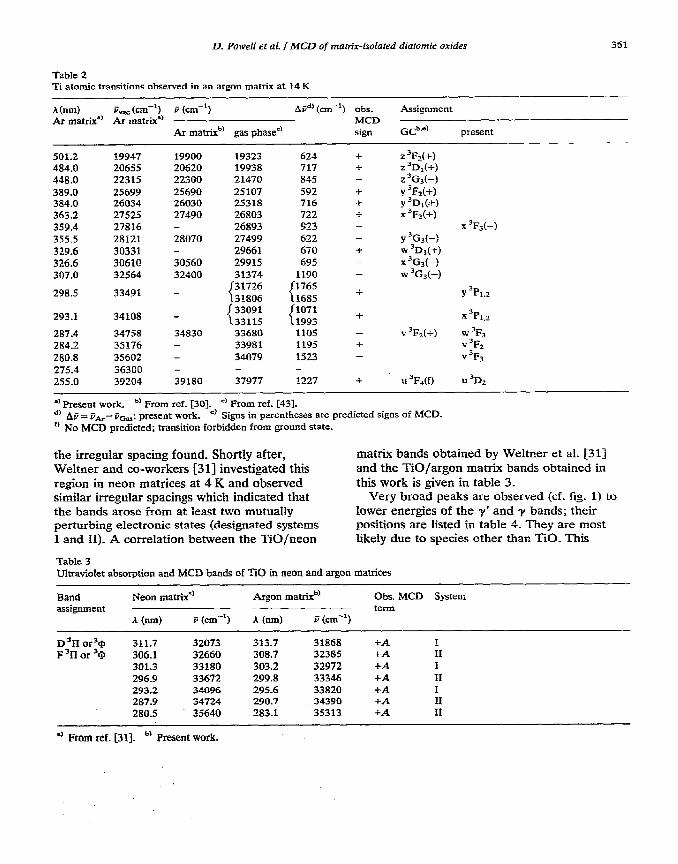
Table 2 Ti atomic transitions observed in an argon matrix at 14 K
A (nm) &IRc (cm-‘) e (cm-‘) Ai+’ (cm-‘) obs. Assignment Ar matrix” Ar matrix” MCD
Ar matrix”’ gas phase” sign GCb” present
501.2 19947 19900 19323
484.0 20655 20520 19938 448.0 22315 22300 21470
389.0 25699 25690 25107 384.0 26034 26030 25318 363.2 27525 27490 26803 359.4 27816 - 26893 355.5 28121 28070 27499
329.6 30331 29661 326.6 30610 30560 29915
624 + 717 •l- 845 - 592 + 716 + 722 t
923 - 622 - 670 + 695 _
z 3F2(+)
z ‘IX(+)
z 3G+)
Y 3Fz(+) Y ‘DIG+)
x %(+) x 3FzH
Y 3G,(-:
w 3D,(+)
x 3G~(-) 307.0 32564 32400
298.5 33491 -
293.1 34108 -
31374 31726
31806 33091
33115
1190 1765
I685 1071
1993
- w 3G,(-)
+ Y %.2
t x +1.2
287.4 34758 34830 33680 1105 - v 3F=(+) w 3Fs
284.2 35176 - 33981 1195 + v ‘Fz
280.8 35602 - 34079 1523 - v 3F3
275.4 36300 - _
255.0 39204 39180 37977 I227 + u 3R(D u 3Dz - -
=’ Present work. b’ From ref. DO]_ =’ From ref. 1431.
d, AI = c,- FG_: present work. =) Signs in parentheses are predicted signs of MCD.
o No MCD predicted; transition forbidden from ground state.
the irregular spacing found. Shortly after, Weltner and co-workers [31] investigated this region in neon matrices at 4 K and observed similar irregular spacings which indicated that the bands arose from at Ieast two mutually perturbing electronic states (designated systems I and II). A correlation between the TiO/neon
Table 3
matrix bands obtained by Weltner et al. [31] and the TiO/argon matrix bands obtained in this work is given in table 3.
Very broad peaks are observed (cf. fig. 1) to lower energies of the y’ and y bands; their positions are listed in table 4. They are most likely due to species other than TiO. This
Ultratiolet absorption and MCD bands of TiO in neon and argon matrices
Band assignment
Neon matrix”
A (m) F (cm--‘)
Argon ma&b?’ Obs. MCD Sjxtem _ term
.& (om) a (cm-l)
D ‘II or% 311.7 32073 313.7 31868 +A I F’iIor 3S 306.1 32660 308.7 32385 i-A II
301.3 33180 303.2 32972 +A I 296.9 33672 299.8 33346 4-A II 293.2 34096 295.6 33820 -i-A I 287.9 34724 290.7 34390 +A II 280.5 35640 283.1 35313 i-A II
l ’ From ref. [31]. ” Present work.

362 il. Potiveil et al. / MCD of matrk-isolated diatomic oxides
Table 4 Broad bands observed in argon matrices containing li0 and Ti at 14K
TiO band
y band
A (ml)
764.3”’ (750.0) 715.3”’
FvIK (cm-‘) ACT,-,112 MCD
term
896 tc
(710.0) (14080) 674.3”’ 14826 >
850 ic
(670.0) (14921) +C y’ band 648.4 1.5418
614.9 16258 >
840 -C
_
585.4 17078 820 1;
=’ Apparent zero phoncn !ine; values in parenrheses represent (phononj band maxima.
tentative conclusion rests on the following pertinent observations.
(1) The intensity of the broad peaks relative to the y and y’ bands varies from matrix to matrix. Ma&Aces displaying strong Ti bands aIso have correspondingly strong broad bands.
for the observed MCD C terms.) An emission spectrum from TiOz in neon matrices (Hg exci- tation at 380 nm) reveaIed [31] a band system beginning at 529.5 nm, i.e. at a wavelength far removed from the present broad bands. Though only suggestive, these observations argue against Ti02 as the species responsible for the broad bands. The close association of the broad peaks with the y and y’ systems indicates a similarity between the unknown species and TiO. Possi- bilities include a Ti-TiOz or Ti-TiO complex or a (TiO)Z dimer. The Ti2 dimer can be definiteIy discounted since its absorption bands [36] do not coincide with the present broad bands. The broad bands associated with the y system exhibit apparent narrow zero phonon lines at the red edge of the bands and broad phonon maxima at higher energies. This suggests a strong interaction between the absorbing species and the matrix, and possibly even a Ar - TiO species. Further work will be necessary to estab- lish the identity of the broad band absorber.
(2) The MCD of the broad bands shows the inverse temperature dependence characteristic of C terms, implying that the ground state of the absorbing species is magnetically degenerate. The sign of the C term is negative for the broad bands associated with the y’ system and positive for the -y system broad bands.
4.2. zro
(3) During deposition the intensity of the broad bands increases relative to the TiO bands as the Knudsen cell temperature is increased from 2140 to 2260 K.
The absorption and MCD spectra obtained for ZrO in argon matrices at 14 K are illus- trated in figs. 5-8. The band positions, vibra- tional spacings, and observed MCD signs are given in table 5. The listed band positions are similar (within experimental error) to those observed by Weltner and McLeod [ll] in their investigation of ZrO in argon and by Bates and Gruen [37] in their recent study of Zr atoms isolated in rare gas matrices.
Hildenbrand [34] has recently shown that the The system with its -(O, 0) transition at equilibrium constant for the gaseous reaction 663.5 nm was assigned by WeItner and McLeod Ti f Ti02 e 2Ti0 decreases as the temperature [ll] to ‘II+ ‘Z+. This assignment was confirmed is raised from 1975 to 2222 K. While it might by Tatum and Balfour [38], aIthough their be inferred from the above that TiOz is analysis of the arc emission spectrum was responsible for the broad bands, several facts complicated by the presence of the strong y argue against its sole participation_ Electric system (b 3Q-X’ ‘A) emission in this region. Our deflection studies [35] and infrared studies [3i] MCD results (cf. fig. 5) show a four-membered have proven that TiOz has a permanent dipoie vibrational progression dispIaying positive A moment and thus possesses a bent (C,,) term behavior which was found to be tempera- geometry. Such a structure precludes ground ture independent. This observation provides state orbital degeneracy. (However, it does not strong confirmatory support for the %I+ 1x+ exclude a spin degeneracy which could account assignment.

LX PoweN e! al. / MCD of matrix-isolated diatomic oxides 363
A
AA
b
ZrO/Ar:I4K
i
0 1 I a I i 1 1 u c
335605600640 680 720
WAVELENGTHhm
Fig. 5. Absorption (top) and MCD (bottom) spectra of 21-0 in argon (14 K) in the 520-720 nm region.
The absorption spectrum in fig. 5 also shows the presence of another electronic transition with a (0,O) band at 602.4 nm. In contrast to the B band system, this system (designated C) does not show the characteristic derivative shape of an A term but weakly mimics the absorption band shape function_ The maxima iu the C system bands correspond in absorption and MCD and furthermore show no tempera- ture dependence, suggesting B term behavior. Weltner and McLeod [11] assigned this system to a ‘III~X ‘IE+ transition, but admitted this was very uncertain. A ‘Z’+X lx+ transition was also deemed possible. The absence of a positive A term precludes its assignment to a ‘S’x transition. The presence of a positive B term indicates that the transition is forbidden in MCD, but observable because of magnetic tieId mixing of nearby states. We conclude that the
Zr:3400 ‘L!z as720
I t
3.50 340 3M 360’ 370 &o c 3;o
WAVELENGTHhm
Fig. 6. Absorption (top) and MCD (bottom) spectra of Zr and ZIG in argon (14 K) in the 330-390 nm region.
‘z+--‘g’ transition is perturbed by the near- lying ‘ITI system. Recently, Phillips and Davis
[39] examined this region closely in a ZrO arc and discovered a ‘IS+-, ‘P’ emissive transition with a (0,O) band at 586.0 nm. This corresponds well with the argon matrix position (602.4 nm) for a gas-to-matrix shift of -465 cm-‘. A similar gas-to-matrix shift (-315 cm-‘) is observed for the B band system.
A prominent band system is observed in the 320-370 nm region (cf. fig. 6). Weltner and McLeod [ll] had previously observed three members of the progression and we have added two more. The vibrational spacings are not qauite regular (cf. table 5). but this may be due to overlap of Zr atomic bands, vide i&a. The triginal assignment of this system by Uhler and Akerlind rl4] to a ‘%‘I. transition was regu-
ded as tentative since thii could not be dis- tinguished from ‘&‘A. Weltner and McLeod

364 D. Powell et al. / MCD of mati+-is&red diafomic oxides
I t 1-1 t I I t I
460 480 500 520 540
WAVELENGTHhn
Fig. 7. MCD spectrum of ZrO in vgon (14 K) in the 460- 540 nm region. Note that the c state designation above should be ; %.
F’ II-X’Z’
7-7-r
AA
c
ZrO/Ar: 14K
b 1 1 1 I I 9 t t 1 1 ’
250 260 270 280 290 3M) WAVELENGTH /nm
Fig. 8. Absoqtion (top) and MCD (hottom; spectra of ZrO in argon (14 K) in the ultraviolet (250-310 nm) rqion.
[11] favored the former assignment on the basis of the similarity between the IR frequency of ZrO in a neon matrix (975 cm-‘) and the gas emission value (969.7 cm-l). The MCD spec- trum (cf. fig. 6) conf%-ms this conclusion since it shows no MCD bands attributable to ZrO. (Instead, only C terms originating from Zr atoms in the matrix are observed in this region. These atomic bands will be discussed fully below.)
Two very weak transitions were observed at 530.4 and 508.0 nm. These bands have pre- viously b’een seen by Weltner and McLeod [11] and assigned by them to the forbidden tran- sition 311+ *X’. In a neon matrix, the first band occurs at 515.4 nm. Exciting into this state with the 514.5 nm line of an Arc ion laser, Lauchlan et al. [4l] observed a strong emission which they attributed to B 3110+ X’ 3A1. Very weak MCD transitions were observed for this system (cf. fig. 7) both with positive A terms_ Although the AS = 0 selection rule is violated* in tran- sitions to 31Yl multiple& the transition to 3111 violates neither the AX = 0 nor the A& = 0 selection rules. A weak, positive A term is predicted for transitions to this multiplet. This accounts for the above obsewations and confirms the ‘II assignment.
Five other weak bands were noted by Weltner and McLeod [Ill but left unassigned. Four can now be assigned_ Two weak bands at 485.5 nm and 463.2 nm show positive A terms (cf. fig. 7) with some site splitting, and can be assigned to 311 or III-+ IX+ transitions. Because of the weakness of these bands, we prefer the ‘II assignments. Two of the other weak tran- sitions at 377.0 and 372.1 nm are readily attri- butable to Zr atomic transitions [37]. These transitions are easily observed in MCD since the ZrO E ‘Pi band systems’ MCD transitions are forbidden. Strong C term behavior is found for these bands as expecied for the Zr 3F2 ground state. Although our major concern in this study is ZrO, enough Zr atoms were present in our
* VioIation of the spin (AS) selection rule Is expected for Zr, even though its spin-orbit coupling is orGy moderately iqe (335 cur’) [40]_

D. PoweN e? al. / MCD of manix-isofared diafomic oxides 365
Table S VisibIe absorption and MCD bands of 21-0 in an argon matrix at 14 K
Band assignment
u’ A (nm)
B ‘II=’ 0 663.5 1.5067 865
+A 1 627.5 15932 2 595.0 16802 870
3 565.9 17666 864 ___
c l=+b)
4 540.0 18513 8141
0 602.4 16596 ___ +B 1 572.8 17453 a>,
2 546.0 18310 857
not observed 0 . 530.4 18849
831 +A, very weak
1 508.0 19680
0 485.5 20592 +A, very peak 0 463.2 211583 +A, very weak 0 367.8 27181 no MCD 1 357.0 28003 822 2 346.9 28819 816 3 337.1 29656 837 4 328.2 30461 805
c W
?I or ‘l-f %I or ‘rf E ‘Zti’
a> Designated as the C system in ref. [ll] and as the e ‘II-X ‘I+ system in ref. [41j; present notation follows ref. 1163. ” Designated as the D system in ref. [llj: however, since ref. [16] uses D for a higher lying ‘A state we suggest the designation
C for this system. ‘I Designated as the B ‘II-X ‘Z’ system in refs. [ll, 411. d, Designated as the b ‘Z’-X *PC system in ref. [41] and as the A system in ref. [ll]. =’ Vibrational members of a progression displayed the same MCD activity as the origin band, unless otherwise noted.
matrices to observe all the moderately intense (and some weak) Zr atomic transitions observed by Bates and Gruen [37]. The matrix band positions, correlation with gas phase bands, observed MCD signs, and excited state assign-
ments are given in table 6. The MCD and absorption spectra of the
ultraviolet region (250-325 nm) are shown in fig. 8. A large number of strong features are noted in this region, some of which are attri- butable to Zr atomic transitions. The majority of the bands are, however, due to ZrO tran- sitions, previously unobserved. Table 7 lists the peak positions of the transitions. In al! cases listed, the peak of the absorption band coincides with the zero crossing point of the MCD band. Both this observation and the bands’ tempera- ture independence characterize them as -4 terms (of positive sign)_ Although more than one transition appears to be present, all are most probably ‘II + ‘Y;+ -transitions. Irregular vibra-
tional spacings (cf. table 7) indicate strong mutual perturbation between these states. A vibrational assignment is outlined in table 7, but, because of the large perturbations, should be regarded as tentative.
4.3. HfO
The MCD and absorption spectra obtained for HfO in argon matrices at 14 IS are given in figs. 9-11 and the transition energies, assign- ments, and observed MCD terms listed in table 8. Because of the high atomic number of Hf, its transitions should be described in the case (c) limit. This is done in table 8 in addition to the historically used case (a) notation. The intensity of the bands in the A and B systems is very weak (cf. fig. 9). The A band at 594.4 nm dis- plays negative B term activity. Gatterer et al. 1211 have assigned the system to a ‘Z state, an assignment supported by Edvinsson and Nylen

366
Table 6
D. Poweli ec al. / MCD of matrix-isolated diatomic oxides
Zr atomic transitions in an argon matrix at 14 K
A (nm)“’ A (m#’ &&m-‘) AP (cm-‘) Ohs. Assignment i\r matrix A? matrix MCD
Ar matrix” gas phase sign B.b.c' present
449.4 - 22246
436.8 436.7 m 228S7 21849 1038 - 2 3Gx(-) Z3GJ
432.2 430.0 VW 23131 21974 1157 i 23.S1
402.8 400.5 VW 24819 23597 1222 t Y%
382.5 381.9 m 26136 24388 1748 - Y’S
377.0 377.1 vs 26516 25730 788 - Y 3G+) Y% 374.7 - 26680 25631 1049 t y ‘Gt
372.0 371.9 5 26874 26062 812 + x3F,(+) x ‘F,
345.7 345.9 w 28919 27482 1437 - W3Ds
340.0 340.1 vs 29403 28404 999 - w %(+I X3Gj
335.0 334.9 s 29842 28801 1041 i L 3G& v 3D,
303.7 305.0 m 32913 31851 1067 + w ”G,(-1 Y %
290.1 290.6 m 34461 33164 1297 t U%
284.8 286.5 s 34894 33487 1407 + u3Dx(+) u3D1 279.6 281.2 vs 35755 34240 1515 _ u 3D3
273.3 272.9 w 36579 35206 1373 + w “P1
248.9 269.1 ms 37178 353115 1665 i t >Fz(+) t 3Fz
260.0 259.4 w 38450 36942 1508 - v 3Gs
‘I Present work. ‘) From ref [37]. ‘) Sign in parenthesis is the predicted sign for the MCD C term.
[22]. Edvinsson [23] later reversed his position and attributed the A and I3 systems to the 3110 2nd 3& ievels, although the high resolution data are consistent with either assignment. The observation of a B term is strong evidence for the former (‘8) assignment, since a positive A
term is expected for a ?I assignment and none is observed. In the B system region, Weltner and McLeod [I-l] discovered two over!apping
(O,O) bands at 564.9 and 558.9 nm. Our MCD
spectrr shows a brozd, positive A term ior the former and a positive B term for the iatter band. We therefore conclude that the~564.9 nm band should be assigned to either *II or ‘II and that 2 %* assignment is ‘warranted for the 358.9 nm band. (We iabel the latter state K in table 8 since the preferred C notation has been reserved for another state, cf. ref. [X1.)
the D system is evident in fig. 10. The E system bands are much less clear; however, upon closer examination several weak, broad A terms may be discerned.
In the 320.0-370.0 nrn region the F and G systems show rather broad bands with distinct vibrational progressions. The MCD shows no signal (cf. fig. 10) as expected for their ‘B+-‘8’ assi,ments. Two very weak bands at 308.5 and 300.9 nm have been observed in the absorption spectrum. They are not pm-t of the G %’ vibrational progression. The first shows a weak +B term while the second displays a weak -B term. The fact that these bands show opposite B
term behavior suggests that they are separate electronic transitiqns, perturbed by different surrounding states. Their assignment to ‘Xi states is indicated.
The region between 370.0 and 440.0 run A number of bands are observed in the W contains the overlapping D and E systems (cf.. fig. 10). Both have been assigned to ‘l-I states.
absorption spectrum between 2.50 and 290 nm (cf. fig. 11). Several (d table 8) can be attri-
This. assi,went is confirmed by the present LMCD results. The expected, positive A term of
buted [42] to Tao present in the matrix. Presumably the Knudsen cell end caps (Ta)

D. Powell et al. / MC.D of matrix-isolated dialomic oxides
TabIe 7 UItravioIet absorption and MCD bands for Zrr in an argon matrix at 14 K”’
367
Band assignment
I km) & (cm-‘) AG..+l,z (cm-‘)
system F system G system H
F1l-I 299.5 G’II 294.5
291.0 287.6 283.5 281.8
33379 33946
34354 I 34760 35263 > 35476
H’l? 278.7 35870 276.0 36221
271.0 36889
264.6 37782
261.0 38303
257.0 38899
252.8 39545
1”’ IP’
975 814
909 1 716
_I 958 74.5
-1
_>
- >
- }
_>
IIlb’
1019
893
521
596
646
a1 AU Iisted bands exhibited a positive A term MCD behavior. b, Presumed (0,O) band.
AA
HfWArl4K
WAVELENGTH /nm
Fig. 9. Absorption (top) and MCD (bottom) spectra of HfO
ia argon (14 K) in the 550-610 nm region. The sensitivity of the MCD spem here is 10X greater than in figs. 10 and 11.
HfO/Ar:l4K
20-x0 360 330 4w 420 440
WAWEiENGTH/nm
Fig. 10. Absorption (top) and MCD (botrom) spectra of HfO in argon (14 K) in the 320-140 nm region.

368 13. Powell et al. / MCD gf m&ix-isolated dintomic oxides
13 260 2;o xx) 320
WAVELENGTHlnm
Fig. 11. Absorption (top) and MCD (bottom) Spectra of HfrJ in argon (14 K) in dtravioiet region (250-320 I&.
reacted slightly, producing Tao. A prominent absorption peak at 274.6 nm shows no MCD and is thus assigned to the HfO N 1Z,i + X ‘C+ transition. Edvinsson end Nylen [22] have observed a gas phase transition at 273.55 nm which probably corresponds to this matrix band. Unfortunately, these authors found that their spectrum was domina?ed by SiO bands in the 230-270 nm region, so that further ,a-matrix comparisons are precluded in this range. The group of three peaks near 260.0 nm all display A term behavior. It seems probable that these three bands do not belong to the same elec- tronic, state, i.e., are not simply due to a matrix site effect. Annealing for l/2 hour at 35 K had no eifect on the relative intensities of these bands. Furthermore, no site effects were dis- cerned in other bands displaying sin&r A term behavior (e.g., D ‘II c X rBt at 424.2 nm), although such splittings were resolvable under the same conditions in analogous bands in TiO. On the other hand, if the excited state were 311 the three bands might arise from transitions to the fi = 0, 1, 2 spin-orbit multiplets. However, since the spin-orbit coupling constant for Hf is large (for neutral -Hfz 1307 cm-i) [40], the multiplet splitting is also expected to be large. Quenching effects could contribute to a smaller splitting, but a decrease from ~1300 to ~200 cm-i is unreasonably large. Thus we
conclude that the bands represent transitions to three separate electronic states of *II or ?I character.
Four additional bands were observed in the 256-250 nm range in absorption (cf. tab!e 7). None of these bands showed an MCD signal. A rZ+ assignment is therefore suggested.
5. slimm2ry
In the present work the power of magnetic circular dichroism spectroscopy for the assign- ment of the electronically excited states of ma’tix-isolated high temperature molecules has been illustrated. Because the group IS% diatomic oxides possess magnetically non- degenerate ground states (a fact confirmed here by the lack of C term activity in any of the three molecules) the observed MCD spectra consist of A terms, B terms, or no MCD signal. From simple selection rule considerations, the appearance of particular MCD activity (or nonactivity) has been used in a qualitative manner to assign heretofore unknown states or to confirm known assignments. In addition it has proven possible to assign a number of elec- tronic transitions for the Ti and Zr atomic species which were codeposited with the corresponding oxides. In both these cases, the temperature dependent C term behavior of the atomic transitions permitted a straight-forward differentiation from the temperature indepen- dent molecular transitions.
The three known [16] visible triplet-triplet systems of TiO (7, y’ and (u) have been ob- served in absorption and MCD. The first two (y, y’) show positive A term behavior and the third (a) no MCD signal, results which confirm their assignments to 3@, 3H, and 3h states, respectively. The weak E system also displayed positive A term behavior which constitutes confirmation of the 311 assignment suggested by Weltner and co-workers [31j. The MCD of the ultraviolet range of TiO showed only positive A terms which eliminates the possible 3Ar assignment but cannot distinguish between the ‘IT or “cf, choices. From previous results [31], it

Table 8
D. Powell et al. / MCD of mafrii-isolated diatomic oxides 369
Absorption and MCD bands for HfO in an xgon matrix at 14 K
Band assignment u’ A (nm) ;;, (cm-‘) AG..+112 (cm’-‘) Observed MCD term
R 2SC1 h
0
1 0 1
1
0
0
0 0
0
1
1 1 0
E’ll
F’Z”
G ‘Xc
L’P v ‘L’ I
N ‘x+
O’iIor%
P’rIor% Q ‘i-Ior3i-i R ‘Z+
O?
0 0 0 1 2 3 0
1 0 1 2 0 1
2 3 4
_
0 1
595.8 16780 594.2 16825 580.0 17237 564.9 17697 558.9 17887 424.2 23567 409.5 24413 395.7 25265 383.1 26095 392.5 25471
379.4 26350 368.8 27107 357.8 27941 347.6 28761 337.3 29639 327.8 30498 319.0 31339 311.0 32145 303.4 32950 308.5 32406
300.9 33224 285.0 35077 280.7 35615 274.6 36406
268.3 37261 262.7 38055 261.3 38259 260.3 38406 255.9 39066
-
846 852 83C
879
834 820
859 841 806 805
-
855
? -B
+A, very broad +A, broad
+B 4-A +A +A CA +A. weak
none none none none none
none
IlOne
*0r,e
+B, very weak
-B, very we& Tao bands TaO bands
IlOne
IlOll-
-i-A
+A +A none
a1 This state is labelled K since C is used in ref. [16] for another state.
appears likely that there are at least two elec- Our MCD results on the known [16] B and tronic transitions in this region. Seventeen E systems of ZrO confirm their respective atomic Ti lines have been observed in lihe 500- *l-i+ ‘Xi and IX*-+ ‘Xi assignments. The weaker 250 nm region. Excited state assignments have C system at ~600 nm in an argon matrix shows been made using the sign of the observed C a positive B term which is interpreted as resul- term as the major criterion. Correlation with ting from the magnetic field mixing of the C ‘IS+ gas phase bands was also performed. The mati state with the near-lying I3 ‘n state. Three very shifts are clearly smaller in the longer weak transitions at 530 nm, 486 nm and 463 nm wavelength range than in the shorter wave- all dispiay positive A signals and are assigned to length range. Broad bands associated with the y spin forbidden ‘Iit ‘x transitions, with ‘l-I and y’ bands of TiO were found to exhibit C designations as less likely alternative choices ior term behavior. Conditions for their appearance the higher two transitions. The ultraviolet are discussed and some possible species region exhibits a plethora of bands, some attri- responsible for the bands speculated upon. butable to ZrO and the rest to atomic Zr. All of

370 D. Powell er al. / MCD of manix-isolared dtaromic oxides
the observed molecular UV bands show positive A terms leading to the assignment of tlxee new ‘fl c- lx+ transitions. Sixteen atomic Zr tian-
sitions have been observed and assigned on the basis of the signs of their C terms.
The six known [16] excited singlet states of HfO (A, B, D, E, F, and G) were confimed as either ‘Z)(R = 0) or ‘II@ = lj on the basis of the lack of an MCD signaI or presence of a B term, or A term, respectively. An overIapped band at 558.9 nm in argon observed previously by Weltner and co-workers has been assigned to a IX+ excited state. Nine new states in the . region 310-254 nm have been observed afid assigned. At present there are no gas phase measurements in this range with which to compare these findings_
El41 U. Uhler and L. Akerlind, Ark. Fys. 10 (1956) 431. [15] L. herlind, Ark. Fys. 11 (1957) 395. [16] K.P. Huber and G. Her&erg, Constants of diatomic
molecules, Vol. 4 (Van Nostrand, Princeton, 1979). [17] W.F. Me&en, J. l&s. Nat:. Bur..Std. 1 (1958) 151. Cl81 AS. King, Astmphys. 3. 70 (1929) 105. [19] R.W. Shaw and H.C Ketcham, Phys. Rev. A45 (1934)
735. [ZO] S.G. Krishnamurti, Proc. Phys. Sot. (Iondon) A64
(1951) 852. [21] A. Gatterer, J. Junkes, E.W. Salpeter and B. Rosen,
in: Molecular spectra of metallic oxides (Specola Vaticana, Vatican City, 1957).
[ZZj G. Edvinsson and Ch. h’ylen, Pbys. Sa. 3 (1971) 261. [23] G. Edvinsson, Ph.D. Dissertation, University of
Stockholm, Sweden (1971). [24] R. B&t&, D. Powell, E. Voigtman and M. Vala, Rev.
Sci. Instrum. 51 (1980) 905. [25] P.J. Stephens, in: Advances in chemical physics, Vol.
35, eds. I. Prigogine and S.A. Rice (Wiley and Sons, New York, 1976).
AcknowIedgement
The National Science Foundation is gratefully acknowledged for its support of this research under grant No. CME 77-00988.
[26] J.G. Phillips, Astrophys. J. 169 (1971) 185. [27] J.G. Phillips, Astrophys. J. 157 (1969) 449. [28] R.L. Mowery, J.C. Miller. E.R. Krausz, P.N. Schatz.,
S.M. Jacobs and L. Andrews, .I. Chem. Phys. 70 (1979) 3920.
[29] G. Henberg. MoIecuIar spectra and molecular struc- ture, Vol. 1, Spectra of diatomic molecules. 2nd Ed. (Van Nostrand, Princeton, i950).
[30] D.M. Green and D.H.W. Carstens. J. Chem. Phys. 54 (1971) 5206.
References
111 R. Brittain, D. Powell, M. Kreglewski and M. Vala, Cbem. Phys. 54 (1980) if.
[2] M. Kreglewski and M Vala, Chem. Phys. 56 (1981) 381.
[?I] N.S. McIntyre, K.R. Thompson and W. Weltner Jr.. J. Phys. Chem. 21 (1971) 3243.
[32] T. Wentink Jr. and R. 3. Spindler Jr., J. Quart. Spec- try. Radiative Transfer 12 (1972) 1569.
[33] CM. Pathak and H.B. Palmer, J. Mol. Spectry. 33 (1970) 137.
[3] EA. Cotton and G. ~l~nson, Advanced inorganic chemistry, 2nd ed. (Interscience, New York, 1966).
[4] L.H. Dubois and J.L. Gale, J. Chem. Phqs. 66 (1977) 779.
[34] D.L. Hildenbrand, C&m. Phys. Latteis 44 (1976) 281. [35] M. Kaufman. J. Muenter and W. Klemperer, J. Chem.
Ph>r. 47 (1967) 3365.
[Sj F. Lowater, Proc. Phys. Sot. (London) 41 (1927) 557. 16-J A. Christy, Phys. Rev. 33 (1929) 701. [7j J.G. Phillips, Astrophys. 3. 114 (1951) 152. [S] U. Uhler, Ph.D. Dissertation, University of Stockholm.
Sweden (1954).
[36] R. Busby, W. Klotzbiicher and G.A. Ozin, J. Am. Chem. Sot. 98 (1976) 4013.
[37] J.K. Bates and D.M. Green, High Temp. Sci. 10 (19783 27.
(381 J.B. Tatum and WJ. Balfour, J. Mol. Spectry. 48 (1973) 292.
[9] K.3. Carlson and C. Moser. J. Phys. Cbem. 67 (1963)
[lo] ~%Carison and R.K. Nesbet, J. Cbem. Phys. 41 (1964) 1051.
[39] J.G. Phillips and S.P. Davies, Astrophys. 3.207 (1976) 632.
[Ill W. Weltner Jr. and D. McJIeod Jr., 3. Psys. Chem. 69 (1965) 3488.
[12] D.N. Davis and P.C. Keenan, Publ. Astron. Sot. Pac. 81 (1369) 230.
[40] J.S. Gri8ith. The Theory of traosition-met& ions (Cambridge Univ. Press, Cambridge. 1961).
[41] L-T. Lauchlan, J.M. Brom fr. and H.P. Broida, J. Chem. Ph>x. 65 (1976) 2672.
[42j R. Brittain, Ph.D. Dissertation, University of Florida, USA (1979).
1131 M. Afaf, Proc. Phys. Sot. (Lcndon) A63 (1950) 674. [43] C.E. AMoore, Natl. Bur. Std. (US). Circ. 467. Vol. 1
(1949).