Macroprudential Solvency Stress Testing of the Insurance Sector
84
WP/14/133 Macroprudential Solvency Stress Testing of the Insurance Sector Andreas A. Jobst, Nobuyasu Sugimoto, and Timo Broszeit
Transcript of Macroprudential Solvency Stress Testing of the Insurance Sector

WP/14/133
Macroprudential Solvency Stress Testing of the Insurance Sector
Andreas A. Jobst, Nobuyasu Sugimoto, and Timo Broszeit
© 2014 International Monetary Fund WP/14/133
IMF Working Paper
Monetary and Capital Markets Department
Macroprudential Solvency Stress Testing of the Insurance Sector
Prepared by Andreas A. Jobst, Nobuyasu Sugimoto, and Timo Broszeit1
Authorized for distribution by Michaela Erbenova
July 2014
Abstract Over the last decade, stress testing has become a central aspect of the Fund’s bilateral and multilateral surveillance work. Recently, more emphasis has also been placed on the role of insurance for financial stability analysis. This paper reviews the current state of system-wide solvency stress tests for insurance based on a comparative review of national practices and the experiences from Fund’s FSAP program with the aim of providing practical guidelines for the coherent and consistent implementation of such exercises. The paper also offers recommendations on improving the current insurance stress testing approaches and presentation of results.
JEL Classification Numbers: F3, G22, G32.
Keywords: insurance, macroprudential surveillance, financial stability analysis, stress testing.
Authors’ E-Mail Addresses: [email protected]; [email protected]; [email protected].
1 Some parts of this paper were completed when Andreas Jobst was Chief Economist of the Bermuda Monetary Authority (BMA) and Vice-Chair of the Financial Stability Data Specialists Subcommittee (FSD) of the International Association of Insurance Supervisors (IAIS). We would like to thank Kalin Tintchev for research assistance, Michaela Erbenova, Jorge Chan-Lau and Martin Čihák for insightful comments, as well as Marcela Gronychová (CNB), Stanislav Georgiev (BaFin), Knut Schäffler (BaFin), Hideki Takeuchi (JFSA), Marc Radice (FINMA), Markus Bachmann (FINMA), Dean Minot (PRA), John Hopman (NAIC) and Philipp Keller (Deloitte) for their invaluable feedback and input to this paper.
This Working Paper should not be reported as representing the views of the IMF. The views expressed in this Working Paper are those of the author(s) and do not necessarily represent those of the IMF or IMF policy. Working Papers describe research in progress by the author(s) and are published to elicit comments and to further debate.

2
Contents Page
Glossary .....................................................................................................................................4
I. Introduction ............................................................................................................................6
II. Overview and Framework .....................................................................................................9 A. Macroprudential Stress Testing for Insurance ..........................................................9 B. Differences between Banks and Insurance Companies and Their Implications for
Stress Testing .........................................................................................................11
III. Process and Methodologies................................................................................................17 A. Object of Analysis ...................................................................................................19 B. Determination of Scope ...........................................................................................20 C. Methodological Framework and Data Quality ........................................................21 D. Valuation and Capital Resources ............................................................................23 E. Scenario Design and Other Assumptions ................................................................28 F. Risk Factors and Aggregation Approaches .............................................................34 G. Output Measures .....................................................................................................43 H. Validation of Results ...............................................................................................49 I. Communicating the Outcome of Stress Tests ...........................................................50
IV. Discussion and Conclusion ................................................................................................54
References ................................................................................................................................59
Appendix I—Tables .................................................................................................................71
Appendix II―Additional Background ....................................................................................81
Tables 1. Overview of Possible Validation Checks ............................................................................50 2. Summary of Key Assumptions in IMF Stress Testing of Insurance Sectors .......................52 Figures 1. Overview of IMF FSAPs and Completion of Insurance Stress Tests ....................................7 2. Number of Completed Insurance Stress Tests in FSAPs Before and After the Global
Financial Crisis ..................................................................................................................8 3. Stylized Insurance Balance Sheet and Solvency Control Levels .........................................15 4. Stress Testing Process ..........................................................................................................17 5a. Overview of Solvency Regimes—Risk Measurement .......................................................26 5b. Overview of Solvency Regimes—Valuation Standards ....................................................26 6. Elements of Risk Assessment and Scope of FSAP Stress Testing ......................................29 7a. Presentation Templates of Outputs (hypothetical singe-period test) .................................46 7b. Presentation Templates of Outputs (hypothetical multiple-period test) ............................47
3
Boxes 1. General Macro-Financial and Systemic Risk Implications for Insurance ...........................16 2. The Taxonomy of Stress Testing Approaches .....................................................................18 3. Recessionary Scenarios in the Insurance Sector ..................................................................31 4. Assessing the Impact of Low Interest Rates on Insurance Activities ..................................33 5. Liquidity Risk in Insurance ..................................................................................................37 6. Examples of Supervisory Approaches of Insurance Stress Testing .....................................39 7. Case Study: Belgium Insurance Stress Test for the FSAP ..................................................49 8. National and IMF Stress Testing for Non-life (Re) insurance—A Case Study of
Bermuda ...........................................................................................................................81

4
Glossary
ALM Asset-Liability Matching BaFin Bundesanstalt für Finanzdienstleistungsaufsicht BCR Basic Capital Requirement BMA Bermuda Monetary Authority BSCR Bermuda Solvency Capital Requirement BU Bottom-up CCAR Comprehensive Capital Analysis and Review CDS Credit Default Swap CEBS Committee of European Banking Supervisors CEIOPS Committee of European Insurance and Occupational Pensions Supervisors CF Cash Flow CNB Czech National Bank CTE Conditional Tail Expectation DC Defined Contribution DFA Dynamic Financial Analysis EBA European Banking Authority ECB European Central Bank ECR Enhanced Capital Requirement EIOPA European Insurance and Occupational Pensions Authority EU European Union EUR Euro FINMA Eidgenössische Finanzmarktaufsicht FSAP Financial Sector Assessment Program FSB Financial Stability Board FSSA Financial System Stability Assessment FX Foreign Exchange GDP Gross Domestic Product GIC Guaranteed Investment Contract G-SII Global Systemically Important Insurance Company IAIS International Association of Insurance Supervisors ICP Insurance Core Principle ICS Insurance Capital Standard IMF International Monetary Fund IOPS International Organisation of Pension Supervisors JFSA Financial Services Agency of Japan MAS Monetary Authority of Singapore MCCSR Minimum Continuing Capital and Surplus Requirements MCEV Market-consistent Embedded Value MCR Minimum Capital Requirement MPS Macroprudential Policy and Surveillance

5
MSM Minimum Solvency Margin NAIC National Association of Insurance Commissioners NBB National Bank of Belgium NTNI Non-traditional, non-insurance NWP Net Written Premiums OFC Offshore Financial Center OSFI Office of the Superintendent of Financial Institutions OTC Over-the-counter P&C Property and Casualty Insurance PCR Prescribed Capital Requirement PML Probable Maximum Loss PRA Prudential Regulatory Authority QIS Quantitative Impact Study RBC Risk-based Capital RoA Return on Assets RoE Return on Equity SCAP Supervisory Capital Assessment Program SCR Solvency Capital Requirement SMR Solvency Margin Ratio SST Swiss Solvency Test STeM Stress Testing Matrix TD Top-down TN Technical Note TVaR Tail-Value-at-Risk UK United Kingdom USD U.S. Dollar VaR Value-at-Risk

6
I. INTRODUCTION
Stress testing is a forward-looking technique that aims at measuring the sensitivity of a portfolio, an institution, or even an entire financial system to events that have a small probability of occurrence but a significant impact if they were to occur. Well-formulated stress tests comprise different methods–such as sensitivity and/or scenario analyses–to assess the overall capacity of an individual firm or the entire sector to absorb shocks from the realization of key macro-financial risks. In financial sector stability analysis, stress tests are aimed at forecasting the impact of these conditions in order to identify vulnerabilities to shocks from a rapid deterioration in the operational and market environment affecting the overall risk profile from the financial system level down to the individual firm and portfolio level. Stress tests help firms and supervisors examine the effects of on financial conditions defined by a set of adverse changes in risk factors corresponding to exceptional but plausible events (CGFS, 2000). They can be limited to one sector or provide a cross-sectoral perspective by capturing the interconnectedness of banks, insurers and other market participants.
Over the last decade, stress testing has become a central aspect of the Fund’s financial sector surveillance. In particular, it is a key component of the Financial Sector Assessment Program (FSAP), and is also used in Article IV and crisis program work.2 Stress testing has also become increasingly more important within the supervisory frameworks of IMF member countries. In particular, a key lesson from the financial crisis has been a greater focus on concepts to identify the build-up of financial risks. This has spawned risk-based analytical framework(s) for financial stability analysis, including the examination of macro-financial linkages and the integration of advanced market and risk-based tools for surveillance purposes. These developments have underscored the need for a coherent and consistent approach to stress testing by IMF staff in the context of bilateral and multilateral surveillance. Based on the IMF’s practical experience with system-wide stress testing after more than a decade of FSAPs, staff recently proposed a set of “best practice” principles for macro-financial stress testing (IMF, 2012b). This paper represents practical extension to these principles in the context of the insurance sector.
The purpose of FSAP stress tests differs from that of supervisory stress testing exercises. FSAP stress testing approaches are designed for surveillance purposes, with a medium-term focus. They typically involve very severe but plausible stress scenarios to assess the overall
2 Stress tests have first emerged in the late 1990s and have been used since then by central banks, regulatory bodies and international organizations, such as the IMF and the World Bank, with the aim to pro-actively identify vulnerabilities and/or to determine specific risks for industry sectors or systemically-relevant institutions.

7
resilience of the financial system to the realization of selected risk drivers.3 While the results of the stress test have no immediate supervisory implications, they provide input into a broader analysis undertaken by the FSAP team, forming the basis for policy discussions on financial stability issues with the authorities. This is different from the supervisory stress tests, aimed at identifying any potential capital shortfall resulting from the likely economic impact of one or more adverse events for which management actions in response to stress scenarios may be required.4 These stress tests also help validate internal (economic) capital models in order to substantiate the resilience of the firm to extreme shocks.
Figure 1. Overview of IMF FSAPs* and Completion of Insurance Stress Tests (Jan. 2000―Feb. 2014)
Source: IMF staff.
Note: (*) includes full FSAPs, FSAP Updates, and Stability Modules (incl. reviews under the Offshore Financial Center (OFC) Assessment Program). The overview does not show the insurance stress tests completed as part of the FSAP/standards assessment for Bermuda, Guernsey, and the Isle of Man. Belgium, France, Japan, and Singapore are the only countries that have completed two FSAP insurance stress test exercises so far.
3 Additional severity in FSAP stress testing for insurance stems from the longer forecast horizon than is usually applied by supervisors and the combination of risk factors affecting both assets and liabilities in a comprehensive scenario-based framework.
4 This would also involve the development of capital plans designed to return the relevant firm to a stable, sustainable position, including options to address capital shortfalls through generating capital internally and externally (also including restricting dividends and variable remuneration). Supervisors would assess the appropriateness of insurers’ plans in terms of the adequacy of identified recovery plans and the supporting governance structure (PRA, 2013).

8
Figure 2. Number of Completed Insurance Stress Tests in FSAPs* Before and After the Global Financial Crisis, as of end-Feb. 2014
Source: IMF staff.
Note: (*) Total number comprises full FSAPs, FSAP Updates, and Stability Modules (incl. all countries subject to the Offshore Financial Center (OFC) Assessment Program with a stress testing exercise) but excludes three (out of a total of 25) insurance stress tests that have not been published.
In the context of FSAPs, insurance stress testing has played only a secondary role relative to the analysis of the banking sector risks. Since 1999, 22 stress tests of the insurance sector have been published out of a total of 256 FSAPs (as of February 2014), while bank stress testing has become an integral part of every mission (Figures 1 and 2). This might be explained not only by the fact that insurers are considered less systemically relevant in many jurisdictions but also by the unique conceptual challenges that emerge from the different balance sheet structure of insurance companies and lack of global solvency and valuation standards, impacting the design and comparability of top-down (TD) stress testing. This has also resulted in a greater reliance on national supervisory frameworks for stress testing in bottom-up (BU) approaches, which are more resource-intensive exercises.
Recent developments in macroprudential surveillance, however, warrant greater focus on identifying systemic risk affecting the insurance sector, including through stress testing. Even though traditional insurance activities have not contributed to systemic risk during the financial crisis, the assessment methodology underpinning the recent designation of global systemically important insurance companies (G-SIIs) published in July 2013 identified some vulnerabilities from non-traditional and/or non-insurance (NTNI) activities (IAIS, 2013c).5
5 In July 2013, the IAIS―in coordination with the FSB―published its final version of an initial assessment methodology for the identification of globally active, systemically important insurance firms (G-SIIs) together with a draft proposal of policy measures for designated firms (IAIS, 2012a, 2012d, 2013b, 2013c, and 2013d), including enhanced supervision, effective recovery and resolution, and capital requirements. The weighted
(continued)
13
9
11 9
0
20
40
60
80
100
120
140
160
180
All countries(- 2008)
All countries(since 2009)
Advanced economies
(- 2008)
Advanced economies(since 2009)
Num
ber o
f FSA
PsInsurance ST
FSAPs without Insurance ST

9
Moreover, the linkages between insurers, banks and other financial institutions may increase in the future as a result of post-crisis regulatory reforms. This could change the transmission channels of risks affecting the solvency and liquidity conditions of insurance companies under stress.
This paper reviews the current state of system-wide solvency stress testing of the insurance sector and provides guidelines for the consistent implementation of such tests for macroprudential surveillance purposes. The focus is on the assessment of capital adequacy under adverse financial conditions in order to support a comprehensive understanding of system-wide vulnerabilities to shocks. Based on the practical insights gained from relevant FSAPs and stress testing approaches used by supervisory authorities, the paper identifies, similarly to Jobst and others (2013) for the banking sector, best practices and methodologies for system-wide stress testing with a conceptual treatment of potential spillover and contagion effects from the interlinkages of insurance companies with other financial institutions. 6 It augments the current banking focus on asset risks in stress testing approaches with a discussion of underwriting risks that affect the liabilities of insurance firms. Specifically, the paper (i) articulates the main characteristics of a stress testing framework and demonstrates its application in the IMF surveillance of insurance markets; (ii) compares the actual implementation of various stress tests in a range of major country FSAPs based on detailed cross-country Stress Testing Matrix (STeM) (Appendix Tables A3 and A4) and (iii) discusses general properties of stress testing approaches for insurance as guidance for readers seeking to develop their own macroprudential stress testing frameworks and for country authorities preparing for FSAPs.
II. OVERVIEW AND FRAMEWORK
A. Macroprudential Stress Testing for Insurance
In the wake of the global financial crisis, there has been an increased focus on macroprudential policy and surveillance (MPS) with a view towards enhancing the resilience of the financial sector to systemic risk.7 MPS comprises the identification, measurement and indicator-based approach for G-SIIs (IAIS, 2013b) is similar in concept to that used to identify G-SIBs, but also introduces additional indicators that are germane to insurance activities. 6 Note that the tenor of the paper is on system-wide stress testing without an in-depth discussion of the spillover effects of insurance companies to the financial system at large. This coverage is consistent with the assessment of systemic risk in the insurance sector (IAIS, 2011a). While banks are prone to contribute to systemic risk from individual failures that propagate material financial distress or activities via intra-and inter-sectoral linkages to other institutions and markets (based on direct exposures via lending and investment), insurers tend to be more affected by their common exposures to asset price shocks that challenge the overall resilience of the sector (Jobst, 2014). See Hesse and others (2014) for general examples of how to model spillover effects in macroprudential solvency stress tests for banking.
7 See IMF (2011c and 2013c) for an overview of current theoretical and empirical work on macroprudential policy and regulation. The CGFS (2012) recently published a report on operationalizing macroprudential
(continued)

10
monitoring of vulnerabilities and risks of multiple firms within a country and/or across national boundaries with the goal of mitigating systemic risk.The potential build-up of system-wide vulnerabilities warrants a comprehensive monitoring of on-going developments beyond institutional fragility, especially in areas of economic significance to both the financial sector participants and the real economy.
Macroprudential stress testing for insurance builds on conceptual approaches for transmission channels of systemic risk affecting investment and underwriting performance of the insurance sector within the broader financial system. More specifically, MPS in the insurance sector comprises a three-step process (IAIS, 2013a):
i. Determining key indicators of general macro-financial vulnerabilities of different insurance business models and recognising the need to distinguish traditional and non-traditional/non-insurance activities;
ii. Designing a conceptual approach for defining risk factors and risk transmission channels of stress aimed at identifying common exposures, risk concentrations, and interdependencies that are sources of spillover effects and contagion risks which may jeopardize the functioning of the system as a whole; and
iii. Developing a macroprudential framework that integrates the key risk drivers of macro-financial vulnerabilities with the design and implementation of meaningful and relevant shocks to risk factors in order to determine supervisory action, operational changes, and/or suitable policy measures that can mitigate the severity and duration of material distress affecting the insurance sector (with adverse effects on the real economy).
However, the development of MPS in the insurance sector is still in its infancy. An IAIS survey of macroprudential surveillance practices at the national level revealed that most supervisory authorities carry out macroprudential surveillance activities (IAIS, 2010). The two most prevalent approaches comprise the monitoring of trends and development in insurance markets and the analysis of the system-wide impact of macroeconomic variables on the insurance market. In both instances, the focus tends to be on the analysis of domestic data, with international data analysis receiving comparatively less attention. Recently, the IAIS (2013a) published first guidelines of MPS for insurance.
Also the use of insurance-specific stress testing for MPS is limited. Stress tests have increasingly been used by insurance supervisors, but more for microprudential purposes. The new Insurance Core Principles (ICP), revised in 2011 (IAIS, 2011b), introduced enterprise
policies. See also IMF (2011c and 2011d) for a more empirically-focused review of macroprudential surveillance and its implementation for financial stability analysis.

11
risk management for solvency purposes, including stress testing and scenario analysis. Nevertheless, most of these tests remain focused on the viability of individual institutions to the economic impact of shocks rather than the system-wide robustness to the joint impact of risk factors in relation to the (i) growing complexity of the interconnectedness among insurance companies and with other financial institutions and (ii) the extent to which such interlinkages cause potential spillover and contagion effects. Although supervisors are not explicitly required to conduct system-wide stress testing, they are expected to monitor vulnerabilities within the insurance sector and carry out the analysis of “plausible unfavorable future scenarios with the objective and capacity to take action at an early stage, if required,” aimed at identifying and mitigating systemic risk that might negatively affect the risk profile of insurers (ICP 24). Stress tests have also been increasingly used to analyze market dynamics under extreme (tail risk) scenarios in order to ascertain whether or not supervisory intervention would be warranted.
Solvency stress tests for insurance tend to assess the capital impact of shocks to risk factors on the total balance sheet. As opposed to bank stress tests, which consider the sector’s vulnerability to general economic conditions based on historical and/or market-implied sensitivities of all profit and loss components, most insurance stress tests tend to focus on the sensitivity of a company’s solvency position to the aggregate impact of very specific changes in macro-financial indicators, such as interest rates/credit spreads, asset risks, and foreign exchange rates. For underwriting risks, specific stress test approaches need to be applied. The assessment of vulnerabilities arising from existing liabilities in life and non-life insurance under stress is essential to a comprehensive assessment and comprises the deterioration of technical provisions,8 demographic risks, and catastrophic risks.9
B. Differences between Banks and Insurance Companies and Their Implications for Stress Testing10
The nature of risk-taking of banks and insurance companies is markedly different and suggests limited usefulness of bank-focused stress testing approaches. While insurance companies share some similarities with banks, insurers do not engage in maturity/liquidity transformation as a key source of systemic risk when solvency and liquidity stresses
8 The amount that an insurer sets aside to fulfill its insurance obligations and settle all commitments to policyholders and other beneficiaries arising over the lifetime of the portfolio, including the expenses of administering the policies, reinsurance and of the capital required to cover the remaining risks.
9 These vulnerabilities could be subject to further differentiation regarding the various general business models in insurance, such as life insurance with minimum guarantees, life insurance without guarantees, non-life short tail insurance, non-life long tail insurance, and non-proportional reinsurance (IAIS, 2013e).
10 This section draws heavily on Jobst (2014).

12
coincide.11 The bank balance sheet comprises rather illiquid, longer term assets funded by short-term liabilities. In contrast, insurers are funded by upfront premium payments, resulting in stable cash flows (than is seen in the banking model).12 The liabilities of an insurance company (which for a life insurer would usually be of a long-term nature) are mostly technical provisions for insurance claims (Figure 3), which are backed by a diversified investment portfolio composed of mostly high-quality assets. In contrast to banks, where sharp asset price declines may lead to immediate and substantial liquidity drains, insurers typically do not suffer collateral calls or liquidity outflows, and their major source of income (premium inflow) is not affected by market shocks (IAIS, 2013a).13 Payouts resulting from claim obligations are normally “managed” in a stress situation, which reduces the speed of cash outflows.14
The main differences between banks and insurance companies are also apparent with regard to their functional characteristics within the financial system, the sensitivity to changes in key macro-financial variables, and their funding structure. These differences explain a more limited role of insurance activities in the transmission of system-wide shocks through interconnectedness and asset liquidation:15
Risk types and links to the economy: Insurance firms are exposed to risks commonly found in other financial institutions, including credit risk, operational risk, and market risk related to equity investments as well as movements in interest rates and exchange rates, all of which are highly correlated with changes in economic conditions; however, insurance risk (e.g., mortality, morbidity, casualty and liability risks) is largely idiosyncratic and generally independent of the economic cycle (Box 1), which allows them to realize diversification gains (through underwriting inversely correlated risks, such as death insurance and pension insurance, risk pooling, or reinsurance/ retrocession). Conversely, banks, by the acceptance of deposits and granting of loans, might find it more difficult to reduce their credit risk (from lending) or liquidity risk
11 Banks assume two major riskscredit risk from lending activities and liquidity risk from borrowing over the short-term and lending long-term. These two risks are highly correlated with the economic cycle.
12 This complicates the fair valuation of economic performance (via actuarial methods) given that insurers receive cash (as gross written premium) for a promise to satisfy an uncertain financial obligation (i.e., pay a claim) at an unknown future date.
13 Institutional failures of insurers have arguably a different impact on the financial system than those in the banking sector, and the way in which they might propagate systemic risk. They tend to have a low level of systemic interconnectedness, and their products are not highly complex, which also limits systemic risk from a non-substitutability of insurance capacity offered by a failing institution (Jobst, 2014).
14 Prudent levels of loss reservestogether with the management of the loss adjustment/claims verification processeshelp mitigate vulnerabilities from the risk of sudden outflows of (claims) payments.
15 See Geneva Association (2010a, 2010b, 2011 and 2012), Jones and Clark (2011) as well as IAIS (2011a and 2012b) for a thorough review of the possible systemic relevance of insurance activities.

13
(from the maturity mismatch in borrowing short and lending long) under crisis scenarios.16
Integration in financial sector infrastructure: As insurance firms are not part of payments or clearing systems (which they access but do not have responsibility for organizing), they tend to hold only limited direct intra-system claims and liabilities and exhibit relatively low levels of interconnectedness with the rest of the financial system both domestically and across national boundaries. While the lower degree of interconnectedness reduces the negative externalities of failure, it might still pose challenges in their resolvability, especially for large and complex insurance firms.17
Insurance regulation against risk generation and potential moral hazard: Insurance regulation universally limits insurers to the underwriting of risks that represent insurable interest.18 Therefore, insurers cannot generate additional risks (or transfer risks to third parties) but rather aim at controlling and mitigating existing risks over a defined time horizon.19 As opposed to risk transfer of bank assets, insurance risks are generally retained on the balance sheet, mitigating the risk of moral hazard. The reinsurance of primary underwriters and the acceptance of ceded insurance risk between reinsurers involve only a partial transfer of risk, because most risk remains on the ceding insurer’s balance sheet. In addition, while the trading of derivatives (CDS) could be made in absence of insurable interest, reinsurance generally transfers clearly defined risk and is inherently linked to the insurable interest ceded by the policyholder.20
Funding structure: In absence of maturity transformation, consumer or commercial credit, or transaction clearing services, insurers’ liquidity position is less influenced by external funding conditions due to strong operating cash flows via upfront premium payments, a so-called “inverted production cycle,” together with longer-term and well-diversified retail funding compared with other types of financial institutions. Thus, insurers can be insolvent (or insufficiently solvent) and still remain
16 Those insurers that failed during the financial crisis did not do so because of their insurance functions, but because of the quasi-banking activities that they engaged in.
17 Even if an insurer does fail, the run-off process takes place over an extended time period that allows for orderly planning as part of stable processes that do not lead to destabilizing runs.
18 The IAIS (2011a) defines insurable interest as “an interest in a person or a good that will support the issuance of an insurance policy; an interest in the survival of the insured or in the preservation of the good that is insured. […] Financial derivatives are not considered insurance for regulatory purposes.”
19 Reinsurance shares certain characteristics with derivatives transactions, with the latter being generally classified as a non-insurance activity (IAIS, 2012b).
20 Note, however, that insurance contracts with limited or no risk transfer can change the risk profile, making at least part of the insurance transaction non-traditional or even non-insurance (IAIS, 2011a).

14
liquid due to the long-term nature of the business model. However, liquidity risk can arise from asset-liability mismatches and cash flow management:
o Asset-liability mismatches―Insurance companies pursue a predominantly liability-driven investment approach to ensure that they can meet their policyholder obligations arising from such underwriting risk (especially for non-life insurance firms), which is largely idiosyncratic and generally independent of the economic cycle. Cash inflows from unearned premiums are invested such that payments of future (unsure) claims can be made at all times, which explains why asset-liability matching plays such a critical part of an insurer’s profitability. Given the scarcity of sufficiently long-term assets, however, insurers tend to have a negative duration gap (“short-long mismatch”).21
o Cash flow management―Insurers are generally not predisposed to sudden cash withdrawals as most insurance liabilities are not redeemable on demand by policyholders (like bank deposits). At the same time, cash inflows from unearned economic activity places a premium on investment as insurers need to invest premiums such that payments of future (unsure) claims can be made at all times. Claims can normally be paid via the sale of liquid assets that generate commensurate cash inflows (as opposed to traditional financial intermediation, which involves maturity transformation).22 The pre-paid funding model (with the possibility of continued collection of premiums even in a recovery or resolution phase), the longer duration of the claims process, and penalties for early surrenders of (life) insurance policies (“lapse risk”) make insurers less susceptible to liquidity runs. However, excessive lapse risk can arise from adverse economic conditions. For instance, higher interest rates may trigger higher lapse rates as more policyholders switch to other products for higher return, which may result in potential loss caused by selling investment assets for cash (or other assets) needed to cover surrender payments.
However, the long-term funding structure of insurers puts a premium on the valuation methods for best/current estimates of liabilities. Actuarial models underpinning the valuation
21 This implies that insurers generally benefit from rising interest rates (especially long-term business) whereas banks tend to experience valuation losses on investments, which might outweigh the benefits from higher interest margins as interest rates rise and funding costs adjust only slowly.
22 Even though some forms of life insurance may be viewed as savings products, most contracts have tax and contractual disincentives for policyholders to surrender the insurance policies before its contractual maturity (i.e., insurance reserves are not instantaneously “puttable” like deposits). Conversely, where reserves are “puttable,” the policyholder bears the investment risk (unit-linked, separate accounts).

15
of liabilities might not fully take into account the stochastic properties of risk factors, especially during times of stress when valuation models might fail to fully reflect potential downside risks. In addition, some pricing and loss reserve models require sufficient empirical observations over long periods of time, which entails the risk of intermittent model deficiencies in capturing underlying risk factors. Examples include calibration errors in estimating best estimates of mortality and lapse rates in life insurance, catastrophe risk, and insurance policies on perils with few empirical observations, such as pandemics or terrorism or perils which materialize only over long periods of time, such as asbestos-related claims.
Figure 3. Stylized Insurance Balance Sheet and Solvency Control Levels
Source: IMF staff.
Surplus
Enhanced Capital Requirement (ECR)(e.g., 120% of PCR)
Prescribed Capital Requirement (PCR)
Minimum Capital Requirement
(MCR)
early warning: additional reporting may be required
statutory insolvency
Solv
ency
Con
trol
Lev
els
Assets
Technical Provisions
Statutory Capital
and Surplus
enforcement measures
Risk Margin (e.g., 2% of Reserves)
Reserves(Best Estimate)

16
Box 1. General Macro-financial and Systemic Risk Implications for Insurance1 Although economic cycles impact investment income and underwriting performance of insurance companies over time, macro-financial linkages vary by different business lines as well as technical factors influencing the pricing and reserving of insurance products.
Certain life insurance activities exhibit a high correlation with economic volatility, mainly because their reliance on stable investment returns to match expected claims over the long run. Higher asset leverage than non-life insurers and longer duration investments, makes life companies more susceptible to secular changes in credit spreads and interest rates (unless they are sufficiently hedged). For instance, lower interest rates do not only heighten the re-investment risk for new funds generated from premiums but also increase the present value of future claims, which could give rise to critical asset-liability mismatches in spite of temporary asset valuation gains. Monetary easing (possibly in combination with higher asset impairments) during a slowdown of economic activity lowers investment income, and, thus, could jeopardize the returns of life insurance companies, of which some might be forced to lower guaranteed premium rates or returns in capital-intensive investment products.2
In the non-life insurance sector, underwriting performance broadly tracks economic growth, which affects available capacity and future pricing as insurers adjust to changing demand and cost of capital. Large catastrophe losses tend to be followed by premium hardening due to lower insurance capacity, whose cost of replenishment is accentuated if the insurance cycle coincides during economic downturns when rising risk aversion of investors and depressed asset prices raise the cost of capital. Conversely, excess capacity would push pricing lower on renewals, which could be accelerated if this cycle coincides during economic boom with lower cost of capital. Such price dynamics are also influenced by the extent to which renewal rates trail expected underwriting losses. Selective price increases become more likely if the long-term loss trend outpaces historical price increases at the margin.3 In addition, higher rates of inflation during periods of economic recovery can adversely affect provisioning and reserve adequacy, especially if changes in claims activity negatively impact performance in real terms.4 However, more than cyclical factors influencing the scale and frequency of different underwriting risks associated with property, casualty and professional business lines, the erratic occurrence of natural catastrophes and man-made disasters explain significant changes in underwriting performance, whose system-wide impact is driven firm-specific and/or cross-sectional concentration of exposures.
Some non-traditional forms of life insurance are inherently more susceptible to cyclical effects than the mainstream individual life insurance business. Funding arrangements via capital markets (such as repurchase agreements, security lending and OTC derivatives) might require more liquidity over shorter time periods than insurance claims. For instance, potential high quality collateral calls from OTC derivatives transactions or margin calls from cash collateral reinvestment from securities lending differ markedly from long-term cash flow projections associated with insurance liabilities. Large transactions of liquidity swaps could make the liquidity position of insurers worse by reducing available cash and liquid assets significantly. The cash flow models for security financing transactions are generally derived from mark-to-market valuations and can give rise to margin calls if funding liquidity deteriorates. Also, especially prior to the credit crisis, insurance-backed contracts, such as institutional investment and third-party asset management products, such as guaranteed investment contracts (GICs), implied some liquidity risk to the extent that policyholders could surrender their contracts at short notice with limited penalties causing a cash flow scenario comparable to a bank run if contracts are surrendered on short notice.5 __________________________ 1 This box draws on Jobst (2012) and IAIS (2013a). 2 During the financial crisis, however, several mitigating factors allowed life insurers to mitigate investment risks. In most cases, the realization of such adverse effects can be reduced by regulatory forbearance, product designs, and/or and personal tax regimes. 3 While the growing popularity of insurance-linked securities on natural catastrophes increases the linkage of some insurance firms to capital markets, the outsourcing of insurance risk via alternative risk transfer mechanisms has arguably muted the impact of the insurance cycle on some business lines, and by extension, has reduced the potential for economic conditions to exacerbate pricing pressures. 4 Thus, an inflationary effect beyond expectations (which implies higher nominal insurance cover due to price appreciation) could cause insurers being under-reserved for future claims. 5 For instance, in August 1999, holders of GICs issued by General American Life Insurance Co. exercised put options that required the life insurer to rapidly repay principal and interest, causing its parent firm, General American Group, to go into administration.

17
III. PROCESS AND METHODOLOGIES
An effective stress testing process entails a series of considerations that inform the specification of the methodology, the scope of analysis, and the interpretation of relevant findings that inform both day-to-day supervisory activities and capital planning of participating firms (Box 2). The steps for designating stress test frameworks include: (i) the object of analysis (structural conditions, regulatory situation), (ii) the determination of scope, (iii) the development of a methodological framework and analysis of data quality, (iv) considerations regarding the valuation standard and the treatment of capital resources, (v) the design of stress scenarios, (vi) the selection of appropriate risk factors, (vii) the definition of output measures, (viii) the validation of results, and (ix) dealing with the outcome of the stress test (Figure 4).
Figure 4. Stress Testing Process
Source: IMF Staff.
In this section, the conceptual discussion of these core elements of stress tests is complemented with a review of relevant characteristics of national supervisory practices in insurance stress testing and the experience of Fund staff in FSAPs. While publicly available information is limited, our analysis includes 13 jurisdictions and regional bodies which disclose some specifications for stress testing exercises in the insurance sector. The IMF experience includes 22 FSAPs which have been carried out since 1999 in both advanced and developing economies.
Object of Analysis
Scope
Metho-dology
Valuation & Capital
Scenario Design
Risk Factors &
Aggre-gation
Output Measures
Validation
Dealing with the Outcome

18
Box 2. The Taxonomy of Stress Testing Approaches
Stress testing can serve a number of different, though usually inter-related purposes, which include macroprudential surveillance, microprudential supervision, crisis management, and risk management. The former three are completed (or requested from insurance companies) by supervisory authorities and can be performed by means of bottom-up (BU), top-down (TD) or as a combination of both; the latter one is run by companies mainly for internal purposes, but also by credit rating agencies in the process of assigning or monitoring ratings. BU tests are performed by the companies based on a prescribed set of assumptions and scenarios and providing the results to the supervisory authority, while TD tests are run by the supervisory authority based on input data provided by companies, e.g., via regular reporting channels or via public disclosure. Macroprudential stress tests determine the system-wide resilience to shocks within the financial sector. They can be limited to one financial sector or provide a cross-sectoral perspective by capturing interlinkages between banks, insurers and other market participants. System-wide stress tests completed in the context of IMF FSAPs generally fit this description. Microprudential stress tests are used by supervisory authorities to determine firm-specific vulnerabilities to stress. Especially in jurisdictions which have not introduced a risk-based solvency system and accompanying supervisory reporting yet, such microprudential stress tests are an important tool which is indeed commonly used by insurance supervisors around the world; some examples are presented in Table A4. Crisis management stress tests are used to assess the actual or potential need for capital of distressed companies. The Supervisory Capital Assessment Program (SCAP) and the first Comprehensive Capital Analysis and Review (CCAR) run by the U.S. authorities in early 2009 as well as the recapitalization exercise by the European Banking Authority (EBA) in 2011 are prominent examples of this type of stress test. Risk management stress tests are used by individual financial institutions to manage their business portfolio and plans in more forward-looking manner. As the main objective of the tests is for internal purposes, there are varieties of approaches. Reverse stress tests can also be an effective tool but their very concept limits the scope of application. Reverse stress tests set a certain target threshold for an output measure, e.g., a solvency ratio of 100 percent, with the aim of identifying the required magnitude of shock to one specific risk factor that would lead to a breach of the threshold criterion. This condition could be relaxed by providing shocks also for other risk factors.1 ____________________________ 1 Note that reverse stress tests should be used only for material and relevant risks lest they generate meaningless results when the stressed risk exposure is low in absolute terms. For instance, given the low level of equity exposures of many insurance companies, only an implausibly large decline in equity prices would result in a breach of a pre-defined solvency threshold. Conversely, this method is quite relevant for attesting the impact of large parallel upward or downward shifts of the interest rate term structure.

19
A. Object of Analysis
A thorough insurance market analysis of external factors and general business conditions impacting firm behavior should be conducted, acknowledging differences in business models, the role of insurance companies in the domestic financial sector and international linkages, especially when offshore companies are of relevance. In the context of an FSAP, this is often covered by the assessment of the Insurance Core Principles (ICPs). Issues to be elaborated for insurance stress testing include:
i. Insurance business—The prevalence of specific lines of business, the share of traditional vs. investment-linked life insurance; existence of country-specific insurance products, especially when these are subject to specific regulations like state-sponsored catastrophe insurance or retirement schemes; profitability of insurance business (breakdown of profit sources); duration of liabilities; average guaranteed interest rates; the degree of penalty of early termination of policies; the use of reinsurance and the use of risk-mitigating features like profit sharing.
ii. Investment portfolio—Asset composition (equity, bonds, loans, real estate, alternative investments such as private equity, hedge funds, and commodities) and breakdown of countries, sectors, duration and liquidity (e.g., Level 1, 2, and 3); hedging transactions, especially for interest rate risks.
iii. Connectedness within groups/conglomerates—Corporate structure of insurance groups/conglomerates, including foreign group entities and special purpose vehicles; analysis of intra-group transactions, e.g., committed funding arrangements (securities holdings/lending with parents or other group companies) and intra-group reinsurance activities; possible interventions by local supervisors, such as ring-fencing.23
iv. Interlinkages to other financial institutions—Exposures to other financial sectors, typically through asset exposures (equity, senior bonds, subordinated debt, and commercial paper), deposits, derivative transactions, and securities lending/repos. Usually, NTNI-related exposures (such as derivatives trading and securities lending/ repo) are negligible except for large firms and monoline insurers, and securities holdings are readily available. Some insurers (with large investment portfolios) could provide large amounts of liquidity to banks via liquidity swaps (and other funding
23 Intra-group transactions within conglomerate structures often involve a higher degree of liquidity risk under stress. Against a backdrop of an overall loss in confidence in capital markets, the banking side of conglomerates (or bank counterparties to liquidity swaps) could become vulnerable to the risk of large withdrawals of deposits and/or the run-off of liabilities. As both banks and insurers would sustain a sharp decrease in the value of their investment portfolios, funding needs could lead to greater reliance on intra-group transactions (or the use of contingent funding arrangements).

20
commitments). Such arrangements are prone to contagion effects during times of stress.
v. Solvency standards—Existence of a risk-based system, coverage of risks, level of confidence, time horizon, and calibration of risk factors.
vi. Tax regime—Shock absorption effect of deferred tax assets/liabilities; relative tax advantages of saving products offered by insurance undertakings vs. bank products.
vii. Policyholder protection funds—Existence of a protection fund and its coverage, also in comparison with the protection of bank deposits.
B. Determination of Scope
A capital assessment under stress should capture all material risks affecting insurance operations and provide a total view of capital adequacy—on an aggregated or individual basis—of legal entities and/or across insurance groups. Where the group conducts non-financial activities, these could be excluded if only of a non-material nature, but non-insurance financial activities would need to be considered.24 Group participation usually involves inclusion of foreign businesses, which should be included in a stress testing exercise in order to examine vulnerabilities to the group and its parent company. However, supervisory authorities usually have less granular information on the group level stemming from regulatory reporting, which makes TD stress test more difficult and also complicates the validation of BU results. In case a group-wide stress test is run by the home supervisor, the results should be communicated to and discussed with host supervisors.
A representative sample could be selected in order to reduce the burden for both supervisors and the industry. The decision on the actual coverage should depend on the market structure in each specific case and the extent to which NTNI activities are relevant for the specification of spillover and contagion risks. Generally, market coverage should be calculated separately for the life and the non-life sector. If the market is highly concentrated, it is usually sufficient to include just the largest companies in terms of premiums or assets. However, also medium-sized (or even small) insurers should be included if they conduct significant NTNI activities and/or these firms (i) are expected to be highly vulnerable to certain shocks to risk factors, (ii) have high relevance for the real economy or the financial sector by offering specific products (e.g., credit or mortgage insurance), or (iii) are very interconnected (e.g., as a reinsurer or in a financial conglomerate).
24 In the same vein, off-balance sheet exposures need to be considered (total balance sheet approach).

21
Most FSAP insurance stress tests have been completed for samples that comprise the largest firms only.25 The market coverage reached about 70 percent on average, with two thirds of the exercises ranging between 55 and 85 percent (Appendix Table A3). Depending on the size and the industry structure within a particular jurisdiction, the comprehensive system-wide coverage of FSAP stress test sometimes involved a larger number of firms (e.g., 30 each in Switzerland and the United States or 78 in France). On average, the market coverage of insurance companies is smaller than that of banks in FSAP stress tests (Jobst and others, 2013), which can be explained by the fact that smaller insurers have only a marginal impact on financial stability unless they are highly interconnected through reinsurance or NTNI business.
C. Methodological Framework and Data Quality
The choice of a suitable stress testing model(s) and technique(s) would need to be proportionate to the nature, scale and complexity of the insurance sector. As a general rule, the more sophisticated the model the higher the chances of estimation uncertainty, which needs to be taken into account when drawing policy conclusions from stress tests.
Insurance stress tests are traditionally completed as BU exercises which is reflected in growing number of guidance and consultation papers by supervisors, industry, and international organizations. The IAIS (2003) was first to propose a standardization of the design and implementation of supervisory stress tests in order to establish greater consistency of insurance risk scenarios, and recently provided some additional guidance in its paper on MPS in insurance (IAIS, 2013a). Shortly thereafter, the International Actuarial Association (IAA, 2013) published a paper that provided an actuarial perspective on scenario analysis and stress testing.26 There is also noticeable progress at the national level. In Europe, insurance stress testing has been advanced by EIOPA and the ECB. EIOPA (2011a and 2011b), the EU supervisory oversight authority for the insurance sector, conducts regular BU stress tests with customized scenarios27, which build on the first system-wide supervisory stress test for the European insurance sector (CEIOPS, 2009 and 2010). In the UK, the Prudential Regulatory Authority (PRA, 2013) issued a statement on its approach to insurance supervision, which
25 Exceptions were Luxembourg and Israel, where all domestic insurance companies were within the scope of the stress test.
26 The International Organisation of Pension Supervisors (IOPS) recently published results from a survey of current stress testing practices, which informs on whether and how stress testing could be applied to defined contribution (DC) plans. The assessment of the economic impact of risk factors on DCs is similar to that of life insurance companies (Ionescu and Yermo, 2014).
27 In April, EIOPA (2014) published the scenarios and methodology of its most recent system-wide stress test. It consists of a core module, which is based on two financial market stress scenarios and on single-factor shocks to insurance liabilities, and a “low yield” module. The latter addresses individual (re)insurance undertakings only and represents a follow up on EIOPA (2013a)’s “Opinion on Supervisory Response to a Prolonged Low Interest Rate Environment” (Box 4).

22
also included several references to stress testing, and the implications for supervisory assessments of capital planning. This follows an earlier consultation process with industry (FSA, 2008) on scenario analysis and stress testing, which concluded in a statement on the use of stress tests within the prudential regulatory regime for insurers (FSA, 2009).
Data constraints are the biggest challenge for TD insurance sector stress tests, which are generally less developed than BU approaches. While the main advantage of TD exercises lies in the quick availability of results, data limitation hinders these approaches to be developed in insurance supervision. Usually data input for stress testing exercises stems from regular prudential reporting, which can differ widely across countries in terms of scope and granularity. On investments, few supervisory authorities have detailed information that is needed to conduct TD stress tests, such as information on the duration, credit quality of bonds, or detailed information on hedging instruments. On the liability side, information on reinsurance programs and the duration of liabilities is often missing. In the absence of such critical information, a BU stress test would usually be a necessary first step to gather information on the range of values for the key parameters used in a subsequent TD stress test. A robust modeling framework for a TD stress test would also require a global valuation and solvency regime together with harmonized reporting and disclosure standards, which are still in development. As an IAIS survey revealed, in recent years insurance supervisors have become increasingly reliant on a mixture of both TD and BU approaches to stress testing (IAIS, 2011c).28
In FSAP exercises, the IMF has predominantly applied BU stress tests using prudential data, with just three exceptions (Table 2 and Appendix Table A3). In Israel, only a TD exercise has been performed, while in Portugal and South Africa a TD exercise complemented the BU approach. While prudential data are used for FSAP insurance stress tests, this approach does not preclude the use of public data for the preparation of BU exercises and the cross-validation of stress test results. Just one exercise (Japan, 2003) relied solely on public data, e.g., the breakdown of assets was less granular, making it impossible to distinguish between bonds denominated in Yen and those denominated in foreign currencies; further, it was not possible to split between fixed- and floating rate bonds, both information would have been needed for properly modeling the effects of the interest rate shock on bond investments.29
28 The ECB has recently presented a market-consistent framework, which is used for monitoring the stability of large Euro area insurance groups (ECB, 2013; Vouldis and others, 2013). A macro scenario affects insurance companies via valuation changes for both assets and liabilities, potential sale of assets due to a cash flow drain caused by higher lapse rates, and changes in the credit quality of the loan portfolio. The result of the stress test can be presented in terms of total balance sheet assets as well as net assets, with the latter serving as a proxy for a solvency measure.
29 Data quality also imposes practical limitations to comparative analysis of these country cases. High data granularity, while giving deeper insight into the mechanics of results can also increase the potential for different interpretation, straining the analytical poignancy.

23
The data used in the stress test should be sufficiently granular to account for vulnerabilities from intra-group transactions or transactions between banking and insurance legal entities. Most supervisory stress tests require firms to report stress testing results on a legal entity basis (especially when the solvency regime supports group-wide oversight, such as in the case of Bermuda, Germany, United Kingdom, and Switzerland). In many cases, however, stress tests are completed only on a consolidated reporting basis (European Union), which does not cover the assessment of the impact of intra-group transactions on the capital and liquidity positions of legal entities that are part of a group or conglomerate. If intra-group transactions and transactions between banking and insurance entities are salient risk drivers, these sources of vulnerability require more granular prudential information, which would need to be explored on a legal entity basis (together with a greater involvement of microprudential supervisors). Thus, some stress tests in FSAPs are completed on both a solo and consolidated basis.
D. Valuation and Capital Resources
The capital adequacy assessment under stress is influenced by the interaction between the economic impact of risk factors and the characteristics of the relevant solvency regime. The results of the stress test project the economic change in the balance sheet for different adverse scenarios based on the risk sensitivity and the valuation of exposures. All assets and liabilities would need to be appropriately and consistently valued, and reserves and provisions should be adequate. Typically, valuation standards prescribe fair valuation for investment assets and best estimate valuation for insurance liabilities. Cash flow projections should reflect realistic future demographic trends, legal, medical, technological, social and economic developments, with appropriate assumptions relative to the relevant exposure, gross of reinsurance and special purpose vehicles. Discount rates applied to cash flows should be consistent with observable market prices for financial instruments with cash flows matching those of insurance liabilities in terms of timing, currency, and liquidity.30
However, distortions can arise from of the level of conservatism and the degree of risk-sensitivity included in the valuation standard.31 Some solvency regimes contain alleviations based on conservative assumptions of asset prices and best estimate liabilities (including discount rates), which vary across countries by the type of valuation standards and the degree 30 They should exclude the effect of the insurer’s non-performance risk in order to avoid introducing uneconomic volatility in net assets.
31 The consistent use of valuation standards also facilitates comparability of the solvency impact on balance sheets of internationally active insurance groups operating under different solvency regimes in the absence of global accounting and actuarial standards supporting a consistent capital requirement. Currently, the comparability of valuation standards and capital treatment across countries is complicated by the divergence of existing accounting standards, the capital treatment of off-balance sheet items, and the intended scope of covering all financial activities within insurance groups (which could raise consistency issues vis-à-vis other capital regimes).

24
of risk-sensitivity. These alleviations trade off greater robustness of the capital assessment (by reducing the procyclicality of valuation) against the risk of understating insurance liabilities derived from less reliable market prices. These differences have a significant impact on capital resources, risk measurement and solvency positions of insurers.
Recognizing the impact of risk-sensitivity and valuation standards on both the inputs and the results of stress tests is essential. The outcome of a stress test, and in particular the estimation of changes in liability-matched asset values and technical provisions, can vary significantly depending on the choice of the risk sensitivity and valuation standard underpinning the capital assessment. Thus, a comprehensive analysis of applicable valuation standards should be made prior to developing a specific stress testing. Figures 5a and 5b visualize the most important features of the risk measurement and valuation standard of solvency regimes in major (re)insurance markets—Bermuda, the EU, Japan, Switzerland, and the United States. Figure 5a compares the degree of both market sensitivity and level of economic consistency implicit in the risk measurement under different solvency regimes. The prevalence of internal models approaches, if combined with a rising degree of statistical confidence of risk measures, few (or no) diversification benefits, and a comprehensive scope of reporting, tend to generate a more market-sensitive valuation of both assets and liabilities. This is because factor models (with pre-determined and constant parameters) may not be able to fully capture time-varying or non-linear risks. Figure 5b shows that a similar comparison can be made for the valuation aspect of a solvency regime considering the impact of assumptions, including initial conservative and ex-post adjustments. Jurisdictions that have moved to market-consistent valuation accept greater procyclicality at the expense of limiting the degree of economic consistency in order to better align capital adequacy with the economic cost of capital (and the way it influences management decisions, and, if need be, supervisory enforcement activities).
There are three major valuation approaches that are found in existing solvency regimes:
i. Accounting basis (e.g., Solvency I in the EU)—The valuation is based on historical prices (i.e., cost accounting) without consideration of the actual risk. The absence of risk-based elements affecting the valuation makes this standard less suitable for the quantification of the economic impact of changes in asset prices and interest rates.
ii. Risk-based approaches (e.g., Risk-based Capital in the United States, Solvency II in the EU)—For Solvency II, the valuation basis includes alleviations, such as the dampeners of the long-term guarantee package (i.e., volatility adjustment, matching adjustment, and the convergence period for extrapolating the basic risk-free curve), which decrease the sensitivity to interest rate and spread changes, resulting in lower technical provisions and higher own funds.
iii. Market-consistent valuation basis (e.g., Swiss Solvency Test)—For technical provisions, cash flows due to insurance liabilities are discounted with an appropriate

25
risk-free rate based on asset swap rates (after controlling for credit risk) or replicated with sovereign bonds only.32 Assets are valued based on available market prices.
The use of a market-consistent (rather than cost-based) valuation informs the most objective and economic view of asset exposures and insurance liabilities. Such an approach generates a fair value representation of assets and best estimates of insurance liabilities to be valued based on financial instruments with reliable market prices. Needless to say, robust validation is necessary to minimize model risks and valuation uncertainty, which would increase capital or lower technical provisions under the disguise of greater robustness.
32 For instance, the following specifications are commonly used for the balance sheet valuation and the calculation of solvency capital requirements. The term structure of discount rates is extrapolated based on the Smith-Wilson method (or similar), assuming a certain ultimate forward rate, with a downward adjustment to the calculated forward rate in order to account for credit risk, and is then applied to cash outflows related to future insurance liabilities over the same time horizon.

26
Figure 5a. Overview of Solvency Regimes—Risk Measurement
Figure 5b. Overview of Solvency Regimes—Valuation Standards
Source: IMF staff.
Note: This illustration provides a general comparison of risk measurement and valuation standards (assets and/or liabilities), which informs a stylized scaling of relative economic consistency [upper chart] and transparency [lower chart] relative to the risk-sensitivity of different solvency regimes. However, this comparison abstracts from a more complicated interaction of various determinants of solvency regimes. The actual degree of ”stringency” of capital requirements for insurance activities within a given solvency regime depends on the confluence of valuation standards, the definition of capital, the level of solvency thresholds (i.e., prescribed capital requirement (PCR) and the minimum capital requirement (MCR)), the sensitivity of capital requirements to the changing nature of risk drivers and interaction (“diversification effects”) as well as the scope and implementation of supervisory practices. (*) Internal models and additional reporting by legal entities can provide the basis for additional insight on group-wide activities, especially in cases when the legal entity accounts for the majority of group-wide activities.
Leve
l of E
cono
mic
Co
nsis
tenc
y/Re
alis
m Full internal model approachwith stringent calibration requirements
and down-cycle emphasis
Accounting/balance sheet approaches
without consideration of variables risks and volatility of exposures
Risk-based approacheswith economic balance sheet assumptions and adjustments
Partial internal model approachwith limited reliance on firm-based
estimates
Solvency II• consolidated
• standardized/internal model at 99.5% VaR
• diversification benefit
BSCR• consolidated
• factor-based/internal model at 99.0% TVaR
• diversification benefit
Japan SMR• solo, branch, consolidated
• factor-based at 95.0% VaR (assets) and >99% VaR (liabilities)
RBC• solo basis
• factor-based at 98.0% VaR
Solvency I• consolidated
• balance sheet/leverage ratio without consideration of actual risk
SST• solo*
• internal model at 99.0% TVaR
Market-consistency/Risk-sensitivity
Leve
l of T
rans
pare
ncy
Market-consistentwith best estimate liabilities
and fair value assets, without alleviations
Lock-inwith simplifying/conservative
assumptions
Solvency IImarket-consistent with certain alleviations, such as premium matching and counter-cyclical measure
BSCRsome initial assumptions with
certain alleviations
Japan SMRLock-in with CF testing (ICP 14)
• some initial assumptions • 10-year analysis in ex-post re-
valuation
RBCLock-in with CF testing (ICP 14)
• conservative assumptions• full lifetime analysis in ex-post re-
valuation
Solvency I• pre-defined capital requirements
• balance sheet valued at historical cost
SSTmarket-consistent with certain alleviations, such as temporary
change of discount rate
Market-consistency/Risk-sensitivity

27
Most insurance stress tests completed by national supervisors allow (or require) only the use of historical cost accounting for insurance liabilities (“cost-based valuation standard”) while assets are usually valued in a market-consistent manner.33 The statutory valuation with conservative assumptions (using balance sheet values at historical cost) is premised on the assumption that insurers can continue holding most assets until their maturity to generate sufficient cash flows to pay claims and other liabilities over the same time. However, given the potential and actual turnover of investment assets in insurers’ balance sheets, the application of cost accounting and, to a lesser extent, other adjustments that assume hold-to-maturity investment, would be inconsistent.34 If such alleviations were applied, they would understate the greater economic impact of market stress scenarios under a less robust (and more risk-sensitive) valuation standard. Insurers would also have the incentive to invest in as illiquid and risky assets as possible to maximize returns while at the same time minimizing technical provisions under less risk-sensitive valuation.35
Adjustments to statutory data might be required if the absence of market-consistency within a given solvency regime were to dominate its sensitivity to the economic impact of risk factors under different stress scenarios. Valuation standards with simplifying assumptions based on cost accounting and certain alleviations (Figure 5b) could overstate capital resources and underestimate risk measurements, which would lead to a misleading assessment of solvency. Removing mitigating factors and adjustments tends to generate lower capital resources (through recognizing economic loss) and increase capital requirements than under a cost-based valuation standard. Conversely, inflating discount rates (by a certain credit spread in addition to the risk-free rate) for the estimation of technical provisions under a more conservative (i.e., less market-sensitive) approach could overstate solvency ratios (and increase liquidity risks ex ante).
Given their considerable reliance on prudential data, the valuation standards in FSAP insurance stress tests are heavily influenced by the existing (national) solvency regimes and may differ significantly between countries. The data input to most supervisory stress tests tends to be based on statutory accounting (using historical cost), and, thus, has also limited a wider application of a more risk-sensitive valuation in the context of FSAPs. A fully market-consistent valuation has been applied only to a few countries (Belgium (2013), Canada, Portugal, Spain, Singapore (2013), and Switzerland), with some adjustments for unrealized
33 Market-consistent valuation of insurance liabilities is used only in a few cases (e.g., Switzerland).
34 The effect is even more pronounced for stress test results under Solvency I. Solvency I ratios contain simplifying/conservative assumptions that react very weakly to stresses, leading to generally very stable Solvency I margins.
35 For instance, the Solvency II regime contains some dampeners and countercyclical elements—the volatility adjustment, matching adjustment, convergence period for extrapolating the basic risk-free curve—which are aimed at increasing the robustness of the solvency regime but also imply strong assumptions.

28
gains and losses in other cases (Japan (2013)).36 The most comprehensive set of valuation approaches in FSAPs to date were used for the FSAP of Belgium (2013), which included both statutory (cost) accounting, a “near market-consistent” valuation according to EIOPA’s QIS5 on Solvency II, and a fully market-consistent valuation of both assets and liabilities.
E. Scenario Design and Other Assumptions
The assessment of capital adequacy under stress requires the definition of suitably severe yet plausible scenarios defined by macro-financial shocks. A stress test should be designed to quantitatively assess the implications of a rapid deterioration of both investment and underwriting performance resulting from adverse changes of one or more risk factors affecting earnings and/or capital and reserves. These risk factors should have the potential to generate findings that complement the insights on firm-specific and system-wide vulnerabilities gained from routine supervisory reporting.37 Such potential vulnerabilities can arise from a wide range of loss scenarios and extreme but plausible asset price movements.38 Therefore, scenarios would ideally supplement the monitoring of risk factors as part of prudential oversight by introducing specific risks (which are not addressed in the relevant solvency regime) and/or augmenting the severity of risk factors that already exist in the relevant solvency regime.39
The scenario design of a stress test is driven by the relevance of identified macro-financial vulnerabilities to certain risk factors and its implications for firm performance and/or system-wide stability. For this purpose, projections on possible future risk materialization and the transmission channel to the business of insurance undertakings need to be developed. The determination of risk factors affecting identified vulnerabilities requires a careful examination of the interactions between insurance activities and developments in the rest of the financial system and the real economy (Figure 6). Scenarios should be plausible and meaningful in relation to the firm’s capacity of firms to control and mitigate vulnerabilities to chosen risk factors. This also involves the assessment of the impact on the firm’s capital planning and expected strategic changes in order to allow for demonstrable anticipation and integration of findings in current processes (“use test”) (Jobst, 2013a).
36 The reference to particular years only applies to countries that have completed two insurance stress tests in the context of an FSAP exercise.
37 Note that it is not seen as necessary to use an adverse development for all risk categories. Some asset classes (such as sovereign bonds in major jurisdictions) might actually develop quite positively (“safe havens”).
38 It would, however, be impossible to map all vulnerabilities for all business models in all jurisdictions without running the risk of obscuring the most relevant macro-financial risk transmission channels affecting financial stability.
39 For example, if the solvency framework does not take into account sovereign risk, the scenario can be adjusted. In addition, if the current valuation does not require insurers to recognize losses from sovereign bond investments, the valuation needs to be adjusted accordingly.

29
Figure 6. Elements of Risk Assessment and Scope of FSAP Stress Testing
Source: PRA (2013) and IMF Staff.
Risk scenarios would ideally combine historical and simulated (or hypothetical) outcomes subject to supervisory judgment/validation/expert opinion. This approach would help avoid optimizing the calibration of adverse scenarios based on past experience without giving sufficient prominence to the aberration of risk factors that might result in different scenarios in the future.40 At the same time, the generation of worst cases with a qualitative overlay would still need to satisfy a general concept of plausibility. Such plausibility would be defined as a probabilistic concept, which deems a scenario more plausible the higher the probability of realization subject to the greatest possible degree of consistency with the prevailing (and historically correlation of risk factors (Breuer and others, 2010)).41
It is important to cover all relevant risk categories. Scenarios commonly include a combination of market and credit risks (from both corporate and sovereign exposures), interest rate risk from asset-liability mismatches, foreign currency risk, liquidity risks, underwriting risks, and concentration risks, including the interconnectedness with other financial institutions. When selecting relevant risk categories, it is important to take into account the main features of insurance markets, such as the share of traditional business versus unit-linked business, average guaranteed rates, modified duration of assets and liabilities, profitability of insurance business, investment portfolio, degree of interconnectedness within the industry and other financial sectors.
40 In addition, the past experience itself might have limited explanatory power as early warning signals (“legacy/hindsight bias”).
41 More specifically, this would amount to the first-order stochastic dominance of the selected stress scenario over the outcomes of other combinations of risk factors (Abdymomunov and others, 2011). All risk measures within the plausible domain of outcomes would need to satisfy the axioms of coherence. A risk measure is deemed “incoherent” if it violates the axioms of sub-additivity, monotonicity, positive homogeneity, and translation invariance. For example, sub-additivity, which is a mathematical way to say that diversification leads to less risk, is not satisfied by VaR (Artzner and others, 1999).

30
The scenario design will need to take into account the diversity of the insurance market. It comprises a variety of unique business models and supervisory frameworks that differ significantly across jurisdictions. As a result, the relevance of macro-financial shocks and their impact on the assets, liabilities, and revenues of insurers are bound to differ from those that apply to other financial institutions and insurance companies in other countries. In order to cover all relevant risk categories and to generate stress test results for a variation of future outcomes, more than one scenario and combination of those should be used. Typical scenarios could look as follows:
i. Recessionary scenario—decline in equity and property prices, increase in credit spreads, higher lapse rates, higher defaults of mortgage borrowers, offset by lower interest rates (Box 3);
ii. Banking/financial/sovereign crisis—higher credit spreads for financials, default of a large bank counterparty, stress of all asset classes including sovereign bonds;
iii. Inflation scenario—claims inflation, rising interest rates, offset by rising equity and property prices;
iv. Non-life underwriting shock—large natural or man-made catastrophe claim which could be combined with a default of a reinsurer or a decline in equity prices (in the country affected by the catastrophe);
v. Life underwriting shock—high lapse rates and/or a pandemic; and
vi. Combinations of the above.

31
Box 3. Recessionary Scenarios in the Insurance Sector
The economic impact of a recessionary stress test scenario does typically not only affect the asset side the balance sheet but also extends to insurance liabilities, which would need to be considered in a comprehensive stress testing approach. There are several macro-financial linkages between adverse changes in economic conditions and the performance of insurance companies: - A decline in household wealth and disposable income could lower premium income of insurers; however
the effect is likely to vary across different lines of business. Life insurance but also motor insurance tends to be more sensitive to a downturn of the economy (EIOPA, 2013b).
- Lower household income and wealth can cause higher lapse rates in life insurance. The size of this shock
would depend on the incentives of policyholders to surrender their policy; if the surrender value is low (and/or the interest rate levels drop below the implied return from guaranteed term insurance), the lapse rate in a recession tends to decline.
- Higher corporate default rates could increase claims from financial guarantees and credit insurance.
However, these lines of business are quite heterogeneous, ranging from trade and export financing to mortgage insurance and credit enhancements of structured finance transaction. All these sub-categories would require a specific set of assumptions regarding probability of default and loss given default.
- Higher claims could also be attributable to higher operational risk from insurance fraud. Dionne and
Wang (2013) identify a business-cycle pattern in fraudulent claims for the Taiwanese automobile theft insurance market.
While macro-financial linkages of underwriting activity are generally limited, there can be tail dependence between market and insurance risks during times of stress. For instance, large catastrophes could have negative effects on asset prices and/or funding conditions affecting insurance companies. The cost of replenishing capital after large insurance losses would be accentuated if the insurance cycle coincides with rising risk aversion of investors and higher cost of capital during an economic downturn.42 Longer-term uncertainty about the ultimate consequences of a catastrophe (or a pandemic like the SARS outbreak in 2002/03) tends to be negative for the stock markets. Thus, amending a catastrophe scenario by some
42 However, recent studies show that even highly disastrous events like Hurricanes Katrina and Sandy in the United States or the 2011 Tōhoku earthquake and tsunami in Japan had only very short-lived effects on the respective domestic stock markets (Wang and Kutan, 2013). Notwithstanding more severe declines for specific sectors like (re)insurance, discretionary consumer goods and tourism, broad market indices did not decline significantly. This could be explained by the fact that the economic loss in terms of the GDP was rather limited. In emerging and developing countries, a natural catastrophe might have a much more severe impact on the real economy and the domestic financial market, especially if large parts of a country or a large metropolitan area with critical infrastructure are affected.

32
subsequent market stresses (especially a stock price decline and potentially some currency fluctuations) could be considered. Moreover, higher rates of inflation during periods of economic recovery can adversely affect provisioning and reserve adequacy in non-life underwriting, especially if changes in claims activity negatively impact investment performance in real terms. Also some non-traditional insurance activities, such as funding arrangements via capital markets (such as repo, security lending and OTC derivatives), differ markedly from long-term cash flow projections associated with insurance liabilities, and are inherently more susceptible to cyclical effects than the mainstream insurance business (IAIS, 2013c).
The scenario specification should start from a baseline that reflects a likely future development of a consistent combination of changes in risk factors. Some forecasts for parameters like interest rates, credit spreads or real estate prices could be directly derived from a macroeconomic model, while other factors would likely be estimated exogenously (or be based on expert judgment). The adverse scenarios should subsequently be defined as deviations from the baseline scenario. A sufficiently high but realistic confidence level for the calibration of the magnitude of shocks should be used for the scenarios. As far as only sensitivities in single risk categories are tested, one might resort to use confidence levels and determine the actual shock based on time series analysis (for instance, by means of bootstrapping procedures).
Traditionally, most FSAP stress test exercises apply single-factor shocks. In some cases, the sensitivity results have not been aggregated like in Belgium (2006), Spain or Denmark (2007), while other stress tests usually used a simple summation (Guernsey, South Africa, Isle of Man, United States, Japan (2012), Singapore (2013)). In other countries, certain combinations of single-factor shocks have been added up (France (2005), Mexico), while other countries used aggregation approaches via correlations (complemented by simple summation, i.e., setting correlation coefficients to 1), examples for this latter approach include The Netherlands, Luxembourg and Belgium (2013). For the Swiss FSAP solely a correlation matrix was used for aggregating the shocks. Single-period stresses are also still the predominant modeling framework used by national supervisory authorities. Authorities in Canada, Singapore and the United States apply multi-year period scenarios with projection horizons of up to five years, while others are using single-period or instantaneous shocks.
FSAP stress tests were also focused on a single-period stress until very recently. However the actual concept differed slightly in various countries. In some cases a one-year horizon was used with the shock occurring at the end of this year, while in other exercises an instantaneous shock was applied. The only exceptions are three recent stress test exercises in Japan (2012), Singapore (2013) and Canada, with two-, three- and five-year projection horizons, respectively. This extension to a multi-year horizon constitutes a fundamental change in the FSAP stress testing methodology and calls for making a number of additional assumptions when designing the scenarios.

33
Box 4. Assessing the Impact of Low Interest Rates on Insurance Activities Since insurers are large investors in fixed income instruments, equity and real estate, they are particularly vulnerable to the risk of an abrupt fall in asset prices as a result of a reassessment of risk premia (which implies an increase in nominal interest rates). Unlike banks, which benefit from lower short-term interest rates (which lower borrowing costs as the intended effect of monetary easing) and the likely widening of term spreads, the opposite is true for insurance companies. Low yields increase the insurers’ long-term liabilities in today’s terms. In most cases (with the exception of most non-life insurance business lines), the duration of these liabilities exceeds that of available investment assets. On the assets side, low interest rates reduce investment returns and increase the reinvestment risk of assets. This problem is even more pronounced for firms that need to match long-term low risk investments to guaranteed rates of returns to policyholders. Adverse effects from low interest rates vary by the balance sheet structure and the type of business. Interest rate risk of existing policies (i.e., the legacy book) in life insurance can be significant as future premiums cannot be changed to reflect lower investment returns, and the higher value of interest-dependent assets can usually not compensate for the higher present value of liabilities due to the “short-long duration mismatch.” If the duration of liabilities exceeds that of assets, and interest rates decline, lower investment income increases the insurer’s dependence on underwriting performance and/or could encourage greater risk-taking (once gains from higher yielding assets have been realized).1 Low interest rates would require insurers to either increase premiums for the same expected future claims payments or lower guarantees to policyholders lest they risk reducing future earnings. While there are usually no tight substitutes for insurance, and setting higher premium rates should be theoretically possible, in practice, insurers would be reluctant to change their pricing conditional on investment returns. Both life and non-life insurers would need to take lower investment returns into account in the pricing of new underwriting. However, low interest rates may be unlikely to cause z serious solvency impact on non-life business (in particular protection oriented product lines) in absence of negative demand effects and lower expense due to low inflation expectations. Similarly, some life insurance products (mortality, disability, and long-term care) have more protection features than saving features and do hardly have substitutes. These protection-oriented features would allow insurers to compensate lower investment returns with higher risk charges. However, demand for those less vulnerable businesses (protection-oriented life products, property and casualty) is still inherently susceptible to economic conditions and is likely to decline during recessions (which tend to trigger a relaxation of monetary conditions (and lower interest rates)). Insurance supervisors have identified the current environment of low interest rates as a major risk for the life insurance industry (EIOPA, 2013a; Antolin and others, 2011; Swiss Re, 2012). However, the quantification of the capital impact from low interest rates is not straightforward. Stress tests that use an instantaneous interest rate shock without market-consistent valuation cannot capture the long-term effects on solvency. Nevertheless, some methods that can provide rough estimates have been presented in recent years. French and others (2011) project cash flows based on the existing investment portfolio and the duration of insurance liabilities in order to determine the sensitivity of own funds to changes in markets rates. They assume that maturing bonds would be re-invested at a lower market rate and the asset allocation remains unchanged. In its latest Financial Stability Review, the Deutsche Bundesbank (2013) uses scenario analysis to examine the effect of lower future investment income on bonus and rebate provisions over a 10-year horizon with a view to drawing conclusions about the solvency ratios of 85 German life insurers. The analysis was based on a refinement of the model developed by Kablau and Wedow (2012) and finds that “a stress scenario with a prolonged period of low interest rates, more than one-third of German life insurers would no longer be able to fulfill the regulatory own funds requirements under the current solvency regime (Solvency I) by 2023. […] This result is attributable primarily to high guaranteed interest rates (Deutsche Bundesbank, 2013, p. 69).” ______________________________ 1 This situation is potentially aggravated by a higher substitutability of some life insurance products and negative demand effects impacting premium income from life insurance due to lapse risk.

34
Despite the prevalence of single-period stress testing approaches for insurance, there are clear advantages associated with multi-year scenarios. In most cases, risk factors are applied as one-off (instantaneous) shocks that exogenously determined or calibrated to a specified statistical confidence level over a one-year risk horizon. Extending the stress test horizon to multiple periods helps identify medium- and long-term vulnerabilities from a gradual erosion of the solvency position, which would inform suitable remedial actions and recovery plans (but also support capital planning decisions).43 It also allows for a more comprehensive coverage of intertemporal effects of shocks (such as the impact of lower solvency/rating downgrades on the scenario-based cost of funding/underwriting capacity) and mitigating factors (such as the impact of deferred tax assets, dividend policy, and managerial actions).
While the application of a longer time horizon better reflects the long-term nature of most underwriting activities (with the exception of “short-tailed” non-life insurance), it also diminishes the accuracy of any forecast of solvency conditions under stress. Moreover, the effectiveness of management actions, like changes in hedging activities, product design or dividend payouts, are difficult to model and compare across firms, which risk undermining the consistent implementation of a stress testing methodology. FSAP exercises tend to abstract from a quantitative assessment of these mitigating factors but recognize the scope available to insurance managers for allocating losses among current and future benefits and equity (as in the case of France (2005)) (Figure 6). Given their deeper understanding of local markets and firm characteristics, national supervisors are better placed to assess the credibility of management actions and their mitigating effects under stressed market conditions in multi-period stress tests.
F. Risk Factors and Aggregation Approaches
The relevance of particular risk factors can be very different, depending on the business model and products prevalent in the insurance sector of a specific jurisdiction, as well as the typical investment portfolio. In general, the most significant macro-financial risk transmission can be found in forward-looking indicators of monetary conditions (interest rates and inflation) and asset valuations in capital markets (equity and debt prices) that affect the performance of insurance companies. Although income from underwriting activities is the dominant driver of earnings, life insurers in particular depend on their investment performance, which can be impacted adversely by interest rate changes and asset price volatility, especially if some investments are very long term and/or are highly concentrated in particular asset classes. In addition, non-life insurers with long-term claims are sensitive to significant changes in inflation, which affects their loss provisioning.
43 Extending the time horizon would then require the inclusion of management actions and changes in policyholder behavior; also the pricing cycle in the (re)insurance market would need to be taken into account.

35
i. Interest rate risk―Interest rate risk is one of the most important risk factors in stress tests, especially for life insurers offering long-term annuities with guarantees since the duration of their assets is usually shorter than the duration of liabilities. The methodological approaches for generating interest rate shocks vary widely and include simple parallel shifts of the interest rate term structure as well as more advanced modeling in line with macroeconomic projections. In case a recessionary scenario forms the basis of the stress test, interest rates would likely decline or remain at a low level given (expected) accommodative monetary policy by the central bank. Inflationary pressure, however, would likely result in a scenario with upward-moving interest rates. Generally, short-term interest rates tend to be more volatile than long-term rates (Box 4).44
ii. Equity―Equity risk is a typical component in insurance stress tests although the relevance of equity exposures has decreased in many countries over the last decade. The main challenge is to determine shocks for very different categories of equity exposures, ranging from listed stocks to private equity, hedge funds and various other alternative asset classes. Similarly, for strategic participations shocks can be designed which adequately take into account the nature of these investments.
iii. Real estate―Property price shocks can be designed in the same manner as equity shocks, and also this asset class is characterized by a high degree of heterogeneity across types of property holdings (residential vs. commercial real estate, forestry, project development).The shocks could be applied to both investment assets and self-used property.
iv. Foreign exchange―Risks inherent to exchange rate fluctuations are usually seen as less relevant in an insurance stress test since many solvency regimes include strict matching rules for business written and investments held in foreign currencies. Instead of providing a number of shocks for bilateral exchange rates, sometimes a general appreciation or depreciation of the local currency could be adequate. Nevertheless, for a realistic macro scenario it should be kept in mind that some currencies tend to appreciate in a crisis situation more likely than others due to a “flight to safety.”
v. Credit risk―Credit risk can be of high relevance for insurance undertakings not only due to investment holdings of fixed-income instruments. Credit risk is also inherent in
44 Interest rate risk can be decomposed into changes in the risk-free rate, term premium, and counterparty risk (which also includes changes in sovereign risk). Thus, the impact of interest rate shocks is commonly modeled as the combined result of valuation changes in interest-rate sensitive assets and the losses associated with valuation haircuts due to increases in credit spreads.

36
derivative transactions, contractual relations with reinsurers and direct lending where allowed in the relevant legal framework.45
vi. Concentration risk―Concentration risks can be prevalent on both the asset and the liability side. For a consistent measurement of this risk, it might be useful to apply the stress to the combined exposure to a single counterparty (e.g., a reinsurer to whom business is ceded while an undertaking also holds asset exposures to the same entity). In this context, concentrated banking exposures could also be stressed by assuming the default of the largest bank counterparty and modeling the effects by taking into account the different levels of seniority of deposits, secured or unsecured bonds, equity, repo lending or OTC transactions; if the bank acted as a distribution channel for insurance products, lower premiums could also feed into the stress scenario.
vii. Liquidity/funding risk―Insurers invest premium income from long-dated gross claims and gross life assurance provisions in high-quality assets to support (mostly predictable) short-term payment obligations from insurance policies. However, an abrupt rise in the frequency and severity of claims (due to an exceptional string of large natural catastrophes) could drain the existing liquidity position and overwhelm the liquidity management capacity of non-life insurers.46 Liquidity risks could also materialize in the life insurance sector, though usually to a lesser extent, if structural changes in claims activity and/or negative cash flows from exceptional surrender behavior by policyholders (“lapse risk”) were to increase payment obligations above actuarial expectations (Box 5). For instance, unexpected surrender payments due to higher lapse rates would require insurers to use cash reserves or sell assets to meet these obligations.
viii. Contagion risk―Some arrangements between banking and insurance activities are prone to contagion effects during times of severe stress but are difficult to model
45 From a modeling perspective, there are two interrelated ways of stressing credit risk exposures of insurance undertakings: First, credit risk in a narrow sense, or counterparty default risk, can be modeled similarly to common practices in banking stress tests by estimating stressed probabilities of default and losses given default for different types of claims; however, the historic evidence of defaults for relevant types of claims (especially for reinsurance defaults) is scarce so some approximations are needed. Second, market prices of bonds or other fixed income instruments could be stressed by assuming higher credit spreads. Depending on the exact scenario to be used in the stress test, different shocks might be assumed for corporate bonds (even distinguishing between financials and non-financials, or taking different seniority levels into account) and sovereign bonds. Deriving a consistent macro scenario for sovereign spread should also include a potential “flight to safety” effect, similar to foreign exchange shocks.
46 Note, however, that the immediacy of such liquidity pressures is quite distinct from the demands placed on the treasury function of banks in wholesale funding markets (Box 4), where margin calls have to be satisfied on an intra-day basis.
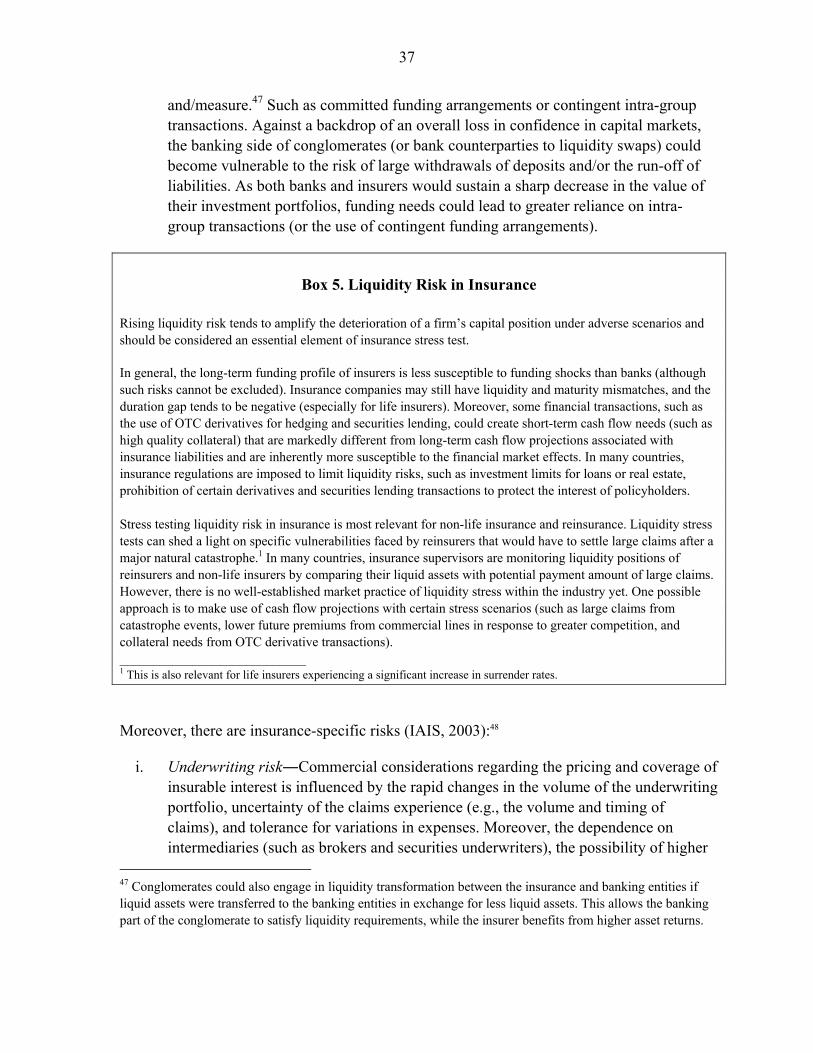
37
and/measure.47 Such as committed funding arrangements or contingent intra-group transactions. Against a backdrop of an overall loss in confidence in capital markets, the banking side of conglomerates (or bank counterparties to liquidity swaps) could become vulnerable to the risk of large withdrawals of deposits and/or the run-off of liabilities. As both banks and insurers would sustain a sharp decrease in the value of their investment portfolios, funding needs could lead to greater reliance on intra-group transactions (or the use of contingent funding arrangements).
Box 5. Liquidity Risk in Insurance
Rising liquidity risk tends to amplify the deterioration of a firm’s capital position under adverse scenarios and should be considered an essential element of insurance stress test.
In general, the long-term funding profile of insurers is less susceptible to funding shocks than banks (although such risks cannot be excluded). Insurance companies may still have liquidity and maturity mismatches, and the duration gap tends to be negative (especially for life insurers). Moreover, some financial transactions, such as the use of OTC derivatives for hedging and securities lending, could create short-term cash flow needs (such as high quality collateral) that are markedly different from long-term cash flow projections associated with insurance liabilities and are inherently more susceptible to the financial market effects. In many countries, insurance regulations are imposed to limit liquidity risks, such as investment limits for loans or real estate, prohibition of certain derivatives and securities lending transactions to protect the interest of policyholders. Stress testing liquidity risk in insurance is most relevant for non-life insurance and reinsurance. Liquidity stress tests can shed a light on specific vulnerabilities faced by reinsurers that would have to settle large claims after a major natural catastrophe.1 In many countries, insurance supervisors are monitoring liquidity positions of reinsurers and non-life insurers by comparing their liquid assets with potential payment amount of large claims. However, there is no well-established market practice of liquidity stress within the industry yet. One possible approach is to make use of cash flow projections with certain stress scenarios (such as large claims from catastrophe events, lower future premiums from commercial lines in response to greater competition, and collateral needs from OTC derivative transactions). ____________________________ 1 This is also relevant for life insurers experiencing a significant increase in surrender rates.
Moreover, there are insurance-specific risks (IAIS, 2003):48
i. Underwriting risk―Commercial considerations regarding the pricing and coverage of insurable interest is influenced by the rapid changes in the volume of the underwriting portfolio, uncertainty of the claims experience (e.g., the volume and timing of claims), and tolerance for variations in expenses. Moreover, the dependence on intermediaries (such as brokers and securities underwriters), the possibility of higher
47 Conglomerates could also engage in liquidity transformation between the insurance and banking entities if liquid assets were transferred to the banking entities in exchange for less liquid assets. This allows the banking part of the conglomerate to satisfy liquidity requirements, while the insurer benefits from higher asset returns.

38
reinsurance rates, and the effects of high pricing uncertainty in new or emerging markets (possibly complicated by insufficiently understood insurance risk and reserving requirements) represent considerable challenges to the risk management of insurers.
ii. Deterioration of technical provisions―This includes the adequacy of the technical claims and other underwriting provisions, the uncertainty of the claims experience (in terms of the frequency and size of claims), the length of the claims development (including possible outcomes relating to any disputed claims, particularly where the outcome is subject to legal proceedings), the impact of inflation, the effects of increasing longevity on pension products, the guarantees and options in policy terms, the risks of early policy surrenders which can be linked to variations in interest rates, and other social, economic, legislative and technological changes.
iii. Demographic risks―Changes in long term trends of mortality can have a significant permanent impact on the life insurance industry. While shocks do not change the underlying trend, they heavily affect both the level and volatility of mortality rates and long-term pay-outs.
iv. Catastrophe risks―This risk reflects the ability of insurers to withstand catastrophic events, increases in unexpected exposures, latent claims or aggregation of claims, or the possible exhaustion of reinsurance (or alternative risk transfer) arrangements, and the appropriateness of the underlying assumptions and calibrations underpinning catastrophe models. Insurance companies use commercially available models to simulate and estimate the possible cost of claims arising from natural catastrophes and man-made disasters. The models are based on historic claims and are constantly updated. Nevertheless, there is a fundamental model risk, especially for low-probability events.
48 The inclusion of underwriting risks is essential; however, some underwriting risks are seen as more useful for inclusion than others: The shorter the time horizon determined for a stress test, the fewer risk types will likely be included. As an example, a stress test depicting an instantaneous shock event might comprise a large catastrophic event which could be a natural or a man-made catastrophe, or a mass lapse event, but probably no improvement in longevity which is a more gradual development.

39
Box 6. Examples of Supervisory Approaches of Insurance Stress Testing
Several jurisdictions have sustained efforts in developing comprehensive stress testing frameworks, which are largely based on bottom-up (BU) approaches that involve considerable involvement by insurers (and their own risk models). Some example jurisdictions are (Appendix Table A2): European Union—The Committee of European Insurance and Occupational Pension Supervisors (CEIOPS) and its successor, the European Insurance and Occupational Pension Authority (EIOPA), have completed two EU-wide stress tests in 2009 and 2011, respectively; by EU Regulation, EIOPA is obliged to perform stress tests on a regular basis. Both stress test exercises used the proposed Solvency II valuation framework, i.e., a (near) market-consistent valuation of assets and liabilities (Figures 5a and 5b). While the scope of the first stress test included only some 30 large insurance groups, the scope has been expanded in the 2011 exercise to include some more insurance groups and also solo entities in order to have a better coverage within individual jurisdictions of EIOPA’s membership; overall, the stress test in 2011 covered more than 50 percent of the European insurance sector in terms of balance sheet assets. Three scenarios have been designed for the latest stress test: (i) a baseline scenario with slightly negative capital market developments, (ii) an adverse scenario with more pronounced equity, property and credit spread shocks, and (iii) an inflationary scenario with sharply rising interest rates. Some underwriting risks have been included, e.g., an increase in longevity, a natural catastrophe (with companies providing their individual largest maximum probable loss for a 1-in-200-years event), a claims deficiency shock and an increase in lapses. Besides these three scenarios, two satellite exercises have been included to cover sovereign stresses (modeled via an increase of sovereign bond spreads) and a prolonged low-yield environment. No specific confidence level has been provided for the shocks which are supposed to happen instantaneously, thereby ruling out any discretionary ex post management actions. As an output measure the Minimum Capital Requirement (MCR) as well as the available capital had to be submitted by participating companies. EIOPA published aggregated results, but no individual company data (EIOPA, 2011a). Singapore—The Monetary Authority of Singapore (MAS) conducts comprehensive stress testing exercises covering all direct insurers. Several exercises have been conducted with different time horizons and time dynamics (short-term (1 year), medium-term (3 years) and stress-to-failure scenarios). Short-term and medium-term scenarios are specified by the MAS, while stress-to-failure scenarios are developed by the appointed actuary of each participating insurance company. The shock scenarios comprise a rise in mortality/morbidity, changes in yield curves, an equity market crash, higher operating expenses, a decline in new underwriting, higher lapse rates, and other risk factors that the appointed actuary considers as relevant. The stress test report submitted to the MAS breaks down the contribution of each risk driver to the overall economic impact of all shocks and the mitigating effect of potential management actions. The report also includes recommendations on risk mitigating actions by the appointed actuary. In addition, the MAS requires the Board of Directors of each insurer to discuss the results and recommendations by the appointed actuary, comment on the feasibility of the management actions and conclude whether any measures need to be taken based on the findings from the stress test. Canada—The Office of the Superintendent of Financial Institutions (OSFI) introduced a guideline on stress testing in 2009, which introduces the purpose, role of the Board of Directors and senior management, methodology, scenario selection and more specific guidance on risk mitigation, securitization, reputation, counterparty and concentration. The guideline covers not only insurers but also their holding companies, banks and bank holding companies, and, thus, provides an integrated framework for the entire financial sector. In 2012, OSFI requested several life (re)insurers to complete a macroeconomic stress test based on a common adverse scenario. OSFI shared the individual results with the participating companies.

40
These risk categories should be defined so as to provide additional insights into the stability of the insurance sector under stress outside the existing solvency regime (Box 6). It is not sufficient to design a stress test exclusively along the lines of prudential measures, which might be limited to general vulnerabilities for less extreme changes in risk factors. In addition, the ability of varying the severity of shocks at different degrees of statistical confidence highlights the sensitivities of the capital contingent on the dynamics.
While supervisory stress testing approaches often include a comprehensive set of asset price shocks, the coverage of underwriting risks varies significantly across countries (Table 2 and Appendix Table A4). Most of the exercises include all material asset risks (credit, market, and interest rate risk), which sometimes exceed the scope of the existing solvency regime. However, foreign exchange risks, sovereign exposures and other risks from the deterioration of the insurer’s risk profile and second-order effects of shocks affecting future underwriting and the ability to maintain existing diversification benefits are rarely found. Foreign exchange risks are explicitly included only in Bermuda, Czech Republic, Guernsey, Switzerland, and the United States. Some jurisdictions also cover sovereign risks, but the actual modeling differs significantly.49 Risk factors on the liability side vary among jurisdictions and are less comprehensive than those on the asset side. More than half of the stress tests consider some form of life underwriting risk (mortality, morbidity, and or longevity); however, other material risks affecting life insurance companies, such as pandemics and lapse/surrender risks are rarely included. For non-life underwriters, supervisors acknowledge economic losses from man-made and natural disasters as peak risks based on the maximum historical claims experience and/or the aggregate policy limit. Other non-life risks tend to be focused on the relative impact of premium risk and the rising cost of insurance claims; the risk of a defaulting reinsurer or the basis risk in reinsurance programs or alternative risk transfer are frequently not covered.50 Most exercises do not explicitly consider shocks of off-balance sheet exposures, with the exception of Bermuda and the Czech Republic.51 However, especially supervisors that approve internal models have
49 For example, the joint exercise by EIOPA and Switzerland includes sovereign risks mainly in the form of higher spread spreads (without considering explicit default scenarios). However, the actual severity of shocks varies considerably among jurisdictions.
50 The market for Alternative Risk Transfer (ART) instruments has grown considerably as insurers are expanding their business activities in order to capitalize on fee income and satisfy demand for cost-efficient (re)insurance capacity. Some of the approaches adopted by firms include expanding their asset management services for sophisticated investors, adopting alternative collateral management solutions, and/or establishing so-called “sidecars” as well as creating special-purpose insurers (SPIs) or segregated accounts companies. The majority of specialised insurance companies support the issuance of insurance-linked securities (ILS), which have become the hallmark of an expanding ART market (Bermuda Monetary Authority, 2013c).
51 For example, the BMA requires an estimation of the impact of a two-notch downgrade of the counterparties. Exercises of other jurisdictions cover at least partially some off-balance sheet risks (such as counterparty credit risks of OTC derivatives) within their overall credit risk module.

41
extended their methodologies to incorporate firm-specific worst-case scenarios based on internal models and/or scenarios that combine the impacts of both adverse macro-financial conditions and maximum aggregate underwriting losses.
The scope of risk factors in FSAP stress tests is generally more limited compared to supervisory exercises (Table 2 and Appendix Table A3). As much as FSAP insurance stress tests benefit from a close cooperation with national supervisors in collecting essential data on insurance risks (which are mostly assessed via BU approaches), the reliance on existing stress testing frameworks also limits the extent to which other risks can be analyzed (and compared across FSAPs for different countries). In most cases, alternative specifications of economic shocks are often confined to sensitivity analyses, which are combined with an overall macroeconomic scenario that primarily impacts the investment performance of insurers. Thus, FSAP stress tests tend to be biased toward risk factors affecting investment performance, such as equity and interest rate shocks (and to a lesser extent real estate and credit spread shocks), which are common to most supervisory approaches. However, the combined effect of economic and underwriting shocks, feedback effects, and the sensitivity of stress test results to changes in the aggregation of risk factors are frequently outside the scope of insurance stress tests completed for FSAPs, which also tend not to incorporate management actions in a more dynamic capital assessment under stress (Figure 6). More specifically, risk factors in FSAPs were specified as follows:
i. Interest rate shocks varied substantially with regard to their severity and implementation. The standard approach of a parallel increase and/or decrease was used in most countries with shocks usually between 100 and 250 basis points. In most of the exercises, both upward and a downward shocks were tested; however, the low interest rate environment motivated greater incidence of upward shocks (Luxembourg, Japan (2012), Singapore) since 2011. Some stress tests applied more sophisticated variations of the interest rate term structure, like a steepening or a flattening of the yield curve (France (2005), Spain, Switzerland, Belgium (2013) and Singapore (2013)). Only very few stress tests applied different shocks for domestic and foreign interest rates, such as in the case of Mexico.
ii. Equity shocks were rather homogeneously modeled. For most FSAP stress tests, a uniform shock between 25 and 35 percent was assumed without taking into account differences in industry sectors or specifying divergent shocks for equity-like assets other than shares like hedge funds or private equity.52 Smaller shocks were applied if equity markets were already depressed (Japan (2013)) or after significant financial sector transformation (Belgium (2013)).
52 Different shocks were applied for advanced economies and emerging economies only in the FSAPs for the Netherlands, Belgium and Singapore.

42
iii. Property price shocks were applied uniformly, similar to equity shocks. In most FSAP stress tests, real estate prices declined by between 15 and 30 percent during times of stress. However, most exercises did not differentiate between commercial and residential real estate prices or involved different shocks to real estate exposures in other countries. Also changes in the collateral value of mortgage loans were not modeled explicitly.
iv. The specification of credit risk varied significantly. Until 2007, one approach was to use the realization of implied Basel II probabilities of default, i.e., losses being derived as the Basel II risk-weights times the minimum capital requirement of eight percent as a measure of expected losses. This approach was used in Spain and Portugal. Simple valuation haircuts were another rather straightforward way, like a 1.5 percent loan loss in Japan (2003) or a 4.4 (9.4) percent loss on loans (corporate bonds) in the case of Israel. Downgrade scenarios for bond holdings (e.g., two to four notches) were frequent during the early phase of the financial crisis (Guernsey and the Isle of Man), whereas absolute (e.g., an increase by 50 bps) or relative (e.g., multiplying current spreads with a factor of 1.5) shocks to credit spreads have now become the norm in stress testing credit risk from traded securities. A differentiation of spread increases by rating class was used in the Netherlands, Belgium (2013), and Singapore (2013). Most of the credit risk scenarios were applied only to corporate bond exposures. Sovereign stress have been added only recently, such as in the case of Luxembourg and Belgium (2013).
v. Foreign exchange risk was included in every other exercise. Only half of all stress tests included an explicit shock to FX rates, which can be explained by its relatively small relevance for the insurance sector relative to other risk factors. For most exercises, a simple variation of the external value of the domestic currency was assumed, ranging between 15 and 35 percent. Rather severe shocks were applied in the Netherlands (45 percent depreciation of the euro), in Denmark (+/- 40 percent) and in South Africa (+/- 50 percent).
vi. Life underwriting risk was included in fewer than half of the exercises. In most cases, a mortality shock was included with mortality rates exceeding baseline assumptions by between 15 and 30 percent. In Spain and Portugal, the effect of lower-than-expected mortality rates was also tested. This approach has been developed further by testing higher mortality rates together increased longevity for annuitants (Guernsey, South Africa, and Isle of Man). Pandemics or higher morbidity rates (similar to mortality rates mostly in a range of 15 to 25 percent above the baseline assumptions) were tested in Spain, Guernsey, South Africa, Isle of Man, and the United States. In a scenario-based motivation of risk factors, higher lapse and surrender rates during recessions were included in five exercises. While earlier stress specifications prescribed a general increase in lapse rates (50 percent in Spain and Portugal, 30 percent in Guernsey), which could potentially be beneficial to insurers, in the case of

43
Belgium (2013) higher lapse rates (+30 percent) were assumed for those policies for which higher lapses would result in a loss for the insurer, i.e., where the surrender value exceeded the technical provision.
vii. Non-life underwriting risks were incorporated mainly via natural catastrophe scenarios. Among the historic scenarios tested in Portugal and France (2005) were the Lisbon earthquake of 1755 and a severe windstorm in 1999, respectively; for the latter the claims were assumed to be twice the amount of the historical claims. The Belgian FSAP (2013) included the PML expected over a 40-year risk horizon. Other non-life stresses included higher claim levels or a higher frequency of large losses, e.g., such as an increase of 10 percent in the cost of claims and a 15 percent higher frequency of claims greater than EUR 30,000 (Spain) or a worsening technical result and higher operating costs (Netherlands and Belgium (2006)).
viii. Other risk factors. In the FSAP for the Netherlands, a commodity shock was added as well as an increase in implied volatilities (which was also used in the South African FSAP).
The risk factors are aggregated in order to determine the joint impact of shocks. Most supervisory stress tests determine the resilience of individual firms based on a combination of single factor shocks that are individually determined rather than calibrated jointly using the historical sensitivity of investment and underwriting performances to changes in economic conditions. Thus, it is common place to use aggregation approaches for the calculation of the total stress impact in order to account for dependence structure between these risk factors. In some cases, the total impact is derived from aggregating the individual impacts various risk factors using one or more correlation matrices (which is also embedded in several solvency regimes, most notably Solvency II). However, this approach implies that the changes of the risk factors are random with a given correlation, which is inconsistent with the notion that shocks represent a significant deviation from expectations around a random process. More intuitive would be to consider the total impact based on a linear combination of the separate risk factor impacts, which preserves individual risk factor impacts at high levels of statistical confidence on an aggregate basis. Thus, some supervisory stress tests (as well as FSAP exercises) have adopted a dual approach of assessing capital adequacy under stress with and without the aggregation of risk factors with diversification effects (Box 7).
G. Output Measures
The main output variable in all solvency stress tests is the change in capital adequacy due to the impact of a pre-defined shock and/or scenario over a single- or multi-period forecast horizon. In the total balance sheet approach, which underpins insurance solvency regimes in many countries, insurance liabilities need to be covered by assets at all times, subject to risk factors impacting the value of assets, the sources of funding, and the payout of insurance claims. In this regard, solvency is frequently defined as the capacity of an insurer to maintain

44
a positive net asset value with a high level of statistical confidence, usually over a one-year risk horizon. The solvency ratio of an insurer is calculated as the excess of equity capital (assets minus liabilities, usually with some restrictions to account for the quality of different types of equity capital, such as preferred stocks) over the prescribed capital requirement (PCR) or some other national capital standard. Besides the PCR, many jurisdictions have also implemented a minimum capital requirement (MCR) or a balance sheet-based minimum solvency margin (MSM) as a minimum threshold; its breach will necessarily trigger the strongest supervisory actions, such as business suspension and revocation of licenses.
The definition of solvency in stress tests can deviate from prudential norms and might involve alternative measures that complement the prudential definition of capital adequacy. Supervisory stress test might not be an essential component of the national solvency regime but serve as sensitivity test only. General accounting-based solvency standards and solvency indicators could be applied, such as the net premium/loss reserve ratio, net premium to capital and surplus ratio, and a simple net asset value measure (i.e., excess assets over liabilities). In an instantaneous stress test, the impact is usually measured by simply comparing pre-shock solvency with post-shock solvency (or an alternative proxy for changes in solvency based actuarial/accounting indicators).
The assessment of capital adequacy is heavily influenced by the definition of capital resources and their availability under stress within the relevant solvency regime. In addition, in jurisdictions with stringent statutory requirements for current (best) estimates of technical provisions and margin requirements, it might be appropriate to include some reserves in the regulatory eligible capital resources.53 However, including less reliable capital instruments (non-permanent instruments such as subordinated debt) and assets (such as intangible assets, deferred tax assets and deferred acquisition costs) requires careful consideration as to their potential loss absorption given the absence of a clear definition of capital for insurance companies.54 When insurers rely on capital instruments of lower quality, adjustment before or after the stress test together with a careful interpretation of the results would be necessary.
The interpretation of stress test results reflects the degree of granularity, the sensitivity of findings to various assumptions, and the calibration of risk factors under different scenarios. Especially BU approaches offer the possibility of analyzing in detail the solvency position
53 Current (best) estimate reflects the expected present value of all relevant future cash flows that arise in fulfilling insurance obligations, using unbiased, current assumptions.
54 More specifically, ICP 17.11.34 provides only a broad categorization of capital: (i) highest quality capital—permanent capital that is fully available to cover losses of the insurer at all times on a going-concern and wind-up basis; (ii) medium quality capital—capital that lacks some of the characteristics of highest quality capital, but which provides a degree of loss absorption during on-going operations and is subordinated to the rights (and reasonable expectations) of policyholders; and (iii) lowest quality capital—capital that provides loss absorption in insolvency/winding-up only.

45
under stress due to the direct involvement of firms in the completion of the exercise. This leads to a more nuanced assessment beyond the source and scope of risk factors, which includes the contribution of individual shocks to the overall scenario impact. Moreover, findings would be conditional on the mitigating (or aggravating) influence of business and external factors (i.e., business strategy and market competition) as well as operational (i.e., management behavior) and structural considerations, e.g., a change in policyholder participation or changes in deferred tax assets/liabilities (Figure 6). If shocks are expected to affect both available and required capital,55 a disaggregated view of the stress test results is desirable. In both FSAPs and national supervisory stress tests, the mitigating (or aggravating) influence of business and external factors tends to be assessed on a qualitative basis only. While management actions and hedging are recognized in many exercises, authorities are requiring insurers to report the results without recognizing those actions.
A higher aggregation level of available stress test results due to data confidentiality increases the importance of the presentation format.56 In many countries, the insurance sector can be segmented into life, non-life and reinsurance. Results should be reported for each year of the forecast time horizon with some measure of dispersion, such as the inter-quartile range, i.e., between the 25th and the 75th percentile of the distribution of solvency levels and certain performance measures. Also the contributions of different risk drivers to the overall solvency results, risk mitigation effects and recognized diversification effects should be shown. Figure 7a shows various graphical presentations of single-period stress test results. In the case of a multi-year projection, the results are compared against a baseline scenario, which reflects a continuation of the business and external conditions at the start of the forecast horizon (Figure 7b).
55 An effect on required capital can usually be assumed in a risk-based solvency framework, which is typically the case for market or credit stresses while for most underwriting effects the effect is rather negligible.
56 Results related to FSAP stress test are only published after consulting with the authorities and approval by the IMF Executive Board, subject to the existing confidentiality agreements between national authorities and IMF as well as IMF statutes that govern data confidentiality with national authorities.

46
Figure 7a. Presentation Templates of Outputs (hypothetical single-period test)
Source: IMF staff.
Note: Boxplots include the asset-weighted and simple average (red dots and yellow diamonds) and the inter-quartile range (i.e., sample results between the 25th and 75th percentiles) (blue boxes).
0
2
4
6
Interest rate risk
Equity risk Spread risk
Sovereign risk
Non-life insurance
stress
Life insurance
stressOverall losses in base scenarioOverall losses in adverse scenario
4. Individual Risk Impacts (In [currency and unit])
0
50
100
150
200
250
300
350
Pre-stress Baseline Adverse Scenario
1. Overall Solvency Ratios(In percent)
0
50
100
150
200
250
300
Pre-stress Baseline Adverse Scenario
All groups and legal entitiesOnly groupsOnly legal entities (solo basis)
2. Overall Solvency Ratios(In percent, weighted average)
0102030405060708090
100
Pre-stress Baseline Adverse scenario
301+251 - 300201 - 250151 - 200101 - 1500 - 100
3. Distribution of Results (by "solvency buckets")(In percent of total insurance sector assets)
020406080
100120140160180200
Pre-stress solvency ratio
Interest rate Equity Spread Sovereign Non-life insurance
Life insurance Policyholder participation
Deferred taxes
Post-stress solvency ratio
5. Breakdown of Changes in Aggregate Solvency(In percentage points)

47
Figure 7b. Presentation Templates of Outputs (hypothetical multiple-period test)
Source: IMF staff.
Note: The bubble chart depicts the total balance sheet assets as the diameter of the bubbles; blue bubbles depict life insurers, red bubbles are non-life insurers.
The traditional balance sheet-based output measures can be complemented with additional risk-sensitive indicators of financial performance. For instance, profitability measures, such as changes in underwriting and investment income relative to net premiums earned/written, can usefully augment the analysis of solvency positions by providing an insight into the underlying dynamics of solvency conditions under stress. A positive net income in a stress scenario is likely to result in a higher solvency ratio and might counterbalance negative valuation effects for assets and liabilities. However, some accounting measures might be difficult to reconcile with the valuation approach underpinning the stress testing exercise. Although net income or derived measures, like return on equity or return on assets, are commonly used as measures of profitability, there are material inconsistencies in the
-14
-12
-10
-8
-6
-4
-2
0
2
-60 -50 -40 -30 -20 -10 0
3. Cumulative Change in Solvency Ratios and Net Income(In percentage points and [currency and unit], respectively)
Net
Inco
me
Solvency Ratio
0
50
100
150
200
250
300
350
2012 2013 2014 2015 2016 2017
1. Solvency Ratios over Time(In percent)
Baseline Adverse scenario
-30
-20
-10
0
10
20
2013 2014 2015 2016 2017
2. Adverse scenario: Contribution of stresses to deviations from baseline(In percentage points)
interest rate & spread equity currency lapse

48
valuation of assets and liabilities.57 These difficulties could be addressed by defining an alternative valuation metric, such as the market-consistent embedded value (MCEV), which can be calculated as the difference between the market value of assets less the market value of liabilities.
The publication of stress test results by insurance supervisors has generally been limited thus far, especially when compared to similar analyses performed on banks. EIOPA refrained from publishing firm-by-firm results of 2011 EU stress test, stating that the test “is based on a future regulatory regime and not necessarily indicative of any current solvency problems (EIOPA, 2011a).”58
The results of FSAP stress tests are published as part of FSSA reports and Technical Notes (TNs) after approval by the IMF’s Executive Board in consultation with the national authorities (Table A1). These publications do not include any company-specific information; instead stress test results are published on an aggregated level. Commonly published are solvency ratios before and after stress (depending on the stress test methodology for single stress factors or for the full scenario) together with some information on the dispersion of results across the sample. Dispersion measures include the inter-quartile range, minimum and maximum. The presentation of test results are linked to the description of the structure and predominant business models observed in the sector. In addition, the recent trend of using multi-year projection horizons requires a thoughtful presentation of the contribution of individual shocks in order to assess the exact timing and duration of the stress. Only very few exercises included the presentation of non-solvency figures, as an example the stress test for France included post-shock policy yields and the stress test for Canada analyzed the impact on net income.
57 For instance, under Solvency II, net income is not a regulatory concept, which complicates any effort to align it with profitability indicators derived from the statutory balance sheet.
58 In the earlier system-wide stress test, also CEIOPS (2010) decided against disclosing firm-specific results.

49
Box 7. Case Study: Belgium Insurance Stress Test for the FSAP
(IMF, 2013b) The stress testing of insurer solvency was undertaken as a BU exercise to determine the capacity of the sector to absorb a combination of single-factor shocks affecting each capital component. The stress test covered the six largest insurers, comprising more than 70 percent of the insurance sector, and was conducted by insurers themselves in collaboration with the FSAP team and National Bank of Belgium (NBB) staff based on mid-2012 prudential data, following the calculation method and guidelines provided by the NBB. In the insurance sector, macro-financial linkages often vary by different business lines as well as technical factors influencing the pricing and reserving of insurance products. In general, the most significant association of the insurance cycle with changes in economic growth can be found in forward-looking indicators of monetary conditions (interest rates and inflation), asset valuations in capital markets (equity and debt prices), and general risk aversion (credit spreads). The NBB calibrated four market risk factors—interest rates, equity prices, corporate spreads, and sovereign spreads—for a mild and a severe adverse scenario, together with a mass lapse event in the life business and the realization of the largest probable maximum losses (PML) on a single (man-made or natural) catastrophic tail event .1 The non-life catastrophe and the life insurance mass lapse were identical for both scenarios. Insurers calculated the overall capital impact by aggregating the individual impact of each risk factor, using a correlation approach, similar to the technique applied within the Solvency II standard formula. The amount of own funds available under each scenario is then compared with the Solvency Capital Requirement (SCR) and the Minimum Capital Requirement (MCR), subject to eligibility conditions. This can be seen as a slight simplification, since the SCR and the MCR change during times of stress. However, the main effect of the scenario is its impact on own funds, rather than on SCR. Also the impact of general conditions affecting risk factors, such as the upcoming regulatory reforms were examined as the sector transitions from the current Solvency I regime to a more risk-based solvency standard (Solvency II). _____________________________ 1 The tests were carried out using data as of end-June 2012 (with the exception of one insurer, which used end-September 2012 data due to corporate restructuring in the interim period).
H. Validation of Results
The prevalence of BU approaches in supervisory stress testing of insurance companies puts a premium on due diligence. While asset side risks from investments are relatively straightforward to evaluate even at a very aggregate level, the actuarial assessment of insurance liabilities requires detailed knowledge of different underwriting portfolios and their stochastic properties, which is difficult to achieve in a TD exercise. Thus, most insurance stress tests are completed in collaboration with the respective insurers. Such a BU approach benefits from greater accuracy (due to industry participation) but also risks undermining the consistency of a system-wide exercise if participating insurers applied different assumptions without sufficient adjustments to the overall stress test results.

50
Validation should be performed based on historical experience and comparative analysis/benchmarking. Firm-specific results can be validated against financial soundness indicators and prudential measures from supervisory reporting, public disclosure or other forms of disclosure, such as surveys and audits. In addition, peer group analysis would help identify outliers across different firms and business lines. Within each of these analytical approaches, not only a point-in-time comparison should be pursued, but also a comparison based on historic trends, including previous stress test results. Table 1 provides an overview of these dimensions and suggests some indicators that could be used for validation.
Table 1. Overview of Possible Validation Checks
Same company Peer group analysis
Point-in-time Impact of stress
Disclosed sensitivities
Impact of stress
Exposure
Impact of stress
Disclosed sensitivities
Deviation in assumptions of future baseline (premiums, claims, lapses etc.)
Time series analysis
Deviations from historic average RoE/RoA
Deviations from historic dividend payout ratio
Deviation in assumptions of future baseline (premiums, claims, lapses,
investment yields etc.)
Deviations from historic average RoE/RoA
Deviations from historic average dividend payout ratio
I. Communicating the Outcome of Stress Tests
The effectiveness of stress testing depends on its communication and disclosure of the identified vulnerabilities. The communication of the stress test results in a manner that is consistent with the applicable solvency regime (and the existing risk governance of firms) is just as important as the design and execution of the stress test itself. Since stress tests should attract attention, and, if applicable, trigger action at the senior decision-making level, it is crucial to present the results in a non-technical manner.59 Moreover, the sensitivity of the 59 An early example of utilizing stress test results and directly linking supervisory action to these is the “traffic-light approach” introduced in Denmark in 2001 for life insurers and pension funds. Depending on the outcome of the stress test, the supervisory authority is empowered to limit the risk-taking of the firm and require additional reporting (IMF, 2007c).

51
outcome to various assumptions and key risk drivers should be presented as robustness check and comprehensive disclosure. If stress tests are completed on a regular basis, standard reporting templates aid comprehension and enhance comparability of stress test results.
The frequency of stress tests is determined by the risk-sensitivity of the supervisory framework, the dynamics of the insurance sector, and the influence of changes in external factors on the validity of the test results. Most risk-based solvency regimes incorporate regular stress tests as an indispensable tool to complement the assessment of solvency conditions. Stress tests should be run on a regular basis. During periods of stress or greater market uncertainty (when firms are likely to adjust their asset allocation or hedging becomes more difficult or expensive), frequent sensitivity analyses and/or additional stress tests based on ad hoc data surveys provide a more accurate representation of existing vulnerabilities.
The specification of stress test scenarios should reflect the changing nature of risk factors and insurance market trends. Even though it might be of interest to track the resilience of the insurance sector towards a specific scenario over time, there is a risk that firms take measures that would allow them to perform well under this specific scenario, which defies the basic premise of the stress test. Instead, stress scenarios should be periodically updated to reflect the time-varying scope of risk factors and their impact on different insurance activities.
The publication of stress test results should be balanced against the consequences of negative market reactions and requires suitable backstops. Findings from a stress testing exercise, especially if completed with the participation of firms, tend to constitute privileged information that can materially influence the behavior of stakeholders outside the supervisory remit, such as investors, counterparties, and competitors. Thus, the scope of disclosure warrants a commensurate communication plan together with an effective recovery and resolution regime, including the option of a readily available fund to protect policyholders of companies that show capital shortfall under stress. For banking stress tests, there is mixed empirical evidence on market reactions in cases when stress test results are disclosed to a wider audience. The publication of the results from the first comprehensive banking stress test in the United States, the Supervisory Capital Assessment Program (SCAP) in 2009, was well-received by investors, largely because the Federal Reserve’s commitment to recapitalize failing banks was seen as sufficiently credible. In contrast, a similar exercise carried out by the Committee of European Banking Supervisors (CEBS) in the same year failed to allay investor concerns about existing vulnerabilities in the banking sector as some relevant risks had been excluded from the exercise, which were amplified by the absence of credible backstop measures (Ong and Pazarbasioglu, 2013).

52
Table 2. Summary of Key Assumptions in Stress Testing of Insurance Sectors in FSAPs and National Approaches
Source: IMF. Notes: TD=top-down, BU=bottom-up. 1/ The scenario design also includes factors that management of insurers can control, such as balance sheet growth, dividend pay-out, other business strategy considerations. In FSAPs, common assumptions are that the growth of balance sheet is in line with nominal GDP, the firm maintains its historical dividend pay-out ratio over the forecast horizon, and there are no changes in investment portfolio, funding sources, business model/underwriting behavior. National approaches benefit from greater insight on the supervisory implications of managerial actions, but assumptions in most approaches are consistent with those applied in FSAPs.
Components Key Elements Explanation
1. Scope
Approach Top-down (TD)/bottom-up (BU) Completion of exercise by supervisor/FSAP team (TD), aggregation of individual results received directly from firms (BU)
Coverage and relevance Institutions, market share Number/type of insurance companies, percentage of insurance sector assets or premiums
Data Source Insurer's own, prudential and/or public data
Scope/reporting basis Reference basis for econoomic impact (solo vs. consolidated), cut-off date
(Un)consolidated insurance group or domestic business only
2. Valuation Basis
Assets/Liabilities Market-consistent or statutory accounting Defines the degree of market-consistency (fair value assets and best estimates of liabilities/technical provisions)
Confidence level Measure of statistical accuracy Value-at-Risk, Conditional Tail Expectation (CTE) (e.g., Expected Shortfall)
3. Scenario Design 1/
Macro-financial linkage/transmission channel(s)
Single factor shocks; macro-financial conditions influencing investment and underwriting performance
Shocks are defined based on the aggregate impact of individual stresses to identified risk factors, joint impact from one or more adverse economic scenarios (as the result of changes in certain equilibrium conditions); also sensitivity analysis of certain risk drivers help assess the robustness of estimates to changes in the severity and combination of risk factors
Combination of single factor shocks without specification of general macroeconomic conditions/scenarios
Risk Horizon Single period (instantaneous, or multiple-period forecast horizon
Forecast horizon over which the severity of stresses are applied (also determined by maturity term of liabilities)
4. Regulatory capital standards
Capital definition/solvency requirement
Metrics (regulatory solvency/premium/loss reserve ratio)
Minimum solvency margin requirement (MSM)/minimum capital requirement (MCR), prescribed capital requirement (PCR)/enhanced capital requirement (ECR), or other general accounting-based/risk-based solvency standard (incl. premium/loss reserve ratio and excess assets over liabilities (net asset value)), with standardized charges (solvency capital requirements or SCR) or charges based on approved internal model results
Capital adequacy Threshold Capital and surplus/amount of recapitalization (in domestic currency) based on choice of solvency requirement/"pass mark" for stress test
5. MethodologyStress test model Accounting-based or marked-based (economic) Determines the degree of market-consistency of economic loss estimates and
implications for solvency assessment
Modeling of risk factors Asset/Insurance risks; macro-financial linkages Calibration/parameterization of risk factors affecting both assets and liabilities under stress using market information, historical experience, and expert judgment
6. CommunicationPresentation of output Template(s) Standardized output template for individual resultsPublication Internal (with authorities), external Results published in FSSA (and Technical Note)
Combination of single factor shocks without specification of general macroeconomic conditions/scenarios; in some instances contains macro-financial linkages of capital market shocks
Balance sheet approaches with varying degrees of conservativeness/actuarial assumptions; Systemic contingent claims analysis (Jobst and Gray, 2013) as market-based technique
Dominance of actuarial approaches based on supervisory guidelines; rising acceptance of economic balance sheet approaches
Adaptation of existing supervisory approaches with sensitivity analysis regarding specific parameters
Reliance on firm's vendor models (esp. for non-life business) and internal approaches; econometric models for income elements and lapse rates
see Figures 7a and 7bsee Tables A1 and A2
Single-period (one year) stress horizon, but most recently multiple periods (2-3 years)
Mostly single-period stress horizon with shocks prescribed by supervisor
Application of existing prudential solvency standard, but also alternative stress testing measures, such as loss measured as percentage of shareholder equity, minimum regulatory premium/loss reserve ratio, solvency margin ratio, net asset value
Existing prudential solvency standard (e.g., Solvency I, Minimum Continuing Capital and Surplus Requirements (MCCSR), Bermuda Solvency Standard, Risk-based Capital (RBC), Swiss Solvency Standard (SST), Singapore Risk-based Capital, Individual Capital Adequacy Standards (ICAS), Solvency Margin Ratio)
e.g., 100% solvency level after application of mitigating factors (if applicable), such as diversfication effects, ECR: 120% of MCR or MSM: higher of USD $[x] or [x]% of net written premiums (NWP), and [x]% of technical provisions
Mostly solo basis, but also consolidated reporting; end of fiscal year Mostly solo basis, but also consolidated reporting; end of fiscal year
Mostly statutory accounting, but also instances when market-consistent valuation was applied
Statutory accounting
Rarely specified From 99.0% CTE to 99.9% VaR
Mostly prudential data (but also public data, esp. for TD) Mostly insurer's own data (but also prudential data, esp. for TD)
IMF FSAPs National Supervisory Approaches
Mostly completed as BU exercise (with the occasional use of TD to complement BU results and as basis for sensitivity analysis)
Usually largest firms (4-6 firms in smaller countries, but more firms in larger countries (e.g., 30 firms in the case of the United States); usually both life and non-life firms (but depends on significance), between 43% and 100%
Usually all firms, but coverage varies between 50% and 100%

53
Table 2. Summary of Key Assumptions in Stress Testing of Insurance Sectors in FSAPs and National Approaches (continued)
Source: IMF. Notes: TD=top-down, BU=bottom-up. 1/ "Freq. (H/M/L)" denotes the frequency of each risk factor in IMF and national stress tests, respectively, where H=high (always/nearly always), M=medium (frequent), and L=low (rare/never).
Components Key Elements Explanation
Assets Freq.(H/M/L)
Freq.(H/M/L)
Credit/counterparty risk Market value changes of fixed income instruments, increase of counterparty risk, and economic value change of loan portofolio
Relative/absolute increase of sovereign credit spreads (at different maturities, rating grades) based on benchmark corporate/sovereign debt and/or credit default swaps (CDS) for specific maturity tenors at a given level of statistical confidence, possibly combined with the assumption of higher implied volatility
Increase of credit spreads by up to 50%, downgrade of counterparties by 2-4 notches, realization of implied PD of Basel II risk-weights, failure of large counterparty
H Rating-class specific increase in credit spreads (but often unspecified)
H
Equity risk Market value changes of equity and alternative investments
Uniform drop of the market values About -30% (but up to -50%) H About -20% (but up to -40%) H
FX risk Negative/positive shocks to net open FX positions and/or FX-denominated assets and liabilities
Significant FX rate appreciation/depreciation (e.g., multiple of historical volatility of FX rate pairs under stress)
Around +/-20% (but up to +/-50%) H Around +/-20% (but often unspecified) H
Real estate risk Economic value change of exposures sensitive to real estate values
Uniform drop of real estate prices About -20% (but up to -50%) H About -15% (but often unspecified) H
Interest rate risk Economic value change of interest-sensitive assets and liabilities
Shift of risk-free yield curves of domestic and foreign currencies (steepening, flattening)
About +/-200bps parallel shift H About +/-100bps parallel shift (but often unspecified) H
Liabilities Freq.(H/M/L)
Freq.(H/M/L)
Life underwritingMortality/morbidity/longevity
Economic loss caused by higher mortality, morbidity and longer life expectancy; catastrophe-related risks from pandemics included in this category
Revaluation of technical provisions (reserves) due to longer claim periods and/or higher claim frequency
Mortality/morbidity/longevity of annuitants (about +25% each); occasional testing of pandemic
M Included in most countries with significant life insurance business (but severity not disclosed)
M
Lapse/surrender rates Economic loss caused by higher surrender rates Share of policies surrendered prematurely; share of policies that result in underwriting losses due to higher lapse rates
Mass lapse of about 25% (but up to 50%) L Rarely included (severity not disclosed) L
Non-life underwritingNatural catastrophe Economic losses from natural and man-made
disastersPerils related to windstroms, earthquakes, floods, and terrorism Usually set to maximum historical claims experience,
such as 1-in-50 years probable maximum loss (PML), or aggregate policy limit
L Usually defined as peak risk based on internal (firm-specific) models or industry benchmarks (often at ver high levels of statistical confidence, such as 1-in-200 years)
M
Other non-life underwriting shocks
Cost/claim increase Relative impact/severity of premium risk, misestimation of liabilities (esp. cost of claims)
Large variation in assumptions, but usually around +10% average cost of claims and +15% higher frequency of claims
L Mostly focused on premium risk and frequency of claims (but no severity disclosed)
M
Other risk factors Freq.(H/M/L)
Freq.(H/M/L)
Deterioration of perceived risk profile
Rating downgrade Relative impact/severity of collateral requirements, loss payment triggers on in-force policy contracts, claw-backs, and/or other adverse financial and liquidity implications of the downgrade
n.a. ― Rating downgrade of insurer by [x] number of notches, off-balance sheet items
L
Second-order effects Feedback effects; management and regulatory action in times of stress
Consideration of feedback effects that compound the impact of risk factors as well as operational/strategic change(s) to business model due to shock
n.a. ― Mostly focused on managerial actions and capital planning M
Combination of financial/underwriting scenarios
Lower premiums after instant shocks; coincidence of peak underwriting losses and asset price depreciation
Lower premium after policyholder reduction of dividends; combined insurance and capital market shock proxies liquidity risk (esp., short-tail business)
Only as part of ex post sensitivity analysis (but rarely used thus far)
L Mostly firm-specific scenarios L
Risk mitigation(reinsurance and hedging)
Reinsurance and derivatives Interest rate swaps for ALM mismatches, reinsurance/retrocession agreements, alternative risk transfer (insurance-linked securities, side cars, embedded value securitization)
n.a. ― Mostly firm-specific scenarios, with/without hedging assumption H
Risk aggregation/diversification effects
Diversification among risk factors and entities Correlation assumptions among various risk factors (e.g., diversification benefit in Solvency II standard formula)
Various simple summations of individual single-factor shocks; sometimes use of correlation matrices for diversification effect
M Various simple summations of individual single-factor shocks but rarely application of diversification effects
M
7. Risk factors 1/
IMF FSAPs National Supervisory Approaches

54
IV. DISCUSSION AND CONCLUSION
The design, use, and implications of system-wide stress tests for insurance have taken greater importance since the end of the last financial crisis. While the systemic relevance of insurance companies is generally different (and in most jurisdictions smaller) than that of banks, the interlinkages between insurers, banks and other financial institutions may increase in the future through products, markets and organizational arrangements, which warrants enhancements to supervisory processes, combined with stronger risk management and flexible approaches to resolvability in order to minimize adverse externalities. National supervisory authorities are revisiting existing stress testing practices with a view towards enhancing their effectiveness and usefulness for forward-looking capital assessments. Nevertheless, most stress testing approaches remain focused on the viability of individual institutions to the economic impact of instantaneous shocks rather than the system-wide robustness to the joint impact of risk factors in relation to the (i) growing complexity of the interconnectedness among insurance companies and with other financial institutions and (ii) the extent to which such interlinkages cause potential spillover and contagion effects. As more jurisdictions move towards market-consistent valuation within their solvency regimes, stress test results can inform a thematic review of key vulnerabilities to these risk factors, which would help integrate stress testing with the supervisory framework.
A more integrated stress testing approach would ideally be based on a common framework for banking and insurance stress testing, or at least consistent assumptions. The closer coordination between banking and insurance stress testing in recent FSAPs, such as in the case of Belgium, Canada, and the United States, testifies the critical role of insurance sector analysis in financial stability assessments as part of bilateral surveillance efforts. However, past experience in FSAPs suggests that considerable effort is required to develop common scenarios that reflect the interconnectedness between the two sectors via capital market transactions and intra-group obligations based on diversification effects from the complementary balance sheet structures: (i) different time horizons used in the specification of stresses (aggregate impact of instantaneous/single factor shocks in insurance stress testing vs. average impact of scenario-based/multi-period sensitivity to multiple risk drivers in bank stress testing), (ii) different (and in the extreme, opposite) sensitivities to the same shocks;60 and (iii) the characteristics of risk factors with adverse scenarios for the insurance sector that would include many liability side risks in addition to the asset side risks that affect both insurers and banks alike. There is also a case to be made for close alignment of these stress tests with similar exercises completed for pension funds (which was the case in Israel (IMF, 2012a)).
60 For instance, a positive shock to interest rates tends to generate higher levels of solvency among insurers, especially long-term underwriters, whereas the opposite holds true for banks.

55
The evolution of the insurance industry will require a constant re-assessment of stress testing practices. The results of stress tests and the interpretation of associated findings are heavily influenced by data availability/granularity, the scope and calibration of macro-financial risks, and the assessment of vulnerabilities to these risks. In particular, these difficulties relate to the following issues:
i. The risk factors are bound to change over time, which can affect the robustness of stress test results. The calibration of risk factors in stress tests is premised on a comprehensive assessment of general conditions and trends in the insurance industry and the broader financial system, the interconnections between insurers and other financial institutions (with a focus on non-traditional and non-insurance activities in insurance groups), and general capital market conditions. Understanding the differences in business models and behavioral characteristics under stress are fundamental to the qualified assessment of their influence on potential risk transmission channels affecting the insurance sector.
ii. The impact of shocks depends on valuation methodologies, whose robustness may be undermined by the very stress events the methodologies are designed to measure. Systemic risks affecting financial stability generally arise from uncertainty, that is, rare and non-recurring events rather than repeated realizations of predictable outcomes. This reality might limit the usefulness of certain (quantitative) measures and actuarial valuation models based on robust statistics (which tend to rely on the convergence of prices and parameters to long-term expectations).
iii. The interpretation of macro-financial shocks and their impact on capital adequacy involves a trade-off between accuracy and timeliness. The historical sensitivity of sample firms to macro-financial shocks is essential to assessing the combined impact of selected risk factors over a pre-defined forecast horizon of stress. While reliance on past experiences enhance confidence in the predictability of how shocks impact capital ex ante, it may also make it difficult to interpret signals and provide early warnings without hindsight bias. Conversely, any early warning gains greater accuracy as the realization of the identified risk becomes more probable, which limits the flexibility in re-calibrating effective policy reaction.61
There is a clear trend towards a more precise and consistent assessment of vulnerabilities in stress testing models due to greater convergence of regulatory standards and supervisory practices. The current work of the IAIS on developing a global solvency regime will further influence the methodological framework of scenario-based capital assessment of insurance
61 Borio and others (2012) state categorically that “stress tests failed spectacularly when they were needed most: none of them helped to detect the vulnerabilities in the financial system ahead of the recent financial crisis.” They concede, however, that stress tests may have a role as crisis management and resolution tools.

56
companies in the context of stress testing for surveillance purposes and prudential supervision. The development and field testing of a basic capital requirement (BCR) for global systemically important insurance companies (G-SIIs) by the end of 2014 is likely to influence the specification of the future risk-based global insurance capital standard (IAIS, 2013e). Both efforts include a cross-country stress testing component together with a BU exercise with participating firms, which will promote further convergence of key methodologies, such as economic valuation as well as the categorization and calibration of risk factors for capital purposes. Also the introduction of Solvency II in the European Union has influenced the design of stress tests in Member States over the recent years, and is paving the way for a more comprehensive assessment of risk factors (including more shocks and a higher level of granularity) and greater convergence in both taxonomy and methodology.
As macroprudential stress testing for the insurance sector continues to evolve, several issues require particular consideration:
i. Most stresses impact both assets and liabilities and should be assessed using a total balance sheet approach. While the modeling of interest rate shocks affecting both sides of the balance sheet has become common practice, most notably in a market-consistent valuation framework for liabilities, other important macro-financial transmission channels should not be overlooked. Claim patterns are closely linked to changes in inflation. Similarly, in some lines of business, such as credit insurance, claims increase significantly during recessions. Depending on the circumstances, the appropriate calibration of shocks affecting liabilities often requires weighing the benefits of prescribed parameters (including premium and claim developments) against the plausibility (and sufficient rigor) of firms’ own assumptions for modeling these effects.
ii. The aggregate risk impact should not include diversification benefits among risk factors except where economically plausible. Assuming that risk factors are not fully correlated, it is reasonable to account for their dependence structure and combinations of stress testing parameters in which the individual impact of each risk is lower than the appropriate percentile for that risk in isolation. However, combining multiple risk factors with diversification effects under different scenarios tends to complicate a reliable capital assessment under stress. Instead, the simple aggregation of risk factor impacts would preserve the stochastic assumptions of each risk factor. In addition, the frequent use of correlation to determine the joint impact of risk factors could lead to an underestimation of potential losses. Given that large shocks are transmitted across entities differently than small shocks, the use of non-linear dependence can deliver more reliable insights about the joint tail risks that arise in extreme loss scenarios (Jobst, 2013b).
iii. Different combinations of risk factors and varying magnitudes of alternative scenarios introduce an element of flexibility. The data on single risk factor impacts

57
can be used to measure the impact of different combinations of risk factors on estimates of system-wide capital adequacy (subject to varying levels of statistical confidence). This would allow stress testers to extend the analysis beyond single factor scenarios and include the assessment of the impact of events with different magnitude in changes of risk factors. However, the non-linearity in the price changes of certain products (such as financial derivatives, embedded options, non-proportional re-insurance contracts, etc.) needs to be taken into consideration for a proper assessment of the impact.
iv. Besides assessing solvency effects, additional measures can reveal a more comprehensive perspective on the full impact of different stress scenarios. First and foremost, accounting measures (e.g., net income and other profitability indicators) are an important factor to understand the dynamics of solvency buffers, as they would affect the decision to pay out dividends to shareholders or bonuses to policyholders. Also incorporating liquidity measures could provide useful insights, especially when investment assets of participating insurance companies become more illiquid (e.g. due to lower market liquidity in an adverse scenario) or when a particularly severe claims shock (e.g., a mass lapse event, or a catastrophe) is tested.
v. The extension of single-period shocks to multi-period scenarios could help to identify medium to long-term vulnerabilities. Extending the stress test horizon and applying multi-year scenarios would also help identify medium- and long-term vulnerabilities from a gradual erosion of the solvency position of insurers, which would inform suitable remedial actions and recovery plans. Moreover, even the market-consistent valuation of liabilities might not fully capture the uncertainty of future cash outflows related to insurance claims (e.g., most liabilities for asbestos-related claims were only recognized decades after the contract was issued), which could be addressed in multi-period scenarios.
vi. When performed in parallel, banking and insurance stress tests might include different risk factors, but would ideally be based on the same target variables defined by a general deterioration of economic conditions. A common metric of risk factors and shocks allows for an integrated analysis at a system-wide level but also at the level of a conglomerate. While the impact of a given scenario defined by changes in economic activity, asset prices and interest rates is likely to differ between insurance and banking activities under stress, supplementary sensitivity analyses for the less affected sector can usually provide additional insights.
vii. The impact of scenarios on intra-group transactions should be assessed by comparing stress testing results. Intra-group transactions or transactions between banking and insurance entities within groups and conglomerates can be very material for the capital and liquidity positions of legal entities under stress and would be

58
ignored if the data input to a stress test was based on consolidated reporting only, which would not include sufficiently granular data.
viii. Secondary impacts emanating from a deteriorating financial position can be material in stress conditions. For instance, the degrading of the solvency position can result in a higher cost of capital, constrain capital mobility or limited underwriting (especially if a rating downgrade occurs), which limits the ability of a distressed insurer to generate sufficient premiums and profit. The detailed analysis of secondary impacts should be linked to contingency and recovery and resolution planning.
ix. The framework of supervisory stress testing should be designed with a view to avoid distortive effects on the behavior of insurers (such as uneconomic changes of the asset allocation or product design). For instance, if stress tests are applied only to the asset side, insurers may reduce the duration of assets (and increase maturity mismatches) in order to improve the solvency position after the stress shock. If an undue cut of policyholder dividends is recognized in the stress testing, insurers may provide more participating products but could end up paying significant dividends to protect their reputation even in stress situations. In the same vein, a variation of stress test scenarios over time will likely reduce the risk of insurance companies trying “to game” the stress test.
x. While the constant evolution of risk analytics is likely to create bias towards enhancing stress testing models, qualitative elements cannot be ignored. The dynamics of business strategies, including but not limited to the constant evolution of underwriting practices, changes in business models, and innovations in risk transfer, require a periodic re-assessment of the relevance of risk factors for the desired level of rigor and comprehensiveness of the chosen stress testing approach. Stress tests will borrow from the evolution of risk management, but without (more) granular datawhich will never be sufficient for reliably modeling tail riskthe utility of more sophisticated methods is limited. Thus, expert judgment will remain a highly crucial element of stress tests. This also places greater focus on more qualitative analysis, such as the reputational risk of individual firms, the competitive environment, and existing risk controls that influence the gross impact of risks.

59
REFERENCES
Abdymomunov, Azamat, Blei, Sharon and Bakhodir Ergashev, 2011, “Worst-Case Scenarios as a Stress Testing Tool for Risk Models,” Working paper, June 21 (Charlotte: The Federal Reserve Bank of Richmond), available at http://www.richmondfed.org/banking/economists/pdf/aa_worst-case_scenarios.pdf.
Antolin, Pablo, Schich, Sebastian and Juan Yermo, 2011, “The Economic Impact of Protracted Low Interest Rates on Pension Funds and Insurance Companies,” OECD Journal: Financial Market Trends, Issue 1 (Paris: Organisation for Economic Co-operation and Development), available at http://www.oecd.org/finance/financial-markets/48537395.pdf.
Artzner, Philippe, Delbaen, Freddy, Eber, Jean-Marc and David Heath, 1999, “Coherent Measures of Risk,” Mathematical Finance, Vol. 9, No. 3, pp. 203-28.
Bermuda Monetary Authority (BMA), 2013a, “2013 Capital and Solvency Return: Stress/Scenario Analysis—Class 4, Class 3B and Insurance Groups,” December 10 (Hamilton: Bermuda Monetary Authority), available at http://www.bma.bm/document-centre/reporting-forms-and-guidelines/INSURANCE%20II/2013%20Stress%20and%20Scenario%20Instructions%20for%20Class%204%20Class%203B%20and%20Insurance%20Groups.pdf.
_______, 2013b, “2013 Capital and Solvency Return: Stress/Scenario Analysis—Class 3A,” December 10 (Hamilton: Bermuda Monetary Authority), available at http://www.bma.bm/document-centre/reporting-forms-and-guidelines/INSURANCE%20II/2013%20Stress%20and%20Scenario%20Instructions%20for%20Class%203A.pdf.
_______, 2013c, “Bermuda Insurance-Linked Securities (ILS) Market Report,” Vol. 1, No. 1, November (Hamilton: Bermuda Monetary Authority), available at http://www.bma.bm/publications/ILS/Q3%202013%20Bermuda%20ILS%20Market%20Report.pdf.
Borio, Claudio, Drehmann, Matthias and Kostas Tsatsaronis, 2012, “Stress-testing Macro Stress Testing: Does It Live Up to Expectations?,” BIS Working Paper No. 369 (Basel: Bank for International Settlements), available at http://www.bis.org/publ/work369.pdf.
Breuer, Thomas, Jandačka, Martin, Mencía, Javier and Martin Summer, 2010, “A Systematic Approach to Multi-Period Stress Testing of Portfolio Credit Risk,” Documentos de Trabajo No. 1018 (Madrid: Banco de España).

60
Bundesanstalt für Finanzdienstleistungsaufsicht (BaFin), 2004, “Conducting of Stress Test,” Circular 1/2004 (VA), February (Bonn: Bundesanstalt für Finanzdienstleistungsaufsicht), available at http://www.bafin.de/DE/Aufsicht/VersichererPensionsfonds/Stresstest/stresstest_node.html.
Committee on the Global Financial System (CGFS), 2000, “Stress Testing by Large Financial Institutions: Current Practice and Aggregation Issues,” CGFS Publications No. 14, April (Basel: Bank for International Settlements), available at http://www.bis.org/publ/cgfs14.pdf.
_______, 2012, “Operationalising the Selection and Application of Macroprudential Instruments,” CGFS Papers No. 48, December (Basel: Bank for International Settlements), available at http://www.bis.org/publ/cgfs48.pdf.
Committee of European Insurance and Occupational Pensions Supervisors (CEIOPS), 2009, “Building a European Stress Test for the European Insurance Sector,” CEOPS-FSC-31/09 (Frankfurt/M.: Committee of European Insurance and Occupational Pensions Supervisors).
_______, 2010, “Results of CEIOPS EU-wide Stress Test for the Insurance Sector,” March 16 (Frankfurt/M.: Committee of European Insurance and Occupational Pensions Supervisors), available at https://eiopa.europa.eu/fileadmin/tx_dam/files/pressreleases/20100316-CEIOPS-Press-Release-Stress-Test-EU-insurance-sector.pdf.
Deutsche Bundesbank, 2013, “Insurance Companies: Bridging Low Interest Rates and Higher Capital Requirements,” Financial Stability Review, November 12 (Frankfurt/M.: Deutsche Bundesbank), available at http://www.bundesbank.de/Redaktion/EN/Downloads/Publications/Financial_Stability_Review/2013_financial_stability_review.pdf?__blob=publicationFile.
Dionne, Georges and Kili C. Wang, 2013, “Does Insurance Fraud in Automobile Theft Insurance Fluctuate with the Business Cycle?,” Journal of Risk and Uncertainty, Vol. 47, No. 1, pp. 67-92.
European Central Bank (ECB), 2013, “Financial Stability Review,” May (Frankfurt/M.: European Central Bank), available at http://www.ecb.europa.eu/pub/pdf/other/financialstabilityreview201305en.pdf.
European Insurance and Occupational Pension Authority (EIOPA), 2011a, “EIOPA Announced Today the Results of Its Second European Insurance Stress Test,” Press Release, July 4 (Frankfurt/M.: European Insurance and Occupational Pension

61
Authority), available at https://eiopa.europa.eu/fileadmin/tx_dam/files/Press-Room/Stress-Test-Results-Release.pdf.
_______, 2011b, “Specification for the 2011 EU-wide Stress Test in the Insurance Sector,” EIOPA-FS-11/012 (Frankfurt/M.: European Insurance and Occupational Pension Authority), available at https://eiopa.europa.eu/index.php?eID=dam_frontend_push&docID=14551.
_______, 2013a, “Opinion on Supervisory Response to a Prolonged Low Interest Rate Environment,” 28 February (Frankfurt/M.: European Insurance and Occupational Pension Authority), available at https://eiopa.europa.eu/fileadmin/tx_dam/files/publications/opinions/EIOPA_Opinion_on_a_prolonged_low_interest_rate_environment.pdf.
_______, 2013b, “Financial Stability Report, Second Half-Year Report,” (Frankfurt/M.: European Insurance and Occupational Pension Authority), available at https://eiopa.europa.eu/fileadmin/tx_dam/files/publications/fin-stability/Reports/EIOPA_Financial_Stability_Report_-_2013_1H_01.pdf.
_______, 2014, “EIOPA Launches EU-wide Stress Test,” Press Release, 30 April (Frankfurt/M.: European Insurance and Occupational Pension Authority), available at https://eiopa.europa.eu/fileadmin/tx_dam/files/activities/financial_stability/insurance_stress_test_2014/2014-04-30_Stress_Test_2014.pdf.
Financial Services Authority (FSA), 2008, “Stress and Scenario Testing,” Consultation Paper CP 08/24, December (London: Financial Services Authority), available at http://www.fsa.gov.uk/pubs/cp/cp08_24.pdf.
_______, 2009, “Stress and Scenario Testing,” Policy Statement 9/20, Feedback on Consultation Paper CP 08/24 and Final Rules, December, available at http://www.fsa.gov.uk/pubs/policy/ps09_20.pdf.
Financial Services Agency of Japan (JFSA), 2013, “Supervisory Guidance for Insurers,” (Tokyo: Financial Services Agency of Japan), available at http://www.fsa.go.jp/common/law/guide/ins/index.html.
French, Doug, de Haan, Richard, Luck, Robb and Justin Mosbo, 2011, “The Impact of Prolonged Low Interest Rates on the Insurance Industry,” Ernst&Young, Financial Services, October.
Guernsey Financial Services Commission, 2011, “Stress Testing of the Guernsey Insurance Sector,” December (St Peter Port: Guernsey Financial Services Commission), available at http://www.gfsc.gg/The-

62
Commission/Documents%20and%20Forms/Technical-Note-on-Stress-Testing-(December%202011).pdf.
Hesse, Heiko, Salman Ferhan and Christian Schmieder, 2014, “How to Capture Macro-Financial Spillover Effects in Stress Tests?,” IMF Working Paper No. 14/103 (Washington, D.C.: International Monetary Fund), available at http://www.imf.org/external/pubs/ft/wp/2014/wp14103.pdf.
International Actuarial Association (IAA), 2013, “Stress Testing and Scenario Analysis,” Insurance Regulation Committee, July (Ottawa: International Actuarial Association), available at http://www.actuaries.org/CTTEES_SOLV/Documents/StressTestingPaper.pdf.
International Association of Insurance Supervisors (IAIS), 2003, “Stress Testing by Insurers Guidance Paper,” Guidance Paper No. 8, October (Basel: Bank for International Settlements), available at http://www.iaisweb.org/__temp/Stress_testing_by_insurers_guidance_paper.pdf.
_______, 2010, “Macroprudential Surveillance and (Re)Insurance,” Global Reinsurance Market Report, Mid-year Edition, August 26 (Basel: Bank for International Settlements), available at http://www.iaisweb.org/view/element_href.cfm?src=1/9926.pdf.
_______, 2011a, “Insurance and Financial Stability,” November (Basel: Bank for International Settlements), available at http://www.iaisweb.org/view/element_href.cfm?src=1/13348.pdf.
_______, 2011b, “Insurance Core Principles, Standards, Guidance and Assessment Methodology” (Basel: Bank for International Settlements), available at http://www.iaisweb.org/db/content/1/16689.pdf.
_______, 2011c, “Global Reinsurance Market Report” (Basel: Bank for International Settlements), available at http://www.iaisweb.org/Global-Reinsurance-Market-Report-GRMR-538.
_______, 2012a, “Global Systematically Important Insurers: Proposed Policy Measures,” Public Consultation Document, 17 October (Basel: Bank for International Settlements), available at http://www.iaisweb.org/view/element_href.cfm?src=1/16023.pdf.
________, 2012b, “Reinsurance and Financial Stability,” 19 July (Basel: Bank for International Settlements), available at http://www.iaisweb.org/view/element_href.cfm?src=1/16023.pdf.

63
________, 2012c, “Global Insurance Market Report (GIMAR),” October (Basel: Bank for International Settlements), available at http://www.iaisweb.org/Global-Insurance-Market-Report-GIMAR-962.
_______, 2012d, “Global Systemically Important Insurers: Proposed Assessment Methodology,” Public Consultation Document, May 31 (Basel: Bank for International Settlements), available at http://www.iaisweb.org/view/element_href.cfm?src=1/15384.pdf.
_______, 2013a, “Macroprudential Policy and Surveillance in Insurance,” Macroprudential Surveillance and Policy Subcommittee (MPSSC), July 18 (Basel: Bank for International Settlements), available at http://www.iaisweb.org/view/element_href.cfm?src=1/19149.pdf.
_______, 2013b, “IAIS Releases Global Systemically Important Insurers Assessment Methodology and Policy Measures, Macroprudential Policy and Surveillance Framework,” Press Release, July 18 (Basel: Bank for International Settlements), available at http://iaisweb.org/view/element_href.cfm?src=1/19152.pdf.
_______, 2013c, “Global Systemically Important Insurers: Final Initial Assessment Methodology,” July 18 (Basel: Bank for International Settlements), available at http://www.iaisweb.org/view/element_href.cfm?src=1/19151.pdf .
_______, 2013d, “Global Systemically Important Insurers: Final Policy Measures,” Press Release, July 18 (Basel: Bank for International Settlements), available at http://www.iaisweb.org/view/element_href.cfm?src=1/19150.pdf .
_______, 2013e, “Proposal for Basic Capital Requirements (BCR) for Global Systemically Important Insurers (G-SIIs),” Public Consultation, December 16 (Basel: Bank for International Settlements), available at http://www.iaisweb.org/News/Consultations/Basic-Capital-Requirement-1141.
International Monetary Fund (IMF), 2003, “Japan: Financial System Stability Assessment and Supplementary Information,” IMF Country Report No. 03/287, September (Washington, D.C.: International Monetary Fund), available at http://www.imf.org/external/pubs/ft/scr/2003/cr03287.pdf.
_______, 2004a, “The Kingdom of the Netherlands—Netherlands: Financial System Stability Assessment,” IMF Country Report No. 04/312, September (Washington, D.C.: International Monetary Fund), available at http://www.imf.org/external/pubs/ft/scr/2004/cr04312.pdf.

64
_______, 2004b, “France: Financial System Stability Assessment,” IMF Country Report No. 04/344, November (Washington, D.C.: International Monetary Fund), available at http://www.imf.org/external/pubs/ft/scr/2004/cr04344.pdf.
_______, 2004c, “Singapore: Financial System Stability Assessment,” IMF Country Report No. 04/104, April (Washington, D.C.: International Monetary Fund), available at http://www.imf.org/external/pubs/ft/scr/2004/cr04104.pdf.
_______, 2005, “France: Financial Sector Assessment Program—Technical Notes—Stress Testing Methodology and Results,” IMF Country Report No. 05/185, June (Washington, D.C.: International Monetary Fund), available at http://www.imf.org/external/pubs/ft/scr/2005/cr05185.pdf.
_______, 2006a, “Belgium: Financial System Stability Assessment,” IMF Country Report No. 06/75, March (Washington, D.C.: International Monetary Fund), available at http://www.imf.org/external/pubs/ft/scr/2006/cr0675.pdf.
_______, 2006b, “Spain: Financial System Stability Assessment,” IMF Country Report No. 06/212, June (Washington, D.C.: International Monetary Fund), available at http://www.imf.org/external/pubs/ft/scr/2006/cr06212.pdf.
_______, 2006c, “Spain: Financial Sector Assessment Program—Technical Note—Stress Testing Methodology and Results,” IMF Country Report No. 06/216, June (Washington, D.C.: International Monetary Fund), available at http://www.imf.org/external/pubs/ft/scr/2006/cr06216.pdf.
_______, 2006d, “Denmark: Financial System Stability Assessment,” IMF Country Report No. 06/343, October (Washington, D.C.: International Monetary Fund), available at http://www.imf.org/external/pubs/ft/scr/2006/cr06343.pdf.
_______, 2006e, “Mexico: Financial System Stability Assessment,” IMF Country Report No. 06/350, October (Washington, D.C.: International Monetary Fund), available at http://www.imf.org/external/pubs/ft/scr/2006/cr06350.pdf.
_______, 2006f, “Portugal: Financial System Stability Assessment,” IMF Country Report No. 06/378, October (Washington, D.C.: International Monetary Fund), available at http://www.imf.org/external/pubs/ft/scr/2006/cr06378.pdf.
_______, 2007a, “Portugal: Financial Sector Assessment Program – Technical Note – Stress Testing,” IMF Country Report No. 07/34, January (Washington, D.C.: International Monetary Fund), available at http://www.imf.org/external/pubs/ft/scr/2007/cr0734.pdf.

65
_______, 2007b, “Denmark: Financial Sector Assessment Program – Technical Note – Stress Testing,” IMF Country Report No. 07/125, January (Washington, D.C.: International Monetary Fund), available at http://www.imf.org/external/pubs/ft/scr/2007/cr07125.pdf.
_______, 2007c, “Denmark: Financial Sector Assessment Program – Detailed Assessment of Observance of the Insurance Core Principles,” IMF Country Report No. 07/119, March (Washington, D.C.: International Monetary Fund), available at http://www.imf.org/external/pubs/ft/scr/2007/cr07119.pdf.
_______, 2007d, “Switzerland: Financial System Stability Assessment,” IMF Country Report No. 07/187, October (Washington, D.C.: International Monetary Fund), available at http://www.imf.org/external/pubs/ft/scr/2007/cr07187.pdf.
_______, 2007e, “Switzerland: Financial Sector Assessment Program – Technical Note – Insurance Sector Stress Testing,” IMF Country Report No. 07/201, June (Washington, D.C.: International Monetary Fund), available at http://www.imf.org/external/pubs/ft/scr/2007/cr07201.pdf.
_______, 2007f, “Mexico: Financial Sector Assessment Program Update - Technical Note - Risk Management Practices and Stress Tests of Commercial Banks, The Insurance Sector, and the Derivatives Exchange,” IMF Country Report No. 07/165, October (Washington, D.C.: International Monetary Fund), available at http://www.imf.org/external/pubs/ft/scr/2007/cr07165.pdf.
_______, 2008a, “South Africa: Financial System Stability Assessment,” IMF Country Report No. 08/349, October (Washington, D.C.: International Monetary Fund), available at http://www.imf.org/external/pubs/ft/scr/2008/cr08349.pdf.
_______, 2008b, “Bermuda: Assessment of the Supervision and Regulation of the Financial Sector,” IMF Country Report No. 08/336, October 16 (Washington, D.C.: International Monetary Fund), available at http://www.imf.org/external/pubs/ft/scr/2008/cr08336.pdf.
_______, 2008c, “Austria: Financial Sector Assessment Program Update, Technical Note—Factual Update and Analysis of the IAIS Insurance Core Principles,” IMF Country Report No. 08/207, July (Washington, D.C.: International Monetary Fund), available at http://www.imf.org/external/pubs/ft/scr/2008/cr08207.pdf.
_______, 2009a, “Isle of Man: Financial System Stability Assessment,” IMF Country Report No. 09/275, September (Washington, D.C.: International Monetary Fund), available at http://www.imf.org/external/pubs/ft/scr/2009/cr09275.pdf.

66
_______, 2009b, “Isle of Man: Financial Sector Assessment Program Update – Technical Note – Stress Testing: Banking and Insurance,” IMF Country Report No. 09/279, September (Washington, D.C.: International Monetary Fund), available at http://www.imf.org/external/pubs/ft/scr/2009/cr09279.pdf.
_______, 2010a, “United States: Financial System Stability Assessment,” IMF Country Report No. 10/247, July (Washington, D.C.: International Monetary Fund), available at http://www.imf.org/external/pubs/ft/scr/2010/cr10247.pdf.
_______, 2010b, “United States: Financial Sector Assessment Program Update – Technical Note on Stress Testing,” IMF Country Report No. 10/244, July (Washington, D.C.: International Monetary Fund), available at http://www.imf.org/external/pubs/ft/scr/2010/cr10244.pdf.
_______, 2011a, “Guernsey: Financial System Stability Assessment,” IMF Country Report No. 11/1, January (Washington, D.C.: International Monetary Fund), available at http://www.imf.org/external/pubs/ft/scr/2011/cr1101.pdf.
_______, 2011b, “Guernsey: Financial Sector Assessment Program Update – Technical Note on Stress Testing: Banking and Insurance,” IMF Country Report No. 11/4, January (Washington, D.C.: International Monetary Fund), available at http://www.imf.org/external/pubs/ft/scr/2011/cr1104.pdf.
_______, 2011c, “Macroprudential Policy: An Organizing Framework,” Monetary and Capital Markets (14 March) (Washington, D.C.: International Monetary Fund), available at http://www.imf.org/external/np/pp/eng/2011/031411.pdf.
_______, 2011d, “Toward Operationalizing Macroprudential Policies: When to Act?,” Global Financial Stability Report, Chapter 3, September, World Economic and Financial Surveys (Washington, D.C.: International Monetary Fund), available at http://www.imf.org/external/pubs/ft/gfsr/2011/02/pdf/ch3.pdf.
_______, 2011e, “Luxembourg: Financial System Stability Assessment,” IMF Country Report No. 11/148, June (Washington, D.C.: International Monetary Fund), available at http://www.imf.org/external/pubs/ft/scr/2011/cr11148.pdf.
_______, 2012a, “Israel: Financial System Stability Assessment,” IMF Country Report No. 12/69, April (Washington, D.C.: International Monetary Fund), available at http://www.imf.org/external/pubs/ft/scr/2012/cr1269.pdf.
_______, 2012b, “Macrofinancial Stress Testing – Principles and Practices,” August (Washington, D.C.: International Monetary Fund), available at http://www.imf.org/external/np/pp/eng/2012/082212.pdf.

67
_______, 2012c, “Israel: Technical Note on Stress Testing of the Banking, Insurance and Pension Sectors,” IMF Country Report No. 12/88, April (Washington, D.C.: International Monetary Fund), available at http://www.imf.org/external/pubs/ft/scr/2012/cr1288.pdf.
_______, 2012d, “Japan: Financial System Stability Assessment,” IMF Country Report No. 12/210, August (Washington, D.C.: International Monetary Fund), available at http://www.imf.org/external/pubs/ft/scr/2012/cr12210.pdf.
_______, 2012e, “France: Financial System Stability Assessment,” IMF Country Report No. 12/341, December (Washington, D.C.: International Monetary Fund), available at http://www.imf.org/external/pubs/ft/scr/2012/cr12341.pdf.
_______, 2013a, “Belgium: Financial System Stability Assessment,” IMF Country Report No. 13/124, May (Washington, D.C.: International Monetary Fund), available at http://www.imf.org/external/pubs/ft/scr/2013/cr13124.pdf.
_______, 2013b, “Belgium: Technical Note on Stress Testing the Banking and Insurance Sectors,” IMF Country Report No. 13/137, May (Washington, D.C.: International Monetary Fund), available at http://www.imf.org/external/pubs/ft/scr/2013/cr13137.pdf.
_______, 2013c, “Key Aspects of Macroprudential Policy,” Board Paper, June 10 (Washington, D.C.: International Monetary Fund), available at http://www.imf.org/external/np/pp/eng/2013/061013b.pdf.
_______, 2013d, “Singapore: Financial System Stability Assessment,” IMF Country Report No. 13/325, November (Washington, D.C.: International Monetary Fund), available at http://www.imf.org/external/pubs/ft/scr/2013/cr13325.pdf.
_______, 2014a, “Canada: Financial Sector Stability Assessment,” IMF Country Report No. 14/29, February (Washington, D.C.: International Monetary Fund), available at http://www.imf.org/external/pubs/ft/scr/2014/cr1429.pdf.
_______, 2014b, “Canada: Technical Note on Stress Testing,” IMF Country Report No. 14/69, March (Washington, D.C.: International Monetary Fund), available at http://www.imf.org/external/pubs/ft/scr/2014/cr1469.pdf.
Ionescu, Liviu and Juan Yermo, 2014, “Stress Testing and Scenario Analysis of Pension Plans,” IOPS Working Papers on Effective Pensions Supervision No.19, March (Paris: Organisation for Economic Cooperation and Development (OECD)― International Organisation of Pension Supervisors (IOPS)), available at http://www.oecd.org/site/iops/Working%20Paper%2019%20Stress%20testing%20and%20Scenario%20Analysis%20of%20Pension%20Plans.pdf.

68
Jobst, Andreas A., 2012, “Systemic Risk in the Insurance Sector―A Review of General Issues and Some Findings on Large Insurers in Bermuda,” Working Paper, available at http://papers.ssrn.com/sol3/papers.cfm?abstract_id=2022062.
_______, 2013a, “Best Practices in Insurance Stress Testing,” Insurance Industry Forum: ORSA, Section 3: Group Risk Capital and Prospective Solvency Assessment, Institute for International Research (IIR), 11 December (Boston/MA).
_______, 2013b, “Multivariate Dependence of Implied Volatilities from Equity Options as Measure of Systemic Risk,” International Review of Financial Analysis, Vol. 28, pp. 112-29.
_______, 2014, “Systemic Risk in the Insurance Sector: A Review of Current Approaches,” The Geneva Papers on Risk and Insurance, Vol. 39, pp. 440-70.
Jobst, Andreas A., Ong, Li Lian and Christian Schmieder, 2013, “A Framework for Macroprudential Bank Solvency Stress Testing: Application to S-25 and Other G-20 Country FSAPs,” IMF Working Paper No. 13/68 (Washington, D.C.: International Monetary Fund), available at http://www.imf.org/external/pubs/ft/wp/2013/wp1368.pdf.
Jobst, Andreas, Hardy, Daniel, and Christian Schmieder, forthcoming, “Sovereign Haircuts,” IMF Working Paper (Washington, D.C.: International Monetary Fund).
Jones, Rob C., and Rodney A. Clark, 2011, “Credit FAQ: Rating Implications for G-SIFI-Designated Insurers,” Standard and Poor’s Rating Services, Credit & Investment Research, S&P Credit Research (28 June). Also published in Rob C. Jones (ed.) Global Reinsurance Highlights 2011. Regulatory Update, Standard and Poor’s Rating Services, pp. 7-76, available at http://www.standardandpoors.com/spf/swf/ereports/webpage/Webpage/pdf/Global_Reinsurance_Highlights.pdf.
Kablau, Anke and Michael Wedow, 2012, “Gauging the Impact of a Low-interest Rate Environment on German Life Insurers,” Applied Economics Quarterly, Vol. 58, No. 4, pp. 279-98. Also published as Discussion Paper No. 02/2011 (Frankfurt/M.: Deutsche Bundesbank), available at http://www.bundesbank.de/Redaktion/EN/Downloads/Publications/Discussion_Paper_2/2011/2011_02_08_dkp_02.pdf?__blob=publicationFile.
Komárková, Zlatuše and Marcela Gronychová, 2012, “Models for Stress Testing in the Insurance Sector,” Research and Policy Notes, December (Prague: Czech National Bank), available at http://www.cnb.cz/miranda2/export/sites/www.cnb.cz/en/research/research_publications/irpn/download/rpn_2_2012.pdf.

69
Monetary Authority of Singapore (MAS), 2011, “Stress Testing on Financial Condition of Life Direct Insurer [Cancelled with effect from 16 Jan 2012],” Notice No. MAS 312, February 7 (Singapore: Monetary Authority of Singapore), available at http://www.mas.gov.sg/regulations-and-financial-stability/regulations-guidance-and-licensing/insurance/notices/insurance-companies/2011/mas-312-stress-testing-on-financial-condition-of-life-direct-insurer_7-feb-2011.aspx.
_______, 2013, “Enterprise Risk Management for Insurers,” Notice No. MAS 126, April 2 (Singapore: Monetary Authority of Singapore), available at http://www.mas.gov.sg/~/media/resource/legislation_guidelines/insurance/notices/MAS%20126_20130402.pdf.
National Association of Insurance Commissioners (NAIC), 2013, “Own Risk and Solvency Assessment (ORSA),” 2013 NAIC Financial Summit, San Diego, May 29 (Kansas City: National Association of Insurance Commissioners), available at http://www.naic.org/documents/frs_financial_summit_presentations_13_orsa.pdf.
Office of the Superintendent of Financial Institutions (OSFI), 2009, “Stress Testing,” Guideline, December (Ottawa: Office of the Superintendent of Financial Institutions), available at http://www.osfi-bsif.gc.ca/Eng/fi-if/rg-ro/gdn-ort/gl-ld/Pages/e18.aspx.
Ong, Li Lian and Ceyla Pazarbasioglu, 2013, “Credibility and Crisis Stress Testing,” IMF Working Paper No. 13/178 (Washington, D.C.: International Monetary Fund), available at http://www.imf.org/external/pubs/ft/wp/2013/wp13178.pdf.
Prudential Regulatory Authority (PRA), 2013, “The Prudential Regulation Authority’s Approach to Insurance Supervision,” April (London: Bank of England), available at http://www.bankofengland.co.uk/publications/Documents/praapproach/insuranceappr1304.pdf.
Swiss Federal Office of Private Insurance, 2004, “White Paper of the Swiss Solvency Test,” November (Bern: Swiss Federal Office of Private Insurance), available at http://www.naic.org/documents/committees_smi_int_solvency_switzerland_sst_wp.pdf.
Swiss Re, 2012, “Facing the Interest Rate Challenge,” Sigma No. 4/2012 (Zurich: Swiss Re), available at http://www.swissre.com/r/sigma4_2012_en.pdf.
The Geneva Association, 2010a, “Systemic Risk in InsuranceAn Analysis of Insurance and Financial Stability,” Special Report of the Geneva Association Systemic Risk Working Group, March (Geneva: The International Association for the Study of Insurance Economics), available at http://www.genevaassociation.org/portals/0/Geneva_Association_Systemic_risk_in_Insurance_Report_March2010.pdf.

70
_______, 2010b, “Key Financial Stability Issues in InsuranceAn Account of the Geneva Association Ongoing Dialogue on Systemic Risk with Regulators and Policy-Makers,” July (Geneva: The International Association for the Study of Insurance Economics), available at http://www.genevaassociation.org/pdf/BookandMonographs/Geneva_Association_Key_Financial_Stability_Issues_in_Insurance_July2010.pdf.
_______, 2011, “Assessment of Systemic Risk Indicators in the Insurance Sector,” IAIS Technical Committee Observer Hearing, February17 (Geneva: The International Association for the Study of Insurance Economics), available at http://www.genevaassociation.org/pdf/News/GA_Presentation_IAIS_Hearing_17Feb2011.pdf.
_______, 2012, “Cross Industry Analysis: 28 G-SIBs vs. 28 Insurers Comparison of Systemic Risk Indicators,” December 11 (Geneva: The International Association for the Study of Insurance Economics), available at http://www.genevaassociation.org/pdf/News/GA2012_Benchmark_Study.pdf.
Vouldis, Angelos, Baudino, Patrizia, Kok, Christoffer and Matthias Sydow, 2013, “Box 4: Insurance Sector Solvency Analysis Framework: A Stock-taking of Available Tools,” in Henry, Jérôme and Christoffer Kok (eds.), “A Macro Stress Testing Framework for Assessing Systemic Risks in the Banking Sector,” Occasional Paper Series No. 152 (Frankfurt/M.: European Central Bank), available at http://www.ecb.europa.eu/pub/pdf/scpops/ecbocp152.pdf.
Wang, Lin and Ali M. Kutan, 2013, “The Impact of Natural Disasters on Stock Markets: Evidence from Japan and the United States,” Comparative Economic Studies, Vol. 55, pp. 672-86.

71
Appendix I―Tables
Table A1. Overview of Insurance Stress Tests in FSAPs
FSAP mission dates Publication
Japan June 2002, October 2002, March 2003 FSSA: September 2003 (IMF, 2003)
Singapore November 2002, July/August 2003,
September 2003 FSSA: April 2004 (IMF, 2004c)
Netherlands October/November 2003, March 2004 FSSA: September 2004 (IMF, 2004a)
France February 2004,
May 2004 FSSA: November 2004 (IMF, 2004b)
TN: June 2005 (IMF, 2005)
Belgium December 2004,
March 2005 FSSA: February 2006 (IMF, 2006a)
Spain June/July 2005,
October/November 2005 FSSA: June 2006 (IMF, 2006b)
TN: June 2006 (IMF, 2006c)
Denmark November 2005,
May 2006
FSSA: October 2006 (IMF, 2006d)
TN: March 2007 (IMF, 2007b)
Mexico February/March 2006 FSSA: October 2006 (IMF, 2006e)
TN: May 2007 (IMF, 2007f)
Portugal December 2005,
May 2006
FSSA: October 2006 (IMF, 2006f)
TN: January 2007 (IMF, 2007a)
Switzerland November 2006 FSSA: June 2007 (IMF, 2007d)
TN: June 2007 (IMF, 2007e)
Bermuda June 2007 FSSA: October 2008 (IMF, 2008b)
South Africa May 2008 FSSA: October 2008 (IMF, 2008a)
Isle of Man September 2008 FSSA: September 2009 (IMF, 2009a)
TN: September 2009 (IMF, 2009b)
United States October/November 2009,
February/March 2010 FSSA: July 2010 (IMF, 2010a)
TN: July 2010 (IMF, 2010b)
Guernsey March 2010 FSSA: January 2011 (IMF, 2011a)
TN: January 2011 (IMF, 2011b)
Luxembourg November 2010 FSSA: June 2011 (IMF, 2011e)
Israel November 2011 FSSA: April 2012 (IMF, 2012a)
TN: April 2012 (IMF, 2012c)
Japan November/December 2011,
March 2012 FSSA: August 2012 (IMF, 2012d)
France January 2012, June 2012 FSSA: December 2012 (IMF, 2012e)
Belgium November 2012,
January 2013
FSSA: May 2013 (IMF 2013a)
TN: May 2013 (IMF, 2013b)
Singapore May 2013,
July/August 2013 FSSA: November 2013 (IMF, 2013d)
Canada June 2013,
September 2013
FSSA: February 2014 (IMF, 2014a)
TN: March 2014 (IMF, 2014b)
Notes: FSSA=Financial System Stability Assessment; TN=Technical Note on Stress Testing.

72
Table A2. Overview of National Supervisory Stress Testing Approaches
Reference
Austria Austria: Financial Sector Assessment Program Update, Technical Note—Factual Update and Analysis of the IAIS Insurance Core Principles (IMF, 2008c)
Bermuda Stress/Scenario Analysis (Class 4, Class 3B and Insurance Groups) and Stress/Scenario Analysis (Class 3A) (BMA, 2013a and 2013b; Appendix Box 8)
Canada Stress Testing Guideline (OSFI, 2009)
Czech Republic Models for Stress Testing in the Insurance Sector (Komárková and Gronychová, 2012)
Denmark Financial Sector Assessment Program - Detailed Assessment of Observance of the Insurance Core Principles (IMF, 2007c)
European Union (EIOPA) Specifications for the 2011 EU-wide Stress Test in the Insurance Sector (EIOPA, 2011b)
Germany Conducting of Stress Test (BaFin, 2004)
Guernsey Stress Testing of the Guernsey Insurance Sector (Guernsey Financial Services Commission, 2011)
Japan Supervisory Guidance for Insurers (JFSA, 2013)
Singapore ERM Notice (MAS, 2011), Stress Testing on Financial Condition of Life Direct Insurer (MAS, 2013)
Switzerland White Paper of the Swiss Solvency Test (Swiss Federal Office of Private Insurance, 2004)
United Kingdom Stress and Scenario Testing (FSA, 2008)
United States Own Risk and Solvency Assessment (ORSA) (NAIC, 2013)

73
Table A3. IMF FSAPs: Specification of Insurance Stress Testing
Source: IMF. Notes: TD=top-down, BU=bottom-up. Notes: 1/ based on gross premium income; 2/ based on insurance liabilities; 3/ only policies where lapses result in loss; 4/ PML=probable maximum loss.
Country Japan Singapore Netherlands France Belgium
Year (FSSA publication) 2003 2003 2004 2005 2006
1. Scope
Approach BU BU BU BU BU
Coverage 10 life 10 insurers n.a. 26 life, 52 non-life 2 life and 4 bancassurance groups
Relevance of the coverage 86% (life, based on assets)
77% (life), 45% non-life /1 54% (based on assets) 79% (life), 75% (non-life) /2 76%
Reporting Basis n.a. n.a. n.a. solo/consolidated
solo/consolidated
Data Sources public n.a. prudential n.a. prudential
2. Valuation Basis
Assets n.a. n.a. n.a. n.a. n.a.Liabilities n.a. n.a. n.a. n.a. n.a.
3. Scenario Design
Macro-financial linkage/transmission channel(s)
Combination of single (instantaneous) shocks
Combination of single (instantaneous) shocks
Combination of single (instantaneous) shocks
Combination of single (instantaneous) shocks
Combination of single (instantaneous) shocks
Risk horizon single period single period single period single period single period
4. Risk factors
AssetsCredit risk 1.5% credit loss on loan
book-2% and -7% in corporate bond prices (Singapore
and other SE Asian markets); -2% and -3%
rest of the world
credit spreads +30% and +50% for investment grade; +40% and +60% for speculative grade; +25% implied
volatility
— credit spreads +50 bps
Equity risk -20% -10% and -20% (Singapore and other SE Asian
markets); -5% rest of the world
-25% and -40% for developed countries; -30% and -50% for
developing countries and private equity; +25% implied volatility
-30% -30%
FX risk — between -3% and +3% against various currencies
30% and 45% depreciation of the EUR; +25% implied volatility
—
Real estate risk — -10% and -20% (Singapore commercial); -5% rest of
the world
-10% and -20% -30% -20%
Interest rate risk +100 bps parallel shift -60 bps in short-term rates (with unchanged long-term rates); +150 bps in short-
term rates (long-term rates +50 bps)
+/-100 bps parallel shift; +/-200 bps parallel shift; ; +25% implied volatility
+/-100 bps parallel shift; +300 bps parallel shift; steepening of
yield curve; flattening and upward shift of yield curve
+200 bps parallel shift
LiabilitiesLife underwriting
Mortality/morbidity/longevity — — — — —
Lapse/surrender rates — — — — —
Non-life underwritingNatural catastrophe 4/ — — — doubling the claims of a strom
event in 1999yes
Other non-life underwriting shocks
— — — — —
Other risks — receivables (outstanding premiums and agents' balances): -10% and -20%; loans and other
receivables -5% and -10%
50% increase in worst technical result in last 5 years; 50% increase in maximum cost in last 5 years; -
30% and -45% in commodity prices; +25% implied volatility in
commodities
— 50% worsening technical result; 50% increase
operating costs
Risk aggregation/diversification effects
simple summation simple summation; aggregation with correlation of 0.5 between all shocks;
aggregation with correlation of 0 between all shocks
various simple summations of individual single-factor shocks
—
5. Reg. capital standardsloss measured as
percentage of shareholder equity
Minimum solvency margin requirements
Solvency I Solvency I Solvency I
6. Presentation of resultsDispersion measures distribution of losses as a
percentage of shareholder equity
— — min/max impact on solvency ratio; min/max solvency ratios after stress; min/max policy
yields after stress
min/max impact on solvency and operating
profit
Contribution of individual shocks impact of individual shocks on shareholder equity
— impact of individual shocks on solvency ratio
impact of various scenarios which present different
combinations of indivdual single-factor shocks
impact of individual shocks
Other — — — number of companies with solvency ratios after stress
below 100% and recapitalization need as percent of liabilities for these companies; number of
companies with a" policy yield shortfall", and yield shortfall to
liabilities
impact of natural catastrophe shock before
and after reinsurance

74
Table A3. IMF FSAPs: Specification of Insurance Stress Testing (continued)
Source: IMF. Notes: TD=top-down, BU=bottom-up. Notes: 1/ based on gross premium income; 2/ based on insurance liabilities; 3/ only policies where lapses result in loss; 4/ PML=probable maximum loss.
Country Spain Denmark Mexico Switzerland
Year (FSSA publication) 2006 2007 2007 2007
1. Scope
Approach BU BU BU TD BU BU
Coverage 27 insurers 5 largest life n.a. 4 non-life 4 life, 2 non-life, 3 composite
9 life, 12 non-life, 9 health
Relevance of the coverage 62% (life), 50% (non-life) 50% /2 n.a. 48% 1/ 78% (life), 64% (non-life) 1/
n.a.
Reporting Basis solo/consolidated
n.a. n.a. solo/consolidated
solo/consolidated
solo/consolidated
Data Sources prudential n.a. n.a. n.a. n.a. prudential
2. Valuation Basis
Assets market-consistent n.a. n.a. market-consistentLiabilities market-consistent n.a. n.a. market-consistent
3. Scenario Design
Macro-financial linkage/transmission channel(s)
Combination of single (instantaneous) shocks
Combination of single (instantaneous) shocks
Combination of single (instantaneous) shocks
Combination of single (instantaneous) shocks
Risk horizon single period single period single period single period
4. Risk factors
AssetsCredit risk realization of implied PD of
Basel II risk-weights; alternatively credit spread
shock
— — — realization of implied PD of Basel II risk-weights
credit spread (+50 bps)
Equity risk n.a. -30% — — +/-35% -30%
FX risk n.a. +/- 40% — — +/-15% +20% (CHF against EUR, GBP and USD)
Real estate risk -17% -30% — — +/-5% -20%
Interest rate risk +/- 200 bps parallel shift; steepening of the yield
curve; flattening of the yield curve
+250 bps parallel shift; -100 bps parallel shift
-190 bps in domestic interest rates; - 114 bps in foreign
interest rates
— +/- 94 bps parallel shift of
entire yield curve
25 bps (short-term)/75 bp (long-term) lower than the lowest interest rates in the
last economic cycle
LiabilitiesLife underwriting
Mortality/morbidity/longevity mortality (+/- 15%),morbidity (+/- 15%)
— — — mortality (+/- 15%)
n.a.
Lapse/surrender rates +50% — — — +/-50% —
Non-life underwritingNatural catastrophe 4/ — — — earthquake with
a probability of 1-in-250 years
— n.a.
Other non-life underwriting shocks
+10% average cost of claims; +15% higher
frequency of claims > 30,000 EUR
— — — — n.a.
Other risks — — premium shock: zero nominal premium growth;
loss rate increase: life (10%), accidents and health (13%), P&C (20%), auto (5%) and
catastrophe (10%)
— — —
Risk aggregation/diversification effects
— — simple summation (premium shock + interest rate shock; premium shock + loss rates;
premium shock + interest rate shock + loss rates)
combination with BU results (market and life
stress) via correlation
matrix (QIS2 of Solvency II)
— correlation matrix of Swiss Solvency Test
5. Reg. capital standardsSolvency I Solvency I n.a. Swiss Solvency Test (SST)
6. Presentation of resultsDispersion measures min/max impact on insurers'
capital, standard deviation— distributions of solvency ratios
before and after shockboxplots with single data points per anonymized
company (change in risk-bearing capital)
Contribution of individual shocks impact of individual shocks impact of individual shocks on available capital, required capital and
solvency ratio
impact of individual shocks on solvency ratio
impact of individual shocks on solvency ratio (change
in risk-bearing capital)
Other — — capital shortfall as percent of market solvency requirement
—
Solvency II SCR
Portugal
market-consistentmarket-consistent
Combination of single (instantaneous) shocks
2007
single period
anonymized company-by-company data (for the catastrophe
module: absolute gross and net losses, gross and net losses to capital surplus; for the combined BU and TD impact: reduction in
capital surplus)
impact of individual shocks on free surplus
—

75
Table A3. IMF FSAPs: Specification of Insurance Stress Testing (continued)
Source: IMF. Notes: TD=top-down, BU=bottom-up. Notes: 1/ based on gross premium income; 2/ based on insurance liabilities; 3/ only policies where lapses result in loss; 4/ PML=probable maximum loss.
Country Bermuda Isle of Man United States Guernsey Luxembourg
Year (FSSA publication) 2008 2009 2010 2011 2011
1. Scope
Approach BU TD BU BU BU BU BU and TD
Coverage 10 large commercial and long-terms
6 largest life 30 largest life all except pure captives all insurers
Relevance of the coverage n.a. 82% 2/ 68% 1/ n.a. 100%Reporting Basis solo solo/
consolidatedn.a. solo/
consolidatedn.a.
Data Sources prudential prudential prudential/public prudential n.a.
2. Valuation Basis
Assets statutory accounting statutory accounting statutory accounting statutory accounting n.a.Liabilities statutory accounting statutory accounting statutory accounting statutory accounting n.a.
3. Scenario Design
Specification of shocks, macro-financial linkage/transmission
combination of single (instantaneous) factor shocks
combination of single (instantaneous) factor
shocks
combination of single (instantaneous) factor
shocks
combination of single (instantaneous) factor
shocks
combination of single (instantaneous) factor
shocks
Risk horizon single period single period 5 years single period single period
4. Risk factors
AssetsCredit risk yes downgraded by 2-4
notchesn.a. downgraded by 2-4 notches sovereign distress; for non-
life companies: failure of largest depository bank
Equity risk yes -35% n.a. -35% -25%
FX risk +/-20% (GBP) — +/-20% and 30% (GBP) —
Real estate risk — — n.a. -20% -15%
Interest rate risk yes +/- 200 bps parallel shift of entire yield curve
n.a. +/- 200-300 bps parallel shift of entire yield curve
+25% along yield curve
LiabilitiesLife underwriting
Mortality/morbidity/longevity — mortality (+25%), morbidity (+25%),
longevity of annuitants (+25%)
pandemic (equivalent to 100% RBC)
mortality (+25%), morbidity (+25%), longevity of annuitants (+25%)
—
Lapse/surrender rates — — — — — +30% —
Non-life underwritingNatural catastrophe 4/ yes — — — — n.a. deterioration in the claims
situationOther non-life underwriting shocks
— — — — — n.a. n.a.
Other risks — — — — — — —Risk aggregation/diversification effects
simple summation and correlation (diversification
effect)
— — — simple summation simple summation combined equity and interest rate shock via (1)
simple summation, and (2) QIS5 correlations
5. Reg. capital standardsChange in capital and
surplus, minimum regulatory premium ratio, and minimum regulatory loss reserve ratio
RMM(required minimum margin)
RBC Excess assets over liabilities
(net asset value)
Solvency I
6. PresentationDispersion measures — min/max change in
solvency ratio (in percentage points)
— min/max impact on excess of assets over liabilities
number of companies in post-stress solvency
buckets, including the Contribution of individual shocks — impact of individual shocks
on solvency ratio— impact of individual shocks
on excess of assets over liabilities
impact of individual shocks on solvency ratio
Other — — number of companies below 300 percent RBC
number of companies with negative net asset value
—
min/max impact on solvency ratio of individual shocks (in
percentage points)impact of individual shocks on
solvency ratio
—
statutory accounting
+600 bps and -400 bps parallel shift (and +100%
implied volatility)
mortality (+30%)morbidity (+30%)
longevity of annuitants (+30%)
Total capital divided by total assets
-35% (and +100% implied volatility)
+/-50% (and +100% implied volatility)
-50%
credit spreads (+ 50%, except goverments)
South Africa
2008
statutory accounting
combination of single (instantaneous) factor shocks
single period
4 largest life
55% of life/1solo
prudential/public

76
Table A3. IMF FSAPs: Specification of Insurance Stress Testing (continued)
Source: IMF. Notes: TD=top-down, BU=bottom-up. Notes: 1/ based on gross premium income; 2/ based on insurance liabilities; 3/ only policies where lapses result in loss; 4/ PML=probable maximum loss.
Country France Israel Japan Belgium Singapore Canada
Year (FSSA publication) 2012 2012 2012 2013 2013 2014
1. Scope
Approach BU BU BU BU BU BU
Coverage 12 life and unknown number of non-life
all insurers 4 life, 5 non-life 6 largest life 4 largest life 3 largest life
Relevance of the coverage 70% (life) 100% 43% (life), 82% (non-life) 70% 80% 60% 1/
Reporting Basis solo n.a. solo solo/consolidated
solo consolidated
Data Sources n.a. n.a. prudential/public prudential prudentail/public prudential
2. Valuation Basis
Assets n.a. market-consistent market-consistent market-consistentLiabilities n.a. market-consistent market-consistent market-consistent
3. Scenario Design
Specification of shocks, macro-financial linkage/transmission
combination of single (instantaneous) factor
shocks
combination of single (instantaneous) factor
shocks
scenario analysis + single factor shocks
combination of single (instantaneous) factor
shocks
scenario analysis + single factor shocks
scenario analysis + single factor shocks
Risk horizon single period single period 2 years single period 3 years 5 years
4. Risk factors
AssetsCredit risk n.a. credit spread (between
+50 and 200 bps)3% (1.5% for life) credit loss on loan book +80 % of re-insurers' failures
credit spread (between +30bps and +1,260 bps)
credit spread (between +25 bps and +300 bps)
credit spread (increase to a level 3-4 times higher than end-
2012)
Equity risk yes -20 - 30% -20% between -16% and -23.7% between -15% and -30% between -21% and -49% in first year
FX risk — +/-20% — — between +5% and -35% (in first year)
between +10% and +20% appreciation of USD
Real estate risk yes — — — — between -34% and -54% over three years
Interest rate risk yes +/- 20% of the risk-free rate
+ 100 bps parallel shift -61 - 82 bps shift of yields up to +150 bps sharp decline in first year, followed by gradual increase
and steepening in subsequent years
LiabilitiesLife underwriting
Mortality/morbidity/longevity yes — yes(pandemic increasing mortality rate
of 0.13 pcp)
— — —
Lapse/surrender rates yes — — +30% 3/ — +20% in first year
Non-life underwritingNatural catastrophe 4/ n.a. n.a. — largest PML on a single
catastrophe event (1/40 year event)
— —
Other non-life underwriting shocks
n.a. n.a. moderate reinsurance failure — — —
Other risks — — — — — —Risk aggregation/diversification effects
n.a. n.a. simple summation simple summation and correlation matrix similar
to that of Solvency II
simple summation simple summation
5. Reg. capital standardsSolvency I n.a. Solvency Margin Ratio Solvency II SCR/MCR Singapore Risk Based
CapitalMCCSR (minimum continuing
capital and surplus requirement)
6. PresentationDispersion measures min/max impact on
aggregate solvency ratio of individual shocks (in percentage points)
anonymized company-by-company data (change in
capital surplus in percentage points)
— — — —
Contribution of individual shocks impact of individual shocks and shock
absorption mechanisms
impact of individual shocks on value of long-term
savings
separate presentation of the effects of the pandemic shock and the
reinsurance failure
capital impact of individual shocks
— capital impact of individual shocks (for each year of the 5-
year projection horizon)
Other — impact on value of long-term savings
composition of change in solvency margin (net realized gains/losses on securities, unrealized gains/losses on land, contingency reserve, price
fluctuation reserve and others)
pre-stress composition of solvency capital
requirements; post-stress solvency ratios in % of pre-
stress level
number of companies below 100 percent
statutory minimum capital requirements, both for one-
year and three-year horizon
impact on net income (for each year of the 5-year projection
horizon)
statutory accounting with some adjustments of unrealized gain/loss and economic valuation for interest
rate sensitivity
statutory accounting, quasi-Solvency II (QIS-5),
and market-consistent

77
Table A4. Selected National Supervisory Approaches: Specification of Insurance Stress Testing
Sources: BMA, CNB, EIOPA, FINMA, and IMF. Notes: TD=top-down, BU=bottom-up. * Also Switzerland contributes to the EIOPA stress test based on the same specification and scenarios (but applies the Swiss Solvency Test (SST) for capital assessment)); 1/ The credit spread scenario is calibrated annually to historical price changes of rating-specific baskets of credit default swaps (CDS) with maturity terms of three years at a statistical confidence of 99th percentile over an estimation period starting on 1 January 2006; 2/ CTE=conditional tail expectation (which is a more generic term for "Tail VaR" or "Expected Shortfall"); 3/ The sovereign risk shock is considered from a creditor perspective by examining the potential magnitude of both valuation changes and impairment charges of mark-to-market and hold-to-maturity assets. Haircuts are calculated from expected valuation changes of liquid government (benchmark) bonds, assuming an increase of sovereign distress but not a general shift in the yield curve; 4/ In addition, the economic view to the interest rate risk of assets and liabilities is applied.
Country Austria Bermuda Canada Czech Republic Denmark European Union (EIOPA)*
1. Scope
Approach 1/ BU BU BU BU BU BU
Coverage entire sector all large commercial (re)insurers[Classes 4 and 3B]
entire sector (but small insurers as well as term life and unit-linked
insurers can be exempted)
large and middle-sized insurers entire sector major European (re)insurance entities (200 firms)
Relevance of the coverage 100% 100% n.a. 90% of gross premium written 100% 50% of gross premium written
Reporting Basis solo solo/consolidated n.a. solo n.a. consolidated(excl. banking activities)
Frequency semi-annual for life and health insurers, annual for non-life insurers
annual annual annual annual annual
2. Valuation Basis
Assets statutory accounting statutory accounting statutory accounting statutory accounting 4/ statutory accounting statutory accounting
Liabilities statutory accounting statutory accounting statutory accounting statutory accounting 4/(rough estimation of the change in the deficiency
provision in life insurance )
statutory accounting market-based approach of best estimateof liability projected into financial
statements
3. Scenario Design
Source provided by supervisor; prescriptive shocks
provided by supervisor; prescriptive shocks
mostly principles-based with some prescriptive shocks
provided by supervisor; prescriptive shocks provided by supervisor; prescriptive shocks
provided by supervisor; prescriptive shocks
Specification of shocks, macro-financial linkage/transmission
combination of single (instantaneous) factor shocks; no
specification of general macroeconomic conditions
combination of single (instantaneous) factor shocks; no
specification of general macroeconomic conditions
combination of single (instantaneous) factor shocks; no
specification of a baseline scenario; inflation is considered only for P&C
combination of single (instantaneous) factor shocks; contains macro-financial linkages of
insurance and capital market shocks (two adverse scenarios (depression and loss of
confidence))
combination of single (instantaneous) factor shocks;
no specification of general macroeconomic conditions
combination of single (instantaneous) factor shocks; baseline and adverse
scenarios with 0% inflation change anda single inflationary scenario
Risk Horizon single period (stress is assumed to occur at the end of a one-year
horizon)
single period multiple periods(5 years (life), 3 years (non-life))
single period single period single period
Confidence level 2/ n.a. 99.0% Tail-VaR (99.0% CET) n.a. n.a. n.a. n.a.
4. Reg. capital standards
Solvency I Bermuda Solvency Standard (BSCR)
Minimum Continuing Capital and Surplus Requirements (MCCSR)
Solvency I Solvency I Solvency II/Swiss Solvency Test (SST)
5. General comment
contains no macro-financial specifications and amounts to a
sensitivity analysis
high comprehensiveness on technical (underwriting) risks; sensitivity analysis exercises
similar to Solvency II tests
approach relies on dynamic financial analysis (DFA) completed by firms, which use employ DFA techniques
to model the uncertainty of insurance operations (including
scenarios and subsequent responses)
additional features can be incorporated in one-year risk horizon, such as the profit/loss produced during the year, the repeated
occurrence of natural disasters, and planned dividend payments
"traffic-light" system with a yellow and a red scenario;
missing the thresholds of either scenario is directly linked to
heightened supervisory scrutiny; yellow scenario suspended since
Q3 2008
Contains no macro-financial specifications and amounts to a sensitivity analysis; Switzerland
conducted stress tests together with EIOPA based on the same scenarios
(but the Swiss Solvency Test (SST) forcapital assessment)
6. Outputpost-stress effect on solvency ratio
(full impact, full impact net of hidden reserves, full impact net of hidden
reserves and the equalization reserve)
post-stress effect on statutory assets and liabilities
statutory ratio post-stress either positive or above minimum
depending on scenario
post-stress effect on Solvency I ratio and the ability to cover technical provisions with a
sufficient volume of assets; economic view to the interest rate sensitivity of assets and
liabilities
solvency ratio post-stress reduction of own funds and comparisonto MCR

78
Table A4. Selected National Supervisory Approaches: Specification of Insurance Stress Testing (continued)
Sources: BMA, CNB, EIOPA, FINMA, and IMF. Notes: TD=top-down, BU=bottom-up. * Also Switzerland contributes to the EIOPA stress test based on the same specification and scenarios (but applies the Swiss Solvency Test (SST) for capital assessment)); 1/ The credit spread scenario is calibrated annually to historical price changes of rating-specific baskets of credit default swaps (CDS) with maturity terms of three years at a statistical confidence of 99th percentile over an estimation period starting on 1 January 2006; 2/ CTE=conditional tail expectation (which is a more generic term for "Tail VaR" or "Expected Shortfall"); 3/ The sovereign risk shock is considered from a creditor perspective by examining the potential magnitude of both valuation changes and impairment charges of mark-to-market and hold-to-maturity assets. Haircuts are calculated from expected valuation changes of liquid government (benchmark) bonds, assuming an increase of sovereign distress but not a general shift in the yield curve; 4/ In addition, the economic view to the interest rate risk of assets and liabilities is applied.
Country Austria Bermuda Canada Czech Republic Denmark European Union (EIOPA)*
7. Risk factors
AssetsCredit risk yes
(-5% for A- to BBB-;-20% for non-IG bonds)
yes(rating class-specific increase of
credit spreads)
yes yes — yes
Equity risk yes(-20% and -35%)
yes(-40%)
yes(-35%, +15%, -10% and level
thereafter)
yes yes(yellow: -30%,
red: -12%)
yes(up to -15%)
FX risk — yes(up to -20% relative to major
currencies)
— yes n.a. —
Real estate risk yes(-20%)
— — yes yes(yellow: -12%,
red: -8%)
yes(up to 11.6% for residential, up to
25% for commercial)Interest rate risk yes
(bonds -5% and -10%)— 3-month T-bill (-10 bps), long-term (-
170 bps)yes yes
(yellow: +/- 100 bps,red: +/- 70 bps)
yes
Sovereign risk — yes 3/ — yes government bond spread DNK-DEU
yes
Other assets hedge funds -40% — — — — —Liabilities
Life underwritingMortality/morbidity/longevity — yes
(life loss is included in Lloyd’s RDS scenarios for P&C)
yes — — yes(maximum exposure to mortality
and longevity shocks)
Pandemic — yes — — — —
Lapse/surrender rates — — — — — —Reinsurance n.a. — yes — — —Other risk factors — — yes
(expense persistency, cash flow mismatch, and new business
(renewal))
— — —
Non-life underwritingNatural catastrophe yes yes
(Lloyd’s RDS scenarios for P&C/own worst case scenarios)
yes(implicit in internal models
underpinning DFA approach)
yes(frequency and severity of natural
catastrophes)
— yes(maximum exposure to two
specific 1/200 year scenarios (with reinsurance allowed to be included
discounted by 70%); inflation shock to claims reserves))
Reinsurance n.a. — yes — — —
Other risk factors yes(higher frequency of claims in
various lines of business)
yes(terrorism)
yes(frequency, severity, reinsurance, premium volume, misestimating
liabilities, pricing)
yes(premium risk for casco/motor third party liability insurance, shock to net written premiums following a macroeconomic
model)
— —
Other business health insurance (being similar to life insurance): increase in claims
by 7.5%
off-balance sheet items; rating downgrade (up to two notches)
regulatory and political risks off-balance sheet items(look-through approach for market and
credit risk)
— —
Other risk factorsSecond-order effects — — yes
(managerial and regulatory reaction)— — yes
(management actions)
Combination of financial/underwriting scenarios
yes yes yes(implicit in internal models
underpinning DFA approach)
yes — yes
Risk mitigation(reinsurance and hedging)
n.a. yes(completion with and without
hedging assumption)
yes(implicit in internal models
underpinning DFA approach)
yes(completion with existing hedging
assumptions)
n.a. yes(completion with and without
hedging assumption)
Risk aggregation/diversification effects
various aggregations of stresses, generally no diversification effects
limited(approximation of peak exposure based on combined impact from
the three largest underwriting risks)
yes(implicit in internal models
underpinning DFA approach)
aggregation by simple summation, no diversification effects applied.
n.a. limited(only inflation impact on P&C
scenarios)

79
Table A4. Selected National Supervisory Approaches: Specification of Insurance Stress Testing
(continued)
Sources: BaFin, FINMA, IMF, NAIC, and Bank of England (PRA). Notes: TD=top-down, BU=bottom-up. 5/ Number of submission vs. number of supervised solo undertakings in 2013; 6/ annual with obligation to report to supervisor; internally the undertakings are obliged to perform the test quarterly; 7/ In order to avoid explicit procyclical behavior, the equity shock is based on a rules-based system depending on the year-end value of the Euro Stoxx 50. In 2012, the shock was 18% for the equity only scenario; 8/ Only in combination with equity price shock; 9/ Market value reduction of 10% of fixed income instruments according to an assumed interest rate rise (note: for the low interest rate environment, BaFin uses a different approach termed “scenario calculation”); 10/ only in combined scenarios, with credit risk calculated (shocked) in every scenario.
CountryGermany Guernsey Japan Singapore Switzerland
United Kingdom(PRA)
United States(NAIC)
1. Scope
Approach 1/ BU/TD BU BU BU BU BU BU
Coverage most insurance firms (but small insurers may be exempted)
6 life with liabilities > GBP 50 mln and 22 non life firms with gross premium earned > GBP 15 mln;
cell companies are included.
All insurers, re-insurers and branches
all insurers all insurers under supervision major life insurers all life and health (re)insurers
Relevance of the coverage 88% 5/ unspecified 100% 100% 100% n.a. 100%
Reporting Basis solo n.a. n.a. solo/consolidated solo/consolidated/granular solo/consolidated solo (legal entity)
Frequency annual (TD), quarterly (BU) 6/ ad hoc n.a. annual annual/semiannual annual annual
2. Valuation Basis
Assets statutory accounting statutory accounting Not specified statutory accounting market-consistent statutory accounting statutory accounting
Liabilities statutory accounting statutory accounting Not specified statutory accounting market-consistent statutory accounting statutory accounting
3. Scenario Design
Source provided by supervisor; prescriptive shocks
provided by supervisor; prescriptive shocks
general guidelines but principle-based approach; historical and hypothetical
shocks/scenarios
general guidelines but principle-based approach
provided by supervisor; prescriptive shocks, plus company-specific scenarios defined by insurance
companies
provided by supervisor; prescriptive (standardized)
shocks
deterministic scenarios prescribed by regulator; stochastic scenarios
generated by prescribed scenario generator
Macro-financial linkage/transmission channel(s)
combination of single (instantaneous) factor shocks
combination of single (instantaneous) factor shocks
combination of single (instantaneous) factor shocks
combination of single (instantaneous) factor shocks
combination of (instantaneous) multiple factor shocks
combination of (instantaneous) multiple factor shocks
combination of single (instantaneous) factor shocks (interest rates/market
returns)
Risk Horizon single period single period not specified single period and multiple period (3 years)
single period single period over lifetime of liabilities
Confidence level 2/ n.a. n.a. n.a. n.a. Probability in between 0.1% and 1% for prescriptive scenarios
n.a. 70% CET for reserves and 90% CET for capital
4. Reg. capital standards
German Solvency I Minimum Capital Requirement of licensed insurers
Solvency Margin Ratio Singapore Risk Based Capital Swiss Solvency Test (SST) Individual Capital Adequacy Standards (ICAS)
Risk-based Capital (RBC)
5. General comment
Contains no macro-financial specifications (other than market risk shocks) and amounts to a
sensitivity analysis.
Simple model with selected single factor shocks.
Publicly available information limited to stress testing;
approach is heavily reliant on firm-generated stress
scenarios.
Publicly available information limited to stress testing for life insurers; approach is heavily reliant on internal models and
firm-generated stress scenarios.
High comprehensiveness on technical (underwriting) risks.*
Aimed to evaluate the resilience of major life insurance groups to market stresses of progressive severity in order to understand the nature of the market risks which the groups are exposed
to
Stress testing is done as test on the adequacy of statutory formula
reserves; at start of projection, it is assumed that assets equal liabilities (e.g., surplus is zero); metric is the
present value of surplus at end of the projection period.
6. OutputAsset coverage ratio over liabilites Margin of solvency has to be
higher than the minimum margin of solvency
n.a. Risk based capital ration post-stress
Aggregation of several scenarios to the capital requirement (target
capital)
Post-stress impacts If reserves are adequate surplus is positive at end of projection. If surplus
is negative additional reserve has to be established

80
Table A4. Selected National Supervisory Approaches: Specification of Insurance Stress Testing
(continued)
Sources: BaFin, FINMA, IMF, NAIC, and Bank of England (PRA). Notes: TD=top-down, BU=bottom-up. 5/ Number of submission vs. number of supervised solo undertakings in 2013; 6/ annual with obligation to report to supervisor; internally the undertakings are obliged to perform the test quarterly; 7/ In order to avoid explicit procyclical behavior, the equity shock is based on a rules-based system depending on the year-end value of the Euro Stoxx 50. In 2012, the shock was 18% for the “equity only” scenario; 8/ Only in combination with equity price shock; 9/ Market value reduction of 10% of fixed income instruments according to an assumed interest rate rise. For the low interest rate environment, BaFin uses a different approach termed “scenario calculation”; 10/ only in combined scenarios, with credit risk calculated (shocked) in every scenario; 10/ all risk factors are considered within firm-specific scenarios according to supervisory guidelines; 11/ firm-specific scenarios over a three-year risk horizon according to supervisory guidelines.
CountryGermany Guernsey Japan Singapore Switzerland
United Kingdom(PRA)
United States(NAIC)
7. Risk factors
Macro scenario no specifiation of general macroeconomic conditions
Two scenarios, baseline and adverse for the downward
movement of interest rates and rate of inflation affecting non-life
claims volumes.
included, but no consistent specification of general
macroeconomic conditions across firms
no specification of general macroeconomic conditions
no specifiation of general macroeconomic conditions
no specification, but scenarios combining substantial equity,
property, credit and yield shifts.
no specifiation of general macroeconomic conditions
AssetsCredit risk yes — just credit spreads yes
(+ spread for "A"-rated corporate bonds)
yes(rating class-specific increase of credit
spreads)
Equity risk yes 7/ yes yes yes (-%) yes(stochastic)
FX risk — yes yes — yes
Real estate risk yes(-10%) 8/
yes yes yes yes
Interest rate risk yes 9/ yes yes yes yes(deterministic & stochastic)
Sovereign risk — yes(overlaps with interest rate
scenarios)
— — yes (credit spreads only) — —
Other assets — — — yes
Liabilities
Life underwritingMortality/morbidity/longevity — yes yes — yes
(sensitivity tested)
Pandemic — yes yes — —
Lapse/surrender rates — — yes — yes(sensitivity tested)
Reinsurance — — yes — —Other risk factors yes
(bond and equity test: decline in the price of equities and 5% decline in
the price of fixed-income securities; equity and property test: decline in
the price of equities and 10% decline in the market value of
properties)
yes(expense persistency)
yes — expenses & other policyholder behavior
Non-life underwriting — n.s.Natural catastrophe — yes
(with and without reinsurance default)
— — n.s.
Reinsurance — yes yes — n.s.
Other risk factors — yes(claims inflation)
yes — n.s.
Other business — — — — yes — n.s.
Other risk factorsSecond-order effects — — — yes
(management actions)yes
(management actions)yes
(managerial and regulatory action)
n.s.
Combination of financial/underwriting scenarios
— — yes(firm-specific scenarios)
yes(firm-specific scenarios)
yes — n.s.
Risk mitigation(reinsurance and hedging)
yes(only financial risks)
yes(only reinsurance)
yes(firm-specific scenarios)
yes(firm-specific scenarios)
yes(for insurance risk computed gross
and / or net of reinsurance)
— yes
Risk aggregation/diversification effects
yes(only financial risks) 10/
— — — risk factors are shocked simultaneously
— yes
yes(firm-specific scenarios
according to supervisory guidelines)
yes(firm-specific scenarios over a
one-year risk horizon according to supervisory
guidelines)
yes(firm-specific scenarios
according to supervisory guidelines)
yes(firm-specific scenarios over a
three-year risk horizon according to supervisory
guidelines)
yes(firm-specific scenarios
according to supervisory guidelines)
yes(firm-specific scenarios over a
three-year risk horizon according to supervisory
guidelines)

81
APPENDIX II―ADDITIONAL BACKGROUND
Box 8. National and IMF Stress Testing for Non-life (Re) insurance—A Case Study of
Bermuda
Bermuda is host to the third largest (re)insurance market in the world, with globally active commercial underwriters focused on property and casualty risks. The supervisory stress testing framework is an important component of the solvency regime for these firms. All large firms are required to perform an annual stress test as specified by the Bermuda Monetary Authority (BMA) and submit the results with their Capital and Solvency Return.
The stress testing exercise aims at assessing the capital adequacy of the legal entities and groups by evaluating the impact of risk drivers conditional on plausible scenarios defined by firm- and system-wide changes. It is designed to provide a comprehensive understanding of the general loss absorbing capacity of firms in relation to the economic impact of shocks to asset prices and interest rates as well as projected losses arising from specific underwriting risks on the insurer’s/group’s statutory balance sheet (i.e., statutory admitted assets, admitted liabilities, and capital and surplus). The BMA requires stress testing to be conducted at the firm level, either as part of firms’ internal models or through the use of prescriptive shocks to risk factors in accordance with uniform guidelines and assumptions. It is based on either internal model-derived or pre-defined scenarios affecting both the single entity and group-wide annual solvency return.1
The annual stress testing exercise examines the impact of a rapid deterioration of both investment and underwriting performance over a wide range of risk factors. The objective of the various scenarios is to assess the expected impact and effects of adverse events on a (re)insurer’s statutory assets and liabilities. The post-stress/-scenario positions reported are those that would be observed immediately upon the occurrence of the event as determined by the firm’s internal or vendor model(s) (both with and without the effect of reinsurance and/or other loss mitigation instruments):
Economic scenarios (financial risk)—asset risks include several capital market-related single factor shocks triggered by an adverse global macroeconomic scenario: (i) a severe decline in equity prices of 40 percent without allowance for diversification across the markets (i.e., assume that all markets are correlated and only long (asset) positions are affected), (ii) a widening of credit spreads,2 (iii) negative shocks to asset and net open foreign currency positions (i.e., assuming a depreciation of the U.S. dollar vs. major reserve currencies),3 and (iv) valuation haircuts on fixed income holdings (and long derivative positions) of sovereign debt and financial bonds (debt securities and loans), including a general upward shift in the yield curve of 50 basis points.4

82
Underwriting scenarios (insurance risk)—multiple underwriting risks affecting aggregates in-force at the beginning of the reporting period are examined based on (i) prescribed property and casualty events in different scenario groupings (U.S. windstorm, U.S. earthquake, Non-U.S. windstorm, and Non-U.S. earthquake, aerospace/aviation, and marine) as specified in Lloyd’s Handbook on Realistic Disaster Scenarios, (ii) non-peak perils, which do not currently exist in vendor models (U.S. oil spill, U.S. tornadoes, Australian flooding, and Australian wildfires), (iii) additional insurance risks (pandemic, terrorism), (iv) other underwriting scenarios (if the prescribed perils either do not apply or partially apply to the insurer/ group resulting in de minimis loss projections), (v) projections from the worst-case annual aggregate catastrophe loss scenario, which combines economic and underwriting loss scenarios generating the largest losses and a series of loss simulations relating to extreme tail events,5 as well as (vi) a qualitative assessment of a rating downgrade by two notches (or falling below a “A-” rating, whichever is more severe) on income and liquidity positions.6 All lines of business and exposures are included in the final estimates of the loss impact net of protection, such as reinsurance, retrocessional agreements, or insurance-linked securities.
The reporting firms submit a description of all key assumptions and calculations utilized to arrive at final results as well as the post- stress/scenario positions on aggregate statutory assets and liabilities that would be observed immediately upon the occurrence of the event (both with and without the effect of reinsurance and/or other loss mitigation instruments). The results also comprise both the occurrence return period (e.g., 1-in-50 year event) and the relative return period (i.e., using the underlying loss distribution of the aggregate net probable maximum loss to calculate the corresponding return period (e.g., 1-in-50 year event)) of each event.
In 2007, the IMF completed a BU system-wide solvency stress test of ten large commercial (re)insurance and long-term insurance companies as part of its Offshore Financial Center Assessment Program (IMF, 2008b). The companies employed a combination of their respective internal and vendor models to calculate the capital impact of a variety of underwriting scenarios (three natural catastrophe events, two pandemic events, and worst-case scenarios of aggregate net probable maximum loss as specified by each insurer). The impact of these scenario was assessed against statutory reporting requirements at the time (i.e., change in capital and surplus, minimum regulatory premium ratio, and minimum regulatory loss reserve ratio). The results of the stress test exercise suggested that catastrophic events would have had a significantly negative impact on aggregate capital, with the most severe impact resulting from the worst-case scenarios, only two of which included economic events (in addition to natural catastrophes). Scenarios combining catastrophic events and an economic recession had the greatest impact on the solvency positions of firms on average. No firm failed to meet applicable regulatory capital requirements under any of the scenarios; however, the exercise only covered a subset of risk factors considered

83
necessary to attain a comprehensive assessment of the risk profile of firms under stress.7
The dynamics of Bermuda’s insurance industry in response to internal and external factors require a constant re-assessment of stress testing practices. After extending the stress testing framework to other classes of insurers (i.e., smaller commercial (re)insurers (Class 3A) and long-term business), future enhancements include the capacity of the BMA to execute system-wide industry-level stress testing on a regular basis and an expanded treatment of catastrophe risk scenarios based on more granular data. ________________________ 1 The stress test of underwriting performance allows firms to also consider own worst case scenarios as a substitute for the prescriptive scenarios. In this regard, the BMA encourages firms to apply internal stress testing approaches that utilize in-house expertise in risk management and the data/models to facilitate the management of important risk drivers according to their own risk appetite and risk profile.
2 In the exercise for the current reporting year (BMA, 2013a and 2013b), credit spreads widen across different rating classes (between 163 basis points for “AAA”-rated securities to 3,188 basis points for securities rated “BB” or lower). The adverse scenario (“through-the-cycle”) is calibrated to historical price changes of rating-specific baskets of benchmark CDS with three-year maturity at a statistical confidence of 99th percentile.
3 The magnitude of negative shock is determined based on four times the difference between the maximum implied annualized volatility of each currency (Euro, Japanese yen, Pound sterling, Swiss franc, and Australian dollar with the U.S. dollar as reference currency) between 1 Jan. 2008 and end-2011 and the long-term average since 1 Jan. 2005.
4 The sovereign risk shock comprises valuation changes and impairment charges in economic terms and are applied to all net exposures (i.e., gross exposures net of cash (short) positions (without derivative hedges such as CDS), including both on- and off-balance sheet assets and claims irrespective of accounting treatment (mark-to-market, available for sale, and hold-to-maturity). These haircuts have been calculated from expected valuation changes of liquid government (benchmark) based on changes in sovereign risk implied by the 99th percentile of the historical density of one-/three-/five-/seven- and ten-year forward contracts on CDS with maturity terms between one and ten years using the methodology by Jobst and others (forthcoming).
5 More specifically, each firm is to submit the results of the aggregate impact of (i) a combination of a financial market scenario (assuming only a severe decline in equity prices and a widening of credit spreads) and an aggregation of the three largest net underwriting losses, and (ii) either a series of loss simulations or results of other analysis performed related to extreme tail events or an firm-specific worst-case annual aggregate loss scenario at a level considered extreme but plausible by the firm.
6 The disclosure should cover and provide an indication of the relative impact/severity of collateral requirements, loss payment triggers on in-force policy contracts, claw-backs, and/or other adverse financial and liquidity implications of the downgrade. 7 The incomplete coverage of financial market effects and use of accounting data rather than economic valuation were identified as shortcomings of the supervisory stress testing framework, which were remedied in the first stress testing guidance as part of the newly established risk-based solvency regime (BSCR), which the BMA introduced in 2010. In particular, the sensitivity of some firms to the combination of effects from several extreme financial and underwriting events motivated the introduction of the worst-case annual aggregate catastrophe loss scenario in the stress testing framework.