Consider some of the Best Black Friday Offers On the internet
Macroprudential Bulletin Issue 3
June 2017
Macroprudential Bulletin, Issue 3, June 2017 2
Contents Foreword
Chapter 1 – Topical issue ECB floor methodology for setting the capital buffer for an identified Other Systemically Important Institution (O-SII)
CRD IV specifies that O-SIIs may be required to maintain additional buffer requirements between 0% and 2% of risk-weighted assets as part of the combined buffer requirements. To inform the calibration of these additional buffer requirements, the ECB O-SII methodology allocates O-SIIs into one of four categories of systemic importance (“buckets”), whereby each bucket is associated with a specific O-SII buffer rate that should be considered as a floor. The floor methodology forms part of the analysis which the ECB conducts when assessing O-SII buffer rates implemented by national authorities in countries under ECB Banking Supervision and has been used for benchmarking O-SII buffer rates from June 2016 onward.
Chapter 2 – Macroprudential policy analysis and tools Stress test quality assurance from a top-down perspective
Stress tests have become an important tool for both microprudential and macroprudential purposes. This article describes how the stress test quality assurance process at the ECB benefited from using part of a top-down model toolkit developed for macroprudential purposes (STAMP€). The article concludes that top-down benchmarks are a useful component of the quality assurance stress test process, as they help ensure a level-playing field by providing a model-based view which is forward-looking and scenario-specific.
Chapter 3 – Macroprudential regulatory issues Exposure of the European Deposit Insurance Scheme (EDIS) to bank failures and the benefits of risk-based contributions
The EDIS proposed in November 2015 by the European Commission is the third, necessary pillar of the banking union. This chapter offers some quantitative analysis on EDIS capacity and deposit insurance risk-based contributions. The results indicate that a fully-funded European Deposit Insurance Fund (DIF) would be sufficient to cover pay-outs in a non-systemic crisis, which is by design a goal of a deposit insurance scheme. However, other safety net tools are necessary to deal with systemic crises. There would also be no unwarranted systematic cross-subsidisation within EDIS in the sense of some banking systems systematically contributing less than they would benefit from the Fund.
Annex – Macroprudential policy measures at country level
Glossary
Macroprudential Bulletin, Issue 3, June 2017 3
Foreword
The biannual ECB Macroprudential Bulletin aims to increase awareness of and enhance transparency regarding the ECB’s macroprudential policy work. With this intention in mind, the third issue of the Macroprudential Bulletin provides insights into the ECB’s macroprudential tools and its thinking on macroprudential issues.
The first chapter describes the ECB floor methodology for setting the O-SII capital buffer that each identified O-SII is required to maintain. The ECB O-SII methodology provides input to national authorities for their assessment of the level of O-SII buffers, informs them about possible outliers relative to their peers within the Single Supervisory Mechanism (SSM) and fosters a discussion of the possible need for corrective policy actions. Following the implementation of the ECB methodology in June 2016, every notification from countries under ECB Banking Supervision regarding an O-SII buffer was benchmarked against the ECB floor methodology.
Chapter 2 of this Macroprudential Bulletin describes quality assurance as part of the 2016 Stress Test Exercise. Stress testing has recently gained importance as a tool for both microprudential and macroprudential purposes. This chapter focuses on the quality assurance process from a top-down perspective using part of a model toolkit developed for macroprudential purposes (STAMP€). Top-down models could be a useful component of the quality assurance stress test process, as they help ensure a level-playing field and a sufficient degree of rigour by providing model-based benchmarks.
The last chapter develops some quantitative analysis regarding the EDIS, the third pillar of the Banking Union. First, it quantifies the exposure of a fully mutualised EDIS to bank failures, examining how the European deposit insurance fund, with a target size of 0.8% of covered deposits of participating banking systems, would be affected under different stress and bail-in scenarios. Second, the chapter provides a quantitative analysis of how the calibration of risk-based contributions affects the distribution of contributions across countries. Third, the analysis verifies the possible existence of cross-subsidies between banking sectors in different Member States.
As in previous issues, this Macroprudential Bulletin ends with an overview of recent announcements relating to macroprudential instruments in the euro area. However, the overview tables showing all macroprudential measures at a glance are now provided on the ECB website, where they will be updated on a quarterly basis.
Finally, if you are interested in being notified of the latest publication of the Macroprudential Bulletin, please send us an email at [email protected].
Vítor Constâncio Vice-President of the European Central Bank
ECB Vice-President Vítor Constâncio
Macroprudential Bulletin, Issue 3, June 2017 4
Chapter 1 – Topical issue – ECB floor methodology for setting the capital buffer for an identified Other Systemically Important Institution (O-SII)1
This chapter describes the ECB floor methodology for setting the O-SII capital buffer that each identified O-SII is required to maintain. This methodology forms part of the analysis which the ECB conducts when assessing the O-SII buffers set by national authorities in the SSM area. The ECB O-SII floor methodology is based on banks’ systemic importance score and allocates each bank to one of four categories of systemic importance (“buckets”), whereby each bucket is associated with a specific O-SII buffer rate that should be considered as a floor. This floor buffer rate forms the basis of a discussion between the ECB and national authorities on the overall assessment of an O-SII buffer, taking into account the information provided by national authorities and national specificities. At the same time, the ECB O-SII methodology provides input to national authorities, informs them about possible outliers relative to their peers within the SSM and fosters a discussion of the possible need for corrective policy actions.
The ECB floor methodology for setting the O-SII capital buffer builds on the following principles and assumptions:
• The framework provides a floor to O-SII capital buffers set by National Designated Authorities (NDA).
• A bucketing approach rather than a continuous function approach is adopted to ensure the simplicity and robustness of the framework.
• Banks are allocated to buckets based on scores computed on the basis of the European Banking Authority’s (EBA) O-SII identification framework. A total of four buckets with buffer increments of 25 basis points avoids excessive variability and minimises cliff effects.
• The calibration of the buffer for the first bucket is non-zero in order to account for the externalities which an O-SII could exert on the domestic economy in the case of failure or distress.
Following the implementation of the ECB methodology in June 2016, every notification from countries under ECB Banking Supervision of an O-SII buffer was benchmarked against the ECB O-SII methodology.
1 Prepared by Behn, M., Cappelletti, G., Kaltwasser, P., Kolb, M., Pawlikowski, A., Tracol, K., Salleo, C.,
and van der Kraaij, A.
Macroprudential Bulletin, Issue 3, June 2017 5
1 Introduction
In October 2012 the Basel Committee on Bank Supervision (BCBS) published its framework for dealing with domestic systemically important banks (D-SIB). The Basel framework proposes to apply additional buffer requirements to such institutions – thus strengthening their capacity to absorb losses – in order to account for the externalities which they could exert on the domestic economy in the case of failure or distress.2
The EU implemented the Basel D-SIB framework in Capital Requirements Directive 2013/36/EU (CRD IV), referring to “other systemically important institutions (O-SIIs)” which are of systemic importance for “the economy of the Union or the relevant Member State”. Hence, the identification of O-SIIs takes a more narrow perspective compared with the identification of global systemically important institutions (G-SIIs) whose systemic importance is assessed at the global level.
O-SIIs may be required to maintain additional buffer requirements from 0% to 2% of risk-weighted assets (RWA) as part of the combined buffer requirements. This requirement must be met through Common Equity Tier 1 (CET1) capital in addition to minimum Pillar 1 and Pillar 2 requirements.
This chapter describes the ECB floor methodology for setting the O-SII capital buffer for each O-SII identified in the SSM, and is structured as follows. First, we provide a short description of the O-SII buffer framework and the role of the ECB. Second, we present the principles and assumptions underlying the ECB floor methodology, including the four categories of systemic importance, their O-SII buffer calibration and phase-in period. We conclude with the results of the 2016 annual review of O-SII buffers.
2 Macroprudential tasks within the SSM and the role of the ECB
CRD IV entrusts national authorities with the task of applying additional capital buffer requirements to O-SIIs. As with other measures enshrined in European legislation, the ECB can subsequently “top up” these buffer requirements. That is to say, the ECB can decide to impose stricter requirements but cannot scale down the O-SII buffer requirements already implemented by national authorities under Article 5 of the SSM Regulation.3
In compliance with the provisions laid down in Article 131 of the CRD IV, national authorities in the EU undertake an annual assessment of O-SII buffer requirements for systemically important institutions operating within their jurisdictions. Before
2 See Basel Committee on Bank Supervision (2012), A framework for dealing with domestic systemically
important banks, Bank for International Settlements, October 2012. 3 Council Regulation (EU) No 1024/2013 of 15 October 2013 conferring specific tasks on the European
Central Bank concerning policies relating to the prudential supervision of credit institutions (OJ L 287, 29.10.2013, p. 63).
Macroprudential Bulletin, Issue 3, June 2017 6
taking a final decision implementing the outcome of this annual assessment process, national authorities notify the ECB and – if the ECB objects to the planned decision – duly consider the ECB’s reasons prior to proceeding. A similar requirement applies to the ECB, which is required to notify its intentions to national authorities if it wants to “top-up” macroprudential measures.4
The annual O-SII buffer assessment process comprises two main steps: first, identifying the O-SIIs within each jurisdiction and, second, assigning bank-specific O-SII buffer requirements to the institutions identified in the first step. For the identification of O-SIIs, national authorities have followed the EBA Guidelines on criteria for the assessment of O-SIIs5, which specify a methodology based on a systemic importance score (summarising the institution’s size, importance, complexity/cross-border activity, and interconnectedness). The EBA Guidelines are, however, silent with respect to the assignment of buffer rates to identified O-SIIs, and consequently the approaches used to calibrate O-SII buffers differ across jurisdictions. In particular, the measures adopted by Member States vary in a number of aspects relating to their design (buffer calibration, phase-in arrangements) and execution (including the timing of the decision-making).
The ECB, in line with its macroprudential mandate and responsibilities, analyses the proposed O-SIIs buffers to ensure that relevant systemic or macroprudential risks are addressed in a consistent manner within and across the SSM Member States. To this end, the ECB – in collaboration with national authorities – has developed a common methodology to set a floor for the O-SII capital buffers of systemically important institutions in the SSM area.
3 A methodology for assessing O-SII buffer calibrations
3.1 Assumptions underlying the ECB O-SII floor methodology
The ECB floor methodology for setting O-SII buffer requirements is based on the following principles and assumptions:
The methodology provides a floor for the O-SII buffers set by NDAs. This floor buffer rate forms the basis of a discussion between the ECB and national authorities on the overall assessment of an O-SII buffer, taking into account the information provided by national authorities and national specificities. At the same time, the ECB O-SII methodology provides input to national authorities, informs them about possible outliers relative to their peers within the SSM and fosters a discussion of the possible need for corrective policy actions.
4 The reciprocal notification requirements between national authorities and the ECB are regulated in
Article 5 of the SSM Regulation. 5 Guidelines on the criteria to determine the conditions of application of Article 131(3) of Directive
2013/36/EU (CRD) in relation to the assessment of other systemically important institutions (O-SIIs). EBA/GL/2014/10, 16 December 2014.
Macroprudential Bulletin, Issue 3, June 2017 7
The methodology relies on different categories of systemic importance – a bucketing approach – rather than a continuous function approach. Such a bucketing approach ensures simplicity and robustness and is similar to the bucketing approach used by the BCBS for the G-SIB framework. A total of four buckets with buffer increments set at 25 basis points avoids excessive variability and minimises cliff effects. The calibration of the buffer for the first bucket is non-zero, in order to account for the externalities which an O-SII could exert on the domestic economy in case of failure or distress.
The scores used to allocate banks to the four buckets are based on the scores computed in accordance with the EBA O-SII identification framework. Using the EBA O-SII scoring methodology allows for a harmonised approach to measures of systemic relevance across the SSM and the EU as a whole.
The designation of global systemically important institutions (G-SII) and the corresponding setting of G-SII buffer requirements are done independently of the setting of O-SII buffer requirements. In the case of banks subject to both a G-SII and an O-SII buffer, the higher of the two applies. The O-SII buffer is therefore not capped by the G-SII buffer as the reference for systemic relevance for the latter is the global financial system and not the financial system of the EU or the Member State.
3.2 Sorting banks into categories of systemic importance
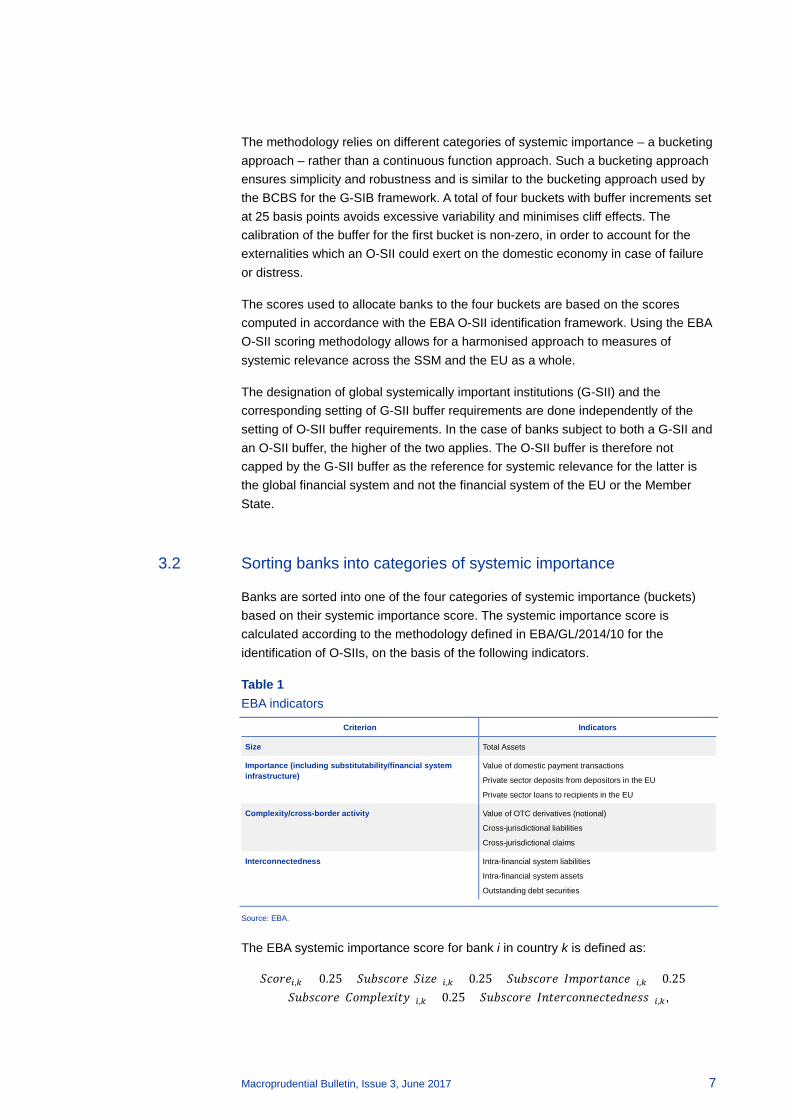
Banks are sorted into one of the four categories of systemic importance (buckets) based on their systemic importance score. The systemic importance score is calculated according to the methodology defined in EBA/GL/2014/10 for the identification of O-SIIs, on the basis of the following indicators.
Table 1 EBA indicators
Criterion Indicators
Size Total Assets
Importance (including substitutability/financial system infrastructure)
Value of domestic payment transactions
Private sector deposits from depositors in the EU
Private sector loans to recipients in the EU
Complexity/cross-border activity Value of OTC derivatives (notional)
Cross-jurisdictional liabilities
Cross-jurisdictional claims
Interconnectedness Intra-financial system liabilities
Intra-financial system assets
Outstanding debt securities
Source: EBA.
The EBA systemic importance score for bank i in country k is defined as:
𝑆𝑆𝑆𝑆𝑆𝑖,𝑘 = 0.25 × 𝑆𝑆𝑆𝑆𝑆𝑆𝑆𝑆(𝑆𝑆𝑆𝑆)𝑖,𝑘 + 0.25 × 𝑆𝑆𝑆𝑆𝑆𝑆𝑆𝑆(𝐼𝐼𝐼𝑆𝑆𝐼𝐼𝐼𝑆𝑆)𝑖,𝑘 + 0.25 ×𝑆𝑆𝑆𝑆𝑆𝑆𝑆𝑆(𝐶𝑆𝐼𝐼𝐶𝑆𝐶𝑆𝐼𝐶)𝑖,𝑘 + 0.25 × 𝑆𝑆𝑆𝑆𝑆𝑆𝑆𝑆(𝐼𝐼𝐼𝑆𝑆𝑆𝑆𝐼𝐼𝑆𝑆𝐼𝑆𝐼𝐼𝑆𝑆𝑆)𝑖,𝑘,
Macroprudential Bulletin, Issue 3, June 2017 8
where the subscores for each category are the simple average of the indicator scores in the category. Indicator scores are calculated by dividing the indicator value of each institution by the aggregate total of the respective indicator values of all institutions in the Member State. Hence, the EBA systemic importance score measures the systemic importance of individual institutions relative to the other institutions in the relevant jurisdiction.
Since the EBA Guidelines address only the identification of O-SIIs, and not buffer calibration or bucketing structures, a methodology is required to group the identified O-SIIs into the four buckets associated with different buffer rates. The ECB O-SII methodology relies on a cluster analysis to define the bucket thresholds. The cluster analysis is run on the subset of banks with an overall systemic importance score higher than 350 bps, which is the predetermined threshold defined by the EBA Guidelines.6 To ensure the robustness of the clustering with respect to underlying assumptions and different specifications, alternative clustering methodologies are employed in the grouping of institutions. In particular, the k-means method aims to partition the points into four groups such that the sum of squares from points to the assigned cluster centres is minimised. Hierarchical clustering assigns each object to its own cluster and then proceeds iteratively, at each stage joining the two most similar clusters, and continues until there is just a single cluster. The Jenks natural breaks classification method seeks to reduce variance within clusters and maximise variance between clusters, while the Fisher’s natural breaks classification improves on the Jenks algorithm to minimise variability within clusters. All of the different clustering methodologies assume four buckets, in line with the general principles and assumptions underlying the ECB framework.
Table 2 ECB bucketing and floor methodology for O-SIIs
Bucket Score range Floor for O-SII buffer
4 ≥ 2,900 1.00%
3 1,950-2,900 0.75%
2 1,250-1,950 0.50%
1 up to 1,250 0.25%
Notes: Scores equal to one of the boundaries are assigned to the higher bucket. Identified O-SIIs should have a strictly (fully phased-in) positive O-SII buffer Source: ECB.
The cluster analysis suggests that banks can be sorted into the four buckets according to the following thresholds for their systemic importance scores: 1250 bps, 1950 bps and 2900 bps (see Table 2). The thresholds for the four buckets were calibrated by making use of the various clustering methodologies discussed above, supplemented by expert judgement and robustness checks. A prudent and conservative approach will be used for a possible migration of banks between buckets (i.e. banks moving from a higher bucket to a lower bucket or vice-versa). For example, banks would only move to a lower bucket when the decrease in their score
6 Most countries used the standard threshold of 350 bps. Austria, Ireland used a lower threshold (275
bps) while Latvia and Slovakia used a higher threshold (425 bps) due to specific characteristics of the banking system.
Macroprudential Bulletin, Issue 3, June 2017 9
represents a structural and longer-term decrease in their systemic footprint. Such a prudent approach in combination with the use of clearly defined thresholds also mitigates excessive variability.
3.3 Calibration of the buffer floors in each bucket
To calibrate floors for the O-SII buffers of individual banks, each of the four buckets identified in the previous subsection must be associated with a specific buffer rate. The ECB O-SII framework specifies the following buffer rates for the four buckets: 0.25%, 0.50%, 0.75% and 1%. Since the methodology establishes a floor, the O-SII buffer for each bank in a particular bucket must be equal to or greater than the buffer rate associated with each bucket. This implies that institutions that have been identified as O-SIIs cannot have an O-SII buffer requirement of 0%. Consistent with its aim of implementing a floor, the methodology does not cover the whole range of O-SII buffer rates allowed by CRD IV (0%-to 2% of RWA). As such, the current calibration also aims to leave sufficient flexibility for national authorities to discuss and potentially take into account national specificities.
The ECB O-SII methodology and its resulting bank-specific O-SII buffers should be fully implemented by 1 January 2022 at the latest. This ultimate date for full implementation does not preclude national authorities from fully implementing the O-SII buffer earlier or with a shorter phase-in period.
The ECB framework will be reviewed every three years, beginning on 1 January 2019. Choosing a three-year review period instead of an annual review allows the ECB to take into account lessons learnt while ensuring the consistency and clarity of the scoring and bucketing methodology over the medium term.
4 Results of the 2016 annual review of O-SII buffers
The ECB O-SII framework was adopted in June 2016. Since then, it has become an essential part of the ECB’s analysis of the macroprudential measures implemented by national authorities. All of the O-SII capital buffer requirements implemented by national authorities have been established in line with the ECB floor methodology. Moreover, all identified O-SIIs will have a strictly positive capital buffer rate as of 2022, in line with the phase-in arrangements.
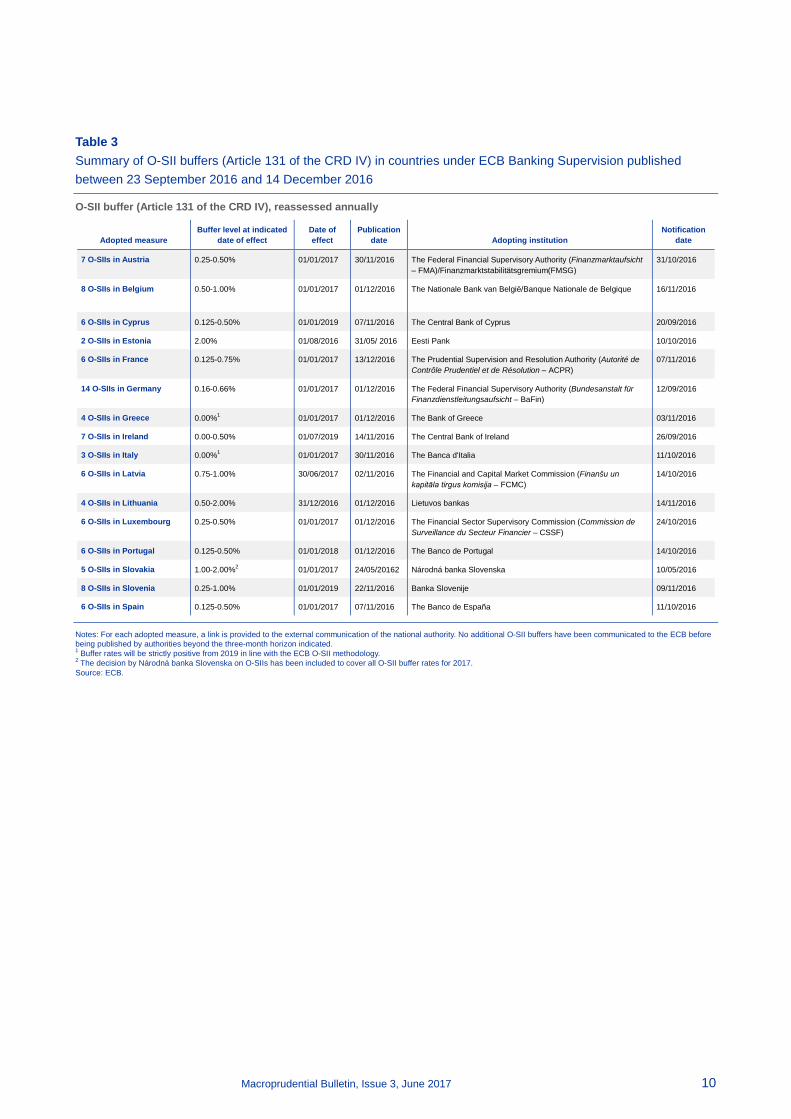
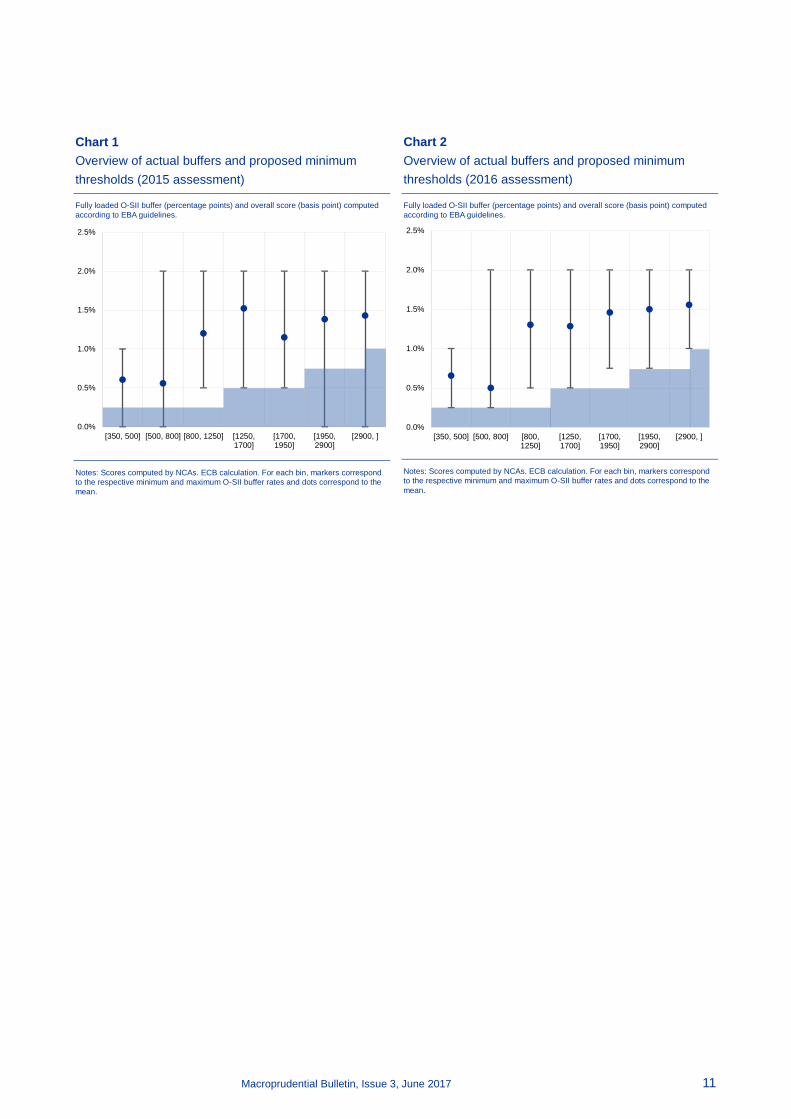
Table 3 provides a summary of measures taken by competent or designated authorities in countries under ECB Banking Supervision. In line with its intention, the adoption of the framework led to a reduction in the heterogeneity of O-SII buffer requirements in SSM countries in 2016 relative to the previous year (see Charts 1 and 2).
Macroprudential Bulletin, Issue 3, June 2017 10
Table 3 Summary of O-SII buffers (Article 131 of the CRD IV) in countries under ECB Banking Supervision published between 23 September 2016 and 14 December 2016
O-SII buffer (Article 131 of the CRD IV), reassessed annually
Notes: For each adopted measure, a link is provided to the external communication of the national authority. No additional O-SII buffers have been communicated to the ECB before being published by authorities beyond the three-month horizon indicated. 1 Buffer rates will be strictly positive from 2019 in line with the ECB O-SII methodology. 2 The decision by Národná banka Slovenska on O-SIIs has been included to cover all O-SII buffer rates for 2017. Source: ECB.
Adopted measure Buffer level at indicated
date of effect Date of effect
Publication date Adopting institution
Notification date
7 O-SIIs in Austria 0.25-0.50% 01/01/2017 30/11/2016 The Federal Financial Supervisory Authority (Finanzmarktaufsicht – FMA)/Finanzmarktstabilitätsgremium(FMSG)
31/10/2016
8 O-SIIs in Belgium 0.50-1.00% 01/01/2017 01/12/2016 The Nationale Bank van België/Banque Nationale de Belgique
16/11/2016
6 O-SIIs in Cyprus 0.125-0.50% 01/01/2019 07/11/2016 The Central Bank of Cyprus 20/09/2016
2 O-SIIs in Estonia 2.00% 01/08/2016 31/05/ 2016 Eesti Pank 10/10/2016
6 O-SIIs in France 0.125-0.75% 01/01/2017 13/12/2016 The Prudential Supervision and Resolution Authority (Autorité de Contrôle Prudentiel et de Résolution – ACPR)
07/11/2016
14 O-SIIs in Germany 0.16-0.66% 01/01/2017 01/12/2016 The Federal Financial Supervisory Authority (Bundesanstalt für Finanzdienstleitungsaufsicht – BaFin)
12/09/2016
4 O-SIIs in Greece 0.00%1 01/01/2017 01/12/2016 The Bank of Greece 03/11/2016
7 O-SIIs in Ireland 0.00-0.50% 01/07/2019 14/11/2016 The Central Bank of Ireland 26/09/2016
3 O-SIIs in Italy 0.00%1 01/01/2017 30/11/2016 The Banca d'Italia 11/10/2016
6 O-SIIs in Latvia 0.75-1.00% 30/06/2017 02/11/2016 The Financial and Capital Market Commission (Finanšu un kapitāla tirgus komisija – FCMC)
14/10/2016
4 O-SIIs in Lithuania 0.50-2.00% 31/12/2016 01/12/2016 Lietuvos bankas 14/11/2016
6 O-SIIs in Luxembourg 0.25-0.50% 01/01/2017 01/12/2016 The Financial Sector Supervisory Commission (Commission de Surveillance du Secteur Financier – CSSF)
24/10/2016
6 O-SIIs in Portugal 0.125-0.50% 01/01/2018 01/12/2016 The Banco de Portugal 14/10/2016
5 O-SIIs in Slovakia 1.00-2.00%2 01/01/2017 24/05/20162 Národná banka Slovenska 10/05/2016
8 O-SIIs in Slovenia 0.25-1.00% 01/01/2019 22/11/2016 Banka Slovenije 09/11/2016
6 O-SIIs in Spain 0.125-0.50% 01/01/2017 07/11/2016 The Banco de España 11/10/2016
Macroprudential Bulletin, Issue 3, June 2017 11
Chart 2 Overview of actual buffers and proposed minimum thresholds (2016 assessment)
Fully loaded O-SII buffer (percentage points) and overall score (basis point) computed according to EBA guidelines.
Notes: Scores computed by NCAs. ECB calculation. For each bin, markers correspond to the respective minimum and maximum O-SII buffer rates and dots correspond to the mean.
0.0%
0.5%
1.0%
1.5%
2.0%
2.5%
[350, 500] [500, 800] [800,1250]
[1250,1700]
[1700,1950]
[1950,2900]
[2900, ]
Chart 1 Overview of actual buffers and proposed minimum thresholds (2015 assessment)
Fully loaded O-SII buffer (percentage points) and overall score (basis point) computed according to EBA guidelines.
Notes: Scores computed by NCAs. ECB calculation. For each bin, markers correspond to the respective minimum and maximum O-SII buffer rates and dots correspond to the mean.
0.0%
0.5%
1.0%
1.5%
2.0%
2.5%
[350, 500] [500, 800] [800, 1250] [1250,1700]
[1700,1950]
[1950,2900]
[2900, ]
Macroprudential Bulletin, Issue 3, June 2017 12
Chapter 2 – Macroprudential policy analysis and tools7 – Stress test quality assurance from a top-down perspective8
Bank stress testing has recently gained importance as a tool for both microprudential and macroprudential purposes. This article describes Quality Assurance (QA) as conducted internationally and introduces the process and its key stakeholders followed in the 2016 Stress Test Exercise. For the latter, the banks’ stress testing projections were challenged from different perspectives: a bank-specific perspective leveraging first-hand supervisory knowledge about individual banks, a top-down (TD) perspective using TD benchmarks and TD models, and a horizontal bottom-up (HBU) perspective employing peer benchmarks and integrating a country perspective based on NCA expertise. This QA process involving a close collaboration across teams ensured that QA outcomes reflected all perspectives in a balanced way. This article provides an overview of the QA process to which the TD team contributed, with the HBU team providing a peer review and the Joint Supervisory Teams (JSTs) providing a supervisory view. It focuses on the approach of the TD team using a model toolkit developed for macroprudential purposes (called STAMP€)9 and presents an international comparison of bank stress testing approaches, highlighting the merits of top-down stress test quality assurance as part of the QA process.
1 Introduction
Since the financial crisis, stress tests have become an important tool for central banks and bank supervisors to assess the resilience of the banking sector against macro-financial shocks. The US Government, together with the Federal Reserve System, launched regular stress tests of the largest US financial institutions in 2009 as part of a broader programme to restore confidence in the financial sector, and since 2011 these have been regularly conducted as the Comprehensive Capital Analysis and Review (CCAR). In the EU the first EU-wide stress tests were conducted as early as 2009 by the predecessor of the European Banking Authority (EBA), the Committee of European Banking Supervisors (CEBS). While these approaches have typically focused on the financial health of individual institutions in
7 This chapter provides some examples of the analytical tools used by the ECB for its macroprudential
policy. It should be noted that the results provided in the Macroprudential Bulletin should not be interpreted as an indication of the final ECB view on national macroprudential measures, as the ECB uses several tools for its assessment.
8 Prepared by Mirza, H., and Żochowski, D.. 9 Dees, S., Henry J. and Martin R., STAMP€: Stress-test analytics for macroprudential purposes in the
euro area, ECB, Frankfurt am Main, 2017,
Macroprudential Bulletin, Issue 3, June 2017 13
a hypothetical adverse scenario, i.e. being used for microprudential purposes, the application of stress testing for macroprudential purposes in order to gauge systemic risks has recently gained momentum (see the ECB Macroprudential Bulletin 2016, Chapter 1 and the ECB e-book on STAMP€ by Dees et al., 2017).
2 The ECB approach to quality assurance and the role of a top-down perspective
The quality assurance process for the 2016 EBA stress test was performed by the ECB in cooperation with NCAs and the EBA. It was designed as a multipronged process combining different perspectives (see Table 1):
• A bank-specific perspective on the stress test results provided by the JSTs, which used their expert knowledge of the banks they directly supervise to assess said bank’s delivery and represented the key contact point for banks during the exercise.
• A peer group and a country perspective provided by the central HBU and the HBU teams in the NCAs (HBU(NCA)). The HBU teams focused on reviewing the differences between banks’ projections and the projections by relevant peers both from a risk and a country perspective, including at risk parameter level.
• A model-based perspective provided by the TD team, which focused on reviewing the differences between banks’ projections and the projections of P&L and balance-sheet items based on TD model outputs.
Table 1 Stakeholders in quality assurance of the 2016 EU-wide stress tests and their roles
Note: This table shows the different stakeholders that participated in the quality assurance process during the 2016 EU-wide stress test and describes their responsibilities.
From a process point-of-view, the teams challenged banks’ projections which – when deemed not to be prudent enough – generated so-called QA flags that were communicated to banks for explanation and/or compliance. The TD and HBU teams
Stakeholder Main responsibility
JST (supervisory perspective)
Assessing banks’ deliveries. Key contact point for banks during the stress test.
TD (model-based perspective)
Challenging each bank’s projections using top-down estimates for each bank.
ECB teams Horizontal (peer group perspective), including NCA staff
Challenging each bank’s projections using peer benchmarking, including at risk parameter level.
Data Uploading data to database and producing the data quality report.
PMO Facilitating internal processes and interactions and taking care of internal and external communication.
EBA Initiating and coordinating the EBA EU-wide stress test. Leading the development of the methodology and publishing the final
results for the EBA EU-wide stress test.
Other stakeholders NCAs/NCBs In addition to being directly integrated into ECB ST teams in Frankfurt, providing a horizontal country perspective of
corresponding banks and fulfilling a role as a member of the technical and governance committees of the EBA and SSM.
Banks Delivering historical and 2015 starting-point data and of bottom-up projections until 2018. Providing explanatory information.
Macroprudential Bulletin, Issue 3, June 2017 14
leveraged projections of the banks’ balance-sheets based on TD benchmarks and peer benchmarks, respectively. The results of a large number of credit institutions were reviewed, with the banks split into two samples: those that participated in the EBA exercise (37 banks) and those that took part in a somewhat lighter exercise in the context of the SREP.
Figure 1 High-level overview of the quality assurance process
Note: This flow-chart shows a high-level overview of the different steps taken by the various teams during each cycle of the quality assurance process.
From a TD perspective, the QA involved producing TD model-based benchmarks using the TD stress-testing framework developed by ECB staff for macroprudential purposes (STAMP€, see Henry and Kok, 2013 and Dees et al., 2017). These TD benchmarks, conditional upon the scenario assumptions, provide forward-looking paths for key stress test parameters. The individual banks’ stress test submissions were reviewed against those benchmarks. In particular, this included the use of credit top-down models for the generation of probability-of-default (PD) and loss-given-default (LGD) rates for multiple loan segments and countries (see Gross, Georgescu and Hilberg, 2017), models for the projections of the reference interest rates and margins for both asset and liability items (see Gross, Hilberg and Pancaro, 2017), TD models for market risk (see Laliotis and Mehta, 2017) as well as other
Macroprudential Bulletin, Issue 3, June 2017 15
benchmarks for operational risk (see Bousquet and Dubiel-Teleszynski, 2017) and additional profit and loss items (see Mirza, Moccero and Pancaro, 2017).10
The 2016 quality assurance process was designed around three cycles. Figure 1 presents a simplified overview of the individual steps per cycle with the TD-specific elements highlighted. Each cycle began with the submission of data by participating banks followed by a data quality review. The most comprehensive process was then the review of actual bank projections, comprising a comparison to published benchmarks, additional TD model outcomes and projections of relevant peer groups (e.g. at the country or business-model level), as well as an assessment of these projections in light of the common methodology and general supervisory scrutiny. Frequent communication across teams via various channels (dedicated communication tool, meetings, presentations, teleconferences) was followed by sessions dedicated to reaching decisions regarding individual bank submissions. These decisions then had to be validated by ECB/SSM decision-making bodies in the context of stress testing. Finally, banks were provided with detailed assessments of their submissions as well as, potentially, with requests for clarification, further information or compliance with certain benchmarks or methodological constraints requiring a re-submission.
This article focuses on the approach of the ECB top-down team, bearing in mind the importance of all functions performed by the overall project group and the highly complementary nature of the individual workflows involving all stakeholders.11 The TD team was following a precise work process − embedded in the overall quality assurance process − describing the key steps in the provision of TD model output and deliverables, a corresponding review of TD risk functions, interactions with other ST teams and a managerial review. The approach taken by the TD team, as well as specific individual TD risk functions, are described below along with some high-level findings.
The aforementioned process involved the production of TD projections using the ECB TD stress-testing framework and the review of individual bank results against the relevant benchmarks. The TD team focused on reviewing the differences between banks’ submitted projections, on the one hand, and projections of P&L and balance-sheet items based on TD model outputs, on the other. If deemed relevant, these were discussed with the other stakeholders in the QA process along with the QA flags generated from the other perspectives. Following the agreement of all stakeholders, the consolidated list of QA flags from all perspectives (TD, HBU, HBU(NCA) and JST) and the required adjustment in banks’ submissions were then communicated by the JSTs to their respective banks. The process also involved a recalibration of TD models taking into account relevant information provided by banks (in particular regarding starting points). There were also substantial adjustments of banks’ projections, reflecting corresponding requests for compliance
10 It should be noted that TD operational risk parameters were not used as explicit benchmarks, but rather
to inform the review of bank projections, given that the development of corresponding TD models has only begun quite recently.
11 This chapter does not address further the QA work performed by other SSM member authorities or the EBA.
Macroprudential Bulletin, Issue 3, June 2017 16
with methodological requirements or applicable benchmarks from the various QA perspectives, which resulted in a broad convergence over time.
3 International comparison to stress testing banks’ solvency
The different approaches to stress testing banks’ solvency differ with respect to the degree to which the analysis is conducted in a top-down (TD) as opposed to a bottom-up (BU) manner. Under a BU approach, banks are requested to perform balance sheet projections using their own models under specific adverse scenarios, while any quality assurance at the central level would involve mainly supervisory expert judgement and peer comparisons. Under a TD approach stress tests are conducted centrally by a supervisor or a central bank using centrally developed TD stress-test models after the banks have submitted the relevant data. In both cases it is common practice to use the same general adverse scenario for all institutions taking part in the stress test and to implement a methodological framework applicable to all banks within the stress test sample. While a TD approach uses a set of centrally developed models, under a BU approach banks use their own stress-test models.
Internationally renowned supervisory stress testing exercises are in particular those performed annually by the Bank of England (BoE) and the US Federal Reserve System. While the BoE exercise could be classified as primarily a BU exercise, in which banks submit historical data and their own projections under pre-specified scenarios, the Federal Reserve exercise is considered primarily a TD approach, as projections are calculated centrally by the supervisor relying on the same set of models.12 In the former case, the quality assurance process involves expert judgement of the plausibility of certain projections, peer comparisons and some supervisory models, but at the individual portfolio or sectoral level rather than via a fully-fledged modelling framework.13 In the latter case, the data submitted by banks is quality assured, while projections are carried out centrally by the Federal Reserve and are therefore subject to internal review.
The most recent EBA Stress Test, in 2016, can be considered to lie somewhere between the other two approaches and was labelled a constrained BU approach. It was the first time that a stress test was performed in conjunction with the ECB in its capacity as the single supervisor for euro area banks. In this case banks were required to submit historical data and their own projections under a common scenario. Nevertheless, the EU-wide stress test methodology14 introduced specific conservative caps and floors and other prescriptions, including the obligation to use
12 The Comprehensive Capital Analysis and Review also involves a bottom-up component in addition to
the top-down stress test, since banks are also required to submit their own projections. However, the (typically more conservative) top-down projections are published by the Federal Reserve. The latest results and a description of the general framework can be found at IMF 2016.
13 The BoE intends to strengthen the role of in-house models, and thus plans to further develop corresponding capabilities, see BoE 2015.
14 2016 EU-Wide Stress Test, Methodological Note, EBA 2016.
Macroprudential Bulletin, Issue 3, June 2017 17
certain benchmark parameters and haircuts which were binding for all banks participating in the exercise. The bulk of these explicit benchmarks were calibrated using the projections stemming from ECB TD models and were agreed by the EBA Board of Supervisors after consultation with SSM member authorities. The quality assurance process also differed from the BoE and Federal Reserve exercises described above due its multi-pronged nature. While the banks’ submissions were subject to supervisory expert judgement and comprehensive peer comparisons, the ECB also conducted a thorough parallel model-based TD challenge using the top-down stress testing framework developed for macroprudential purposes (STAMP€, see Henry and Kok, 2013 and Dees et al., 2017).
The outcome of the 2016 Stress Test was the starting point for a macroprudential extension of the stress test conducted by the ECB (see the ECB Macroprudential Bulletin 2016, Chapter 1 and Dees et al., 2017). To this end, the published projections as submitted by each bank are used as input for the ECB macroprudential stress testing models used to assess systemic risks. This involves estimating, inter alia, interbank and cross-sector contagion effects, the impact of bank capital depletion on the real economy as well as second- (and subsequent) round effects of deleveraging on bank solvency using a dynamic balance sheet. Such exercises are used to derive useful aggregate information on the financial sector as a whole rather than for assessing individual banks’ conditions.
The next section highlights some merits of using TD models in the context of bank stress-test quality assurance as a complement to the required supervisory scrutiny and peer comparisons. Some further details of the quality assurance by risk area are also provided.
4 The benefits of top-down model-based stress test quality assurance
One important benefit of using a TD approach to quality assurance is that it is model-based. This means that the same set of models is used to produce benchmark projections for all banks in the stress test sample on the basis of a set of stress test scenarios. The approach is therefore consistent across the institutions assessed, guaranteeing a level playing field, and it provides a direct link to the scenarios used in the stress test. As such it provides a very good complement to the supervisory expert judgment provided by the direct supervisors of a bank under consideration, who are generally better placed to judge bank specificities. It is also a useful complement to horizontal reviews (peer comparisons), where the latter may help in informing the calibration of TD models and determining a bank’s relative projections with respect to its peers.
Furthermore, top-down quality assurance, as a data-rich approach, uses information from the entire sample of banks, which improves the reliability of models and therefore statistical inference. It also provides a holistic perspective and enables the identification of key risk drivers for the banks in the stress test sample.
Macroprudential Bulletin, Issue 3, June 2017 18
One further consideration relates to incentives. As discussed in Hirtle and Lehnert (2015), banks may be incentivised to produce overly optimistic projections and thus to underestimate risks to their solvency. If this is the case, a peer comparison would only be able to identify banks that deviate sufficiently from their peers’ projections without uncovering any bias in the average projection. The TD modelling approach takes into account model and parameter uncertainty. This allows for the evaluation and use of the tails of parameter distributions. As a result, the TD estimates may be more conservative than the banks’ projections.
Finally, TD benchmarks may also help banks to improve their own stress test models. While these benchmarks should not be seen as complete replacements for bank projections, thereby potentially inducing herding behaviour, they may inform banks’ own model calibrations and thus contribute to better risk management practices.
5 Quality assurance by risk area and aggregate results
The following part describes the main ECB TD approaches used for specific risk classes.
Credit risk: TD satellite models were used to derive benchmark parameters for PD and LGD rates for individual sectors and by country, making use of an expected loss concept. These models relate the credit risk parameters to macroeconomic and financial factors. The benchmark parameters were applied to bank starting points and the resulting paths were used to derive impairments from new defaulted assets, impairments from old defaulted assets and changes to Risk Exposure Amounts. TD credit risk results were used to challenge bank projections and, given the very prescriptive nature of some of the benchmarks (as published by EBA), these resulted directly in a compliance request in the absence of a credible model provided by the bank in question.
Net interest income (NII): The projection of NII relies to some extent on the results from the credit risk analysis insofar as non-performing exposures can be assumed not to yield any interest. Furthermore, the expected NII evolution depends on the paths assumed for the reference rate and for the margin component.15 These were also projected using macro-financial satellite models.
Market risk: The TD approach to market risk involved the use of six models related to the held-for-trading (HFT) portfolio, market liquidity, credit valuation adjustments (CVA), counterparty credit, the available-for-sale (AFS) portfolio and the CVA risk-exposure amounts. The TD models contributed to the quality assurance process alongside the HBU and JST perspectives, and there were a number of error corrections and methodological clarifications which led banks to change their results over the cycles.
15 Outstanding loans were assumed to remain constant along with the composition of loans, in line with
the static balance sheet assumption made in the context of the stress test.
Macroprudential Bulletin, Issue 3, June 2017 19
Operational risk: In the context of assessing banks’ operational risk projections, TD models were used for three subcategories. First, losses from non-material conduct risk and other operational risk were projected. Second, risk exposure amounts were derived from TD operational risk projections. Third, the relevant indicator16 was approximated using TD models. Bank projections were assessed in light of these TD results.
Other P&L: Due to the highly idiosyncratic nature of the items concerned, they are less suitable to be quality assured via the use of models. Instead, they require detailed analysis and judgment of the information submitted by the bank. Although in the context of the 2016 exercise only a very limited number of TD models was used for the assessment of banks’ other P&L projections, a set of relevant rules of thumb and caps/floors was employed to challenge them.
Bank capital projections were also subject to quality assurance in order to ensure that they were in line with existing accounting standards.
The entire QA process, which involved three complementary approaches as described in Section 3, led over time to substantial adjustments to banks’ BU projections since more conservative bank submissions implied a convergence between TD and BU. This reflects the combined efforts of the JST, HBU and TD teams, as well as work performed by SSM member authorities and the EBA.
Overall, the major risk drivers that contributed to the changes in BU projections were net interest income and credit risk (relating to loan loss provisions), followed by market risk.
6 Conclusions
This article outlines the QA process and its major stakeholders in the 2016 EBA Stress Tests as performed at the ECB. The QA process followed by the ECB applied multiple perspectives, based on bank-specific knowledge and country-specific insights as well as peer benchmarking and TD models. All these perspectives were integrated in a horizontally consistent way during the 2016 quality assurance process. The article highlights the merits of TD models as a useful component of the QA stress test process, in particular as they help ensure a level playing field and provide model-based benchmarks which are forward looking and scenario-specific.
References
Bousquet A., T. Dubiel-Teleszynski (2017), Operational risk module of the top-down stress test framework in: Dees, S., J. Henry and R. Martin [editors], STAMP€: Stress-Test Analytics for macroprudential Purposes in the euro area, Chapter 8, ECB
16 The relevant indicator is defined in the Capital Requirements Regulation Article 316.
Macroprudential Bulletin, Issue 3, June 2017 20
Dees, S., Henry, J. and Martin R. (eds.), STAMP€: Stress-Test Analytics for macroprudential Purposes in the euro area, ECB, Frankfurt am Main, 2017.
European Central Bank (2016), Macroprudential Bulletin, Issue 2.
Henry, J. and Kok, C. (eds.), “A macro stress testing framework for assessing systemic risks in the banking sector”, Occasional Paper Series, No 152, ECB, Frankfurt am Main, 2013.
Hirtle, B. and Lehnert, A., (2015), “Supervisory stress tests”, Annual Review of Financial Economics, Vol. 7, pp. 339-355.
Gross, M., Georgescu, O. and Hilberg, B., “Credit risk satellite models”, in Dees, S., Henry, J. and Martin, R. (eds.), STAMP€: Stress-Test Analytics for macroprudential Purposes in the euro area, ECB, Frankfurt am Main, 2017.
Gross, M., Hilberg, B., and Pancaro, C., “Satellite models for bank interest rates and net interest margins”, in Dees, S., Henry, J. and Martin, R. (eds.), STAMP€: Stress-Test Analytics for macroprudential Purposes in the euro area, ECB, Frankfurt am Main, 2017.
Laliotis D. and Mehta, W., “Top-down modelling for market risk”, in Dees, S., Henry, J. and Martin, R. (eds.), STAMP€: Stress-Test Analytics for macroprudential Purposes in the euro area, ECB, Frankfurt am Main, 2017.
Mirza, H., Moccero, D. and Pancaro, C., “Satellite model for top-down projections of banks’ fee and commission income risk”, in Dees, S., Henry, J. and Martin R. (eds.), STAMP€: Stress-Test Analytics for macroprudential Purposes in the euro area, ECB, Frankfurt am Main, 2017.
Macroprudential Bulletin, Issue 3, June 2017 21
Chapter 3 – Exposure of the European Deposit Insurance Scheme to bank failures and the benefits of risk-based contributions17
This chapter provides three analytical contributions to the discussion of the establishment of a European Deposit Insurance Scheme (EDIS). First, it quantifies the exposure of a fully mutualised EDIS to bank failures, examining how the European Deposit Insurance Fund (DIF), with a target size of 0.8% of covered deposits of participating banking systems, would be affected under different stress and bail-in scenarios as well as under different methodological assumptions. Second, the chapter provides a quantitative analysis of how the calibration of deposit insurance risk-based contributions (based on current banks’ risk profiles) affects the distribution of contributions across countries. Third, the analysis aims to investigate whether EDIS would produce any systematic cross-subsidisation between banking sectors in different Member States. The results indicate that a fully-funded DIF could be sufficient to cover pay-outs in a non-systemic banking crisis, which is by design a goal of a deposit insurance scheme while other safety net tools are necessary to deal with systemic crises. Risk-based contributions can and should internalise specificities of a banking system – allowing moving forward with risk sharing measures in parallel with risk reduction measures, tackling moral hazard and avoiding any decrease in EDIS capacity. Furthermore, there would be no unwarranted systematic cross-subsidisation within EDIS in the sense of some banking systems systematically contributing less than they would benefit from the Fund.
1 Main assumptions, data and methodology
On 24 November 2015, the European Commission published a proposal for the creation of a European system of deposit insurance supported by a European Deposit Insurance Fund (DIF) and managed by the Single Resolution Board (SRB).18 The DIF would be built-up in different stages with increased mutualisation as the contributions of EDIS progressively increase over time. At the final stage of the EDIS set up, the protection of bank deposits would be fully financed by EDIS.
17 Drafted by Carmassi, J., Dobkowitz, S., Evrard, J., Silva, A. and Wedow, M. Input from Jan Lang is
gratefully acknowledged. The authors would also like to thank the following for their useful comments or input: Barbara Attinger, Andreas Baumann, Thorsten Beck, Inês Cabral, Simona Dodaro, Malte Jahning, Luis Molestina Vivar, Sergio Nicoletti-Altimari, Fátima Pires, Tanguy Poelman, Antonio Riso and Pär Torstensson. The chapter is based on a forthcoming ECB occasional paper on EDIS: Carmassi, J., Dobkowitz, S., Evrard, J., Silva, A. and M. Wedow (2017), “Exposure of the European Deposit Insurance Scheme to bank failures and the benefits of risk-based contributions”.
18 European deposit insurance scheme
Macroprudential Bulletin, Issue 3, June 2017 22
This chapter focuses on the steady state, where EDIS would be a fully-fledged deposit insurance system with a target level of 0.8% of covered deposits of the participating banking systems as in the Commission proposal. The analysis uses Bankscope data and supervisory data from COREP and FINREP for Q4 2015 on covered deposits and balance sheet indicators to estimate EDIS exposure to bank failures and contributions to EDIS at bank level. The conclusions of the analysis are therefore based on the assumption that banks’ balance sheet structures remain the same until EDIS has been fully introduced. The sample scrutinised comprises 1,675 euro area banks with total assets of €22.14 trillion, representing approximately 75% of total assets of credit institutions in the euro area, and €4,744 billion of covered deposits, corresponding to approximately 83% of covered deposits in the euro area. The sample can be considered as representative, both in terms of total assets and covered deposits.19 The target size of the DIF for the sample is approximately €38 billion.
The analysis is articulated in two steps. First, the exposure of EDIS to banks’ failures is calculated using covered deposits as well as banks’ estimated probabilities of default (PD), loss given default (LGD) and banks’ loss-absorbency capacity. The primary role of deposit insurance schemes is to build and maintain trust in the stability of the banking system by ensuring the safety of deposits and thus preserving depositors’ confidence. However, deposit insurance schemes are not designed to protect the system against systemic crises. This would be too costly to implement (due to the need for substantially higher banks' fees to build up the necessary fund) and create moral hazard (the larger the fund, the greater the potential incentive for banks to increase risk-taking and the smaller the potential depositors’ incentive to monitor banks' health). Therefore, deposit insurance schemes are typically established to ensure depositor confidence for non-systemic crises when a few individual banks fail. In this context, the analysis considers crises of a different magnitude, where the riskiest 1% or 3% of banks fail simultaneously according to their estimated PDs, in combination with different magnitudes of loss severity (LGD)20 and two variations of banks’ loss-absorbing capacity. This first step allows an assessment of the resilience of EDIS to potential loss scenarios of different severities and under different loss-absorption assumptions regarding banks’ liabilities. In a second step, banks’ contributions to EDIS are estimated and compared to the EDIS exposures obtained in the first step. This comparison aims to identify possible unwarranted cross-subsidisation across euro area countries.
19 The degree of representativeness of the sample at country level is, however, heterogeneous. 20 Losses in insolvency are assumed to be always 50% higher than losses in resolution.
Macroprudential Bulletin, Issue 3, June 2017 23
2 Estimation of EDIS exposure to bank failures21
2.1 Analysis
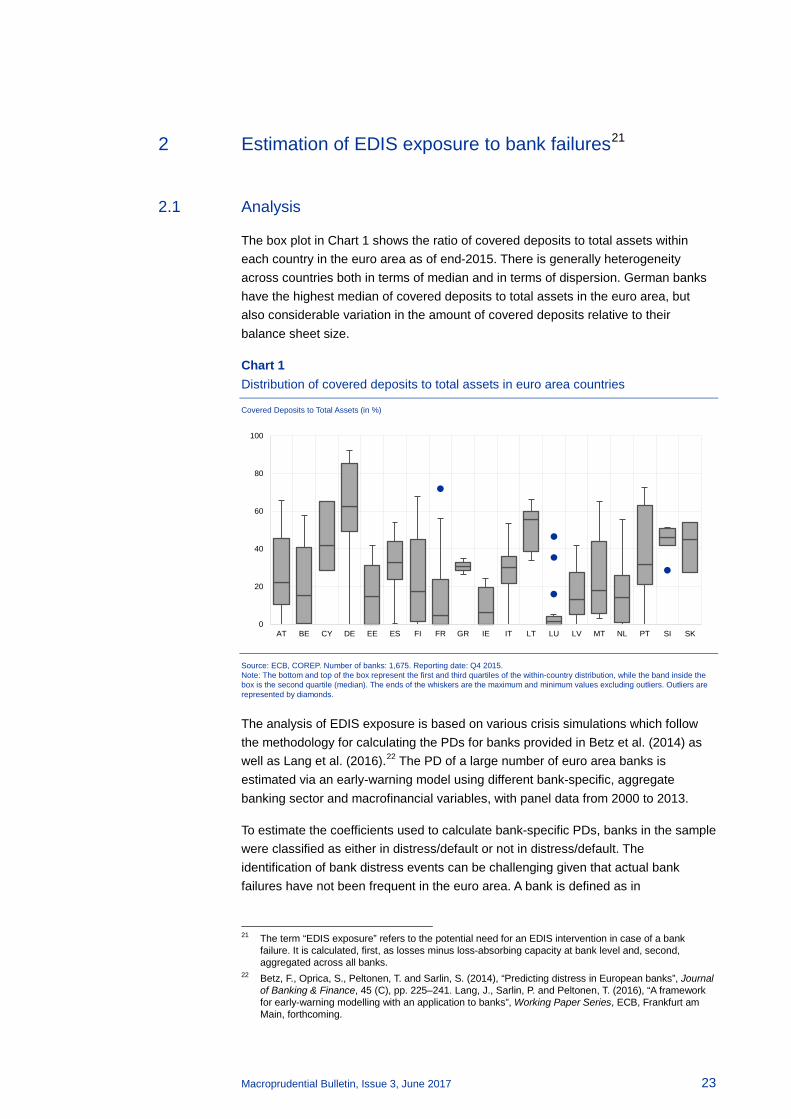
The box plot in Chart 1 shows the ratio of covered deposits to total assets within each country in the euro area as of end-2015. There is generally heterogeneity across countries both in terms of median and in terms of dispersion. German banks have the highest median of covered deposits to total assets in the euro area, but also considerable variation in the amount of covered deposits relative to their balance sheet size.
Chart 1 Distribution of covered deposits to total assets in euro area countries
Covered Deposits to Total Assets (in %)
Source: ECB, COREP. Number of banks: 1,675. Reporting date: Q4 2015. Note: The bottom and top of the box represent the first and third quartiles of the within-country distribution, while the band inside the box is the second quartile (median). The ends of the whiskers are the maximum and minimum values excluding outliers. Outliers are represented by diamonds.
The analysis of EDIS exposure is based on various crisis simulations which follow the methodology for calculating the PDs for banks provided in Betz et al. (2014) as well as Lang et al. (2016).22 The PD of a large number of euro area banks is estimated via an early-warning model using different bank-specific, aggregate banking sector and macrofinancial variables, with panel data from 2000 to 2013.
To estimate the coefficients used to calculate bank-specific PDs, banks in the sample were classified as either in distress/default or not in distress/default. The identification of bank distress events can be challenging given that actual bank failures have not been frequent in the euro area. A bank is defined as in
21 The term “EDIS exposure” refers to the potential need for an EDIS intervention in case of a bank
failure. It is calculated, first, as losses minus loss-absorbing capacity at bank level and, second, aggregated across all banks.
22 Betz, F., Oprica, S., Peltonen, T. and Sarlin, S. (2014), “Predicting distress in European banks”, Journal of Banking & Finance, 45 (C), pp. 225–241. Lang, J., Sarlin, P. and Peltonen, T. (2016), “A framework for early-warning modelling with an application to banks”, Working Paper Series, ECB, Frankfurt am Main, forthcoming.
0
20
40
60
80
100
AT BE CY DE EE ES FI FR GR IE IT LT LU LV MT NL PT SI SK
Macroprudential Bulletin, Issue 3, June 2017 24
distress/default if: (i) the status of the bank in the BvD Bankscope database is either “bankruptcy”, “dissolved” or “in liquidation”; (ii) the bank has negative capital; (iii) the bank was involved in a distressed merger, i.e. the merged entity had a negative coverage ratio (equity capital and loan loss reserves minus non-performing loans to total assets) one year before the merger; or (iv) the bank received state aid as indicated by data from the European Commission.
The bank-specific PDs for 2014 and 2015 are calculated on the basis of the coefficients estimated as described above. Given the distribution of the estimated 2015 PDs for 1,675 banks (93 of which are Significant Institutions (Sis)), the 3% (using the 97th percentile as a threshold) and 1% (corresponding to the 99th percentile) of banks with the highest PDs are singled out as banks most likely to fail in the next two years on the basis of the described PD methodology. The analysis assumes that, for each crisis simulation, all banks belonging to the riskiest 3% or 1% fail simultaneously. The 97th and 99th percentiles correspond to a PD of 5.32% and 11.78%, respectively.
As a result, crisis simulations in this analysis strongly depend on observed banking failures and crises. Additionally, while the coefficients for the regressions to obtain PDs are calculated using panel data taking the economic and financial cycle into account, the data on independent variables used to calculate banks’ probabilities to fail do not. Thus, the cycle is partially taken into account in the estimation of PDs. The inclusion of the recent financial crisis may influence this paper’s results, leading to potential discrepancies between simulated failures and those possibly materialising in the steady state.
The need for an EDIS contribution in case of a bank failure depends on whether the bank goes into resolution or insolvency and on its level of loss absorption capacity. For the purpose of the analysis, it is assumed that a bank would be resolved if it has (i) a balance sheet size of more than €20 billion or (ii) more than 40,000 transactional accounts, and that it would otherwise be liquidated.23 Since there is no available data on the number of transactional accounts, the assumption is that any bank with more than €4 billion in covered deposits is above the 40,000 threshold, i.e. that each account has €100,000 (corresponding to the maximum amount covered by deposit insurance per depositor per bank). This assumption is conservative, since on average each account has less than €100,000. Therefore, the analysis may overestimate the number of banks going into insolvency rather than resolution, which is overall conservative since insolvency may cause more destruction of value than resolution. In addition, this approach is more conservative in terms of the impact on the DIF, as the DIF’s contribution in resolution cannot be higher than the contribution
23 These assumptions broadly follow the Bank of England’s proposed approach to direct institutions to
maintain a minimum requirement for own funds and eligible liabilities; see The Bank of England’s approach to setting a minimum requirement for own funds and eligible liabilities (MREL) - Consultation on a proposed Statement of Policy, Bank of England, December 2015. Following feedback on the consultation, the Bank of England made two changes regarding the transactional accounts threshold: first, it clarified that accounts are defined as “transactional” on the basis of the frequency of their use (at least nine withdrawals over the previous three months) and, second, a range of between 40,000 and 80,000 accounts replaced a fixed threshold of 40,000; see The Bank of England’s approach to setting a minimum requirement for own funds and eligible liabilities (MREL) - Responses to Consultation and Statement of Policy, Bank of England, November 2016.
Macroprudential Bulletin, Issue 3, June 2017 25
it would have paid in insolvency.24 In resolution, a contribution from the Single Resolution Fund (SRF) is considered in each scenario, respecting the conditions set out in the legislation. This means that SRF contributions are capped at a maximum of 5% of a bank’s total assets after shareholders and creditors have absorbed losses corresponding to at least 8% of the bank’s total assets. In addition, cumulative SRF contributions cannot exceed the overall size of the SRF (i.e. 1% of total covered deposits for the sample of banks which equals €47.4 billion).
Regarding banks’ loss absorption capacity, two resolution scenarios are used in the analysis:
1. all liabilities except for secured liabilities and covered deposits absorb losses;
2. only capital, subordinated debt and senior unsecured bonds with a remaining maturity of at least 12 months absorb losses.
The analysis follows the existing creditor hierarchy, where covered deposits have a super-priority, both in resolution and liquidation. Indeed, the Banking Recovery and Resolution Directive (BRRD)25 and the Single Resolution Mechanism Regulation (SRMR)26 make it possible to subject a wide range of unsecured liabilities to losses, e.g. via a bail-in, and give a super-priority to covered deposits in the ranking of creditors. However, in practice, it is unlikely that all liabilities within the scope of bail-in will be fully loss-absorbing at the point of resolution. Therefore, scenario B considers a more realistic bail-in scenario in which only MREL-eligible liabilities are considered to be fully loss-absorbing (but deposits of large corporates above €100,000 euro are not included, despite being MREL-eligible, to make the scenario more conservative). It should be noted, however, that senior unsecured liabilities currently rank alongside other liabilities classes, e.g. derivatives. Thus, it is unlikely that they would be fully loss-absorbing given the “no creditor worse off” principle.
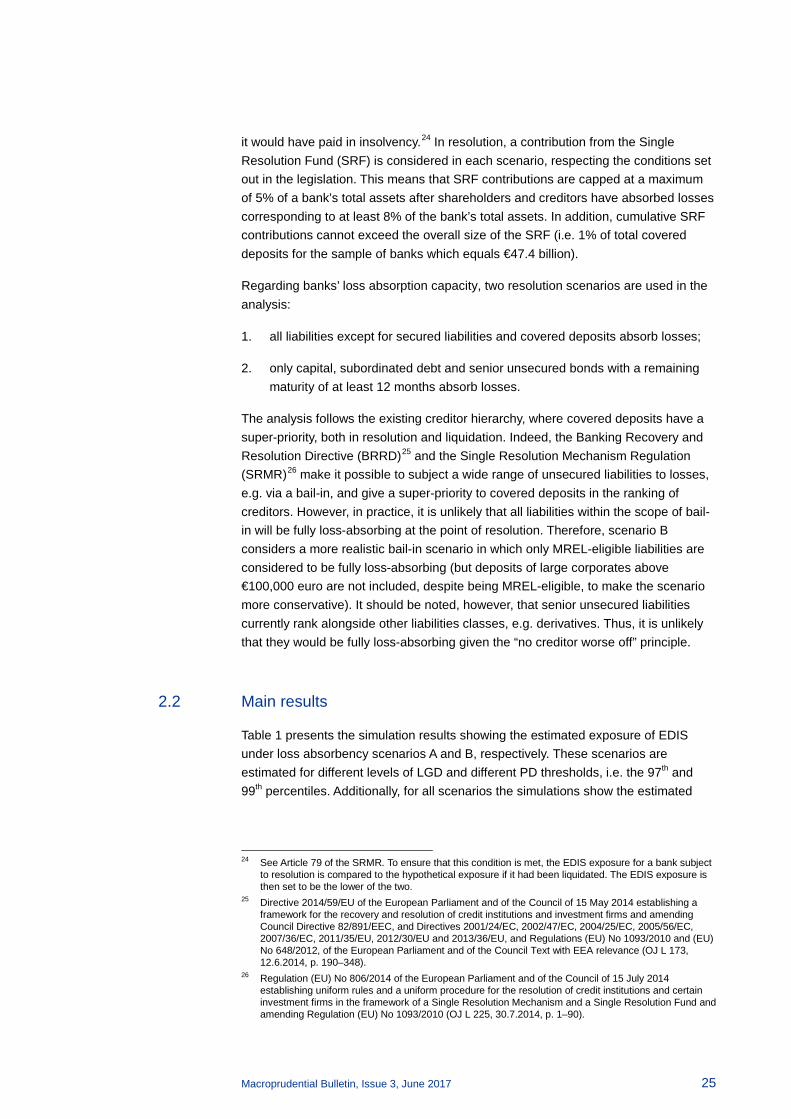
2.2 Main results
Table 1 presents the simulation results showing the estimated exposure of EDIS under loss absorbency scenarios A and B, respectively. These scenarios are estimated for different levels of LGD and different PD thresholds, i.e. the 97th and 99th percentiles. Additionally, for all scenarios the simulations show the estimated
24 See Article 79 of the SRMR. To ensure that this condition is met, the EDIS exposure for a bank subject
to resolution is compared to the hypothetical exposure if it had been liquidated. The EDIS exposure is then set to be the lower of the two.
25 Directive 2014/59/EU of the European Parliament and of the Council of 15 May 2014 establishing a framework for the recovery and resolution of credit institutions and investment firms and amending Council Directive 82/891/EEC, and Directives 2001/24/EC, 2002/47/EC, 2004/25/EC, 2005/56/EC, 2007/36/EC, 2011/35/EU, 2012/30/EU and 2013/36/EU, and Regulations (EU) No 1093/2010 and (EU) No 648/2012, of the European Parliament and of the Council Text with EEA relevance (OJ L 173, 12.6.2014, p. 190–348).
26 Regulation (EU) No 806/2014 of the European Parliament and of the Council of 15 July 2014 establishing uniform rules and a uniform procedure for the resolution of credit institutions and certain investment firms in the framework of a Single Resolution Mechanism and a Single Resolution Fund and amending Regulation (EU) No 1093/2010 (OJ L 225, 30.7.2014, p. 1–90).
Macroprudential Bulletin, Issue 3, June 2017 26
EDIS exposure with and without SRF contribution assuming the requirements mentioned in the previous section are satisfied.27
In the table, EDIS exposures exceeding €38 billion (which is the DIF target size in the sample) are highlighted in red to indicate a depletion of the fund.
Table 1 EDIS exposure in euro billions for resolution scenarios A and B, with and without SRF contribution
DIF target size is €38 billion. Cell entries exceeding this amount indicate cases where the fund is depleted
Note: Resolution scenario A: all liabilities except for secured liabilities and covered deposits absorb losses. Resolution scenario B: only capital, subordinated debt and senior unsecured bonds with a remaining maturity of at least 12 months absorb losses. Source: Calculations using COREP and Bankscope data, Q4 2015.
The table depicts different levels of losses for scenario A (B) in columns 3 to 6 (columns 7 to 10) as a percentage of total assets, both in resolution and insolvency (columns 1 and 2). Columns 3(7) and 5(9) represent the DIF exposure when the riskiest 3% of euro area banks in the sample fail, without and with SRF contribution, respectively. For the sample of 1,675 banks, this implies the failure of 51 banks holding 12.66% of the total assets in the sample. 18 of those failing banks enter into resolution and 33 into insolvency, corresponding to 12.42% and 0.24% of total assets, respectively. Columns 4(8) and 6(10) show the equivalent numbers for a more modest crisis where the riskiest 1% of euro area banks in the sample fail, both without and with SRF contribution, respectively. In this scenario, six banks are resolved, and 10 banks are subject to insolvency, representing 1.9% and 0.08% of total assets in the sample, respectively.
The results suggest that a fully-funded DIF with ex-ante contributions of 0.8% of covered deposits would have no exposure in cases of loss rates up to 15% in resolution and 22.5% in insolvency in both resolution scenarios. This finding partially reflects the strengthening of banks’ loss absorbency capacity and the risk-reducing
27 The analysis takes into account the following caps: (1) a ceiling for the SRF contribution in order not to
deplete the SRF (SRF contribution is capped at 1% of covered deposits of participating banks); (2) EDIS exposure for each bank cannot exceed the amount of covered deposits held by that bank; (3) a resolution cap not allowing EDIS exposure in resolution to exceed the theoretical exposure if the bank had been subject to insolvency; and 4) SRF contribution cannot exceed 5% of a bank’s total assets. Note that, in this exercise, the fact that the DGS contribution in resolution cannot exceed 50% of its target level as per Article 109 of the BRRD and Article 79 of the SRMR is not considered. As a result of the different caps which limit EDIS exposure, the exposure numbers are similar both with and without SRF contribution calculations. Furthermore, it should also be noted that only bank losses are considered for the calculations of the EDIS exposure, while bank recapitalisation needs (which would not be borne by EDIS) are not included.
Scenario A Scenario B
Without SRF With SRF Without SRF With SRF
1) 2) 3) 4) 5) 6) 7) 8) 9) 10)
Loss in Resolution
(as % of TA)
Loss in Insolvency
(as % of TA) Riskiest 3% of
banks fail Riskiest 1% banks fail
Riskiest 3% of banks fail
Riskiest 1% banks fail
Riskiest 3% of banks fail
Riskiest 1% banks fail
Riskiest 3% of banks fail
Riskiest 1% banks fail
10% 15% 0.0 0.0 0.0 0.0 0.0 0.0 0.0 0.0
15% 22.5% 0.0 0.0 0.0 0.0 0.0 0.0 0.0 0.0
20% 30% 0.003 0.0 0.003 0.0 3.0 0.9 3.0 0.9
25% 37.5% 0.04 0.0 0.04 0.0 23.9 15.6 23.8 14.6
30% 45% 3.4 1.2 0.5 0.4 87.6 33.1 85.8 30.3
Macroprudential Bulletin, Issue 3, June 2017 27
measures that have been implemented so far. Moreover, it should be emphasised that the main benefit of an EDIS derives from reducing the sovereign-bank nexus as well as from pooling resources across member states. This enhances depositor confidence and reduces the risk of wider deposit withdrawals which may also spill over to other banks. Spill-overs are not modelled in the analysis given the confidence enhancing role of an EDIS.
Under scenario A, EDIS exposure does not exceed the EDIS target size in any crisis-loss combination, with and without SRF contribution in resolution, even with a very high loss rate of, for instance, 30% in resolution. Under scenario B, EDIS exposure would become material only with a very high loss rate, for example, 25% in resolution. The DIF would only be depleted in the most severe crisis simulations (3% of banks in the sample failing) in combination with loss rates above 25% in resolution and 37.5% in insolvency, both with and without SRF contribution. It should be emphasised that the loss rates necessary to exhaust the EDIS fund are considerably harsher than historical cases of bank failures and losses both in Europe and in the U.S., including during the recent global financial crisis. By way of comparison, the European Commission28 estimated average losses for 23 banks over the period 2007-2010 to be 2.5% of total liabilities (maximum of 46.4%, minimum of 0.2%), while losses plus recapitalisation needs were 6% of total liabilities (maximum of 50.7%, minimum of 2.6%). The Financial Stability Board found that for G-SIBs losses as a fraction of total assets ranged from less than 1% to almost 4.7%, with most banks between 2% and 4%. The maximum ratio of losses plus recapitalisation amounts to total assets was 8.8%.29 It should also be noted that the analysis in this chapter assumes a simultaneous failure of the riskiest banks and a fixed level of LGD rather than a distribution of LGDs, which is more conservative than what was observed in past crises, notably for high LGD levels.
3 Estimating banks’ risk-based contributions to EDIS
3.1 Analysis
One concern which is frequently voiced regarding EDIS relates to the possibility that the pooling of resources could lead to cross-border subsidies, i.e. the eventuality of one or several banking systems structurally contributing more and benefitting less from the scheme than other, potentially riskier, systems. The pooling of resources could also lead to increased moral hazard and incentivise risk-taking behaviour by banks given the existence of a larger deposit guarantee scheme and fund. There might also be a risk that certain banking systems would be more likely to tap into the EDIS funds than others, even though all banking systems would benefit from the enhanced capacity of the deposit scheme to withstand larger crises.
28 Commission staff working document - impact assessment 29 Historical Losses and Recapitalisation Needs - Findings report
Macroprudential Bulletin, Issue 3, June 2017 28
The post-crisis review of the European Deposit Guarantee Scheme Directive (DGSD) applied the concept of risk-based contributions to national DGSs. The Commission proposal on EDIS also foresees the use of risk-based contributions to the DIF, the methodology of which would be determined in a Commission Delegated Act. The use of a “Banking Union methodology” would have the potential to reduce the risk of cross-border subsidies compared to a system where banks’ contributions would be calculated only relative to their national peers. This is because, following a “polluter-pays” principle, a banking system would contribute more to the DIF overall if it is riskier relative to other banking systems in the banking union. This approach would have the benefit of aligning incentives and tackling moral hazard, since banking systems which include riskier banks would contribute more to the DIF overall than they would if contributions were solely based on the amount of deposits. Given that the exact methodology for the calculation of banks’ contributions to the DIF is yet to be developed, the analysis below is based on a modified version of the methodology developed by the EBA for national DGSs in which banks’ contributions are risk-based.30 Please note that, while the EBA methodology for national DGSs applies the risk adjustment at a national level, the risk adjustment in this analysis is carried out at the banking union level.
According to the EBA Guidelines, the calculation of an institution’s contribution is based on five risk categories: (1) capital, (2) liquidity and funding, (3) asset quality, (4) business model and management, and (5) potential losses for the DGS (this factor is not considered here due to limited data on unencumbered assets). For the purpose of this study, the leverage ratio and the total risk-based capital ratio are included for category (1), liquid assets per total assets31 are included for category (2), and the ROE and RWA per total assets are used for the category representing an institution’s business model and management (4). Furthermore, the analysis includes a measure of (part of) MREL-eligible liabilities.32 The higher the MREL, the higher the likelihood of a bank going into resolution rather than liquidation, the higher the bank’s expected capacity to absorb losses and, all else being equal, the lower the potential exposure for EDIS.33 The combination of these indicators shall hereinafter be referred to as “DGS-baseline indicators” and is comparable to the list of indicators proposed for EDIS. As these indicators are still under discussion, the set used here does not prejudge the final calculation method that will be decided by the European Council and Parliament. In a first modification of the baseline list of indicators, the indicator for MREL-eligible liabilities is excluded to test the impact of this indicator on the contributions. In a second modification, the established baseline set of indicators is extended by additionally including an indicator for
30 See EBA Guidelines on methods for calculating contributions to deposit guarantee schemes, available
at: https://www.eba.europa.eu/documents/10180/1089322/EBA-GL-2015-10+GL+on+methods+for+calculating+contributions+to+DGS.pdf
31 Defined as: (cash & balances with central banks + net loans and advances to banks + level 1 assets (fair value hierarchy))/total assets.
32 Senior unsecured bonds only: regulatory capital is not included to avoid double consideration, given that it is already used for category (1) on capital.
33 EDIS exposure could be lower for several reasons: for example, MREL-eligible liabilities cannot be suddenly withdrawn, e.g. in a run, because they must have residual maturity of at least one year; losses in insolvency tend to be higher than in resolution; the losses for the deposit guarantee scheme in resolution cannot be higher than in insolvency (see Article 109 of the BRRD and Article 79 of the SRMR).
Macroprudential Bulletin, Issue 3, June 2017 29
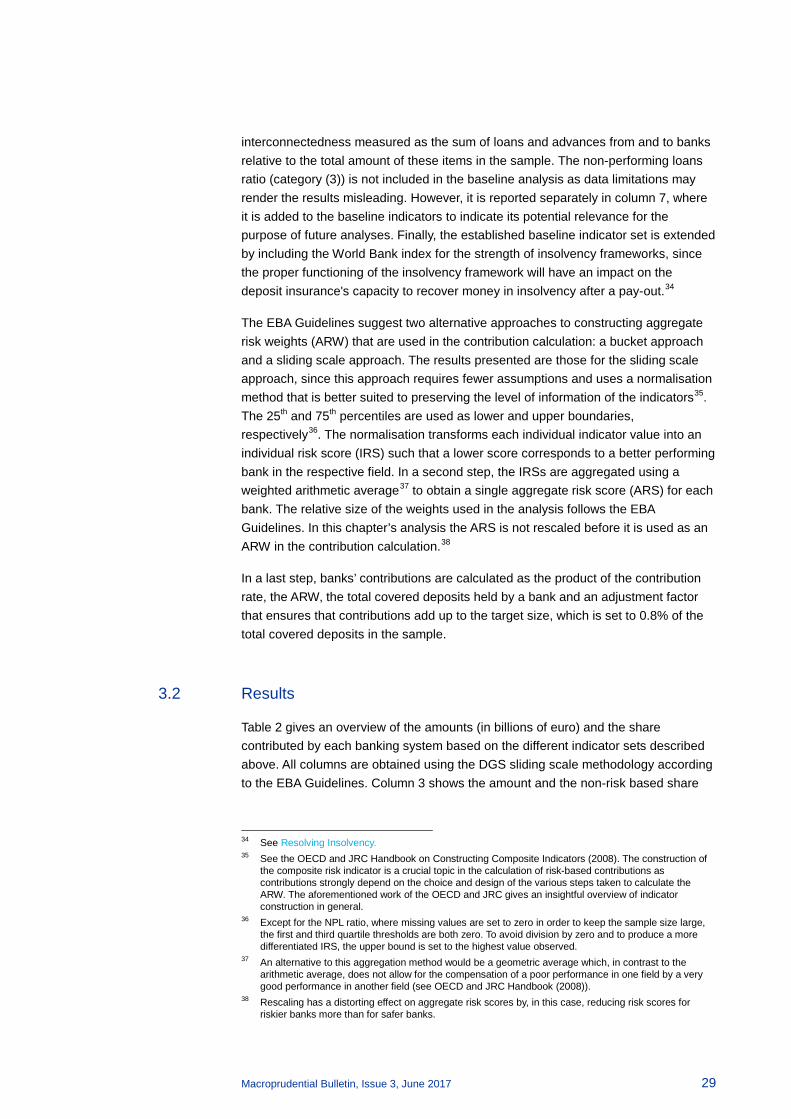
interconnectedness measured as the sum of loans and advances from and to banks relative to the total amount of these items in the sample. The non-performing loans ratio (category (3)) is not included in the baseline analysis as data limitations may render the results misleading. However, it is reported separately in column 7, where it is added to the baseline indicators to indicate its potential relevance for the purpose of future analyses. Finally, the established baseline indicator set is extended by including the World Bank index for the strength of insolvency frameworks, since the proper functioning of the insolvency framework will have an impact on the deposit insurance's capacity to recover money in insolvency after a pay-out.34
The EBA Guidelines suggest two alternative approaches to constructing aggregate risk weights (ARW) that are used in the contribution calculation: a bucket approach and a sliding scale approach. The results presented are those for the sliding scale approach, since this approach requires fewer assumptions and uses a normalisation method that is better suited to preserving the level of information of the indicators35. The 25th and 75th percentiles are used as lower and upper boundaries, respectively36. The normalisation transforms each individual indicator value into an individual risk score (IRS) such that a lower score corresponds to a better performing bank in the respective field. In a second step, the IRSs are aggregated using a weighted arithmetic average37 to obtain a single aggregate risk score (ARS) for each bank. The relative size of the weights used in the analysis follows the EBA Guidelines. In this chapter’s analysis the ARS is not rescaled before it is used as an ARW in the contribution calculation.38
In a last step, banks’ contributions are calculated as the product of the contribution rate, the ARW, the total covered deposits held by a bank and an adjustment factor that ensures that contributions add up to the target size, which is set to 0.8% of the total covered deposits in the sample.
3.2 Results
Table 2 gives an overview of the amounts (in billions of euro) and the share contributed by each banking system based on the different indicator sets described above. All columns are obtained using the DGS sliding scale methodology according to the EBA Guidelines. Column 3 shows the amount and the non-risk based share
34 See Resolving Insolvency. 35 See the OECD and JRC Handbook on Constructing Composite Indicators (2008). The construction of
the composite risk indicator is a crucial topic in the calculation of risk-based contributions as contributions strongly depend on the choice and design of the various steps taken to calculate the ARW. The aforementioned work of the OECD and JRC gives an insightful overview of indicator construction in general.
36 Except for the NPL ratio, where missing values are set to zero in order to keep the sample size large, the first and third quartile thresholds are both zero. To avoid division by zero and to produce a more differentiated IRS, the upper bound is set to the highest value observed.
37 An alternative to this aggregation method would be a geometric average which, in contrast to the arithmetic average, does not allow for the compensation of a poor performance in one field by a very good performance in another field (see OECD and JRC Handbook (2008)).
38 Rescaling has a distorting effect on aggregate risk scores by, in this case, reducing risk scores for riskier banks more than for safer banks.
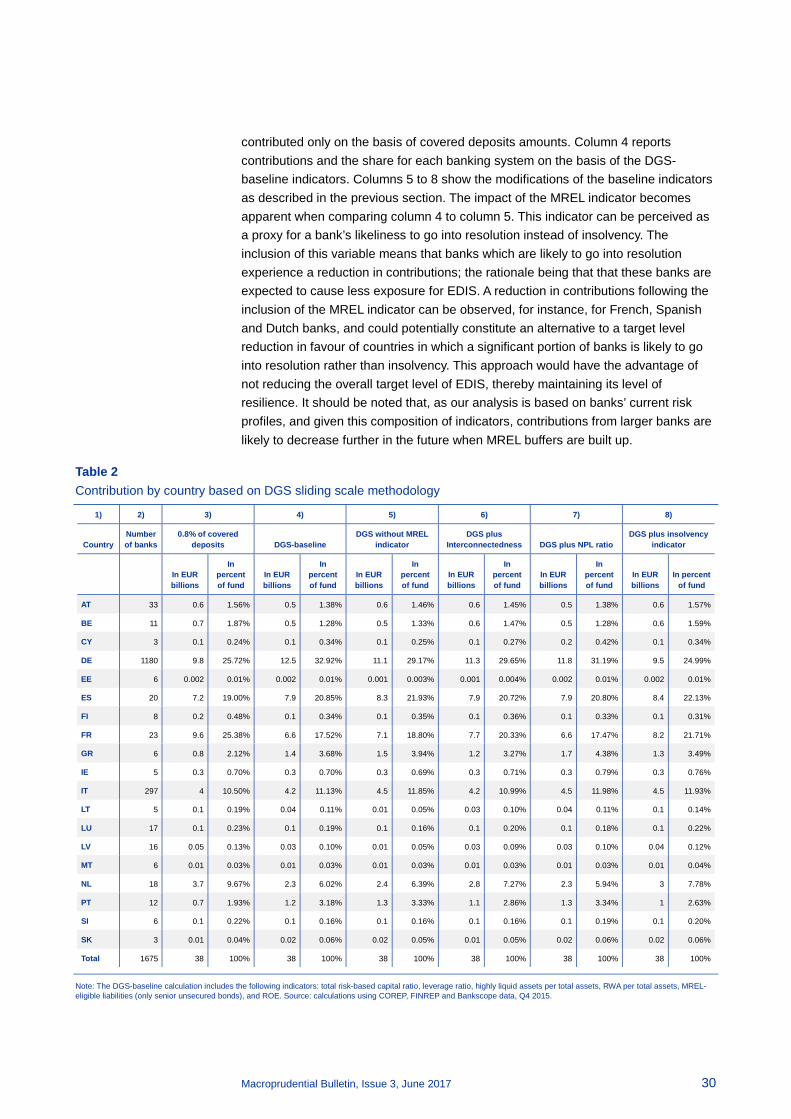
Macroprudential Bulletin, Issue 3, June 2017 30
contributed only on the basis of covered deposits amounts. Column 4 reports contributions and the share for each banking system on the basis of the DGS-baseline indicators. Columns 5 to 8 show the modifications of the baseline indicators as described in the previous section. The impact of the MREL indicator becomes apparent when comparing column 4 to column 5. This indicator can be perceived as a proxy for a bank’s likeliness to go into resolution instead of insolvency. The inclusion of this variable means that banks which are likely to go into resolution experience a reduction in contributions; the rationale being that that these banks are expected to cause less exposure for EDIS. A reduction in contributions following the inclusion of the MREL indicator can be observed, for instance, for French, Spanish and Dutch banks, and could potentially constitute an alternative to a target level reduction in favour of countries in which a significant portion of banks is likely to go into resolution rather than insolvency. This approach would have the advantage of not reducing the overall target level of EDIS, thereby maintaining its level of resilience. It should be noted that, as our analysis is based on banks’ current risk profiles, and given this composition of indicators, contributions from larger banks are likely to decrease further in the future when MREL buffers are built up.
Table 2 Contribution by country based on DGS sliding scale methodology
Note: The DGS-baseline calculation includes the following indicators: total risk-based capital ratio, leverage ratio, highly liquid assets per total assets, RWA per total assets, MREL-eligible liabilities (only senior unsecured bonds), and ROE. Source: calculations using COREP, FINREP and Bankscope data, Q4 2015.
1) 2) 3) 4) 5) 6) 7) 8)
Country Number of banks
0.8% of covered deposits DGS-baseline
DGS without MREL indicator
DGS plus Interconnectedness DGS plus NPL ratio
DGS plus insolvency indicator
In EUR billions
In percent of fund
In EUR billions
In percent of fund
In EUR billions
In percent of fund
In EUR billions
In percent of fund
In EUR billions
In percent of fund
In EUR billions
In percent of fund
AT 33 0.6 1.56% 0.5 1.38% 0.6 1.46% 0.6 1.45% 0.5 1.38% 0.6 1.57%
BE 11 0.7 1.87% 0.5 1.28% 0.5 1.33% 0.6 1.47% 0.5 1.28% 0.6 1.59%
CY 3 0.1 0.24% 0.1 0.34% 0.1 0.25% 0.1 0.27% 0.2 0.42% 0.1 0.34%
DE 1180 9.8 25.72% 12.5 32.92% 11.1 29.17% 11.3 29.65% 11.8 31.19% 9.5 24.99%
EE 6 0.002 0.01% 0.002 0.01% 0.001 0.003% 0.001 0.004% 0.002 0.01% 0.002 0.01%
ES 20 7.2 19.00% 7.9 20.85% 8.3 21.93% 7.9 20.72% 7.9 20.80% 8.4 22.13%
FI 8 0.2 0.48% 0.1 0.34% 0.1 0.35% 0.1 0.36% 0.1 0.33% 0.1 0.31%
FR 23 9.6 25.38% 6.6 17.52% 7.1 18.80% 7.7 20.33% 6.6 17.47% 8.2 21.71%
GR 6 0.8 2.12% 1.4 3.68% 1.5 3.94% 1.2 3.27% 1.7 4.38% 1.3 3.49%
IE 5 0.3 0.70% 0.3 0.70% 0.3 0.69% 0.3 0.71% 0.3 0.79% 0.3 0.76%
IT 297 4 10.50% 4.2 11.13% 4.5 11.85% 4.2 10.99% 4.5 11.98% 4.5 11.93%
LT 5 0.1 0.19% 0.04 0.11% 0.01 0.05% 0.03 0.10% 0.04 0.11% 0.1 0.14%
LU 17 0.1 0.23% 0.1 0.19% 0.1 0.16% 0.1 0.20% 0.1 0.18% 0.1 0.22%
LV 16 0.05 0.13% 0.03 0.10% 0.01 0.05% 0.03 0.09% 0.03 0.10% 0.04 0.12%
MT 6 0.01 0.03% 0.01 0.03% 0.01 0.03% 0.01 0.03% 0.01 0.03% 0.01 0.04%
NL 18 3.7 9.67% 2.3 6.02% 2.4 6.39% 2.8 7.27% 2.3 5.94% 3 7.78%
PT 12 0.7 1.93% 1.2 3.18% 1.3 3.33% 1.1 2.86% 1.3 3.34% 1 2.63%
SI 6 0.1 0.22% 0.1 0.16% 0.1 0.16% 0.1 0.16% 0.1 0.19% 0.1 0.20%
SK 3 0.01 0.04% 0.02 0.06% 0.02 0.05% 0.01 0.05% 0.02 0.06% 0.02 0.06%
Total 1675 38 100% 38 100% 38 100% 38 100% 38 100% 38 100%
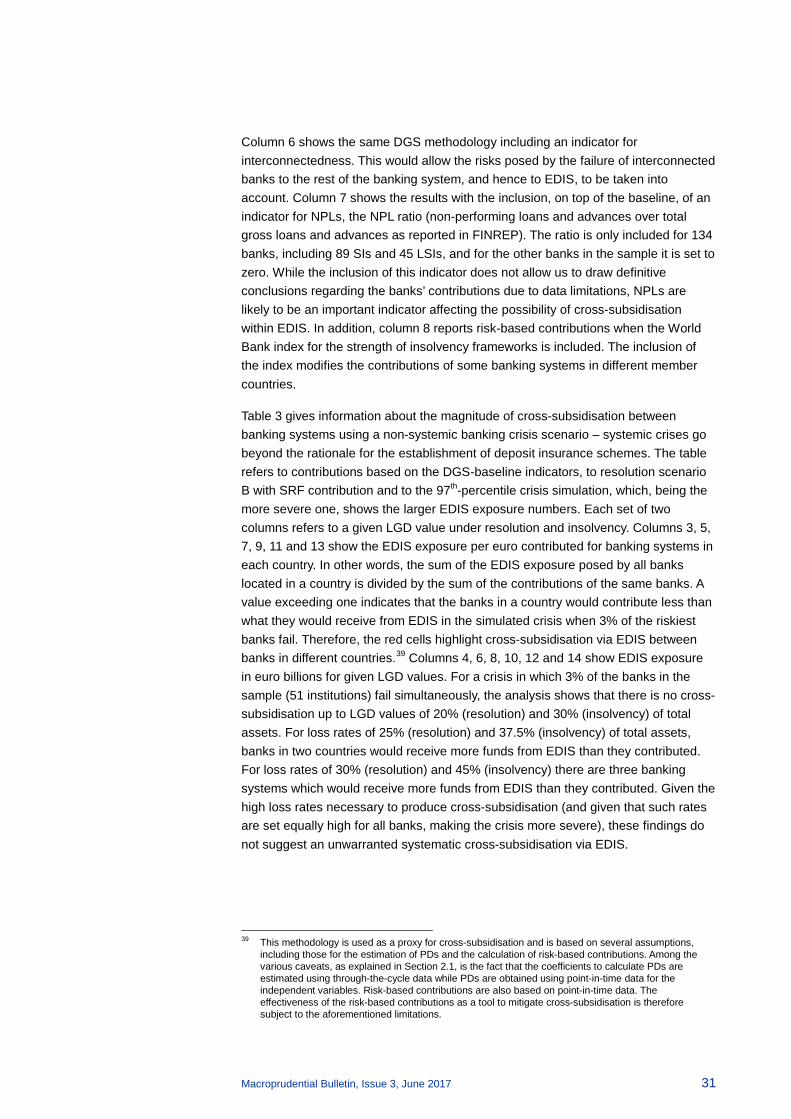
Macroprudential Bulletin, Issue 3, June 2017 31
Column 6 shows the same DGS methodology including an indicator for interconnectedness. This would allow the risks posed by the failure of interconnected banks to the rest of the banking system, and hence to EDIS, to be taken into account. Column 7 shows the results with the inclusion, on top of the baseline, of an indicator for NPLs, the NPL ratio (non-performing loans and advances over total gross loans and advances as reported in FINREP). The ratio is only included for 134 banks, including 89 SIs and 45 LSIs, and for the other banks in the sample it is set to zero. While the inclusion of this indicator does not allow us to draw definitive conclusions regarding the banks’ contributions due to data limitations, NPLs are likely to be an important indicator affecting the possibility of cross-subsidisation within EDIS. In addition, column 8 reports risk-based contributions when the World Bank index for the strength of insolvency frameworks is included. The inclusion of the index modifies the contributions of some banking systems in different member countries.
Table 3 gives information about the magnitude of cross-subsidisation between banking systems using a non-systemic banking crisis scenario – systemic crises go beyond the rationale for the establishment of deposit insurance schemes. The table refers to contributions based on the DGS-baseline indicators, to resolution scenario B with SRF contribution and to the 97th-percentile crisis simulation, which, being the more severe one, shows the larger EDIS exposure numbers. Each set of two columns refers to a given LGD value under resolution and insolvency. Columns 3, 5, 7, 9, 11 and 13 show the EDIS exposure per euro contributed for banking systems in each country. In other words, the sum of the EDIS exposure posed by all banks located in a country is divided by the sum of the contributions of the same banks. A value exceeding one indicates that the banks in a country would contribute less than what they would receive from EDIS in the simulated crisis when 3% of the riskiest banks fail. Therefore, the red cells highlight cross-subsidisation via EDIS between banks in different countries.39 Columns 4, 6, 8, 10, 12 and 14 show EDIS exposure in euro billions for given LGD values. For a crisis in which 3% of the banks in the sample (51 institutions) fail simultaneously, the analysis shows that there is no cross-subsidisation up to LGD values of 20% (resolution) and 30% (insolvency) of total assets. For loss rates of 25% (resolution) and 37.5% (insolvency) of total assets, banks in two countries would receive more funds from EDIS than they contributed. For loss rates of 30% (resolution) and 45% (insolvency) there are three banking systems which would receive more funds from EDIS than they contributed. Given the high loss rates necessary to produce cross-subsidisation (and given that such rates are set equally high for all banks, making the crisis more severe), these findings do not suggest an unwarranted systematic cross-subsidisation via EDIS.
39 This methodology is used as a proxy for cross-subsidisation and is based on several assumptions,
including those for the estimation of PDs and the calculation of risk-based contributions. Among the various caveats, as explained in Section 2.1, is the fact that the coefficients to calculate PDs are estimated using through-the-cycle data while PDs are obtained using point-in-time data for the independent variables. Risk-based contributions are also based on point-in-time data. The effectiveness of the risk-based contributions as a tool to mitigate cross-subsidisation is therefore subject to the aforementioned limitations.
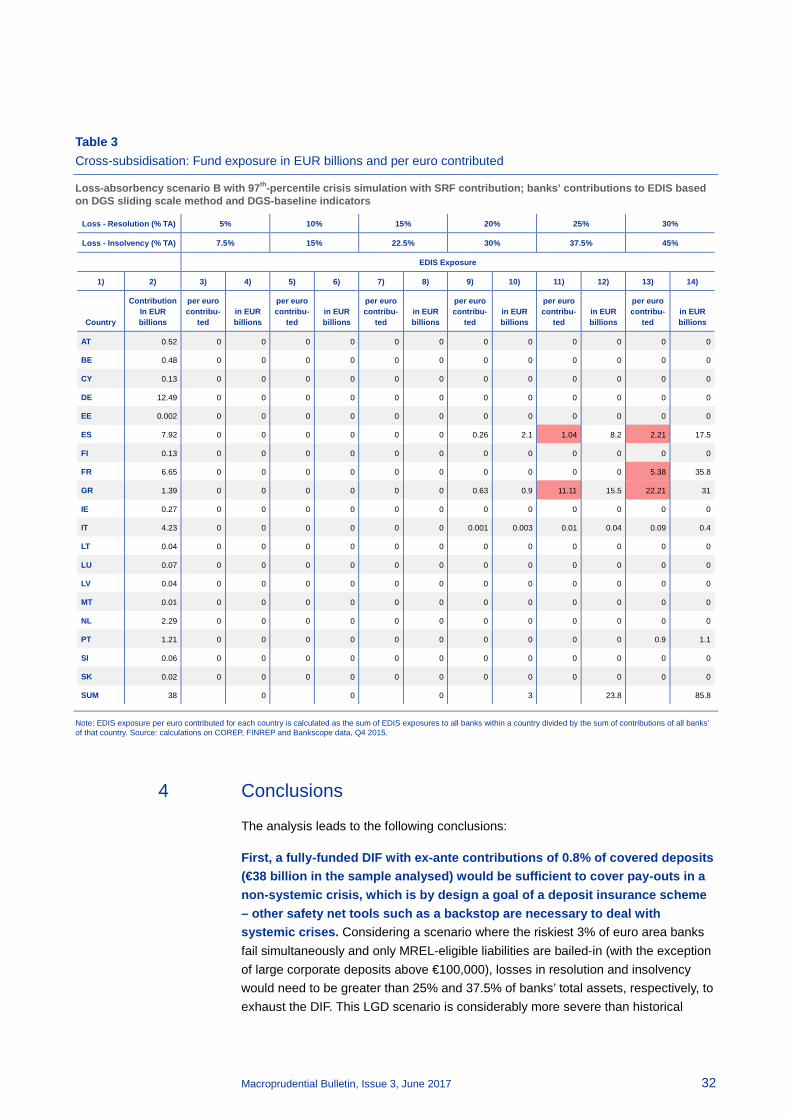
Macroprudential Bulletin, Issue 3, June 2017 32
Table 3 Cross-subsidisation: Fund exposure in EUR billions and per euro contributed
Loss-absorbency scenario B with 97th-percentile crisis simulation with SRF contribution; banks’ contributions to EDIS based on DGS sliding scale method and DGS-baseline indicators
Note: EDIS exposure per euro contributed for each country is calculated as the sum of EDIS exposures to all banks within a country divided by the sum of contributions of all banks' of that country. Source: calculations on COREP, FINREP and Bankscope data, Q4 2015.
4 Conclusions
The analysis leads to the following conclusions:
First, a fully-funded DIF with ex-ante contributions of 0.8% of covered deposits (€38 billion in the sample analysed) would be sufficient to cover pay-outs in a non-systemic crisis, which is by design a goal of a deposit insurance scheme – other safety net tools such as a backstop are necessary to deal with systemic crises. Considering a scenario where the riskiest 3% of euro area banks fail simultaneously and only MREL-eligible liabilities are bailed-in (with the exception of large corporate deposits above €100,000), losses in resolution and insolvency would need to be greater than 25% and 37.5% of banks’ total assets, respectively, to exhaust the DIF. This LGD scenario is considerably more severe than historical
Loss - Resolution (% TA) 5% 10% 15% 20% 25% 30%
Loss - Insolvency (% TA) 7.5% 15% 22.5% 30% 37.5% 45%
EDIS Exposure
1) 2) 3) 4) 5) 6) 7) 8) 9) 10) 11) 12) 13) 14)
Country
Contribution In EUR billions
per euro contribu-
ted in EUR billions
per euro contribu-
ted in EUR billions
per euro contribu-
ted in EUR billions
per euro contribu-
ted in EUR billions
per euro contribu-
ted in EUR billions
per euro contribu-
ted in EUR billions
AT 0.52 0 0 0 0 0 0 0 0 0 0 0 0
BE 0.48 0 0 0 0 0 0 0 0 0 0 0 0
CY 0.13 0 0 0 0 0 0 0 0 0 0 0 0
DE 12.49 0 0 0 0 0 0 0 0 0 0 0 0
EE 0.002 0 0 0 0 0 0 0 0 0 0 0 0
ES 7.92 0 0 0 0 0 0 0.26 2.1 1.04 8.2 2.21 17.5
FI 0.13 0 0 0 0 0 0 0 0 0 0 0 0
FR 6.65 0 0 0 0 0 0 0 0 0 0 5.38 35.8
GR 1.39 0 0 0 0 0 0 0.63 0.9 11.11 15.5 22.21 31
IE 0.27 0 0 0 0 0 0 0 0 0 0 0 0
IT 4.23 0 0 0 0 0 0 0.001 0.003 0.01 0.04 0.09 0.4
LT 0.04 0 0 0 0 0 0 0 0 0 0 0 0
LU 0.07 0 0 0 0 0 0 0 0 0 0 0 0
LV 0.04 0 0 0 0 0 0 0 0 0 0 0 0
MT 0.01 0 0 0 0 0 0 0 0 0 0 0 0
NL 2.29 0 0 0 0 0 0 0 0 0 0 0 0
PT 1.21 0 0 0 0 0 0 0 0 0 0 0.9 1.1
SI 0.06 0 0 0 0 0 0 0 0 0 0 0 0
SK 0.02 0 0 0 0 0 0 0 0 0 0 0 0
SUM 38
0
0
0
3
23.8 85.8
Macroprudential Bulletin, Issue 3, June 2017 33
losses both in Europe and in the United States, including the recent global financial crisis, as it is assumed that banks are failing simultaneously and LGDs are fixed at high levels for the entire banking system.
Second, the specificities of a banking system can be taken into account in the risk-based contributions to the DIF, which is preferable to the lowering of the EDIS target level. The methodology follows the EBA Guidelines for national DGS contributions but is applied to all participating banks within the scope of EDIS to ensure that a bank’s risk profile is compared to its peers across the banking union rather than within each national banking system. The features of a banking system can be appropriately reflected in the risk-based contributions using a “polluter pays” approach. This would have the benefit of keeping the credible target level of EDIS, which has been shown to be appropriate in dealing with a non-systemic banking crisis. Furthermore, risk-based contributions would allow a wide range of factors which are likely to have an impact on EDIS to be taken into account. For example, including an indicator for MREL-eligible liabilities provides an indication of banks’ loss absorbency capacity and could also be a proxy for the likelihood of a bank going into resolution rather than insolvency. Therefore, including this variable means that banks that are likely to go into resolution may have their contributions reduced because of their higher loss absorbing capacities and the resulting potentially lower exposure for EDIS. This could cater for the fact that a banking system composed of larger institutions would be less likely to benefit from EDIS as these are more likely to be resolved, thus limiting the possible contribution needed from the DIF. Also, the inclusion of an interconnectedness indicator would permit the impact of a bank’s failure on the banking system as a whole, and therefore on EDIS, to be taken into account. This would be particularly relevant for a banking system composed mainly of interconnected institutions.
Third, there is no unwarranted systematic cross-subsidisation within EDIS, in the sense of some banking systems systematically contributing less than they would benefit from the DIF. A comparison of banks’ risk-based contributions to the DIF exposure shows that, even in a severe (non-systemic) banking crisis, while there are some cases in which the contributions of a banking system are lower than the amounts which would be received from EDIS, this is only the case for very high loss rates that have a low probability of occurring.
In conclusion, EDIS would offer major benefits in terms of depositor protection while posing limited risks in terms of EDIS exposure since, given our assumptions on banks’ PDs, LGDs and loss-absorbing capacities, the probability and magnitude of interventions are likely to be low. Additionally, based on the results shown in this chapter the risk of unwarranted cross-subsidisation also appears to be low. Appropriately-designed risk-based contributions are crucial to establish the right incentives and strike the right balance between ensuring adequate and credible deposit protection and minimising the risk of cross-subsidisation across countries. Risk-based contributions can and should internalise the specificities of a banking system. This would allow moving forward with risk-sharing measures in parallel with risk-reduction measures, address moral hazard and avoid lowering EDIS capacity.
Macroprudential Bulletin, Issue 3, June 2017 34
Annex – Macroprudential policy measures at country level
This Annex provides a summary of the macroprudential policy measures that have been implemented or announced in euro area countries since the publication of the second Macroprudential Bulletin in October 2016. The cut-off date for reporting macroprudential measures was 28 April 2017. An overview of all measures reported to the ECB under Article 5 of the SSM Regulation is provided on the ECB website40. The aim of each macroprudential policy measure is described in further detail either in the first issue of the Macroprudential Bulletin or in the glossary.
1 Capital requirements at country level
Chart A displays the minimum and the maximum combined buffer requirements (CBR). Whereas the minimum CBR is usually applicable to all banks in one country (blue colour), taking into account the CCoB and the CCyB, the maximum CBR (yellow colour) relates to financial institutions which are required to apply the O-SII, the G-SII or the systemic risk buffer, whichever is higher.41 In some countries only a few financial institutions are affected by the maximum CBR. In Italy, for example, only two institutions are currently designated as O-SIIs, while in Germany 14 institutions are affected. Overall, the chart also shows that the CBR ranges between 1.25% and 5.5%. The minimum CBR in the euro area ranges from 1.25% (the minimum CCoB) to 3.5% (in Estonia, the 2.5% CCoB and a 1% systemic risk buffer apply to all banks). The institution-specific maximum CBR may be 0%, but in some countries it can add up to 2%. These differences are justified by the heterogeneous macroeconomic developments in the euro area and by the different levels of systemic risk which individual institutions pose to financial stability. Chart A compares the minimum CBR and the maximum CBR from September 2016 with the ones from April 2017. Overall, the minimum CBR has increased42 since last September due to the phasing-in of the CCoB in 2017 (from 0.625% to 1.25%). At the same time, the maximum CBR in some countries, which reflects individual structural buffers (e.g. O-SIIs), has increased as buffers are either phased-in or newly introduced.
40 Latest update on the website: 3 April 2017. 41 In one country (Estonia), the systemic risk buffer applies to all banks. In Estonia and Slovakia, SRB is
applied only on domestic exposures, meaning that the buffer comes in addition to the O-SII or G-SII buffers, whichever is greater.
42 Cyprus and Italy stopped the front-loading of the CCoB. Therefore, the CCoB decreased from 2.5% to 1.25%.
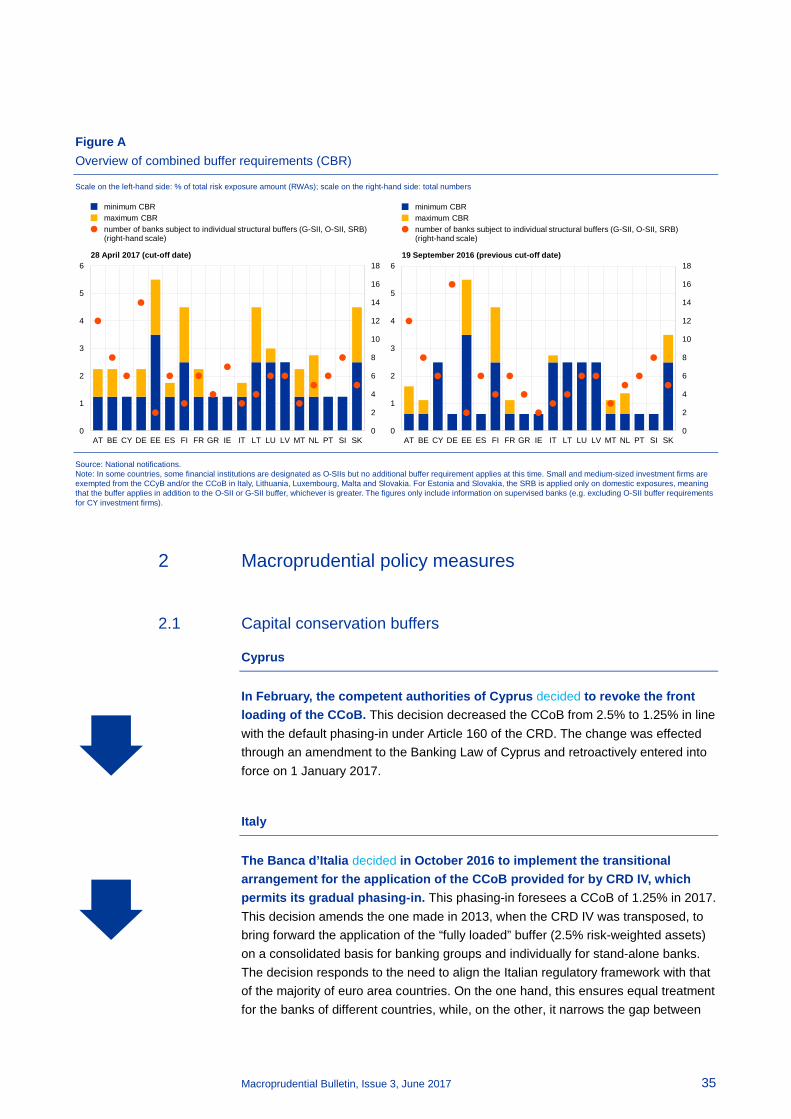
Macroprudential Bulletin, Issue 3, June 2017 35
Figure A Overview of combined buffer requirements (CBR)
Scale on the left-hand side: % of total risk exposure amount (RWAs); scale on the right-hand side: total numbers
Source: National notifications. Note: In some countries, some financial institutions are designated as O-SIIs but no additional buffer requirement applies at this time. Small and medium-sized investment firms are exempted from the CCyB and/or the CCoB in Italy, Lithuania, Luxembourg, Malta and Slovakia. For Estonia and Slovakia, the SRB is applied only on domestic exposures, meaning that the buffer applies in addition to the O-SII or G-SII buffer, whichever is greater. The figures only include information on supervised banks (e.g. excluding O-SII buffer requirements for CY investment firms).
2 Macroprudential policy measures
2.1 Capital conservation buffers
Cyprus
In February, the competent authorities of Cyprus decided to revoke the front loading of the CCoB. This decision decreased the CCoB from 2.5% to 1.25% in line with the default phasing-in under Article 160 of the CRD. The change was effected through an amendment to the Banking Law of Cyprus and retroactively entered into force on 1 January 2017.
Italy
The Banca d’Italia decided in October 2016 to implement the transitional arrangement for the application of the CCoB provided for by CRD IV, which permits its gradual phasing-in. This phasing-in foresees a CCoB of 1.25% in 2017. This decision amends the one made in 2013, when the CRD IV was transposed, to bring forward the application of the “fully loaded” buffer (2.5% risk-weighted assets) on a consolidated basis for banking groups and individually for stand-alone banks. The decision responds to the need to align the Italian regulatory framework with that of the majority of euro area countries. On the one hand, this ensures equal treatment for the banks of different countries, while, on the other, it narrows the gap between
0
2
4
6
8
10
12
14
16
18
0
1
2
3
4
5
6
AT BE CY DE EE ES FI FR GR IE IT LT LU LV MT NL PT SI SK
minimum CBRmaximum CBRnumber of banks subject to individual structural buffers (G-SII, O-SII, SRB) (right-hand scale)
28 April 2017 (cut-off date)
0
2
4
6
8
10
12
14
16
18
0
1
2
3
4
5
6
AT BE CY DE EE ES FI FR GR IE IT LT LU LV MT NL PT SI SK
minimum CBRmaximum CBRnumber of banks subject to individual structural buffers (G-SII, O-SII, SRB) (right-hand scale)
19 September 2016 (previous cut-off date)
Macroprudential Bulletin, Issue 3, June 2017 36
national regulatory frameworks in line with the work undertaken by ECB Banking Supervision to minimise the differences in the prudential regulation applicable to banks.
2.2 Countercyclical capital buffers
All euro area countries
All euro area countries that notified countercyclical capital buffer (CCyB) rate measures to the ECB decided to maintain the CCyB at 0% since the last publication of the Macroprudential Bulletin, with the exception of Slovakia, which confirmed its decision to keep the CCyB rate at 0.5% from August 2017 also beyond May 2018. Slovakia based its decision on the fact that the domestic credit-to-GDP trend gap had increased to 2.98%, above the 2% threshold that indicates a need for an increase in the countercyclical buffer rate. Since the continuation of the expansionary phase was already expected when the non-zero CCyB was adopted in July 2016 and as actual developments are in line with these expectations, no revision of the CCyB rate was deemed necessary by the Slovakian authorities.
2.3 Other systemically important institutions (O-SII) buffers
All euro area countries
Almost all national competent authorities in euro area countries have notified the ECB of their decisions on capital buffers for O-SIIs in the last six months. The decisions on O-SII buffers were based on the newly introduced ECB methodology for assessing O-SII buffers, which is why the heterogeneity in the calibration by national authorities of O-SII buffers in comparable economic and financial systems has decreased. Overall, the number of banks which have been designated as O-SIIs has increased slightly since October. In total, 110 banks have been designated as O-SIIs. An overview of the current buffer range is provided on the new ECB website (external link).
2.4 Global systemically important banks (G-SIB) buffers
France, Germany, Italy, the Netherlands and Spain
The macroprudential policy authorities in SSM countries carried out the 2016 update of Global Systemically Important Banks (G-SIBs). The ECB and national authorities have identified eight banks in France (BNP Paribas, Groupe BPCE, Group Crédit Agricole, Société Générale), Germany (Deutsche Bank), Italy (Unicredit), the Netherlands (ING Bank) and Spain (Santander) as G-SIBs with buffer rates between 0.5% and 1.0% in 2017 (fully loaded in 2019: between 1.0% and 2.0%).
Macroprudential Bulletin, Issue 3, June 2017 37
2.5 Other macroprudential measures
Cyprus and Latvia
The Central Bank of Cyprus (CBC) as well as the Latvian Financial and Capital Market Commission (FCMC) have decided to reciprocate a macroprudential measure that was adopted by the National Bank of Belgium.
The Belgian measure constitutes a 5% risk-weight add-on to the Belgian mortgage loan exposures of credit institutions. The Belgian measure must be applied by those credit institutions that are established in Cyprus or Latvia which use the internal-ratings based (IRB) approach and have a branch located in Belgium, or use the IRB approach and their exposures to Belgian mortgage loans are provided directly cross-border, or do not use the IRB approach and have direct cross-border exposures to the Belgian mortgage market.
Ireland
The Central Bank of Ireland introduced a variation in the LTV limits for Principal Dwelling Homes, with the objective of increasing the resilience of Irish households and banks against the risk related to residential real estate in the context of high exposure to this sector. According to the revised lending standard restrictions, loans exceeding an LTV ratio of 80% should not amount to more than 20% of aggregate new loans for non-first time buyers. For first-time buyers the LTV limit is 90%, which should not exceed more than 5% of the total amount of such loans per lender per calendar year. For buy-to-let a 70% LTV limit applies, which should not exceed more than 10% of the total amount of such loans per lender per calendar year.
Slovakia
The ECB was informed by Národná banka Slovenska about macroprudential measures related to housing loans. The measures relate to:
• Limit on debt service to income (DSTI) ratio: Loan instalments (for both new and existing loans, subject to an assumed interest rate increase of 2 p.p., if the interest rate is not fixed) cannot exceed 80% of the borrower’s disposable income.43 The measure will be phased in starting on 1 March 2017.
• LTV limits (application in parallel):
(a) LTV cannot exceed 100%.
(b) The share of new loans with LTV>90% cannot exceed 10%.
(c) The share of new loans with LTV>80% cannot exceed 40%. The measures apply as of 1 January 2017 and measures under b) and c) are subject to a phasing-in period.
43 Disposable income is defined as net income less the minimum subsistence amount (including the
minimum subsistence amount for children and spouse, if applicable).
Macroprudential Bulletin, Issue 3, June 2017 38
• Maturity limits:
(a) Loans secured by residential real estate (RRE): maximum maturity is 30 years with a possible exemption of 10% of new loans.
(b) Loans not secured by RRE granted by building societies:
(i) maximum maturity: 30 years;
(ii) max. share of new loans over 25 years: 10%;
(iii) max. share of new loans over 20 years: 20%.
(c) Other loans not secured by RRE: 8 years. The measures apply as of 1 January 2017.
The implementation of these measures is related to the transformation of an existing non-binding NBS Recommendation into binding law. Two measures are new or tightened: the DSTI limit and the maximum share of new loans with LTV > 80%.
Slovenia
Banka Slovenije issued a recommendation on loan-to-value (LTV) and debt service-to-income (DSTI) ratio limits. The recommended maximum level of the LTV ratio is 80%. The recommended maximum level of the DSTI ratio is 50% of all income up to €1,700 and 67% of all income exceeding €1,700. The purpose of the recommendation is to ensure that existing credit standards do not become excessively loose, to improve banks' existing risk profile and to harmonise credit standards amongst bank with regard to the LTV and DSTI ratios.
Macroprudential Bulletin, Issue 3, June 2017 39
Glossary
Regulatory framework
Bank Recovery and Resolution Directive (BRRD) A harmonised framework for the recovery and resolution of credit institutions and investment firms. It introduces harmonised tools and powers relating to prevention, early intervention and resolution for all EU Member States.
Basel framework (Basel III) A global regulatory framework for banks and banking systems, developed by the Basel Committee on Banking Supervision in response to the financial crisis of 2008. Basel III builds upon the Basel II rulebook. Its aim is to strengthen the regulation, supervision and risk management of the banking sector. The measures aim to improve the banking sector's ability to absorb shocks arising from financial and economic stress, improve risk management and governance, and strengthen banks' transparency and disclosures.
Capital Requirements Regulation / Capital Requirements Directive (CRR/CRD IV) Regulation on prudential requirements for credit institutions and investment firms (CRR) and Directive on access to the activity of credit institutions and the prudential supervision of credit institutions and investment firms (CRD IV). The CRR/CRD IV package transposes the global standards on bank capital (the Basel III agreement) into EU law.
Deposit Guarantee Schemes (DGS) Directive Directive on deposit guarantee schemes introducing a harmonisation and simplification of rules and criteria applicable to deposit guarantees.
Single Supervisory Mechanism (SSM) A mechanism composed of the ECB and national competent authorities in participating Member States for the exercise of the supervisory tasks conferred upon the ECB. The ECB is responsible for the effective and consistent functioning of this mechanism, which forms part of the banking union.
SSM Framework Regulation The regulatory framework setting out the practical arrangements concerning the cooperation between the ECB and the national competent authorities within the Single Supervisory Mechanism.
SSM Regulation (SSMR) The legal act creating a single supervisory mechanism for credit institutions in the euro area and, potentially, other EU Member States, as one of the main elements of Europe’s banking union. The SSM Regulation confers on the ECB specific tasks concerning policies relating to the prudential supervision of credit institutions and macroprudential policy.
Capital-based macroprudential policy instruments
Capital conservation buffer (CCoB) A capital buffer of up to 2.5% of a bank’s total exposures to avoid breaches of minimum capital requirements during periods of stress when losses are incurred. The capital buffer has been implemented in Europe via Article 129 CRD IV and must be met with CET1 capital. Phasing-in arrangements apply between 2016 and 2019, but earlier introduction is possible.
Combined buffer requirement (CBR) The total Common Equity Tier 1 capital required to meet the requirement for the capital conservation buffer extended by an institution-specific countercyclical capital buffer, a G-SII buffer, an O-SII buffer and a systemic risk buffer, as applicable. It is defined in Article 128 CRD IV.
Countercyclical capital buffer (CCyB) A capital buffer intended to ensure that credit institutions accumulate sufficient capital during periods of excessive credit growth to be able to absorb losses during periods of stress. It has been implemented in Europe via Article 130, 135-140 CRD IV and it amounts to 0-2.5% of total risk exposure amount and must be met with CET1 capital, but it can be set at a higher level under certain procedures. The buffer is institution-specific and is calculated as a weighted average of the CCyB rates that apply in the countries where an institution’s credit exposures are located.
Global systemically important institutions (G-SII) buffer A capital buffer that aims to reduce the moral hazard created by the implicit state support and guarantee of bail-out using taxpayers’ money that such institutions enjoy due to their size, cross-
Macroprudential Bulletin, Issue 3, June 2017 40
border activities and interconnectedness. It has been implemented in Europe via Article 131 CRD IV and amounts to 1-3.5% of total risk exposure amount, to be met with CET1 capital, depending on the degree of systemic importance of an institution. Phasing-in arrangements apply between 2016 and 2019.
Leverage ratio The Basel III leverage ratio is defined as Tier 1 capital divided by the bank’s total exposure, expressed as a percentage. The prudential use of a leverage ratio limit is intended to restrict the build-up of leverage in the banking sector and to strengthen the risk-based requirements by adding a simple, non-risk-based backstop.
Other systemically important institutions (O-SII) buffer A capital buffer that aims to reduce the moral hazard created by implicit support and guarantee of bailout using taxpayers’ money that such institutions enjoy due to their size, cross-border activities and interconnectedness. It has been implemented in Europe via Article 131 CRD IV, amounts to 0-2% of total risk exposure amount to be met with CET1 capital, and can be applied to domestically important institutions and to institutions important at EU level.
Sectoral capital requirements (SCR) The prudential rules for the EU banking system provide for the use of more targeted capital-based tools designed to address vulnerabilities that can appear at sectoral level. They can take the form of stricter requirements for loss given default and higher real estate risk weights, which have been implemented via Articles 124, 164 and 458 CRR.
Systemic risk buffer (SRB) A capital buffer applied to the financial sector or to one or more subsets of the sector, in order to prevent and mitigate long-term non-cyclical systemic or macroprudential risks. It must amount to at least 1% of the targeted risk exposure amount to be met with CET1 capital and can be applied to all exposures or to a subset of exposures. A special notification procedure must be followed in order to set the buffer at rates between 3% and 5%. Buffer rates above 5% are possible, but also require special authorisation (e.g. a Commission implementing act).
Liquidity-based instruments
Liquidity coverage ratio (LCR) A short-term liquidity requirement which aims to ensure that credit institutions hold sufficient high-quality liquid assets to withstand an acute stress scenario lasting 30 days. The LCR is calculated in accordance with the following formula: liquidity buffer ÷ net liquidity outflows over a 30 calendar-day stress period = liquidity coverage ratio %. Credit institutions must maintain a liquidity coverage ratio of at least 100%. Phasing-in arrangements apply between 2015 and 2019.
Net stable funding ratio (NSFR) The amount of available stable funding relative to the amount of required stable funding. Available stable funding is the portion of capital and liabilities that is expected to be stable over a one-year time horizon. The amount of funding required of a specific institution is a function of the liquidity characteristics and residual maturities of the various assets held by that institution as well as those of its off-balance sheet (OBS) exposures. The NSFR should be equal to or higher than 100%.
Asset-based measures
Debt service-to-income (DSTI) ratio: A measure of the amount of debt service payments relative to total disposable income. It is frequently used to assess the financial obligations of mortgage-indebted households and their ability to repay debt, and is useful for evaluating their vulnerability to changes in interest rates in countries with a high share of variable rate mortgages.
Large exposures An institution's exposure to a client or group of connected clients, the value of which is equal to or exceeds 10% of its eligible capital. Limits to large exposures can be implemented in Europe via Article 458 CRR.
Loan-to-income (LTI) ratio A ratio of the amount borrowed to the total annual income of a borrower.
Loan-to-value (LTV) ratio The ratio of the amount borrowed to the appraised value or market value of the underlying collateral, usually taken into consideration in relation to loans for real estate financing.

Abbreviations Countries BE Belgium BG Bulgaria CZ Czech Republic DK Denmark DE Germany EE Estonia IE Ireland GR Greece ES Spain FR France
HR Croatia IT Italy CY Cyprus LV Latvia LT Lithuania LU Luxembourg HU Hungary MT Malta NL Netherlands AT Austria
PL Poland PT Portugal RO Romania SI Slovenia SK Slovakia FI Finland SE Sweden UK United Kingdom US United States
In accordance with EU practice, the EU Member States are listed in this report using the alphabetical order of the country names in the national languages. Others ABS Asset-backed security
BCBS Basel Committee on Banking Supervision
BIS Bank for International Settlements
CBR Combined buffer requirement
CCyB Countercyclical capital buffer
CCoB Capital conservation buffer
CET1 Common Equity Tier 1
CRD Capital Requirements Directive
CRR Capital Requirements Regulation
D-SIB Domestic Systemically Important Bank
DSR debt service ratio
DSTI debt-service-to-income
DTI debt-to-income
EAA Euro area accounts
EBA European Banking Authority
ECB European Central Bank
Ecofin Council
EEA European Economic Area
EFSF European Financial Stability Facility
EIOPA European Insurance and Occupational Pensions Authority
EMIR European Market Infrastructure Regulation
EMU Economic and Monetary Union
ESA European Supervisory Authorities
ESCB European System of Central Banks
ESM European Stability Mechanism
ESMA European Securities and Markets Authority
ESRB European Systemic Risk Board
EU European Union
FSB Financial Stability Board
ICPF Insurance corporations and pension funds
IMF International Monetary Fund
IOSCO International Organization of Securities Commissions
ISDA International Swaps and Derivatives Association, Inc.
IRBA internal ratings-based approach
LCR liquidity coverage ratio
LGD loss-given-default
LTD loan-to-deposit
LTI loan-to-income
LTSF loan-to-stable-funding
LTV loan-to-value
MFI Monetary financial institution
MiFID Markets in Financial Instruments Directive
MMF Money market fund
NCA National competent authority
NCB National central bank
NDA National designated authority
NSFR net stable funding ratio
OECD Organisation for Economic Cooperation and Development
OJ Official Journal of the European Union
PD probability of default
RRE residential real estate
RWA risk-weighted assets
SRB Systemic risk buffer
SRM Single Resolution Mechanism
SSM Single Supervisory Mechanism
SSMR Single Supervisory Mechanism Regulation

© European Central Bank, 2017 Postal address 60640 Frankfurt am Main, Germany Telephone +49 69 1344 0 Website www.ecb.europa.eu
All rights reserved. Reproduction for educational and non-commercial purposes is permitted provided that the source is acknowledged.
ISSN 2467-1770 DOI 10.2866/971946 ISBN 978-92-899-2264-7 EU catalogue No QB-CA-17-001-EN-N