Macroeconomic Variables and the Pakistan Stock Market ... · cost in future. Karachi Stock Exchange...
11
www.pbr.co.in www.pbr.co.in Macroeconomic Variables and the Pakistan Stock Market: Exploring Long and Short-Run Relationships Pacific Business Review International Volume 11 Issue 7, January 2019 Abstract The motivation behind this study is to an empirical examination of relationship exist between the stock value (KSE-100 index) and macroeconomic factors (Money supply, Inflation Rate, Interest Rate, and Exchange Rate) by utilizing monthly time series data information covering the period 30th June2009- 30th June 2018. The main target of this investigation is to check the long-run and short-run connection between macroeconomic factors and stock cost by using the different strategies and procedures. The outcomes of Augmented Dickey-Fuller (ADF) and Phillips Perron (PP) unit root test indicated the primary series is non-stationary in level and stationary in the first difference. On a monthly basis by using the Johann-Juselius (1990) multivariate co-integration and Vector Error Correction Model techniques, it is indicated the Pakistani stock market had a long run equilibrium relationship with a set of macroeconomic variables and with the short- term dis-equilibrium corrected at 7.22%.These discoveries are valuable for policymakers; securities exchange controllers, financial specialists, and stock exchange examiners. Keywords: Stock Prices, Macroeconomic variables, Co-integration, VECM. Introduction The stock market has been truly analyzed as an unswerving component to show the financial procedures of the nation. The imperative job of an effectual financial system is to utilize the capital resources meritoriously and proficiently (Ahuja et al., 2012). Be that as it may, existing examination uncovers the logomachies of the matter. The reasonable indulgent of stock & securities exchange determining factor is crucial for financial specialists, controllers, and researchers (Donatas Pilinkus, 2009). Because Mukit (2012) investigated that borrowers request assets from a similar framework with the possibility that they will be obligatory to reimburse the entirety with the financing cost in future. Karachi Stock Exchange (KSE) is the greatest Exchange floor of Asia and greatest one of Pakistan Stock Exchange (PSX). Stock prices are emphatically prejudiced by a set of macroeconomic factors like as Inflation, Gross Domestic Prices and Exchange Rate as well as adversely influenced by Interest Rate (Khan, 2014). Securities are exchanged the optional funds & securities exchange. Security is Sobia Naseem Department of Optimization and Decision Making, Liaoning Technical University, Liaoning, China [email protected] Gao Lei Fu Department of Optimization and Decision Making, Liaoning Technical University, Liaoning, China [email protected] Vu ThiLan Department of Optimization and Decision Making, Liaoning Technical University, Liaoning, China [email protected] Muhammad Mohsin College of Business Administration Liaoning Technical University, China [email protected] Muhammad Zia-Ur-Rehman Department of Management Science, National Textile University, Pakistan [email protected] 62
Transcript of Macroeconomic Variables and the Pakistan Stock Market ... · cost in future. Karachi Stock Exchange...
www.pbr.co.inwww.pbr.co.in
Macroeconomic Variables and the Pakistan Stock Market: Exploring Long and
Short-Run Relationships
Pacific Business Review InternationalVolume 11 Issue 7, January 2019
Abstract
The motivation behind this study is to an empirical examination of relationship exist between the stock value (KSE-100 index) and macroeconomic factors (Money supply, Inflation Rate, Interest Rate, and Exchange Rate) by utilizing monthly time series data information covering the period 30th June2009- 30th June 2018. The main target of this investigation is to check the long-run and short-run connection between macroeconomic factors and stock cost by using the different strategies and procedures. The outcomes of Augmented Dickey-Fuller (ADF) and Phillips Perron (PP) unit root test indicated the primary series is non-stationary in level and stationary in the first difference. On a monthly basis by using the Johann-Juselius (1990) multivariate co-integration and Vector Error Correction Model techniques, it is indicated the Pakistani stock market had a long run equilibrium relationship with a set of macroeconomic variables and with the short-term dis-equilibrium corrected at 7.22%.These discoveries are valuable for policymakers; securities exchange controllers, financial specialists, and stock exchange examiners.
Keywords:
Stock Prices, Macroeconomic variables, Co-integration, VECM.
Introduction
The stock market has been truly analyzed as an unswerving component to show the financial procedures of the nation. The imperative job of an effectual financial system is to utilize the capital resources meritoriously and proficiently (Ahuja et al., 2012). Be that as it may, existing examination uncovers the logomachies of the matter. The reasonable indulgent of stock & securities exchange determining factor is crucial for financial specialists, controllers, and researchers (Donatas Pilinkus, 2009). Because Mukit (2012) investigated that borrowers request assets from a similar framework with the possibility that they will be obligatory to reimburse the entirety with the financing cost in future. Karachi Stock Exchange (KSE) is the greatest Exchange floor of Asia and greatest one of Pakistan Stock Exchange (PSX). Stock prices are emphatically prejudiced by a set of macroeconomic factors like as Inflation, Gross Domestic Prices and Exchange Rate as well as adversely influenced by Interest Rate (Khan, 2014). Securities are exchanged the optional funds & securities exchange. Security is
Sobia NaseemDepartment of Optimization and
Decision Making, Liaoning Technical
University, Liaoning, China
Gao Lei FuDepartment of Optimization and
Decision Making, Liaoning Technical
University, Liaoning, China
Vu ThiLanDepartment of Optimization and
Decision Making, Liaoning Technical
University, Liaoning, China
Muhammad MohsinCollege of Business Administration
Liaoning Technical University, China
Muhammad Zia-Ur-RehmanDepartment of Management Science,
National Textile University, Pakistan
62
www.pbr.co.in 63
Pacific Business Review International
fundamentally a trade of reserve. The exploration of (Adam macroeconomic variables (oil prices, money, private et al., 2008) inferred that change in macroeconomic factors consumption & GDP) by using Australian stock market's is lead to change the structure of stock trade. data for the time of 1960 to 1998.
Skillet et al., (2007) Inflation, Interest and Exchange rate By using Granger non-causality (Azman-Saini & are driving variables which turned into a reason for the Habibullah Law et al., 2006) wrapped up that depreciation change in stock costs. Inflation and stock costs are of Malaysian Ringgit significantly influenced Malaysian adversely identified with one another in the Tokyo stock stock market in the crisis era.The examination of Zhang at trade (TSE) as indicated by Roll and Gaske (1983) and al., (2006) also provides corroborating evidence about Rose, Chen, and Rall (1986). Park (1997's) and short and long-run relation between a meticulous set of (Achsani&Strohe, 2002)examine explores that stock macroeconomic variables stock market of New Zealand. returns are exceptionally contrarily impacted by work Money supply and inflation rate depict a negative impact development and emphatically influenced with GDP. by the Granger causality test. When interest rate increase as Development exercises decline a nation's inflation rateso juxtaposing to other countries foreign investors deposit because of a declining in the expansion rate securities their money instead of risky investment and in case of low-exchange is decidedly influenced. Inflation rate and stock interest rate people invest their money in a stock market cost are randomly identified with one another that's why the impact of the money supply is always (Fama&Schwert, 1977; Schwer at al., 1981). Money negative in New Zealand. Patra and Poshakwale (2006) related approach is connected with stock prices such as concurred that Athens stock market significantly affected Mukit (2012) by applying the co-integration technique, he by macroeconomic variables (inflation, money supply, and concluded that if 1% of changes occur in interest rate and trading activity) for curtail span of time with the unanimity exchange rate so stock price affected 1.71% and 1.04% of Granger causality test and no short or long-run respectively. A long run relationship is observed between equilibrium state observed in stock prices andexchange macroeconomic variables and changes in stock prices rate. Athens stock exchange is inefficient that openly (Fama, 1981, 1990). existing data on macroeconomic factors and exchanging
size can be conceivably utilized in imagining stock prices The study of(Muhammad & Shahid, 2008)also concluded (Khan et al., 2013).that short-run interest rate and money supply are positively
related with stock exchange and negative foreign exchange Inflation and unemployment are highly significant with a reserve & inflation while this relationship changed into negative impact on stock prices (Martin Sirucek, 2012). By opposite when short-runperiodchanges into the long-run using multiple regressions analysis with chronological period. In accordance with the study of Heinz Herrmannet monthly data (MACN Shafana, 2012) observed Sri Lankan al., (2006) that Currency depreciation is converted into an stock exchange positively affected by inflation rate and origin of declining in stock prices for a short run. Ajayi and negatively significant with exchange rate for (January Mougoue (1996) inspected in their examination stock price 2008-2012) four years informational data. Treasury bill negatively affects the estimation of domestic currency for imperceptibly negatively influenced all sectors of share short-run time range while in the long run, this connection prices. Sharma & Mahendru (2010) investigated exchange varies into a positive relationship. rate and gold prices have a long-run relationship with stock
prices as well as both factors highly affected the stock The monetary system unequivocally influenced the market by using Indian stock market data from January economic development of Pakistan (Sara & Levine, 1996). 2008 to January 2009. According to Krishna Reddy The interpretations of Sara and Levine (1996)'s research (2015)'s investigation most of empirical analysis are consist of the positive relation exploration amid economic favored the inconsistency of long and short-run growth and stock because of predestined factors. relationship among stock market and particular set of Assimilation of the (Habib, 1996) inquired a positive macroeconomic variables (Muneer et al., 2017). connection of money supply and stock return in short-run
anyway it may change if there ought to emerge an event of Uncommon and motivating research by Mustafa (2007), long-run. Aforementioned financial reforms, stock prices, investigated an ostentatious relationship of stock market exchange rate and foreign reserve are positively related to and development of a country are directly connected with one another (Muhammad, 2009). the help of co-integration model. A momentous relation is
observed between the exchange rate, oil prices and stock Stock prices negatively related to inflation and call money market index of BRIC(Robert, 2008). A causal relationship (Achsani & Strohe, 2002)whereas a positive influenced via perceived in macroeconomic determining factors and stock money supply, exchange rate, and gross domestic product. prices thorough Johansen's approach of co-integration Chaudhuri & Smiles (2004) described a long run (Ahmed, 2008). Pakistani stock market is based on relationship between stock prices and variations of
www.pbr.co.inwww.pbr.co.in64
Volume 11 Issue 7, January 2019
speculation not on the true fundamentals. Macroeconomic 2018 Pakistan stock market (KSE) is as old as Pakistan. variables significantly affect the Kuala Lumpur Composite Karachi stock exchange founded 14 August 1947 and Index (KLCI) analyzed by the impulse response function, established 18 September 1947 with five companies as Co-integration test, ECM, variance corrosion & the unit KSE-50 with a total market capitalization of US $350,000 root test. Furthermore suggested to Malaysian government (37 million PK rupees). The KSE promoted capital have to be emphasized on policies and strategic formation and facilitated a wide range of participants management for stabilization of stock market (Mohamed et (individual and institutional investors) for the last 70 years. al., 2010). With growing numbers of listed companies and trading
activities, the KSE 100 index (included banking, Maysami and Koh (2000) found that money supply and processing plant, pharmacological, cement, E & P, and so stock return are positively related to each other. Achsani on) was introducedin November 1991. On 20 April 2008 and Strohe (2002) found stock return negatively respond to Pakistani stock exchange achieved 15,737 points for the interest rate and positively respond to oil price and real first time it was 7.4% increase made Pakistan stock economic activity in small regional markets like as Norway exchange had become the high pointe achievers among the (net oil exporting country) and Indonesia. By applying rest of emerging world markets. In rest of 2008 stock some specific test carefully like as Unit Root Test of Ng, market was influenced by inflation, attack of investors at Perron to test for time series properties, Dickey-Fuller and KSE building, Taliban and resignation of President Pervez Philips-Perron and Johansen co-integration test than Musharraf. In 2009 PSX has recovered all negligence of concluded that all macroeconomic variables except money 2008 and again become the third best performer stock supply initially linked negatively with the stock market market of the world. Pakistan delivered 26% equities for (Guneratne & Wickremasinghe, 2006).US dollars in 2015 and maintained the position of the best Pal and Mittal (2011) concluded macroeconomic variables performer stock market of the world. In 2016 stock market have a substantial impact on the stock return of India by showed an upward trend, so investors became confident to using the pre and post-crises data of the stock market. invest in Pakistan stock exchange (PSX). The year 2017-18 Pakistani stock market is an accurate prognosticator of show a mixed performance in volatility perspective. economic activity of country (Kamran &Israr, 2015).
Thisarticle will also verify the relationship of stock prices and macroeconomic variables, by using a set of data from Pakistani economy and its major stock exchange ,i.e., Karachi Stock Exchange. This study enriched the available stock of literature and boost up the present research for better development of Pakistan stock market.
H1= A stable significant long-run relationship exist between macroeconomic variables (M2, IFR, INR & EXR) and stock prices
H2= A stable significant short-run relationship exist between macroeconomic variables (M2, IFR,INR& EXR) and stock prices
Karachi Stock Exchange (KSE 100 index)
The focus of this study is observed the nature of relationship, either long or short-run; between macroeconomic variables and stock prices by applying monthly data over the period of 30th June2009- 30th June
Source of data and description
This study is based on pragmatic research on secondary data. Previous work on this topic also supports that macroeconomic variables and stock market having a relationship with each other, after consulting and studying the literature as well as reviewing the Pakistani economy it's considered that four macroeconomic variables are important to check the relationship with stock prices.
th thMonthly time-series data is usedfrom 30 June2009- 30 thJune 2018. The current data of KSE 100 index from 30
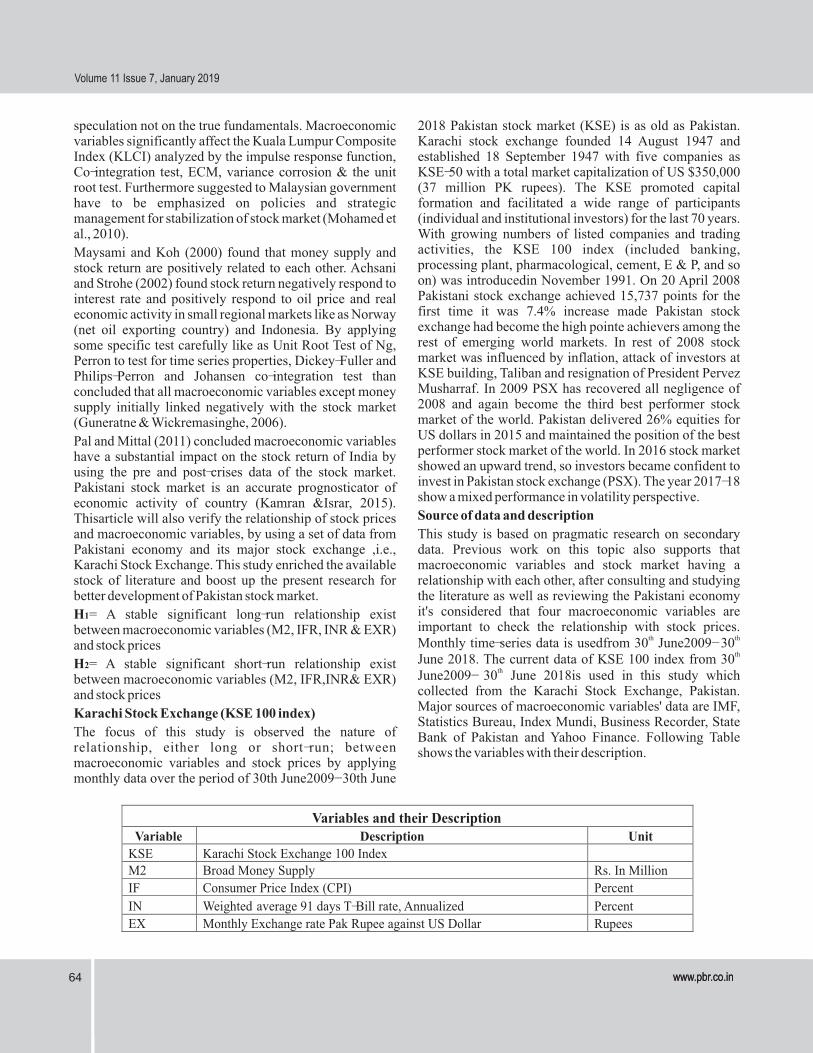
thJune2009- 30 June 2018is used in this study which collected from the Karachi Stock Exchange, Pakistan. Major sources of macroeconomic variables' data are IMF, Statistics Bureau, Index Mundi, Business Recorder, State Bank of Pakistan and Yahoo Finance. Following Table shows the variables with their description.
Variables and their Description Variable Description Unit
KSE Karachi Stock Exchange 100 Index M2 Broad Money Supply Rs. In Million
IF Consumer Price Index (CPI) Percent IN Weighted average 91 days T-Bill rate, Annualized
Percent
EX Monthly Exchange rate Pak Rupee against US Dollar Rupees

www.pbr.co.in 65
Pacific Business Review International
MethodologyTo analyze the coessentiality of relationship, either short or long-run relationship exists among the macro economical variables' set and stock prices in Pakistan by using
. The specific models are given below:Johansen multivariate
co-integration test and Granger-causality
www.pbr.co.inwww.pbr.co.in66
Volume 11 Issue 7, January 2019
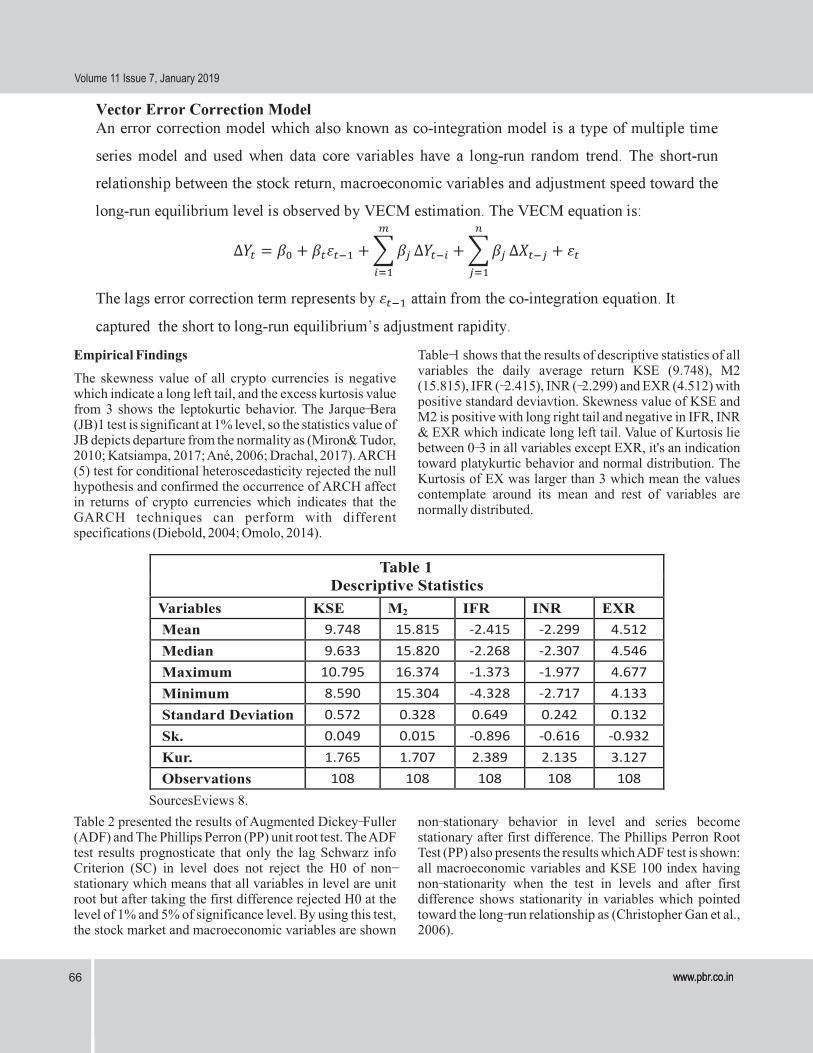
Empirical Findings Table-1 shows that the results of descriptive statistics of all variables the daily average return KSE (9.748), M2
The skewness value of all crypto currencies is negative (15.815), IFR (-2.415), INR (-2.299) and EXR (4.512) with
which indicate a long left tail, and the excess kurtosis value positive standard deviavtion. Skewness value of KSE and
from 3 shows the leptokurtic behavior. The Jarque-Bera M2 is positive with long right tail and negative in IFR, INR
(JB)1 test is significant at 1% level, so the statistics value of & EXR which indicate long left tail. Value of Kurtosis lie
JB depicts departure from the normality as (Miron& Tudor, between 0-3 in all variables except EXR, it's an indication
2010; Katsiampa, 2017; Ané, 2006; Drachal, 2017). ARCH toward platykurtic behavior and normal distribution. The
(5) test for conditional heteroscedasticity rejected the null Kurtosis of EX was larger than 3 which mean the values
hypothesis and confirmed the occurrence of ARCH affect contemplate around its mean and rest of variables are
in returns of crypto currencies which indicates that the normally distributed.
GARCH techniques can perform with different specifications (Diebold, 2004; Omolo, 2014).
Table 1Descriptive Statistics
Variables KSE M2 IFR INR EXR
Mean 9.748 15.815 -2.415 -2.299 4.512
Median 9.633 15.820 -2.268 -2.307 4.546
Maximum 10.795 16.374 -1.373 -1.977 4.677
Minimum 8.590 15.304 -4.328 -2.717 4.133
Standard Deviation 0.572 0.328 0.649 0.242 0.132
Sk. 0.049 0.015 -0.896 -0.616 -0.932
Kur. 1.765 1.707 2.389 2.135 3.127
Observations 108 108 108 108 108
SourcesEviews 8.
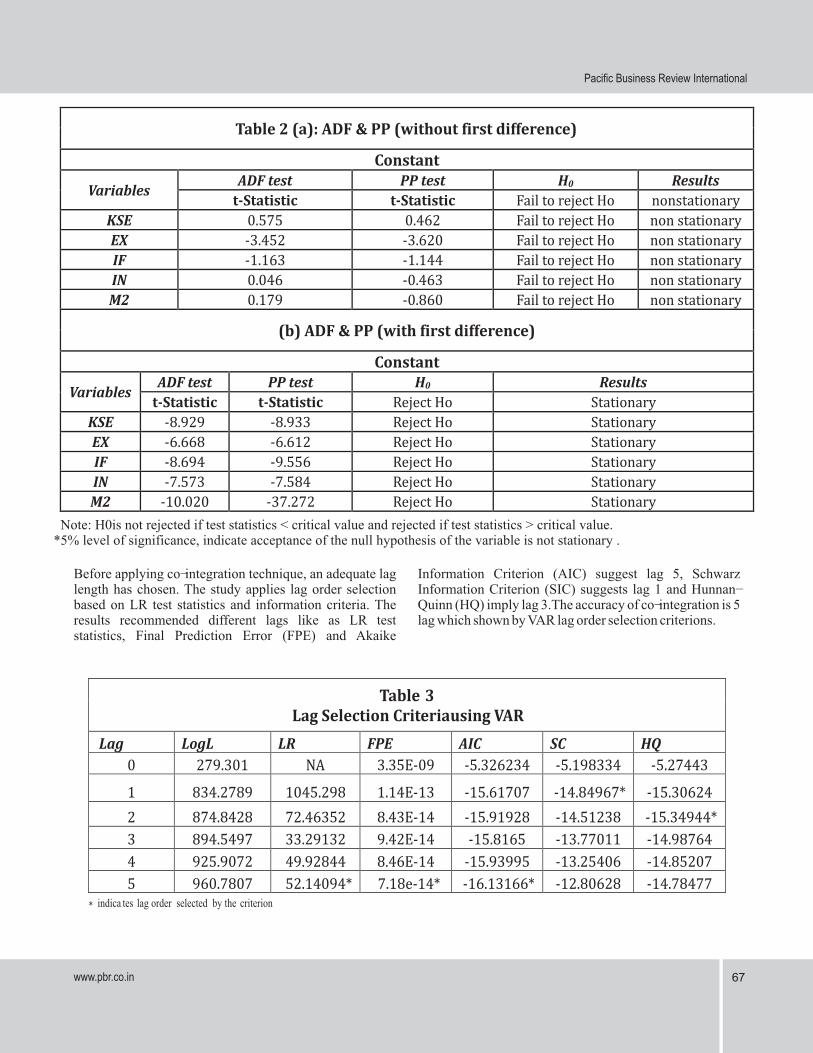
Table 2 presented the results of Augmented Dickey-Fuller non-stationary behavior in level and series become (ADF) and The Phillips Perron (PP) unit root test. The ADF stationary after first difference. The Phillips Perron Root test results prognosticate that only the lag Schwarz info Test (PP) also presents the results which ADF test is shown: Criterion (SC) in level does not reject the H0 of non- all macroeconomic variables and KSE 100 index having stationary which means that all variables in level are unit non-stationarity when the test in levels and after first root but after taking the first difference rejected H0 at the difference shows stationarity in variables which pointed level of 1% and 5% of significance level. By using this test, toward the long-run relationship as (Christopher Gan et al., the stock market and macroeconomic variables are shown 2006).
www.pbr.co.in 67
Pacific Business Review International
Before applying co-integration technique, an adequate lag Information Criterion (AIC) suggest lag 5, Schwarz length has chosen. The study applies lag order selection Information Criterion (SIC) suggests lag 1 and Hunnan-based on LR test statistics and information criteria. The Quinn (HQ) imply lag 3.The accuracy of co-integration is 5 results recommended different lags like as LR test lag which shown by VAR lag order selection criterions. statistics, Final Prediction Error (FPE) and Akaike
Table 2 (a): ADF & PP (without first difference)
Constant
Variables ADF test PP test H0 Results
t-Statistic t-Statistic Fail to reject Ho nonstationary
KSE 0.575 0.462 Fail to reject Ho non stationary
EX -3.452 -3.620 Fail to reject Ho non stationary
IF -1.163 -1.144 Fail to reject Ho non stationary
IN 0.046 -0.463 Fail to reject Ho non stationary
M2 0.179 -0.860 Fail to reject Ho non stationary
(b) ADF & PP (with first difference)
Constant
Variables ADF test PP test H0 Results
t-Statistic t-Statistic Reject Ho Stationary
KSE -8.929 -8.933 Reject Ho Stationary
EX -6.668 -6.612 Reject Ho Stationary
IF -8.694 -9.556 Reject Ho Stationary
IN -7.573 -7.584 Reject Ho Stationary
M2 -10.020 -37.272 Reject Ho Stationary
Note: H0is not rejected if test statistics < critical value and rejected if test statistics > critical value.*5% level of significance, indicate acceptance of the null hypothesis of the variable is not stationary .
Table 3 Lag Selection Criteriausing VAR
Lag LogL LR FPE AIC SC HQ
0 279.301 NA 3.35E-09 -5.326234 -5.198334 -5.27443
1 834.2789 1045.298 1.14E-13 -15.61707 -14.84967* -15.30624
2 874.8428 72.46352 8.43E-14 -15.91928 -14.51238 -15.34944*
3 894.5497 33.29132 9.42E-14 -15.8165 -13.77011 -14.98764
4 925.9072 49.92844 8.46E-14 -15.93995 -13.25406 -14.85207
5 960.7807 52.14094* 7.18e-14* -16.13166* -12.80628 -14.78477 * indica tes lag order selected by the criterion
www.pbr.co.inwww.pbr.co.in68
Volume 11 Issue 7, January 2019
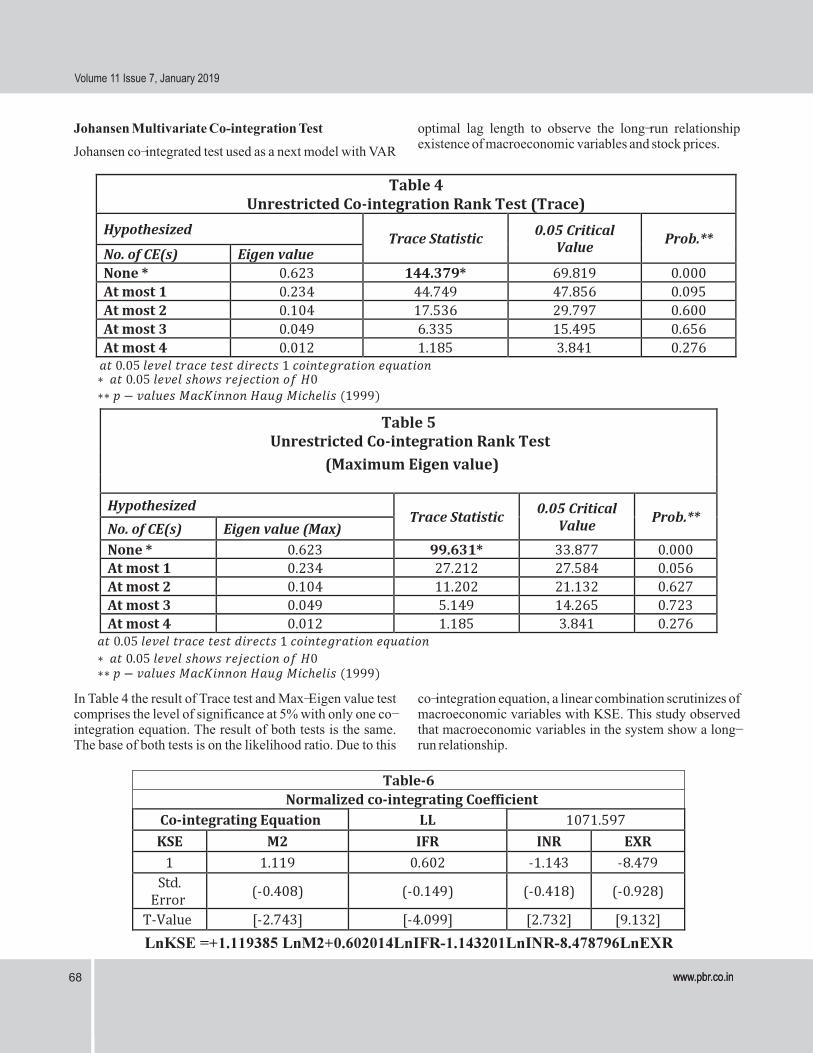
Johansen Multivariate Co-integration Test optimal lag length to observe the long-run relationship existence of macroeconomic variables and stock prices.
Johansen co-integrated test used as a next model with VAR
In Table 4 the result of Trace test and Max-Eigen value test co-integration equation, a linear combination scrutinizes of comprises the level of significance at 5% with only one co- macroeconomic variables with KSE. This study observed integration equation. The result of both tests is the same. that macroeconomic variables in the system show a long-The base of both tests is on the likelihood ratio. Due to this run relationship.

www.pbr.co.in 69
Pacific Business Review International
According to the normalized equation stock prices relation between stock prices and Exchange Rate (LnEXR) (LnKSE) showed a significantly positive relationship with in long-run (Wycliffe and Peter, 2014 and Sharma & money supply (LnM2) in the long run which recommended Mahendru, 2010). that stock market provides evade against inflation
VEC Model(NiranjanPhuyal, 2016; Sohail&Zakir, 2009; Karki, 2017
This model used when analysis deals with multiple time and Barkatet al., 2016).Inflation rate (LnIFR) also series with long-run stochastic trend, it is also known as co-positively related to stock prices (Sohail & Zakir, integration. The short run relationship with stock return and 2009;Khalid, 2017; Karki, 2017). Interest rate (LnINR) has macroeconomic variable as well as adjustment speed a negative impact on stock prices and the previous study toward long run equilibrium level is observed by VECM also supported this relationship (Pilinkus & Boguslauskas, estimation.The VECM equation is:2009; Saifullah Khan, 2017 and Achsani and Strohe, 2002).
Normalized equation showed a negative sign and opposite

www.pbr.co.inwww.pbr.co.in70
Volume 11 Issue 7, January 2019
Conclusion with cash supply and expansion rate through a negative connection with inflation and interest rate. The VECM
This examination discovered the long-run and short-run results expo monthly 7.22% reversion from long-run
association between macroeconomic determining factors instability in short-run. The Wald test exhibited that by
and stock value (KSE 100 index) of Pakistan by utilizing utilizing 5 lags of KSE returns has a short-lived effect on
monthly data information for the time of 2010-2018. This money supply.
investigation comprises of the selected time span It is concluded that a long-run relationship exist between informational data collection of Karachi Stock Exchange macroeconomic variables and stock prices so on the bases (KSE), Money Supply (M2), Inflation Rate (IFR), Interest of this relation predictions can be made by using this Rate (INR) and Exchange Rate (EXR). The ADF and PP research. On the base of analysis some recommendations to test utilized for stationarity property of the time series data enhance the performance of Karachi stock market for information demonstrated every one of the five factors was Government of Pakistan are; Increasing in Bank rates is not nonstationary in level and stationary in the first difference. in favor of a vigorous stock market because rapid Johansen co-integration model used to check the long-term amplification in bank rate becomes the reason for inflation. equilibrium connection of the stock exchange with Inflation is reduced the currency value,and currency macroeconomic factors. The VECM show is utilized to value's depreciation decreases the exchange rate of money. look at the short-run connection between stock price and So we can say that Bank rates are the fundamental problem macroeconomic factors and the speed of adjustment which creates the rest of problematic elements which affect toward the long-run equilibrium level. the economy as well as Pakistan stock exchange. The
The Johansen co-integration test discloses that results of this study will also helpful for domestic and
macroeconomic factors are co-incorporated with stock foreign investors while decision making to invest in
costs which mean variables a long-run relationship be Pakistan stock exchange.
present with stock price. The information investigation Referencessuggested that the macroeconomic factors in particular Abdul Hadi, A. R., Hamad 1, S. A., Yahya 2, M. H., & Iqbal Inflation Rate, Interest Rate, and exchange rate standard
1, T. (2013). Examining Relationship between are bound in long-run congruence connection as well as Palestine Stock Exchange andAmman Stock their variety inclination stock return toward vacillations. It Exchange-Cointegration Approach.International further is seen that there is a positive connection of KSE
The above table-7 presents the coefficient (C1) of the Error run deviation to the level of long-run equilibrium.Coefficient term (ECT) is negatively significant. It is re-
Other Diagnostic Testtestified that variables are co-integrated. The coefficient of
Autocorrelation Testthe error term specifies or pointed out long-run equilibrium adjustment speed whenever there is a disparity. When the
Breusch Godfrey Lm test for Serial Correlationstock price variate from their long-run equilibrium in the
Ho: no serial autocorrelation short-run, it is accurate, and the long run equilibrium is brought back. It is corrected the disequilibrium at the rate of
H1: serial autocorrelation-0.07217 shows that around 7.22% per month of the short-
Breusch-Godfrey test shows that R-squared is insignificant Heteroskedasticity Testat the 5%,so Ho is not rejected. Hence the model is free
Ho= Heteroskedasticity is not presentfrom serial autocorrelation.
H1=Heteroskedasticity is present

www.pbr.co.in 71
Pacific Business Review International
Journal of Business and Management, 13. Khan, F., Muneer, S. & Anuar, M. A. (2013). Relationship between Stock Prices and Economic Variables: Adam, A. M., & Tweneboah, G. (2008). Macroeconomic Sectoral Analysis. Actual Problems of Economics, Factors and Stock Market Movement: Evidence 5(143), 544-553from Ghana. 26.
Kotha, K. (2016). Macroeconomic Factors and the Indian Ahuja, A. K., Makan, C., Chauhan, S., & Kumar, A. (2012). Stock Market: Exploring. International Journal of A Study of the effect of Macroeconomic Variables Economics and Financial.on Stock Market: Indian Perspective. International
business and finance, 43. Lee, m., Yong, H. H., & Zhang, J. (2006). MACROECONOMIC VARIABLES AND Barakat, M. R., Elgazzar, S. H., & Hanafy, K. M. (2016). STOCK MARKETINTERACTIONS: NEW Impact of Macroeconomic Variables on Stock Z E A L A N D E V I D E N C E . I n v e s t m e n t Markets. International Journal of Economics and Management and Financial Innovations, 15.Finance, 13.
MAGHAYEREH, A. (2003). Causal Relations among Bekhet, H. A., &Mugableh 1, M. I. (2012). Investigating Stock Prices and MacroeconomicVariables in the E q u i l i b r i u m R e l a t i o n s h i p b e t w e e n Small, Open Economy of Jordan. JKAU: Econ. & Macroeconomic Variables and Malaysian Stock Adm. , 10.Market Index through Bounds Tests Approach.
International Journal of Economics and Finance, Maysami, R. C., Howe, L. C., & Hamzah, M. A. (2004). 13. The relationship between Macroeconomic
Variables and Stock Market Indices. Jurnal Chittedi*, K. R. (2015). Macroeconomic Variables impact Pengurusan, 30.on Stock Prices in a BRIC Stock Markets: An
Empirical Analysis. Stock & Forex Trading, 7. Muneer, S., Ali, A. & Ahmad, R. A. (2017). Impact of Financing on Small and Medium Enterprises D.gay, R. (2008). Effect of macroeconomic variables on (SMEs) Profitability with Moderating Role of stock market returns. international business & Islamic Finance. Information Management and Economics Research Journal, 8.Business Review, 9(2), 25-32El-Nader 1, H. M.-N., &Alraimony 1, A. D. (2012). The
OKORO, C. O. (2017). MACROECONOMIC FACTORS Impact of Macroeconomic Factors on Amman AND STOCK MARKET PERFORMANCE: Stock Market. International Journal of Economics EVIDENCE FROM. International Journal of and Finance, 12.Social Sciences and Humanities Reviews, 9.Gay, R. D. (2008). Effect Of Macroeconomic Variables on
Osamwonyi, I. O., & Evbayiro-Osagi, E. I. (2012). The Stock Market returns. International Business & Relationship between Macroeconomic Variables Economics Research Journal, 8.andStock Market Index in Nigeria. J Economics, Horobet, A., & Dumitrescu, S. (2006). On the causal 9.relationships between monetary, financial and
Ouma, W. N., & Muriu, D. P. (2014). THE IMPACT OF realmacroeconomic variables: evidence from MACROECONOMIC VARIABLES ON Central and Eastern Europe. international business STOCKMARKET RETURNS IN KENYA. and finance, 22.International Journal of Business and Commerce, Hosseini, S. M., Ahmad, Z., & Lai, Y. W. (2011). The Role 31.of Macroeconomic Variables on Stock Market
Phuyal*, N. (2016). Can Macroeconomic Variables Index in China and India. International Journal of Explain Long-Term Stock Market Movements? A Economics and Finance, 11.Study of Nepali Capital Market. Journal of Kalyanaraman 1, L., &Tuwajri 1, B. A. (2014). Business and Management Research, 13.Macroeconomic Forces and Stock Prices.
Pilinkus, D., & Boguslauskas, V. (2009). The Short-Run International Journal of Financial Research, 12.Relationship between Stock Market Prices and Karki, D. (2017). STOCK MARKET RESPONSES TO M a c r o e c o n o m i c . E C O N O M I C S O F M A C R O E C O N O M I C D Y N A M I C S : ENGINEERING DECISIONS, 9.international economics and finance, 11.
Plíhal 1, T. (2016). Granger Causality Between Khalid, W., & Khan, S. (2017). Effects of Macroeconomic Stockmarket And Macroeconomicindicators: Variables on the StockMarket Volatility: The Evidence From Germany. Acta Universitatis Pakistan Experience. International Journal of Agriculture Et Silviculture Mendelianae Econometrics and Financial Management, 18.

www.pbr.co.inwww.pbr.co.in72
Volume 11 Issue 7, January 2019
Brunensis, 8. From Korea. Research Gate.
Quadir, M. M. (2012). The Effect of Macroeconomic Levine, R., & Zervos, S. (1996). Stock Market Variables On Stock Returns. International Journal Development and Long-Run Growth. The World of Economics and Financial Issues, 8. Bank Economic Review, 10(2), 323-339.
Sahu 2, B., & Kotha, K. K. (2016). Macroeconomic Factors Maysami, R. c., & Koh, T. S. (2000). A Vector Error and the Indian Stock Market. Macroeconomic Correction Model of the Singapore Stock Market. Factors and the Indian Stock Market, 11. International Review of Economics and Finance,
79-96.Shafana, M. (2012). Macroeconomic Variables Effect on Financial Sector Performance in Emerging Sri Muktadir-al-Mukit, D. (2012). Effects of Interest Rate and Lankan Stock Market. International Journal of Exchange Rate on Volatility of Market Index at Science and Research (IJSR), 5. Dhaka Stock. Business and Technology (Dhaka),
1-18.Sirucek, M. (2012). Macroeconomic variables and the stock market: US review. IJCSMS International Park, S. (1997). Rationality of Negative Stock-Price Journal of Computer Science and Management Responses to Strong Economic Activity. Financial Studies, 10. Analysts, 53(5), 52-56.
Wickremasinghe, G. B. (2006). Macroeconomic forces and Patra, T., & Poshakwale, S. (2006). Economic Variables s t o c k p r i c e s . F a c i l i t y o f B u s i n e s s and Stock Market Returns Evidence from the. accounting&Finance paper, 41. Applied Financial Economics, 16, 993–1005.
Abdul Hadi, A. R., Hamad 1, S. A., Yahya 2, M. H., & Iqbal S, K. (2000). Portfolio Management. Delhi: Prentice-Hill.1, T. (2013). Examining Relationship between saini, A., Habibullah, M. S., & hook law, S. (2006). Stock Palestine Stock Exchange andAmman Stock prices, exchange rates, and causality in Malaysia: Exchange-Cointegration Approach. International a note. The ICFAI Journal of Financial Journal of Business and Management, 13. Economics, 7-13.
Ahmed, S. (2008). Aggregate Economic Variables and Soenen, L. A., & Hennigar, E. S. (1991). An analysis of Stock Markets in India. International Research exchange rates and stock prices: the US Journal of Finance and Economics, 141-164. experience between 1980 and 1986. Akron
Ajayi, R., & Mougoue, M. (1996). On the Dynamic Business and Economics Review, 71-76Relation between Stock Prices and Exchange. The 1 Appendix Journal of Financial Research, 193-207. http://www.sbp.org.pk/
Chaudhuri, K., & Smiles, S. (2004). The stock market and https://www.gdpinflation.com/search/label/Pakistan%20aggregate economic activity: evidence from Economic%20IndicatorsAustralia. Applied Financial Economics, (14),
https://www.psx.com.pk/121-129.https://data.worldbank.org/indicatorDumitrescu, S., & Horobet, A. (2008). On the Causal https://www.indexmundi.com/Relationship between Stock Prices and Exchange https://www.brecorder.com/market-data/Rates: Evidence from Romania. Energy Journal,
1-42. Endnotes:Fama, E. F. (1981). Stock returns, real activity, inflation, 1 Mittal and Goyal (2012) explained the Kurtosis value
and money. American Economic Review, 45(4): was more than three mean data is not normally 1089-1108. distributed. The fat-tailed distribution also shows
that the return series entail large positive and Gan, C., Lee, M., Yong, H. H., & Zhang, J. (2006). negative returns, which are not likely to be MACROECONOMIC VARIABLES AND observed in normally distributed returns STOCK MARKET. Investment Management and (Danielsson, 2011). Financial Innovations, 3(4), 89-101.
Geske, R., & Roll, R. (1983). The Fiscal and Monetary Linkage between Stock Returns and Inflation. Journal of Finance, 7-33.
Goswami, G., & Jung, S.-C. (1997 Retrieved April 2012). Stock Market and Economic Forces: Evidence