Macroeconomic Update: Nepal (August 2016) · PDF filecompared to an average 90% in the last...
42
NEPAL VOLUME 4. NO. 2 August 2016 MACROECONOMIC UPDATE
Transcript of Macroeconomic Update: Nepal (August 2016) · PDF filecompared to an average 90% in the last...
NEPALVOLUME 4. NO. 2
August 2016
MACROECONOMICUPDATE


NEPALVOLUME 4. NO. 2
August 2016
MACROECONOMICUPDATE

iv Macroeconomic Update
@2016 Asian Development Bank, Nepal Resident Mission
All rights reserved. No part of this publication may be reproduced, stored in a retrieval system, or transmitted, in any form or by any means, without the prior written permission of the Asian Development Bank (ADB). ADB does not guarantee the accuracy of the data included in this publication and accepts no responsibility for any consequences of their use.
This issue of the Nepal Resident Mission (NRM) Macroeconomic Update was prepared by the following team with overall guidance of Kenichi Yokoyama, Country Director, NRM; Sharad Bhandari, Principal Economist, NRM; Hoe Yun Jeong, Senior Economist, Regional Cooperation and Operations Coordinations Division (SARC); and Masato Nakane Economist, SARC, reviewed the draft and provided comments and suggestions.
Chandan Sapkota, National Graduate Institute for Policy Studies (GRIPS), TokyoNeelina Nakarmi, Economics Analyst, NRM
Supported by: Sangeeta Gurung, Senior Operations Assistant, NRM
The views expressed in the Macroeconomic Update are those of the authors and do not necessarily reflect the views of the ADB, or its Board of Directors, or its member governments.
Asian Development BankNepal Resident MissionMetro Park Building, LazimpatPost Box 5017Kathmandu, NepalTel +977 1 4005120Fax +977 1 [email protected]/nepal

Macroeconomic Update v
CONTENTS
MACROECONOMIC UPDATE PageExecutive Summary viiA. Real Sector 1B. Fiscal Sector 6C. Monetary Sector 11D. External Sector 18
ISSUE FOCUS Efficiency and Integrity in Public Procurement 22
BOXES Box 1: Electricity Demand in 2030 12Box 2: Common Issues in Procurement 23Box 3: Amended PPA and International Best Practices 29Box 4: Post-Procurement: Key Elements of Effective Contract Management 31
APPENDICES Appendix 1: Country Economic Indicators 32Appendix 2: Country Poverty and Social Indicators 33
vi Macroeconomic Update
ABBREVIATIONS
BFI – banks and financial institutions
CAR – capital adequacy ratio
CPI – consumer price index
FDI – foreign direct investment
FY – fiscal year
GDP – gross domestic product
GFCF – gross fixed capital formation
GNDI – gross national disposable income
GNI – gross national income
LDC – Least Developed Country
M2 – Money supply
NEA – Nepal Electricity Authority
NOC – Nepal Oil Corporation
NRB – Nepal Rastra Bank
PE – public enterprises
PPA – public procurement act
PRC – People’s Republic of China
SDG – Sustainable Development Goals
VAT – value added tax
NOTE(i) The fiscal year (FY) of the Government ends on 15 July. FY before a calendar year denotes
the year in which the fiscal year ends, e.g., FY2016 ends on 15 July 2016.
(ii) In this report, “$” refers to US dollars.

Macroeconomic Update vii
1. The lingering impact of the catastrophic earthquakes in FY2015, slow post-earthquake reconstruction, and crippling trade and supply disruption resulted in gross domestic product (GDP) growth of just 0.8% in FY2016. The earthquake-led disruption of economic activities, especially in agricultural and industrial production, struggled to recover as reconstruction and rehabilitation efforts could not pick up speed. This was exacerbated by the trade and supply disruption between September 2015 and February 2016. The combined effect was quite disruptive for the economy as GDP growth dipped to its lowest level since FY2002. Agricultural output grew by an estimated 1.3%, marginally higher than 0.8% in FY2015. Meanwhile, industrial output registered a negative growth of 6.3% in FY2016, sharply down from 1.5% growth in FY2015. The services sector, which accounts for about 53% of GDP and is the key driver of GDP growth, grew by 2.7%, lower than 3.6% after the earthquake in FY2015 and 6.2% in FY2014. The outlook for FY2017 is moderately optimistic and hinges on the scale of recovery of agricultural output given the normal monsoon, the scope and pace of post-earthquake reconstruction and rehabilitation, budget execution, and remittance inflows. Considering these factors, GDP growth is forecast at 4.8% in FY2017.
2. The trade and supply disruption affected public spending although the pattern of spending, with heavy bunching up in the last quarter, was no different from previous years. Capital spending stalled for almost five months as the severe shortage of fuel and construction materials paralyzed project implementation as well as post-earthquake reconstruction. Budget under-execution has been a major fiscal issue in Nepal. The estimated actual capital spending was just 56.3% of planned capital spending in FY2016, sharply down from about 76% in the last five years. Meanwhile, actual recurrent spending was 75.6% of planned recurrent spending in FY2016, a significant drop compared to an average 90% in the last five years. Overall, expenditure grew by 13%, with recurrent and capital spending growth at 7.9% and 32.6%, respectively— lower than the growth rates in FY2015.
3. The continuous reforms in revenue administration, gradual broadening of the tax base, and the higher import
bill (mostly financed by remittance income) resulted in robust revenue performance over the last decade. Total revenue grew by 18.9%, higher than the 13.7% growth in FY2015 but lower than the 20.5% growth in FY2014. Despite the five months long trade and supply disruption, revenue growth accelerated in the last five months of FY2016 as imports gradually normalized along with the clearance of the backlog of goods stuck at various customs points along the Nepal-India border. As a share of GDP, tax revenue mobilization increased significantly, reaching 18.8% of GDP in FY2016, up from 9.8% of GDP in FY2007. Non-tax revenue amounted 2.7% of GDP in FY2016. Total revenue growth averaged 20% in the last five years.
4. The robust revenue mobilization but disappointing expenditure performance resulted in a fiscal surplus equivalent to 1.4% of GDP in FY2016. The country ran a fiscal surplus in FY2013 and FY2014, but a fiscal deficit (of about 0.7% of GDP) in FY2015. For a country with one of the lowest per capita incomes in Asia, running a fiscal surplus indicates chronic problems associated with budget execution. A fiscal policy anchored on a modest deficit to finance productivity-enhancing infrastructure would not jeopardize fiscal sustainability. Nepal faces an estimated infrastructure financing gap of between 8% and 12% of GDP annually until 2020. Ramping up public spending on physical and social infrastructures, including those related to post-earthquake reconstruction, is essential for accelerated, employment-centric and inclusive economic growth. Primary surplus— fiscal balance before interest payment on public debt— increased to 3.8% of GDP. Nepal has been running a primary surplus since FY2012. Combined with the low and declining outstanding public debt (about 27.6% of GDP), it indicates that the government has ample fiscal space to ramp up productivity-enhancing public capital investment without jeopardizing fiscal sustainability. However, a major constraint for doing that is the eroding expenditure absorption capacity.
5. Inflation (year-on-year average consumer price index [CPI]) increased by 9.9%, higher than 7.2% increase in FY2015, as the unfavorable monsoon affected agricultural output and the trade disruption created a severe shortage
Executive Summary
Macroeconomic Update vii

viii Macroeconomic Update
of essential goods, including cooking gas and petroleum products. Overall, food prices and non-food prices contributed 4.8 and 5.1 percentage points to overall inflation. Looking forward, the expected bumper agricultural harvest due to the normal monsoon, expected subdued inflation in India, low fuel and commodity prices and normalization of trade and supplies will likely lower general prices of goods and services in FY2017 despite the demand-side pressures emanating from the earthquake related fiscal stimulus, especially the committed $2000 grant to over half a million affected households. Consequently, food and non-food inflation are projected to contribute 4.3 and 4.2 percentage points, respectively to overall inflation forecast of 8.5% in FY2017. The possibility of supplies disruption arising from natural disasters and political instability is a major downside risk to the inflation forecast.
6. Money supply (M2) grew by 19.5%, reaching NRs366.8 billion, supported by a robust increase in net foreign assets. However, it is marginally lower than the 19.9% growth in FY2015 owing to the decrease in net domestic assets. The BFIs mobilized NRs328 billion (reaching a total NRs2016.8 billion) in deposits in FY2016, higher than NRs282 billion mobilized in FY2015, as higher remittance inflows (despite the decrease in the number of migrant workers) and slower government expenditure boosted deposits. Total credit (loans and advances) of BFIs increased by 23.3% (NRs360 billion) in FY2016, up from 17.5% growth in FY2015 (NRs229.3 billion). Credits by commercial banks grew by 25.9% (NRs327.9 billion), up from a rate of 18.8% in FY2015. Responding to the persistent excess liquidity in the banking sector in FY2016, the Nepal Rastra Bank (NRB) mopped up liquidity equivalent to NRs235.9 billion through reverse repo auctions— one of the short-term tools used by the central bank to manage liquidity— at weighted interest rates between 0.0001% and 1.3%; NRs9 billion through outright sale auctions at weighted interest rate between 1.06% and 2.88%; NRs297.5 billion through deposit auction at a weighted interest rate of 0.85%; and NRs49.1 billion by selling NRB bonds. The short-term interest rates fluctuated throughout the year and were slightly higher than in the corresponding months in FY2015.
7. The balance of payments surplus reached $1.8 billion (8.5% of GDP) in FY2016, up from $1.4 billion in the previous year. The large merchandise trade deficit, which declined to 30.3% of GDP from 31.3% of GDP in FY2015, was partially offset by workers’ remittances, which hit a record
29.6% of GDP, resulting in a current account surplus of $1.3 billion (6.2% of GDP), up from 5.1% of GDP in FY2015. Meanwhile, FDI inflows increased to $55.8 million from $44.2 million in FY2015. Gross foreign exchange reserves increased from $8.1 billion in FY2015 to $9.7 billion in FY2016, sufficient to cover 14.1 months of import of goods and non-factor services. The Nepalese rupee continued to remain weak against the US dollar, closely following movement of the Indian rupee, to which the currency is pegged since 1993. Overall, the Nepalese rupee depreciated by 5.2% between mid-July 2015 and mid-July 2016.
8. This edition of Macroeconomic Update’s issue focus delves into the efficiency and integrity of public procurement and its effects on accelerating inclusive economic growth. Many medium to large-scale development projects in Nepal are plagued by implementation delays and cost overruns. At the core of such recurrent hurdles is inefficient public procurement, contributed by a slew of factors such as legal and policy complications, poor performance of contractor, lack of required human resources to manage contract and high staff turnover, political meddling at management and operational levels, weak leadership by project directors, and prolonged delays by oversight and judicial agencies to clear contentious procurement. Consequently, project implementation is slow with cost and time overruns, quality and scale of infrastructure construction is not up to the taxpayers’ expectation, and disbursement is slow and below target. All these result in sluggish economic growth and insufficient jobs creation.
9. Efficiency and integrity in public procurement (of goods, works and services) accelerate project implementation, which in turn enhances capital spending and positively affects economic growth, research and development (innovation), stimulation of private sector activities and jobs creation. Furthermore, if done in the right way and on time to maximize the value for taxpayers’ money, public procurement could be used as a strategic policy tool to address the myriad of economic, social and environmental challenges faced by the country. Hence, efficiency and integrity in public procurement— equivalent to around 12% of GDP— is vital to not only accelerate project implementation, but also to achieve medium-term goal of graduation from LDC category and long-term goal to be a middle income country by 2030, which also is the target date to achieve the Sustainable Development Goals (SGDs).
viii Macroeconomic Update

Macroeconomic Update 1
MACROECONOMIC UPDATEA. Real Sector
I. Performance in FY20161. The lingering impact of the catastrophic earthquakes in FY2015, slow post-earthquake reconstruction, and the trade and supplies disruption resulted in gross domestic product (GDP) growth of just 0.8% in FY2016 (Figure 1). The earthquake-led disruption of economic activities, especially in agriculture and industry, struggled to recover as reconstruction and rehabilitation efforts failed to pick up speed. This was exacerbated by the trade and supply disruption between September 2015 and February 2016. The combined effect was harmful for the economy as GDP growth dipped to its lowest level since FY2001.
2. In the agricultural sector, which comprises almost 33% of GDP and provides livelihood to about 76% of households, growth failed to pick up steam as the displacement of agricultural households after the earthquake and the loss of agricultural land due to landslides led to low production in western and mid-western regions. Furthermore, the unfavorable monsoon and prolonged drought affected paddy, wheat, millet and dairy output. Paddy and wheat output, which together account for about one-fourth of agricultural value added, declined by 10.2% and 5%, respectively. Consequently, overall agricultural output grew by an estimated 1.3%, marginally higher than 0.8% in FY2015. Agricultural output has been low and volatile for the last few years due to the absence of year round irrigation facilities, sporadic shortage of chemical fertilizers and unfavorable monsoon. Agricultural output growth averaged 2.5% in the last five years.
3. The industrial sector, which comprises a mere 14% of GDP, suffered the most because of the trade and supply disruption. Overall industrial output registered a negative growth of 6.3% in FY2016, sharply down from 1.5% growth in FY2015. Manufacturing was hit the hardest as it’s output decreased by 10.1% owing to the severe shortage of fuel and raw materials. The decrease in quarrying of stones, pebbles, sand and soil in the earthquake affected districts and the temporary moratorium on construction of houses contributed to the negative growth of 6.5% of mining and quarrying. Manufacturing, accounting for about 6% of GDP, is also plagued by long-standing supply-side constraints (notably the lack of adequate electricity, adverse industrial relations, lack of capable human resources and policy bottlenecks). Electricity, gas and water output decreased by 1.7% as the hydroelectricity projects affected by the earthquake could
Figure 1: Contributions to GDP growth (% points)
Note: R and P denote revised and provisional estimates, respectively. Any reference to GDP for FY2015 and FY2016 in this Macroeconomic Update refers to revised and provisional estimates, respectively.
Source: Central Bureau of Statistics, NRM staff estimates.

2 Macroeconomic Update
not resume generation on time. Furthermore, the overall electricity generation dropped due to the low water level, which affected most of the run-of-the-river hydropower projects, caused by the prolonged drought. Construction activities decreased by 4% with the closure of firms and shortage of raw materials, including imports. The average capacity utilization1 of key industries decreased to about 40% from 52% in FY2015. Industrial output growth averaged 1.6% in the last five years.
4. The services sector, which accounts for about 53% of GDP and is the key driver of GDP growth, grew by 2.7%, lower than 3.6% after the earthquake in FY2015 and 6.2% in FY2014. Its output growth, propelled by remittance-induced consumption demand, averaged 4.6% in the last five years. Wholesale and retail trade, which accounts for about 13% of GDP and is the largest sub-sector save agriculture and forestry, growth declined by 1.1% as the trade and supply disruption affected agricultural and industrial output, and import growth plunged down to 7.1%. There was a severe shortage of wholesale and retail items and fuel, which are largely imported and transacted by small and medium enterprises. Similarly, the decline in tourist arrivals and the shortage of fuel and necessary goods affected air transport and hotel and restaurant business. Many small and medium scale firms in the tourism industry are yet to resume operations after the earthquake. The shortage of fuel and goods further dampened the prospects for early recovery. While hotels and restaurant activities decreased by 4.9%, transport, storage and communications sub-sector growth slowed down to 2.6% from 6.2% in FY2015. Mechanized and non-mechanized transport related value added transactions were curtailed by the shortage of fuel (Figure 2).
5. The insurance and banking transactions slightly recovered after the earthquake and were not significantly affected by the earthquake, resulting in financial intermediation growth of 3.3%, up from 2.9% in FY2015. Additionally, real estate and renting business, which suffered heavily after the earthquake, recovered modestly in FY2016 as land and housing transaction increased in urban areas. Real estate, renting and business activities grew by 3.7%, up from 0.8% in FY2015. Public administration and defense grew by 5.8%, marginally higher than 5.4% in FY2015. Similarly, despite the shortage of fuel and disruption after the earthquake, education
1 Capacity utilization of key industries in FY2013 was 57.8%, the same as in FY2012. In FY2014, it averaged 59.3%.
Table 1: Sub-sectoral growth and share of GDP
Growth Share of GDP
Sub-sector FY2015R FY2016P FY2015R FY2016P
Agriculture & forestry 0.7 1.1 32.7 32.8
Fishing 7.1 11.8 0.6 0.7
Mining & quarrying 2.3 -6.5 0.4 0.4
Manufacturing 0.4 -10.1 6.7 6.0
Electricity, gas & water 1.0 -1.7 2.1 2.1
Construction 2.9 -4.0 5.9 5.7
Wholesale & retail trade 2.1 -1.1 13.3 13.1
Hotels and restaurants 3.3 -4.9 1.8 1.7
Transport, storage & communications 6.2 2.6 10.4 10.6
Financial intermediation 2.9 3.3 4.0 4.1
Real estate, renting & business activities 0.8 3.7 7.7 7.9
Public administration & defence 5.4 5.8 1.8 1.9
Education 3.7 6.7 6.7 7.1
Health & social work 10.5 8.8 1.6 1.7
Community, social & personal services 4.4 5.6 4.2 4.4
Source: Central Bureau of Statistics

Macroeconomic Update 3
sector grew by a robust 6.7% in FY2016. Following the spike in health services and social work immediately after the earthquake, FY2016 saw a slight moderation in its growth to 8.8%. Community, social and personal services grew by 5.6%, up from 4.4% in FY2015, thanks to relatively better budget execution in community and social activities and the improved business of private television, radio and entertainment operations.
6. Consumption2 accounted for an estimated 94.7% of GDP in FY2016, up from 91.2% of GDP in FY2015, stimulated by growing remittance income. Gross capital formation decreased to 34% of GDP in FY2016 from 38.8% of GDP in FY2015, largely reflecting the decrease in private gross fixed capital formation (GFCF) and change in stocks. An unfavorable investment climate led to a decrease in total GFCF to 25% of GDP in FY2016 from 27.7% of GDP a year earlier.3 GFCF averaged 23.9% of GDP in the last five years. Public GFCF stood at 5.9% of GDP, which needs to be drastically increased to close the infrastructure financing gap (estimated to be between 8% and 12% of GDP annually till 2020). Currently, Nepal’s level of fixed capital investment is lower than the least developed country average. Short-term measures to accelerate inclusive growth by boosting public capital investment (which is complimentary to private capital investment) and long term structural reforms for higher
2 The GDP by expenditure data are prone to measurement errors as change in stocks is computed residually, which also includes statistical discrepancy/errors. Change in stocks was estimated to be 8.9% of GDP in FY2016, slightly down from 11% of GDP in FY2015. A large residual indicates that a significant portion of the GDP is either unexplained or could not be directly attributed to its components, i.e. consumption, capital formation and net exports.
3 Even with this level of investment, the impact on growth and employment is nominal, most probably due to the inefficiency of investment management arising from the lack of efficiency-enhancing prerequisites related to physical and social infrastructures, and the inability to unwind expenditures in underperforming and unfeasible projects.
Figure 2: Sub-sectoral growth in FY2016 (% change)
Source: Central Bureau of Statistics

4 Macroeconomic Update
and inclusive economic growth are required. It means creating the favorable conditions for productivity and efficiency enhancing public and private investment in physical and social infrastructures.
7. Foreign direct investment (FDI) commitment: FDI commitment, approved by the Department of Industry, sharply decreased to NRs15.1 billion from NRs67.4 billion in FY2015 (Figure 3). It translates into a negative growth of 77.5% compared to a positive 235.1% in the previous year. Consequently, as a share of GDP, it stood at 0.7% in FY2016. Except for manufacturing and services, FDI commitment in other sectors declined sharply. While FDI commitment in energy sector constituted 80.6% of total FDI commitment in FY2015, its share dropped to a mere 12.1% in FY2016. The unfavorable business environment, caused by the crippling fuel and supplies shortage and the long pending investment reforms, deterred FDI commitments. Actual FDI inflows were a mere 0.3% of GDP.
8. Both import and export of goods and non-factor services decreased because of the trade disruption, resulting in narrowing down of trade deficit (Figure 4). Exports decreased to 10.7% of GDP from 11.7% of GDP in FY2015. Similarly, imports decreased to 39.4% of GDP from 41.7% of GDP a year earlier. Consequently, trade deficit decreased to 28.7% of GDP from 30% of GDP in FY2015. Nepal’s export performance has been weak due to factors such as: (i) lack of adequate and quality infrastructure; (ii) political instability and strikes; (iii) recurring labor disputes; (iv) lack of skilled human resources; (v) deficient research and development and innovation in the private sector; and vi) policy inconsistencies and implementation paralysis.4
Moreover, higher inflation rate in Nepal vis-a-vis India in the recent years poses an additional challenge to the competitiveness of Nepali products.
9. Gross domestic savings declined to an estimated 5.3% of GDP from 8.8% of GDP in FY2015 and 11.9% of GDP in FY2014, indicating that a majority of the resident’s income is spent on consumption, which is mostly met by imported goods. Meanwhile, the high gross national savings— 42.9% of GDP, slightly down from 43.9% of GDP in FY2015— reflects the increasing remittance inflows. Higher gross national savings relative to gross capital formation has resulted in a positive savings-investment gap5 (an estimated 9% of GDP in FY2016, up from 5.1% of GDP in FY2015).
10. Nominal per capita GDP and nominal per capita gross national income (GNI) are estimated to be around $746 and $760 in FY2016. They were $762 and $775, respectively, in FY2015 (Figure 5). Similarly, nominal per capital gross national disposable income (GNDI), which
4 For more on Nepal’s export competitiveness, see the issue focus section of Macroeconomic Update, Vol.2, No.1, February 2014. 5 Computed as the difference between gross national savings and gross capital formation (or gross investment). Saving and investment figures in FY2016 are provisional estimates,
hence do not match with current account balance.
Figure 5: Nominal GDP and per capita GDP
Source: Central Bureau of Statistics; NRM staff estimates
0
5
10
15
20
25
0
100
200
300
400
500
600
700
800
900G
DP
($ b
illio
n, c
urre
nt p
rices
)
Per c
apita
GD
P ($
, cur
rent
pric
es)
GDP ($ billion) Per cap ta GDP ($)
Figure 3: FDI commitment and actual inflow
Source: Department of Industry, Nepal Rastra Bank
0
10
20
30
40
50
60
70
80
FY2010 FY2011 FY2012 FY2013 FY2014 FY2015 FY2016
Energy Service Manufacturing
Tourism Agriculture Mineral
Construction Total FDI commitment Actual FDI inflows
Figure 4: Share of GDP by expenditure
Source: Central Bureau of Statistics

Macroeconomic Update 5
includes net transfer such as remittances, decreased to $1,027 from $1,030 in FY2015. The size of the economy marginally contracted to $21.2 billion from $21.4 billion in the previous year.
II. FY2017 Growth Outlook11. The outlook for FY2017 growth is moderately optimistic and hinges on the scale of recovery of agricultural output given the normal monsoon, the scope and pace of post-earthquake reconstruction and rehabilitation, budget execution, and remittance inflows. The monsoon rains were above normal6 and on time unlike in the past few years. Approximately, 80% of total rainfall occurs between June and September. The Ministry of Agricultural Development estimated that paddy transplantation has been higher than in previous years. Paddy transplantation averaged about 95% of 1.4 million hectares of rice field by the first week of August, much higher than 75% in FY2015. However, widespread flooding in the Terai region and mid-Hills, and landslides caused some damage to crops during the last week of July and the first week of August. The outlook for industrial and services output is contingent upon the evolving political situation, reconstruction work, pace of budget execution, recovery of tourism sector and remittance inflows. The scope and pace of reconstruction projects will affect demand for quarrying, manufacturing and construction activities, which largely dictates the trajectory of industrial output. Timely, effective and judicious budget execution, which includes both accelerated spending and reform measures, will be at the core of industrial and services sector recovery. Similarly, a slowdown in the growth of overseas migrants is bound to affect remittance inflows, which subsequently would affect the major components in the services sector.
12. Considering these developments and a cautiously optimistic outlook on reconstruction and political situation, GDP growth (at basic prices) is forecast at 4.8%, lower than the government’s target of 6.5% announced in the FY2017 budget speech (Figure 6). Agriculture, industry and services outputs are expected to contribute 0.7, 1.0 and 3.0 percentage points. A downside risk to the forecast is the more than expected damage caused by natural disasters, especially flooding and landslides, to agricultural output; slow rehabilitation and reconstruction works; the slow pace of budget execution; and depressed demand in services sector arising from the deceleration of remittance inflows.
6 The India Meteorological Department forecast normal to above normal monsoon in FY2017. The seasonal monsoon rainfall is projected to be 98% of long period average, which refers to the 50 year average. For more, see 25 August 2016 monsoon update: http://www.imd.gov.in/pages/press_release_view.php?ff=20160825_pr_52
Figure 6: Sectoral contribtions to growth (percentage points)
f = forecastSource: Central Bureau of Statistics, NRM staff estimates.

6 Macroeconomic Update
B. FISCAL SECTOR
I. Expenditure performance13. The trade disruption and supplies disruption affected public spending although the pattern of spending, with heavy bunching in the last quarter, was no different from previous years. Capital spending stalled for almost five months as the severe shortage of fuel and construction materials paralyzed project implementation as well as post-earthquake reconstruction initiatives. The estimated actual capital spending was just 56.3% of planned capital spending in FY2016, sharply down from about 76% in the last five years. Meanwhile, actual recurrent spending was 75.6% of planned recurrent spending in FY2016, a significant drop compared to an average 90% in the last five years (Figure 7). Overall, expenditure grew by 13%, with recurrent and capital spending growth at 7.9% and 32.6%, respectively— lower than the growth rates in FY2015 (Figure 8).
14. Within recurrent spending7 compensation of employees is estimated to have increased by 18.6%, use of goods and services8 by 71.1%, grants to local bodies by 16.5%, subsidies9 by 59.4%, and social security by 29.1% . Overall, recurrent expenditures are estimated to be 16.3% of GDP, marginally higher than 16% of GDP in FY2015. The government had planned to spend 21.5% of GDP in FY2016 (Figure 9).
15. The estimated capital spending stood at 5.2% of GDP against 9.3% of GDP planned for FY2016. Apart from the effect of trade and supply disruption, other persistent factors impeding capital spending are: (i) lack of project readiness, in terms of timely preparatory activities such as detailed project design, land acquisition, establishment of project management offices and required personnel, and procurement plans; (ii) delays in project approval and budget release; (iii) delays in procurement related processes; and (iv) overall weak project planning, implementation and contract management capacity.10 Increasing the quantum and quality capital spending is crucial to building the necessary infrastructure to graduate from Least Development Country (LDC) category to a developing status by 2022, and the long-term goal of becoming a middle income country by 2030.
16. Within capital spending, although vehicle purchase declined by 29.2%, all other components grew by over double digits. Spending
7 Breakdown of recurrent and capital spending is sourced from FY2017 budget speech, which included estimated spending. The updated figures from FCGO were not available during the analysis of fiscal data for this Macroeconomic Update. These estimated spendings are much higher than those reported by FCGO.
8 Use of goods and services consists of (i) rent & services; (ii) operation and maintenance of capital assets; (iii) office materials and services; (iv) consultancy and other services fee; (v) program expenses; (vi) monitoring, evaluation and travel expenses; (vii) recurrent contingencies; and (viii) miscellaneous.
9 Subsidies include direct subsidies to non-financial public corporations and private enterprises only. Actual direct and indirect subsidies are much higher. It does not include subsidies for chemical and organic fertilizers, micro-hydropower projects, transportation subsidy for seed and fertilizer supply, and interest subsidies to farmers groups and cooperatives, among others.
10 The lengthy processes taken by various oversight bodies and aversions to decision-making have also contributed to the delay in project implementation.
Figure 8: Growth rate of total, recurrent and capital expenditure (% change)
Source: Financial Comptroller General Office; NRM staff estimates
0
20
40
60
80
100
120
FY2006 FY2007 FY2008 FY2009 FY2010 FY2012 FY2013 FY2014 FY2015 FY2016RE
Recurrent Capital Total expenditure
Figure 9: Recurrent budget (% of GDP)
Source: Ministry of Finance; NRM staff estimates
Figure 7: Absorption capacity (% of allocation)
Source: Financial Comptroller General Office; NRM staff estimates
Macroeconomic Update 7
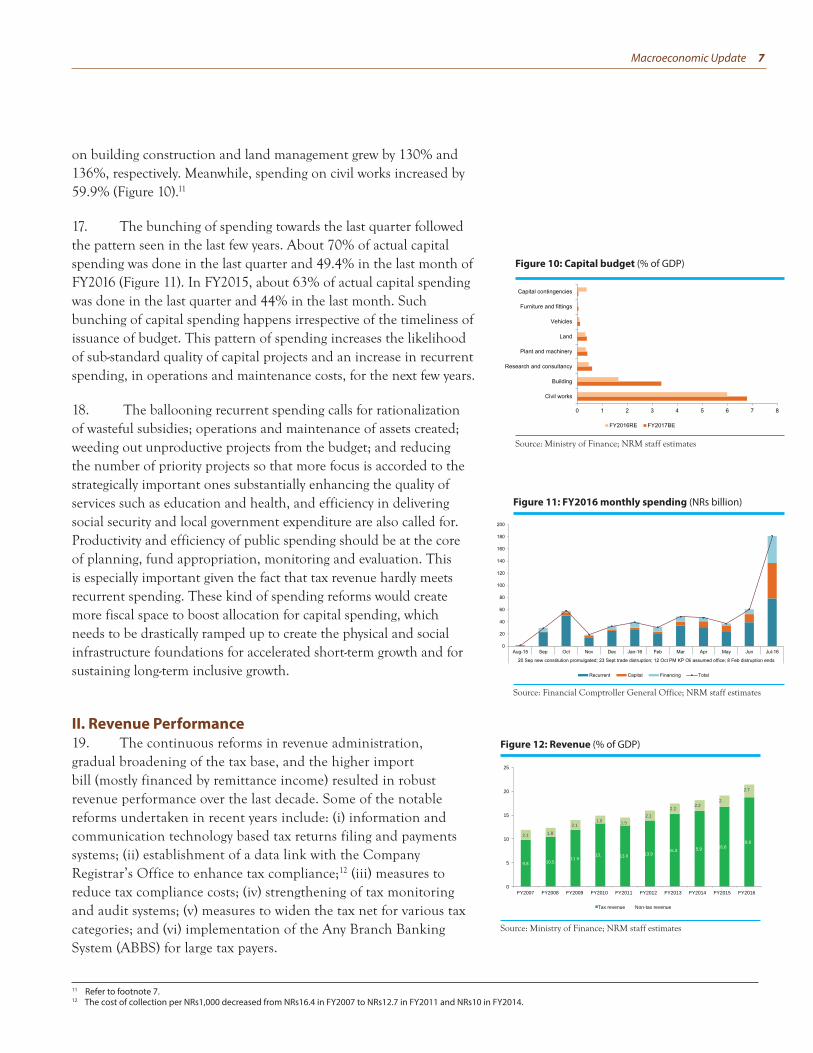
on building construction and land management grew by 130% and 136%, respectively. Meanwhile, spending on civil works increased by 59.9% (Figure 10).11
17. The bunching of spending towards the last quarter followed the pattern seen in the last few years. About 70% of actual capital spending was done in the last quarter and 49.4% in the last month of FY2016 (Figure 11). In FY2015, about 63% of actual capital spending was done in the last quarter and 44% in the last month. Such bunching of capital spending happens irrespective of the timeliness of issuance of budget. This pattern of spending increases the likelihood of sub-standard quality of capital projects and an increase in recurrent spending, in operations and maintenance costs, for the next few years.
18. The ballooning recurrent spending calls for rationalization of wasteful subsidies; operations and maintenance of assets created; weeding out unproductive projects from the budget; and reducing the number of priority projects so that more focus is accorded to the strategically important ones substantially enhancing the quality of services such as education and health, and efficiency in delivering social security and local government expenditure are also called for. Productivity and efficiency of public spending should be at the core of planning, fund appropriation, monitoring and evaluation. This is especially important given the fact that tax revenue hardly meets recurrent spending. These kind of spending reforms would create more fiscal space to boost allocation for capital spending, which needs to be drastically ramped up to create the physical and social infrastructure foundations for accelerated short-term growth and for sustaining long-term inclusive growth.
II. Revenue Performance19. The continuous reforms in revenue administration, gradual broadening of the tax base, and the higher import bill (mostly financed by remittance income) resulted in robust revenue performance over the last decade. Some of the notable reforms undertaken in recent years include: (i) information and communication technology based tax returns filing and payments systems; (ii) establishment of a data link with the Company Registrar’s Office to enhance tax compliance;12 (iii) measures to reduce tax compliance costs; (iv) strengthening of tax monitoring and audit systems; (v) measures to widen the tax net for various tax categories; and (vi) implementation of the Any Branch Banking System (ABBS) for large tax payers.
Figure 10: Capital budget (% of GDP)
Source: Ministry of Finance; NRM staff estimates
Figure 11: FY2016 monthly spending (NRs billion)
Source: Financial Comptroller General Office; NRM staff estimates
11 Refer to footnote 7.12 The cost of collection per NRs1,000 decreased from NRs16.4 in FY2007 to NRs12.7 in FY2011 and NRs10 in FY2014.
Figure 12: Revenue (% of GDP)
Source: Ministry of Finance; NRM staff estimates
9.8 10.5 11 9
13. 13 0 13.9 15.3 5.9 16.8
8.8 2.1 1.8
2.1 1.5 1.5
2.1 2 2
2.2 2.
2.7
0
5
10
15
20
25
FY2007 FY2008 FY2009 FY2010 FY2011 FY2012 FY2013 FY2014 FY2015 FY2016
Tax revenue Non-tax revenue

8 Macroeconomic Update
20. Revenue mobilization beat expectation despite the five month long trade disruption. Total revenue grew by 18.9%, higher than the 13.7% growth in FY2015 but lower than the 20.5% growth in FY2014. Despite the five months long trade disruption and ensuing supply disruption, revenue growth accelerated in the last five months of FY2016 as imports gradually normalized along with the clearance of the backlog of goods stuck at the various customs points along the Nepal-India border. This along with the one-off windfall capital gains tax payment (about NRs13 billion) by Ncell Private Limited and NRs10 billion transfer by Nepal Telecommunication Authority from its telecommunication funds contributed to the achievement of tax target for FY2016. Tax and non-tax revenue increased by 18.6% and 20.2%, respectively. As a share of GDP, tax revenue mobilization has increased significantly, reaching 18.8% of GDP in FY2016, up from 9.8% of GDP in FY2007. Non-tax revenue amounted 2.7% of GDP in FY2016 (Figure 12). Total revenue growth averaged 20% in the last five years. It might be challenging to attain such a high growth rate annually if economic activities do not accelerate and if tax base remains narrow. As of FY2014, 685,958 individuals registered for permanent account number (PAN) and 133,178 for value added tax (VAT).
21. Income tax, customs, excise, education service tax, health service tax and non-tax revenue grew at a rate higher than in FY2015. Value added tax and vehicle tax mobilization decelerated (Figure 13). Overall, VAT comprised the largest (25.3%) share of total revenue mobilization, followed by income tax (24.3%), customs (17.2%) and excise duty (14.4%) (Figure 14). Taxes on income and imported goods, which are largely financed by remittance income, constitute a lion’s share of total tax revenue mobilization— around 70%. Furthermore, import-based revenue (custom duties, VAT and excise on imports) account for about 45% of total revenue.
III. Fiscal Balance22. Robust revenue mobilization but disappointing expenditure performance resulted in a fiscal surplus13 equivalent to 1.4% of GDP in FY2016 (Figure 15). The country ran a fiscal surplus in FY2013 and FY2014, but a fiscal deficit (of about 0.7% of GDP) in FY2015. For a country with one of the lowest per capita incomes in Asia, running a fiscal surplus reflects chronic problems associated with budget execution. A fiscal policy anchored on a modest deficit to finance productivity-enhancing infrastructure would not jeopardize fiscal sustainability.14 Nepal faces an estimated infrastructure
Figure 13: Revenue growth (% change)
Source: Nepal Rastra Bank
Value added tax 25.3
Income tax 24.3
Customs 17.2
Excise 14.4
fee 2.5
Vechile tax 1.5
tax 0.1
Health service tax 0.1
Other tax 2.0
Non-tax revenue 12.7
Figure 14: Composition of total revenue in FY2016
Source: Nepal Rastra Bank
13 Fiscal balance is computed as expenditures (including net lending) minus revenue (including grants).14 For more see, Macroeconomic Update, Vol.3, No.2, August 2015 (page 34-35).

Macroeconomic Update 9
financing gap of between 8% and 12% of GDP annually until 2020.15 Ramping up public spending on physical and social infrastructures, including those related to post-earthquake reconstruction, is essential for an accelerated, employment-centric and inclusive economic growth.
23. Total net borrowing amounted to NRs82.1 billion in FY2016 (3.7% of GDP), up from about NRs3.4 billion in FY2015. Net external and domestic borrowing were NRs36.2 billion (1.6% of GDP) and NRs45.9 billion (2% of GDP), respectively. A significant portion of the internal borrowing in FY2016 was done in the last quarter with an intention to use it in FY2017. In the aftermath of the earthquake, foreign grants increased to 3% of GDP, up from 1.8% of GDP in FY2015. Primary surplus— fiscal balance before interest payment on public debt— increased to 3.8% of GDP (Figure 16). Nepal has been running a primary surplus since FY2012. Combined with the low and declining outstanding public debt, it indicates that the government has ample fiscal space to ramp up productivity-enhancing public capital investment without jeopardizing fiscal sustainability. However, a major constraint for doing that is the low absorptive capacity.
IV. Public debt24. Nepal’s overall outstanding public debt (external and domestic) has been steadily declining, reaching an estimated 25.7% of GDP in FY2015 from 51.9% of GDP in FY2005. It increased to an estimated 27.6% of GDP in FY2016. Higher internal borrowing in FY2016 contibuted to the increase in debt in FY2016. Total external debt accounts for about 10.6% of GDP and domestic debt 17% of GDP (Figure 17). External debt service payments stand at around 8.8% of export of goods and non-factor services. The low public debt and debt service payments generally indicate sound public debt management in addition to the early repayment of principal (contributed by large treasury surplus due to robust revenue growth but sluggish expenditure). Nepal’s external debt is mostly on concessional terms and faces low debt distress as per the debt sustainability analysis.16
15 World Bank. 2013. Reducing Poverty by Closing South Asia’s Infrastructure Gap. Washington DC.16 ADB. 2015. Macroeconomic Update, Vol.3, No.2, August 2015 (page 34-35). Kathmandu.
Figure 16: Primary and fiscal balance (% of GDP)
Source: Budget Speech various year; NRM staff estimates
-3
-2
-1
0
1
2
3
4
5
FY2010 FY2011 FY2012 FY2013 FY2014 FY2015 FY2016R
Primary balance Fiscal balance
Figure 17: Public debt (% of GDP)
Source: Financial Comptroller General Office
Figure 15: Fiscal indicators (% of GDP)
Source: Budget Speech various year; NRM staff estimates

10 Macroeconomic Update
V. Public Enterprises25. Despite the unexpected financial turnaround of Nepal Oil Corporation (NOC), the overall performance of public enterprises (PEs) declined in FY2016 as Nepal Electricity Authority (NEA) losses more than doubled. Net profit of PEs decreased to an estimated NRs16.6 billion in FY2016 from NRs33.9 billion in FY2015. The low global oil prices but high domestic prices throughout FY2016 contributed to the significant net profit of NOC, which has met its entire debt obligation. However, the mismatch between per unit production (or purchase from India) cost of electricity and per unit selling price17 contributed to the large loss of NEA, whose accumulated loss amounted to NRs25.2 billion. The government wrote off NEA’s NRs27.5 billion debt in FY2011 in order to help in its financial turnaround and reforms. The large profit earned by NOC and Nepal Telecom offset the increasing losses incurred by NEA and other 13 loss making public enterprises. Of the 27 public enterprises, 14 made loss and three did no transaction. NOC’s profit increased to about 0.8% of GDP in FY2016, a surprising turnaround given the fact that its losses averaged 0.5% of GDP over FY2010-FY2014. Meanwhile, NEA’s losses18 increased to 0.6% of GDP from 0.2% of GDP in FY2015 (Figure 18).
26. The cumulative liabilities of PEs decreased from 2.5% of GDP in FY2013 to 1.7% of GDP in FY2015 because of the decline in both unfunded and contingent liabilities. The unfunded liabilities (salary, pension, social security contribution, health care, and recurrent costs, among others, that the PEs cannot finance themselves) had increased steadily from 1.0% of GDP in FY2009 to 1.6% of GDP in FY2013, but it declined to 1.3% of GDP in FY2015. A major contributor to the rise in unfunded liabilities is the hike in salary and allowances in the public sector. Meanwhile, contingent liabilities (state guarantees of loans, defaults of PEs, and clean-up liabilities of privatized PEs, among others) increased in FY2013 after a steady decline in the past four years. However, it declined from 0.9% of GDP in FY2013 to 0.4% of GDP in FY2015.
27. Either privatization or liquidation of loss making PEs19 needs to be accelerated to reduce the drain on the budget. The weak financial position of PEs has led to large unfunded liabilities, especially for pension and other related retirement benefits, which could ultimately become the government’s liabilities. Due to the
17 The Electricity Tariff Fixation Commission allowed the NEA to increase electricity tariff, on an average, by 19.5% starting FY2017. The last time electricity tariff was in-creased was on 17 August 2012.
18 The high losses of NEA are also attributed to the rising electricity import from India, which is sold at suppressed rates, and the still large provisioning for pension and gratuity of employees. The average electricity import price is NRs8.4 per unit, but the retail price is NRs8.04 per unit. Nepal imports around 250 MW of electricity during the dry season. Electricity demand spiked during the five months trade disruption, which resulted in a severe shortage of fuel. Households and businesses used electricity as an alternative to fuel and cooking gas.
19 The government is also considering merger of four public enterprises— Nepal Food Corporation (NFC), National Trading Ltd (NTL), National Seed Company Ltd (NSCL) and Agriculture Inputs Company Ltd (AICL)— into National Import and Supply Company to manage import and distribution of essential goods.
Figure 18. Net earnings of select PEs (% of GDP)
Source: Ministry of Finance; NRM staff estimates

Macroeconomic Update 11
lack of accurate and updated data, the contingent liability of PEs presented here are at best conservative estimates. It is likely that the government is exposed to a higher level of liabilities. In this regard, fiscal and macroeconomic stability could potentially be subject to significant risks. Continuing the adjustment of electricity tariffs to reflect the cost of production and the automatic adjustment of fuel prices in earnest to reflect the international prices will help to lower losses and liabilities. The PEs suffer from chronically weak management and political meddling. Moreover, privatization and liquidation process is plagued by weak inter ministry coordination, unsupportive management and a lack of political will.
C. MONETARY SECTOR
I. Inflation28. Inflation (year-on-year average consumer price index [CPI]) increased by 9.9%, higher than 7.2% increase in FY2015, as the unfavorable monsoon affected agricultural output and the trade disruption created a severe shortage of essential goods, including cooking gas and petroleum fuel. Food and beverage prices, which have 44% weight in the CPI basket, grew by 10.2%, up from 9.6% in FY2015. The drop in prices of cereal grains (which has 11% weight in the CPI basket) to 9.2% was offset by a double-digit increase in prices of pulses and legumes, vegetables, ghee and oil and spices. Overall, food prices contributed 4.8 percentage points to overall increase. Meanwhile, non-food and services inflation increased sharply to 9.2% from 5.1% in FY2015. Prices of clothes and footwear, housing and utilities (which have 20% weight in the CPI basket and contributed 2.6 percentage points to overall inflation), and education increased by double-digits. Non-food and services prices accounted for about 5.1 percentage points to overall inflation. Inflation in Nepal has been deviating from the inflation in India, especially after the global food price escalation in FY2008, primarily due to the persistent supply-side constraints and in FY2016 due to the trade disruption. Normally, inflation in Nepal and India tend to move in tandem with inflation in Nepal being slightly higher than in India. Nepalese rupee is pegged to the Indian rupee at IRe1 = NRs1.6.
29. Inflation has remained elevated since FY200820 due to a combination of structural bottlenecks, domestic supply-side constraints and high inflationary expectations. Structural bottlenecks include weak backward and forward linkages,
20 For a more detailed analysis, see policy challenge section of Nepal chapter in ADO 2014.
Figure 19: Overall inflation
Source: Nepal Rastra Bank
Figure 20: Food inflation
Source: Nepal Rastra Bank

12 Macroeconomic Update
fragmented value chain and distribution system, low productivity and policy inconsistencies, especially in terms of market monitoring to check anti-competitive practices. Supply-side constraints include the lack of adequate supply of electricity, transport bottlenecks, shortage of raw materials leading to high import content of processed and light manufactured goods, and the deficient supply of key inputs to boost productivity. Credible strategies/policies to tame elevated inflation would help dampen inflationary expectations.
In a report published by the Investment Board of Nepal (IBN) the total energy demand is projected to reach 33,433 gigawatt hour (GWh), which is equivalent to 6,358 mega watt (MW) at 60% system capacity factor in 2030. Additionally, accounting for transmission loss (1,211 MW), outages (2,523 MW), and the constant daily demand load curve, the required installed capacity to meet energy demand in 2030 is 10,092 MW in 2030. A lower system factor (arising from supplementary sources such as storage plants and capacity increases in renewables) would mean higher installed capacities to meet demand. At 50% system capacity factor, the required installed capacity to meet energy demand would be about 12,000 MW.
It uses the model for analysis of energy demand (MAED) to forecast energy demand in the next 15 years. This differs significantly from the linear energy demand projection. The model considers latent demand (for instance, switching from traditional cooling methods to air conditioning, from liquefied petroleum gas to electrical appliances to cook food, and from fuel to electricity to power up vehicles) in such forecast and takes into account the evolution of socio-economic, technological and demographic patterns.
While these projections may be on the higher side given the optimistic assumptions for sectoral growth and its pattern, the direction and magnitude of energy demand in the next 15 years points to a
Box 1: Electricity demand in 2030
Source: Investment Board of Nepal. 2016. Energy Demand Projection 2030: A MAED Based Approach. Kathmandu
plausible scenario of large demand-supply deficit if the planned projects are not completed on time. This has to be accompanied by reform of the entire sector, including enacting and implementing the legal, regulatory, institutional and administrative reforms. NEA system losses are already one of the highest in the world. In FY2016 its system losses were 25.9%, up from 24.4% in FY2015. It largely reflecting a dated distribution system (including sub par transformers). The country faces a challenge to meet the energy demand given the slow pace of project implementation (generation, transmission and distribution).
Figure 21: Non-food inflation
Source: Nepal Rastra Bank

Macroeconomic Update 13
30. Inflation moderated to 6.9% and 7.2% in mid-August and mid-September 2015, respectively and started to escalate for the rest of the months in FY2016 as a result of the crippling shortages caused by the trade disruption. After mid-September, inflation was in double-digit in all the months except mid-April 2016. It reached a high of 12.1% in mid-January 2016 (Figure 19). Similarly, food inflation also remained in double-digit in all the months except mid-April and mid-May 2016, when it hit 9.3% and 9.6% respectively (Figure 20). Non-food inflation hit double digit starting mid-February 2016 (Figure 21).
II. FY2017 Inflation Outlook 31. Better agricultural harvest due to the normal monsoon, subdued inflation in India, low international fuel and commodity prices and normalization of production and supplies since February 2016 will likely lower general prices of goods and services in FY2017 despite the demand-side pressures emanating from the earthquake-related fiscal stimulus. The prices of cereal grains, paddy, pulses and legume are expected to moderate on account of the favorable monsoon. However, the prices of alcoholic drinks and tobacco products will likely escalate due to the hike in its tariff rate in the FY2017 budget. Similarly, restaurant and hotel prices are also likely to increase as the rebound in tourism sector will stimulate demand. Meanwhile, normalization of supplies and cooling off of demand pressures in housing and utilities will drive the de-escalation of non-food and services inflation. Although furnishing and housing equipment may see a rise in prices on account of the increased demand arising from gradual revival of real estate and housing markets, its impact will not be large enough to offset the decline in prices of other items in the non-food and services basket. Consequently, food and non-food inflation are projected to contribute 4.3 and 4.2 percentage points, respectively to overall inflation of 8.5% in FY2017 (Figure 22).
III. Money Supply 32. Money supply21 (M2) grew by 19.5%, supported by a robust increase in net foreign assets (Figure 23). However, it is marginally lower than the 19.9% growth in FY2015 owing to the decrease in net domestic assets. The large net foreign asset holdings— registering a 25.6% growth rate in FY2016, up from 24.2% growth in FY2015 — were supported by high remittance inflows and foreign assistance. The increase in money supply was reflected in the 18.5% growth of narrow money (M1) and 21.6% growth of time deposits. As a share of
Figure 22: Contributions to overall inflation (percentage points)
f = forecastSource: Nepal Rastra Bank, NRM staff estimates
9 5 9.6
8.2
9.9
9.1
7.2
9.9
8.5
0
2
6
8
10
12
FY2010 FY2011 FY2012 FY2013 FY201 FY2015 FY2016 FY2017f
Food and beverage Non-food and services Nepal-CPI Ind a-CPI
21 Money supply (M2) is the sum of net foreign assets and net domestic assets. Also called broad money, M2 is equal to narrow money (M1) and saving and time deposits. M1 is equal to currency in circulation and demand deposits.
Figure 23: Monetary sector (% change)
Source: Nepal Rastra Bank
-50
-40
-30
-20
-10
0
10
20
30
40
M2 Net foreign assets Net domesticassets
Credit to privatesector
Net claims onGovernment
FY2014 FY2015 FY2016

14 Macroeconomic Update
GDP, money supply, net foreign assets and net domestic assets stood at 99.8%, 42.5% and 57.3%, respectively in FY2015.
33. Net claims on government — direct loans and government securities held by the central bank— further decreased by 40.7% in FY2016. It decreased by 10.4% in FY2015 and 15.4% in FY2014, reflecting the still large government deposits compared to the bank and financial institutions (BFIs) claims on the government. The overall credit to the private sector picked up pace, registering a growth of 23.2% compared to 19.4% growth in the previous year. It indicates a gradual pick up in credit demand by the private sector, especially in wholesale and retail trade, production, and finance and insurance after the devastation caused by the earthquake, and the BFIs’ willingness to lend more at a time when excess liquidity persisted for over three years. As a share of GDP, total credit to the private sector stood at 75.3% of GDP in FY2016, up from 64.8% of GDP in FY2015.
IV. Deposit and Credit 34. The BFIs mobilized NRs328 billion (reaching a total NRs2,016.8 billion) in deposits in FY2015, higher than NRs282 billion mobilized in FY2015, as higher remittance inflows (despite the decrease in the number of migrant workers) and slower government expenditure boosted deposits. This translates into a growth of 19.4%, slightly lower than 20.1% growth in FY2015. Deposit mobilization of commercial banks grew by 20.7%, marginally lower than 21.4% in the previous years. Meanwhile, deposit mobilization by development banks increased by 16.5%, higher than 15.2% in FY2015 (Figure 24). Commercial banks account for about 87% of total deposits.
35. Total credit (loans and advances) of BFIs increased by 23.3% in FY2016, up from 17.5% growth in FY2015. Credits by commercial banks grew by 25.9% , up from a rate of 18.8% in FY2015. Meanwhile, credits by development banks and finance companies grew by 16.2% but it decreased by 5.8% in the case of finance companies (Figure 25). Overall, commercial banks account for about 85% of total credit. The credit to private sector increased by 23.3%, with commercial and development banks registering growth of 26.1% and 19.6%, respectively. Credit to private sector by finance companies decreased by 10.7%. Despite the unfavorable business environment, credit increased because of large increases in lending to wholesalers and retailers (particularly of non-durable commodities, automotive dealers and trading businesses), production (particularly agriculture, alcohol, paper, printing and publishing, raisin and tarpin, plastic, and processed oil), and finance, insurance and fixed assets (particularly finance companies, pension
Figure 24: Growth of deposits (% change)
Source: Nepal Rastra Bank
-20
-10
0
10
20
30
40
FY2011 FY2012 FY2013 FY2014 FY2015 FY2016
Commerical banks Development banks Finance companies Total deposit
Figure 25: Growth of credit (% change)
Source: Nepal Rastra Bank
-15
-10
-5
0
5
10
15
20
25
30
FY2011 FY2012 FY2013 FY2014 FY2015 FY2016
Commerical banks Development banks Finance companies Total credit
Macroeconomic Update 15
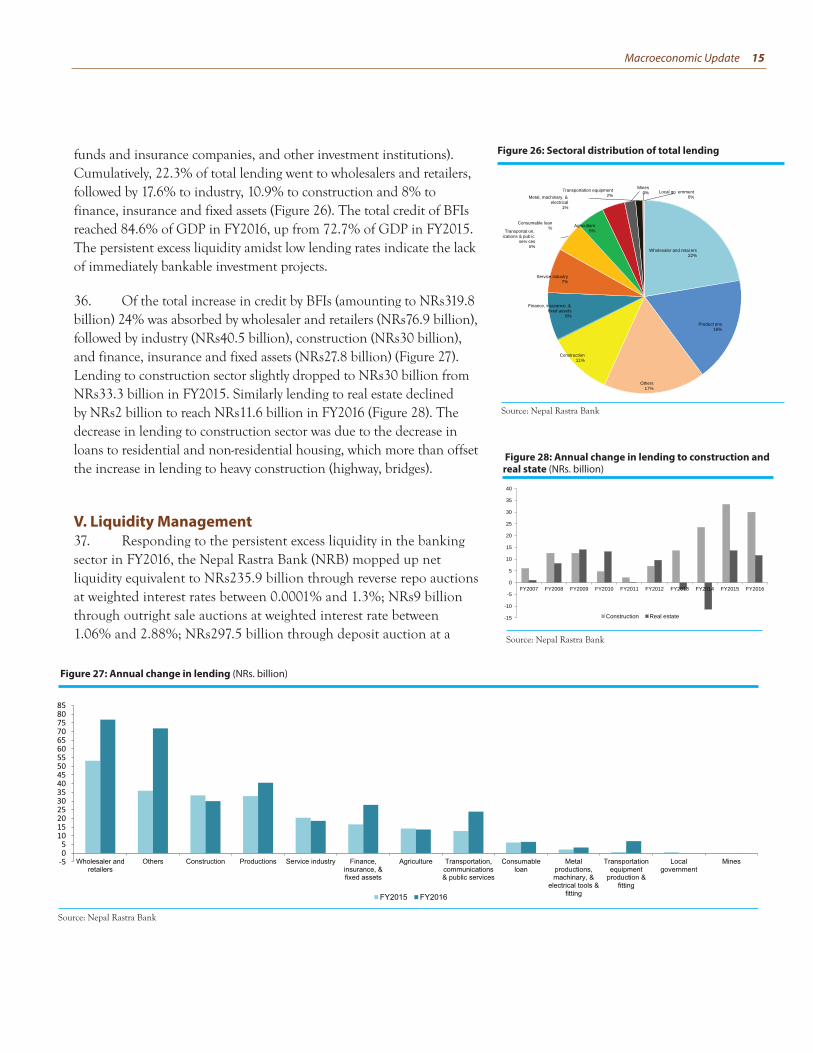
funds and insurance companies, and other investment institutions). Cumulatively, 22.3% of total lending went to wholesalers and retailers, followed by 17.6% to industry, 10.9% to construction and 8% to finance, insurance and fixed assets (Figure 26). The total credit of BFIs reached 84.6% of GDP in FY2016, up from 72.7% of GDP in FY2015. The persistent excess liquidity amidst low lending rates indicate the lack of immediately bankable investment projects.
36. Of the total increase in credit by BFIs (amounting to NRs319.8 billion) 24% was absorbed by wholesaler and retailers (NRs76.9 billion), followed by industry (NRs40.5 billion), construction (NRs30 billion), and finance, insurance and fixed assets (NRs27.8 billion) (Figure 27). Lending to construction sector slightly dropped to NRs30 billion from NRs33.3 billion in FY2015. Similarly lending to real estate declined by NRs2 billion to reach NRs11.6 billion in FY2016 (Figure 28). The decrease in lending to construction sector was due to the decrease in loans to residential and non-residential housing, which more than offset the increase in lending to heavy construction (highway, bridges).
V. Liquidity Management 37. Responding to the persistent excess liquidity in the banking sector in FY2016, the Nepal Rastra Bank (NRB) mopped up net liquidity equivalent to NRs235.9 billion through reverse repo auctions at weighted interest rates between 0.0001% and 1.3%; NRs9 billion through outright sale auctions at weighted interest rate between 1.06% and 2.88%; NRs297.5 billion through deposit auction at a
Figure 28: Annual change in lending to construction and real state (NRs. billion)
Source: Nepal Rastra Bank
-15
-10
-5
0
5
10
15
20
25
30
35
40
FY2007 FY2008 FY2009 FY2010 FY2011 FY2012 FY2013 FY2014 FY2015 FY2016
Construction Real estate
Figure 26: Sectoral distribution of total lending
Source: Nepal Rastra Bank
Wholesaler and retai ers 22%
Product ons 18%
Others 17%
Construction 11%
Finance, insurance, & fixed assets
8%
Service industry 7%
Transportat on, ications & pub ic
serv ces 5%
Agriculture 5%
Consumable loan %
Transportation equipment 2% Metal, machinary, &
electrical 1%
Mines 0% Local go ernment
0%
Figure 27: Annual change in lending (NRs. billion)
Source: Nepal Rastra Bank
16 Macroeconomic Update
weighted interest rate of 0.85%; and NRs49.1 billion by selling NRB bonds.
38. In FY2015, the NRB had mopped up a net liquidity equivalent to NRs315.8 billion through reverse repo auctions at a weighted average interest rate of 0.05%, and NRs6.0 billion through outright sale auctions at a weighted interest rate of 0.78%. The central bank did not use reverse repo auctions in FY2012 and FY2013. The repeated use of short-term liquidity management tools amidst fluctuating interest rates throughout the year indicates that the existing liquidity management strategy is a temporary measure and for long-term solution the investment climate has to be improved. It may then result in higher credit growth relative to deposit growth.
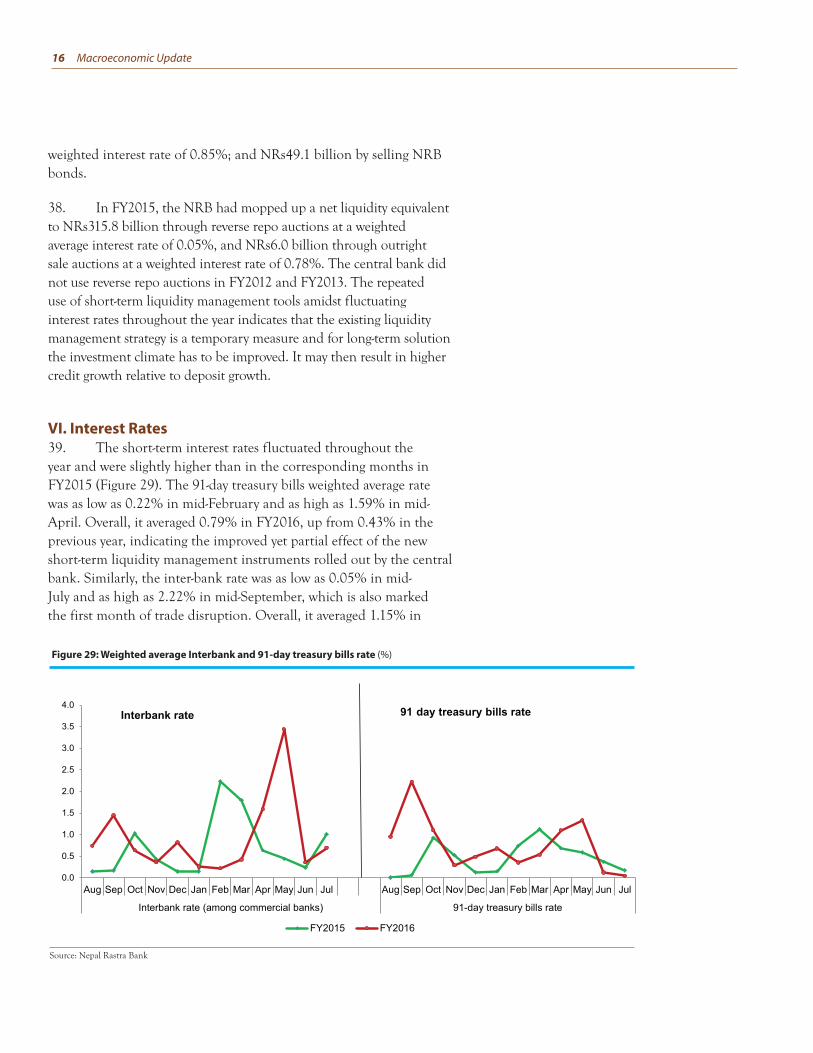
VI. Interest Rates39. The short-term interest rates fluctuated throughout the year and were slightly higher than in the corresponding months in FY2015 (Figure 29). The 91-day treasury bills weighted average rate was as low as 0.22% in mid-February and as high as 1.59% in mid-April. Overall, it averaged 0.79% in FY2016, up from 0.43% in the previous year, indicating the improved yet partial effect of the new short-term liquidity management instruments rolled out by the central bank. Similarly, the inter-bank rate was as low as 0.05% in mid-July and as high as 2.22% in mid-September, which is also marked the first month of trade disruption. Overall, it averaged 1.15% in
Figure 29: Weighted average Interbank and 91-day treasury bills rate (%)
Source: Nepal Rastra Bank

Macroeconomic Update 17
FY2016, higher than 1.06% in FY2015. The short-term liquidity management instruments are useful till the time they mature and the same excess liquidity problem arises.
40. The cash reserve ratio (CRR), which is the minimum mandatory deposits that BFIs need to hold as reserves either in cash or as deposits with the central bank and is usually used as one of the tools to achieve monetary policy goals, has remained unchanged since mid-August 2014. The present CRR for commercial banks, development banks and finance companies is 6.0%, 5.0% and 4.0%, respectively (Figure 30). The bank rate and standing liquidity facility have been kept unchanged at 8%.
41. The commercial banks’ have comfortably satisfied the capital adequacy ratio (CAR) and net liquidity requirements. CAR of commercial banks stood at 12.26%, which is 1.26 percentage points higher than the minimum 10% CAR and 1% buffer requirement. Non-performing loans (NPL) declined to 2.21% of total loan by mid-June 2016 from 3.01% in mid-October 2014 (Figure 31). Similarly, credit to deposit ratio stood at 75.2% against a maximum limit of 80% and net liquidity stood at 30.45% against the minimum 20% requirement, indicating that there is still room for commercial banks to expand credit and reduce their excess liquidity.
Figure 31: CAR and NPL (%)
Source: Nepal Rastra Bank
Figure 30: Cash Reserve Ratio
Source: Nepal Rastra Bank

18 Macroeconomic Update
Figure 32: Top five exports to India, PRC and other countries ($ million)
Source: Nepal Rastra Bank
D. EXTERNAL SECTOR
I. Exports42. The crippling trade disruption and persistent supply-side constraints weighed heavily on exports, resulting in a decrease in merchandise exports (free-on-board), in US dollar terms, by 28.8%. It had decreased by 3.9% in FY2015 because of the impact of the earthquake and the weak external demand. Exports to India and PRC decreased by 33.9% and 29.5%, respectively. India and PRC accounted for 56.3% and 2.4%, respectively, of total export in FY2016. Exports to India and PRC were hit by the five months long trade disruption and the slow restoration and reconstruction of the major trading routes and custom points, respectively. As a share of GDP, merchandise exports decreased to 3.3% from 4.6% in FY2015 and 5.1% in FY2014.
43. The top five exports to India were cardamom ($43.7 million), jute goods ($40 million), textiles ($32.4 million), polyster yarn ($30.7 million), and juice ($30.6 million). In FY2015, the top export to India was textiles ($51.7 million). Meanwhile, the top five exports to the People’s Republic of China (PRC) were handicraft ($4 million), woolen carpet ($2.2 million), tanned skin ($1.6 million), other handicraft goods ($0.5 million), and agarbatti ($0.1 million). In FY2015, the top export to PRC was tanned skin ($3.1 million). The top five exports to other countries were woolen carpet ($74 million), readymade garments ($42.3 million), pashmina ($24.9 million), pulses ($8.3 million) and tea ($5.4 million). In FY2015, the top export to other countries was woolen carpet ($68.2 million) (Figure 32).
II. Imports44. Merchandise imports (cost, insurance and freight) in US dollar terms decreased by 7.1% from a growth rate of 8.0% in FY2015 as the crippling trade disruption halted the inflow of goods into Nepal. Of the total import of $7.1 billion, lower than $7.6 billion in the previous year, just 9.1% was oil import, which is substantially lower than 14.7% of total import in FY2015 and 19.1% in FY2014. In US dollar terms, oil import in FY2016 was equivalent to $648 million and $1.1 billion in FY2015. Overall, merchandise imports decreased to 33.6% of GDP from 35.9% of GDP in FY2015. Imports from India and PRC accounted for 61.7% and 15% of total imports in FY2016.

Macroeconomic Update 19
45. The top five imports from India were petroleum products ($618.6 million), vehicles and spare parts ($593.5 million), steel billets ($213.6 million), rice and paddy ($206.2 million), and other machinery and parts ($182.2 million). In FY2015, the top imports from India was petroleum products ($1.1 billion). The top imports from PRC were telecommunication equipment ($169.6 million), chemical fertilizer ($152 million), electrical goods ($84.5 million), other machinery and parts ($74.7 million), and readymade garments ($53 million). The top import from PRC in FY2015 was telecommunication equipment ($155.2 million). The top imports from other countries were gold ($151.6 million), crude soybean oil ($119.9 million), polythene granules ($86 million), medicine ($85.1 million), and aircraft spare part ($72.4 million). In FY2015, the top import from other countries was silver ($249 million) (Figure 33).
46. As a share of GDP, Nepal’s merchandise trade deficit with India, PRC and other countries stood at 19.5%, 5.1% and 6.7%, respectively, in FY2016. It translates into $4.1 billion, $1.1 billion, and $1.4 billion, respectively. Similarly, as a share of GDP, Nepal’s total trade with India, PRC and other countries stood at 23%, 5.2%, and 9.3%, respectively. Trade with India accounted for 61.2% of total foreign trade in FY2016. Apart from import from India against payment in Indian rupee, the NRB has allowed traders to import industrial raw materials and intermediate goods against payment in US dollars. This mode of payment had been steadily increasing, reaching import equivalent to NRs78.5 billion that was paid US dollars in FY2015 to Indian suppliers. However, the trade disruption reduced such imports to NRs70.2 billion (Figure 34).
III. Remittances47. Consistent with the slowdown in the number of overseas migrant workers, official remittance inflows decelerated to 0.8% in US dollar terms in FY2016 from 12.2% in FY2015 and 11.9% in FY2014 (Figure 35). However, the still higher growth rate of remittances compared to GDP growth resulted in its share of GDP to increase to a record 29.6% in FY2016 (equivalent to $6.3 billion), up from 29.1% of GDP in FY2015 and 27.7% of GDP in FY2014.22 Remittances is an important contributor to reducing absolute poverty and over 56% of households receive remittances in Nepal.23 About 80% of household remittance income is spent on daily consumption goods and about 2.4% in capital formation. Remittances income has
Figure 33: Top five imports from India, PRC and other countries ($ million)
Source: Nepal Rastra Bank
Figure 34: Import from India against payment of US dollar (NRs billion)
Source: Nepal Rastra Bank
Figure 35: Number of migrants and remittance inflows
Source: Department of Foreign Employment; Nepal Rastra Bank
0
5
10
15
20
25
30
35
0
100
200
300
00
500
600
FY2005 FY2006 FY2007 FY2008 FY2009 FY2010 FY2011 FY2012 FY2013 FY201 FY2015 FY2016
Wor
kers
' rem
ittan
ces
(% o
f GD
P)
Num
ber o
f ove
rsea
s m
igra
nt w
orke
rs ('
000)
Overseas migrant workers Workers' remittances (% of GDP)
22 In local currency, the growth rate was 7.7% in FY2016, 13.6% in FY2015 and 25% in FY2014.23 Sapkota, Chandan. 2013. Remittances in Nepal: Boon or Bane? Journal of Development Studies, 49 (10), pp.1316-1331. DOI: 10.1080/00220388.2013.812196

20 Macroeconomic Update
been the prime factor supporting steady services sector growth and for financing imports. The recent decline in the number of overseas migrant workers and the subsequent deceleration of remittance inflows poses a downside risk to reducing poverty, supporting economic growth and to maintaining external sector stability.
48. According to the Department of Foreign Employment, growth of migrant workers further decreased by 18.4% following a decrease by 2.8% in FY2015. In FY2014, it had increased by 16.4%. The recent slowdown in the number of overseas migrant workers is triggered by the investment slowdown in the Gulf countries following low oil prices, the decision of Malaysian government to halt fresh recruitment, and the availability of jobs related to post-earthquake reconstruction.24 A total of 418,713 migrants legally left to work overseas in FY2016 (daily average of 1,147), down from 512,887 in FY2015 and 527,814 in FY2014 (daily average of 1,466). The number of migrant workers to Malaysia drastically decreased to 60,979 from 202,828 in FY2015 and 214,149 in FY2014 (Figure 36). Qatar, Saudi Arabia and Malaysia were the top employment destinations for low and semi-skilled Nepalese migrant workers. They together accounted for about 78% of total migrant workers in FY2016, down from 83% in the previous year. Japan and South Korea absorbed 3,844 and 7,432 migrant workers, respectively.
IV. Balance of Payments 49. Despite the deceleration of remittance inflows, the lower external trade deficit resulted in further strengthening of the external situation in FY2016. The balance of payments surplus reached $1.8 billion (8.5% of GDP) in FY2016, up from $1.5 billion in the previous year (Figure 37). The large merchandise trade deficit, which declined to 30.3% of GDP from 31.3% of GDP in FY2015, was partially25 offset by workers’ remittances, which hit a record 29.6% of GDP, and export (3.3% of GDP), resulting in a current account surplus of $1.3 billion (6.2% of GDP), up from 5.1% of GDP in FY2015. Meanwhile, FDI inflows increased to $55.8 million from $44.2 million in FY2015. Gross foreign exchange reserves increased from $8.1 billion in FY2015 to $9.7 billion in FY2016, sufficient to cover 14.1 months of import of goods and non-factor services.
Figure 36: Overseas migration excluding India (in thousands)
Source: Department of Foreign Employment
29
355 385
5
528 513
19
0
100
200
300
00
500
600
FY2010 FY2011 FY2012 FY2013 FY201 FY2015 FY2016
Malaysia
Qatar
Saudi Arabia
UAE
Others
Kuwait
South Korea
Bahrain
Oman
Japan
Afghanistan
Lebanon
Israel
Total
Figure 37: Balance of payments (% of GDP)
Source: Nepal Rastra Bank, NRM staff estimates
24 It is also attributed to the government’s decision to impose free visa and drastic reduction in processing charges that were levied by manpower agencies. 25 Overall, the net goods, services and income balance was a negative 28.4% of GDP, which was offset by net transfers equivalent to 34.6% of GDP, resulting in current account
surplus equivalent to 6.2% of GDP.

Macroeconomic Update 21
V. Exchange Rate50. The Nepalese rupee continued to remain weak against the US dollar, closely following currency movement of the Indian rupee, to which the currency peg has remained unchanged since 1993 (Figure 38). Overall, the Nepalese rupee depreciated by 5.2% between mid-July 2015 and mid-July 2016. It depreciated by 19.9% between mid-July 2011 and mid-July 2012, a further 6.7% depreciation between mid-July 2012 and mid-July 2013, 0.9% depreciation between mid-July 2013 and mid-July 2014 and 5.3% depreciation between mid-July 2014 and mid-July 2015. Despite the consecutive five years nominal depreciation of the currency, Nepal has not been able to benefit because of persistent structural as well as supply-side constraints and related increased inflation relative to that of India. In FY2015 export was hit by the devastation and dislocation of production caused by the earthquake and in FY2016 it was crippled by the five month long trade disruption. A weak currency should boost exports provided that there is adequate productive capacity and strong external demand. Similarly, it also tend to boost remittance inflows. On the other hand, a weak currency also tend to increase import bill and fuel inflationary pressures.
Figure 38: Daily nominal exchange rate (NRs per $)
Source: Nepal Rastra Bank
88.5
96.5
107.0
60
65
70
75
80
85
90
95
100
105
110
1-Ja
n-12
28-J
an-1
224
-Feb
-12
22-M
ar-1
218
-Apr
-12
15-M
ay-1
211
-Jun
-12
8-Ju
l-12
4-A
ug-1
231
-Aug
-12
27-S
ep-1
224
-Oct
-12
20-N
ov-1
217
-Dec
-12
13-J
an-1
39-
Feb-
138-
Mar
-13
4-A
pr-1
31-
May
-13
28-M
ay-1
324
-Jun
-13
21-J
ul-1
316
-Aug
-13
12-S
ep-1
39-
Oct
-13
5-N
ov-1
32-
Dec
-13
29-D
ec-1
325
-Jan
-14
21-F
eb-1
420
-Mar
-14
16-A
pr-1
413
-May
-14
9-Ju
n-14
6-Ju
l-14
2-A
ug-1
429
-Aug
-14
25-S
ep-1
422
-Oct
-14
18-N
ov-1
415
-Dec
-14
11-J
an-1
57-
Feb-
156-
Mar
-15
2-A
pr-1
529
-Apr
-15
26-M
ay-1
522
-Jun
-15
19-J
ul-1
515
-Aug
-15
11-S
ep-1
58-
Oct
-15
4-N
ov-1
51-
Dec
-15
28-D
ec-1
524
-Jan
-16
20-F
eb-1
618
-Mar
-16
14-A
pr-1
611
-May
-16
7-Ju
n-16
4-Ju
l-16
31-J
ul-1
627
-Aug
-16

22 Macroeconomic Update
Efficiency and Integrity in Public Procurement1
I. Introduction1. Many medium to large-scale development projects in Nepal are plagued by implementation delays and cost overruns. At the core of such recurrent hurdles is inefficient public procurement, contributed by a range of factors such as legal and policy complications, lack of required human resources to manage contracts, political intervention at management and operational levels, weak leadership by project directors and their high turnover, and prolonged delays by oversight and judicial agencies to clear contentious procurement. (See Box 2.) Consequently, project implementation is slow with cost and time overruns, quality of infrastructure construction is not up to the taxpayers’ expectation, and disbursement is slow and below target. These all result in low capital expenditure, sluggish economic growth, and insufficient jobs creation.
2. Efficiency and integrity in public procurement (of goods, works and services) enhance value for money and accelerate project implementation, which in turn stimulates private sector activities and innovations. Furthermore, if done in the right way and on time to maximize the value for taxpayers’ money, public procurement could be used as a strategic policy tool to address the myriad of economic, social and environmental challenges faced by the country. Hence, efficiency and integrity in public procurement—equivalent to around 12% of GDP — is vital to not only accelerate project implementation, but also to achieve medium-term goal of graduation from LDC category and long-term goal to be a middle income country by 2030, which also is the target date to achieve the Sustainable Development Goals (SDGs).
3. Public procurement is done when taxpayers’ money and/or grants and loans funded by development partners are used to finance public goods and services, including building of roads, airports, dry ports, hydroelectricity, irrigation canals, drinking water facilities, school and hospital buildings, and consultancy/advisory services. Unscrupulous procurement practices (resulting in wasteful
ISSUE FOCUS
1 This section was written in collaboration with Narendra Chand, Senior Procurement Officer and Bhupendra Bhatta, Procurement Officer, NRM.

Macroeconomic Update 23
capital spending in the last quarter of fiscal year) tends to increase recurrent spending in the next several years,since the sub-standard fixed assets need to be maintained more frequently. Furthermore, implementation delays unnecessarily prolong the project construction and completion, which ultimately is a drain of public funds. Hence, if done in the right way,efficient public procurement, which makes spending effective and has the potential to yield substantive savings (on whole-of-life cost basis), contributes significantly to create the foundation for economic growth to take off on a high and sustainable path.
II. Key Highlights of the Amended Public Procurement Act 20164. The recently amended Public Procurement Act (PPA) 2016, which has come about after prolonged revisions and delays, dictates public procurement in Nepal. In line with the amended PPA, procurement policy, operating guidelines and necessary administrative changes (including capacity enhancement) need to be rolled out to effectively implement it. The amended PPA includes procurement methods such as lump sum, catalogue shopping, limited tendering and buy back method (which is a new addition to the methods of procurement).
5. Preparation and approval of estimates: Cost estimate is not required, except works, for procurement up to NRs100,000. Regarding the approval of estimates,the officials involved in the design or estimation, checking or approval and the consultant involved, shall be responsible and subjected to legal action if the revised estimate
1. Lengthy process from bidding document preparation to contract signing
n (Actions) Streamlining procedures; decentralizing approval authority
2. Ineffective procurement packaging by executing and implementing agencies (too many small packages; small International Competitive Bidding (ICB) packages to encourage ghost international joint venture lead)
n (Actions) Appropriate sizing with multi-year contracts; increasing ICB thresholds
3. Weak governance/bidder capacity leading to collusive/irregular practices by bidders, entry of over-committed contractors, and abnormally low bid price
n (Actions) E-procurement with sound contractual database; stringent technical evaluation to control overcommitted bidders; clear price evaluation criteria to control low bidding; stringent contract management
4. Under-developed procurement regulation and monitoring by concerned agency; low public procurement expertise
n (Actions) Strengthening Public Procurement Act (PPA) and capacity of Public Procurement Monitoring Office (PPMO); procurement expertise accreditation; Building capacities of implementing agencies
Box 2: Common issues in procurement

24 Macroeconomic Update
is more than 25% of the initial estimate or due to defective design or abnormal estimation. In the previous version of the PPA, cost estimate was not required for procurement of up to NRs25,000.
6. Qualification of bidder or proposer: No qualification requirements is prescribed for the procurement of a construction work with cost estimate less than NRs20 million unless the procuring entity has decided that the work requires qualification criteria. In the previous version of the PPA, no qualification requirements were needed for the procurement of a construction work with cost estimate less than NRs6 million.
7. Invitation to bid: A re-invitation with reduced submission period may be given if no bids/proposals are submitted within the stipulated time or all the submitted bids/ proposals are non-responsive. The period shall be at least 15 days for national competitive bidding and at least 21 days for international competitive bidding. However, in case no bids/proposals are submitted during re-invitation period or all of the submitted bids/ proposals are non-responsive and there will be loss to the procuring entity (or some activity of the Public Enterprises will be affected), then the procuring entity may re-invite the bid by giving at least seven day notice for national bidding. Else, it could procure following the methods specified under Section 8, with approval from one level higher authority. Furthermore, works within the prescribed estimate amount under national competitive bidding may be procured competitively only from domestic bidders. In the previous version of the PPA, in the case of procurement of construction work, preference was given according to the sub-section (1) of section 12 of the Construction Entrepreneur Act, 1958.
8. Withdrawal or modification of bid: A bidder has to make a sealed application 24 hours prior to the deadline for submission if it intends to modify or withdraw its bid unless the bid is submitted through electronic submission. In the previous version of the PPA, a bidder may, prior to expiry of the deadline for the submission of bids, make a sealed application for modification to or withdrawal of bid that a bidder has once submitted.
9. Acceptance of bid and procurement contract: A performance security of 5% is levied if the bid price is up to 15% below the estimate. An additional performance security equivalent to half the difference between the bid price and the amount that is 15% below the estimate is needed if the bid price is lower than 15% of the estimate.
Macroeconomic Update 25
10. Provision of advance: The procuring entity, after the agreement, may provide advance of up to 20% of the contract amount by getting a bank guarantee to the supplier, construction entrepreneur or service provider. Initially half of the advance is provided, and the other half is given based on the utilization of the initial advance. Moreover, except under the provision of Section 10(5), the payment for advance is made to a specially opened account for the contract. The contract may be terminated if the contractor misuses the advance payment.
11. Variation order: The variation of up to 5% may be done by gazette II class officer, up to 10% by Gazetted I class officer, up to 15% by department chief, between 15% and 25% by Secretary, and 25% and above by the Council of Ministers. However, for the procurement of amount less than NRs6 million, the department chief may approve the variation order in excess of 15%. In the previous version of the PPA, a variation order above 15% was issued as per the decision by the Council of Ministers.
12. Price adjustment in procurement contract: Unless otherwise provided in the procurement contract, if price needs to be adjusted in the course of implementation of a procurement contract having duration exceeding 12 months, then the competent authority may adjust the price. In the previous version of the PPA, the duration period was 15 months.
13. Mechanism for dispute settlement: Contract agreement will include provision of dispute settlement through prevailing law on arbitration if the dispute cannot be settled amicably.
14. Termination of contract and remedy: The procuring entity may terminate procurement contract if the supplier, consultant, service provider or construction entrepreneur does not perform as per contract, or its conduct is not as specified in section 62(2) or it misuses the advance payment. If the contract is terminated because the contractor did not start, abandoned or did not attain progress as per the agreement, the procuring entity may terminate the contract anytime. If the contract is terminated as per section 59(7), the full amount of performance security shall be forfeited. Any additional amount to complete the remaining work shall be recovered as amount due to the government. The remaining work after the termination of contract may be completed by inviting financial proposal from the remaining bidders selected under section 25 by giving 15 day notice. Meanwhile, the approval of one level higher authority is required prior to requesting for financial proposal as per section 59(9). In the previous version of the PPA, the procuring entity could terminate

26 Macroeconomic Update
procurement contract if the supplier, consultant, service provider or construction entrepreneur did not perform as per the contract.
15. Blacklisting: If a bidder selected pursuant to section 27 or a consultant selected pursuant to section 38does not come to sign the contract, then it may be blacklisted.
16. Hindrance of procurement process: The authority authorized to investigate is required to request any document from the procuring entity with due consideration to not hinder the procurement process as far as possible.
III. Implications for Public Procurement Management17. The PPA has been amended after an iteration of discussion with a range of stakeholders. Overall, the added or amended provisions are in the right direction. For instance, the onus of timely and quality procurement is placed on the chief of the procuring entity (department, division or section of a project or program), including the completion of the task within the stipulated time. Additionally, in order to make procurement official more accountable, a provision on non-compliance is added. Specifically, the amended PPA has included a provision that “Ensuring completion within the set time by conducting regular supervision, monitoring, and quality control measures to implement or to cause to implement the procurement agreement made under this act, will be the responsibility of the chief of the concerned public entity.” This opens up the possibility of prosecution of underperformers.
18. The other positive aspects of the amended PPA are that e-bidding is now explicitly mentioned and six additional direct procurement methods are added, facilitating the procurement by public enterprises. These include: (i) procurement of goods and services between two public entities; (ii) public entities/enterprises doing business by competing with private sector; (iii) procuring aviation, aircraft and associated equipment; (iv) procuring goods and services on rates fixed by international organizations; (v) procuring goods and services for organizing programs and promotional activities outside the country; and (vi) procuring goods and services by diplomatic mission.
19. Another important amendment is the provision to facilitate fast decision-making on matters related to cost variation. For instance, department heads can approve variation of up to 15%, between 15% and 25% by the concerned Secretary, and on and above 25% by the Cabinet. Although an additional layer of committee is added in this process, the overall amendment will likely speed up review and
Macroeconomic Update 27
approval of variation, which is one of the most contentious issues in public procurement and has been delaying project implementation. A related positive amendment concerns the shortening of price adjustment applicable for contracts exceeding 12 months instead of 15 months in the previous version of the PPA. This price adjustment is applicable to the contract procured under the multi-year contract that is tendered.
20. On the institutional side, regulatory function of PPMO has been strengthened to include additional functions to (i) issue necessary manuals; work procedures; and technical notes required for procurement methods such as turnkey, EPC, schedule rate contract, and management contracts, etc.; (ii) review and cause to review after procurement, (iii) develop roster of contractors, consultants, suppliers, and service providers regarding their procurement qualification and experience, (iv) issue electronic procurement guidelines, (v) certify/ accredit procurement experts, and (vi) forward case to competent authority for necessary action if the procurement carried out by the public entity is found to be contradicting with the PPA, its rules, work procedure, or guidelines. PPMO has been entrusted sole responsibility to maintain a national e-GP system and the PPA has provisioned that the method of submitting the bids through e-bidding shall be in accordance with the procedure approved by PPMO. Public entity may adopt only electronic- procurement procedure partially or completely in public procurement. In other words, public entity, based on the capacity, may phase out the paper based submission to obtain full benefit of the e-GP system.
21. Furthermore, the amended PPA has explicitly mentioned that the procurement process will not apply to the following methods and a separate working procedure to procure goods, services and works may be issued: (i) design and build; (ii) turn key/EPC; (iii) design, build and operate; (iv) public private partnership/build operate and transfer; (v) framework agreement; (vi) cost replacement; (vii) management agreement; (viii) exchange; (ix) installments; (x) buy on lease; (xi) buying land properties; and (xii) operation and maintenance or management procurement based on performance. These are an improvement because the previous version of the PPA was silent on these methods and had created confusion especially on the procurement related issues for public private partnership projects.
22. Remaining Gaps. While these amendments are expected to make procurement timely and efficient, thus helping to accelerate project implementation, a number of shortcomings also appear in the amended PPA. These need to be gradually addressed over time as it may slowdown the speed of project implementation.
28 Macroeconomic Update
23. The additional penalty (forfeiture of bid security and other financial penalties to the bidder) imposed in case the contract is not signed is impractical as merely putting a stringent provision may not help to get a good contractor. There is a need for concurrently improving the quality of selection. Specifically, any deficiencies of the bids (such as serious errors in a price bid) that may oblige the bidder to withdraw later, need to be detected and such bid be duly rejected. Similarly, reduced rebidding time, in case the first round of bidding fails, does not necessarily provide fair treatment to new bidders or lead to the most efficient selection of a contractor.
24. The amended PPA also provided clearer provision of dealing with the low bids, by specifying the level of additional performance guarantees. While this can provide clarity to deal with such circumstances, the issue of low price bidding needs to be dealt with by strengthening the technical evaluation, thereby effectively rejecting the insufficiently experienced and skilled bidders, which is one of the causes of the low price bidding. On this account, within the context of PPR amendment, PPMO is considering the introduction of one-stage two envelope (1S2E) selection process, in which technical and financial evaluation is separately undertaken. Likewise, there is a need for strengthening the disciplines of contract management for higher compliance with cost, time, and quality in executing the works after contract signing.
25. The earlier draft PPA had included a provision of additional advance without bank guarantee, which could be used for the additional deployment of construction materials and equipment. The provision was entirely removed from the final PPA. This could have provided a basis for meeting such requirements, with specification of how the paid amount was to be guaranteed (through material valuation or bank guarantee).
26. Furthermore, the increase in threshold of works contract/tender without requiring bidders’ qualifications up to NRs20 million (current threshold is NRs6 million) may foster malpractice in the construction industry. First, entry of insufficiently experienced and skilled contractors can undermine the timeliness, quality, and cost of the works. Second, contractors may prefer to register a new firm every time they bid for a new contract whenever the firm’s past performance record was poor. This has the potential to undermine capacity development of the construction industry. Third, the absence of qualification for such contracts may result in irregular practices with political pressures. Such system may best be introduced after establishment of sound registration and performance recording system of the contractors.

Macroeconomic Update 29
27. The threshold applied to international bidders may violate WTO as well as procurement procedures of multilateral development banks (MDBs). Country system needs to be harmonized to MDBs procurement standard. This provision will restrict participation of international bidders in domestic market and may open up avenues for political pressure to frequently change the thresholds, which will lead to unpredictable procurement environment in the country. Similarly, the provision to allow withdrawal of bid only before 24 hours of the deadline is impracticable. Bidders should be allowed to withdraw their bids at any point in time before the bid submission deadline.
IV. Way forward28. Almost all of capital spending and some capital formation related components of recurrent spending (such as use of grant to local bodies to build local infrastructure, operation and maintenance, etc.)are subjected to public procurement in Nepal, which together amount to 12% of GDP. Efficiency and integrity in procurement for goods, services and works is vital to accelerate project implementation and enhance the quality of spending, which eventually leads to higher, sustainable and employment-centric inclusive economic growth. This in turn is essential to graduate from LDC category by 2022, and to
The following provisions deviate significantly from the internationally practiced public procurement principles: n In case of re-bidding, bid preparation time has been substantially
reduced to 21 and 15 days from 45 and 30 days for ICB and NCB, respectively
n If the bidding fails repeatedly or in special circumstances, competitive bidding may be invited providing only 7 days of bid preparation and submission time
n Performance security amount has been increased for low quoted bid prices in proportion to the difference between the bid price and the cost estimate
n If a bidder does not sign the contract, in addition to forfeiture of its bid security, the bidder shall be blacklisted
n While submitting bids, bidders have to submit contract information and documents related to their previously signed contracts (including progress report) and technical and financial documents for all previously submitted bids
n Instead of managing variation order, stringent provisions have been added to discourage it, which may lead to termination of the contract
(construction works) without functional completion or possibility of silently adding additional quantity of works/ amount in the cost estimate to cover future variation
Major implications: The above amendments may delay procurement or make it less efficient as these are not fully in line with the Asian Development Bank and the World Bank procurement guidelines. They are different from international best practices on public procurement and may weaken some aspects of the reforms initiated in the previous years. Some provisions may lead to collusive practices among bidders, resulting in limited competition and equal treatment to all bidders. The inclusion of seemingly unnecessary, contradicting, recurring and stringent provisions for bidders and procurement officials may discourage their active participation in bidding and decision-making processes.
Box 3: Amended PPA and international best practices

30 Macroeconomic Update
become a middle income country by 2030 along with the achievement of the SDGs.
29. Public procurement is governed by the recently amended PPA 2016. While the amendments or addition of new provision are expected to lead to timely and efficient procurement, a number of shortcomings need to be gradually addressed over time. Additionally, timely implementation of the amended PPA by rolling out updated policy, regulations, operational guidelines and manuals, and institutional setup is equally important. For instance, fully rolling out e-bidding system is urgently required, given that the present system still requires that original bid security must be submitted on paper, which undermines the effectiveness of e-submission of bids. This will help to make public procurement efficient, transparent and rules based. Similarly, the evaluation bids should be completed within the stipulated timeframe and payment of contract processed on time.
30. The government needs to ensure that transaction costs are not prohibitively high, which is a natural barrier for the participation of small and medium contractors, whose capacity needs to be enhanced. E-procurement, which creates a marketplace characterized by equal access and competition under a transparent framework, needs mainstreaming along with the capacity enhancement of implementing agencies, contractors, and other stakeholders. It lowers the likelihood of rent-seeking opportunities as it minimizes in-person contacts before bid submission and during bid evaluation. A rigged tendering process in the absence of e-procurement stifles competition, leading to lower quality of goods, works or services at higher cost.
31. The executing and implementing agencies need to boost their capacity on technical and administrative matters related to efficient procurement, including clarity about the scope and nature of work, contract management methodology, and the associated financial aspects of procurement design and processing. A lack of professionalism remains one of the major weaknesses. Public procurement is a specialized profession requiring effective integration of technical, financial, and legal requirements in its process of preparation, contractor selection, and execution. Competent human resources required for its efficient execution are critical. It essentially is a strategic policy lever/function of the government as opposed to mundane administrative service.
32. A careful procurement planning and effective performance monitoring yield value for taxpayers’ money used for public procurement. This is equally important throughout the procurement lifecycle: preparation of bids, submission and evaluation of bids,

Macroeconomic Update 31
awarding contracts and executing contracts with sound contract management, which is another critical subject for efficient execution of infrastructure investments in Nepal while duly controlling time, cost, and quality. (See Box 4.) Exception to the rule (bypassing the amended PPA) and breaching threshold procurement should be minimized in order to maximize the utility of taxpayer’s money and to leverage the bulk purchasing power of the government.
1. Effective Control (particularly during startup) for: n Proper utilization of advance payment n Presence of joint venture lead; unauthorized sub-
contracting n Timeliness in equipment and material delivery, and in
plant establishmentn Timely provision of site access with statutory clearances
2. Strong Application of Instruments for Time, Cost and Quality controln Issuance of Notice to Correct; Notice to Terminaten Stringent application of delay damages
3. Sound employer-contractor relation (equal partnership with mutual trust to facilitate timely processing of payments, changes in design and contract variation)
4. Sufficient Supervision Personnel and Capacities of Executing and Implementing Agenciesn Use of competent supervision consultants n Applying much higher standards in contract
management
Box 4: Post-procurement: Key elements of effective contract management

32 Macroeconomic Update
Note: FY2016 starts on 16 July 2015 andends on 15 July 2016.
GDP = gross domestic product; P = provisionala Based on FY2016 National Accounts Statistics. Central Bureau of Statisticsb Refers to gross fixed investmentand does not include change in stocksc Based on FY2016 annualdata. Nepal Rastra Bank d Based on FY2017 Budget Speech. Ministry of Financee Includes cash balance of previous yearf Based on FY2016annual data. Financial Comptroller General Office
Sources: Ministry of Finance.FY2017 Budget Speech.Kathmandu; Nepal Rastra Bank. 2016. Macroeconomic Situation. Kathmandu; Central Bureau of Statistics.May 2016. FY2016 National Accounts Statistics.Kathmandu;Central Bureau of Statistics. 2014. National Population and Housing Census 2011 (Population Projection 2011 – 2031). Kathmandu; Finan-cial Comptroller General Office.
ItemFiscal Year
2012 2013 2014 2015 2016PA. Income and Growth 1. GDP per Capita ($, current) 704 709 725 762 746a
2. GDP Growth (%, in basic prices) 4.6 3.8 5.7 2.3 0.8a
a. Agriculture 4.6 1.1 4.5 0.8 1.3a
b. Industry 3.0 2.7 7.1 1.5 (6.3)a
c. Services 5.0 5.7 6.2 3.6 2.7a
B. Saving and Investment (current and market prices, % of GDP) 1. Gross Domestic Investmentb 20.8 22.6 23.5 21.5 25.0 2. Gross National Saving 39.5 40.7 45.7 43.9 42.9
C. Money and Inflation 1. Consumer Price Index (average annual % change) 8.3 9.9 9.1 7.2 9.9c
2. Total Liquidity (M2) (annual % change) 22.6 16.4 19.1 19.9 19 5c
D. Government Finance (% of GDP) 1. Revenue and Grants 18.6 19.5 20.6 20.9 24.4d
2. Expenditure and Onlending 20.9 18.8 20.0 21.9 23.1d
3. Overall Fiscal Surplus (Deficit) (2.2) 0.7 0.9 (0.7) 1.4d
E. Balance of Payments 1. Merchandise Trade Balance (% of GDP) (24.4) (27.2) (30.3) (31.3) (30.3)c
2. Current Account Balance (% of GDP) 5.0 3.4 4.6 5.1 6 2c
3. Merchandise Export ($) Growth (annual % change) 5.7 (2.9) 5.1 (3.9) (28.8)c
4. Merchandise Import ($) Growth (annual % change) 4.7 10.9 13.9 8.0 (7.1)c
5. Remittances (% of GDP) 23.5 25.6 27.7 29.1 29.6c
F. External Payments Indicators1. Gross Official Reserves ($ million) 4,960.0 5,613.7 6,938.6 8,147.7 9,736.8c
Months of current year’s imports of goods) 10.3 10.1 10.0 11.2 14.1c 2. External Debt Service (% of exports of goods and services) 10.6 9.5 8.9 8.1 8.8f
3. Total External Debt (% of GDP) 20.2 19.7 17.7 16.2 17.0f
G. Memorandum Items 1. GDP (current prices, NRs billion) 1,527.3 1,695.0 1,964.5 2,120.5 2,248.7a
2. Exchange Rate (NRs/$, average) 80.7 87.7 98.0 99.2 106.1c
3. Population (million) 26.9 27.3 27.6 28.0 28.4
Appendix 1: Country Economic Indicators

Macroeconomic Update 33
ItemPeriod
1990s 2000s Latest YearA. POPULATION INDICATORS1. Population (million) 18.5 (1991) 23.2 (2001) 26.5 (2011)2. Population growth (annual % change) 2.1 2.2 1.4 (2011)
B. Social Indicators1. Fertility rate (births/woman) 5.1 (1996) 3.6 (2004) 3.4 (2011)
2. Maternal mortality ratio (per 100,000 live births) 539.0 (1996) 281 (2006) 140.0 (2013)3. Infant mortality rate (below 1 year/1,000 live births) 82.0 (1991) 48.0 (2006) 32.2 (2014)4. Life expectancy at birth (years) 55.0 (1991) 62.0 (2001) 69.6 (2014)
a. Female 54.0 (1991) 63.0 (2001) 70.1 (2014)b. Male 55.0 (1991) 62.0 (2001) 68.2 (2011)
5. Adult literacy (%) 35.6 (1996) 48.0 (2004) 61.6 (2014)a. Female 19.4 (1996) 33.8 (2004) 44.5 (2011)b. Male 53.5 (1996) 64.5 (2004) 71.6 (2011)
6. Primary school gross enrollment (%) 57.0 (1996) 72.0 (2004) 134.4 (2014)7. Secondary school gross enrollment (%) 43.8 (2001) 54.4 (2004) 51.6 (2014)8. Child malnutrition (% below 5 years old) 57.0 36.4 (2010)9. Population below poverty line (international, %) 68.0 (1996) 53.1 (2003) 24.82 (2011)10. Population with access to safe water (%) 45.9 82.5 (2006) 93.5 (2014)11. Population with access to sanitation (%) 22.0 (1995) 24.5 (2006) 73.7 (2014)12. Public education expenditure (% of GDP) 2.0 2.9 (2005) 4.4 (2016)13. Human development index 0.341 0.429 (2005) 0.548 (2014)14. Rank/total number of countries 152/173 136/177 (2003) 145/188 (2014)15. Gender-related development index 0.33 (1995) 0.511 (2003) 0.908 (2014)16. Rank/total number of countries 148/163 (1995) 106/140 (2003) 145/188 (2014)
C. Poverty Indicators1. Poverty incidence 42 (1996) 31 (2004) 25.16 (2011)2. Proportion of poor to total population
a. Urban 23.0 (1996) 9.55 (2004) 15.46 (2011)b. Rural 44.0 (1996) 34.62 (2004) 27.43 (2011)c. Mountain 57.0 (1996) 32.6 (2004) 42.77 (2011)d. Hills 40.7 (1996) 34.5 (2004) 24.32 (2011)e. Terai 40.3 (1996) 27.6 (2004) 23.44 (2011)
3. Poverty gap 11.75 (1996) 7.55 (2004) 5.43 (2011)4. Poverty severity index 4.67 (1996) 2.7 (2004) 1.81 (2011)5. Inequality (Theil Index) … … …6. Multidimensional poverty index1 … … 0.197 (2011)
… = not available, GDP = gross domestic product,
Central Bureau of Statistics. 2012. National Population and Housing Census 2011. Kathmandu; Central Bureau of Statistics. 2011. Nepal Living Standards Survey 2010/11. Kathmandu; Central Bureau of Statistics. 2015. Annual Household Survey 2013/14. Kathmandu; Ministry of Health and Population. 2012. Nepal Demographic and Health Survey 2011. Kathmandu; United Nations Development Programme. 2015. Human Development Report 2014. New York; Central Bureau of Statistics. 2011. Poverty in Nepal (2010/11). Kathmandu; World Health Organization, United Nations Children’s Fund, United Nations Population Fund, and World Bank. 2012. Trends in maternal mortality 1990 to 2010, Kathmandu; Ministry of Education. 2015. Flash II Report 2014-2015. Kathmandu; Ministry of Finance. 2016. Budget Speech of FY2016/17. Kathmandu
1 UNDP replaced Human Poverty Index with Multidimensional Poverty Index from Human Development Report 2011.
Appendix 2: Country Poverty and Social Indicators

ASIAN DEVELOPMENT BANK6 ADB Avenue, Mandaluyong City1550 Metro Manila, Philippineswww.adb.org
ADB NEPAL RESIDENT MISSIONMetro Park Building, LazimpatPost Box 5017, Kathmandu, [email protected]/nepal