Macroeconomic Effects of Conflict
44
Macroeconomic Effects of Conflict Mitzirose Legal Jeff Ducanes
Transcript of Macroeconomic Effects of Conflict

Macroeconomic Effects of Conflict
Mitzirose LegalJeff Ducanes
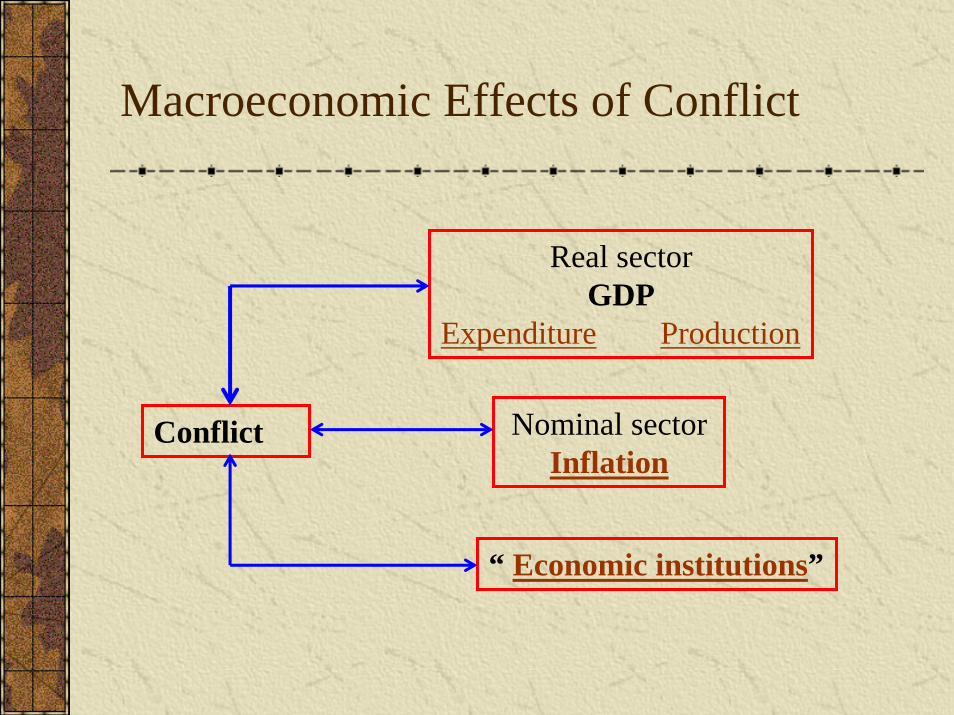
Conflict
Real sectorGDP
Expenditure Production
Nominal sectorInflation
“ Economic institutions”
Macroeconomic Effects of Conflict

GDP – Expenditure sidePrivate ConsumptionInvestmentsGovernment ConsumptionExports
Lower private consumption
• As private incomes fall due to disruption in economic activities and cessation of businesses due to fighting
• Due to uncertainty in asset values• As tourism receipts plummet. High incidence
of conflict in a country, in particular terrorism, causes tourists to go elsewhere
Back

Fall in investment
• Private investment will be affected by lesser confidence in the future, and increased transaction costs
• Government investment will fall due to lower revenue and diversion of expenditure to military
• Local investment is likely to find it difficult to access finance
• Foreign investors will have greater concern about their personnel as well as greater exchange rate risk
Back
Government consumption to rise but to result in deficits
• Government consumption to probably rise due to war expenses but budget deficits likely to result as revenues fall as
o Government finds it more difficult to collect taxeso Other major sources of revenue, such as exports,
fall away
Back
Fall in exports
• Fall in production• Shift towards domestic markets in an attempt to
sustain domestic consumption in the face of falling production
• Disruption in international markets
Back

GDP – Production sideCapitalLabor

Fall in capital
• Outright destruction of capital, such as when power plants and telecommunication facilities are sabotaged
• Decline in investment will eventually lead to lower levels of per capita capital
Back
Lower quantity and quality of labor
• Loss of lives or diminution of health of potential workers
• Disruption in children’s schooling which reduces future level of human capital
Back
Inflation likely to accelerate
• As government resorts to deficit financing• As confidence in the currency declines• From disruption in production and trade• And possibly from speculation by traders
Back
Adverse effect on “economic institutions”
• Financial development is retardedo The demand for domestic currency as medium of exchange
and store of value declineso Poor quality governance results from conflict, including in
the regulation of the financial system
• Reduction in formal and increase in informal sector activity
• Fall in capital-intensive activities and those with significant transportation requirements
• Proportionately less manufacturing and less long-distance trading domestically and internationally
Next
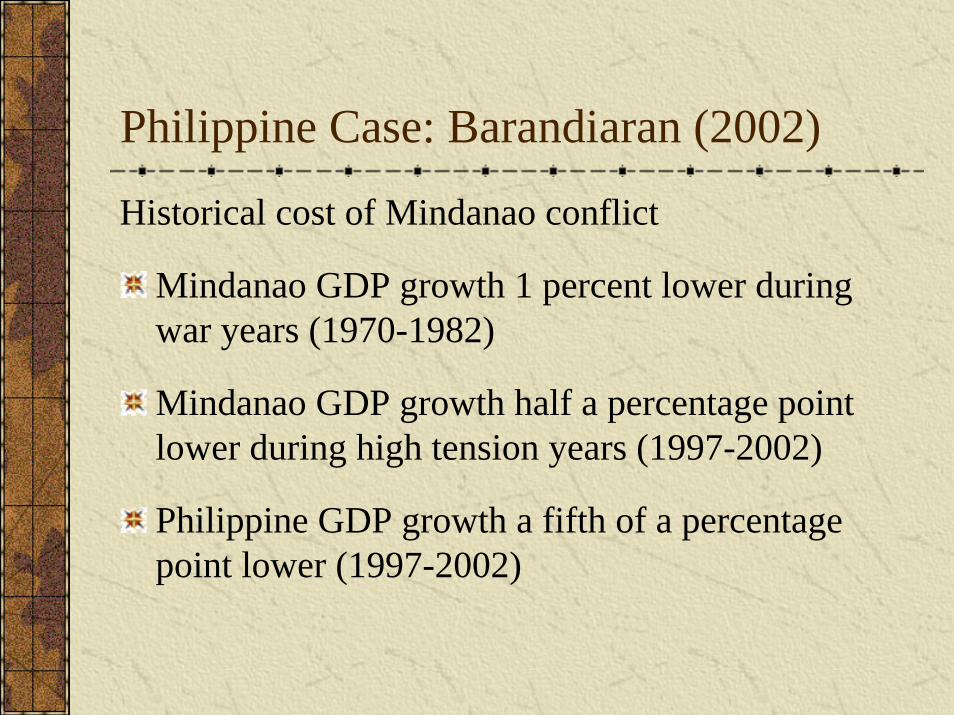
Philippine Case: Barandiaran (2002)
Historical cost of Mindanao conflict
Mindanao GDP growth 1 percent lower during war years (1970-1982)
Mindanao GDP growth half a percentage point lower during high tension years (1997-2002)
Philippine GDP growth a fifth of a percentage point lower (1997-2002)
Philippine Case: Barandiaran (2002)
Cost of Mindanao conflict to economy for next 10 yrs
$2 billion for the whole Philippines from 1970-2001
Per capita GDP in southern Mindanao will be 10% lower than it could be in the 10th year

Philippine Case: Barandiaran (2002)
Relative to estimated cost of conflict to other countries, low for the Philippines because
Conflict contained within the small area of Southwestern Mindanao
The resource base of Southwestern Mindanao at the beginning of the conflict had low economic value
Philippine Case: World Bank (2005)
Adding the indirect economic impact of the conflict such as on investment deflection and agricultural productivity could raise the overall economic cost of the Mindanao conflict to well over $10 billion from 1975-2002.

Human and Social Costs of Conflict
Deaths and Injuries
Estimated 120,000 deaths since the 1970s (World Bank 2005)
Of these an estimated 30% are government casualties, 50% are rebels, and 20% are civilians (Arguilals 2003)
From 1970-1996 the reported injured, not counting those among the rebels, was 55,000 (Arguilals 2003)
Human and Social Costs of ConflictDisplacement
More than 2 million people displaced since the 1970s – half of these during President Estrada’s all out war in 2000 (World Bank 2005)
The US Committee for Refugees identifies the Philippines as one of the top countries in the world where mass exodus of people are pervasive. In Southeast Asia it ranks 3rd, next only to Burma and Indonesia.
Even if displacement is sometimes temporary, it can have huge effects
A survey of more than 1200 evacuees conducted in 2003 by Notre Dame University and the Population Commission in select evacuation centers in Mindanao revealed about 12% got sick during displacement. Moreover, among them, 18% of in-school children stopped schooling because of the evacuation
Human and Social Costs of Conflict
Displacement
Emergence of Muslim ghettos in Mindanao and other places in the country (World Bank 2005)
Exodus to neighboring countries such as in SabahMalaysia, the periodic crackdown against which causes economic and social problems to their places of origin (World Bank 2005)

Stylized FactsPHDR 2002: At every aspect of human development, always among the laggards are provinces in Muslim Mindanao where conflict has been of long standing.
Monsod et al. paper on MDG, Ho (WorldBank) paper on ARMM and human development: Same provinces are among least likely to attain milleniumdevelopment goals.
To a lesser extent, some CAR provinces also fare poorly wrt to several development and poverty measures
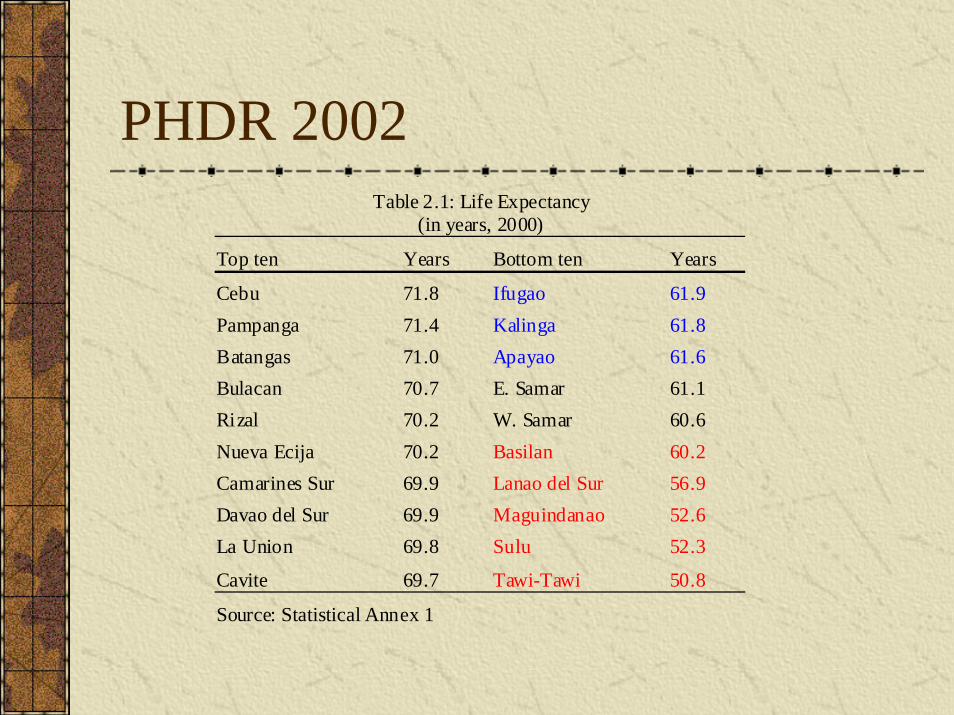
PHDR 2002Table 2.1: Life Expectancy
(in years, 2000)
Top ten Years Bottom ten Years
Cebu 71.8 Ifugao 61.9 Pampanga 71.4 Kalinga 61.8 Batangas 71.0 Apayao 61.6 Bulacan 70.7 E. Samar 61.1 Rizal 70.2 W. Samar 60.6 Nueva Ecija 70.2 Basilan 60.2 Camarines Sur 69.9 Lanao del Sur 56.9 Davao del Sur 69.9 Maguindanao 52.6 La Union 69.8 Sulu 52.3
Cavite 69.7 Tawi-Tawi 50.8
Source: Statistical Annex 1

PHDR 2002
Table 2.2: High-school graduate ratio (18 and above) 2000
Top ten % Bottom ten % Rizal 66.9 Bohol 33.1Benguet 64.7 Biliran 32.6Cavite 64.3 Davao Oriental 31.8Bataan 62.2 Northern Samar 31.8Laguna 60.8 Apayao 31.3Batanes 60.7 Basilan 28.6Zambales 60.2 Eastern Samar 27.8Pangasinan 60.0 Masbate 23.3Misamis Oriental 55.2 Western Samar 22.3Ilocos Norte 54.9 Sulu 18.1Source: Statistical Annex 1

PHDR 2002Table 2.3: % Basic Enrollment Rate
(7-16 years old) 1999
Top ten % Bottom ten % Batanes 98.0 Davao del Sur 85.3Mt. Province 95.7 Camarines Sur 84.5Cavite 95.6 Masbate 84.0Catanduanes 95.3 Bukidnon 82.8Siquijor 95.2 Basilan 82.1Camiguin 94.9 Negros Oriental 79.7Ilocos Norte 94.9 Sulu 77.7Antique 94.8 Lanao del Sur 76.9Zambales 94.8 Maguindanao 76.6Benguet 94.8 Sarangani 69.3Source: Statistical Annex 1

PHDR 2002Table 2.5: Real Per Capita Income
(NCR 1997 Pesos) 2000
Top ten Pesos Bottom ten Pesos
Rizal 39,895 Western Samar 17,262Ilocos Norte 36,460 Marinduque 16,973Laguna 34,717 Lanao del Sur 15,936Bataan 33,907 Romblon 15,679Bulacan 32,318 Sorsogon 15,637Southern Cotabato 32,101 Eastern Samar 15,253Benguet 31,968 Basilan 13,193Cavite 31,814 Masbate 12,825Misamis Oriental 31,795 Tawi-Tawi 11,349
Nueva Vizcaya 31,515 Sulu 7,850
Source: Statistical Annex 1

PHDR 2002
Table 2.7: Top and Bottom 10 provinces in HDI 2000
1997 Ranka
Top provinces HDI 2000 1997 Rankb
Bottom provinces HDI 2000
1 Rizal 0.758 11 Romblon 0.488 7 Ilocos Norte 0.708 8 Sarangani 0.480 4 Bataan 0.698 3 E. Samar 0.452 5 Cavite 0.693 7 W. Samar 0.448 6 Laguna 0.690 4 Masbate 0.433 8 Benguet 0.688 6 Maguindanao 0.431
12 Bulacan 0.672 5 Lanao del Sur 0.425 2 Mis. Orient. 0.665 10 Basilan 0.420
18 Iloilo 0.653 2 Tawi-Tawi 0.378 9 Pampanga 0.652 1 Sulu 0.311
aNumber of places from top, e.g., 1=top; bNumber of places from bottom, e.g., 1=last Source: Statistical Annex 1
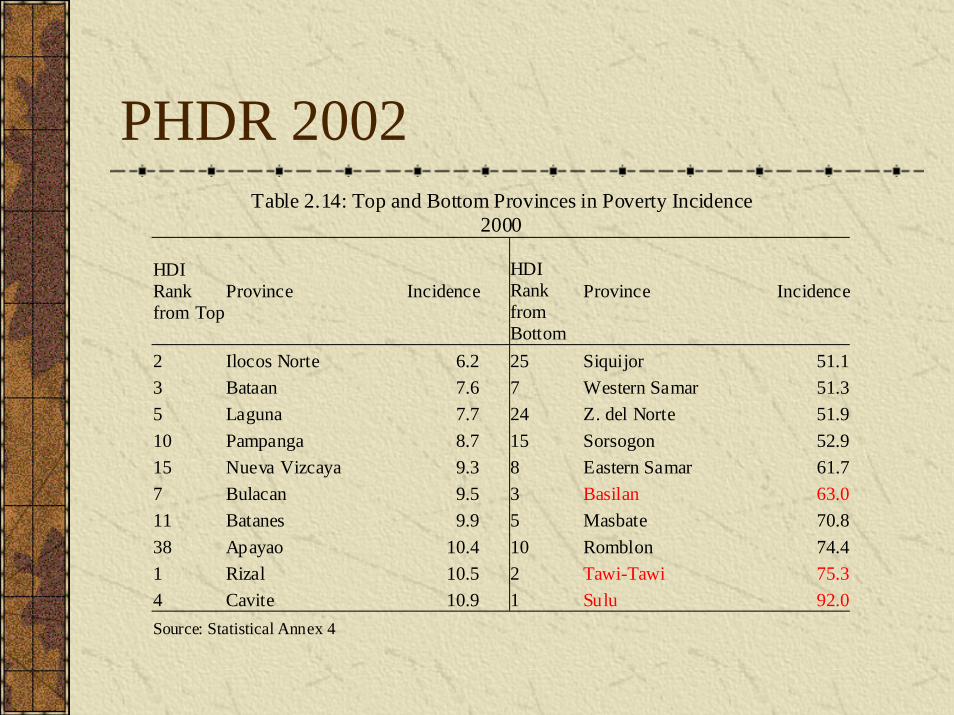
PHDR 2002Table 2.14: Top and Bottom Provinces in Poverty Incidence
2000
HDI Rank from Top
Province Incidence
HDI Rank from Bottom
Province Incidence
2 Ilocos Norte 6.2 25 Siquijor 51.13 Bataan 7.6 7 Western Samar 51.35 Laguna 7.7 24 Z. del Norte 51.910 Pampanga 8.7 15 Sorsogon 52.915 Nueva Vizcaya 9.3 8 Eastern Samar 61.77 Bulacan 9.5 3 Basilan 63.011 Batanes 9.9 5 Masbate 70.838 Apayao 10.4 10 Romblon 74.41 Rizal 10.5 2 Tawi-Tawi 75.34 Cavite 10.9 1 Sulu 92.0Source: Statistical Annex 4

PHDR 2002Table 2.15: Top and Bottom Provinces in HPI (1994-2000)
Top provinces HPI Bottom provinces* HPI
Cavite 8.8 Capiz 24.4 Nueva Ecija 8.9 Zamboanga del Norte 24.7 Bulacan 9.0 Guimaras 24.8 Batangas 9.2 Apayao 26.4 Bataan 10.3 Maguindanao 29.4 Pangasinan 11.5 Masbate 29.9 Isabela 11.5 Ifugao 35.8 Laguna 11.6 Lanao del Sur 35.9 Oriental Mindoro 11.8 Sulu 37.8 Marinduque 12.2 Tawi-Tawi 42.4 *Data on the percentage of underweight children is unavailable for Basilan so the HPI was not computed for this province. But were i t available, Basilan is likely to be among the bottom ten in HPI. Source: Statistical Annex 5
N
EW
S
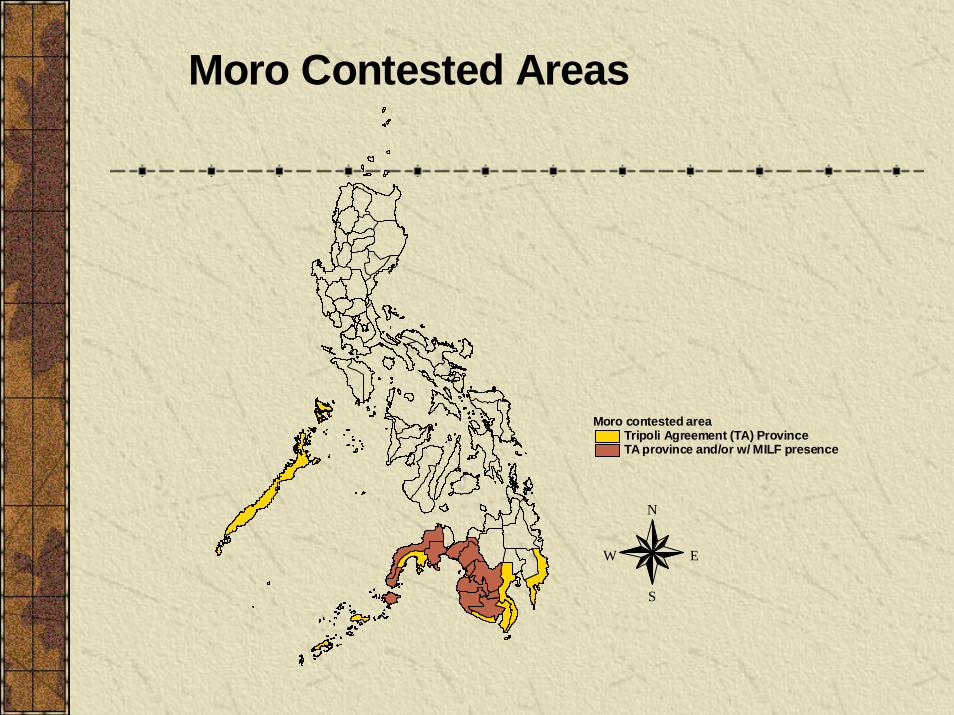
Moro Contested Areas
Moro contested areaTripoli Agreement (TA) ProvinceTA province and/or w/ MILF presence

Indigenous People and Muslim Areas
IP (40%) and Muslim areasMuslim areaMore than 40% IPsMuslim area and more than 40% IPs
N
EW
S
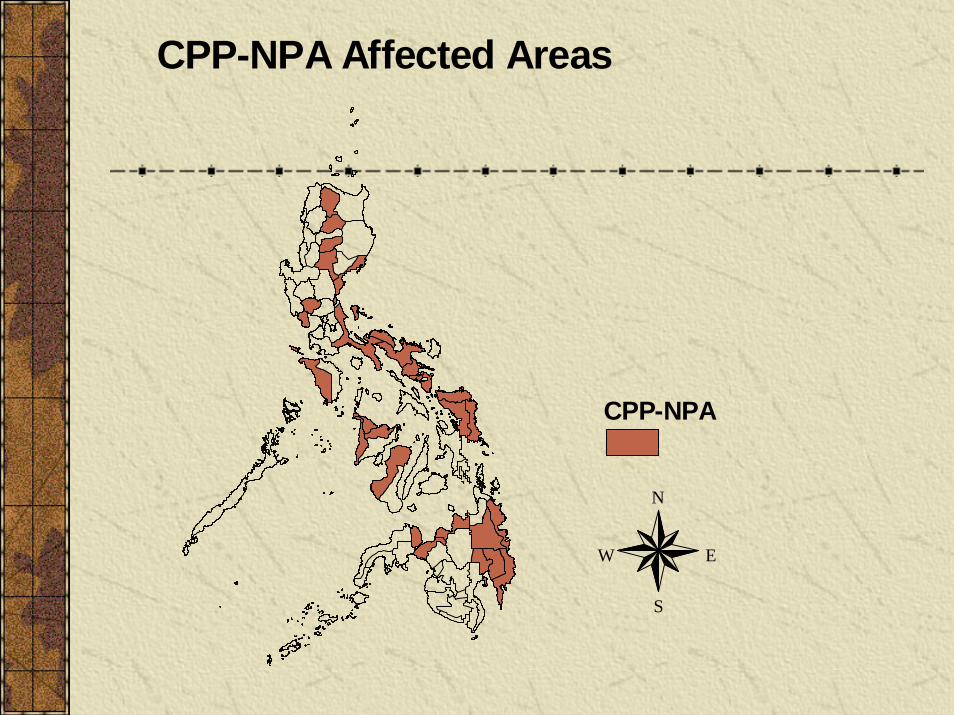
CPP-NPA Affected Areas
CPP-NPA
N
EW
S
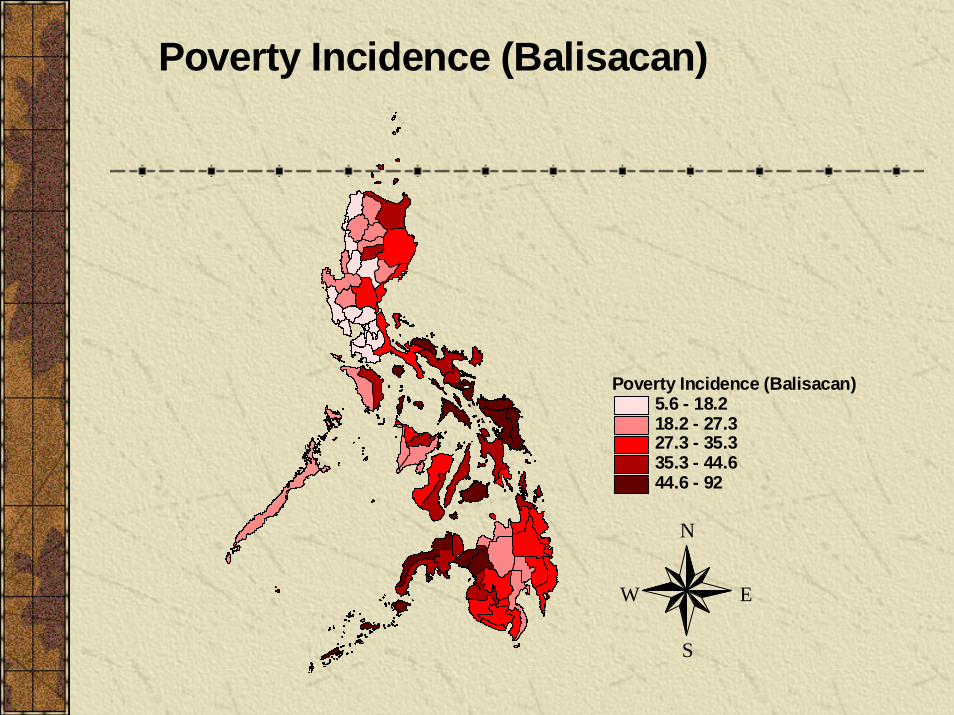
Poverty Incidence (Balisacan)
Poverty Incidence (Balisacan)5.6 - 18.218.2 - 27.327.3 - 35.335.3 - 44.644.6 - 92

N
EW
S
Cohort Survival Rate
cohort survival rate26.46 - 53.5453.54 - 64.7364.73 - 72.5572.55 - 81.481.4 - 92.33
N
EW
S
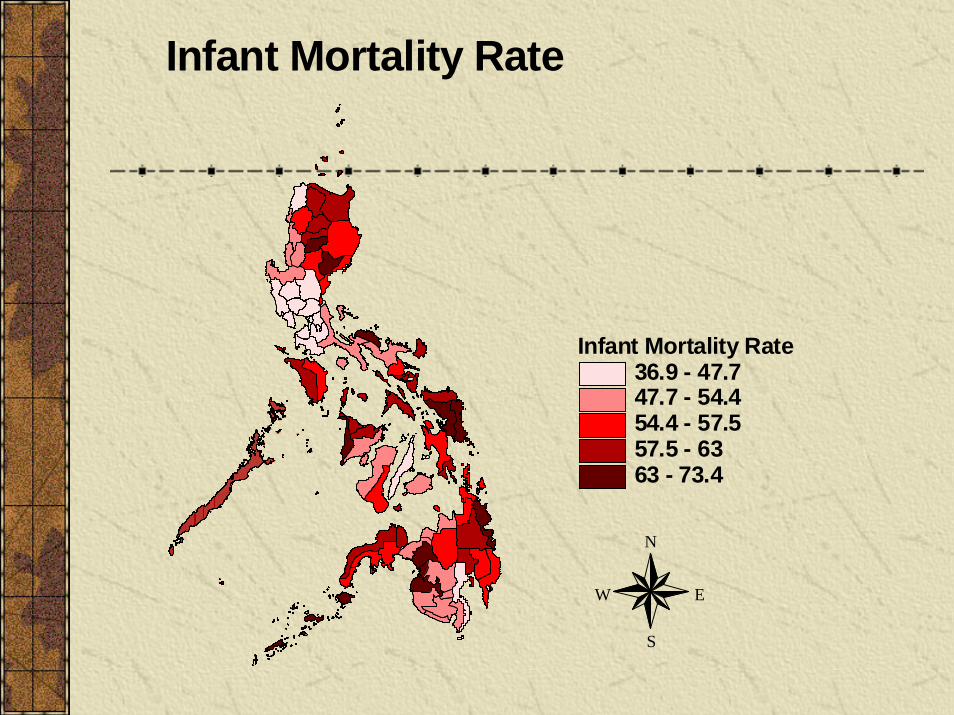
Infant Mortality Rate
Infant Mortality Rate36.9 - 47.747.7 - 54.454.4 - 57.557.5 - 6363 - 73.4
Robust relationshipNegative relationship between various development measures and Muslim Mindanao quite robust
Even if you control for geographic variables (climate, topography, etc.) and access and infrastructure variables (road density, presence of port, etc.) and even initial conditions (proxied by poverty incidence in 1990), a dummy variable for Muslim Mindanao provinces still has strong explanatory power (Monsod et al.)

Robust relationshipControlling for all these other variables, on average,
in Muslim Mindanao
poverty incidence is 32 percentage points higher
per capita income P11,000 lower (2000 value)
cohort survival rate 31 percentage points lower
infant mortality rate 15 points higher
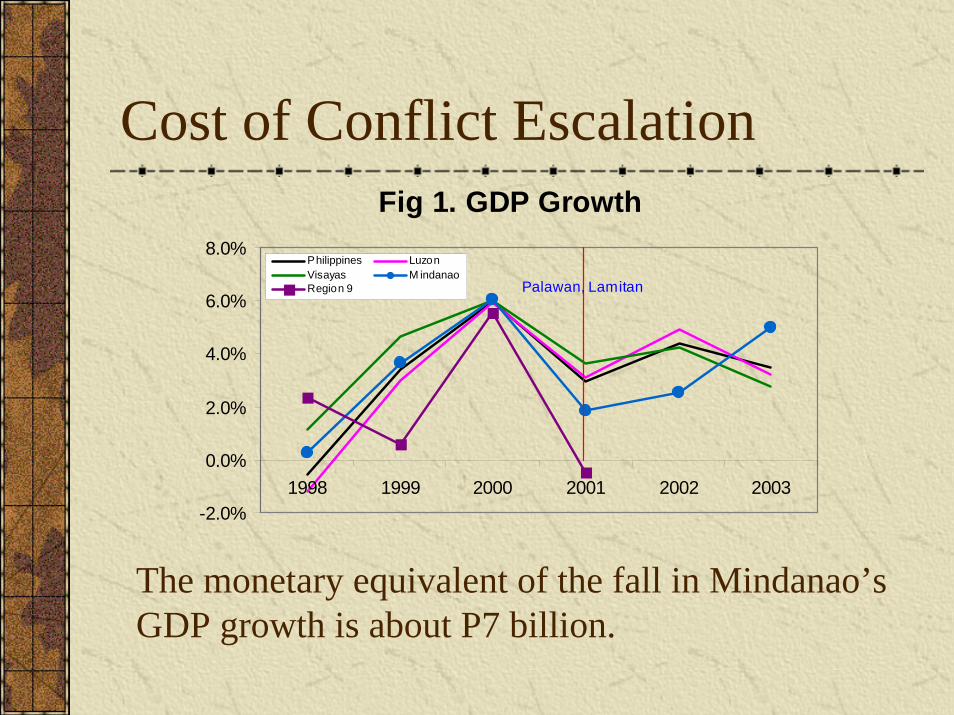
Cost of Conflict EscalationFig 1. GDP Growth
-2.0%
0.0%
2.0%
4.0%
6.0%
8.0%
1998 1999 2000 2001 2002 2003
Philippines LuzonVisayas M indanaoRegion 9 Palawan, Lamitan
The monetary equivalent of the fall in Mindanao’s GDP growth is about P7 billion.

Cost of Conflict Escalation
Investments fell after Palawan/Lamitan and has yet to recover.
Investments Growth (Durable Equipment)
-10.0%
-5.0%
0.0%
5.0%
10.0%
15.0%
20.0%
25.0%
1999 2000 2001 2002 2003
Luzon Visayas
M indanao
Palaw an, Lamitan

Cost of Conflict Escalation
The no. of discouraged workers hit a historical high in Mindanao 2001.
Growth in No. of Discouraged Workers
-20.0%
-10.0%
0.0%
10.0%
20.0%
30.0%
40.0%
50.0%
1997 1998 1999 2000 2001 2002
Luzon Visayas Mindanao
Palawan, Lamitan

Illustrative Case: Marawi
Figure 1. % of Population 25 yrs and Over that Finished College
0.0
5.0
10.0
15.020.0
25.0
30.0
35.0
40.0
Marawi
Cotaba
toButu
an
Iligan
Tagu
mZa
mboan
gaGen
. San
tos
Cagay
an de
Oro
Davao
Philipp
ines
Source: APIS 2002

Illustrative Case: Marawi
Figure 2. % of Workers in Industry
0.0
5.0
10.0
15.0
20.0
25.0
Marawi
Cotaba
toButu
an
Iligan
Tagu
mZa
mboan
gaGen
. San
tos
Cagay
an de
Oro
Davao
Philipp
ines
Source: APIS 2002

Illustrative Case: Marawi
Table 1. # of Manufacturing Enterprises and Financial
Establishment in Mindanao Cities
City Mfg Enterprises Banks and Pawnshops
Marawi 80 9 Cotabato 114 35 Butuan 316 81 Iligan 100 41 Zamboanga 224 65 Gen. Santos 141 57 Cagayan de Oro 271 169 Davao 740 252 Source: 2000 Census

Illustrative Case: MarawiTable 2. Tax and Non-tax Revenues, 2000 (Million Pesos)
City
Total Revenues (including non-tax)
Real Property
Tax Business
Tax Marawi 4.987 0.673 1.258Cotabato 91.323 10.119 21.704Butuan 159.902 23.980 46.830Iligan 220.836 73.119 69.733Tagum 175.681 33.386 34.348Zamboanga 435.452 40.815 92.763General Santos 332.900 61.390 75.576Cagayan de Oro 320.653 68.883 160.054Davao 1026.140 218.253 314.413Source:
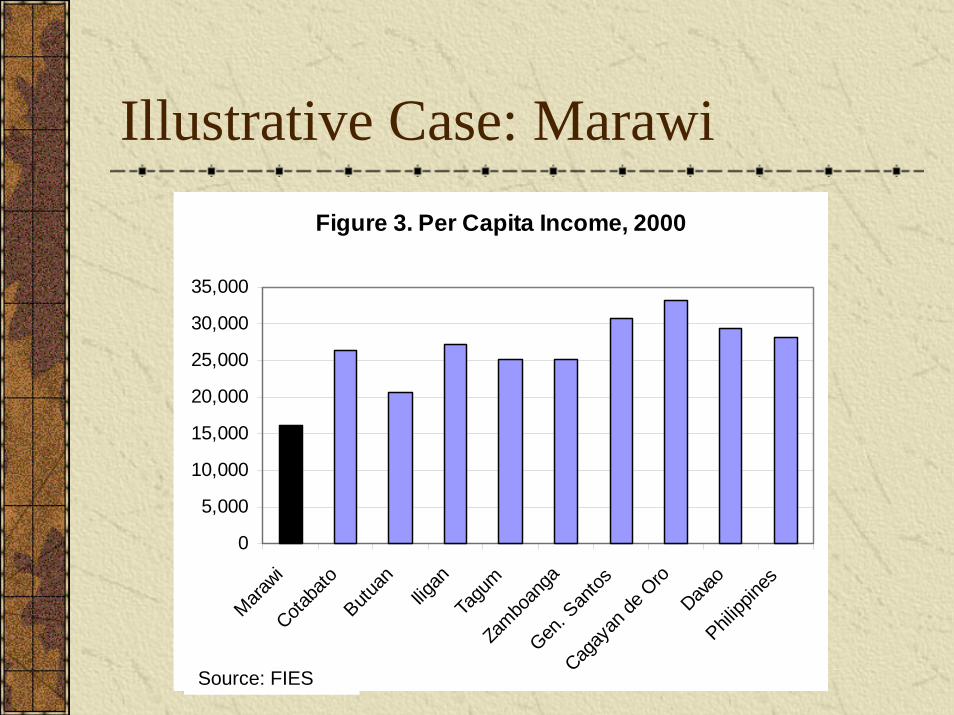
Illustrative Case: Marawi
Figure 3. Per Capita Income, 2000
0
5,000
10,000
15,000
20,000
25,000
30,000
35,000
Marawi
Cotaba
toButu
an
Iligan
Tagu
mZa
mboan
gaGen
. San
tos
Cagay
an de
Oro
Davao
Philipp
ines
Source: FIES
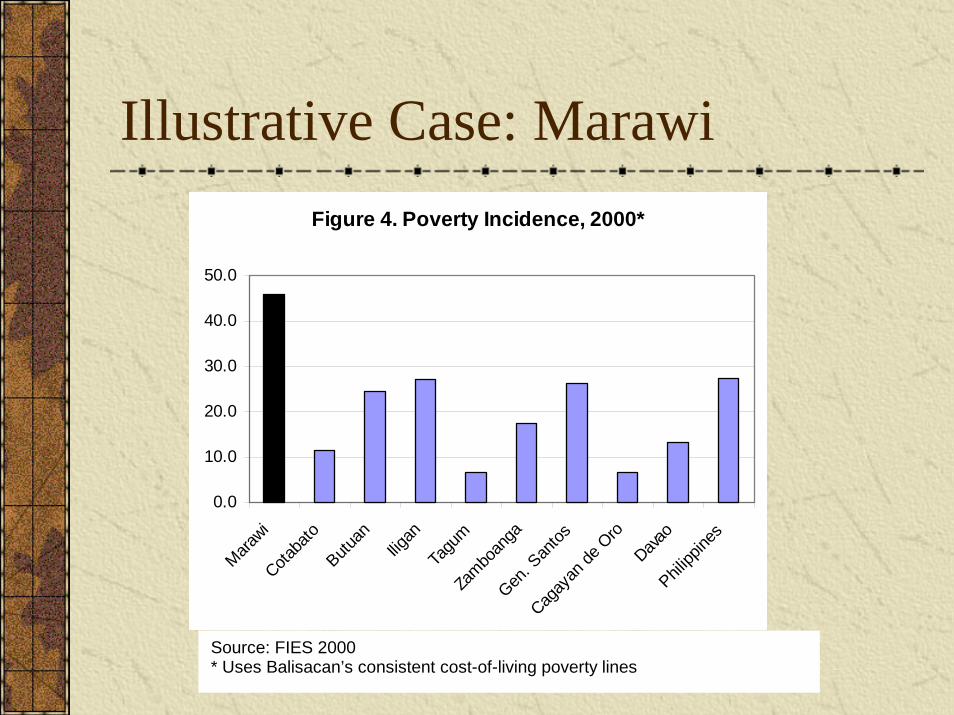
Illustrative Case: Marawi
Source: FIES 2000 * Uses Balisacan’s consistent cost-of-living poverty lines
Figure 4. Poverty Incidence, 2000*
0.0
10.0
20.0
30.0
40.0
50.0
Marawi
Cotaba
toButu
an
Iligan
Tagu
mZa
mboan
gaGen
. San
tos
Cagay
an de
Oro
Davao
Philipp
ines