Macroeconomic Issues AMBA Managerial Economics Macroeconomics I.

1
Macroeconomic and Fiscal Issues in Scaling Up Human Resources for Health in Low-Income Countries
Background Paper Prepared for the World Health Report 2006
October 21, 2005
Marko Vujicic Human Development Network
The World Bank, Washington DC
Correspondence: [email protected]
.
This paper reflects the views of the author and not necessarily those of The World Bank.

2
Introduction Across all regions, progress toward the health-related Millennium Development Goals (MDGs) has been elusive and has been slowest among all the MDGs. Based on current trends, no region is on track to reach the child mortality goal (Goal 4), only one region is on track to reach the maternal mortality goal (Goal 5), and HIV/AIDS, malaria and tuberculosis continue to spread in several regions (Goal 6). Figure 1. Trends in Child Mortality, MDG Goal 4.
Source: World Bank 2005 It is increasingly clear that weak health systems capacity in developing countries is one of the key factors that constrains scaling up health service delivery and improving population health. While health systems rely on several inputs in order to function effectively, currently one of the key health systems constraints is insufficient human resources for health capacity (Wagstaff and Claeson 2004, Narasimhan et al 2004, Joint Learning Initiative 2004). There is growing consensus that in several developing countries, particularly within sub-Saharan Africa there is no way to expand health service delivery unless there is a rapid scaling up of human resources for health capacity. There are also indications that lack of health care providers in several Africa countries is significantly impeding the disbursement of funds from global health initiatives such as the Global Fund for AIDS, Tuberculosis and Malaria and as services simply can not be delivered without the necessary trained people who are in short supply. While in sub-Saharan Africa the main issue is the shortage of health care workers, issues surrounding

3
geographic distribution, skill mix, productivity, quality of care and performance are extremely relevant in other regions. Scaling up the health workforce to the levels required to strengthen health systems and accelerate progress toward the MDGs will require significant increases in resources devoted to the health sector. This is particularly true within sub-Saharan Africa where, on average, human resources for health are in extremely short supply in countries (Figure 2). However, there has been little discussion and even less analytic work addressing the feasibility of increasing expenditure on human resources for health given the macroeconomic conditions in low-income countries. With the recent resolve on the part of the international community in working with countries to address the ir health workforce issues this discussion is vital. Currently governments within sub-Saharan Africa, for example, spend 50-85% of their recurrent health budget on salaries for health care workers. Any increase in health workforce spending, if it is to be achieved mainly through the public sector, will have significant implications on health budgets, the total civil service payroll and the overall fiscal framework of governments. Depending on the source of the increased resources (i.e. domestic resources, donor aid) there are several important economy-wide macroeconomic impacts that may be relevant and that countries ought to consider. This paper discusses the fiscal and macroeconomic implications associated with scaling up health workforce capacity. While these general issues and concepts are relevant in all setting, the focus of the discussion is on low-income countries and sub-Saharan Africa in particular. This paper draws heavily on two recent publications related to fiscal space: Williams and Hay (2005), Heller (2005). Figure 2. Health Worker Density (per 1,000 Population) by Region.
Source: Joint Learning Initiative 2004
The Amount of Additional Resources Needed to Scale up Human Resources for Health in Low Income Countries There have been several recent attempts to quantify the gap in human resources for health capacity in low income countries (in terms of numbers of health workers) and to estimate
4
the resource requirements to fill these gaps (both in terms of investment and recurrent costs). The financing gap refers to the difference between current expenditure on human resources for health (usually restricted recurrent salary and training costs) and what would be required in order to attain some objective such as reaching the health MDGs, delivering anti- retroviral treatment to a certain number of people, or delivering a basic essential health package. These estimates of the gap in human resources for health can be estimated at the global, regional, country of service delivery level. Moreover, there have been several recent thorough studies of the financing gap for health expenditures in general, not just for human resources for health. These studies provide useful insight into the scale of resources required in the health sector to achieve the MDGs while not directly estimating the financing gap for human resources for health. One method of estimating the global and regional shortage of health care workers in aggregate is to apply the health worker per population level that is estimated to be sufficient for providing key MDG health interventions and comparing this to current levels. Using this method the Joint Learning Initiative has estimated that in sub-Saharan Africa as a whole, 1 million additional health workers are required to scale up the workforce to sufficient levels (Joint Learning Initiative 2004). Ethiopia would require an additional 150,000 workers. The Democratic Republic of Congo and Nigeria would both require 90,000. Given that sub-Saharan Africa is the region that is furthest off track to reach the MDGs, there is a health workforce crisis in this region that needs to be addressed if progress is to be made (Chen, Evans et al 2004). Globally the shortfall is estimated to be around 4 million health workers, including 285,000 in Bangladesh. The authors do not attempt to cost this shortage to attain a financing gap. At the country level much more detailed analysis is available. For example, based on the estimates of the human resources for health levels required in order to provide the population with key health services necessary to achieve the MDG, it is possible to estimate the shortage of health workers – the gap between what is needed and what is actually available. At the country level, Kurowski et al (2003) carry out such an analysis for Tanzania, estimating the health workforce size up to 2015 given expected increments (e.g. from training institutions) and losses (e.g. from death) and the health workforce needed in order to provide key MDG related services. By 2015 they estimate human resources for health requirement to be over 98,000 full- time equivalents (FTEs) while the actual availability is estimated to be just over 36,000. Thus, Tanzania will need twice as many health workers in 2015 as it expects to have. A similar study for Chad concluded that about 19,000 FTEs will be required in 2015 compared to an actual number expected of about 3,500 FTEs. There are also analyses of the human resources requirements for specific disease interventions. There is estimated to be a 36% shortage of physicians in Ethiopia if the PEPFAR target for anti- retroviral treatment is to be met while there appears to be no shortage for other cadres of health workers (Kombe, Galaty et al 2005). In Zambia the requirement for curative and preventive services for HIV/AIDS patients is equivalent to 206 doctors by 2008, representing close to one-third of the existing doctor workforce in the country. The need for 211 technicians represents about 65% of Zambia’s 325 public

5
sector lab technicians and technologists. At the same time, however, the requirement of 261 nurses represents only 2% of the existing workforce in that category, serving to highlight the need to reassign as much of the doctor’s role to nurses as possible. Such estimates indicate that the implications of meeting the HIV/AIDS treatment target requirement on the delivery of other priority health services are substantial (Curran, Debas et al 2005). Figure 3. Human Resources for Health Requirements and Availability - Tanzania
0
20,000
40,000
60,000
80,000
100,000
120,000
FT
Es
HRA 42,620 40,380 36,390
HRR 33,250 67,630 98,960
2002 2007 2015
Source: Kurowski et al 2003. There has been much more analysis of the overall health financing gap in low-income countries, not specifically focusing on the human resources for health component of the financing gap. These estimates provide an idea of the scale of expenditure increases required in order to improve health outcomes to MDG levels. The Millennium Project provides cost estimates for the MDGs in low income countries, and suggests that in these countries per capita levels of expenditure on health would need to increase by $30-48 by 2015 in order to achieve the health MDGs. The Commission for Macroeconomics and Health calculated that a minimum total health expenditure of $34 per capita by 2007 (rising to $38 in 2015) would be required to provide a basic package of essential health interventions (Williams and Hay 2005). Public health spending in a sample of 55 low income countries is below this level in all but two cases. Average expenditure is $6.17 per capita per annum or 2.53% of GDP. There are significant variations between countries, but very few countries spend more than 5% of GDP. Average public expenditure per capita on health in low income countries rose by 12% from $5.49 in 1998 to $6.17 in 2002. Expressed as a percentage of GDP public expenditure on health rose from 2.26% to 2.53% over the same period. The World Bank has collected preliminary country level estimates of the additional resources required to achieve the health MDGs using various methods: removing bottlenecks to accelerate progress toward the health MDGs (MBB method), what it will cost to achieve the health MDGs (MP estimates), additional expenditure estimates to

6
reach the MDG in selected countries based on measured elasticities (Elasticity), and/or additional health expenditures per capita under an optimized allocation framework (MAM). The estimates are presented in Figure 4 for illustration of orders of magnitude and should not be used for inter-country comparison or comparison across tools since each tool involves a different set of assumptions (World Bank forthcoming). Figure 4. Alternative Estimates of Additional Health Expenditure Required Using Different Methods (per capita per year in 2000 US$)
Country Model Used Addi tional Health Expenditure Required
Mali (one region) MBB
Elasticity
$3.9 (2003)
$6.8 (2003)
Madagascar (Toamasina) MBB
Elasticity
$2.4 (2003)
$6.7 (2003)
Ethiopia
MBB/MP
Elasticity
MAM
$12 (2015)
$11.0 (2015)
$15.0 (2015)
Bangladesh MP
Elasticity
$20.6 (average 2005-2015)
$16.9 (average 2005-2015)
Cambodia MP
Elasticity
$22.5 (average 2005-2015)
$37.4 (average 2005-2015)
Ghana MP
Elasticity
$24.7 (average 2005-2015)
$23.7 (average (2005-2015)
Uganda MP
Elasticity
$32.1 (average 2005-2015)
$40.6 (average 2005-2015)
Tanzania MP
Elasticity
$34.7 (average 2005-2015)
$66.9 (average 2005-2015)
Source: Millennium Project, World Bank staff estimates This brief review of estimates of the financing gap for human resources for health and for health expenditure in general demonstrates that in low-income settings, large increases are required – often a doubling or tripling of expenditure. The focus of this paper is to discuss the various ways governments may finance the increased expenditure in the health sector, including on human resources for health and the macroeconomic implications of various policy options. It is useful to discuss this in the context of fiscal space and fiscal sustainability.
The Concepts of Fiscal Space and Fiscal Sustainability1 1 This section draws heavily on Williams and Hay (2005) and Heller (2005) with some sections taken directly from Williams and Hay (2005).
7
Fiscal Space Fiscal space refers to the capacity of government to make budgetary resources available for desired purposes. However, the term has been used in different ways, and its precise definition remains somewhat unclear. More restrictive interpretations of fiscal space emphasize hard budget constraints and expenditure ceilings that are designed to ensure macroeconomic stability and the availability of credit to the private sector. Advocates of a more flexible approach argue that it should be possible to support higher levels of public expenditure on meritorious goods and services that are crucial for poverty reduction, growth and achieving the MDGs (Williams and Hay 2005). The following definition of fiscal space taken from a recent IMF paper has been adopted here because it is sufficiently broad to encompass all of the key issues that influence judgments on the appropriate level of public expenditure.
“Fiscal space can be defined as the availability of budgetary room that allows a government to provide resources for a desired purpose without any prejudice to the sustainability of a government’s financial position.” (Heller 2005)
While this paper is specifically concerned with issues surrounding public expenditure in the health sector and specifically, human resources for health, it is not possible to restrict the view of fiscal space to one particular sector. The budgetary resources made available to the health sector depend on the government’s overall fiscal policies, the demands of competing sectors, and spillover effects from one sector to another. Spillover effects are particularly evident in the way government health sector budgets are set. For example, they are affected by government-wide decisions on civil service wages. In addition, spending in other sectors, such as education, water and sanitation and roads, influence health outcomes and may have budgetary implications for the health sector. In any event, the size of the health budget is the result of a set of political decisions on the allocation of public resources between competing priorities. In principle, there are several ways to create fiscal space for additional health spending that reflect the government’s budget arithmetic. Each offers opportunities, but also has limits. Well managed fiscal policy assesses the costs and benefits of each, as well as their political implications (Williams and Hay 2005). i) Increase discretionary expenditure from debt reduction In a number of cases fiscal space available in low income countries for spending on public services, including health, is constrained by their obligations to debt servicing. In a few cases, these obligations may amount to around 50 % of total public spending; hence the significance of recent initiatives to reduce low income country public debt. ii) Reallocation between sectors

8
Health sector spending can be increased by reallocating expenditure from other sectors. As part of HIPC and PRSP processes many governments in low income countries have increased the share of the budget allocated to the health sector, and some are committed to further increases. However, the demands of other sectors will inevitably impose a limit on the share of expenditure that can be allocated to health. iii) Mobilization of domestic revenues Governments can raise additional revenues by increasing tax rates, creating new taxes and levies and improving tax collection. The low tax effort in many low income countries (usually less than 15% of GDP) indicates that there may be considerable scope to mobilize additional domestic revenues, although some policy managers are concerned about the disincentives for economic growth if the tax rate rises much above 20% of GDP. It is vital to foster economic growth, which will raise incomes and economic activity, and thereby boost government revenues in the longer term. iv) Increase borrowing Governments can also finance higher levels of public spending by borrowing from domestic and foreign creditors and increasing their fiscal deficit. However, there are costs in terms of future debt service obligations and the potential crowding out of private sector borrowing. A sound fiscal principle is that over the economic cycle governments should borrow only to invest rather than to finance recurrent expenditure. While health expenditures are generally treated as recurrent expenditure, many have argued that they should be viewed as an investment in human capital that will generate taxable returns in the long run. If this view is accepted then it would be justified to finance a higher level of public expenditure on health through borrowing so long as the expected returns exceed the costs of servicing the debt. v) Increase aid The fiscal space that is generated by aid depends on the level of donor funding, as well as on the type of aid. It is important to consider whether or not aid enters the government’s budget, whether aid is earmarked for a particular use or sector, and the extent to which it is fungible. vi) Seignorage Governments can finance additional expenditure by printing money, but the opportunities to generate seignorage revenues without causing inflation are very limited. Fiscal Sustainability The concept of fiscal sustainability refers to the ability of government to sustain spending on a desired purpose for its planned duration, and to meet the cost of borrowing without compromising the government’s financial position. There are three conditions that need

9
to be met in order to achieve fiscal sustainability in a strict sense (Williams and Hay 2005): § For expenditures funded by loans the financial returns generated by the
additional expenditure should cover the costs of borrowing. § For recurrent expenditures funded by donor grants, if these expenditure levels
are to continue beyond the planned period of donor funding, governments must be able to raise alternative sources of revenue to replace donor funding when it is phased out.
§ For all investments, governments must be able to cover the recurrent costs of any new capital investment, for example the operation and maintenance costs of the construction of a new health facility, as well as the costs of capital.
Health sector spending presents particular challenges in relation to all three of these conditions. With respect to the first, it is usually impossible to assess whether or not it is justified on economic grounds to borrow in order to finance health spending because there is considerable uncertainty about the economic impact of health programs and the level and timing of any financial return. Haacker (2004) estimates that for countries with prevalence rates over 20%, HIV/AIDS is costing the economy between 1.0 and 1.5% in terms of lost GDP growth rates. A large part of this cost in lost economic output is due to the fact that HIV/AIDS primarily afflicts adults of the working age population who would otherwise be active in the labor force (Epstein 2004). Therefore, it may be reasonable to allow a certain level of borrowing on concessional terms to finance health programs in low income countries so long as the government’s overall financial position provides sufficient capacity to service the consequent debt. In relation to grants, the planned duration of health programs usually far exceeds the duration of donor commitments, which typically only cover a few years. This is particularly relevant when considering whether human resources for health expenditures can be expanded through increased donor funding. The health labor market is associated with significant rigidities and barriers to entry/exit (Vujicic et al 2004). Moreover, the current paradigm of employing health care workers is to make them part of the public sector civil service (i.e. most public sector health workers are civil servants in low income countries). Increasing staffing levels, therefore, often creates long term liabilities for the government – salary costs, allowances, pension payments. Since public sector employees have the highest levels of job security – often guaranteed a job for their entire life in low-income countries – the government assumes long term recurrent cost increases when expanding the health workforce (see Box 1). Box 1: Government Policy, the IMF and World Bank and the Fight against HIV/AIDS in Zambia The Zambian AIDS epidemic has contributed to government woes as it saps the civil service, raises cost of health care with HIV and opportunistic infections (OI) care, and leaves large numbers of orphans in its wake. With 16 percent of the population and 30 percent of pregnant women diagnosed as HIV positive there is no doubt that Zambia faces a crisis. HIV/AIDS is estimated to have reduced annual economic growth by one percent per year as the epidemic has spread unchecked. Efforts to scale up HIV/AIDS spending have met a series of setbacks.
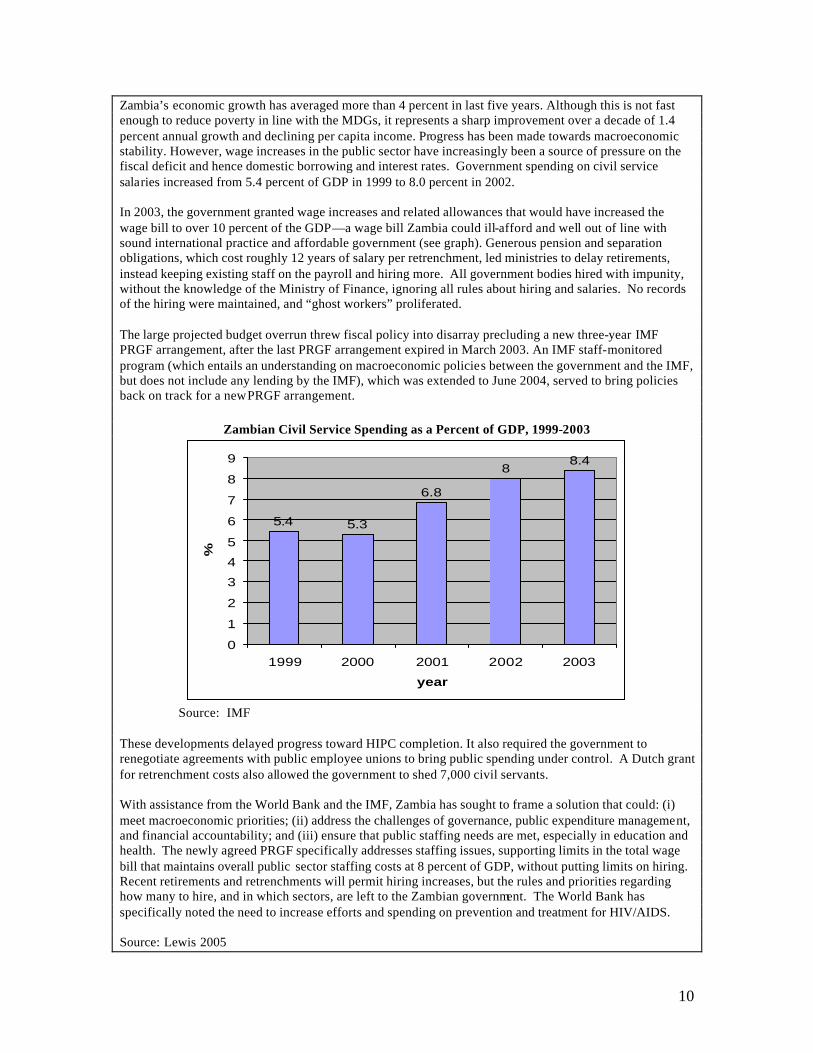
10
Zambia’s economic growth has averaged more than 4 percent in last five years. Although this is not fast enough to reduce poverty in line with the MDGs, it represents a sharp improvement over a decade of 1.4 percent annual growth and declining per capita income. Progress has been made towards macroeconomic stability. However, wage increases in the public sector have increasingly been a source of pressure on the fiscal deficit and hence domestic borrowing and interest rates. Government spending on civil service salaries increased from 5.4 percent of GDP in 1999 to 8.0 percent in 2002. In 2003, the government granted wage increases and related allowances that would have increased the wage bill to over 10 percent of the GDP—a wage bill Zambia could ill-afford and well out of line with sound international practice and affordable government (see graph). Generous pension and separation obligations, which cost roughly 12 years of salary per retrenchment, led ministries to delay retirements, instead keeping existing staff on the payroll and hiring more. All government bodies hired with impunity, without the knowledge of the Ministry of Finance, ignoring all rules about hiring and salaries. No records of the hiring were maintained, and “ghost workers” proliferated. The large projected budget overrun threw fiscal policy into disarray precluding a new three-year IMF PRGF arrangement, after the last PRGF arrangement expired in March 2003. An IMF staff-monitored program (which entails an understanding on macroeconomic policies between the government and the IMF, but does not include any lending by the IMF), which was extended to June 2004, served to bring policies back on track for a new PRGF arrangement.
Zambian Civil Service Spending as a Percent of GDP, 1999-2003
5.4 5.3
6.8
88.4
0
1
2
3
4
5
6
7
8
9
1999 2000 2001 2002 2003
year
%
Source: IMF These developments delayed progress toward HIPC completion. It also required the government to renegotiate agreements with public employee unions to bring public spending under control. A Dutch grant for retrenchment costs also allowed the government to shed 7,000 civil servants. With assistance from the World Bank and the IMF, Zambia has sought to frame a solution that could: (i) meet macroeconomic priorities; (ii) address the challenges of governance, public expenditure management, and financial accountability; and (iii) ensure that public staffing needs are met, especially in education and health. The newly agreed PRGF specifically addresses staffing issues, supporting limits in the total wage bill that maintains overall public sector staffing costs at 8 percent of GDP, without putting limits on hiring. Recent retirements and retrenchments will permit hiring increases, but the rules and priorities regarding how many to hire, and in which sectors, are left to the Zambian government. The World Bank has specifically noted the need to increase efforts and spending on prevention and treatment for HIV/AIDS. Source: Lewis 2005
11
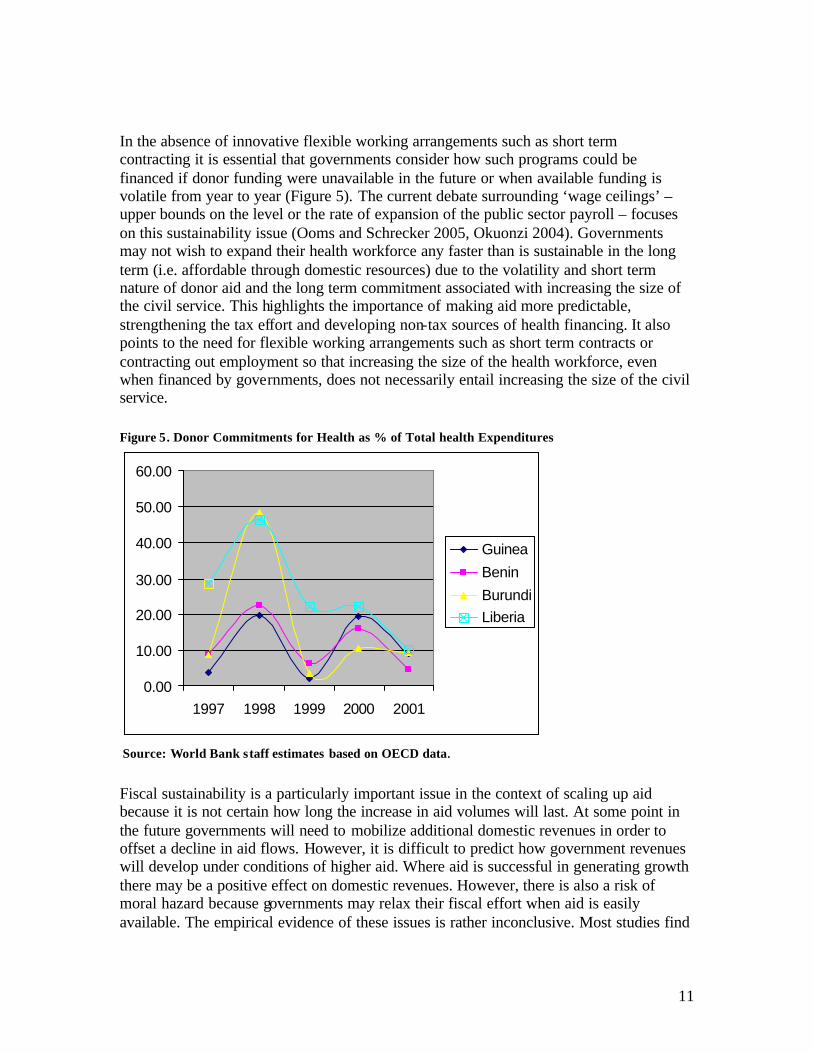
In the absence of innovative flexible working arrangements such as short term contracting it is essential that governments consider how such programs could be financed if donor funding were unavailable in the future or when available funding is volatile from year to year (Figure 5). The current debate surrounding ‘wage ceilings’ –upper bounds on the level or the rate of expansion of the public sector payroll – focuses on this sustainability issue (Ooms and Schrecker 2005, Okuonzi 2004). Governments may not wish to expand their health workforce any faster than is sustainable in the long term (i.e. affordable through domestic resources) due to the volatility and short term nature of donor aid and the long term commitment associated with increasing the size of the civil service. This highlights the importance of making aid more predictable, strengthening the tax effort and developing non-tax sources of health financing. It also points to the need for flexible working arrangements such as short term contracts or contracting out employment so that increasing the size of the health workforce, even when financed by governments, does not necessarily entail increasing the size of the civil service. Figure 5. Donor Commitments for Health as % of Total health Expenditures
0.00
10.00
20.00
30.00
40.00
50.00
60.00
1997 1998 1999 2000 2001
Guinea
Benin
BurundiLiberia
Source: World Bank staff estimates based on OECD data.
Fiscal sustainability is a particularly important issue in the context of scaling up aid because it is not certain how long the increase in aid volumes will last. At some point in the future governments will need to mobilize additional domestic revenues in order to offset a decline in aid flows. However, it is difficult to predict how government revenues will develop under conditions of higher aid. Where aid is successful in generating growth there may be a positive effect on domestic revenues. However, there is also a risk of moral hazard because governments may relax their fiscal effort when aid is easily available. The empirical evidence of these issues is rather inconclusive. Most studies find
12
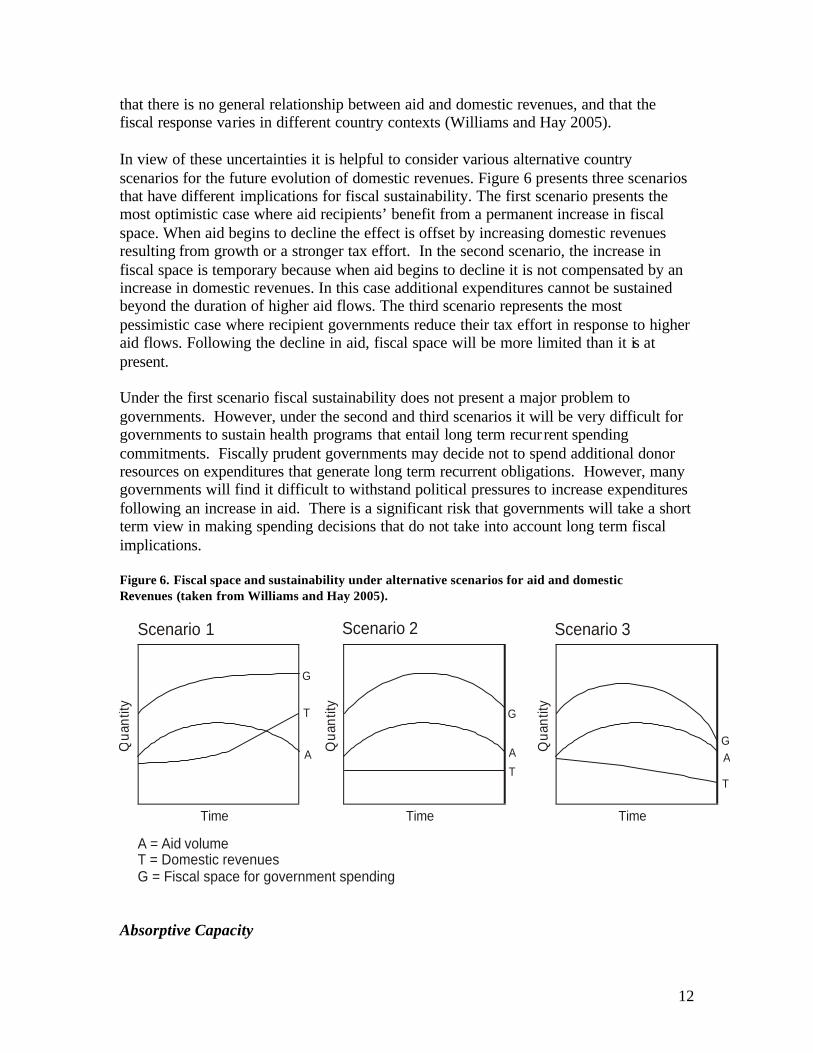
that there is no general relationship between aid and domestic revenues, and that the fiscal response varies in different country contexts (Williams and Hay 2005). In view of these uncertainties it is helpful to consider various alternative country scenarios for the future evolution of domestic revenues. Figure 6 presents three scenarios that have different implications for fiscal sustainability. The first scenario presents the most optimistic case where aid recipients’ benefit from a permanent increase in fiscal space. When aid begins to decline the effect is offset by increasing domestic revenues resulting from growth or a stronger tax effort. In the second scenario, the increase in fiscal space is temporary because when aid begins to decline it is not compensated by an increase in domestic revenues. In this case additional expenditures cannot be sustained beyond the duration of higher aid flows. The third scenario represents the most pessimistic case where recipient governments reduce their tax effort in response to higher aid flows. Following the decline in aid, fiscal space will be more limited than it is at present. Under the first scenario fiscal sustainability does not present a major problem to governments. However, under the second and third scenarios it will be very difficult for governments to sustain health programs that entail long term recur rent spending commitments. Fiscally prudent governments may decide not to spend additional donor resources on expenditures that generate long term recurrent obligations. However, many governments will find it difficult to withstand political pressures to increase expenditures following an increase in aid. There is a significant risk that governments will take a short term view in making spending decisions that do not take into account long term fiscal implications. Figure 6. Fiscal space and sustainability under alternative scenarios for aid and domestic Revenues (taken from Williams and Hay 2005).
Time
Qua
ntity
A
T
G
Time
Qua
ntity
A
T
G
Time
Qua
ntity
A
T
G
Scenario 1 Scenario 2 Scenario 3
A = Aid volumeT = Domestic revenuesG = Fiscal space for government spending
Absorptive Capacity
13
The debate about scaling up aid has also highlighted the question of whether recipient countries have the capacity to absorb large increases in aid flows. The term absorptive capacity is not precisely defined, but is commonly used to refer to the policy and institutional constraints that prevent additional funds from being used effectively. These include the weakness of budgeting systems, failures in public administration, shortages and mismanagement of human resources and skills, and broader governance failures, including corruption. Absorptive capacity constraints may mean that governments cannot effectively utilize additional fiscal space. In the context of scaling up aid, absorption constraints may generate increasing inefficiencies and waste. Where aid resources are not invested productively opportunities to generate fiscal space through economic growth will be missed (Williams and Hay 2005, World Bank forthcoming). The most difficult absorption problems usually relate to concerns about governance, public accountability and the risk of corruption. There are often very serious weaknesses in planning and management capacities that prevent resources being delivered `on the ground’, where they are needed. Public institutions often fail to provide incentives to use resources efficiently and to respond to user demands. Where oversight and financial controls are lacking there is a serious risk of corruption. To a certain extent technical assistance funded by donors can help to improve systems of public sector management. However, in most cases there is a need for broad ranging public sector reform, which will depend more on high level political commitment than on donor aid. A recent study of health financing in 14 countries found that there were few technical barriers to scaling up aid, and that many types of absorption constraint could be addressed through well targeted donor assistance. However, the weakness of governance and public sector management was found to be a serious absorption constraint in several countries. In two countries (Tajikistan and Cambodia) governance and expenditure management constraints were judged to be so pervasive that major reforms would be needed to precede or accompany increased funding. In another two cases (Benin, Burkina Faso) government procedures were found to be over-centralized and bureaucratic, and in need of reform in order to permit available funding to be spent (Foster 2004). A study in which the quality of policies and institutions in countries was measured by the Country Policy and Institutional Assessments (CPIA), indicate the importance of institutions and governance in enabling effective health policy (Wagstaff and Claeson 2004). The CPIA index assesses how conducive the policy and institutional framework is to fostering poverty reduction, sustainable growth, and the effective use of development assistance. The index covers four broad categories: economic management, structural policies, policies for social inclusion and equity, and public sector management, and institutions. Countries are rated on several performance criteria with scores ranging from 1 (poor performance) to 6. Empirical analysis found that the elasticity of health outcomes with respect to expenditure depended on a country’s CPIA score. The elasticity increases in absolute size – government spending has a larger impact on health outcomes at the margin – in better-
14
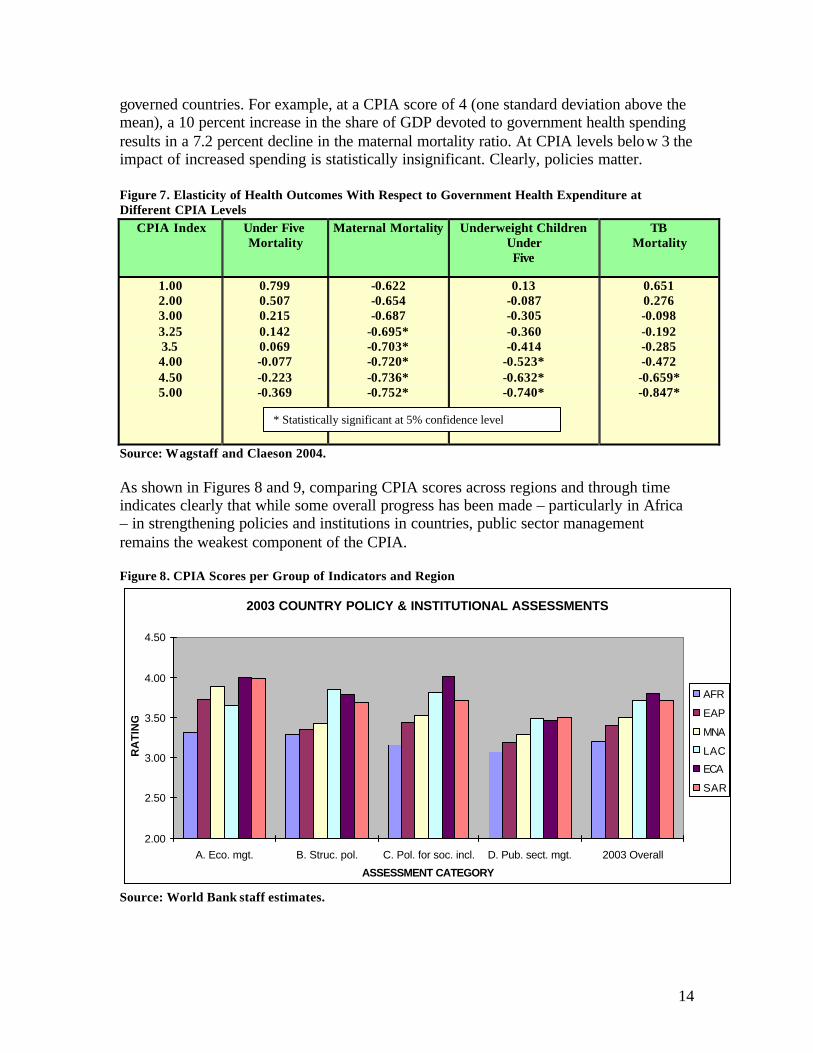
governed countries. For example, at a CPIA score of 4 (one standard deviation above the mean), a 10 percent increase in the share of GDP devoted to government health spending results in a 7.2 percent decline in the maternal mortality ratio. At CPIA levels below 3 the impact of increased spending is statistically insignificant. Clearly, policies matter. Figure 7. Elasticity of Health Outcomes With Respect to Government Health Expenditure at Different CPIA Levels
CPIA Index Under Five Mortality
Maternal Mortality Underweight Children Under Five
TB Mortality
1.00 2.00 3.00 3.25 3.5 4.00 4.50 5.00
0.799 0.507 0.215 0.142 0.069 -0.077 -0.223 -0.369
-0.622 -0.654 -0.687
-0.695* -0.703* -0.720* -0.736* -0.752*
0.13 -0.087 -0.305 -0.360 -0.414
-0.523* -0.632* -0.740*
0.651 0.276 -0.098 -0.192 -0.285 -0.472 -0.659* -0.847*
Source: Wagstaff and Claeson 2004. As shown in Figures 8 and 9, comparing CPIA scores across regions and through time indicates clearly that while some overall progress has been made – particularly in Africa – in strengthening policies and institutions in countries, public sector management remains the weakest component of the CPIA. Figure 8. CPIA Scores per Group of Indicators and Region
2003 COUNTRY POLICY & INSTITUTIONAL ASSESSMENTS
2.00
2.50
3.00
3.50
4.00
4.50
A. Eco. mgt. B. Struc. pol. C. Pol. for soc. incl. D. Pub. sect. mgt. 2003 Overall
ASSESSMENT CATEGORY
RA
TIN
G
AFR
EAP
MNA
LAC
ECA
SAR
Source: World Bank staff estimates.
* Statistically significant at 5% confidence level

15
Figure 8. CPIA Scores by Region 1999-2003
CPIA Scores by Region
0.00.51.01.52.02.53.03.54.0
AF
R
EA
P
MN
A
LAC
EC
A
SA
R
All
coun
tries
1999
2002
2003
Source: World Bank staff estimates
Policy Levers to Increase Fiscal Space Given the current macroeconomic environment, what are feasible methods for governments to increase fiscal space for the health sector and for human resources for health in particular? Each of the policy options are discussed in this section with particular emphasis on historical trends in key variables and expected future developments. Reallocation of Expenditure Toward the Health Sector and Human Resources for Health Figure 9 groups low income countries according to the share of health spending in total public spending. The majority of low income countries allocate less than 10% of the government budget to health spending, and that very few countries spend more than 15% of their budget on health. The threshold of 15% is relevant because in 2001 African leaders signed a resolution calling on all 53 African nations to devote 15% of their national budgets to health care spending. This appears to be an effective ceiling on health spending that reflects the competing demands of other sectors and the political constraints to reallocating resources in favor of health (Williams and Hay 2005). Figure 9. Share of Health Expenditure in Government Budgets in Low-Income Countries

16
0 2.5 5 7.5 10 12.5 15 17.5 20 10 15 20 25 30 35 40
Share of health spending in total public expenditure % Public expenditure as % GDP
0
2
4
6
8
10
0
2
4
6
8
10
12
14
>20
%
Num
ber o
f cou
ntrie
s
Num
ber
of c
ount
ries
Source: Williams and Hay 2005. Hinchliffe (2004) sheds light on the pattern over time in health expenditures as a share of total government expenditures in 20 HIPC countries between 1998 and 2002. Figure 10 shows that the share increased on average for all 20 countries from 6.2% to 8.1%. Of the 20 countries, 13 showed increases in the share of Health Expenditures to Total Government Expenditures with exceptions being Guinea Bissau, Malawi and Zambia where the share remained essentially constant and Burkina Faso, Ethiopia, Madagascar and Mali where the share declined. Figure 10 shows that achieving this larger proportion of expenditures in health is proving to be a slow process. Debt relief for HIPC countries is important, yet one of the eligibility criteria for the program is for a country to be highly indebted and, thus, face difficulties in making debt payments. This implies that many of these countries will also find it difficult to make large increases in social spending. Of the 20 HIPC countries reported in Figure 10 only 4 reported expenditures in health above 10% of total government expenditures. Figure 10. Health Expenditure as Share of Total Government Expenditure. 1997-2002, Selected HIPC countries
1998 1999 2000 2001 2002 Benin 6.5 8.3 7.2 8.8 8.1 Burkina Faso 9.8 5.4 5.6 5.9 8.1 Cameroon 3.2 3.4 4.8 5.5 7.8 Etiopía 5.8 4.3 3.4 4.8 4.4 Ghana 2.7 3.3 3.0 3.7 5.7 Gambia 12.8 14.6 16.3 Guinea 4.4 4.4 4.2 7.5 6.5 Guinea-Bissau 4.3 3.5

17
Madagascar 3.6 2.8 2.7 4.4 2.7 Malawi 9.6 8.0 6.6 8.3 9.3 Mali 5.2 4.4 6.1 7.1 3.3 Mauritania 6.8 6.7 5.4 7.1 9.3 Mozambique 11.1 11.3 12.1 11.2 12.0 Níger 9.0 11.7 11.9 Rwanda 1.9 2.6 2.9 3.3 3.1 Senegal 4.9 5.2 5.8 8.7 11.7 Sierra Leone 4.7 5.4 6.8 8.1 Tanzania 8.5 7.3 9.1 10.1 Uganda 6.7 6.5 7.4 8.6 9.6
Zambia 6.9 5.5 4.7 4.7 6.9 Median 6.2 5.1 5.5 5.9 8.1 Source: Hinchliffe 2004. Reallocation of expenditures across sectors is a very difficult political process especially in resource-constrained environments. Essentially the government must weigh the benefits of increasing spending in the health sector against the benefits of devoting those resources to other sectors. In terms of the objectives of economic growth and poverty reduction it is difficult to measure the marginal impacts of expenditure in the health sector (and within the health sector for human resources) versus other sectors in the economy. Paternostro, Rajaram and Tiongson (2005) recently noted that
“there is growing concern regarding the wisdom of relying so heavily on social sector spending to promote poverty reduction. A different balance between social and other sectors, particularly infrastructure and rural development, may be warranted for mobilizing investment to promote growth, a necessary condition for sustainable poverty reduction.[…] In Uganda, it has been argued that roads, agriculture and water and sanitation may yield higher returns for employment and income creation than primary health care and education and that the Poverty Action Fund has promoted a narrow interpretation of pro-poor programs, skewing budget allocations away from programs that may have allowed greater poverty reduction”.
It is important for policy makers in the health care sector – who tend to be convinced of the need for increased spending – to demonstrate to Ministries of Finance that investments in the sector produce improved health outcomes and in turn, reduce poverty. In terms of the payoff of scaling up human resources for health, such evidence has been absent until very recently. Several studies have examined the relationship between the number of trained health care providers per population and various health outcomes with mixed conclusions. However, a recent study that uses more accurate, up to date data on human resources for health and controls for key socioeconomic determinants of health found a significant relationship between the availability of human resources for health and child mortality, infant mortality and maternal mortality – key MDG related outcomes (Anand and Barnighausen 2004). They found that, on average, a 10% increase in the number of trained health

18
workers per population (doctors, nurses, midwives) is associated with between a 5% and 2% decrease in mortality, controlling for per capita income, poverty, female literacy across 83 countries. Maternity mortality was most sensitive to human resources for health availability. The authors argue that this is expected given that skilled health workers can address a larger proportion of the conditions that lead to maternal mortality compared to the conditions that lead to infant or child mortality. Based on their results, Anand and Barnighausen (2004) conclude that
“investment in human resource can be expected to contribute significantly to the achievement of the MDGs – in addition to and independently of polices that bring about income growth, poverty reduction, and expansion of female education.”
Moreover, for key MDG-related health care interventions, there is a strong correlation between the availability of human resources for health and coverage. For example, countries with less than 1.5 health workers per 1,000 population are highly unlikely to have a measles immunization rate of 80% whereas this is almost assured in countries with a density of more than 2.5 (Joint Learning Initiative 2004). Coverage for skilled births attended is also very sensitive to the availability of human resources for health. It is much less likely that countries have over 80% of births attended by a skilled health worker if they have less than 2.5 health workers per 1,000 population. Studies have also examined the effect of reductions in human resources for health availability on health outcomes within countries. Beginning in 1992 in Indonesia health centers began reducing their staffing levels in response to budget cuts imposed by the government in its bid to reduce its fiscal deficit. The large reduction in staffing (1.8 to 1.2 physicians per health centre) led to a 39% increase in the child stunting rate (Barber and Gertler 2005). In the US and Canada there is evidence to suggest that reductions in nurse staffing levels in hospitals led to a decrease in quality of care and to an increase in mortality and complications for certain procedures (Aiken et al 1994, Aiken et al 2002, Needleman et al 2002) while other research suggests that for certain services, there was little or no, or sometimes even negative impact (Fisher and Wennberg 2003, Wright et al 2002). While these studies highlight the positive impact on health outcomes of increased human resources for health capacity in settings where health workers are scarce, they do not measure the relative benefit of investing in human resource versus other health inputs versus inputs outside of the health sector that improve health (i.e. roads, clean water, literacy). Thus, the empirical evidence addressing the impact of inter-sectoral resource transfers on growth, health status and poverty in different settings is relatively weak. There appears to be scope for governments in low-income countries to devote an increased share of domestic resources to the health sector. Within sub-Saharan Africa, most countries are well below the target of 15% of government spending devoted to health agreed to under the Abuja Declaration of 2001. However, the political economy associated with transferring government resources out of other sectors will be an

19
important factor in determining whether countries go through with their commitment to prioritize the health sector. Shifting health spending increasingly towards human resources for health may prove more difficult. Currently governments in low income countries already devote a large share of their health care budget to recurrent salary spending. Staff costs typically exceed 60% and can be as high as 75% of government health spending (Joint Learning Initiative 2004). As a result, there may be little room to increase resources devoted to salaries for health workers within current health care budgets in developing countries. Figure 11. Salary Spending 2 as a Proportion of Government Health Expenditure
0%
10%
20%
30%
40%
50%
60%
70%
1990
1991
1992
1993
1994
1995
1996
1997
1998
1999
2000
2001
2002
2003
Zambia
Malawi
Ethiopia
TanzaniaBenin
Ghana
Source: World Bank staff estimates Increasing the Level of Government Expenditure Figure 4 shows public expenditure as a percentage of GDP in a sample of low income countries for which adequate data is available. The mean value is around 22% of GDP. There is much variation between countries, but there are few cases where government expenditure exceeds 30% of GDP. The high spenders are likely to combine a strong underlying political preference for publicly financed services with substantial borrowing as low income countries generally tax less than 15 % of their economies. In addition, total public expenditure includes debt servicing. In many cases, debt servicing obligations amount to a significant proportion of total government expenditure. Government expenditure is constrained by domestic revenues in the long run as all government borrowing must eventually be repaid. Thus, increased expenditures in the long run must be financed domestically through increased tax revenues. However, increasing revenues through tax reforms may be more easily said than done. The low tax 2 These data do not include allowances and other non-salary payments that contribute to total compensation. Thus, using data on salary expenditure only will underestimate the share of health spending devoted to remuneration of health workers.

20
and non-tax resource base and the slow growth rates imply that any increases in health expenditures derived from domestic financing will be slow to come by unless drastic changes take place in domestic revenue generation capacity. Yet some countries like Ghana, Benin and Zimbabwe show that such efforts are possible and can also support increases in expenditures in the health sector (World Bank forthcoming). Figures 12 and 13 show the evolution of tax and non tax revenue for sixteen African countries over the 1990s. The average tax and non-tax revenue in sub-Saharan Africa is about 20% of GDP, among the lowest of all regions (World Bank forthcoming). This average, however, conceals big differences across countries, with four countries having proportions above 25% (Zimbabwe, Kenya, Congo Republic and Lesotho), seven countries between 15 and 20% (Benin, Burundi, Cameroon, Cote d’Ivoire, Ethiopia, Ghana and Senegal) and five countries below 15% (Burkina Faso, Guinea, Madagascar, Rwanda, Sierra Leone and Congo Democratic Republic).
Source: World Bank staff estimates As can be seen from the charts above, despite the low base from which these countries started, tax and non-tax revenue as a percentage of GDP actually decreased on average in
Figure 12. Annual percentage change of tax and non-tax revenue (as % of GDP) in 1990s
Note: Blue diamond is tax revenue Red square is non-tax revenue
Figure 13. Annual percentage change in total revenue (as % of GDP) in 1990s
Source: WDI database and IMF PRGF report
21
five countries over 1990s, grew below 2% per year in another four countries and grew at faster rates (i.e. above the population growth rates) in only six countries. The use of progressive income taxes and payroll taxes is severely limited by the size of the formal economy and large rural populations of many developing countries. In Bolivia, for example, roughly 45 % of the population lives in the rural areas and a large part of the urban population works in the informal economy (World Bank forthcoming). As a consequence, only about 30% of household income is paid through payrolls. Under this scenario, income tax would be a burden mostly for civil servants, including the military and the police, and employees of a few companies and would increase the incentives for transferring activities to the black market. In 2004 Bolivia collected about 40% of total tax revenue from Value Added Tax (VAT) with most of the additional revenue coming from royalties and imports. Faced with a large deficit, the Government decided to introduce a progressive income tax. An already weak government had to confront protests, among others, against this income tax which further eroded its popularity and set the civil servants as well as the military and police against the government. The President of Bolivia eventually resigned with almost four years still in his term. Similarly, increasing tax revenues through corporate income taxes may be difficult when there are only a handful of companies reporting income. This is the case when extractive and service sectors are government owned (i.e. have not been privatized). The small number of companies is likely to already be heavily taxed and the owners are likely to be politically influential, making it difficult to increase tax rates through legislation. On the other hand, if extractive and service sectors have been privatized, there is likely to be an important presence of international corporations (especially in petroleum and mineral industries). In this case a country’s tax rate may not exceed internationally competitive tax rates if the country is going to continue to attract international investment. Import taxes, especially on luxury goods (tobacco, alcohol, cars) are a politically attractive alternative. These taxes are levied on the rich and are thought, to be easy to collect at the port of entry. However, import taxes may generate significant economic distortions, especially if imports have a high capital content and, also, may not prove to be so easy to collect after all, especially if borders are large and smuggling is easy (World Bank forthcoming). Thus, low tax to GDP ratios imply that developing countries have room to increase revenues from taxation to accommodate some increase expenditures, including health. Developing countries may want to replace narrow, distorting tax bases that have wide differentiated rates and numerous loopholes with broader tax bases that generate higher revenues at lower rates and do not discriminate against the various sources and uses of income. Doing so would result in the simultaneous achievement of efficiency, administrative simplicity, and horizontal equity. However, the practical difficulties of implementing tax reforms must not be underestimated. Increasing revenues through tax reforms affects many interests and cannot be done from one day to the other, especially when institutional changes in the tax authorities are required, rural/informal sectors are

22
important and borders are large. Countries are unlikely to attempt tax reforms only to accommodate additional health expenditures within their budget constraints. Increasing the Efficiency of Government Expenditure Within a given resource envelope, increased expenditure efficiency provides another avenue to increase fiscal space. For example, for every rupee reaching the poor in a rice-subsidy program in India’s Andhra Pradesh state in 1996, Rs. 3.6 were lost in leakage to the non-poor (Radhakrishna 2004). In late 1980’s, only 30% of Bolivia’s average government investments went to the social sectors and 70% went to other sectors, primarily public sector companies. In 2000 the reverse was true, only 25% of total government investments went to other sectors while 75% was invested in the social sectors (World Bank forthcoming). This reversal, however, took almost 10 years and substantial structural reform including the privatization of all major public companies (petroleum, energy, telecommunications, railroads, airline and others). Therefore, although reallocation of resources is possible, it is an endeavor that requires major political will and may require several years for an important impact to take place. Government resources for health care services often flow through several layers of government bureaucracy down to service facilities, which are charged with the responsibility of exercising the spending. Information on public spending at the service delivery level, however, is seldom available in developing countries. Public expenditure tracking surveys (PETS) track the flow of government resources to determine how much of the originally allocated resources actually reach the service delivery level. It provides information on leakage of funds, corruption and problems in the deployment of human and in-kind resources, such as staff and drugs in the health sector and staff and textbooks in the education sector. PETS have uncovered considerable leakages in resource flows in the education and health sectors, and have led governments to improve institutional arrangements in order to address the leakages. A PETS in Uganda in 1996 found that only 13% of the annual per student grant from the central government reached schools in 1991-95. Eighty-seven percent either disappeared for private gain or was captured by district officials for purposes unrelated to education. Almost three quarters of schools received very little or nothing. About 20% of teacher salaries were paid to ghost teachers – teachers who never appeared in the classroom. In response to the PETS findings the government required improved monitoring and reporting of flow of funds. Although in 2001 schools were still not receiving the entire grant, leakage was reduced from an average of 80% in 1995 to 20% in 2001 with the policy change accounting for two-thirds of this massive improvement (World Bank forthcoming). A review of PETS carried out in African countries found leakage of non-wage funds on a massive scale in the health and education sectors. Salaries and allowances also suffer from leakage but to a much lesser extent. Given that availability of books and other instructional materials are key to improving the quality of schooling, the fact that between 87% (Uganda) and 60% (Zambia) of the funding for these inputs never reach the

23
schools makes leakage a major policy concern in the education sector. In designing interventions to reduce leakage, instead of instituting more general public sector reforms, country experiences show that it may be more efficient to target reforms and interventions at specific problem spots within the public hierarchy. For example, the PETS pointed to the fact that non-wage expenditures are more prone to leakage than salary expenditures. The PETS also demonstrated that leakage occurred at specific tiers within the government. This knowledge can be exploited to effect more efficient interventions. A PETS was used in Honduras to evaluate civil servant behavior in the health and education sector. The study found that 2.4% of staff on the government payroll in the health sector were not working at all (i.e. ghost workers). For general practitioners (GPs) and specialists, 8.3% and 5.1% of staff, respectively, were ghost workers. Absenteeism was also discovered to be a major concern with 39% of staff absent without justifiable reason (such as sick leave, vacations, and compensation for extra hours worked). This amounted to a productivity loss of 10% of total staff time. Clearly, through improved government policies and institutions and monitoring and evaluation systems it is possible to realize large efficiency gains within existing expenditure envelopes. Increased Borrowing Countries can increase their fiscal space through additional borrowing. However, a large number of low-income countries already have a large debt burden and do not have much room for additional borrowing (Heller 2005). Moreover, the scaling up of health services requires increases in recurrent expenditures which should not be financed with debt but rather with permanent sources of funding. The reverse of additional borrowing is obtaining debt relief to release domestic resources that could be use for additional investment and recurrent spending in the country. Increased Debt Relief In theory, the Heavily Indebted Poor Countries (HIPC) Initiative is a mechanism that increases financing available for the social sectors and has important features to help, among others, address constraints to improve health, nutrition and population outcomes: (i) debt relief is based on the delivery of measurable outcomes; (ii) debt relief, and thus increased expenditures in the social sectors, is based on each country’s poverty reduction strategy (PRSP), thus taking into consideration the views of civil society and overall budget constraints; and (iii) PRSPs must look at overall constraints that affect absorptive capacity beyond the social sectors where expenditures are taking place. However, in practice there are several restrictions faced by HIPC countries, the main one being that debt relief does not generate additional flows of resources to the recipient countries. If HIPC countries did not have resources to pay the debt in the first place, they may have difficulties in complying with the expected increases in spending.

24
Currently 38 countries qualify for debt relief through HIPC. Countries reach the decision point – the first stage of debt relief – based on a three year record of macroeconomic stability and the preparation of an interim or full PRSP. At that stage they begin to receive ‘interim’ relief. Simultaneously, the criteria for the completion point are established. In addition to the maintenance of macroeconomic stability, the finalization of a full PRSP and its successful implementation for one year, performance benchmarks are set for structural and social reforms.
On reaching the completion point, the remaining debt relief is provided. To date, 27 countries, including 23 in Africa, have reached the decision point and are receiving some interim debt relief. Nine African countries reached their completion point (Benin, Burkina Faso, Mali, Mauritania, Mozambique, Tanzania, Uganda, Ethiopia and Niger) as of May 2005. Of the remaining countries several have encountered problems in moving towards their completion points and, at times, interim assistance has been temporarily suspended. Difficult problems also remain in about nine HIPC countries that have not yet been able to reach their decision points. Some of these countries are plagued by uneven policy records or poor governance, which in turn may be caused by the serious problems that their governments confront, including civil conflict. Some HIPC countries have debts too large to write off given current funding. This is true, for example, in Liberia and Sudan, which are both afflicted by civil conflict. The IMF and the World Bank recently agreed to extend for an additional two years, to end-2006, the deadline – known as the “sunset clause” – for remaining HIPC countries to begin to establish a policy track record that would allow their consideration for HIPC relief.
What is relevant in terms of health sector spending and human resources for health is whether the beneficiary countries had additional access to resources for expenditures as a result of debt relief. Compared to the 1998-99 averages, debt-service payments relative to fiscal revenue in the 27 HIPC countries that have reached their decision or completion point declined from an average of 24% to 15% in 2003 and are expected to decline further to less than half the average in 1998-99 by 2006. Not surprisingly, there are large variations across countries. A recent study for 23 African HIPC countries shows that the ratios of debt service to Government revenues in 2003 ranged from 6.1% in Rwanda to 30% in Gambia and Malawi (Hinchliffe 2004). Thus, the HIPC initiative is increasing fiscal space overall as resources used for debt services are freed.
Increased Donor Aid Low income countries are typically dependent on foreign aid for a substantial proportion of their revenues and public expenditure. The creation of additional fiscal space for increased health expenditure will therefore depend greatly on future increases in foreign aid. In order to develop probable scenarios for scaling up aid it is useful to review trends in aid flows to low income countries. Data on aid flows is provided in terms of commitments, which refer to pledges made by donors in a certain year, and disbursements, which refer to the money that is actually transferred to the recip ient. From the perspective of fiscal space disbursements are the

25
more relevant measure. However, information on the sectoral composition of aid is only available in terms of commitments. Figure 14 shows total aid commitments (ODA) to low income countries for the period 1990 to 2003 and the share of aid committed for health. This indicates that development aid commitments for health in low income countries increased from around $1.7bn in 1990 to $5.6bn in 2003. Over this period its share of total aid commitments increased from 9% to 17%. Much of this increase has been driven by increased funding commitments for HIV/AIDS, the bulk of which has been mobilised through the Global Fund (GFATM) and the US President’s Emergency Plan For AIDS Relief (PEPFAR). Global bilateral and multilateral commitments for HIV/AIDS increased from $1.2bn in 2000 to $3.4 bn in 2004 (Lewis 2005). While these figures indicate a substantial level of donor funding for the health sector, it is important to put them in perspective. The $5.6 bn committed in 2003 amounts to only $2.56 per capita. Although this amounts to 42% of public expenditure on health, it is a modest contribution in relation to needs. Figure 14: Aid commitments3 to low income countries over the 1990s
0.00
5.00
10.00
15.00
20.00
25.00
30.00
35.00
40.00
45.00
1990
1991
1992
1993
1994
1995
1996
1997
1998
1999
2000
2001
2002
2003
Con
stan
t $ 2
002
biliio
ns Total aid
DevelopmentAid for Health
Sources OECD DAC Creditor Reporting System At the Gleaneagles meeting held in July 2005, the G8 promised that Aid for all developing countries will increase , according to the OECD, by around $50 billion per year by 2010, of which at least $25 billion extra per year would go to Africa.4 During these meetings the EU, Germany, Italy, France and UK all reconfirmed their commitments to reach a 0.7% ODA to GNI ration by 2015. The US proposed to double aid to SSA between 2004 and 2010 but made no commitments with respect to its ODA to GNI ratio. Similarly, Japan committed to increase its ODA volume by $10 billion in aggregate over the next five years including a $5 billion Health and Development Initiative. Simultaneously, the G8 agreed to a proposal to cancel 100% of outstanding 3 Development Aid for Health includes aid recorded under purpose codes 120 Health and 130 Population. For aid that was not recorded by sector it was assumed that this would be allocated to health in the same proportion for aid that was categorised by sector. 4 G8 Summit Statements. Chairman’s Summary. Gleaneagles, July, 2005

26
debts of eligible Heavily Indebted Poor Countries to the IMF, IDA and African Development Fund, and also to provide additional resources to ensure that the financing capacities of the IFIs are not reduced. However, no details, specific mechanism or explicit dates (other than before 2010) were provided for the increased funding (Williams and Hay 2005). To finance donor commitments of additional ODA there have been several innovative financing mechanism. Among the better known of these proposals are (World Bank forthcoming): Airline Ticket Taxation. In June 2005, the “Berlin Declaration” proposed a “solidarity contribution levied on plane tickets ... to combat hunger and poverty and finance global sustainable development, inter alia, health programs including the fight against HIV/AIDS and other pandemics.” The levy would apply to plane tickets issued to passengers departing from airports located in participating countries. Passengers in transit would be exempted. Airline companies would be responsible for collecting the tax and rates would be country specific. Initial estimates on a 5 euro contribution for all plane tickets worldwide with a 20 euro additional surcharge on business and first class would annually yield euro 10 billion. The International Finance Facility (IFF). The U.K. Government’s proposal to create an IFF is based on two basic ideas: frontloading aid (spending money now for critical development investments to reach the MDGs); and using off budget donor commitments (in response to fiscal constraints facing donors that have pledged to increase ODA). A pilot of the IFF targeted to immunizations (IFFm) is under way. The IFFm would raise frontloaded, reliable funding over a number of years to expand global immunization efforts to help achieve the child mortality MDG by accelerating production of new and existing vaccines and strengthening capacity to deliver vaccines. The Tobin Tax. The Tobin Tax dates from an idea from Tobin in the 1970s to curb speculative currency flows. The Tobin tax is levied on currency transactions collected on a national or market basis. Applying the tax proceeds to development finance is a new wrinkle to the long standing idea of a tax to reduce potentially destabilizing hot currency flows. The annualized global foreign exchange market turnover is estimated at $300 trillion. After adjusting for various sources of leakage, it is estimated that a reasonable tax rate of 1-2 basis points (bps) would raise $15-28 billion annually.
Taxes on Global “Bads”. Perhaps the earliest example of a proposal to tax a global bad is the Global Carbon tax. However, a more recent initiative was advocated by President Chirac of France to fund development by taxing global arms sales. The basic idea is straight from the principles of public finance: levy a tax on the production of activities associated with negative externalities (arms sales or carbon emissions). The tax revenues can be used to promote a social good (development) while the increased price as a result of the tax reduces the offending behavior, increasing societal welfare. Estimates for the amount of resources that could be raised from a tax on hydrocarbon fuels according to their carbon content vary but revenues from high- income countries alone could raise $60 billion alone.

27
IMF Gold Sales. A number of proposals have been advanced (CGD Nancy Birdsall) to fund development through IMF Gold Sales. The rationale for this is that the gold held by the IMF is valued at the price prevailing at creation of the Bretton Woods Institutions, $30 per ounce, while the current market price is over ten times that amount. Several proposals have been advanced. The simplest is for the IMF to slowly sell gold in the international market in amounts that would be too small relative to total market volume to have an appreciable impact on price. Critics have argued that this would destabilize global gold and financial markets. Another approach is for the IMF to use an “off market” sale, an approach that has been used only in exceptional circumstances. Creation of New Special Drawing Rights (SDRs). The SDR is an international reserve asset created by the IMF in 1969 to supplement the existing official reserves of member countries. SDRs are allocated to member countries in proportion to their IMF quotas. The SDR is not a claim on the IMF but is potentially a claim on the convertible currencies of IMF members. Countries holding SDRs can exchange them against currencies of other members. SDRs were introduced under the Bretton Woods fixed exchange rate system because gold and US dollar were not sufficient to support the expansion of world trade. With the shift to floating exchange rates the need for SDRs as a reserve asset has declined. Today the stock of SDRs outstanding is approximately SDRs21 billion (approximately US$ 32 billion equivalent). Of late, there have been calls for the IMF to issue new SDRs, with donor countries making voluntary donations of their SDR allocations to fund development. Estimates of the revenue raising potential vary from $25-30 billion. From this discussion, it is likely that increased donor aid for health will be an important contributor to fiscal space in the next few years. There are several important macroeconomic implications of increasing fiscal space through donor aid versus domestic resources (Heller 2005, Williams and Hay 2005, Ebrahim-zadeh 2003): (i) real exchange rate appreciation, and (ii) crowding out of the private sector. If the foreign aid were spent entirely on imports, it would have no direct impact on the country's money supply or demand for domestically produced goods. But suppose the foreign aid is converted into local currency and spent on domestic non-traded goods. If the exchange rate is flexible, converting the foreign aid into local currency would drive up the value of the domestic currency and lead to an appreciation in the real exchange rate. This weakens the competitiveness of the country's exports and, hence, causes the export sector to shrink. This process is called the ‘spending effect’. At the same time, unless there is spare capacity in the non-traded goods sector, resources (capital and labor) would shift from the traded goods sector into the production of domestic non-traded goods to meet the increase in domestic demand. This further shrinks the export sector and is known as the ‘resource movement effect’. There is also domestic inflationary pressure as demand increases for non-traded goods. Crowding out occurs when governments try to avoid the domestic inflationary effects by tightening monetary policy, usually through increased interest rates. Higher interest rates
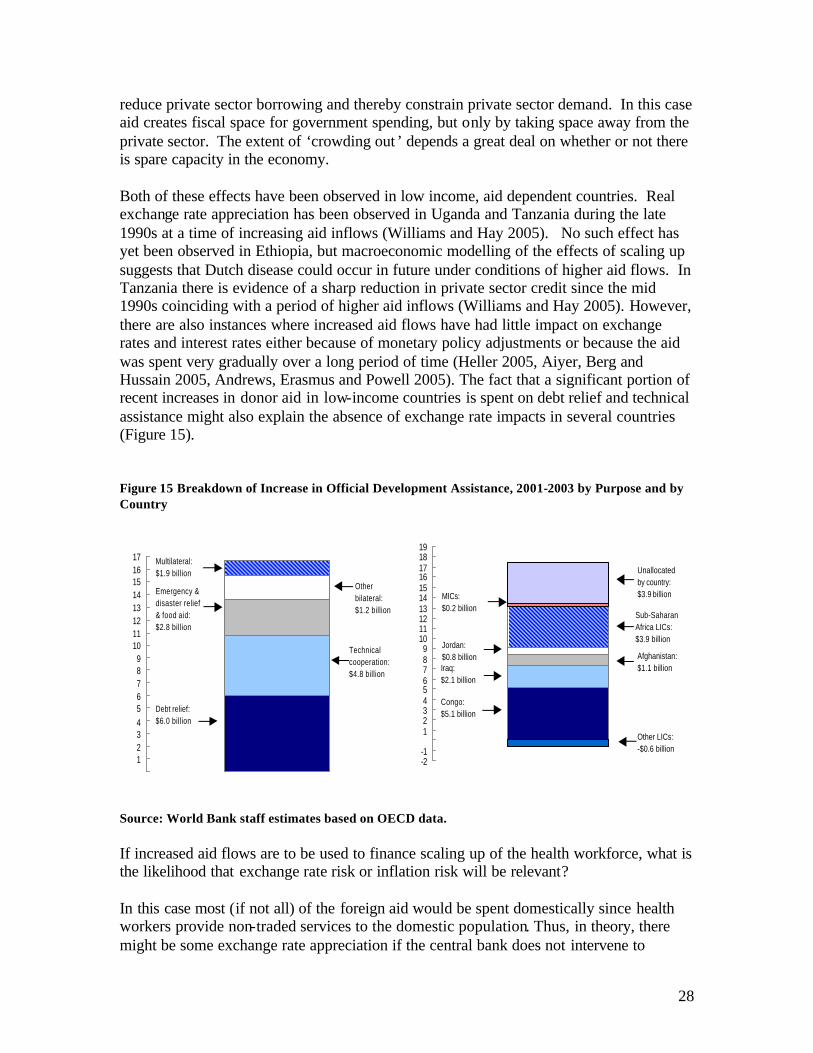
28
reduce private sector borrowing and thereby constrain private sector demand. In this case aid creates fiscal space for government spending, but only by taking space away from the private sector. The extent of ‘crowding out ’ depends a great deal on whether or not there is spare capacity in the economy. Both of these effects have been observed in low income, aid dependent countries. Real exchange rate appreciation has been observed in Uganda and Tanzania during the late 1990s at a time of increasing aid inflows (Williams and Hay 2005). No such effect has yet been observed in Ethiopia, but macroeconomic modelling of the effects of scaling up suggests that Dutch disease could occur in future under conditions of higher aid flows. In Tanzania there is evidence of a sharp reduction in private sector credit since the mid 1990s coinciding with a period of higher aid inflows (Williams and Hay 2005). However, there are also instances where increased aid flows have had little impact on exchange rates and interest rates either because of monetary policy adjustments or because the aid was spent very gradually over a long period of time (Heller 2005, Aiyer, Berg and Hussain 2005, Andrews, Erasmus and Powell 2005). The fact that a significant portion of recent increases in donor aid in low-income countries is spent on debt relief and technical assistance might also explain the absence of exchange rate impacts in several countries (Figure 15). Figure 15 Breakdown of Increase in Official Development Assistance, 2001-2003 by Purpose and by Country
Source: World Bank staff estimates based on OECD data. If increased aid flows are to be used to finance scaling up of the health workforce, what is the likelihood that exchange rate risk or inflation risk will be relevant? In this case most (if not all) of the foreign aid would be spent domestically since health workers provide non-traded services to the domestic population. Thus, in theory, there might be some exchange rate appreciation if the central bank does not intervene to
123456789
1011121314151617
Debt relief: $6.0 billion
Technical cooperation: $4.8 billion
Emergency & disaster relief & food aid: $2.8 billion
Other bilateral: $1.2 billion
Multilateral: $1.9 billion
-2-1
123456789
10111213141516171819
Congo: $5.1 billion
Afghanistan: $1.1 billion
Sub-Saharan Africa LICs: $3.9 billion
Other LICs: -$0.6 billion
Jordan: $0.8 billionIraq: $2.1 billion
MICs: $0.2 billion
Unallocated by country: $3.9 billion

29
compensate. If there is excess capacity in the human resources for health sector (i.e. there are unemployed health workers) then the increase in demand for health workers will not necessarily result in any wage inflation. If, however, the health labor market is ‘tight’ there may be pressure to increase wages in the health care sector. Given that the health sector makes up a very small portion of the labor force, this in itself is not likely to result in any inflationary pressure in the economy as a whole. However, if there are wage spillover effects – i.e. wage increases in the health sector drive wage increases in other sectors, either because of civil service arrangements or economy-wide competition for scarce human resources – then there may indeed be a general inflation impact driven by increases in average wages. Since there are no examples of large scale aid increases to fund expansion of the health workforce in countries, the preceding discussion remains speculative. Recently donors agreed to provide £100 million in support to fund expansion of the health workforce in Malawi over the next five years. This experience ought to be monitored to gain insight into the extent to which the exchange rate and inflation impacts discussed are empirically relevant. Nevertheless, the exchange rate and inflationary effects of increased aid flows – if they do actually occur – in many cases are an acceptable cost to the economy of expanding funding to the health sector. As such, governments must weigh these various trade-offs in deciding whether to accept increased aid flows for the health sector. Overall, these arguments suggest that there is nothing special about public expenditure on health that will reduce the macroeconomic risks of higher aid flows. In many cases increases in spending may be justified, especially where this produces public goods and generates the human resources for health capacity required to strengthen the health care system. However, the impact on private sector investment and consumption should always be considered. At a certain level of public spending the marginal costs of additional expenditure will exceed its marginal benefit. This constitutes an upper limit to fiscal space that no government should exceed irrespective of the amount of aid on offer.
Modeling Scenarios of Scaling Up Health Expenditure It should be clear from the above discussion that the maximum expansion of fiscal space for health spending depends on a combination of measures: increases in the share of public expenditure allocated to health; increases domestic revenues and, in the right conditions, increases in aid. None of these measures is likely to be sufficient on its own, and the mix of measures adopted by an individual country will depend on what the potential yield from each measure is likely to be, taking into account costs, risks, institutional strengths and economic prospects. This section presents some simple projections on the future level of public expenditure per capita on health and on salaries for health workers in low income countries under alternative scenarios when the measures above are combined in different ways. In projecting per capita expenditure on health in low-income countries the following scenarios are considered (simulations are from Williams and Hay 2005):
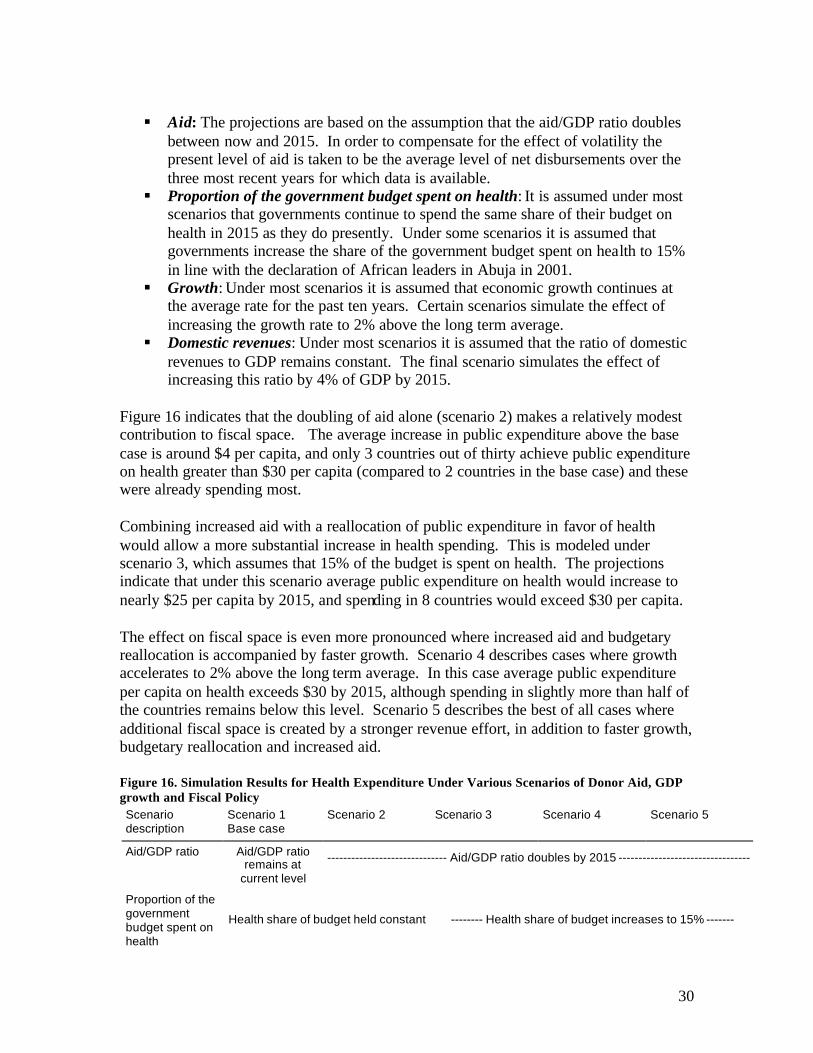
30
§ Aid: The projections are based on the assumption that the aid/GDP ratio doubles
between now and 2015. In order to compensate for the effect of volatility the present level of aid is taken to be the average level of net disbursements over the three most recent years for which data is available.
§ Proportion of the government budget spent on health: It is assumed under most scenarios that governments continue to spend the same share of their budget on health in 2015 as they do presently. Under some scenarios it is assumed that governments increase the share of the government budget spent on health to 15% in line with the declaration of African leaders in Abuja in 2001.
§ Growth: Under most scenarios it is assumed that economic growth continues at the average rate for the past ten years. Certain scenarios simulate the effect of increasing the growth rate to 2% above the long term average.
§ Domestic revenues: Under most scenarios it is assumed that the ratio of domestic revenues to GDP remains constant. The final scenario simulates the effect of increasing this ratio by 4% of GDP by 2015.
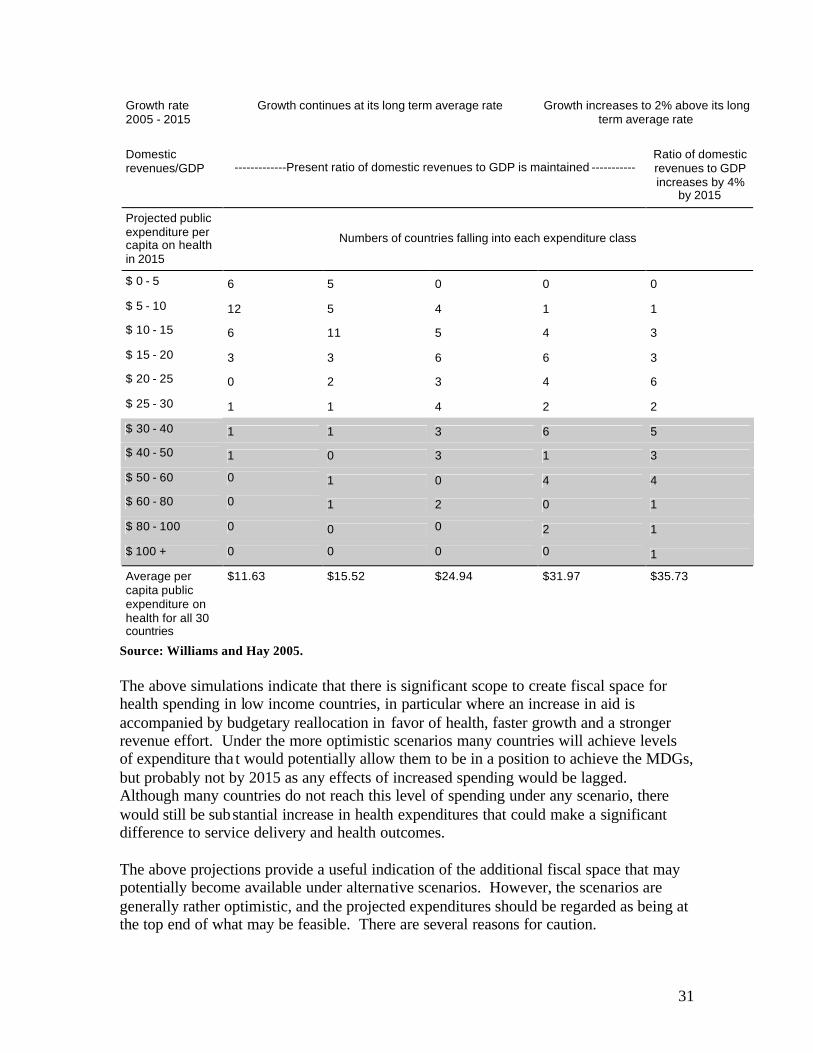
Figure 16 indicates that the doubling of aid alone (scenario 2) makes a relatively modest contribution to fiscal space. The average increase in public expenditure above the base case is around $4 per capita, and only 3 countries out of thirty achieve public expenditure on health greater than $30 per capita (compared to 2 countries in the base case) and these were already spending most. Combining increased aid with a reallocation of public expenditure in favor of health would allow a more substantial increase in health spending. This is modeled under scenario 3, which assumes that 15% of the budget is spent on health. The projections indicate that under this scenario average public expenditure on health would increase to nearly $25 per capita by 2015, and spending in 8 countries would exceed $30 per capita. The effect on fiscal space is even more pronounced where increased aid and budgetary reallocation is accompanied by faster growth. Scenario 4 describes cases where growth accelerates to 2% above the long term average. In this case average public expenditure per capita on health exceeds $30 by 2015, although spending in slightly more than half of the countries remains below this level. Scenario 5 describes the best of all cases where additional fiscal space is created by a stronger revenue effort, in addition to faster growth, budgetary reallocation and increased aid. Figure 16. Simulation Results for Health Expenditure Under Various Scenarios of Donor Aid, GDP growth and Fiscal Policy Scenario description
Scenario 1 Base case
Scenario 2 Scenario 3 Scenario 4 Scenario 5
Aid/GDP ratio Aid/GDP ratio remains at
current level
------------------------------ Aid/GDP ratio doubles by 2015 ---------------------------------
Proportion of the government budget spent on health
Health share of budget held constant -------- Health share of budget increases to 15% -------
31
Source: Williams and Hay 2005. The above simulations indicate that there is significant scope to create fiscal space for health spending in low income countries, in particular where an increase in aid is accompanied by budgetary reallocation in favor of health, faster growth and a stronger revenue effort. Under the more optimistic scenarios many countries will achieve levels of expenditure tha t would potentially allow them to be in a position to achieve the MDGs, but probably not by 2015 as any effects of increased spending would be lagged. Although many countries do not reach this level of spending under any scenario, there would still be substantial increase in health expenditures that could make a significant difference to service delivery and health outcomes. The above projections provide a useful indication of the additional fiscal space that may potentially become available under alternative scenarios. However, the scenarios are generally rather optimistic, and the projected expenditures should be regarded as being at the top end of what may be feasible. There are several reasons for caution.
Growth rate 2005 - 2015
Growth continues at its long term average rate
Growth increases to 2% above its long term average rate
Domestic revenues/GDP -------------Present ratio of domestic revenues to GDP is maintained -----------
Ratio of domestic revenues to GDP increases by 4%
by 2015
Projected public expenditure per capita on health in 2015
Numbers of countries falling into each expenditure class
$ 0 - 5 6 5 0 0 0
$ 5 - 10 12 5 4 1 1
$ 10 - 15 6 11 5 4 3
$ 15 - 20 3 3 6 6 3
$ 20 - 25 0 2 3 4 6
$ 25 - 30 1 1 4 2 2
$ 30 - 40 1 1 3 6 5
$ 40 - 50 1 0 3 1 3
$ 50 - 60 0 1 0 4 4
$ 60 - 80 0 1 2 0 1
$ 80 - 100 0 0 0 2 1
$ 100 + 0 0 0 0 1
Average per capita public expenditure on health for all 30 countries
$11.63 $15.52 $24.94 $31.97 $35.73

32
§ It is probably too optimistic to assume that governments will allocate 15% of public expenditure to the health sector. Very few low income countries have achieved this.
§ Aid recipients may be inclined to allocate a relatively small share of additional aid to the health sector because of the unpredictability of aid and the long term recurrent spending commitments that are generated by health expenditures.
§ The assumption that additional aid will be provided on-budget is not realistic given present patterns of aid delivery
§ An average increase in the revenue/GDP ratio of 4% by 2015 would represent a very strong tax effort that would only be achieved by the best performing countries
Even with optimistic assumptions, as Figure 17 shows the increased expenditures on health still fall short of the target levels for several developed countries as calculated by the Millennium Project. Figure 17. Health Expenditure Projections Relative to Needs
Additional per capita public expenditure on health in 2015 projected
under alternative scenarios / US$
Millennium project estimate of additional per capita spending in 2015 required to meet health MDGs
Scenario 1 Base case
Scenario 2 Scenario 3 Scenario 4 Scenario 5
Cambodia US$ 23.00 5.01 10.59 20.70 28.06 32.25
Tanzania US$ 35.00 2.75 8.05 12.62 18.22 21.14
Uganda US$ 32.00 3.15 7.39 16.90 22.85 25.84 Source: Williams and Hay 2005. Another set of projections can be carried out specifically for public sector salary expenditure for health workers (i.e. the health care wage bill) under various scenarios. The projections cited below are for a sample of sub-Saharan Africa countries and are aimed at examining whether additional fiscal space generated from various domestic policies is sufficient to support a scaled up health workforce and if not, what is the magnitude of the funding gap that might be filled through donor aid (Vujicic, 2005). The additional government resources that are available to be spent on health sector salaries are projected under two scenarios: ‘Baseline’ – Business as Usual § Real GDP is assumed to grow at its forecasted rate § Government Expenditure/GDP is held constant at its current level § Health Expenditure/Government Expenditure is held constant at its current level § Health Salary Expenditure/Health Expenditure is held constant at its current level5
5 Keeping this variable constant implies that non-salary health spending increases at the same rate as salary spending in the projections. If the current ratio of non-personnel to personnel inputs in the health care system is too high (i.e. there is excess capacity in non-personnel inputs like pharmaceuticals, buildings) then this assumption biases downward the estimate of the resources available for salaries.
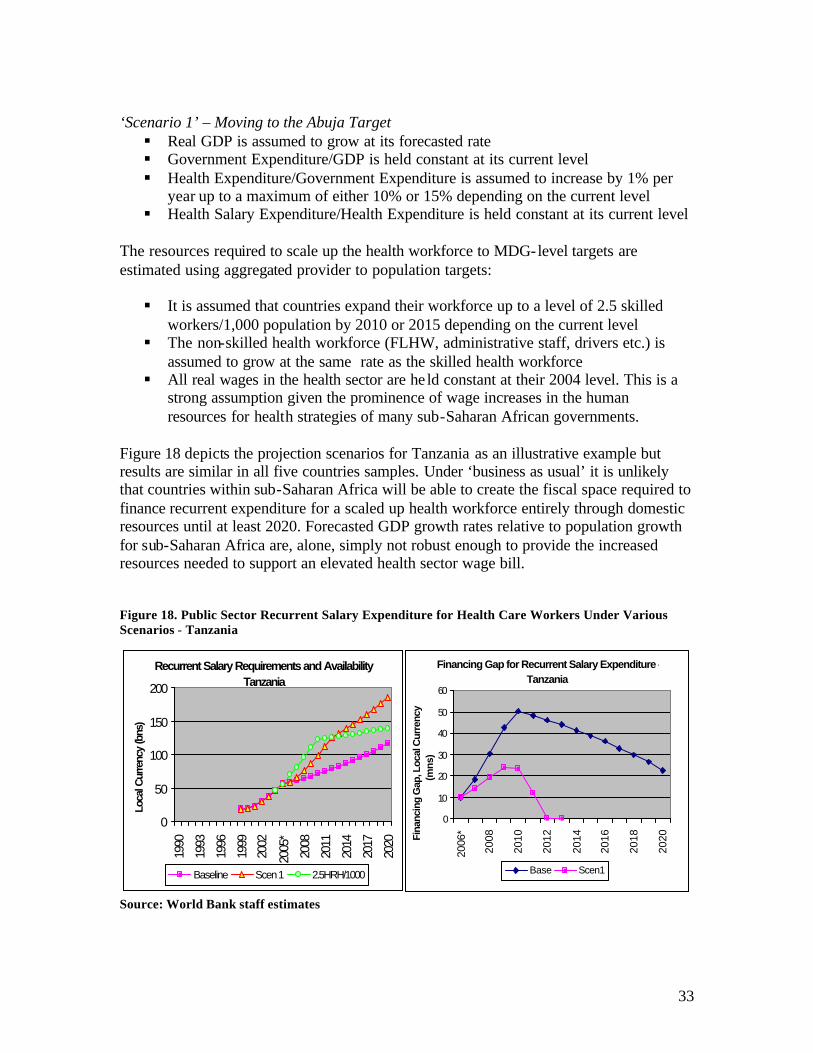
33
‘Scenario 1’ – Moving to the Abuja Target § Real GDP is assumed to grow at its forecasted rate § Government Expenditure/GDP is held constant at its current level § Health Expenditure/Government Expenditure is assumed to increase by 1% per
year up to a maximum of either 10% or 15% depending on the current level § Health Salary Expenditure/Health Expenditure is held constant at its current level
The resources required to scale up the health workforce to MDG-level targets are estimated using aggregated provider to population targets: § It is assumed that countries expand their workforce up to a level of 2.5 skilled
workers/1,000 population by 2010 or 2015 depending on the current level § The non-skilled health workforce (FLHW, administrative staff, drivers etc.) is
assumed to grow at the same rate as the skilled health workforce § All real wages in the health sector are he ld constant at their 2004 level. This is a
strong assumption given the prominence of wage increases in the human resources for health strategies of many sub-Saharan African governments.
Figure 18 depicts the projection scenarios for Tanzania as an illustrative example but results are similar in all five countries samples. Under ‘business as usual’ it is unlikely that countries within sub-Saharan Africa will be able to create the fiscal space required to finance recurrent expenditure for a scaled up health workforce entirely through domestic resources until at least 2020. Forecasted GDP growth rates relative to population growth for sub-Saharan Africa are, alone, simply not robust enough to provide the increased resources needed to support an elevated health sector wage bill.
Figure 18. Public Sector Recurrent Salary Expenditure for Health Care Workers Under Various Scenarios - Tanzania
Recurrent Salary Requirements and Availability -
Tanzania
0
50
100
150
200
1990
1993
1996
1999
2002
2005
*
2008
2011
2014
2017
2020
Loca
l Cur
renc
y (b
ns)
Baseline Scen 1 2.5HRH/1000
Financing Gap for Recurrent Salary Expenditure - Tanzania
0
10
20
30
40
50
60
2006
*
2008
2010
2012
2014
2016
2018
2020Fi
nanc
ing
Gap
, Loc
al C
urre
ncy
(mns
)
Base Scen1
Source: World Bank staff estimates

34
Government fiscal policy, however, can go a long way in closing the gap between resource requirements and resource availability for recurrent health salary costs. If governments act on their commitment to increase budget allocations to the health sector – at least part way to the Abuja target of 15% – this drastically increases fiscal space and decreases the time needed to reach the point where recurrent salary costs can be financed entirely through domestic resources. Of course, even under this second scenario there remains a large funding gap that must be met through donor aid or external borrowing. Between 2005 and the time when countries are able to finance increased health salary expenditure from domestic resources, the funding gap for five sub-Saharan African countries equals about $1 billion (Ghana, Benin, Tanzania, Zambia, Malawi). The total funding gap for each country ranges from .06% of 2005 GDP to 7.5%. It is important to note that under the ‘Abuja Target’ scenario the government’s wage bill will change only if the proportion of spending that is devoted to salaries differs across sectors. Given that the health sector is one of the most labor intensive public sectors the total wage bill may indeed increase.
Conclusion Progress towards the health MDGs has, on average, been below expectation and there is strong international pressure for scaling up efforts, particularly human resources for health capacity in sub-Saharan Africa. This paper has reviewed some of the macroeconomic and fiscal considerations for increasing recurrent expenditure in the health sector with an emphasis on policy options governments can pursue to increase fiscal space, the feasibility of the various options, and preliminary projections on the resource envelope for the health sector under different scenarios in low-income countries. Increases in tax revenue have been somehow disappointing in low-income countries over the past decade. Although increasing tax revenues is an option, it will not provide in the short run the large additional expenditures required to reach the health MDGs. Thus, alternative sources of funding will be required for long periods. Low-income countries in general have limited room to absorb additional debt. In contrast, debt relief is an important source of fiscal space from a growth and solvency perspectives but it is only a start. Debt relief does not generate new resources for countries; it only allows them not to make a payment obligation. Thus, HIPC countries are likely to have difficulties in drastically increasing expenditures in the social sector based on debt relief alone. Donor funding is in the short run the most important source of funding for increased expenditures in the social sectors in low-income countries. Predictable financing offered over extended periods of time (20 years or more in some countries) is necessary to increase health sector recurrent expenditures such as human resources for health. There is a risk that some governments will make capital investments that they cannot fully maintain, take on too many staff to pay properly, or take on other new spending commitments that prove to be unaffordable and unsustainable in the long term. On the other hand concerns about the unpredictability and unreliability of aid flows may cause

35
some governments to be overly cautious about using in additional aid to augment health expenditures financed from domestic resources. The key to ensuring fiscal sustainability is for recipient governments to take a long term view of expenditure commitments, growth and mobilizing domestic revenues. In terms of absorptive capacity, important constraints to increased donor aid flows arise from organizational, managerial and governance weaknesses, which may reduce the returns to additional aid and public expenditure substantially. In these conditions it will be important to scale up aid at a measured pace, and to accompany this with institutional and governance reforms to create conditions where aid can be used effectively. There are macroeconomic risks associated with scaling up aid, in particular real exchange rate appreciation and the crowding out of private sector investment. Development aid for health is no different to other types of aid in this respect. In many cases it will still be justified to increase donor support to the health sector, in particular where this supports expenditures that provides the public goods and generates the human capital that will be required to achieve the MDGs. However, the impact on private sector investment and consumption should always be considered. At a certain level of public spending the marginal costs of additional expenditure will exceed its marginal benefit. This constitutes an upper limit to fiscal space that no government should exceed irrespective of the amount of aid on offer. There are examples of large scale inflows where the macroeconomics risks were mitigated by sound monetary and fiscal policy. However, evidence on aid inflows used to expand the health workforce is absent. Does all this mean that little progress can be done to scale up human resources for health in low-income countries? Not at all. Rather, governments – and Ministries of Health in particular – ought to carefully weigh the impact of increasing fiscal space and using the resources in the health sector against the risk associated with increasing taxation rates, increasing expenditure levels, re-allocating expenditure from other sector to the health sector and accepting large inflows of foreign aid directed to the health sector. This paper has attempted to shed light on the relevant issues as they relate to human resources for health capacity.

36
References Aiken LH, Smith HL, Lake ET (1994) “Lower Medicare mortality among a set of hospitals known for good nursing care,” Medical Care, 32(8):771-787. Aiken LH, Clarke SP, Sloane DM, Sochalski J, Silber JH (2002) “Hospital nurse staffing and patient mortality, nurse burnout, and job dissatisfaction,” Journal of the American Medical Association, 288(16):1987-1993. Aiyer, S., A. Berg and M. Hussain (2005) “The Macroeconomic Challenge of More Aid,” Finance and Development, 42(3): 28-31. Anand S. and T. Barnighausen (2004) “Human Resources and Health Outcomes: Cross Country Econometric Study,” The Lancet (364): 1603-09. Andrews, D, L. Erasmus and R. Powell (2005) “Ethiopia: Scaling Up,” Finance and Development, 42(3): 31-35. Barber, S. and P. Gertler (2005) “Child Health and the Quality of Medical Care in Indonesia,” University of California, Berkeley. Processed. Chen, L., T. Evans et al. (2004) Human Resources for Health: Overcoming the Crisis, The Lancet 364: 1984-90. Curran, J., H. Debas et al eds. (2005) Scaling Up Treatment for the Global AIDS Pandemic: Challenges and Opportunities, National Academies Press, Washington DC. Ebrahim-zadeh, C. (2003) “Back to Basics: Dutch Disease, Too Much Wealth Managed Unwisely,” Finance and Development, 30(1). Epstein, B. (2004) “The Demographic Impact of HIV/AIDS,” in Haacker, M. ed, The Macroeconomics of HIV/AIDS, International Monetary Fund, Washington, DC. Fisher, E. and J. Wennberg (2003) “Health Care Quality, Geographic Variations, and the Challenge of Supply-Sensitive Care” Perspectives in Biology and Medicine 46(1): 69-79. Foster, M. (2004) “MDG-Oriented Sector and Poverty Reduction Stategies: Lessons from Experience in Health,” Report Prepared for the High Level Forum on Health MDGs, Abuja. Hinchcliffe, K. (2004) “Notes on the Impact of the HIPC Initiative on Education and Health Public Expenditures in African Countries,” The World Bank, Washington, DC.
37
Haacker,M. (2004) “HIV/AIDS: The Impact on the Social Fabric and the Economy” in Haacker, M. ed, The Macroeconomics of HIV/AIDS, International Monetary Fund, Washington, DC. Heller, P. (2005) “Back to Basics: Fiscal Space, What it is and How to Get It,” Finance and Development, 42(2). Joint Learning Initiative (2004). Human Resources for Health: Overcoming the Crisis, Cambridge, MA, Harvard University. Kombe G, D. Galaty et al (2005) The Human and Financial Resource Requirements for Scaling Up HIV/AIDS Services in Ethiopia, Abt Associates, Bethesda, Maryland. Kurowski, C., K. Wyss, et al. (2003) Human resources for health: Requirements and availability in the context of scaling up priority interventions in low-income countries. Case studies from Tanzania and Chad, London, London School of Hygiene & Tropical Medicine. Lewis, M. (2005) Addressing the Challenge of HIV/AIDS: Macroeconomic, Fiscal and Institutional Issues Centre for Global Development, Washington, DC. Narasimhan, V., H. Brown et al. (2004) “Responding to the Global Human Resources Crisis,” The Lancet (363): 1469-1472. Needleman J, Buerhaus P, Mattke S, Stewart M, Zelevinsky K (2002) “Nurse-staffing levels and the quality of care in hospitals” New England Journal of Medicine 346:1715-1722. Okuonzo, S. (2004) “Dying for Economic Growth? Evidence of a Flawed Economic Policy in Uganda,” The Lancet, 364: 1632-1637. Ooms, G. and T. Schrecker (2005) “Expenditure Ceilings, Multilateral Financial Institutions and the Health of Poop Populations,” The Lancet, 365: 1821-1823. Paternostro, S., A. Rajaram and R. Tiongson (2005) “How Does the Composition of Public Spending Matter?” World Bank Policy Research Working Paper, The World Bank, Washington, DC. Radhakrishna R. (2004) “India’s Public Distribution System: A National and International Perspective,” World Bank Discussion Paper, The World Bank, Washington, DC. Vujicic, M., P. Zurn et al (2004) “The role of wages in the migration of health care professionals from developing countries,” Human Resources for Health, 2(3). Vujicic, M., P. Zurn et al (2005) “The Dynamics of the Health Labor Market” mimeo.
38
Wagstaff, A. and M. Claeson (2004). The Millennium Development Goals for Health: Rising to the Challenges, The World Bank, Washington, DC. Williams, G. and R. Hay (2005) “Fiscal Space and Sustainability from the Perspective of the Health Sector,” Report Prepared for the High Level Forum on Health MDGs, Paris. World Bank (forthcoming) Health Financing Revisited, The World Bank, Washington, DC. World Bank (2005) Global Monitoring Report 2005, The World Bank, Washington, DC. Wright, C., G.K. Chambers and Y. Robens-Paradise (2002) “Evaluation of indications for and outcomes of elective surgery,” Canadian Medical Association Journal, 167(5).