MACROBENTHIC INVERTEBRATE FAUNA...
31
MACROBENTHIC INVERTEBRATE FAUNA OF THE 11IDDLE ATLAr-iTIC BIGHT REGION: PART I I. FAUIJAL C0I1POSITIOl1 AND QUANTITATIVE DISTRIBUTION by Roland L. Higley and Roger B. Thel'oux U.S. Department of Commel'ce National Oceanic and Atmospheric Administration National Marine Fisheries Service Northeast Fisheries Center Hands Hole, Massachusetts September 30, 1976
-
Upload
nguyentruc -
Category
Documents
-
view
228 -
download
0
Transcript of MACROBENTHIC INVERTEBRATE FAUNA...

MACROBENTHIC INVERTEBRATE FAUNA
OF THE
11IDDLE ATLAr-iTIC BIGHT REGION:
PART I I. FAUIJAL C0I1POSITIOl1 AND QUANTITATIVE DISTRIBUTION
by
Roland L. Higley and Roger B. Thel'oux
U.S. Department of Commel'ce
National Oceanic and Atmospheric Administration
National Marine Fisheries Service
Northeast Fisheries Center
Hands Hole, Massachusetts
September 30, 1976

-1-
TAGLE OF CONTENTS
~
LIST OF TABLES 4
LIST OF FIGURES 12
AGSTRACT 29
INTRODUCTION 31
Reconnaissance Survey 31
Middle Atlantic Bight Region 32
Previous Studies 33
r'1ATERIALS MID r'1ETHODS 41
Macrofauna Samp.l es 41
Benthos Sampling Gear 44
Sample Processing 413
Data Reduction 50
Bathymetry 51
Temperature 51
Geolog'ical Samples 52
FAUNAL CO!'iPOSITION 53
Entire Middle Atlantic Bight Region 53
Subarea Differences in Composition 71
GEOGRAPHIC DISTRIBUTION 77
Total Macrobenthic Fauna -- All Taxonomic Groups Combined 78
t·1ajor Taxonomic Components 81
Selected Genera and Species 161

-2-
" Page
BATHYioiETRIC DISTRIBUlIOii 172
Total Hacl'obenth-ic Fauna 1\11 Taxonomic Groups Combined 172
Entire Hiddle Atlantic Bight Region 172
Subareas 179
Soutllern New England 179
New York Bight 180
Chesapeake Bight 182
Taxonomi c Groups 183
Entire Hiddle Atlantic Bight Region 183
Subarea Differences in Oistl'ibution of Taxonomic Groups 202
RELATION WITH BOTTOM SEDIMENTS 220
Distr-ibution of Sediment Types 220
Total ioiacrobenthic Fauna All Taxonomic Groups Combined
Entire r~-iddle Mlanbc Bight Region
Subareas
Southern New England
NevI York Bight
Chesapeake Bight
Taxonomic Groups
Entire Hiddle Atlantic Bight Region
Subal'eas
Southern New England
New York Bight
Chesapedke Bight
229
229
229
229
234
236
236
236
255
255
267
2[\0

-3-
RELATION WITH SEDI~ENT ORGANIC CARBON
Distribution of Sediment Ol'ganic Carbon
Total Hacrobenthic rauna - .. All Taxonomic Groups Combined
Taxonomi c Grou ps
Entire Hiddle Atlantic Bight Region
Southern New England
RELATION ['IITH RANGE IN BOTTor~ HATER TEf·iPERP,TURE
Total Hacrobenthic Fauna -- All Taxonomic Groups Combined
Entire Middle Atlantic Bight Region
Subareas
Southern New England
NeVI York Bight
Pa~
294
295
295
300
300
309
312
314
314
314
314
318
Chesapeake Bight 319
Taxonomic Groups 320
Entire Middle Atlantic Bigllt Region 320
Subarea Differences in Distribution of Taxonomic Groups 339
DOHINANT FAUNAL CO)lPONENTS 371
Bays and Sounds 372
Continental Shelf 372
Continental Slope 375
Continental Rise 376
ACKNOHLEDGt·1ENTS 377
LITERATURE CITED 379
APPENDIX 391
(--
Table
1.
2.
3.
4.
5.
6.
-4-
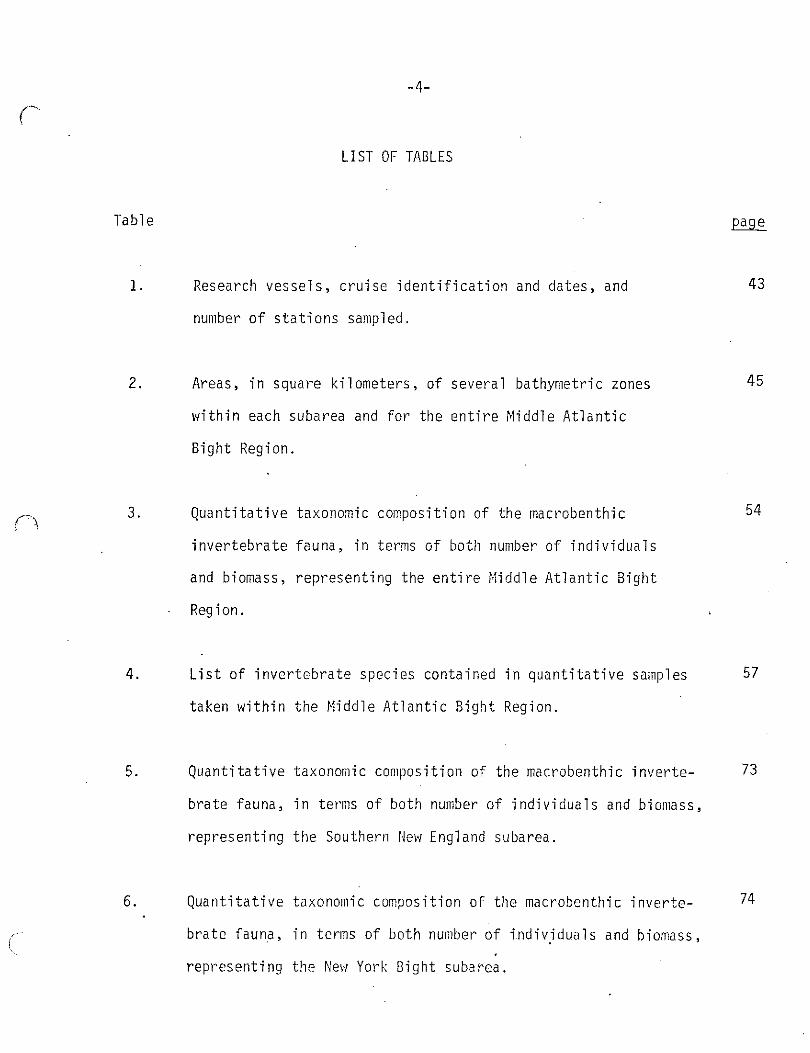
LIST OF TABLES
Research vessels, cruise identification and dates, and
number of stations sampled.
Areas, in square kilometers, of several bathymetric zones
within each subarea and for the entire Middle Atlantic
Bight Region.
Quantitative taxonomic composition of the macrobenthic
invertebrate fauna, in terms of both number of individuals
and biomass, representing the entire Middle Atlantic Bight
Region.
List of invertebrate species contained in quantitative samples
taken within the Middle Atlantic Bight Region.
Quantitative taxonomic composition of the macrobenthic inverte-
brate fauna, in terms of both number of individuals and biomass,
representing the Southern New England subarea.
Quantitati ve taxonomic compos ition of the macrobenthi c inverte-
brate fauna, in terms of both number of individuals and biomass,
representing the New York Bight subarea.
43
45
54
57
73
74

c Table
7.
8.
9.
10.
11.
12.
-5-
TABLES (continued)
Quantitative taxonomic composition of the macrobenthic
invertebrate fauna; in terms of both number of individuals
and biomass, representing the Chesapeake Bight subarea.
Mean number of individuals and biomass of the macrobenthic
invertebrate fauna in relation to Vlater depth. Values are
listed separately for each subarea and for the entire Middle
Atlantic Bight Region.
Change and rate of change in density of invertebrates in
relation to Vlater depth.
Change and rate of change in biomass of invertebrates in
re 1 a ti 0 n to \'ia ter depth.
Mean number of individuals listed by major taxonomic groups
for each bathymetric class, representing the entire Middle
Atlantic Bight Region.
Mean biomass listed by major taxonomic g)'OUPS for each bathy
metric class, representing the entire Middle Atlantic Bight
Region.
75
176
177
178
184
1B5
c Table
13.
14.
15.
16.
17.
18.
-6-
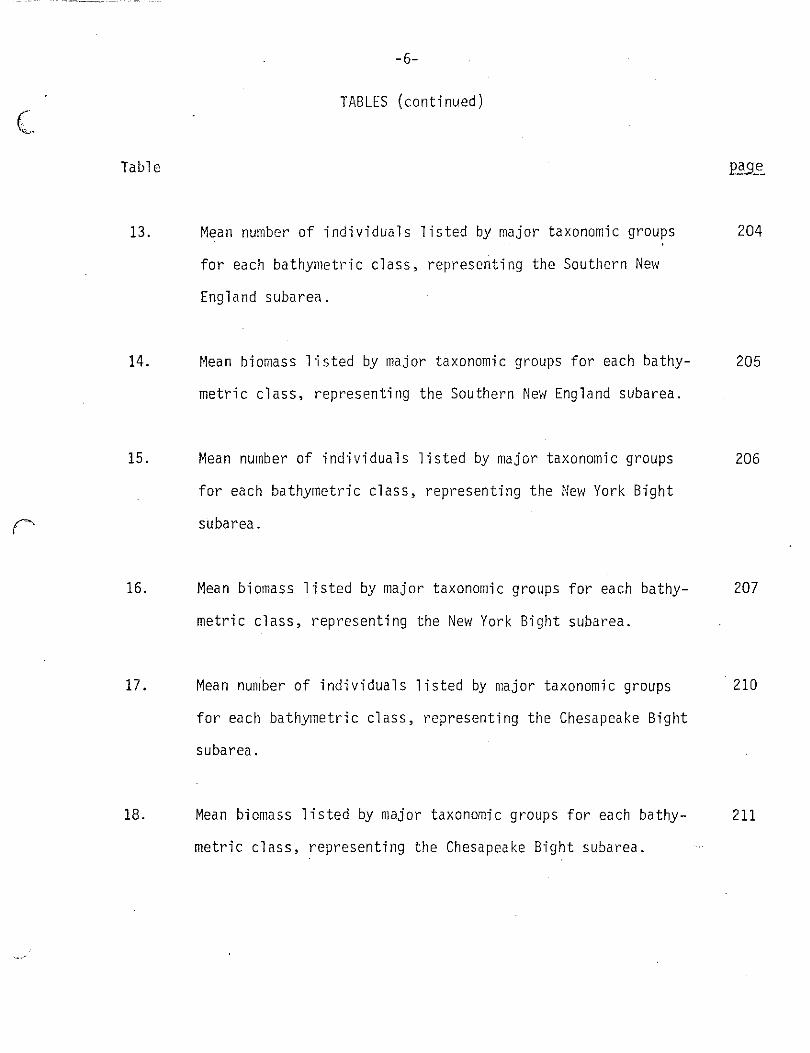
TABLES (continued)
Mean number of individuals listed by major taxonomic groups
for each bathymetl'ic class, representing the Southern New
England subarea.
Mean biomass listed by major taxonomic groups for each bathy
metric class, representing the Southern New England subarea.
Mean number of individuals listed by major taxonomic groups
for each bathymetric class, representing the New York Bight
subarea.
Mean biomass listed by majol' taxonomic groups for each bathy
metric class, representing the New York Bight subarea.
Mean number of individuals 1 isted by major taxonomic groups
for each bathymetric class, representing the Chesapeake Bight
subarea.
Mean biomass 1 isted by major taxonomic groups for each bathy
metric class, representing the Chesapeake Bight subarea.
204
205
206
207
210
211

Table
19.
20.
21.
22.
23.
24.
(
-7-
TABLES (continued)
Mean number of individuals and biomass of the macrobenthic
invertebrate fauna in relation to bottom sediments. Values
are listed separately for each subarea and for the entire
Middle Atlantic Bight Region.
Mean numbe)' of individuals listed by taxonomic groups in each
bottom sediment type for the entire Middle Atlantic Bight
Region.
r-lean biomass of each taxonomic group listed by bottom sediment
type for the entire 1'liddle Atlantic Bight Region.
Mean number of individuals listed by taxonomic g)'OUP in each
i;Jottom sediment type for the Southern Nel-! England suba)'ea.
Mean biomass of each taxonomic g)'OUP listed by bottom sediment
type for the Southern Ne\1 Engl and subarea.
~lean number of i ndi vi dua 1 s 1 i sted by taxonomi c group in each
bottom sediment type for the New York Bight subarea.
230
237
238
256
257
268

Table
25.
26.
27.
28.
29.
30.
-8-
TABLES (continued)
r1ean biomass of each taxonomic group 1 isted by bottom
sediment type for the Nel'! York Bi gilt subarea.
Mean number of individuals listed by taxonomic group in each
bottom sediment type for the Chesapeake Bight subarea.
~1ean biomass of each taxonomic group listed by bottom sedi
ment type in the Chesapeake Bight subarea.
Mean number of individuals and biomass of the macrobenthic
invertebrate fauna in relation to percent organic carbon in
bottom sediments. Values are listed separately for each
subarea and for the entire Middle Atlantic Bight Region.
Mean number of individuals of each taxonomic group listed by
sediment organic carbon content class, representing the
entire Middle Atlantic Bight Region.
Mean biomass of each taxonomic group listed by sediment
organic carbon content class, representing the entire
Middle Atlantic Bight Region.
269
281
282
297
301
302

c Table
31.
32.
33.
34.
35.
36.
-9-
TABLES (continued)
Mean number of individuals of each taxonomic group listed
by sediment organic carbon content class, representing
the Southern New England subarea.
Mean biomass of each taxonomic group 1 isted by sediment
organic carbon content class, representing the Southern
New England subarea.
~lean number of individuals and biomass of the macrobenthic
invertebrate fauna, all taxonomic groups combined, in
relation to range in bottom water temperature. Values are
listed separately for each subarea and for the entire
Middle Atlantic Bight Region.
Mean number of individuals of each taxonomic group listed
by temperature range class, representing the entire t~iddle
Atlantic Bight Region.
Mean biomass of each taxonomic group listed by temperature
range class, representing the entire Middle Atlantic Bight
Region.
Mean number of individuals of each taxonomic group listed
by temperature range class, representing the Southern New
England subarea.
310
311
315
321
322
340

Tabl e
37.
38.
39.
('l ..
40.
41.
A-I.
A-2.
-10-
TABLES (continued)
Mean numbel' of individuals of each taxonomic group listed
by temperature range class, repl'esenting the New York Bight
subarea.
Mean number of individuals of each taxonomic group listed
by temperature range class, representing the Chesapeake
Bight subarea.
Mean biomass of each taxonomic group listed by temperature
range class, representing the Southern New England subarea.
Mean biomass of each taxonomi c group 1 i sted by tempera tUI'e
range class, representing the New York Bight subarea.
~1ean biomass of each taxonomic group listed by temperature
range class, representing the Chesapeake Bight subarea.
APPENDIX
Number of samples within each depth range class in each
subarea and for the entire Middle Atlantic Bight Region.
Number of samples for each bottom sediment type in each
subarea and for the entire Middle Atlantic Bight Region.
341
342
343
344
345
392
393
c Table
A-3.
A-4.
('
-11-
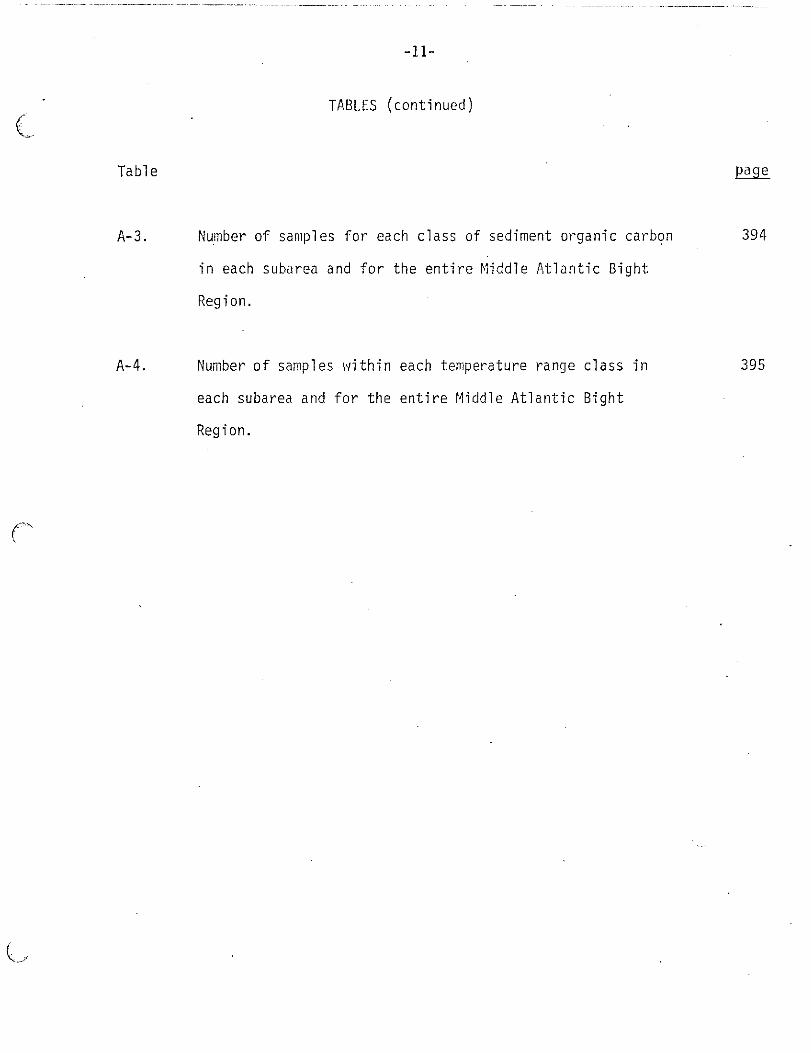
TABLES (continued)
Number of samples for each class of sediment organic carbon
in each subarea and for the entire Middle Atlantic Bight
Region.
Number of samples within each temperature range class in
each subarea and for the entire Middle Atlantic Bight
Region.
394
395
( ..... ;, ..
\ "-.. '
-12-
LIST OF FIGURES
Figure
1 Chart of the Middle Atlantic Bight Region showing the location
of geographical features and the three subarea divisions:
Southern New England, New York Bight, and Chesapeake Bight.
2 Chart of station locations where quantitative samples of
macrobenthic invertebrates were obtained.
3 Side view of the Smith-~1clntyre spring-loaded bottom sampler
4
in the closed position. Lead weights on each side are set
vertically to impede rotation of the sampler during descent
and ascent.
Bottom vi e,1 of Campbell grab sampler. Camera is i nsta 11 ed
in right-hand bucket and strobe light is in the left-hand
bucket. Width of the buckets (vertical dimension in photo
graph) is 57 cm.
5 Pie chart illustrating the taxonomic composition of the total
macrobenthic fauna in the entire Middle Atlantic Bight Region:
upper cilart--percentage number of individuals; lower chart--
percentage biomass.
6 Pie Chal"t illustrating the taxonomic composition of the total
macrobenthic fauna for each subarea in the Middle Atlantic
Bight Region. Numbers of individuals are shown on the left-
hand side, and biomasses are shown on the right-hand side.
The area of each circle is proportional to the mean density or
mean biomass.
34
42
46
47
55
76

-13-
FIGURES (continued)
Fi gure
7 Geographic distribution of the density of all taxonomic groups
combined, expressed as number of individuals per square meter
of bottom. 79
8 Geographic distribution of the biomass of all taxonomic groups
combined, expressed as damp weight per square meter of bottom. 80
9 Geographic distribution of the density of Porifera, expressed
as number of individuals per square meter of bottom.
10 Geographic distribution of the biomass of Porifera, expressed
as damp weight per square meter of bottom.
11 Geographic distribution of the density of Coelenterata,
82
83
expressed as number of individuals per square meter of bottom. 85
12 Geographic distribution of the biomass of Coelenterata,
expressed as damp weight per square meter of bottom.
13 Geographic distribution of the density of Hydrozoa, expressed
as number of individuals per square meter of bottom.
14 Geographic distribution of the biomass of Hydrozoa, expressed
as damp 11eight per square meter of bottom.
15 Geographic distribution of the density of Alcyonaria, expressed
as number of individuals per square meter of bottom.
86
87
88
89

Figure
-14-
FIGURES (continued)
16 Geographic distribution of the biomass of Alcyonaria, expressed
as damp weight per square meter of bottom.
17 Geographic distribution of the density of Zoantharia, expressed
as number of individuals per square meter of bottom.
18 Geographic distribution of the biomass of Zoantharia, expressed
as damp \'Ieight per square meter of bottom.
19 Geographic distl'ibution of the density of Platyhelminthes,
90
92
93
expressed as number of individuals per square meter of bottom. 94
20 Geographic distribution of the biomass of Platyhelminthes,
expressed as damp weight per square meter of bottom.
21 Geographic distribution of the density of Nemertea, expressed
as number of individuals per square meter of bottom.
22 Geographic distribution of the biomass of Nemertea, expressed
as damp weight per square meter of bottom.
23 Geographic distribution of the density of Nematoda, expressed
as number of individuals per squBt'e meter of bottom.
24 Geographic distribution of the biomass of Nematoda, expressed
as damp weight per square meter of bottom.
<15 Geographic distribution of the density of Annelida, expressed
as numbef of individuals per square m~ter of" bottom.
95
96
97
99
100
101

-15-
FIGURES (continued)
Figure
26 Geographic distribution of the biomass of Annelida, expressed
as damp weight per square meter of bottom.
27 Geographi c di stri buti on of the density of Pogonophora, expressed
as number of individuals per square meter of bottom.
28 Geographic distribution of the biomass of Pogonophora, expressed
as damp weight per square meter of bottom.
29 Geographic distribution of the density of Sipuncula, expressed
as number of individuals per square meter of bottom.
30 Geographic distribution of the biomass of Sipuncula, expressed
as damp weight per square meter of bottom.
31 Geographic distribution of the density of Echiura and Priapulida,
102
104
105
106
107
expressed as number of individuals per square meter of bottom. 109
32 Geographic distribution of the biomass of Echiura and Priapulida,
expressed as damp weight per square meter of bottom.
33 Geographic distribution of the density of ~1011usca, expressed
as number of individuals per square meter of bottom.
34 Geographic distribution of the biomass of Mollusca, expressed
as damp weight per square meter of bottom.
35 Geographic distribution of the density of Cephalopoda and
Polyplacophora, expressed as number of individuals per square
meter of bottom.
110
111
112
114


(
(""
(
Figure
-17-
FIGURES (continued)
45 Geographic distribution of the density of Arachnida, Copepoda,
Nebaliacea, Ostracoda, and Pycnogonida, expressed as number of
individuals per square meter of bottom.
46 Geographic distribution of the density of Cirripedia, expressed
as number of individuals per square meter of bottom.
47 Geographic distribution of the biomass of Cirri pedia, expressed
as damp weight per square meter of bottom.
48 Geographic distribution of the density of Cumacea, expressed
as number of individuals per square meter of bottom.
49 Geographic distribution of the biomass of Cumacea, expressed
as damp weight per square meter of bottom.
50 Geographic distribution of the density of Tanaidacea, expressed
as number of individuals per square meter of bottom.
51 Geographic distribution of the biomass of Tanaidacea, expressed
as damp weight per square meter of bottom.
52 Geographic distribution of the density of Isopoda, expressed as
number of individuals per square meter of bottom.
53 Geographic distribution of the biomass of Isopoda, expressed as
damp weight per square meter of bottom.
126
127
128
129
130
132
133
134
. 135
-18-
FIGURES (continued) Figure
54 Geographic distribution of the density of Amphipoda, expressed
as number of individuals per square meter of bottom.
55 Geographic distribution of the biomass of Amphipoda, expressed
as damp \veight per square meter of bottom.
56 Geographic distribution of the density of l1ysidacea, expressed
as number of individuals per square meter of bottom.
57 Geographic distribution of the biomass of l1ysidacea, expressed
as damp weight per square meter of bottom.
58 Geographic distribution of the density of Decapoda, expressed
as number of individuals per square meter of bottom.
59 Geographic distribution of the biomass of Decapoda, expressed
as damp weight per square meter of bottom.
60 Geographic distribution of the density of Bryozoa and Brachiopoda,
136
137
139
140
141
142
expressed as number of individuals per square meter of bottom. 144
61 Geographic distribution of the biomass of Bryozoa and Brachiopoda,
expressed as damp weight per square meter of bottom.
62 Geographic distribution of the density of Echinodermata, expressed
as number of individuals per square meter of bottom.
63 Geographic distribution of the biomass of Echinodermata, expressed
as damp weight per square meter of bottom.
145
146
147
-19-
FIGURES (cont"irlUed)
( Figure Page
64 Geographic distribution of the density of Holothuroidea, expressed
as number of individuals per square meter of bottom. 148
65 Geographic distribution of the biomass of Holothuroidea, expressed
as damp weight per square meter of bottom. 149
66 Geographic distribution of the density of Ech i noi dea, expressed
as number of individuals per square meter of bottom. 151
67 Geographic distribution of the biomass of Echinoidea, expressed
as damp weight per square meter of bottom. 152
68 Geographi c di stri buti on of the density of Ophi uroi dea, expressed
A as number of individuals per square meter of bottom. 153
69 Geographic distribution of the biomass of Ophiuroidea, expressed
as damp weight per square meter of bottom. 154
70 Geographic distribution of the density of Asteroidea, expressed
as number of individuals per square meter of bottom. 157
71 Geographic distribution of the biomass of Asteroidea, expressed
as damp weight per square meter of bottom. 158
72 Geographic distribution of the density of Ascidiacea and
Hemichordata, expressed as number of individuals per square
meter of bottom. 159

-20-
FIGURES (continued)
Figure
73 Geographic distribution of the biomass of Ascidacea and
Hemichordata, expressed as damp weight per square meter of
bottom.
74 Geographic distribution of three selected species of Annelida
and of one Pogonophora (lower right).
75 Geographic distribution of selected bivalves, phylum Mollusca.
76 Geographic distribution of selected bivalves (top) and
gastropods (bottom), phylum Mollusca.
77 Geographic distribution of selected amphipods, phylum Arthropoda.
78 Geographic distribution of a selected isopod (upper left) and
decapods, phyl um Arthl'opoda.
79 Geographic distribution of selected echinoids (top), asteroids
160
162
164
166
167
170
(IO\~er left), and ophiuroids (lower right), phylum Echinodermata. 171
80 Relation betvieen number of individuals and water depth.
Va 1 ues represent all taxonomi c groups combi ned for each
subarea and for the entire Middle Atlantic Bight Region. 173
81 Relation between biomass (wet weight) and water depth.
Values represent all taxonomic groups combined for each
subarea and for the entire Middle Atlantic Bight Region. 174

Figure
82
-21-
FIGURES (continued)
Density and biomass in relation to water depth in the entire
~jiddle Atlantic Bight Region for: Porifera, Hydrozoa,
Alcyonaria, Zoantharia, Platyhelminthes, and NemerteiJ.'.
83 Density and biomass in relation to water depth in the entire
~jiddle Atlantic Bight Region for: Nematoda, Annelida,
Pogonophora, Sipuncula, Echiura, and Priapulida.
84
85
Density and biomass in relation to water depth in the entire
Middle Atlantic Bight Region for: Polyplacophora, Gastropoda,
Bivalvia, Scaphopoda, Cephalopoda, and Pycnogonida.
Density and biomass in relation to water depth in the entire
Middle Atlantic Bight Region for: Ostracoda, Cirripedia,
Copepoda, Nebaliacea, Cumacea, and Tanaidacea.
86 Density and biomass in relation to water depth in the entire
Middle Atlantic Bight Region for: Isopoda, Amphipoda,
r·jys i dacea, Decapoc!a, Bryozoa, and B rachi opoda.
87 Density and biomass in relation to \Vater depth in the entire
Middle Atlantic Bight Region for: Holothuroidea, Echinoidea,
Ophiuroidea, Asteroidea, Hemichordata, and Ascidiacea.
88 Geographic distribution of bottom sediment types in the Middle
Atlantic Bight Region.
187
190
193
196
198
201
222

( -' , .;
( .. , ,
-22-
FIGURES (continued)
Figure
89 Gravel bottom at a depth of 23 m in the Nantucket Shoals
region, south of Cape Cod, Massachusetts. The most con~on
gravels range in diameter from 5 to 15 cm. Camera tripping
weight is visible in the upper right-hand corner. Photo
graph \{as taken at Stc,tion 1103, located at 41 0 11' N. lat.,
69040' H. long. Scale bar is 10 em. 223
gO Sand bottom with a small proportion of shell, located on the
continental shelf northeast of Cape Charles, Virginia, at a
depth of 48 m. Shell remains are mainly bivalve mollusks
with a small proportion of echinoid tests and spines. Photo
graph was taken at Station 1421, located at 37°30' N. lat.,
740 44' l~. long. Scale bar is 10 em. 224
91 Silty sand bottom at a depth of 406 m on the continental
slope east of New Jersey. In the upper left is a sodastraw
worm tube (HYi:llinoeciil tubicola); in the lower left is the
camera tripping-wei gilt; ilnd the tips of brittlestar arms and
numerous aninJal tracks are evident in other sections. Photo
graph was taken at Station 1335, located at 39010' N. lat.,
720 30' H. long. Scale bar is 10 em. 225
92 Sand bottom inhabited by a dense assemblage of sand dollars
(Echinarachnius parma) at a depth of 48 m near mid-shelf east
of Delaware. Size of the sand dollars is 2 to 3 cm in diame-
ter. Photograph was taken at Station 1418, located at
37°59' N. lat., 74°29' W. long. Scale bar is 10 em. 226
'-
-23-
FIGURES (continued)
Figure
93 Sand-shell bottom at a depth of 69 m near the outer
conti nenta 1 she lf northeas t of Cape t'Jay, NeVI Jersey.
The starfish is Astropecten; the shell remains are
Placopecten, Arctica, and Astarte. Photograph Vias taken
at Station 1360, located at 38040' N. lat., 73030' W. long.
Scale bar is 10 cm.
94 Silty sand bottom at a depth of 178 m on the outer conti-
nental shelf near Hudson Canyon, southeast of New York City.
Dominant animals are sea anemones (Zoantharia). Bivalve
shells and polychaete tubes are moderately common. Photo
graph was taken at Station 1324, located at 390 20' N. lat.,
720 18' W. long. Scale bar is 10 cm.
95 Relation betlveen number of individuals and bottom sediment
types. Values represent all taxonomic groups combined for
the entire Middle Atlantic Bight Region.
96 Relation behleen biomass and bottom sediment types. Values
represent all taxonomic groups combined for the entire
Middle Atlantic Bight Region.
97 Relation between number of individuals and bottom sediment
types. Va 1 ues represent all taxonomi c groupscombi ned for
each subarea.
227
228
231
232
233

-24-
FIGURES (continued)
Figure
98 Relation between biomass (~Iet weight) and bottom sediment
types. Values represent all taxonomic groups combined for
each subarea.
99 Density (sol id bar) and biomass (striped bar) in relation
to bottom sediments in the entire 1'1iddle Atlantic Bight
Region for: Porifera, Hydrozoa, Alcyonaria, Zoantharia,
Platyhelminthes, and Nemertea.
100 Density (solid bar) and biomass (striped bar) in relation
to bottom sediments in the entire Middle Atlantic Bight
Region for: Nematoda, Annelida, Pogonophora, Sipuncula,
[chiura, and Priapulida.
101 Density (solid bar) and biomass (striped bar) in relation
to bottom sediments in the entire Middle Atlantic Bight
Region for: Polyplacophora, Gastropoda, Bivalvia,
Scaphopoda, Cephalopoda, and pycnogonida.
102 Density (solid bar) and biomass (striped bar) in relation
to bottom sediments in the entire Middle Atlantic Bight
Region for: Ostracoda, Cirripedia, Copepoda, Nebaliacea,
Cumacea, and Tanaidacea.
103 Density (solid bar) and biomass (striped bar) in relation
to bottom sediments in the entire Middle Atlantic Bight
Region fOI': Isopoda, I\mphipoda, l>Iysidacea1
Decapoda,
Bryozoa, and Brachi opoda.
235
241
245
247
248
251

-25-
FIGURES (continued)
Figure
104 Density (solid bar) and biomass (striped bar) in relation to
bottom sediments in the entire Middle Atlantic Bight Region
for: Holothuroidea, Echinoidea, Ophiuroidea, Asteroidea,
Hemichordata, and Ascidiacea. 254
105 Geographic distribution of sediment organic carbon in the
Middle Atlantic Bight Region. 296
106 Relation between number of individuals and sediment organic
carbon. Values represent all taxonomic groups combined for
each subarea and for the entire Middle Atlantic Bight Region. 298
107 Relation between biomass and sediment organic carbon. Values ,
,--' represent all taxonomic groups combined for each subarea and
for the entire Middle Atlantic Bight Region. 299
108 Density and biomass in relation to sediment organic carbon in
the entire Middle Atlantic Bight Region for: Porifera,
Hydrozoa, Al cyonari a, Zoanthari a, Pl atyhelmi nthes, and Nemertea. 303
109 Density and biomass in relation to sediment organic carbon in
the entire Middle Atlantic Bight Region for: Nematoda,
Annelida, Pogonophora, Sipuncula, Echiura, and Priapulida. 304
110 Density and biomass in relation to sediment organic carbon in
the entire Middle Atlantic Bight Region for: Polyplacophora,
Gastropoda, Bivalvia, Scaphopoda, Cephalopoda, and Pycnogonida. 305

-26-
FIGURES (continued)
Figure
111 Density and biomass in relation to sediment organic carbon in
the entire Middle Atlantic Bight Region for: Ostracoda,
Cirripedia, Copepoda, Nebaliacea, Cumacea, and Tanaidace~.
112 Density and biomass in relation to sediment organic carbon in
the entire Middle Atlantic Bight Region for: Isopoda,
Amphipoda, ~1ysidacea, Decapoda, Bryozoa, and Bl'achiopoda.
113 Density and biomass in relation to sediment organic carbon in
the entire Middle Atlantic Bight Region for: Holothuroidea,
Echinoidea, Ophiuroidea, Asteroidea, Hemichordata, and.
Ascidiacea.
114 Di str! buti on of the range in bottom-water temperature for
the Middle Atlantic Bight Region. Lines delimit areas of
comparable temperature range; they are not isotherms.
115 Relation between number of individuals and range in bottom-
water temperature. Values represent all taxonomic groups
combi ned for each subarea and for the enti re Ni ddl e Atl anti c
Bight Region.
116 Relation between biomass and range of bottom-l'iater temperature.
Values represent all taxonomic groups combined for each subarea.
and for the entire Middle Atlantic Bight Region.
306
307
308
313
316
317

-27-
FIGURES (continued)
Figure
117 Density and biomass in relation to range in bottom-water
temperature in the entire Middle Atlantic Bight Region
for: Porifera, Hydrozoa, Alcyonaria, Zoantharia,
Platyhelminthes, and rlemertea.
118 Density and biomass in relation to range in bottom-vlater
temperature in the enti)'e ~liddle Atlantic Bight Region for:
Nematoda, Annelida, Pogonophora, Sipuncula, Echiura, and
Priapulida.
119 Density and biomass in relation to range in bottom-water
temperature in the entire Middle Atlantic Bight Region for:
Polyplacophora, Gastropoda, Bivalvia, Scaphopoda, Cephalopoda,
and Pycnogonida.
120 Density and biomass in relation to range in bottom-water
temperature in the entire Middle Atlantic Bight Region for:
Ostracoda, Cirripedia, Copepoda, Nebaliacea, Cumacea, and
Tanaidacea.
121 Density and biomass in relation to range in bottom-water
temperature in the entire Middle Atlantic Bight Region for:
Isopoda, Amphipoda, ~lysidacea, Decapoda, Bryozoa, and
Brachiopoda.
Paae -~-
325
328
331 <
333
336

c Figure
-28-
FIGURES (continued)
122 Density and biomass in relation to range in bottom-water
temperature in the entire Middle Atlantic Bight Region for:
Holothuroidea, Echinoidea, Ophiuroidea, Asteroidea,
Hemichordata, and Ascidiacea.
123 Geographic distribution of the number of individuals for
each dominant taxon in the entire Middle Atlantic Bight
Region.
124 Geographic distribution of the biomass for each dominant taxon
in the entire Middle Atlantic Bight Region.
338
373
374
( \.
-29-
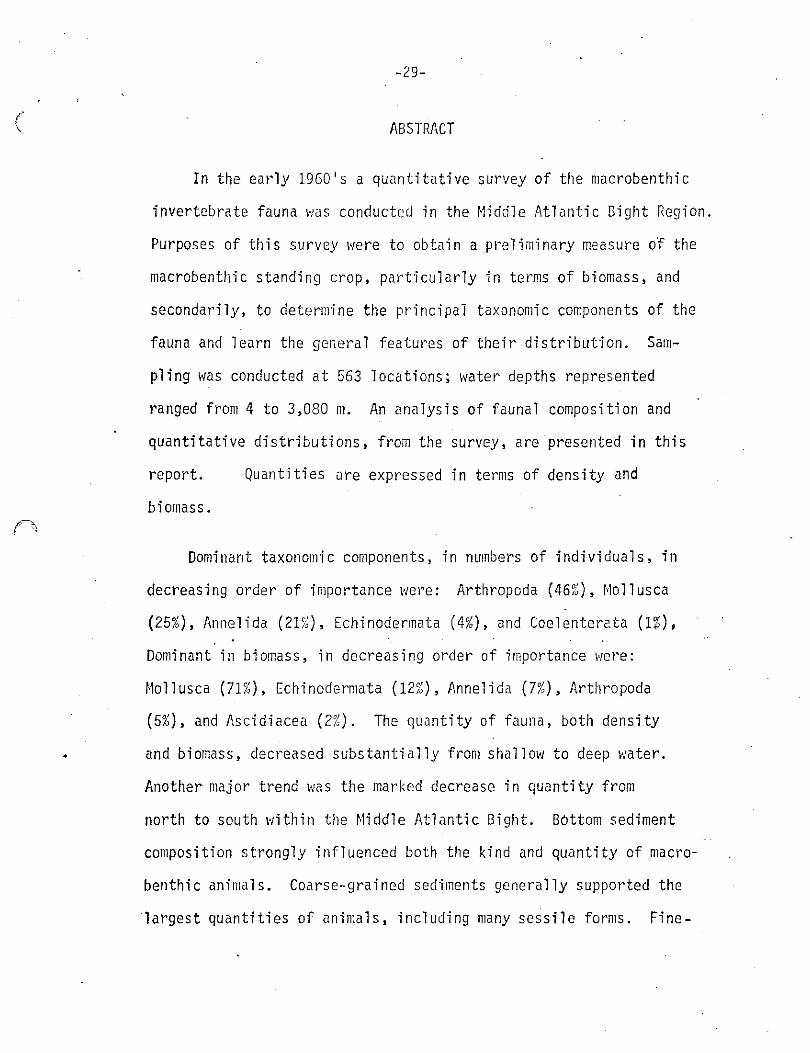
ABSTRACT
In the early 1960's a quantitative survey of the macrobenthic
invertebrate fauna was conducted in the Middle Atlantic Bight Region.
Purposes of this survey were to obtain aprelim'inary measure of the
macrobenthic standing crop, particularly in terms of biomass, and
secondarily, to determine the principal taxonomic components of the
fauna and learn the general features of their distribution. Sam
pling was conducted at 563 locations; water depths represented
ranged from 4 to 3,080 m. An analysis of faunal composition and
quantitative distributions, from the survey, are presented in this
report. Quantities are expressed in terms of density and
biomass.
Dominant taxonomi c components, in numbers of i ndi vi dua 1 s, i 11
decreasing order of importance were: Arthropoda (46%). Mollusca
(25%), Annelida (21%), Echinodermata (4%), and Coelentereta (11).
Dominant in biomass, in decreasing order of importance were:
r'lollusca (71%), Echinodermata (12;;), Annelida (7%), Arthropoda
(5%), and Ascidiacea (2%). The quantity of fauna, both density
and biomass, decreased substantially from shallow to deep water.
Another major trend Ivas the marked decrease in quantity from
north to south within the Middle Atlantic Bight. BOttom sediment
composition strongly influenced both the kind and quantity of macro
benthic animals. Coarse-grained sediments generally supported the
largest quantities of animals, including many sessile forms. Fine-
•
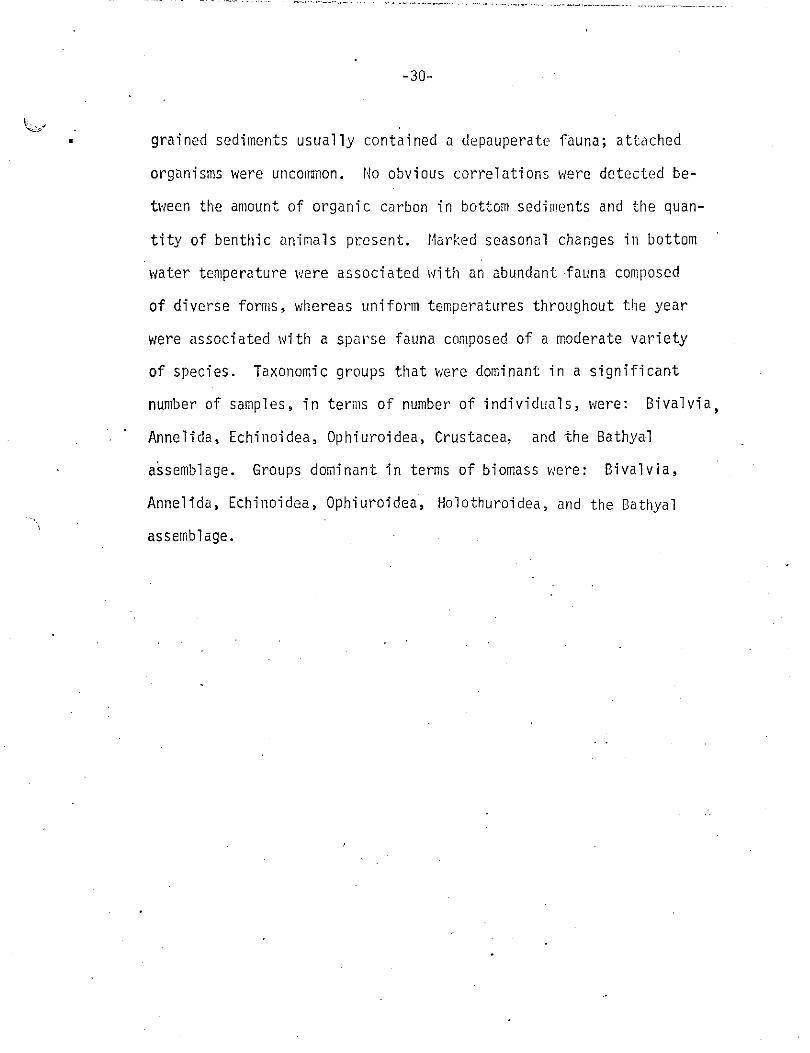
-30-
grained sediments usually contained a depauperate fauna; attached
organisms ~Iere UnCOIT1110n. No obvious correlations I'lere detected be
tVleen the amount of organic carbon in bottom sediments and the quan
tity of benthic animals present. f.1arked seasonal changes in bottom
water temperature were associated with an abundant fauna composed
of diverse forms, wbereas unifom temperatures throughout the year
were associated \Vith a spill'se fauna composed of a moderate val'iety
of species. Taxonomic groups that \vEre dominant in a significant
number of samples, in terms of number of individuals, were: Bivalvia,
Annelida, Echinoidea, Ophiuroidea, Crustacea, and the Bathyal
assemblage. Groups dominant in tems of biomass vlere: Bivalvia,
Annelida, Echinoidea, Ophiuroidea, Holothuroidea, and the Bathyal
assemblage.