Macro Value Investing What to Expect in Sideways Markets · Macro Value Investing What to Expect in...
17
Presented by: Macro Value Investing What to Expect in Sideways Markets April 13, 2016 BEN GRAHAM CENTER 2016 VALUE INVESTING CONFERENCE Kim Shannon, CFA, MBA
Transcript of Macro Value Investing What to Expect in Sideways Markets · Macro Value Investing What to Expect in...

Presented by:
Macro Value InvestingWhat to Expect in Sideways Markets
April 13, 2016
BEN GRAHAM CENTER 2016 VALUE INVESTING CONFERENCE
Kim Shannon, CFA, MBA
PAGE
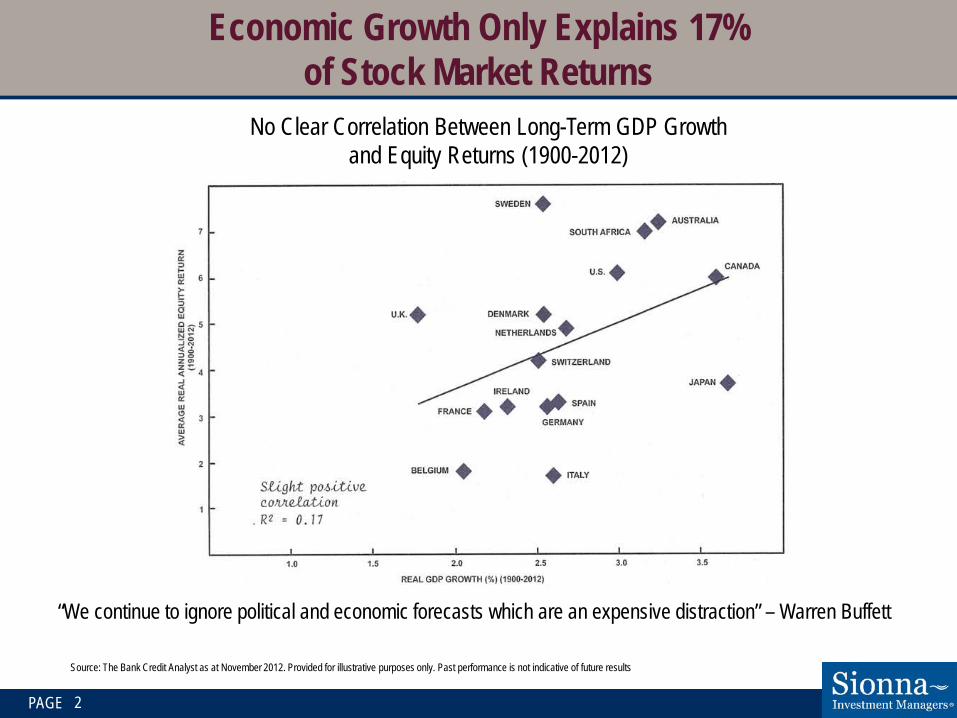
Economic Growth Only Explains 17% of Stock Market Returns
No Clear Correlation Between Long-Term GDP Growth and Equity Returns (1900-2012)
2
Source: The Bank Credit Analyst as at November 2012. Provided for illustrative purposes only. Past performance is not indicative of future results
“We continue to ignore political and economic forecasts which are an expensive distraction” – Warren Buffett

PAGE 3
Short-Term vs. Long-Term Historical Perspective
Source: http://www.macrotrends.net/1319/dow-jones-100-year-historical-chart. Provided for illustrative purposes only. Past performance is not indicative of future results
Dow Jones Industrial Average

PAGE 4
Invisible Hand-Benefits of Trade
“By pursuing his own interest, he frequently promotes that of the
society more effectually than when he really intends to promote it”
Adam Smith, Wealth of Nations 1776

PAGE
Range-Bound Markets are Frequent
U.S. Stock Market
5
Source: Wells Capital Management. For illustrative purposes only. The above returns do not represent the performance of any product or security managed by Sionna or Bridgehouse and are provided for illustrative purposes only. The performance presented represents historical performance of an unmanaged index. Returns would have been lower if they were subject to management fees and trading expenses. Past performance is not an indicator of future results. The indices are unmanaged and have no fees. One cannot invest directly in an Index.
3
2
1
4
5
6
7
8
10
30 Years25 Years
20 Years
15 Years
16 Years
7
8
9
Retu
rns(
log
norm
al sc
ale)
As of 2015:
Markets have been range-bound 106 of the last 142 years
Secular bull runs are a rarity; not the norm
After major bull markets, markets have historically trended sideways for a minimum of 15 years

PAGE
Market Returns Tend To Be Bi-Modal
Source: Robert J. Shiller, S&P 500 Price Returns, average annual returns since 1872 is 5.9%.
0
2
4
6
8
10
12
0 to 2 2 to 4 4 to 6 6 to 8 8 to 10 10 to 12 12 to 14 14 to 16 16 to 18 18 to 20
Frequency of US Returns Since 1872(64 of 144 observations are between 0% to 20%)
6
Percent
Num
ber o
f Obs
erva
tions

PAGE
Last Full Sideways Market (1965-1982)
7
Source: Rathbones’ Investment Strategy, February 2008. CRB: Commodity Research Bureau. P/E: Price/Earnings ratio*As at January 31, 2016. The above returns do not represent the performance of any product or security managed by Sionna and are provided for illustrative purposes only. The performance presented represents historical performance of an unmanaged index. Returns would have been lower if they were subject to management fees and trading expenses. Past performance is not an indicator of future results. The indices are unmanaged and have no fees. One cannot invest directly in an Index.
0
10
20
30
40
50
60
70
80
90
100
1.5
2
2.5
3
3.5
4
4.5
1950 1955 1960 1965 1970 1975 1980 1985 1990 1995 2000 2005
Dow
Jon
es I
ndus
tria
l In
dex
(PE)
CR
B S
pot I
ndex
& D
ow J
ones
Ind
ustr
ial
Inde
x (L
og In
dex)
CRB Spot IndexDow Jones Industrial IndexDow Jones Industrial Index PE Ratio
Sideways Markets typically end with single digit P/Es
S&P/TSX at 19.8 P/E*
S&P 500 at 17.3 P/E*

PAGE
Learn to Love 6%Expected Return of Sideways Market
8
Earnings Growth + Change in P/E Multiple + Dividend Yield Bear Market1929–1932
Range-Bound Markets*
AverageBull Markets†
AverageEarnings Growth -28.1 5.6 5.6+/- P/E Growth -12.5 -4.6 7.0= Stock Return -37.1 0.7 13.0+ Dividend 7.1 5.3 3.7Total Return -32.6 5.9 17.1Inflation/Deflation -8.4 4.9 2.5Total Real Return -26.4 1.0 14.2
*Range-Bound Markets: 1906–1924, 1937–1950, 1966–1982†Bull Markets: 1950–1966, 1982–2000
Dividends are 90% of total returns in range-bound marketsValues in chart shown in percentSource: Vitaliy N. Katsenelson “Active Value Investing – Making Money in Range Bound Markets”, 2007. For illustrative purposes only. Indices are unmanaged and cannot be directly invested into. Index returns from eVestment
January 2000 – March 2016 Annualized Return
S&P/TSX Composite 5.5%S&P 500 (CAD) 3.4%S&P 500 (US) 4.1%

PAGE
The Price of Entry Contributes to Returns
9
Source: Plexus Asset Management (based on data from Prof Robert Shiller and I-Net Bridge). As at September 30, 2012. The above returns do not represent the performance of any product or security managed by Sionna or Bridgehouse and are provided for illustrative purposes only. The performance presented represents historical performance of an unmanaged index. Returns would have been lower if they were subject to management fees and trading expenses. Past performance is not an indicator of future results. The indices are unmanaged and have no fees. Onecannot invest directly in an Index.
Subsequent 10-Yr Real Returns Based on S&P 500 P/E Ratios from 1871 - 2012
-10%
-5%
0%
5%
10%
15%
20%
25%
Group 1:PE Ratio
<6
Group 2:PE Ratio
6 & 7
Group 3:PE Ratio
8 & 9
Group 4:PE Ratio10 & 11
Group 5:PE Ratio12 & 13
Group 6:PE Ratio14 & 15
Group 7:PE Ratio16 & 17
Group 8:PE Ratio18 & 19
Group 9:PE Ratio20 & 21
Group 10:PE Ratio
21 >
Average return Spread between minimum and maximum return
Cheapest valuations Most expensive valuations

PAGE
Bond Yield Trends Tend to Last 20 Years and Symmetrical
Source: US Treasury and Robert Shiller, February 12, 2016
10
10-Year Treasury Rate(percent)
Min. 1.95% (Jan 1941)
Max. 15.32% (Sep 1981)
Recent Min. 1.53% (July 2012)
Suggests rates may bottom 2021
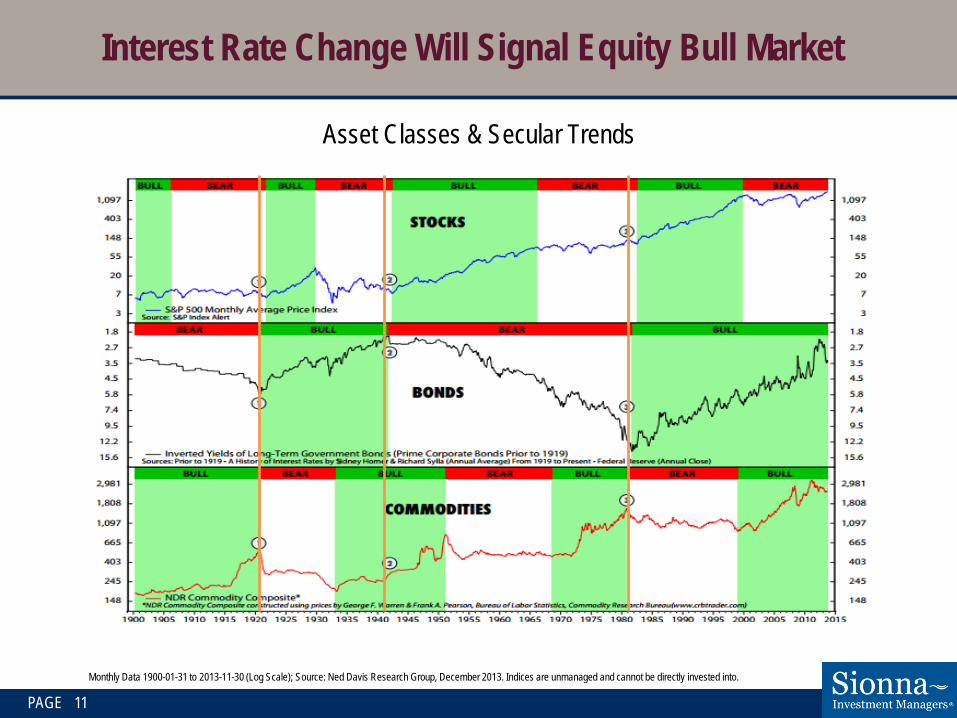
Monthly Data 1900-01-31 to 2013-11-30 (Log Scale); Source: Ned Davis Research Group, December 2013. Indices are unmanaged and cannot be directly invested into.
Interest Rate Change Will Signal Equity Bull Market
Asset Classes & Secular Trends
PAGE 11
PAGE
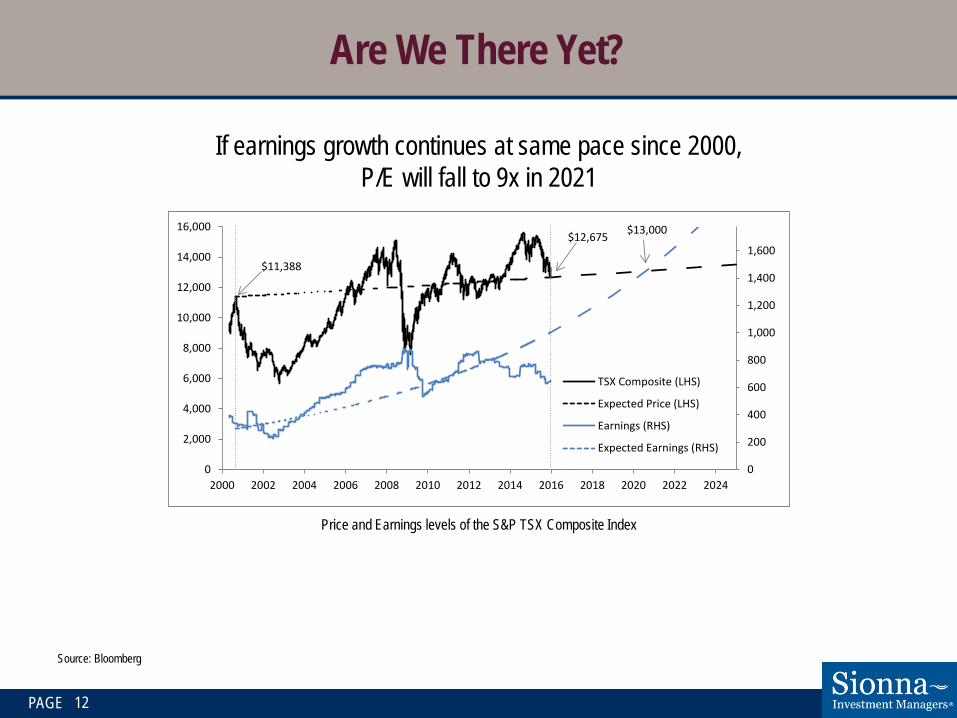
If earnings growth continues at same pace since 2000, P/E will fall to 9x in 2021
Are We There Yet?
12
$11,388
$12,675 $13,000
0
200
400
600
800
1,000
1,200
1,400
1,600
0
2,000
4,000
6,000
8,000
10,000
12,000
14,000
16,000
2000 2002 2004 2006 2008 2010 2012 2014 2016 2018 2020 2022 2024
TSX Composite (LHS)
Expected Price (LHS)
Earnings (RHS)
Expected Earnings (RHS)
Price and Earnings levels of the S&P TSX Composite Index
Source: Bloomberg
PAGE
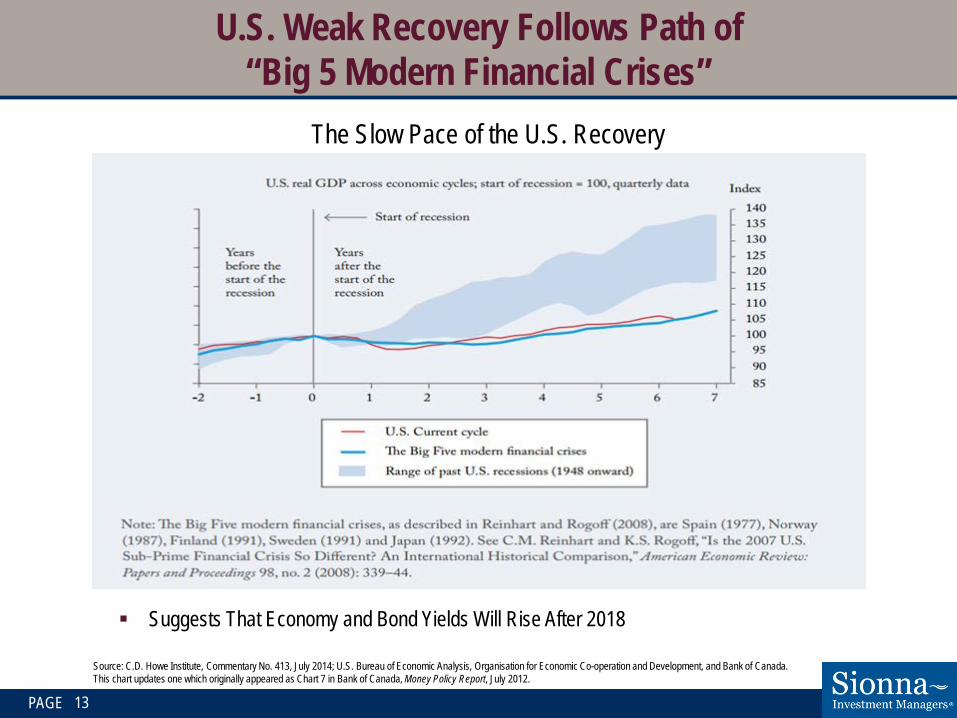
U.S. Weak Recovery Follows Path of “Big 5 Modern Financial Crises”
13
The Slow Pace of the U.S. Recovery
Source: C.D. Howe Institute, Commentary No. 413, July 2014; U.S. Bureau of Economic Analysis, Organisation for Economic Co-operation and Development, and Bank of Canada. This chart updates one which originally appeared as Chart 7 in Bank of Canada, Money Policy Report, July 2012.
Suggests That Economy and Bond Yields Will Rise After 2018

PAGE
Excessive Debt Leads to Extended Periods of Low Interest Rates
14
Source: Federal Reserve Board, Homer & Sylla. Bank of Japan. U.S. line through 2012
After excessive debt panic years: Reduces GDP Growth,
slows inflation and lowers long term interest rates Suggests low in bond
yield could be 2021

PAGE
Best Guess Based on History is Yields Bottom and Equities Enter Bull Around 2018-2021
• Current earnings growth trend suggests single digit P/E of 9 by 2021 • 2 standard deviation event symmetry suggests after an 18 year bull market,
will get an 18 year sideways market… thus sideways will end 2018 • Bond market symmetry suggests 40 years. 1981 + 40 = 2021 • Reinhart and Rogoff – after major financial crises it takes 10 + years for
economy to recover and return to normal. 2008 + 10 = 2018• Rates bottom on average 13.7 years after major financial crisis
2008 + 13 = 2021
15

PAGE 16
Lessons From Sideways Markets
Equity returns modest, expect 4 – 6% average return. Ends when equity P/E multiples fall to single digits a second time
(fell below P/E of 10 in March 2009). Ends after long bond yields change direction (in this case, begin to rise), likely 2018-2021. History suggests rates will bottom next 2-5 years, followed by equities entering a bull phase Current dividend yield of 3.5% a critical part of return (typically 90% of total return). Diversify broadly, avoid excessive risk, avoid capital loss. 3.5 dividend yields and almost 6% annualized returns are solid especially today with low
bond yields. Better returns are ahead for equity investors. Time to bring equity allocations back to normal levels.

For More Information…
Sionna’s communications offer subscribers additional insight from the managers. Subscribers can choose to receive: Quarterly Emails Soundbites Daily Value Quotes
To subscribe to email updates, please visit: www.sionna.ca/sign-up/.
Links to other internet sites should not be construed as an endorsement of any kind or of the views contained therein.
Sionna Investment Managers @SionnaValue The ‘Sharing Value’ Blog
Or follow us:
PAGE 34