Macro Market Levels & Trends Preview - January 23rd, 2017
17
1 Mark Putrino, CMT www.bullsheadtrading.com [email protected] BHT identifies meaningful trends and important supply and demand levels in the markets. An understanding of these dynamics will add Alpha to any investment strategy. The following are important factors to consider in the Financial Markets this week: Equities - The S&P 500 has been consolidating for over a month between 2,250 and 2,280. The most recent phase of this rally began when the technology sector broke important resistance. At that time the SPX was trading around 2,210, so there may be support at that level if it heads lower in the longer-term. Russell 2000 Smallcap Equities - After making all-time highs last month, the IWMs are testing the lower end of the recent range. In the short-term, $135 has been support but it may be deteriorating. Longer-term, there may be support around the $129-130 level because this was the top and an all-time high in June of 2015. Russell Microcap Equites - The IWCs have been trending lower and as expected are testing support around the $84.50 level. This level is important support because it was the peak and an all-time high in June of 2015. A break of this level could lead to a meaningful move lower. S&P 500 Technology Sector - The XLKs continue to trend higher. If they head lower there may be support around the $48 level because it was the top of the range from the middle of September through the end of October. Longer-term, the $46 level was support in early September and early November. S&P 500 Healthcare Sector - The XLVs are trending lower since breaking their short-term uptrend after running into resistance around $72. There was resistance around $72 because it was clear resistance in early November. Longer-term, the dynamics are interesting because they could be forming a multi-year bearish reversal formation. S&P 500 Financial Sector - The move in the XLFs after the election was almost unprecedented. It was one of their largest monthly gains ever. They have been consolidating around $23 and are in a slight downtrend after breaking the lower end of the trading range they were in throughout December and early January. Gold - Gold has broken the uptrend that began at the end of December. Oil - Oil has been consolidating and as expected found support around $51. This level is support because it was clearly defined resistance four times over the past 16 months. It failed and had a significant selloff from this level in October of 2015, in early June, and again in October. Equity Momentum - 65% of NYSE Stocks are trading above their 200-day moving averages. This is a neutral reading. Interest Rates - Ten-year yields have risen from 1.37% in July to 2.46%. US Dollar Index - The US Dollar Index is consolidating and testing support around the 100 level. This level was the exact top in March and November of 2015. It is truly an amazing phenomenon that a market of trillions of dollars would turn at such a precise round level. No fundamental analyst could explain why this happens. Macro Market Levels & Trends Preview Analysis of Supply & Demand Dynamics in the Financial Markets January 23rd h , 2017
-
Upload
mark-putrino-cmt -
Category
Documents
-
view
41 -
download
0
Transcript of Macro Market Levels & Trends Preview - January 23rd, 2017

1
Mark Putrino, CMT www.bullsheadtrading.com [email protected]
BHT identifies meaningful trends and important supply and demand levels in the markets. An understanding of these dynamics will add Alpha to
any investment strategy. The following are important factors to consider in the Financial Markets this week:
Equities - The S&P 500 has been consolidating for over a month between 2,250 and 2,280. The most recent phase of this rally began when the technology sector broke
important resistance. At that time the SPX was trading around 2,210, so there may be support at that level if it heads lower in the longer-term.
Russell 2000 Smallcap Equities - After making all-time highs last month, the IWMs are testing the lower end of the recent range. In the short-term, $135 has been support but
it may be deteriorating. Longer-term, there may be support around the $129-130 level because this was the top and an all-time high in June of 2015.
Russell Microcap Equites - The IWCs have been trending lower and as expected are testing support around the $84.50 level. This level is important support because it was
the peak and an all-time high in June of 2015. A break of this level could lead to a meaningful move lower.
S&P 500 Technology Sector - The XLKs continue to trend higher. If they head lower there may be support around the $48 level because it was the top of the range from the
middle of September through the end of October. Longer-term, the $46 level was support in early September and early November.
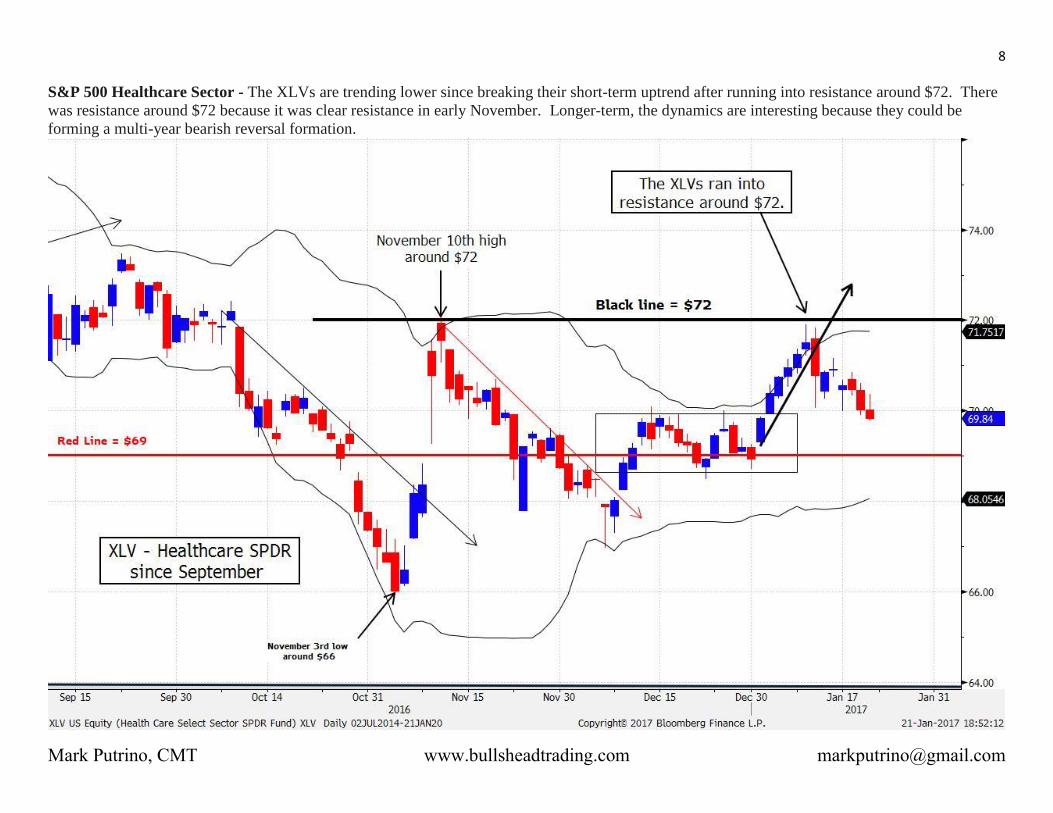
S&P 500 Healthcare Sector - The XLVs are trending lower since breaking their short-term uptrend after running into resistance around $72. There was resistance around $72
because it was clear resistance in early November. Longer-term, the dynamics are interesting because they could be forming a multi-year bearish reversal formation.
S&P 500 Financial Sector - The move in the XLFs after the election was almost unprecedented. It was one of their largest monthly gains ever. They have been consolidating
around $23 and are in a slight downtrend after breaking the lower end of the trading range they were in throughout December and early January.
Gold - Gold has broken the uptrend that began at the end of December.
Oil - Oil has been consolidating and as expected found support around $51. This level is support because it was clearly defined resistance four times over the past 16 months.
It failed and had a significant selloff from this level in October of 2015, in early June, and again in October.
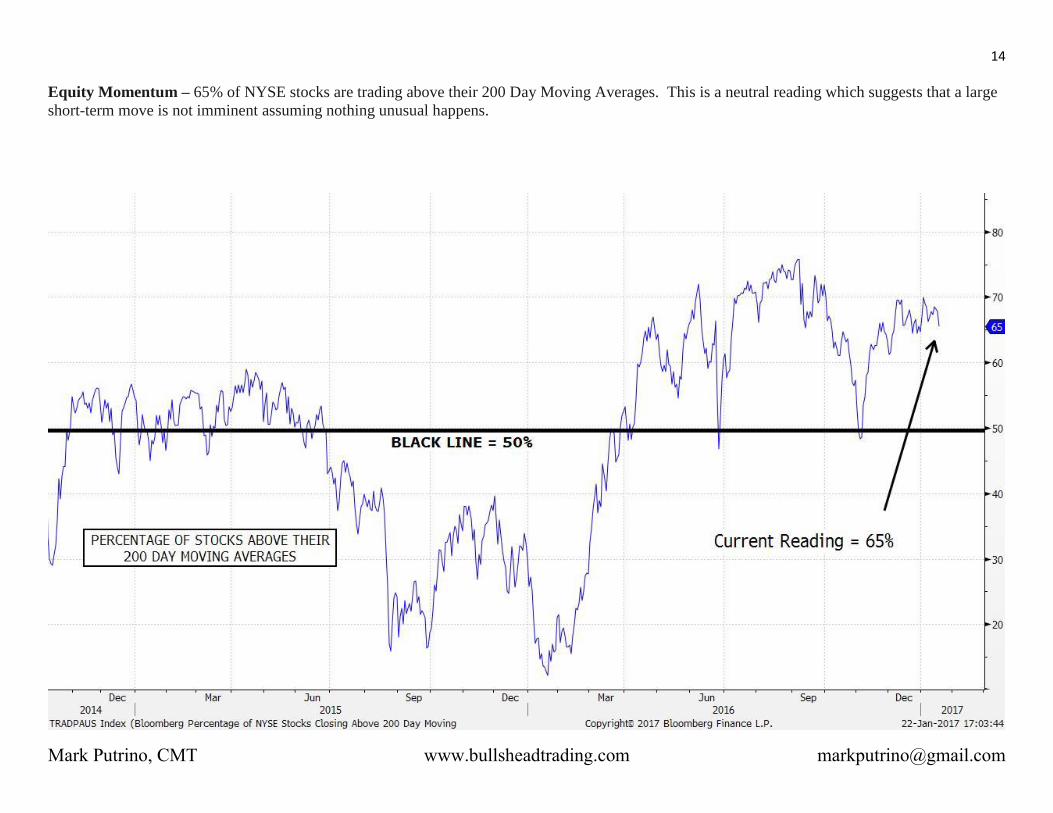
Equity Momentum - 65% of NYSE Stocks are trading above their 200-day moving averages. This is a neutral reading.
Interest Rates - Ten-year yields have risen from 1.37% in July to 2.46%.
US Dollar Index - The US Dollar Index is consolidating and testing support around the 100 level. This level was the exact top in March and November of 2015. It is truly an
amazing phenomenon that a market of trillions of dollars would turn at such a precise round level. No fundamental analyst could explain why this happens.
Macro Market Levels & Trends Preview
Analysis of Supply & Demand Dynamics in the Financial Markets
January 23rdh, 2017

2
Mark Putrino, CMT www.bullsheadtrading.com [email protected]
Large Cap Equities - The S&P 500 has been consolidating for over a month between 2,250 and 2,280. The most recent phase of this rally began
when the technology sector broke important resistance. At that time the SPX was trading around 2,210, so there may be support at that level if it
heads lower in the longer-term.

3
Mark Putrino, CMT www.bullsheadtrading.com [email protected]
Russell 2000 Smallcap Equities - After making all-time highs last month, the IWMs continue to trade sideways but are testing the lower end of the
recent range. In the short-term, $135 has been support but it may be deteriorating. Longer-term, there may be support around the $129-130 level
because this was the top and an all-time high in June of 2015.

4
Mark Putrino, CMT www.bullsheadtrading.com [email protected]
Russell 2000 Smallcap Equities Long-term - After making all-time highs last month, the IWMs continue to trade sideways but are testing the lower
end of the recent range. In the short-term, $135 has been support but it may be deteriorating. Longer-term, there may be support around the $129-
130 level because this was the top and an all-time high in June of 2015.

5
Mark Putrino, CMT www.bullsheadtrading.com [email protected]
Russell Microcap Sector - The IWCs have been trending lower and as expected are testing support around the $84.50 level. This level is important
support because it was the peak and an all-time high in June of 2015. A break of this level could lead to a meaningful move lower.

6
Mark Putrino, CMT www.bullsheadtrading.com [email protected]
Russell Microcap Sector Long-term - The IWCs have been trending lower and as expected are testing support around the $84.50 level. This level
is important support because it was the peak and an all-time high in June of 2015. A break of this level could lead to a meaningful move lower.

7
Mark Putrino, CMT www.bullsheadtrading.com [email protected]
S&P 500 Technology Sector - The XLKs continue to trend higher. If they head lower there may be support around the $48 level because it was the
top of the range from the middle of September through the end of October. Longer-term, the $46 level was support in early September and early
November.
8
Mark Putrino, CMT www.bullsheadtrading.com [email protected]
S&P 500 Healthcare Sector - The XLVs are trending lower since breaking their short-term uptrend after running into resistance around $72. There
was resistance around $72 because it was clear resistance in early November. Longer-term, the dynamics are interesting because they could be
forming a multi-year bearish reversal formation.

9
Mark Putrino, CMT www.bullsheadtrading.com [email protected]
Healthcare Long-term - Longer-term, the XLVs could be forming a multi-year Bearish reversal formation. This is a very important and interesting
dynamic. This sector rallied throughout the Obama Presidency. One can argue that this sector profited due to the Affordable Care Act. Now that
Mr. Trump has said he will repeal Obamacare and this could be why this sector is showing long-term bearish indications. The $64 level is very
important because it was the bottom in September of 2015 and again in February of 2016.

10
Mark Putrino, CMT www.bullsheadtrading.com [email protected]
S&P 500 Financial Sector – The move in the XLFs after the election was almost unprecedented. It was one of their largest monthly gains ever.
They have been consolidating around $23 and are in a slight downtrend after breaking the lower end of the trading range they were in throughout
December and early January.

11
Mark Putrino, CMT www.bullsheadtrading.com [email protected]
Gold – Gold has broken the uptrend that began at the end of December.

12
Mark Putrino, CMT www.bullsheadtrading.com [email protected]
Oil Short-term – Oil has been consolidating although it has been in a slight downtrend over the last two weeks and as expected found support
around $51. This level is support because it was clearly defined resistance four times over the past 16 months. It failed and had a significant selloff
from this level in October of 2015, in early June, and again in October. If the $51 level breaks there could be a meaningful move lower. $43 was
support in September and November.

13
Mark Putrino, CMT www.bullsheadtrading.com [email protected]
Oil – Oil is consolidating since breaking important resistance around the $51 level. It tested this level four times over the past 16 months. It is now
support. It was the low on Tuesday and Wednesday. It failed and had a significant sell-off from this level in October of 2015, in early June, and
again in October of 2016.
14
Mark Putrino, CMT www.bullsheadtrading.com [email protected]
Equity Momentum – 65% of NYSE stocks are trading above their 200 Day Moving Averages. This is a neutral reading which suggests that a large
short-term move is not imminent assuming nothing unusual happens.

15
Mark Putrino, CMT www.bullsheadtrading.com [email protected]
Interest Rates - Ten-year yields have risen from 1.37% in July to 2.46%.
16
Mark Putrino, CMT www.bullsheadtrading.com [email protected]
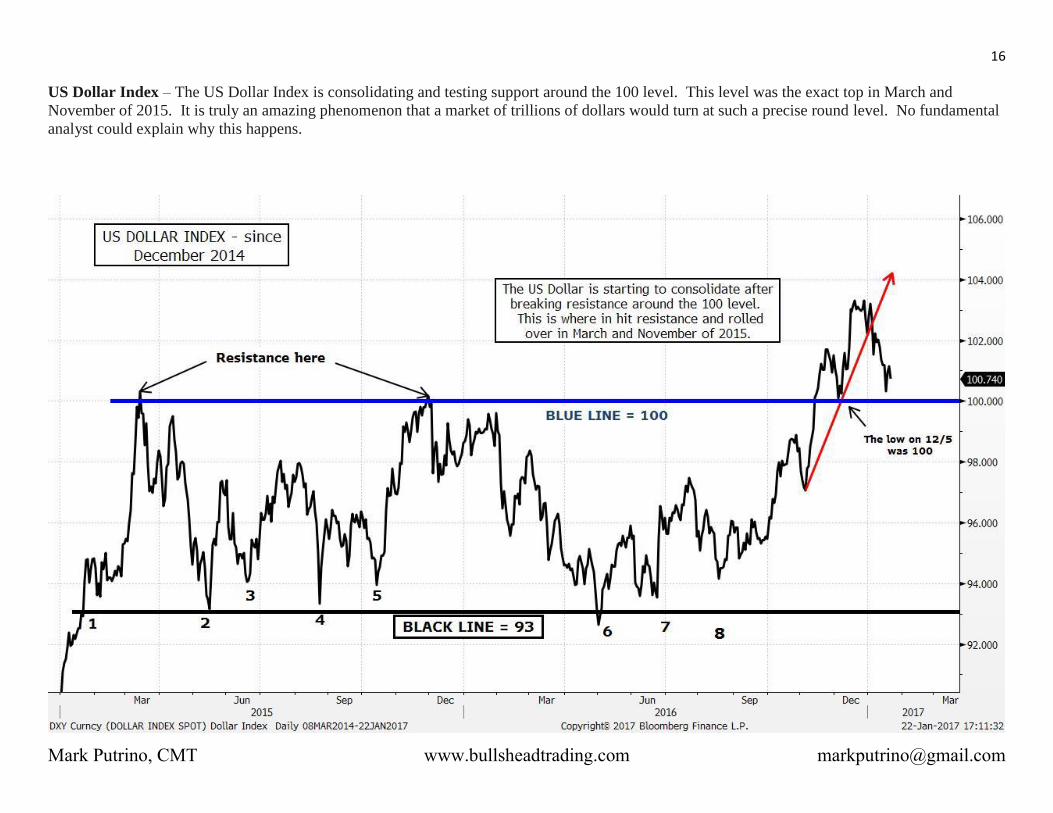
US Dollar Index – The US Dollar Index is consolidating and testing support around the 100 level. This level was the exact top in March and
November of 2015. It is truly an amazing phenomenon that a market of trillions of dollars would turn at such a precise round level. No fundamental
analyst could explain why this happens.

17
Mark Putrino, CMT www.bullsheadtrading.com [email protected]
Summary:
In financial markets, there are certain price levels that are more significant than others with regards to the amount of supply and
demand that exists at them.
In financial markets, prices are always doing one of three things. They are either going up, going down, or staying the same.
BHT utilizes a process and methodology that has been developed over twenty years in order to identify these levels and price
trends.
BHT does not utilize many of the traditional Technical Analysis Techniques such as Fibonacci Retracements or Elliot Waves.
BHT questions and doubts the validity of many of these techniques and believes then belong in the realm of Bigfoot and UFOs.
The BHT philosophy and method is based on experience, common sense, and logic. The founder spent almost two decades trading
illiquid securities and this background gave him the ability to understand how to identify these levels and price trends.
An understanding and awareness of these levels and trends will add Alpha to almost any investment strategy.
BHT’s goal is to contribute to and enhance your research and investment process.
Bulls Head Trading Analysis, LLC was founded by Mark Putrino, CMT.
Mark has nearly two decades of experience in the institutional investment management industry as a professional securities trader. Before founding
Bulls Head, he spent more than 15 years as the Head Trader at three different institutional hedge fund and money management groups, all of which
exceed or exceeded more than $1 billion dollars in managed assets. His experience also includes trading directly for two of the best money
managers in the history of the industry, Mario Gabelli and Steven A. Cohen.
Mark is a member of the Market Technicians Association and has held the Chartered Market's Technician Certification (CMT) since 2002. He
earned a Master’s Degree in Finance at New York University, and a Bachelors in Economics at the University of Connecticut.