Macro Economic Constraints in Developing Nations T he case of Turkey
23
Macro Economic Constraints in Developing Nations The case of Turkey Türkel Minibaş, Prof.Dr. Istanbul University Faculy of Economics
-
Upload
carter-carpenter -
Category
Documents
-
view
24 -
download
0
description
Macro Economic Constraints in Developing Nations T he case of Turkey. Türkel Minibaş , Prof.Dr. Istanbul University Faculy of Economics. every crisis period became a restoration period for capitalism, in that when economic, social and political balances are upset - PowerPoint PPT Presentation
Transcript of Macro Economic Constraints in Developing Nations T he case of Turkey
Macro Economic Constraints in Developing Nations
The case of Turkey
Türkel Minibaş, Prof.Dr.Istanbul University
Faculy of Economics

every crisis period
became a restoration period for capitalism,
in that when economic, social and political
balances are upset
new balances were created.
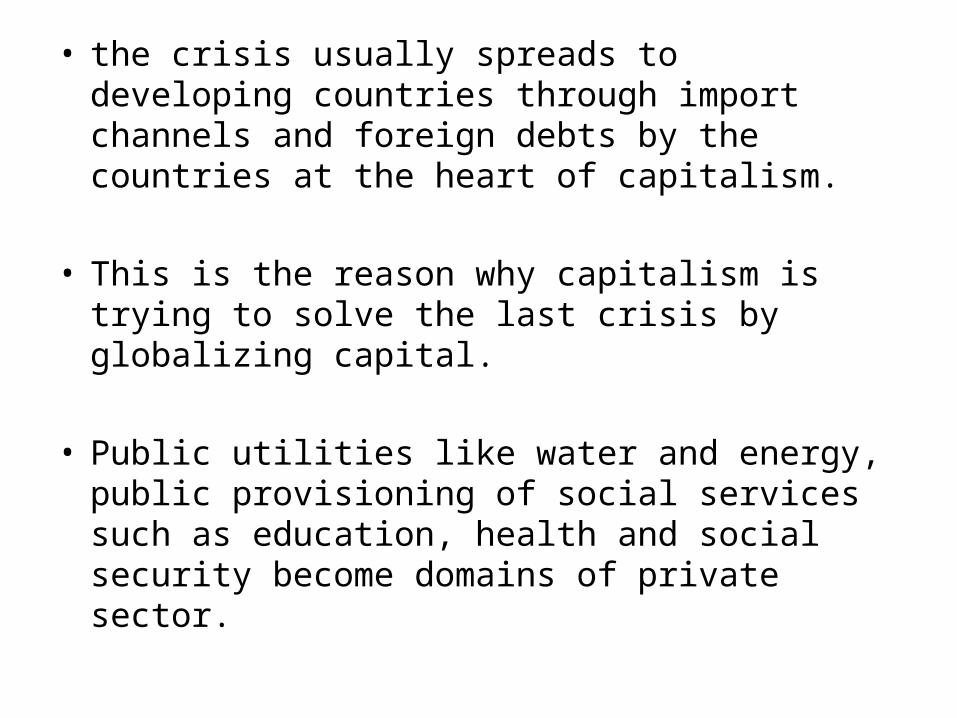
• the crisis usually spreads to developing countries through import channels and foreign debts by the countries at the heart of capitalism.
• This is the reason why capitalism is trying to solve the last crisis by globalizing capital.
• Public utilities like water and energy, public provisioning of social services such as education, health and social security become domains of private sector.

to solve the crisis of the capitalist system
• is not to solve macro economic defects in developing nations,
but to solve the crisis of the capitalist system by integrating less developed ones to the system,
irrespective of whether they are called stability or structural adjustment programs. • They are the dependency programs that are
established by neo-liberal policies.• The main task of these policies is to the design
of a new world order.

neo-liberal thinker
“the liberalization of trade and investment laws around the world
has contributed to an enormous increase
in the volume of world trade and
foreign direct and portfolio investment, whose impact on the welfare of participants has been considerable and for the better.”

If we consider Turkey as an example.
• GNP is now 5 %, but was - 8 in 2001.
• the growth in the manufacturing sector was 12 % in 2004
compared to 4 % in 2005.
• Consumption price index was 69 % in 2001, now it is around 7.6 %.

An increase in growth rates and foreign money reserves depends on continuing short term funds.
21.5 billion dollar external funds entered
50 % of which was government debt instruments and stock market shares.
.

can the house of card break down?
as far as the decrease of real interest rates less than the degree of nominal rate decreases,
we have time!!!
Three years ago, the nominal interest rate of Treasure stocks were 63.9 %, and they decrease to 17.4 %. This was the reason why real interest rates decreased from 30.8 % to 8 % at the same time.
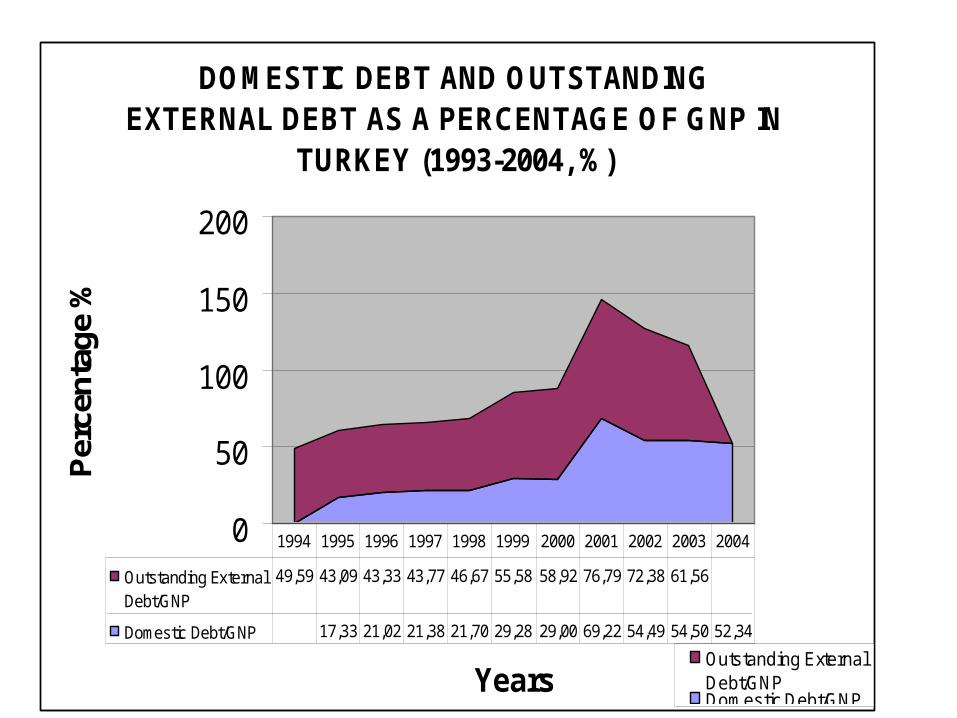
DOMESTIC DEBT AND OUTSTANDING EXTERNAL DEBT AS A PERCENTAGE OF GNP IN
TURKEY (1993-2004, %)
0
50
100
150
200
Years
Per
cent
age
%
Outstanding ExternalDebt/GNPDomestic Debt/GNP
Outstanding ExternalDebt/GNP
49,59 43,09 43,33 43,77 46,67 55,58 58,92 76,79 72,38 61,56
Domestic Debt/GNP 17,33 21,02 21,38 21,70 29,28 29,00 69,22 54,49 54,50 52,34
1994 1995 1996 1997 1998 1999 2000 2001 2002 2003 2004
Growth Rate of GNP
Agriculture
Industry
ConstructionServices
0,005,00
10,0015,0020,0025,0030,0035,0040,00
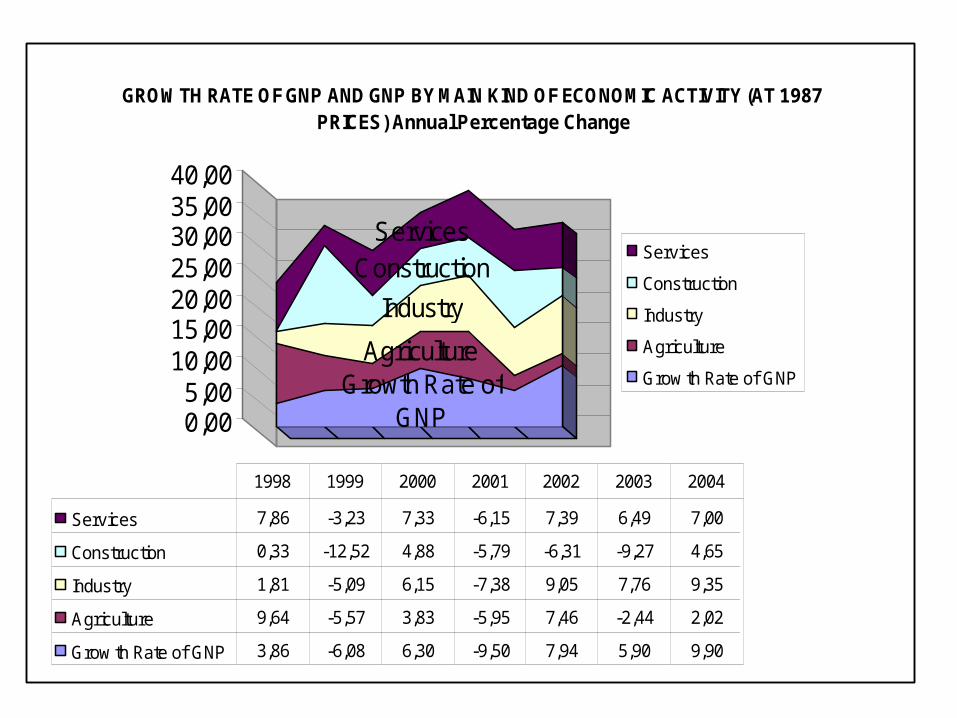
GROWTH RATE OF GNP AND GNP BY MAIN KIND OF ECONOMIC ACTIVITY (AT 1987 PRICES) Annual Percentage Change
Services
Construction
Industry
Agriculture
Grow th Rate of GNP
Services 7,86 -3,23 7,33 -6,15 7,39 6,49 7,00
Construction 0,33 -12,52 4,88 -5,79 -6,31 -9,27 4,65
Industry 1,81 -5,09 6,15 -7,38 9,05 7,76 9,35
Agriculture 9,64 -5,57 3,83 -5,95 7,46 -2,44 2,02
Grow th Rate of GNP 3,86 -6,08 6,30 -9,50 7,94 5,90 9,90
1998 1999 2000 2001 2002 2003 2004

Can the happiness chain break?
i f
the increase in foreign money stocks will continue
and
how long an over valued Turkish lira
will continue
by over valued Turkish lira :
• Import costs become lower in intermediate goods and raw materials.
- import of intermediate goods increased to 22 %,
- import of raw materials increased 24 %.
• domesticly produced final goods such as otomotive sector and consumer durables will begin to be imported.
• ımport of oil and related goods increased to 14.4 billion to 17 billion dollars.
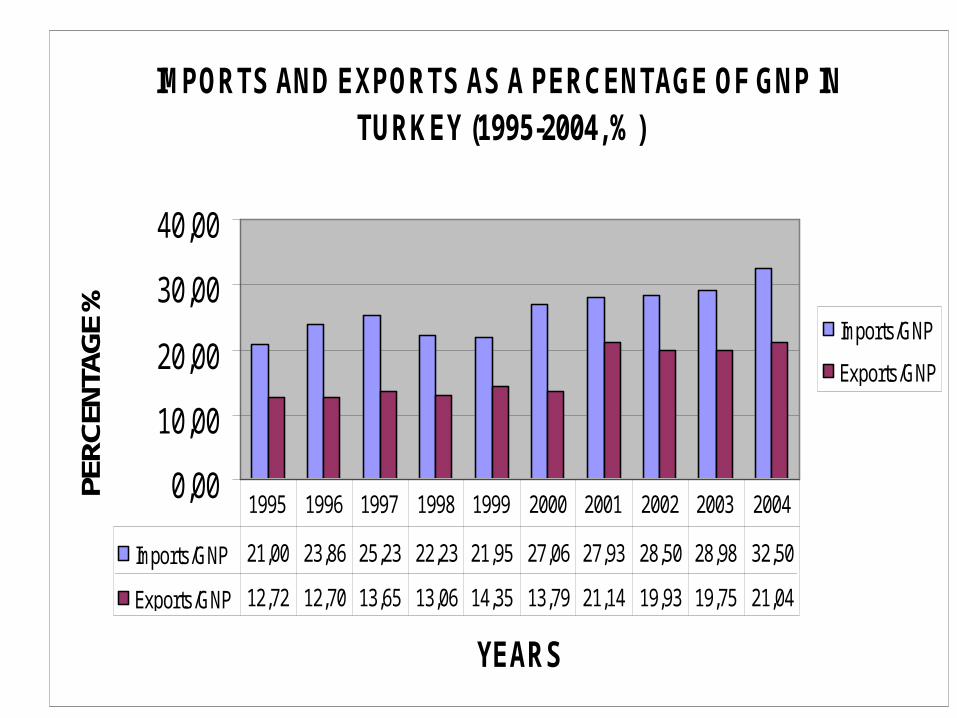
IMPORTS AND EXPORTS AS A PERCENTAGE OF GNP IN TURKEY (1995-2004, %)
0,00
10,00
20,00
30,00
40,00
YEARS
PERC
ENTA
GE %
Imports/GNP
Exports/GNP
Imports/GNP 21,00 23,86 25,23 22,23 21,95 27,06 27,93 28,50 28,98 32,50
Exports/GNP 12,72 12,70 13,65 13,06 14,35 13,79 21,14 19,93 19,75 21,04
1995 1996 1997 1998 1999 2000 2001 2002 2003 2004

the growth of inequality
the poorest 20 % in the world population with the richest population of 20 %.
1960 30 times
1980 45
1989 59
1997 70

The main indicator of growth
is the wage level both
in public and private sectors.

Structural adjustment programs
• Their share of the pie will not grow• Smaller portion will be divided even less equally
among individuals• The share of trade among the poorest countries
will not increase• Transnational companies will maintain their
dominante status in the world market. And, continue transfer resources to the developed world.
• İncome inequality will continue to increase
1- Free market model increases the GNP
as far as state has no restrictions and control
over the market.
How will she success this ?
2- State control is regarded
as one of the causes of
an economic crises and
interruption of social reforms.

public workers wageaverage wage
Reel wage
ındeks of a
year before
%
Percentage of dissolution
1993 4.072.052
1994 6.556.503 78,05 21,95
1995 12.091.709 74,35 25,65
1996 23.463.672 79,97 20,03
1997 50.759.457 93,16 6,84
1998 92.481.635 91,95 8,05
1999 159.429.000 96,13 3,87
2000 218.520.153 85,06 14,94
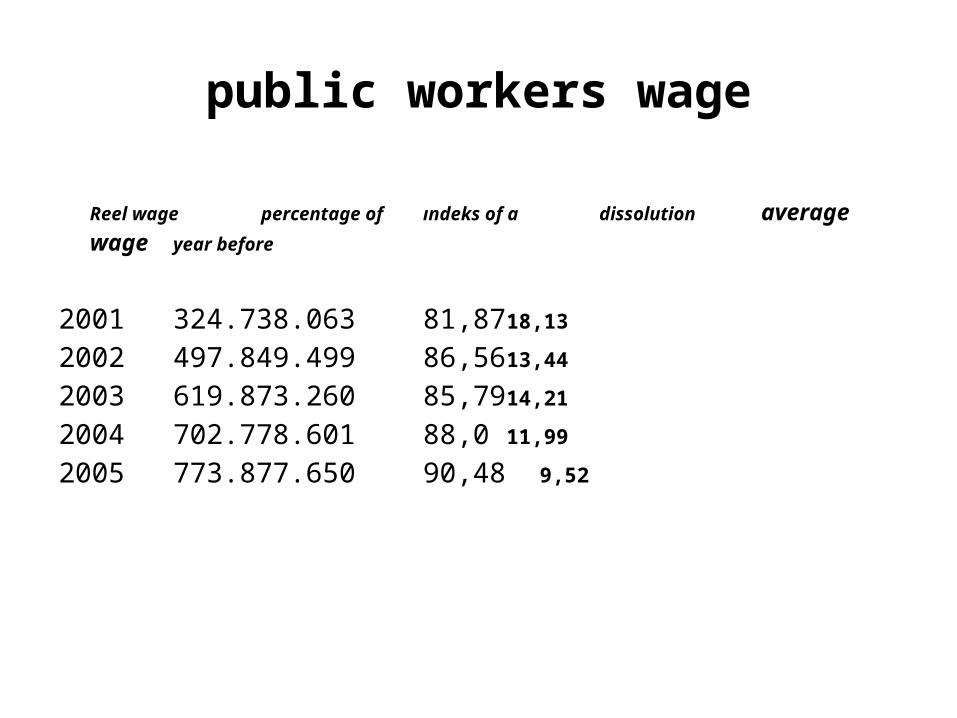
public workers wage
Reel wage percentage
of ındeks of a dissolution
average wage year before
2001 324.738.063 81,87 18,13
2002 497.849.499 86,56 13,44
2003 619.873.260 85,79 14,21
2004 702.778.601 88,0 11,99
2005 773.877.650 90,48 9,52

Personel Expenditures in Total (%)
Personel Harcamalarının Toplam İçindeki Payı (%)
37,23
41,74
34,56
28,70
24,3024,80
23,40
21,30
19,4018,20
20,80
24,20
24,20
25,20
24,40
30,26
38,72
0,00
5,00
10,00
15,00
20,00
25,00
30,00
35,00
40,00
45,00
1989 1991 1993 1995 1997 1999 2001 2003 2005 2007

Personel Expenditures to GNP (%)
Personel Harcamalarının GSYİH Oranı (%)
8 7,7
7,8
7,7
7,36,56
6,37
6,04
0123456789
2000 2001 2002 2003 2004 2005 2006 2007 2008 2009

The percentage of public workers in employment and population
in selected countries Seçilmiş Ülkelerde Kamu Emekçisi Sayılarının İstihdama ve Nüfusa
Oranı
12,315,2
24,321,3
14,6
9,1
14,6 15,4
21,4
15,2
8,15,3 3,9
10,48,2
6,23,2
7,5 6,9 7,83,9
17,5
05
1015202530
Ülkeler
Ora
n
İstihdama Oranı(%) Nüfusa Oranı(%)