Macro and micro econ
25
microeconomics The branch of economics that examines the functioning of individual industries and the behavior of individual decision-making units— that is, business firms and households. MICROECONOMICS AND MACROECONOMICS macroeconomics The branch of economics that examines the economic behavior of aggregates— income, employment, output, and so on—on a national scale. Microeconomics looks at the individual unit—the household, the firm, the industry. It sees and examines the “trees.” Macroeconomics looks at the whole, the aggregate. It sees and analyzes the “forest.”
-
Upload
christian-villanueva -
Category
Technology
-
view
1.769 -
download
0
Transcript of Macro and micro econ
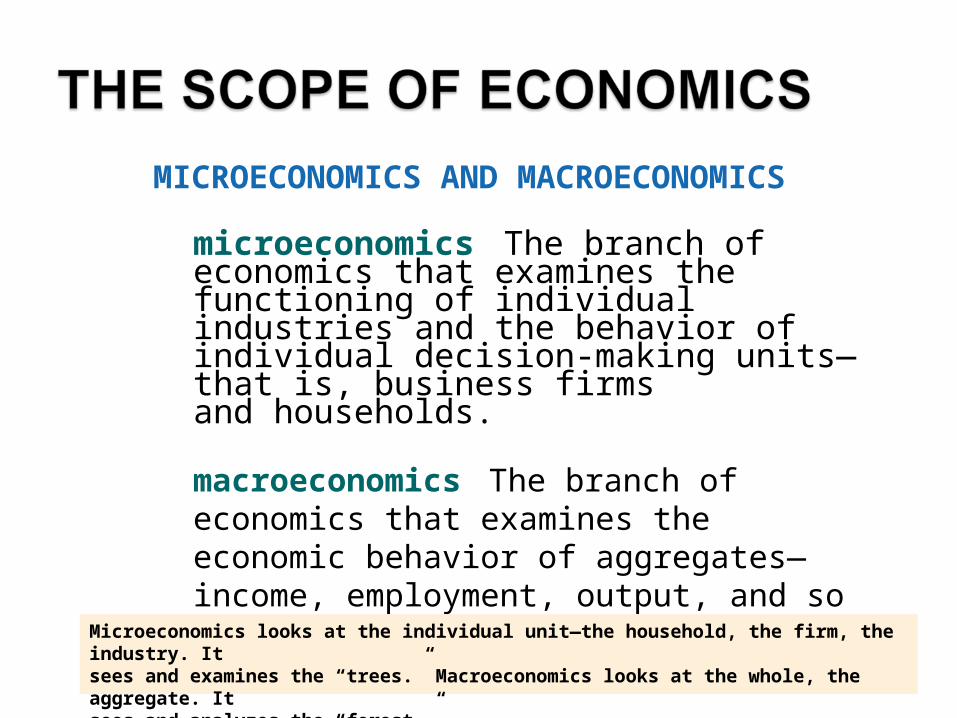
microeconomics The branch of economics that examines the functioning of individual industries and the behavior of individual decision-making units—that is, business firmsand households.
MICROECONOMICS AND MACROECONOMICS
macroeconomics The branch of economics that examines the economic behavior of aggregates—income, employment, output, and so on—on a national scale.
Microeconomics looks at the individual unit—the household, the firm, the industry. Itsees and examines the “trees.” Macroeconomics looks at the whole, the aggregate. Itsees and analyzes the “forest.”
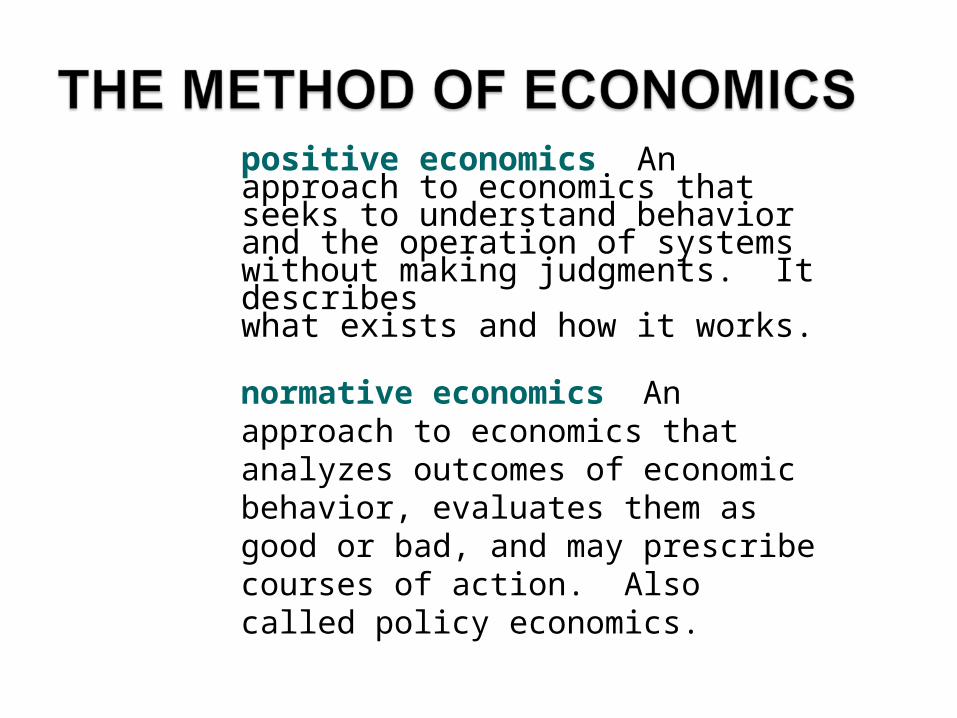
positive economics An approach to economics that seeks to understand behavior and the operation of systems without making judgments. It describeswhat exists and how it works.
normative economics An approach to economics that analyzes outcomes of economic behavior, evaluates them asgood or bad, and may prescribe courses of action. Also called policy economics.
ceteris paribus, or all else equal A device used to analyze the relationship between two variables while the values of other variables are held unchanged.
All Else Equal: Ceteris Paribus
Using the device of ceteris paribus is one part of the process of abstraction. In formulatingeconomic theory, the concept helps us simplify reality to focus on the relationshipsthat interest us.
The most common method of expressing the quantitative relationship between two variables is graphing that relationship on a two-dimensional plane.
Expressing Models in Words, Graphs, and Equations
Cautions and Pitfalls
The Post Hoc Fallacy
post hoc, ergo propter hoc Literally, “after this (in time), therefore because of this.” A common error made in thinkingabout causation: If Event A happens before Event B, it is not necessarily true that A caused B.
ECONOMIC POLICY
Criteria for judging economic outcomes:
1. Efficiency
2. Equity
3. Growth
4. Stability
efficiency In economics, allocative efficiency. An efficienteconomy is one that produces what people want at the least possible cost.
Efficiency
equity Fairness.
Equity
economic growth An increase in the total output of an economy.
Growth
stability A condition in whichnational output is growing steadily, with low inflation and full employment of resources.
Stability
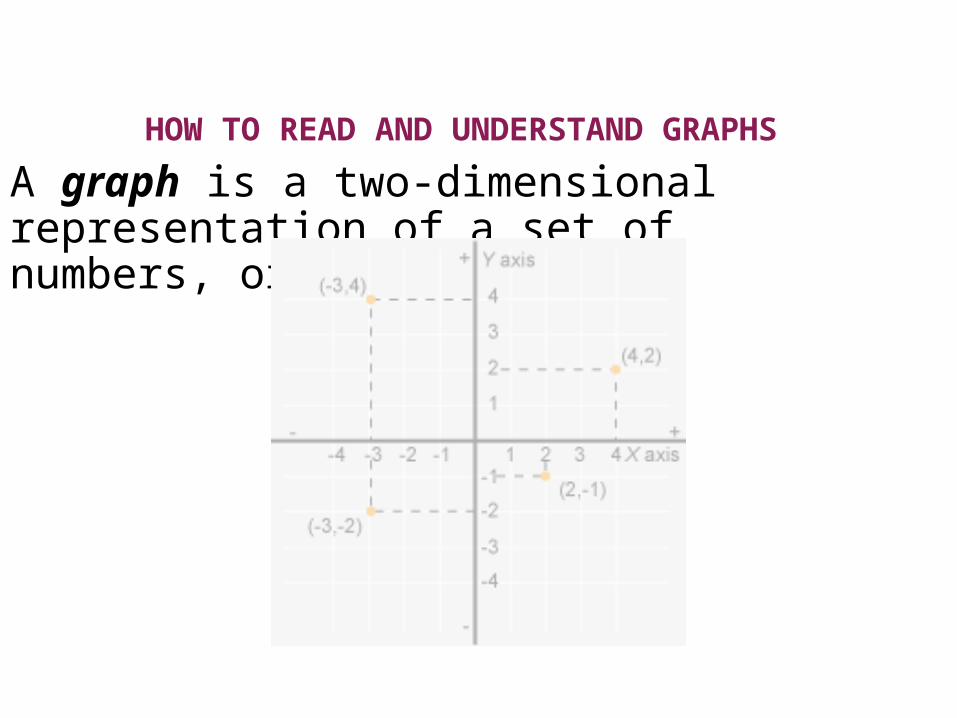
A graph is a two-dimensional representation of a set of numbers, or data.
HOW TO READ AND UNDERSTAND GRAPHS
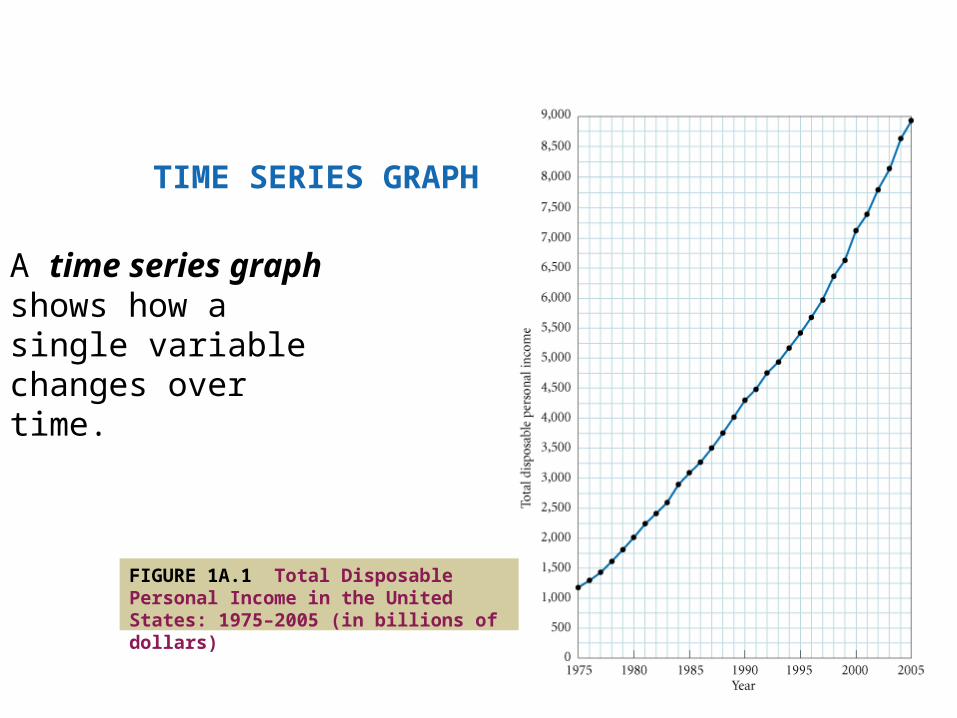
A time series graph shows how a single variable changes over time.
TIME SERIES GRAPH
FIGURE 1A.1 Total Disposable Personal Income in the United States: 1975–2005 (in billions of dollars)
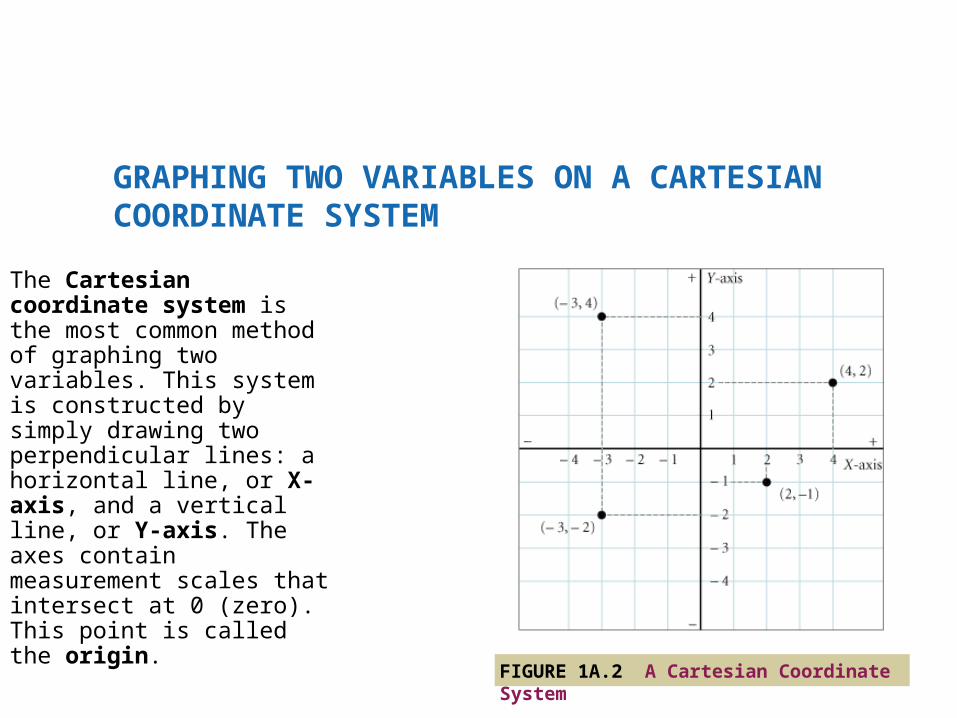
The Cartesian coordinate system is the most common method of graphing two variables. This system is constructed by simply drawing two perpendicular lines: a horizontal line, or X-axis, and a vertical line, or Y-axis. The axes contain measurement scales that intersect at 0 (zero). This point is called the origin.
GRAPHING TWO VARIABLES ON A CARTESIANCOORDINATE SYSTEM
FIGURE 1A.2 A Cartesian Coordinate System
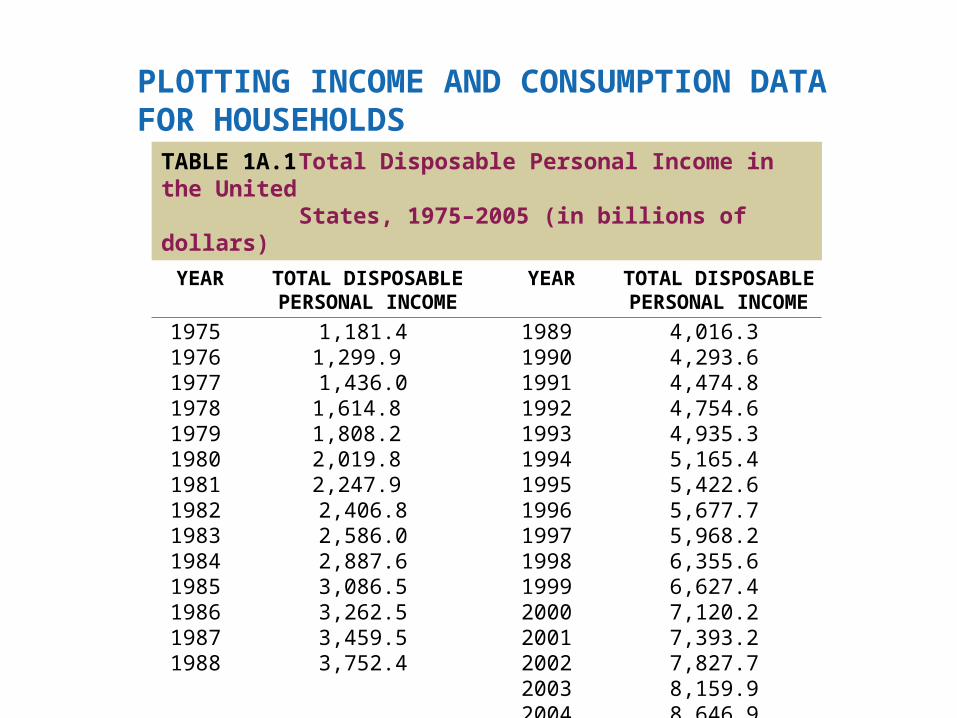
TABLE 1A.1 Total Disposable Personal Income in the UnitedStates, 1975–2005 (in billions of dollars)
YEAR TOTAL DISPOSABLEPERSONAL INCOME
YEAR TOTAL DISPOSABLEPERSONAL INCOME
19751976197719781979198019811982198319841985198619871988
1,181.41,299.9 1,436.01,614.8 1,808.2 2,019.8 2,247.9 2,406.82,586.02,887.63,086.53,262.53,459.53,752.4
19891990199119921993199419951996199719981999200020012002200320042005
4,016.34,293.64,474.84,754.64,935.35,165.45,422.65,677.75,968.26,355.66,627.47,120.27,393.27,827.78,159.98,646.98,945.6
PLOTTING INCOME AND CONSUMPTION DATAFOR HOUSEHOLDS
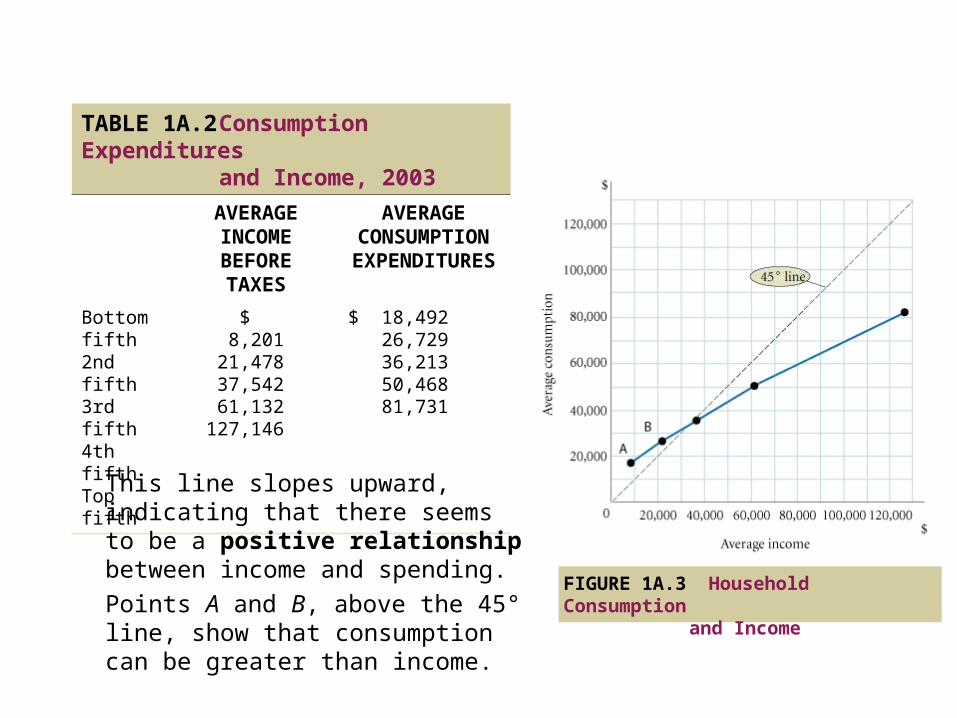
TABLE 1A.2 Consumption Expenditures
and Income, 2003AVERAGEINCOMEBEFORE TAXES
AVERAGECONSUMPTIONEXPENDITURES
Bottom fifth 2nd fifth3rd fifth4th fifthTop fifth
$ 8,20121,47837,54261,132
127,146
$ 18,49226,72936,21350,46881,731
This line slopes upward, indicating that there seems to be a positive relationship between income and spending.Points A and B, above the 45° line, show that consumption can be greater than income.
FIGURE 1A.3 Household Consumptionand Income
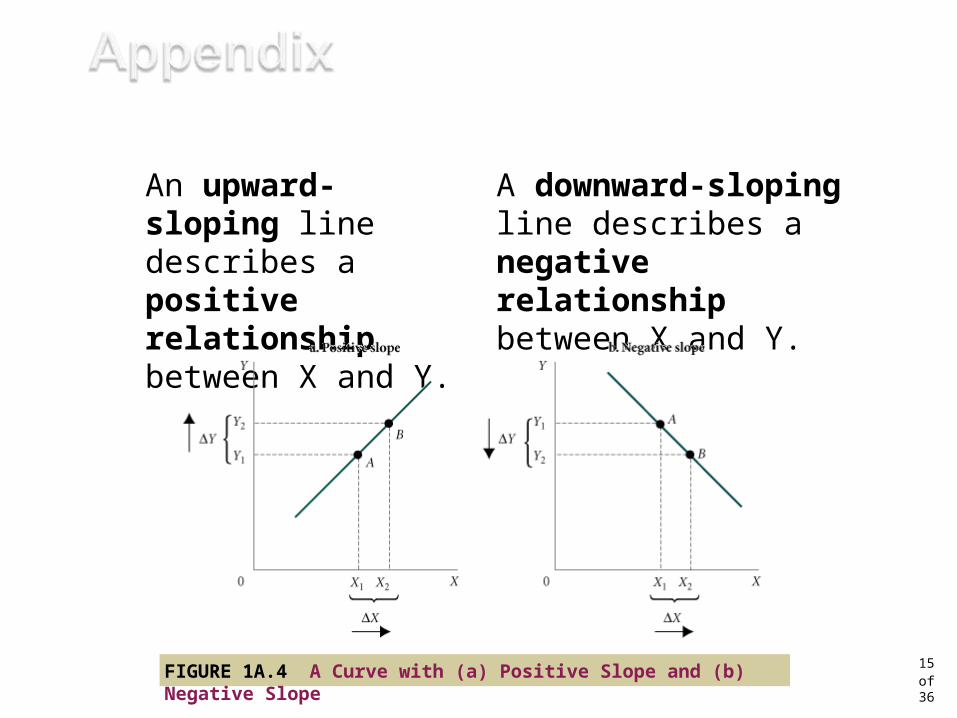
The slope of the line indicates whether the relationship between the variables is positive or negative.
15 of
36
A downward-sloping line describes a negative relationship between X and Y.
An upward-sloping line describes a positive relationship between X and Y.
FIGURE 1A.4 A Curve with (a) Positive Slope and (b) Negative Slope
16 of
36
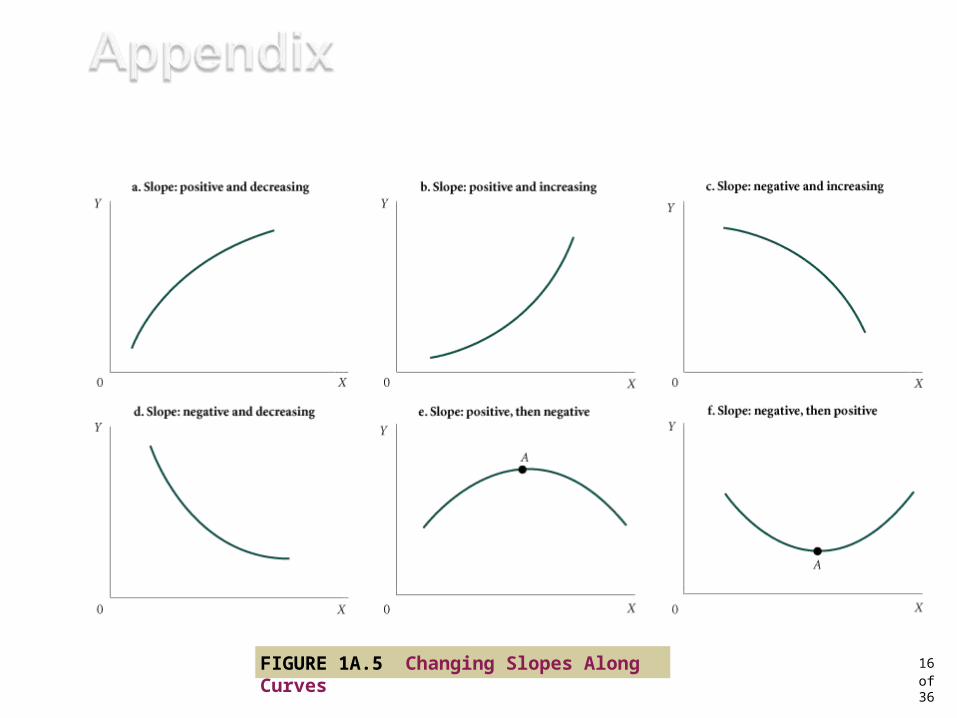
FIGURE 1A.5 Changing Slopes Along Curves
17 of
36
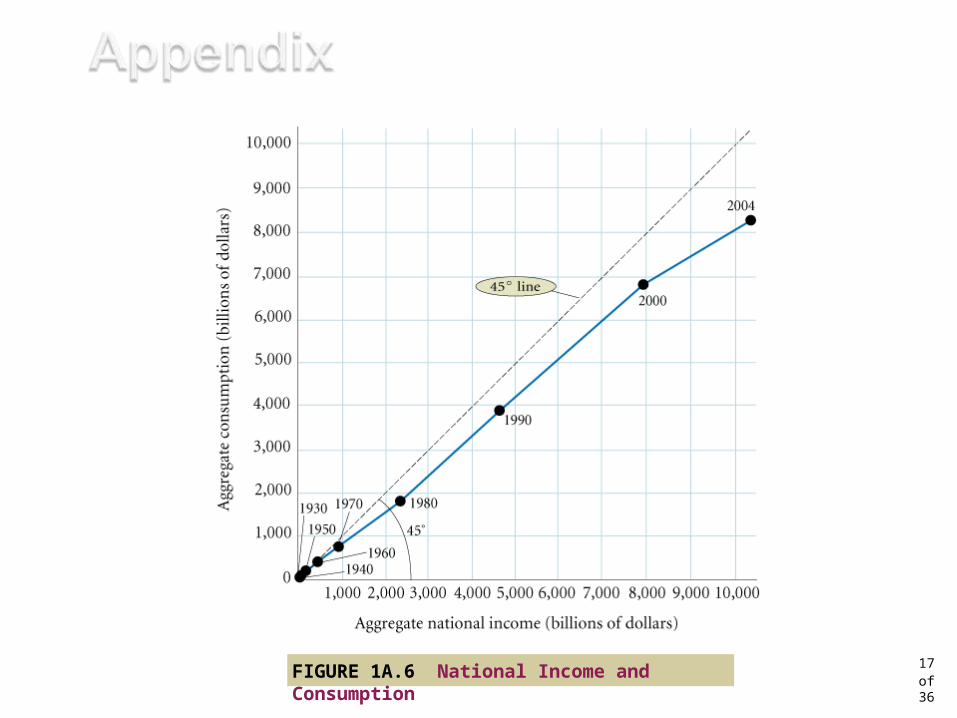
FIGURE 1A.6 National Income and Consumption
The Economic Problem:Scarcity and Choice
THE ECONOMIC PROBLEM:SCARCITY AND CHOICE
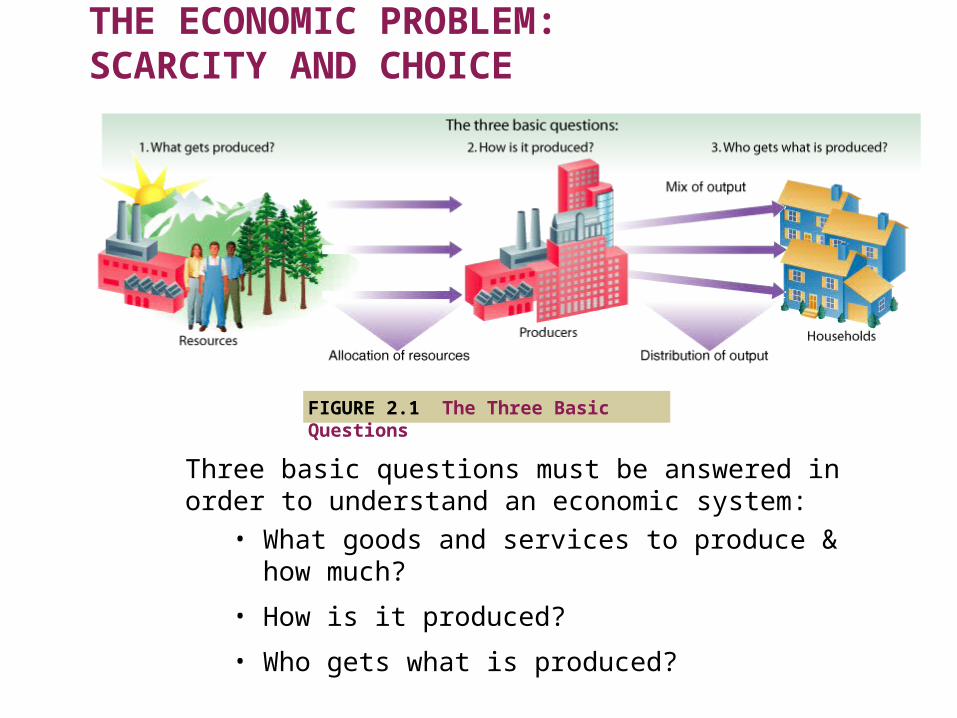
FIGURE 2.1 The Three Basic Questions
Three basic questions must be answered in order to understand an economic system:
• What goods and services to produce & how much?
• How is it produced?
• Who gets what is produced?
capital Things that are themselves produced and that are then used in the production of other goods and services.
THE ECONOMIC PROBLEM:SCARCITY AND CHOICE
factors of production (or factors) The inputs into the process of production. Another word for resources.
production The process that transforms scarce resources into useful goods and services.
THE ECONOMIC PROBLEM:SCARCITY AND CHOICE
inputs or resources Anything provided by nature or previous generations that can be used directly or indirectly to satisfy human wants.
outputs Usable products.
Nearly all the same basic decisions that characterize complex economies must also be made in a simpleeconomy.
SCARCITY, CHOICE, AND OPPORTUNITY COST
SCARCITY AND CHOICE IN A ONE-PERSON ECONOMY

The concepts of constrained choice and scarcity are central to the discipline of economics.
Opportunity Cost
SCARCITY, CHOICE, AND OPPORTUNITY COST
opportunity costs The best alternative that we give up, or forgo, when we make a choice or decision.
Specialization, Exchange, and Comparative Advantage
SCARCITY, CHOICE, AND OPPORTUNITY COST
theory of comparative advantage Ricardo’s theory that specialization and free trade will benefit all trading parties,even those that may be absolutely more efficient producers.
SCARCITY, CHOICE, AND OPPORTUNITY COST
absolute advantage A producer has an absolute advantage over another in the production of a good or service if it can produce that product using fewer resources.
comparative advantage A producer has a comparative advantage over another in the production of a good or service if it can produce that product at alower opportunity cost.


![Welcome [] · 2019-12-10 · 3 Econ Major (42 Credits) Stage 1 - Econ 201 (micro) ↔ Econ 203 (macro) NOTE: Exemption is given if earned 75% or higher in certain CEGEPs. NOTE: Exemption](https://static.fdocuments.us/doc/165x107/5e5e8535df32b52e103b0e09/welcome-2019-12-10-3-econ-major-42-credits-stage-1-econ-201-micro-a.jpg)