“Macro Analysis of Chemical Industry in...
110
DATE :- 8 th Dec. 2014 A Study On “Macro Analysis of Chemical Industry in India” Management Research Project -I Submitted In the partial fulfillment of the Degree of Master of Business Administration Semester-III By Name En. No. Specialization Bhalani Vishal 13044311008 Marketing Bhanushali Hardik 13044311009 Finance Chaudhary Kundan 13044311014 Marketing Desai Jayesh 13044311023 HR Joshi Arpi 13044311029 Finance Nayee Naresh 13044311045 Finance Under the Guidance of: Prof. (Dr.) Mahendra Sharma Prof. & Head, V. M. Patel Institute of Management. & Dr. Harsha Jariwala Dr. Abhishek Parikh Faculty Members V. M. Patel Institute of Management. Submitted To: V. M. Patel Institute of Management, Ganpat University, Kherva.
Transcript of “Macro Analysis of Chemical Industry in...

DATE :- 8th
Dec. 2014
A
Study On
“Macro Analysis of Chemical Industry in India”
Management Research Project -I
Submitted
In the partial fulfillment of the Degree of
Master of Business Administration
Semester-III
By
Name En. No. Specialization
Bhalani Vishal 13044311008 Marketing
Bhanushali Hardik 13044311009 Finance
Chaudhary Kundan 13044311014 Marketing
Desai Jayesh 13044311023 HR
Joshi Arpi 13044311029 Finance
Nayee Naresh 13044311045 Finance
Under the Guidance of:
Prof. (Dr.) Mahendra Sharma
Prof. & Head,
V. M. Patel Institute of Management.
&
Dr. Harsha Jariwala
Dr. Abhishek Parikh
Faculty Members
V. M. Patel Institute of Management.
Submitted To:
V. M. Patel Institute of Management,
Ganpat University,
Kherva.
I page
CERTIFICATE BY THE GUIDE
This is to certify that the contents of this report entitled “A Macro Analysis of Chemical
Industry” by Bhalani Vishal (13044311008), Bhanushali Hardik (13044311009), Desai Jayesh
(13044311025), Joshi Arpi (13044311029), Nayee Naresh (13044311045), Chaudhary Kundan
(13044311014) submitted to V. M. Patel Institute of Management for the Award of Master of
Business Administration (MBA Semester -III) is original research work carried out by them
under my supervision.
This report has not been submitted either partly or fully to any other University or Institute for
award of any degree or diploma.
Prof. (Dr.) Mahendra Sharma,
Professor & Head,
V. M. Patel Institute Of Management,
Ganpat University.
Kherva.
Date : 8th
Dec. 2014
Place : Ganpat Vidyanagar
II page
CANDIDATE’S STATEMENT
We hereby declare that the work incorporated in this report entitled “A Study of Macro
Analysis on Chemical Industry” in partial fulfillment of the requirements for the award of
Master of Business Administration (Semester - III) is the outcome of original study undertaken
by us and it has not been submitted earlier to any other University or Institution for the award of
any Degree or Diploma.
Vishal Bhalani
Hardik Bhanushali
Chaudhary Kundan
Jayesh Desai
Arpi Joshi
Naresh Nayee
Date :- 8th
Dec. 2014
Place :- Ganpat Vidyanagar
III page
PREFACE
One can deny for importance of the practical exposure of the problem for its better understanding
and better grip of coming out with industrially acceptable solution.
Being the management student and performing small practical even is in itself and experience of
responsibility on our head. The project is certainly the best chance to work in the management
field and have practical understanding of management strategic planning and his implementation.
This exposure has really added a supplement and nourishment to our growing tree of
management knowledge-just like the fertilizer does to the plants.
In view of above, this report has been completed as a part of syllabus prescribed for the master of
business administration. This had been made in order to know Chemical industry overview and
its strategic tools and its planning. This will help us to understand how made strategic tools for
particular industry, which factor affected to Chemical industry. We also know the strengths,
weakness, opportunities and threats. This will help to understand financial overview of Chemical
industry. We also know the political, economical, social, technology factor which affected to the
Chemical industry.
IV page
ACKNOWLEDGEMENTS
It is indeed of Great moment to pleasure to express our sense of per found gratitude and
ineptness to all the people who have been instrumental in making our learning a rich experience.
We got the opportunity to do a challenging project in Management Research Project. The project
is the important part of our study and gives us a practical exposure to strategic tools its
implementation and it is almost impossible to do the same without the guidance of people in and
around us.
It gives me immense pleasure to acknowledge strategic tools which has been nice enough to give
our chance to do our report and providing us support throughout our report period and afterword.
We hereby take the pleasure of thanking all who have contributed to the making of this report.
Firstly we would like to thank Dr. M. S. Sharma, professor & Head, V.M. Patel institute of
Management, Ganpat University, Kherva, Mehsana. Who provided the major driving force and
incentive behind this study. He has been always generous with his time, resources, and advices.
We wish to express our sincerest gratitude to Professor Harsha Jariwala and Abhisek Parikh,
Assistant professor, V.M.P.I.M., Ganpat University, Kherva, for their continuous guidance,
support, and encouragement throughout our report work.
We are very grateful to Atish Barot for their support and generosity with their time and
Resources during our work. We are also thankful to Librarian, Friends, and family for their
continuous support to make the report.
Thank you.

V page
Executive Summary
The chemical industry is critical for the economic development of any country, providing
products and enabling technical solutions in virtually all sectors of the economy. Global
chemical production growth slowed down from 4.4% p.a. in 1999-2004 to 3.6% p.a. in 2004-
2009, with global chemical sales in FY10 valued at $3.4 trillion. The industry is increasingly
moving eastwards in line with the shift of its key consumer industries (e.g. automotive,
electronics, etc.) to leverage greater manufacturing competitiveness of emerging Asian
economies and to serve the increasing local demand. This has led to share of Asia in the global
chemical industry increasing from 31% in 1999 to 45% in 2009. With Asia’s growing
contribution to the global chemical industry, India emerges as one of the focus destinations for
chemical companies worldwide. With the current size of approximately $108 billion1, the Indian
chemical industry accounts for ~3% of the global chemical industry. Two distinct scenarios for
the future emerge, based on how effectively the industry leverages its strengths and manages
challenges. In the base case scenario, with current initiatives of industry & government, the
Indian chemical industry could grow at 11% p.a. to reach size of $224 billion by 2017. However,
the industry could aspire to grow much more and its growth potential is limited only by its
aspirations. In such an optimistic scenario, high end–use demand based on increasing per capita
consumption, improved export competitiveness and resultant growth impact for each sub-sector
of the chemical industry could lead to an overall growth rate of over 15% p.a. and a size of $290
billion by 2017 (~6% of global industry). This has a potential for further upside in the future
considering India’s increasing competitiveness in manufacturing.
The draft manufacturing policy recently approved by the Cabinet targets increasing the share
of manufacturing in GDP to at least 25% by 2025 (from current 16%). It aims to create 100
million additional jobs through creation of National Investment and Manufacturing Zones
(NIMZs) as mega investment regions, equipped with world class infrastructure. These zones
will enjoy fast track clearances from the environment ministry and state pollution boards,
special policy regimes, tax concessions and more favorable labour laws. Investments in
manufacturing in the chemical sector are absolutely essential to ensure growth of the Indian
chemical industry.
VI page
Focused growth and planning for the chemical sector would enhance our global
competitiveness further, increase domestic value addition, provide technological depth and
promote sustained economic growth. In order to realize the growth envisaged above and
leverage the India opportunity effectively, the chemical industry would require significant
investments in capacity creation, technology development, access to feedstock and a larger
pool of skilled human resources. This could translate into additional investment of $110-150
billion2. Pro-active action by the Government and nodal agencies of PCPIR zones through
encouraging anchor tenants to establish facilities, making feedstock available for downstream
plants and creating a favorable ecosystem in terms of infrastructure and other facilities will
help them become true chemical manufacturing competence centers and also send a positive
message to the global investing community. The chemical industry’s R&D spends would
need to go up significantly from current levels of less than 0.5% of sales to reach closer to
global benchmarks of 4% of sales (implying R&D spends of ~$12 billion by 20173). On the
human resources front, adequate educational infrastructure would be required to impart
vocational training to develop additional 4.5 to 5 million skilled workers by 20172. Over 15
years, employment potential could range between 8-9 million jobs.
The Indian chemical industry can deliver on an accelerated growth phase, provided a clearly
defined vision along with a strategic roadmap is developed to enable it. If this is not done, we
may see the growing market increasingly being served through manufacturing done outside
India. The various segments of the chemical industry (such as organic chemicals, specialty
chemicals, chlor-alkali, pesticides, colorants and alcohol based chemicals) have their own
unique set of challenges. The industry can grow only if these individual segments overcome
their challenges and move swiftly along the growth path. The performance of these segments
has been studied in the subsequent chapters and targets/ goals have been set for the XIIth five
year plan along with concrete action plans consisting of levers that will help overcome
challenges and drive growth. The industry and government will have to work in tandem to
achieve the ambitious targets set for the chemical industry.
VII page
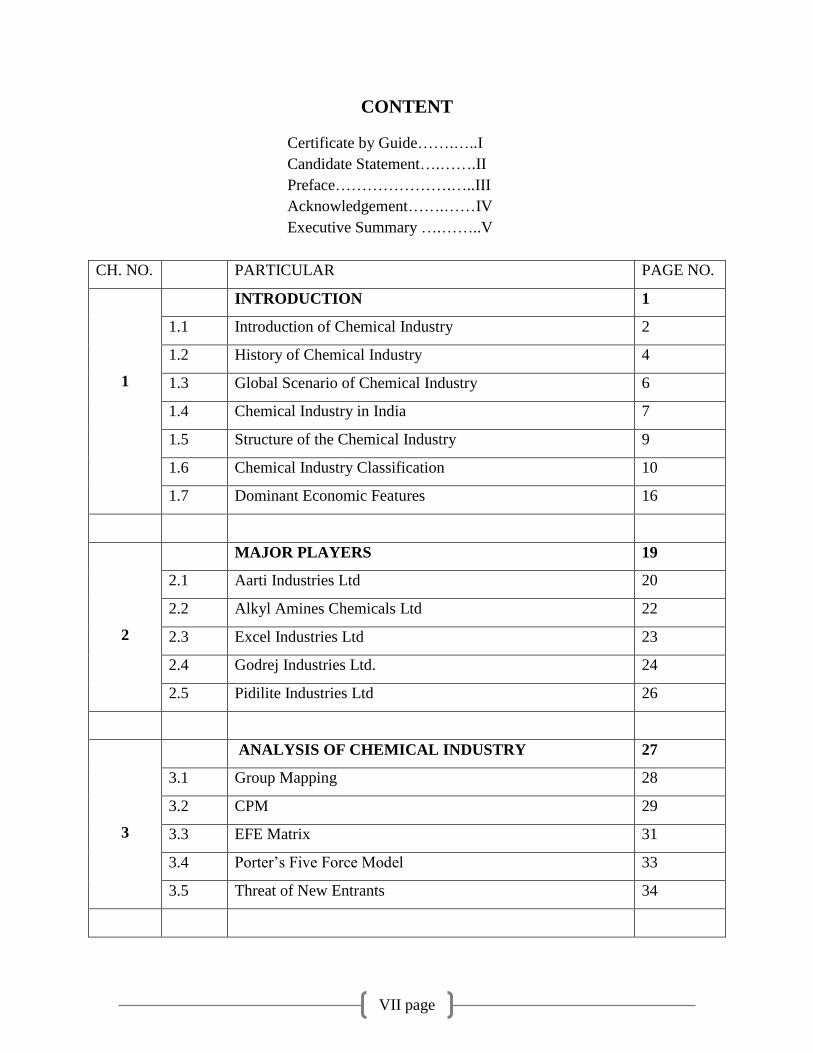
CONTENT
Certificate by Guide…….…..I
Candidate Statement….…….II
Preface………………….…..III
Acknowledgement…….……IV
Executive Summary ….……..V
CH. NO. PARTICULAR PAGE NO.
1
INTRODUCTION 1
1.1 Introduction of Chemical Industry 2
1.2 History of Chemical Industry 4
1.3 Global Scenario of Chemical Industry 6
1.4 Chemical Industry in India 7
1.5 Structure of the Chemical Industry 9
1.6 Chemical Industry Classification 10
1.7 Dominant Economic Features 16
2
MAJOR PLAYERS 19
2.1 Aarti Industries Ltd 20
2.2 Alkyl Amines Chemicals Ltd 22
2.3 Excel Industries Ltd 23
2.4 Godrej Industries Ltd. 24
2.5 Pidilite Industries Ltd 26
3
ANALYSIS OF CHEMICAL INDUSTRY 27
3.1 Group Mapping 28
3.2 CPM 29
3.3 EFE Matrix 31
3.4 Porter’s Five Force Model 33
3.5 Threat of New Entrants 34

VIII page
4
FINANCIAL ANALYSIS 36
4.1 INTRODUCTION OF FINANCIAL ANALYSIS 37
4.2 TREND ANALYSIS 39
4.3 Ratio Analysis 48
5
BUSINESS PLAN 70
5.1 Objectives 72
5.2 Mission 72
5.3 Company Summary 72
5.4 SWOT Analysis 74
5.5 Market Segmentation 77
5.6 Target Market Segment Strategy 79
5.7 Industry Analysis 80
5.8 Sales Strategy 81
5.9 Milestones 82
5.10 Personnel Plan 82
5.11 Break-even Analysis 83
5.12 Projected Profit and Loss 84
5.13 Projected Cash Flow 85
5.14 Projected Balance Sheet 86
5.15 Business Ratios 87
6 CONCLUSION 89
7 BIBLOGRAPHY 100

Page 1
CHAPTER 1
INTRODUCTION

Page 2
1.1 Introduction of Chemical Industry
Chemical industry is an integral component of the Indian economy, which contributes around 7
% of the Indian GDP. It touches our lives in several different ways. Whether it is thermoplastic
furniture we use, or a synthetic garment we wear, or a drug we take – we are inextricably
associated to it.
The industry is integral to the development of agricultural and industrial development in India
and has key linkages with various other downstream, such as automotive, consumer durables,
engineering, food processing and more. Globalization possesses many challenges to the industry,
which has predominantly developed in a protected environment. With World Trade Organization
assuming an increasing role in global economics, there is an inevitable move towards an inter-
linked international economy. However, there have been cases where particular segments of the
industry, such as pharmaceuticals and biotechnology have performed exceedingly well even at
the world level. During 2005-06, the industry contributed 17.6% of the manufacturing sector.
However the country continues to be a net importer in 2005-06, with exports of US$ 5.95 billion
and imports of US$7.92 billion. The worth of Indian chemicals industry during 2005-06 was
US$30.59 billion, which reflected a growth of 10.23% over the previous year and a CAGR of
8.68% during the last 3 years1.
Comprising basic, specialty and knowledge chemicals, the industry caters to a wide range of end-
user industries producing various commodities such aspharmaceuticals, fertilizers, textiles,
plastic, polymers, agrochemicals, and paints and dyes, among others.
Basicchemicals:India has been making remarkable progress as a manufacturer of basic
chemicals - a segment dominated by petrochemicals. With petrochemicals finding use in
almostall user industries, growth prospectsof the segment remain strong. Moreover, with plastic
being widely used in manufacturing a host of commodities,polymer processing is steadily
becoming an organized business. Considering the rising demand for petrochemicals, most
1http://www.india-exports.com/chemical.html (07/09/2014)

Page 3
chemical companies dealing in the commodity are increasing their plant size to ensure greater
production capacity. Notably, India now boasts of having the world’s largest polypropylene
plant.
Specialty chemicals: Heavily dependent on end-user industries, this segment has recorded more
or less uniform growth over the years. During the economic recession, specialty chemicals used
in certain specific export- oriented industries suffered major losses. Post-recession, however,
with a surging demand in key consumer industries such as construction, automobiles and textiles,
among others, specialty chemicals have been able to record pre-downturn growth rate. Coupled
with growth, customized demands from consumers have also moved northward. Now, specialty
chemicals have to be manufactured keeping in mind consumer requirements. The need of the
hour, therefore, is continuous innovation at low costs to maintain a competitive edge.
Knowledge chemicals: This segment remained largely insulated during the global economic
downturn. Comprising mainly agrochemicals and pharmaceuticals, knowledge chemicals hold
bright future prospects. The segment has made prominent headway in the area of R&D and
technological innovation. On the back of a cheap yet intellectual workforce, knowledge-based
chemicals are now manufactured as per global standards. In fact, Indian generics are now in
great demand across the world.

Page 4
1.2 History of Chemical Industry
Indian Chemical Council started out in the year 1938 to promote the interests of the
nascent Chemical Industry. Pioneers of the chemical industry in India such as
Acharya P. C. Ray brought together a group of industrialists including Rajmitra B. D.
Amin, founder of the Alembic Group of Baroda.
What began as a vision, emerging from foresight and aspirations, became the Indian
Chemical Manufacturers Association and was again rechristened the Indian
Chemical Council. It became the representative body of the Rs.500 billion / US $ 16
billion chemical industry in India2
Its members include both Indian companies with a global presence as well as
subsidiaries of multinationals.
Over the years the Indian Chemical Council (earlier as Indian Chemical
Manufacturers Association) went from strength to strength and has evolved into a
movement embodying the goals, concern and achievements of the chemical industry
in India.
In keeping with the dramatically paced growth of the industry in the latter half of this
century, the ICC has striven to give an impetus to the objectives of the industry.
Realizing the power of information, ICC has consciously worked as a bridge for the
many that forms the Indian Chemical Industry.
The chemical industry is one of the earliest domestic industries in India, contributing
considerably to both the industrial as well as economic growth of the country since it achieved
independence in 1947. The industry presently produces around 70,000 commercial products,
which range from toiletries and cosmetics, to plastics and pesticides.
The wide and diverse range of products can be broken down into several categories, which
include Inorganic and organic (commodity) chemicals, plastics and petrochemicals, drugs and
2http://www.india-exports.com/chemical.html (07/09/2014)
Page 5
pharmaceuticals, dyes and pigments, pesticides and agrochemicals, fine and specialty chemicals,
and fertilizers.
With primary focus on modernization, the Govt. of India has taken an active role in promoting
the growth and development of Indian domestic chemical industry. The Department of
Chemicals & Petro-Chemicals that has been part of the Ministry of Chemicals and Fertilizers
since 1991 is responsible for making policy making, planning, development, and regulation of
the industry. In the private sector, several organizations, including the Indian Chemical
Manufacturers Association, the Chemicals and Petrochemicals Manufacturers Association, and
the Pesticides Manufacturers and Formulators Association of India, all work with the prime
objective of promoting the growth of industry and the export of Indian chemicals. For example,
the Indian Chemical Manufacturers Association represents a large number of Indian companies,
which produce and export a variety of chemicals, which have legitimate commercial
applications, but also can be used as precursors and intermediates for production of chemical
weapons.
Page 6
1.3 Global Scenario of Chemical Industry
Global chemical production is growing and the growth is contributed by the chemical industry of
developing countries. Growth in demand for chemicals in developing countries is high leading to
substantial cross-border investment in the chemical sector. Global sales of chemicals in the year
2005 were estimated to be around US$ 1.75 trillion.
USA is the single largest country with a share of 22% (US$ 380 billion) in world chemical sales,
followed by Japan (10% - US$ 194 billion), China (9% - US$ 163 billion), Germany (7% - US$
122 billion) and France (5% - US$ 90 billion). In terms of regions, Asia-Pacific tops the list with
a share of 35% in global sales followed by Europe (34%), NAFTA (25%) and Latin America
(4%). World export of chemicals is estimated to be US$ 832 billion in 2005. The share of
chemicals in world merchandise trade and global trade of manufactures is estimated to be 11%
and 15% respectively, in 2005.
The growth in world chemicals trade has averaged out to around 12% during the period 2000-
2005. Leading chemical exporters are Germany (11% - US$ 95 billion), USA (11% - US$ 94
billion), France (6% - US$ 51 billion), Japan (6% - US$ 49 billion), and China (4% - US$ 32
billion). The joint framework agreement for tariff harmonization in the Uruguay Round
(Chemical Tariff Harmonization Agreement), has led to a substantial reduction in tariffs in the
signatory countries. However, in many countries reduction in tariff hasbeen substituted by
increase in nontariff barriers. Dumping of chemicals and anti-dumping actions by countries has
become part of the game plan of many firms / countries.
Globalizationof chemical industry has led to national markets being supplied from an increasing
number of locations, while individual companies have increased the geographic scope of their
operations. Chemical companies in the world are now merging their business processes,
including their supply chain, to reduce risks and to create sustainable competitive advantage. The
global chemical industry is continuously working towards reduction of environmental impactof
its activities. The industry is committed to contribute to the sustainable development of the
society as a whole, through its ‘Responsible Care Initiative’, and has developed systems for
improving the health, safety and environmental performance of its products and processes.

Page 7
1.4 Chemical Industry in India
Chemical industry is one of the oldest industries in India. It is estimated that the size of Indian
chemical industry is around US$ 30 billion. Volume of production in chemical industry positions
India as third largest producer in Asia (next to China and Japan), and twelfth largest in the world.
The industry, comprising both smallscale and large units (including MNCs) produces several
thousands of products and bi-products, ranging from plastics and petro-chemicals to cosmetics
and toiletries. A significant share (around one-third) of production by chemical industry is
consumed by itself. The chemical industry accounts for about 13% share in the manufacturing
output and around 5% in total exports of the country.
The chemical industry contributes around 20% of national revenue by way of various taxes and
levies. The chemical industry produced around 8 million metric tonnes each of basic chemicals
and basic petrochemicals, and around 10 million metric tonnes of petrochemical intermediaries
in 2005-06.
Gujarat is the major contributor to the basic chemical as well as petrochemical production with
54% and 59% share in all India production, respectively. Other major states producing basic
chemicals include Maharashtra (9%), Tamil Nadu andUttar Pradesh (6% each). Other major
states producing petrochemicals include Maharashtra (18%), West Bengal (12%), Uttar Pradesh
(4%), and Tamil Nadu (3%).
India’s export of basic chemicals amounted to over US$ 7 billion in 2005-06. India exported
US$ 4.85 billion worth of organic chemicals, US$ 775 million worth of inorganic chemicals,
US$ 847 million worth of tanning and coloring materials, and US$ 649 million worth of
pesticides, in the year 2005-06. In addition, India exported petrochemicals valued nearly US$ 4
billion. India is also an importer of basic chemicals and the import value amounted to over US$ 8
billion in 2005-06.
Page 8
The composition of India’s chemical imports includes organic chemicals (63%), inorganic
chemicals (28%), dyes (6%) and pesticides (3%). China, USA and Saudi Arabia are the leading
source countries for India’s chemical imports. In addition, India imported petrochemicals valued
over US$ 2 billion.
The Indian chemical industry has been receiving significant investment intentions, including
foreign direct investment (FDI). Since August 1991, and till November 2006, chemical industry
has received investment proposals worth Rs.274486 cores, a share of 11.3% in total investment
proposals received during this period.
FDI, which is very essential for modern manufacturing of chemicals, has also been flowing into
the chemical sector significantly. During the period August 1991 to October 2006, FDI inflows
into the chemicals sector amounted to US$ 2.2 billion, a share of around6% in total FDI inflows
into the country.

Page 9
1.5 Structure of the Chemical Industry
Ownership pattern of companies include: proprietary firms 30%, partnership firms 25%,
private limited companies 34% and public limited companies 11%.
The total sample is from 15 states; the highest coming from the Western region. The
companies in the West are entirely from Gujarat and Maharashtra and account for 74.5%
of the total sample. Around 11.4% companies are located in the North, 8.5% in the
South and 5.5% in the East.
Around 89% of the companies in the sample are small scale enterprises with investments
less than Rs 50 mn in plant and machinery. The rest are medium sized enterprises.
Close to 77% of the companies in the sample operate in a single segment. The Organic
and Inorganic manufacturers constitute 65% of the sample, organic companies at 37%
and inorganic 28%. The next largest segment is Dyes and Dyestuff accounting for 22%.
Representation of Alkali and Pesticide companies is 1.2% each.
Depicting the long-established nature of the industry, around 49% of the companies in
the sample were established prior to 1990. Another 42% began operations during the
1990s, while only 9% began operations post-2000.
In terms of IT penetration, around 39% of the companies have a website3
3https://sites.google.com/site/chemicalindustry001/the-characteristics-of-fine-chemicals
Proprietary firms
30%
Partnership firms
25%
Private limited
34%
Public limited
11%
Chemical Industry
Page 10
1.6 Chemical Industry Classification
The chemical industry Classified into 4 key segments, based on a detailed analysis of various
industry classifications followed by several domestic & international bodies. The key segments
are:
1. Chemical sector: It includes basic organic chemicals (methanol, acetic acid etc.), basic
inorganic chemicals (caustic soda, chlor alkali etc.) along with the specialty chemicals
(colorants, water treatment etc.) and agrochemicals (pesticides etc.).
2. Petrochemical sector: Petrochemicals includes polymers, synthetic fibers, surfactants and
elastomers.
3. Fertilizers: Include all types of N,P& K based fertilizers like Urea, DAP etc.
4. Pharmaceuticals: It includes formulations, APIs, biotechnology etc.
(However pharmaceutical section, Fertilizers, And Petrochemical sectors are not a part of this
report) Indian chemical sector is the largest followed by fertilizers and then Petrochemicals. In
terms of growth also, chemical sector is fastest growing closely followed by petrochemicals.
Chemical sector high growth estimate is based on high growth potential of specialty chemicals.
1.6.1 Basic organic chemicals
Introduction
Organic chemicals are a significant part of Indian chemicals industry. Availability of natural gas
for use as feedstock is a critical part of the entire production process. Formaldehyde and acetic
acid are important methanol derivatives and are used in numerous industrial applications. Phenol
is an aromatic compound and derived from Cumene, a benzene and propylene derivative.
Global production of organic chemicals was around 400 million tonnes during FY11. Major
producers of organic chemicals are USA, Germany, U.K, Japan, China and India. Few Latin
Page 11
American countries, for example Brazil and Chile are increasing their presence in global organic
chemicals market.
Six major chemicals produced in India are Methanol, Aniline, Alkyle Amines and its derivatives
like Formaldehyde, Acetic Acid andPhenol,contributing to nearly 2/3rd of Indian basic organic
chemical industry. The balance 1/3rd of the organic chemical consumption in the country is
accounted for by other wide variety of chemicals.Production of major organic chemicals has
shown a significant decline due to large volume imports taking place from countries like China,
resulting in low utilization rates of ~ 60%.
The demand for organic chemicals in India has been increasing at nearly 6.5% during this period
and has reached the level of 2.8 million tonnes. The domestic supply has however grown at a
slower pace resulting in gradual widening of demand supply gap which was primarily bridged
through imports. Domestic production declined at ~6% per annum and imports grew at a rate of
17-19% between FY06 and FY11.
The key segments of the industry are methanol, formaldehyde, acetic acid, phenol, ethyl acetate
and acetic anhydride.
KEY SEGMENTS
i) Methanol
Methanol, a very versatile chemical is primarily produced from natural gas or naphtha.Demand
for methanol has increased at a CAGR of 8% from 0.87 mmtpa in FY06 to 1.26 mmtpa in FY11.
The domestic production of methanol is not sufficient to meet thedemand of methanol in India.
As a result, in FY11, the net import of methanol was 0.92 mmtpa i.e. ~2.5 times the domestic
production of 0.38 mmtpa. Import of methanol has increased at a high CAGR of 18% from 0.4
mmtpa in FY06 to 0.92 mmtpa in FY11.
The two main end-user industries of methanol are chemicals and energy. In the chemicals
industry, methanol is used mainly to manufacture formaldehyde, acetic acid, di-methyl
terephthalate (DMT) and some solvents.
Page 12
In the energy industry, methanol goes into the manufacture of methyl tertiary butyl ether
(MTBE), tertiary amyl methyl ether (TAME), di-methyl ether (DME) and bio-diesel among
other chemicals. Methanol is also used for blending with petrol.Over the years the usage pattern
of methanol has remained same. Formaldehyde accounts for the largest share of methanol usage
due to demand of formaldehyde from plastic and paints industries.
Domestic methanol production has increased by 13% in FY11, reflecting improvement in
utilization rates by players such as Deepak Fertilizers& Petrochemicals Corporation Ltd (Deepak
Fertilizers), Gujarat Narmada Valley Fertilizers Company Ltd (GNVFC) and Rashtriya
Chemicals & Fertilizers Ltd (RCF).
ii) Acetic Acid
Acetic Acid is the main alcohol based chemical and is primarily used in the production of Vinyl
Acetate Monomer (VAM), Purified Terephthalic Acid (PTA), Acetic Anhydride and Acetate
Esters.Demand for acetic acid has grown at a CAGR of 13% from 0.33 million tons in FY06 to
0.6 million tons in FY11. The demand growth has happened mainly due to increase usage by
manufacturers of PTA which is the basic raw material for polyester & fiber and organic esters
such as RIL and Vinyl Chemicals.
Most of the demand was met through domestic production earlier. However, due to oversupply
of acetic acid in global markets and depressed prices, imports of acetic acid have grown leading
to reduced plant capacity utilization.
Acetic acid is manufactured in India through two routes: the methanol route and the ethyl alcohol
(from molasses) route. Alcohol route in Indian context is gradually becoming unviable due to
high prices and limited availability of this feedstock. At present bulk of acetic acid is imported
with domestic production accounting for less than 30% of demand.
Page 13
iii) Formaldehyde
Unlike methanol, production of its derivative formaldehyde in India is sufficient to meet the
domestic demand. The production of formaldehyde has increased, at a similar pace as has its
demand, at a CAGR of 3% from 0.25 mmtpa in FY06 to 0.30 mmtpa in FY11.Major
formaldehyde producing companies in India are Kanoria Chemicals, Hindustan Organic, Rock
Hard and Asian Paints. The first two companies account for 44% of formaldehyde production in
India. Asian Paints produces formaldehyde for captive consumption.
iv) Phenol
Phenol is a significant type of organic chemical with numerous applications as mentioned in the
table below. Its demand is closely linked to end user industries like the construction and
automobile industries.
More than 70% of demand of phenol is met through imports with no fresh supply addition in last
few years. There are only two manufacturers - Hindustan Organics and S I Group with capacity
of 40 Kilo tonnes per annum each in FY11. As the consumption has grown from 0.15 mmtpa in
FY06 to 0.18 mmtpa in FY11, the imports has grown at a higher CAGR of 10% to meet the
rising demand.
Page 14
1.6.2 Key Challenges of Organic Chemical Industry:
1. Lack of cheaper raw material availability: Feedstock (naphtha and natural gas)and power
are critical inputs for organic chemicals industry. Costs of these raw materials are high in India
compared to countries like China, Middle East and other South East Asian countries such as
Thailand and Indonesia. Given the poor infrastructure with lack of adequate facilities at ports and
railway terminals and poor pipeline connectivity, domestic manufacturers will continue facing
difficulty in procuring raw materials at a cost competitive with the global peers.
2. No domestic price discovery: Domestic prices of organic chemicals are highly correlated
with international prices. Given the small scale of domestic operations, local manufacturers are
more influenced by global demand and supply forces.
3. Large global capacity additions: Apart from the current oversupply in global markets, there
is another cause of concern for domestic manufacturers, with further large capacity additions
happening in global markets. For example, globally, methanol industry is expected to witness
excess capacity in the future due to a spate of capacity additions in gas rich countries such as
Middle East and Russia.
4. Low capacity utilization: Due to oversupply in global markets, prices of major organic
chemicals have taken a steep decline, thereby forcing the domestic companies to underutilize
their plants operating levels. The average capacity utilization has fallen from > 90% in FY04 to
~60% in FY11.
Page 15
1.6.3 Key Opportunities of Organic Chemical Industry:
1. Consolidation: Sincemost of the Indian manufacturers operate on a small scale compared to
global peers, there is a room for consolidation in Indian organic chemicals industry. Domestic
players can take advantage of economies of scale arising from consolidation and become more
competitive thereby preventing cheaper global imports.
2. Improved feedstock supply: Domestic organic chemicals players don't have the advantages
of backward integration and hence, they lack pricing flexibility. However, given the new finds of
natural gas reserves in the country, domestic manufacturers will be able to get supply of
feedstock at stable prices.
3. Wider product portfolio: Commodity chemicals companies can improve their product
portfolio by adding specialty chemicals such as polymers additives, water treatment chemicals,
lubricating additives, etc. This will help in improving their margins but requires significant R&D
efforts.
4. Forward integration: Petrochemical companies producing benzene and propylene can look
for forward integration opportunity given the demand-supply deficit in phenol market. Similarly,
an opportunity exists for companies with better access to natural gas supply to venture into the
methanol market facing continuous supply deficit.
5. Outbound approach: Even successful companies from west are shifting their base to
resource rich nations like Saudi Arabia, Qatar, Russia, etc. Indian organic chemical companies
may also explore opportunities outside the country either through greenfield or brownfield
projects.

Page 16
1.7 Dominant Economic Features
1.7.1 Market size and growth:
Chemical industry has a significant contribution in the overall economy of the country.
The contribution of the chemical industry in the overall GDP of the country financial year
2013-14 is 21%4. The contribution of chemical industry in total export of the country is
13-14% of the financial year 2013-14. While in a total import is 8-9%. The worth of
Indian chemicals industry during 2005-06 was US$30.59 billion, which reflected a
growth of 10.23% over the previous year and a CAGR of 8.68% during the last 3
years5.The Indian advantage lies in the manufacturing of basic chemicals that are also
known as commodity chemicals that account for about 57% of the total domestic
chemical sector6.
1.7.2 Pace of technological change:
Indian chemical industry should strive for continually improving its production processes and
products by investing resources in technology development. Technological development may be
achieved by the chemical industry at two levels. In the bulk products segment, the chemical
industry should undertake process innovation with the objective of reduction in cost of
production. In addition, the industry needs to invest in technological resources that would lead to
specialized product development.
Liberalization process has already increased the possibility of intra-firm transfer of technology
and management practices in the form of consolidation within the economy as also from
developed countries through foreign direct investment.
4http://www.process-worldwide.com/management/markets_industries/articles/304269/
5http://www.india-exports.com/chemical.html
6https://www.dnb.co.in/IndianTelecomIndustry/Chemical%20overview.asp
Page 17
1.7.3 Product Innovation
Based on the observations that new intervention policies and strategies should find its way to
channel societal concerns and environmental externalities into the current closed system of
process innovation on basic chemicals. Some technology-oriented policy initiatives (e.g. EU
directives on integrated pollution and prevention control, best available technologies and
environmental impact assessment) can integrate with other market-oriented initiatives (e.g. EU
directives one missions trading, EU's official technology trading and information service
CORDIS,Innovation Relay Centers for trading technologies across Europe, environmental
funds). Such integration could help set the direct of process innovation to take environmental
externalities into account for innovation in the chemical industry--at least at an explicit level as
chemical policies on health and safety issues. Further research is need to study how to establish a
more open market for technologies where environmental friendly processes compete with
existing processes based on both economic and environmental performances7.
Conclusion:
Use of advanced technology, strong research capabilities, backward and forward linkages and
Development of domestic capacity to reduce dependence on imported raw materials is key
success factors for Indian chemical industry. In addition, safety, health and environment
protection issues are becoming important challenges for the Indian chemical industry. Indian
Manufacturers are addressing such challenges in an organized way. Indian chemical industry has
major strengths in basic research facilities available with CSIR laboratories such as National
Chemical Laboratory, Indian Institute of Chemical Technology, as also corporate R&D centers.
This ensures that development of process knowhow, plant process design, detailed engineering
design, commissioning assistance and even consultancy for re-engineering are available at low
cost. The need for globalization has made many Indian chemical companies enter into strategic
alliances or merge operations to achieve economies of scale. Foreign Collaboration is also
7 Tao Ren, 2005. An Overview of Innovation in the chemical industry: process innovation and product innovation,
Department of science technology and society, Netherlands, p-10
Page 18
bringing solutions for clean technology, process consultancy, and feedstock Linkages, R&D,
waste management, safe manufacture and environmental protection. In addition, Indian chemical
companies are attempting to achieve global standards by improving productivity through various
measures such as better raw material utilization, bi-product reduction and use, energy reduction
and conservation, effluent management, water management, up gradation of plant and
equipment, skill development.

Page 19
CHAPTER 2
MAJOR PLAYERS

Page 20
2.1 Aarti Industries Ltd
Aarti has started its operations in the year 1975 in the name of alchemie labs in a small of
way with a single product namely Dimentylsulphate.
Today Aarti is One of the leading supplier to global manufacturers of Dyes, Pigments,
Agrochemicals, Pharmaceuticals & rubber chemicals. Aarti has acquired world-class
expertise in the development & manufacture of these chemicals. Aarti is amongst the
largest producers of Benzene based basic and intermediate chemicals in India. It has
corporate office in Mumbai & representatives in U.S.A & Europe.
Aarti has 16 manufacturing units spread across Gujarat & Maharashtra and a
strong Research & Development with sophisticated instruments & pool of
scientists.
Aarti has strong Research & Development center with sophisticated instruments
& pool of scientists.
Aarti has customers spread across the globe in 60 countries with major presence
in USA, Europe, Japan & India.
AARTI has attained a group turnover of US $ 5151 million in the year April 2009 – March
2010.
AARTI group is strategically placed to exploit growth opportunities in the Chemical
Industry. In view of its technical expertise and broad base satisfied clientele in India and
abroad, AARTI is looking for global partners and strategic alliances in areas of mutual
interest viz.
1http://www.aartigroup.com/CompanyProfile/Mission_Vision.aspx
Page 21
Development of International markets for AARTI's products.
Toll manufacturing.
Transfer of Technology / Technical know-how.
Mission & Vision
Vision
To emerge as Key source to leading Global consumers of Specialty
Chemicals and Intermediates for Dye stuff, Agro, polymers, Pharma&
Surfactants.
Mission
To constantly strive to set up and maintain global size plant facilities.
To become customer-driven company by providing customized solutions
and service to meet changing customer requirements.
To maintain consistent quality and timely delivery at competitive prices.
To use best cost effective manufacturing methods supported by proven,
eco-friendly and safe technologies.
Commitment to growth by Research & new product developemtn&
progressive increase in Exports.
Continuous focus on people to encourage and nurture winning
organizational culture.
To meet the challenges of competition by dynamic management drive.
Page 22
2.2 Alkyl Amines Chemicals Ltd
Alkyl Amines Chemicals Ltd (AACL) is a public Limited Listed Company promoted in
1979. The Company is in the business of manufacturing and marketing various aliphatic
amines, amine derivatives and other specialty chemicals for the last 30 years.
It has two manufacturing sites with 9 production plants and related utilities at Patalganga
and Kurkumbh in Maharashtra. The company has an R&D center at Hadapsar, Pune.
Over the last decade, the company had added various new product processes which were
developed in the R&D to expand its product range through inhouse technology.
The first plant was commissioned in 1982 at Patalganga to make ethylamines with
technology from Leonard Process Company, USA. Subsequently, the capacity at the site
was expanded to manufacture other amines with technical know-how of Acid Amines
Technologies,USA, and now hosts 2 multipurpose amines plants with a capacity
exceeding 25000 MT/annum. In 1995 it started on its Kurkumbh complex where various
amines and amine derivatives are currently being manufactured in 7 production plants
with a capacity exceeding 30000 MT/annum. In the last decade, the company has added
various facilities to manufacture a wide range of specialty chemicals with its inhouse
developed technologies.
AACL is a global supplier of amines and amine-based chemicals to the pharmaceutical,
agrochemical, rubber chemical and water treatment industries, among others. It has
established a leading position in the domestic market and presence in the international
market with a reputation for reliable service and quality products with annual sales of
Rupees 400 Crores2.
2http://www.alkylamines.com/corporate/index.html

Page 23
2.3 Excel Industries Ltd
We are Excel Industries Ltd., one of India’s first domestic chemical manufacturers. We
are pioneers in indigenous chemical technology and sustainable waste management.
Innovation has always been a key driving force at Excel. Since our inception in 1941, we
have achieved hundreds of chemical process breakthroughs, steadily contributing to the
enhancement of technology knowhow in the nation.
As a corporation, we are committed to growth that is sensitive to the needs of the
environment, community and nation. Taking proactive steps in helping curb urban
pollution we have ventured into the Environmental and Biotechnology sectors where we
have developed novel solutions for Waste Management.
Today, we are all set to embark on a new phase of meaningful growth. We are one of the
India premier manufacturers of Specialty Polymer Additives and high quality Veterinary
APIs. We are also all set to apply our chemical process knowhow in the Pharmaceutical
Intermediates industry while continuing our leadership position in agro chemical
intermediates and phosphorous derivatives.
Even as we change, we take forward with us our core values of “People, Planet, Profit”
and seek to balance the needs of each of these pillars. The future beckons and we look
forward with excitement to developing innovations and breakthrough ideas.

Page 24
2.4 Godrej Industries Ltd.
Godrej industries a part of Godrej group, is India's leading manufacturer of oleochemicals
and makes more than a hundred chemicals for use in over two dozen industries. Godrej
Group was established in year 1897, it entered in security equipment & soaps segment
and is now a $1.875 billion conglomerate.
Godrej group is engaged in chemicals, vegoils& Real Estate. It delivers international
quality product, exports its products to North America, South America, Asia, Europe,
Australia, and Africa. The company was earlier called Godrej Soaps, then it got de-
merged with godrej consumer products & residual and became part of Godrej
industries.The company has its manufacturing plant located at facility at Vikhroli,
Mumbai, and Maharashtra .It has the capabilities of Fat splitting, Fatty Acid distillation,
Fatty Acid fractional distillation, Hydrogenation of Fatty Acids, Sweet water evaporation,
Glycerin distillation and Alfa Olefin Sulphonation. It also has a Co- generation plant
which satisfies partially its requirements of power and steam.
The greatest advantage Godrej Industries (Chemicals Division) enjoys, thanks to the
Vikhroli complex, is a high level of operational flexibility to meet customers'
requirements with a short lead time. The facility is well equipped to deliver the products
of superior Quality, in time and at competitive price.
The company also has a modern, integrated manufacturing facility at Valia in the Indian
state of Gujarat. This faculty uses vegetable oils as the raw material to manufacture Fatty
Acids, Glycerin, Fatty Alcohols & Surfactants such as Sodium Lauryl Sulphate, Sodium
Lauryl Ether Sulphate& Alpha Olefin Sulphonate. The installed capacity for Fatty
Alcohols is 65000 MT per annum which includes a dedicated Export Oriented Unit of
30000 MT.
Godrej Properties: The Company is India’s leading manufacturers of oleo chemicals and
over hundreds of different industrial chemicals. With its global reach spreading wings
across 40 countries, the company was conferred the prestigious exports award by
Chemexcil for 3 consecutive years in 1998-99, 1999-00 and 2000-01.The products in its

Page 25
portfolio are used in a variety of applications: cosmetics, tyres, detergents,
pharmaceuticals, cigarettes, toothpaste and more.
Godrej Consumer Products: Godrej Properties was incepted in 1990 with an aim of
providing ultra-modern townships to discerning customers at affordable prices. It adheres
to a simple philosophy of providing exemplary service based on the optimal use of
available resources.
Godrej Hershey: Godrej Hershey is one of the most respected business conglomerates
established in 2006 with a prime focus on the food division. The range of products from
the house of Godrej Hershey covers a number of popular products in the segment of
Confectionery, Non-Carbonated Beverages, Cooking Aids, Packet Tea and Edible Oil.
Godrej Agrovet: Godrej Agrovet, formerly a division of Godrej Soaps was reformed in
1971 with a focus on the agricultural sector. Over the years this division has developed a
close relationship with farmers with its innovative offerings in the form of animal feed,
oil palm plantations, agrochemicals and poultry.

Page 26
2.5 Pidilite Industries Ltd
Pidilite Industries, a well-known name in adhesives market, was incorporated in 1969.
Pidilite Industries is the market leader in adhesives and sealants, construction chemicals,
hobby colors and polymer emulsions in India.Over two–third of the company’s sales
come from products and segments it has pioneered in India.
The company has diversified in various segments such as adhesives and sealants,
construction and paint chemicals, automotive chemicals, art materials, industrial
adhesives, industrial and textile resins and organic pigments and preparations. It has
created brands like Fevicol, Dr Fixit, Cyclo, hobby ideas, Roff and M–Seal.
To facilitate better global networking, Pidilite Industries has established offices /
subsidiaries in several countries including Singapore, USA, Brazil, UAE, Saudi Arabia,
Indonesia, Egypt, Bangladesh, UK, Kenya, South Africa and Ghana.In India it has
subsidiaries namely Bhimad Commercial Company and Madhumala Traders.
Pidilite also established a state–of–the–art research centre in Singapore that is now a
member of Singapore Chemical Industry Council (SCIC).
Page 27
CHAPTER : 3
ANALYSIS OF CHEMICAL
INDUSTRY

Page 28
No. of Countries
3.1 Group Mapping
Interpretation
In order to visualize the segmentation of strategic groups, it is useful to design a "map"
(Müller-Stewens 2005):
For this purpose we have determine two variables which is helpful in classify the
strategic groups. These criteria form the X axis, where we have sketch as the no of
countries.
Thereafter on Y axis we have took different variable that is R&D exp. are in lacks.
The last step is to divide the companies into strategic groups. The companies which
are closest to each other form a strategic group. In our project group analysis three
companies are close competitors name of the companies are Aarti, Excel, alky
because of they are very near to each other as per R&D exp. and market share.
R & D
Exp.
Godhrej
Aarti
Pidlit
Alky
ll
Excel
Page 29
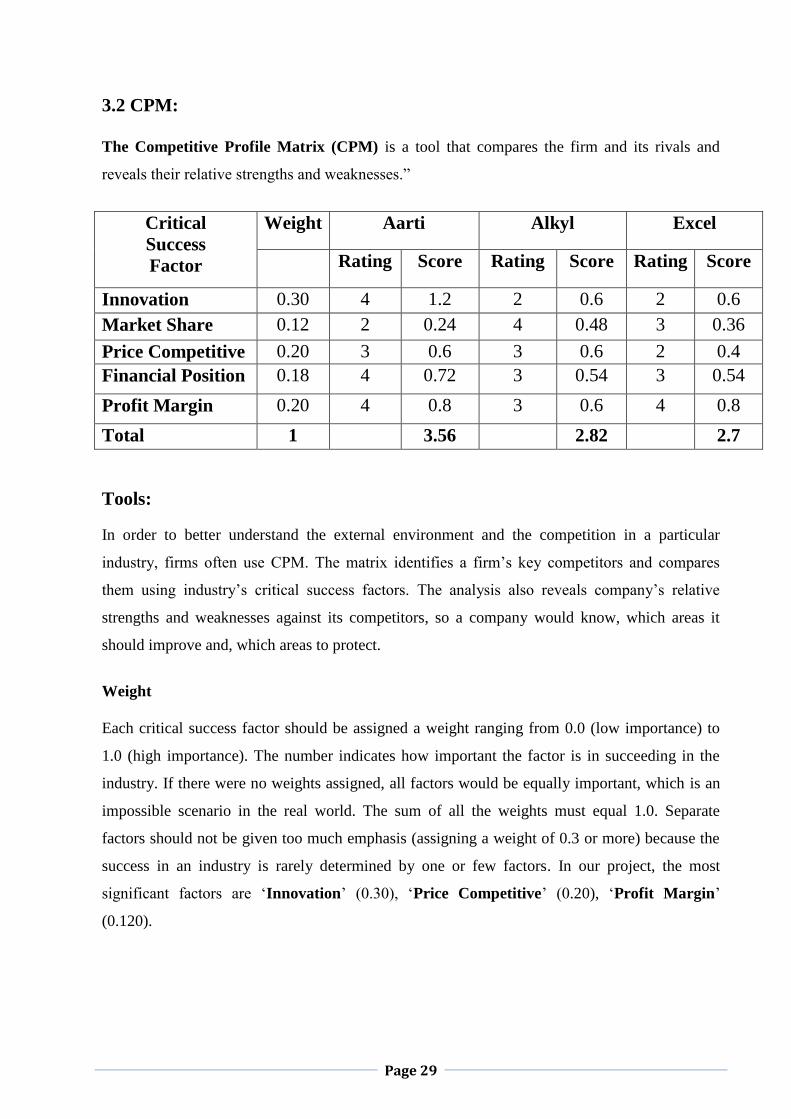
3.2 CPM:
The Competitive Profile Matrix (CPM) is a tool that compares the firm and its rivals and
reveals their relative strengths and weaknesses.”
Critical
Success
Factor
Weight Aarti Alkyl Excel
Rating Score Rating Score Rating Score
Innovation 0.30 4 1.2 2 0.6 2 0.6
Market Share 0.12 2 0.24 4 0.48 3 0.36
Price Competitive 0.20 3 0.6 3 0.6 2 0.4
Financial Position 0.18 4 0.72 3 0.54 3 0.54
Profit Margin 0.20 4 0.8 3 0.6 4 0.8
Total 1 3.56 2.82 2.7
Tools:
In order to better understand the external environment and the competition in a particular
industry, firms often use CPM. The matrix identifies a firm’s key competitors and compares
them using industry’s critical success factors. The analysis also reveals company’s relative
strengths and weaknesses against its competitors, so a company would know, which areas it
should improve and, which areas to protect.
Weight
Each critical success factor should be assigned a weight ranging from 0.0 (low importance) to
1.0 (high importance). The number indicates how important the factor is in succeeding in the
industry. If there were no weights assigned, all factors would be equally important, which is an
impossible scenario in the real world. The sum of all the weights must equal 1.0. Separate
factors should not be given too much emphasis (assigning a weight of 0.3 or more) because the
success in an industry is rarely determined by one or few factors. In our project, the most
significant factors are ‘Innovation’ (0.30), ‘Price Competitive’ (0.20), ‘Profit Margin’
(0.120).
Page 30
Rating
The ratings in CPM refer to how well companies are doing in each area. They range from 4 to 1,
where 4 means a major strength, 3 – minor strength, 2 – minor weakness and 1 – major
weakness. Ratings, as well as weights, are assigned subjectively to each company, but the
process can be done easier through benchmarking
Score & Total Score
The score is the result of weight multiplied by rating. Each company receives a score on each
factor. Total score is simply the sum of all individual score for the company. The firm that
receives the highest total score is relatively stronger than its competitors. In our Project, the
strongest performer in the market is Aarati industries ltd(3.56 points).
Benefits of the CPM:
The same factors are used to compare the firms. This makes the comparison more
accurate.
The analysis displays the information on a matrix, which makes it easy to compare the
companies visually.
The results of the matrix facilitate decision-making. Companies can easily decide which
areas they should strengthen, protect or what strategies they should pursue.
Page 31
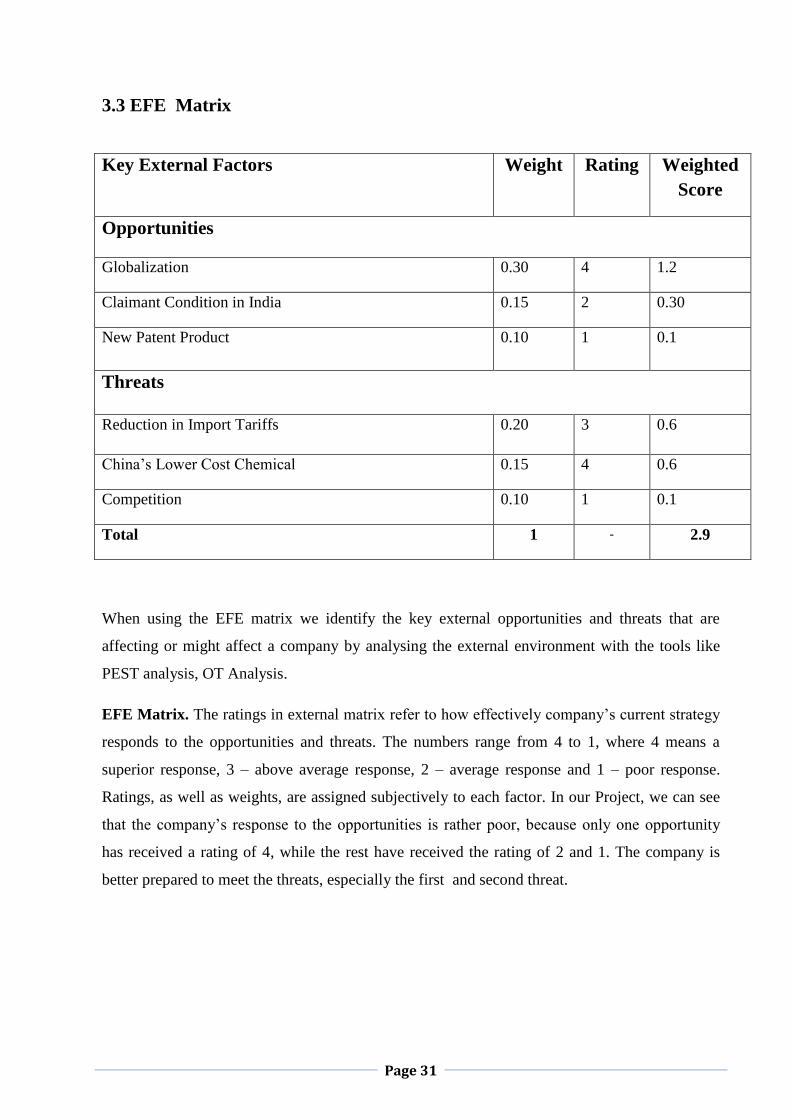
3.3 EFE Matrix
When using the EFE matrix we identify the key external opportunities and threats that are
affecting or might affect a company by analysing the external environment with the tools like
PEST analysis, OT Analysis.
EFE Matrix. The ratings in external matrix refer to how effectively company’s current strategy
responds to the opportunities and threats. The numbers range from 4 to 1, where 4 means a
superior response, 3 – above average response, 2 – average response and 1 – poor response.
Ratings, as well as weights, are assigned subjectively to each factor. In our Project, we can see
that the company’s response to the opportunities is rather poor, because only one opportunity
has received a rating of 4, while the rest have received the rating of 2 and 1. The company is
better prepared to meet the threats, especially the first and second threat.
Key External Factors Weight Rating Weighted
Score
Opportunities
Globalization 0.30 4 1.2
Claimant Condition in India 0.15 2 0.30
New Patent Product 0.10 1 0.1
Threats
Reduction in Import Tariffs 0.20 3 0.6
China’s Lower Cost Chemical 0.15 4 0.6
Competition 0.10 1 0.1
Total 1 - 2.9

Page 32
Weighted Scores & Total Weighted Score The score is the result of weight multiplied by rating. Each key factor must receive a score.
Total weighted score is simply the sum of all individual weighted scores. The firm can receive
the same total score from 1 to 4 in matrix. The total score of 2.9 is an good score. In external
evaluation a low total score indicates that company’s strategies are well designed to meet the
opportunities and defend against threats.
In our project, the company has received total score 2.9, which indicates that company’s
strategies are effective in exploiting opportunities or defending against threats. The company
should improve its strategy and focus more on how takes advantage of the opportunities.
Benefits
The matrixes have the following benefits:
Easy to understand. The input factors have a clear meaning to everyone inside or
outside the company. There’s no confusion over the terms used or the implications of the
matrices.
Easy to use. The matrix do not require extensive expertise, many personnel or lots of
time to build.
Focuses on the key internal and external factors. Unlike EFE only highlight the key
factors that are affecting a company or its strategy.
Multi-purpose. The tools can be used to build SWOT analysis, IE matrix, GE-
McKinsey matrix or for benchmarking.
Limitations
Easily replaced. EFE matrix can be replaced almost completely by PEST analysis,
SWOT analysis, competitive profile matrix and partly some other analysis.
Doesn’t directly help in strategy formation. Both analyses only identify and evaluate
the factors but do not help the company directly in determining the next strategic move
or the best strategy. Other strategy tools have to be used for that.
Too broad factors. SWOT matrix has the same limitation and it means that some
factors that are not specific enough can be confused with each other. Some strengths can
be weaknesses as well, e.g. Changing population psychograph, which can be a strong
and valuable Changing population psychograph or a poor Changing population
psychograph. The same situation is with opportunities and threats. Therefore, each factor
has to be as specific as possible to avoid confusion over where the factor should be
assigned.

Page 33
Industry Rivalry
Large number of competitors all competing for market
share
All are global competitors little room for expansion
All benefiting from economies of scale, so competing on
price
Little differentiation among current players
High fixed costs, and high exit costs
3.4 Porter’s Five Force Model:
Threat of New Entrants
Government regulations and patents
Significant capital requirements
Incumbents have superior efficiency and quality in production that may be difficult to imitate
Intense R&D and human capital requirements
Bargaining Power of Suppliers
Chemical industry relies on supplies from a few large corporations (such as those in petrochemicals industry)
Chemical producers have limited substitutes for inputs
Most suppliers are not dependent on their sales to chemical manufacturers
Bargaining Power of Buyers
Chemicals are important inputs to many industries
Those in chemical industry have many end-customers; don’t rely on one customer
The products (chemicals) are not greatly differentiated
Usually purchased through long-term contracts, so switching costs are high
Threat of Substitutes
Buyers tend to need specific chemicals as inputs
There really are no similar substitutes for chemicals
Even if another chemical can be used, it is most likely produced by the same Industry Players.
Page 34
3.5 Threat of New Entrants
1. Government regulations and patents
Rules under Environment (Protection) Act, 1986
Manufacture, Storage and Import of Hazardous Chemical Rules, 1989, 2000.
Chemical Accidents (Emergency Planning, Preparedness and Response)
Amendment Rules, 1996.
Public Liability Insurance Act, 1991, 1992.
Industrial Activities Covered in the regulations
Production, storages, use and import of the specified hazardous chemicals.
Chemical and petrochemical substances having hazardous (i.e. flammable,
explosive, corrosive, toxic) properties.
Storages of hazardous chemicals not associated with processes.
Bargaining Power of Suppliers
If the suppliers to an industry have strong bargaining power in the market, they can
reduce industry profits and slow industry growth. Some of the factors that can increase
supplier bargaining power include:
The industry being supplied is composed of a large number of competitors.
The supply industry is dominated by a few large firms.
The supply industry experiences little threat from substitutes.

Page 35
Bargaining Power of Buyers
If customers have strong bargaining power in the market, it can reduce industry profits
and slow industry growth. Some of the factors that can increase customer bargaining
power include:
The industry is composed of a large number of competitors.
The customer industry is dominated by a few large firms.
Customers purchase large volumes relative to seller sales.
Customers perceive little product differentiation.
Customers have low switching costs.
The product is unimportant to the cost or quality of the customer's product.
Threat of Substitutes
Substitute products are those products that can perform the same or similar function for
the customer. Substitutes may be very similar to the existing product, for example
substituting an aqueous cleaner for a solvent-based cleaner, or may be very different,
such as eliminating the need for cleaners by using a technology that reduces product
soiling.
Thus, identifying and anticipating potential substitutes requires more than monitoring
new product development by existing competitors. Potential substitutes can come from
almost any industry. Any product, service, or technology that can effectively perform the
same function for a customer may become a significant substitute threat.

Page 36
CHAPTER – 4
FINANCIAL ANALYSIS
Page 37
4.1 INTRODUCTION OF FINANCIAL ANALYSIS
Financial analysis converts raw information of financial statements in useful financial
information. Only after financial analysis, we can use financial statements for decision making.
These financial information are useful for planning. For example, we can estimate our future
ability of earning on advertising if we did financial analysis of our advertising expenses with
direct return on the investment in advertising. Like this, we can do financial analysis of each and
every item of profit and loss account, balance sheet and cash flow statement.
We highlighted the content and importance of the statement of change in financial position.
Management, creditors, investors and other use the information contained in these statements to
form judgment about the operating performance and financial position of the firm. User of
financial statement can get future insight about financial strength and weakness of the firm if
they properly analyse information reported in these statement. Management should be
particularly interested in knowing financial strength of the firm to make their best use and to be
able to spot out financial weakness of the firm to take suitable corrective action. The future plan
of the free should be laid down in view of the firm‘s financial strengths and weakness. Thus
financial analysis is the starting point for making plans, before using any sophisticated
forecasting and planning procedures. Understanding the past is a prerequisite for anticipating the
future.
For doing financial analysis, we use following tools.
4.1.1 Tool of Financial Analysis : Financial Statement Analysis
In financial statement analysis is that tool of financial analysis in which we create and highlight
the significant relationships of different items of financial statement. We also interpret that
relationship in simple words. For example, an investor may be interested to know past earning
data with its relationship with company's investments. Two type of financial statement analysis
are very important. One is horizontal analysis and second is vertical analysis. In horizontal
analysis, we compare all items of balance sheet and profit and loss account with previous years'
balance sheet and profit and loss account's items. In vertical analysis, we convert each element of
the information into a percentage of the total amount of statement so as to establish relationship
with other components of the same statement.
Page 38
4.1.2 Tool of Financial Analysis : Ratio Analysis
Actually, it is also financial statement analysis but for detail study we can make separate topic of
study. We calculate different ratios like revenue ratios, balance sheet ratios and mixed ratios.
Ratio analysis is based on fact, if we create relationship between two accounting figures, we can
get useful information relating to performance, strengths and weakness. For example, we know
that according to rule of thumb, debt equity ratio should not more than 2:1 because it is risky. As
an investor, we calculate debt -equity ratio before invest our money in the form of debt. Here are
two company and we have calculated its debt equity ratio.

Page 39
4.2 TREND ANALYSIS
Trend analysis is an aspect of technical analysis that tries to predict the future movement of a
stock based on past data. Trend analysis is based on the idea that what has happened in the past
gives traders an idea of what will happen in the future.
Method for calculating Trend:
Trend percentage Method:
We have utilized trend percentage method for the calculation of trend. For the trend analysis
index number is advocated. The procedure followed is to assign the number 100 to the item of
the base year and to calculate percentage change in each item of other years in the relation to the
base year. this procedure is called trend percentage method.
Base year for the trend analysis:
For the trend analysis, year dec 2006 is taken as base for the calculation of the trend of different
of balance sheet and income statement.
Page 40
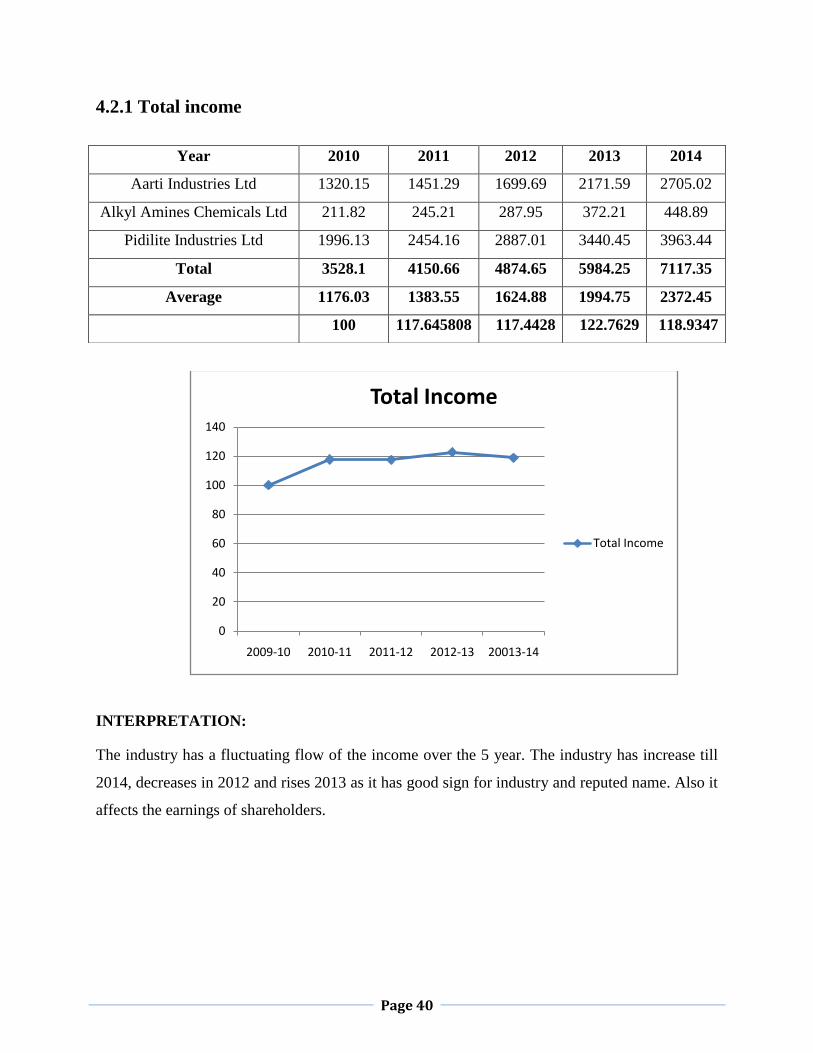
4.2.1 Total income
INTERPRETATION:
The industry has a fluctuating flow of the income over the 5 year. The industry has increase till
2014, decreases in 2012 and rises 2013 as it has good sign for industry and reputed name. Also it
affects the earnings of shareholders.
0
20
40
60
80
100
120
140
2009-10 2010-11 2011-12 2012-13 20013-14
Total Income
Total Income
Year 2010 2011 2012 2013 2014
Aarti Industries Ltd 1320.15 1451.29 1699.69 2171.59 2705.02
Alkyl Amines Chemicals Ltd 211.82 245.21 287.95 372.21 448.89
Pidilite Industries Ltd 1996.13 2454.16 2887.01 3440.45 3963.44
Total 3528.1 4150.66 4874.65 5984.25 7117.35
Average 1176.03 1383.55 1624.88 1994.75 2372.45
100 117.645808 117.4428 122.7629 118.9347
Page 41
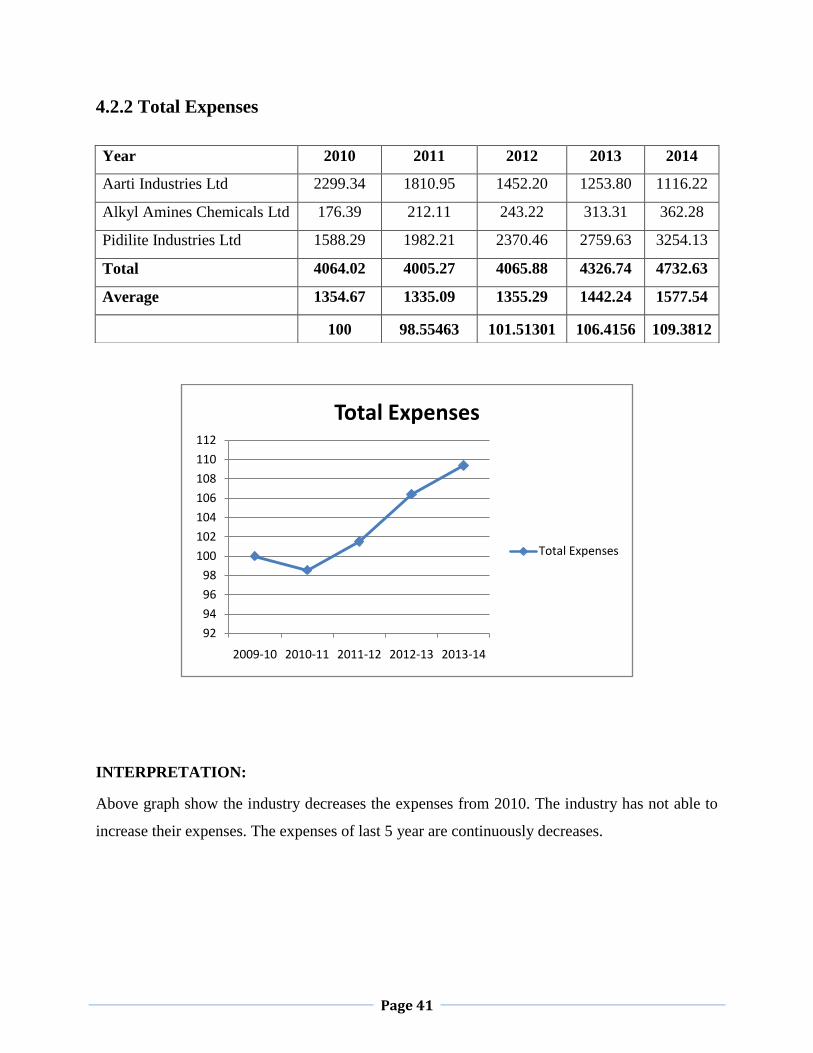
4.2.2 Total Expenses
INTERPRETATION:
Above graph show the industry decreases the expenses from 2010. The industry has not able to
increase their expenses. The expenses of last 5 year are continuously decreases.
92
94
96
98
100
102
104
106
108
110
112
2009-10 2010-11 2011-12 2012-13 2013-14
Total Expenses
Total Expenses
Year 2010 2011 2012 2013 2014
Aarti Industries Ltd 2299.34 1810.95 1452.20 1253.80 1116.22
Alkyl Amines Chemicals Ltd 176.39 212.11 243.22 313.31 362.28
Pidilite Industries Ltd 1588.29 1982.21 2370.46 2759.63 3254.13
Total 4064.02 4005.27 4065.88 4326.74 4732.63
Average 1354.67 1335.09 1355.29 1442.24 1577.54
100 98.55463 101.51301 106.4156 109.3812

Page 42
4.2.3 Operating Profit
INTERPRETATION:
Above graph show the industry different year operating profit over the 5 year. The graph
shows that in 2014 operating profit decreases and increases continuously till 2010.
0
20
40
60
80
100
120
140
160
2009-10 2010-11 2011-12 2012-13 2013-14
Operating Profit
Operating Profit
Year 2010 2011 2012 2013 2014
Aarti Industries Ltd 203.93 197.49 243.49 360.64 405.91
Alkyl Amines Chemicals Ltd 35.43 33.1 44.73 58.9 86.6
Pidilite Industries Ltd 407.84 471.95 516.55 680.83 709.32
Total 672.2 702.54 804.77 1100.37 1201.83
Average 215.73 234.18 268.25 366.79 400.61
100 108.55236 114.54864 136.7344 109.2205

Page 43
4.2.4 PBDT
INTERPRETATION:
Above graph show the industry fluctuating of PBDT over the 5 year. The industry has able to
improve their PBDT in current year.
0
20
40
60
80
100
120
140
160
2009-10 2010-11 2011-12 2012-13 2013-14
PBDT
PBDT
Year 2010 2011 2012 2013 2014
Aarti Industries Ltd 107.47 93.61 122.01 183.84 200.94
Alkyl Amines Chemicals Ltd 14.86 13.61 23.68 35.93 64.62
Pidilite Industries Ltd 328.87 397.4 444.12 619.57 631
Total 451.2 504.62 589.81 839.34 896.56
Average 150.4 168.20 196.60 279.78 298.85
100 111.835106 116.885 142.309 106.816
Page 44
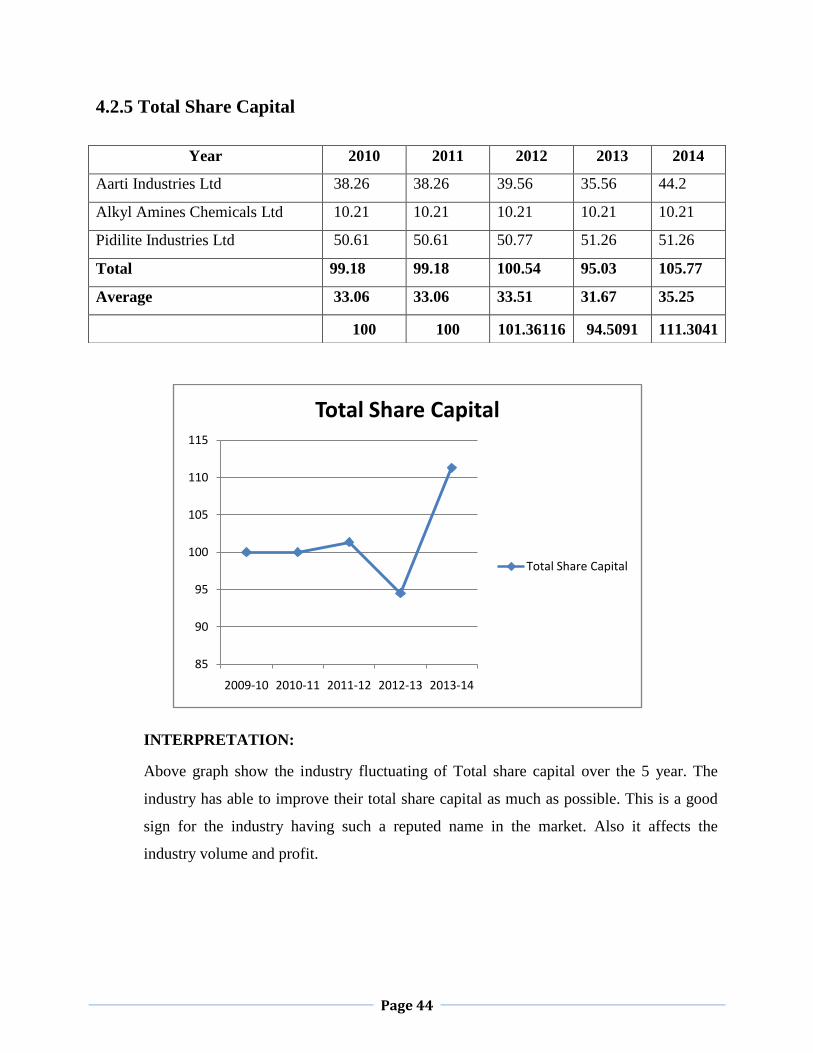
4.2.5 Total Share Capital
INTERPRETATION:
Above graph show the industry fluctuating of Total share capital over the 5 year. The
industry has able to improve their total share capital as much as possible. This is a good
sign for the industry having such a reputed name in the market. Also it affects the
industry volume and profit.
85
90
95
100
105
110
115
2009-10 2010-11 2011-12 2012-13 2013-14
Total Share Capital
Total Share Capital
Year 2010 2011 2012 2013 2014
Aarti Industries Ltd 38.26 38.26 39.56 35.56 44.2
Alkyl Amines Chemicals Ltd 10.21 10.21 10.21 10.21 10.21
Pidilite Industries Ltd 50.61 50.61 50.77 51.26 51.26
Total 99.18 99.18 100.54 95.03 105.77
Average 33.06 33.06 33.51 31.67 35.25
100 100 101.36116 94.5091 111.3041
Page 45
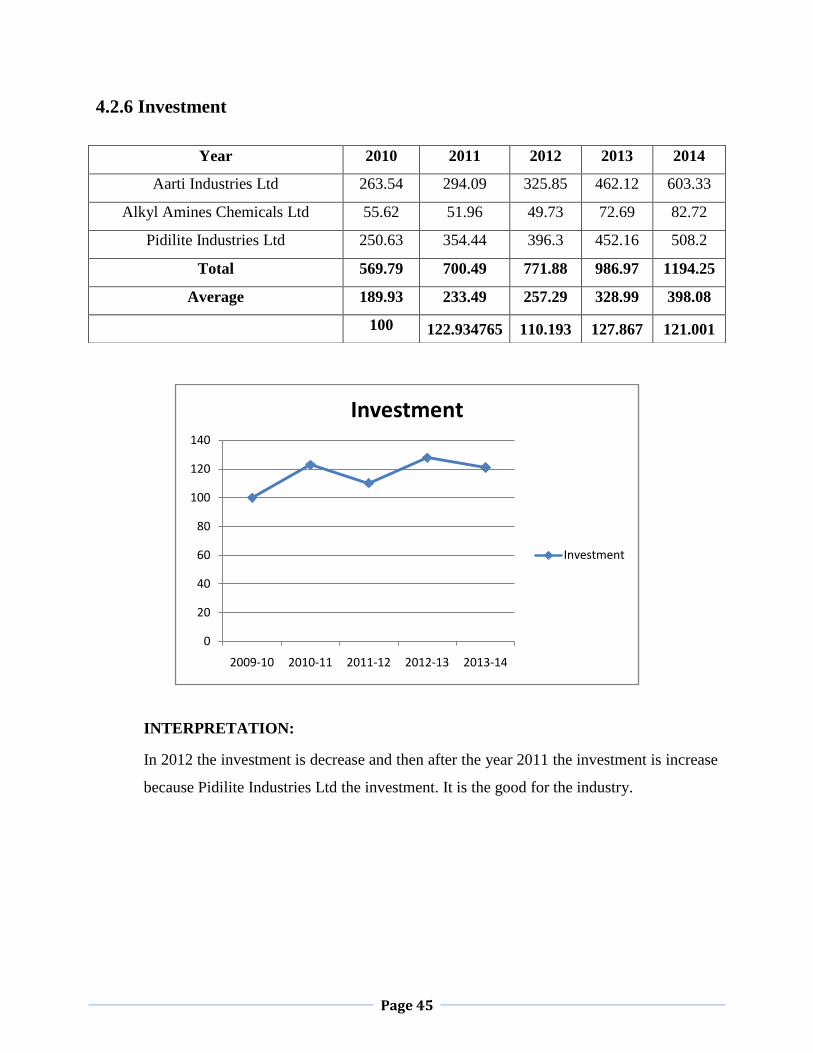
4.2.6 Investment
INTERPRETATION:
In 2012 the investment is decrease and then after the year 2011 the investment is increase
because Pidilite Industries Ltd the investment. It is the good for the industry.
0
20
40
60
80
100
120
140
2009-10 2010-11 2011-12 2012-13 2013-14
Investment
Investment
Year 2010 2011 2012 2013 2014
Aarti Industries Ltd 263.54 294.09 325.85 462.12 603.33
Alkyl Amines Chemicals Ltd 55.62 51.96 49.73 72.69 82.72
Pidilite Industries Ltd 250.63 354.44 396.3 452.16 508.2
Total 569.79 700.49 771.88 986.97 1194.25
Average 189.93 233.49 257.29 328.99 398.08
100 122.934765 110.193 127.867 121.001

Page 46
4.2.7 Total Asset
INTERPRETATION:
From the above trend of total assert of company we can say that company had good
growth rate in 2012 but after that it Increase in 2014.
0
20
40
60
80
100
120
140
2009-10 2010-11 2011-12 2012-13 2013-14
Total Assets
Investment
Year 2010 2011 2012 2013 2014
Aarti Industries Ltd 835.14 1112.66 1309.59 1739.83 079.10
Alkyl Amines Chemicals Ltd 183.21 199.88 214.28 254.9 292.66
Pidilite Industries Ltd 427.87 523.53 609.19 723.24 771.52
Total 1446.22 1836.07 2133.16 2717.97 3143.28
Average 482.07 612.02 711.05 905.99 1047.76
100 126.95667 116.18084 127.4158 115.6481
Page 47
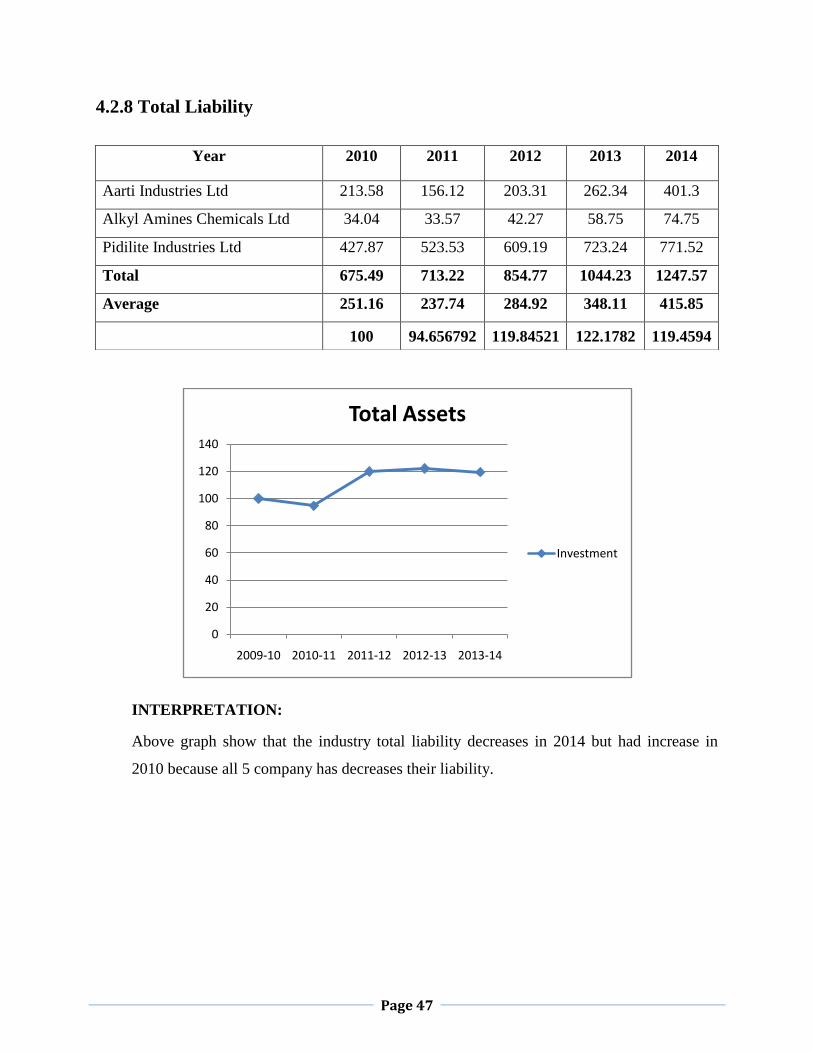
4.2.8 Total Liability
INTERPRETATION:
Above graph show that the industry total liability decreases in 2014 but had increase in
2010 because all 5 company has decreases their liability.
0
20
40
60
80
100
120
140
2009-10 2010-11 2011-12 2012-13 2013-14
Total Assets
Investment
Year 2010 2011 2012 2013 2014
Aarti Industries Ltd 213.58 156.12 203.31 262.34 401.3
Alkyl Amines Chemicals Ltd 34.04 33.57 42.27 58.75 74.75
Pidilite Industries Ltd 427.87 523.53 609.19 723.24 771.52
Total 675.49 713.22 854.77 1044.23 1247.57
Average 251.16 237.74 284.92 348.11 415.85
100 94.656792 119.84521 122.1782 119.4594
Page 48
4.3 Ratio Analysis
4.3.1 Aarti Industries Ltd
Liquidity Ratios
It is extremely essential for a firm to be able to meet its obligations as they become due.
Liquidity ratios measure the ability of the firm to meet its current obligations (liabilities). In fact,
analysis of liquidity needs the preparation of cash budgets and cash and fund flow statements;
but liquidity ratios, by establishing a relationship between cash and other current assets to current
obligations, provide a quick measure of liquidity. A firm should ensure that it does not suffer
from lack of liquidity, and also that it does not have excess liquidity. The failure of a company
to meet its obligations due to lack of sufficient liquidity will result in a poor credit worthiness,
loss of creditors’ confidence or even in legal tangles resulting in the closure of the company. A
very high degree of liquidity is also bad; idle assets earn nothing. The firm’s funds will be
unnecessarily tied up in current assets.
The most common ratios, which indicate the extent of liquidity or lack of it, are (1) current ratio
and (2) quick ratio. Other ratios include cash ratio, interval measure and networking capital ratio.
1. Current ratio
Current ratio is calculated by dividing current assets by current liabilities:
Current assets
Current ratio = --------------------------
Current liabilities
For the Aarti Industries Ltd in the ratio
PARTICULAR 2014 2013 2012 20111 2010
Current Assets 1240.55 1015.43 819.37 702.32 753.57
Current Liability 372.31 235.54 182.74 138.65 148.42
Current Ratio 3.33 4.31 4.48 5.06 5.07

Page 49
2. Quick Ratio
Quick ratio, also called acid –test ratio, establishes a relationship between quick, or
liquid, assets and current liabilities. An asset is liquid if it can be converted into cash is
the most liquid asset.
Current assets – inventories
Quick ratio = ---------------------------------------------
Current liabilities
For the Aarti Industries Ltd in the ratio
PARTICULAR 2014 2013 2012 20111 2010
Current Assets - inventories 637.22 553.31 412.42 408.23 490.03
Current Liability 372.31 235.54 182.74 138.65 148.42
Current Ratio 1.72 2.35 2..26 2.95 3.31
0
0.02
0.04
0.06
0.08
0.1
0.12
Particular 2014 2013 2012 2011 2010
Page 50
3. Cash Ratio
Since cash is the most liquid asset, a financial analyst may examine cash ratio and its
equivalent to current liabilities. Trade investment or marketable securities are equivalent
of cash; therefore, they may be included in the computation of cash ratio:
Cash + Marketable securities
Cash ratio = -------------------------------------------------
Current liabilities
For the Aarti Industries Ltd in the ratio is as follows:
PARTICULAR 2014 2013 2012 20111 2010
Cash 12.35 9.71 8.81 7.77 11.41
Current Liability 372.31 235.54 182.74 138.65 148.42
Current Ratio 0.033 0.041 0.048 0.057 0.076
0
0.02
0.04
0.06
0.08
0.1
0.12
Page 51
4. Debt Ratio
Several debt ratios may be used to analyze the long-term solvency of a firm. The firm
may be interested in knowing the proportion of the interest-bearing debt in the capital
structure. It may, therefore, compute debt ratio by dividing total debt by capital employed
or net assets. Total debt will include short and long-term borrowings from financial
institutions, debentures/bonds, deferred payment arrangements for buying capital
equipments, bank borrowings, public deposits and any other interest-bearing loan. Capital
employed will include debt and net worth.
Total debt
Debt ratio = ----------------------------------
Net Assets
For the Aarti Industries Ltd in the ratio is as follows:
PARTICULAR 2014 2013 2012 20111 2010
Total Debt 1037.42 845.82 624.59 526.1 436.48
Net Assets 839.25 753.09 616.06 546.22 479.99
Current Ratio 1.24 1.12 1.02 0.97 0.91
0
0.02
0.04
0.06
0.08
0.1
0.12
Page 52
5. Debtors turnover
A firm sells goods for cash and credit is used as a marketing tool by a number of
companies. When the firm extends credits to its customers, debtors are credits to its
customers; debtors are created in the firm’s accounts. Debtors are convertible into cash
over a short period and, therefore, are included in current assets. The liquidity position of
the firm depends on the quality of debtors to a great extent.
Debtor’s turnover debtor’s turnover is found out by dividing credit sales by average
debtors:
Sales
Debtors turnover = ---------------------------------
Debtors
For the Aarti Industries Ltd in the ratio is as follows:
PARTICULAR 2014 2013 2012 20111 2010
Sales 2823.37 2273.79 1785.83 1538.35 1336.32
Debtors 465.77 428.65 406.95 332.53 256.45
Current Ratio 6.06 5.31 4.39 4.62 5.22
0
0.02
0.04
0.06
0.08
0.1
0.12
Page 53
6. Assets turnover Ratios
Assets are used to generate sales. Therefore, a firm should manage its assets efficiently to
maximize sales. The relationship between sales and assets is called assets turnover.
Several assets turnover ratios can be calculated.
Net assets turnover The firm can compute net assets turnover simply by dividing sales by
net assets.
Sales
Net assets turnover = -------------------------------
Net sales
For the Aarti Industries Ltd in the ratio is as follows:
PARTICULAR 2014 2013 2012 20111 2010
Sales 2823.37 2273.79 1785.83 1538.35 1336.32
Debtors 839.25 753.09 616.06 546.22 479.99
Current Ratio 3.36 3.02 2.89 2.81 2.78
0
0.02
0.04
0.06
0.08
0.1
0.12

Page 54
7. Gross profit Margin
The first profitability ratio in relation to sales is the gross profit margin. It is calculated by
dividing the gross profit by sales:
Gross profit
Gross profit margin = -----------------------------------
Sales
For the Aarti Industries Ltd in the ratio is as follows:
PARTICULAR 2014 2013 2012 20111 2010
Gross profit 288.88 265.64 175.98 141.53 152.22
Sales 2823.37 2273.79 1785.83 1538.35 1336.32
Current Ratio 0.10 0.11 0.098 0.092 0.11
0
0.02
0.04
0.06
0.08
0.1
0.12

Page 55
4.3.2 Alkyl Amines Chemicals Ltd
1. Current ratio
Current ratio is calculated by dividing current assets by current liabilities:
Current assets
Current ratio = --------------------------
Current liabilities
Alkyl Amines Chemicals Ltd
PARTICULAR 2014 2013 2012 20111 2010
Current Assets 214.43 179.71 131.69 109.95 120.1
Current Liability 74.75 58.75 42.27 33.57 34.04
Current Ratio 2.86 3.05 3.12 3.27 3.52
0
0.02
0.04
0.06
0.08
0.1
0.12
Particular 2014 2013 2012 2011 2010
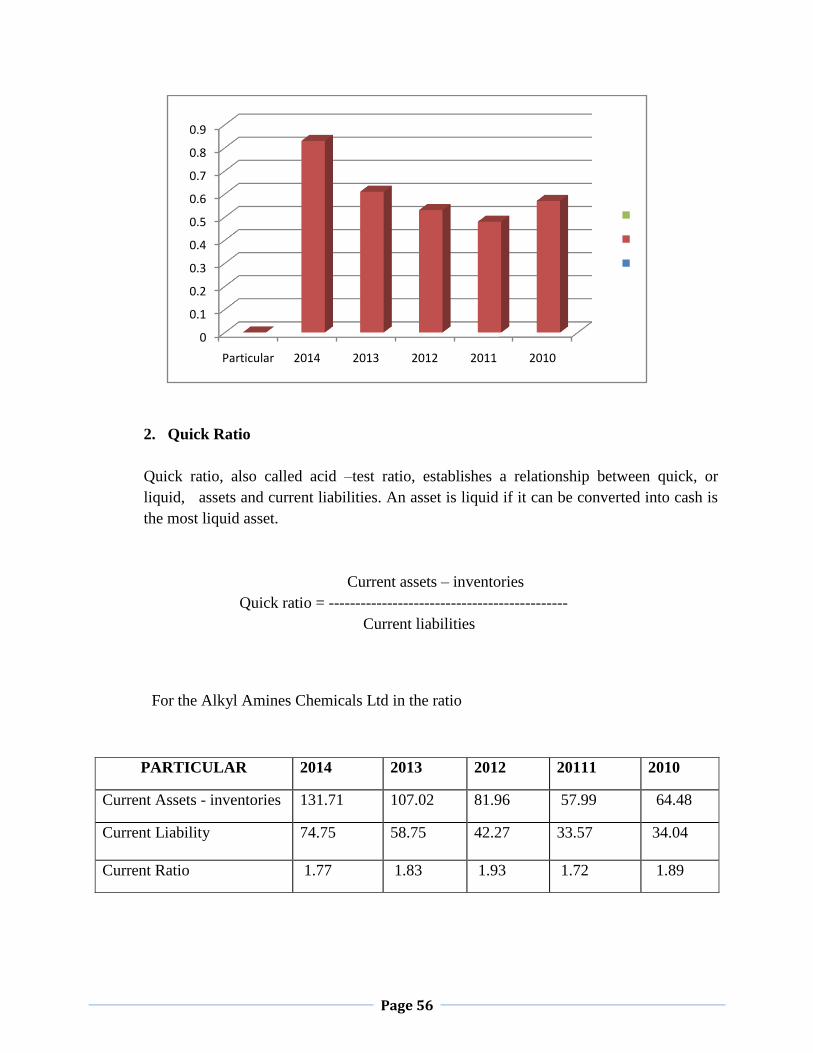
Page 56
2. Quick Ratio
Quick ratio, also called acid –test ratio, establishes a relationship between quick, or
liquid, assets and current liabilities. An asset is liquid if it can be converted into cash is
the most liquid asset.
Current assets – inventories
Quick ratio = ---------------------------------------------
Current liabilities
For the Alkyl Amines Chemicals Ltd in the ratio
PARTICULAR 2014 2013 2012 20111 2010
Current Assets - inventories 131.71 107.02 81.96 57.99 64.48
Current Liability 74.75 58.75 42.27 33.57 34.04
Current Ratio 1.77 1.83 1.93 1.72 1.89
0
0.1
0.2
0.3
0.4
0.5
0.6
0.7
0.8
0.9
Particular 2014 2013 2012 2011 2010

Page 57
3. Cash Ratio
Since cash is the most liquid asset, a financial analyst may examine cash ratio and its
equivalent to current liabilities. Trade investment or marketable securities are equivalent
of cash; therefore, they may be included in the computation of cash ratio:
Cash + Marketable securities
Cash ratio = -------------------------------------------------
Current liabilities
For the Alkyl Amines Chemicals Ltd in the ratio is as follows:
PARTICULAR 2014 2013 2012 20111 2010
Cash+Marketabal securities 22.86 15.44 11.07 1.26 3.33
Current Liability 74.75 58.75 42.27 33.57 34.04
Current Ratio 0.31 0.26 0.26 0.03 0.09
0
0.1
0.2
0.3
0.4
0.5
0.6
0.7
0.8
0.9
Particular 2014 2013 2012 2011 2010
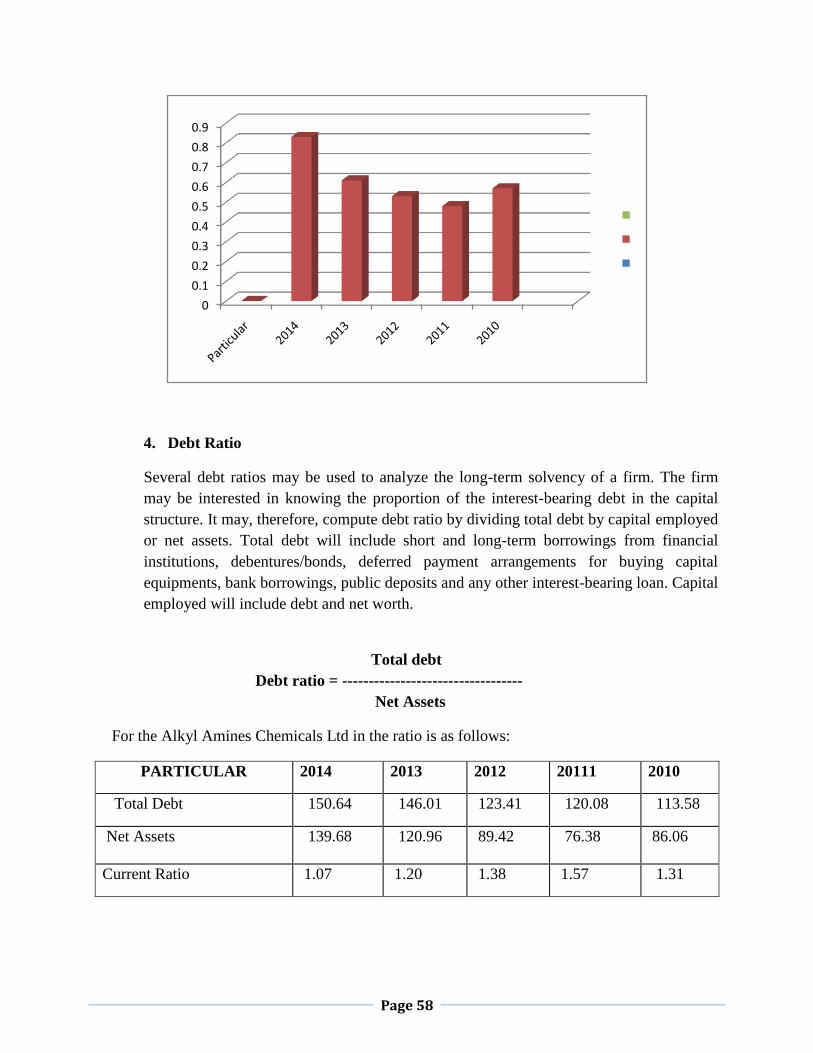
Page 58
4. Debt Ratio
Several debt ratios may be used to analyze the long-term solvency of a firm. The firm
may be interested in knowing the proportion of the interest-bearing debt in the capital
structure. It may, therefore, compute debt ratio by dividing total debt by capital employed
or net assets. Total debt will include short and long-term borrowings from financial
institutions, debentures/bonds, deferred payment arrangements for buying capital
equipments, bank borrowings, public deposits and any other interest-bearing loan. Capital
employed will include debt and net worth.
Total debt
Debt ratio = ----------------------------------
Net Assets
For the Alkyl Amines Chemicals Ltd in the ratio is as follows:
PARTICULAR 2014 2013 2012 20111 2010
Total Debt 150.64 146.01 123.41 120.08 113.58
Net Assets 139.68 120.96 89.42 76.38 86.06
Current Ratio 1.07 1.20 1.38 1.57 1.31
0
0.1
0.2
0.3
0.4
0.5
0.6
0.7
0.8
0.9
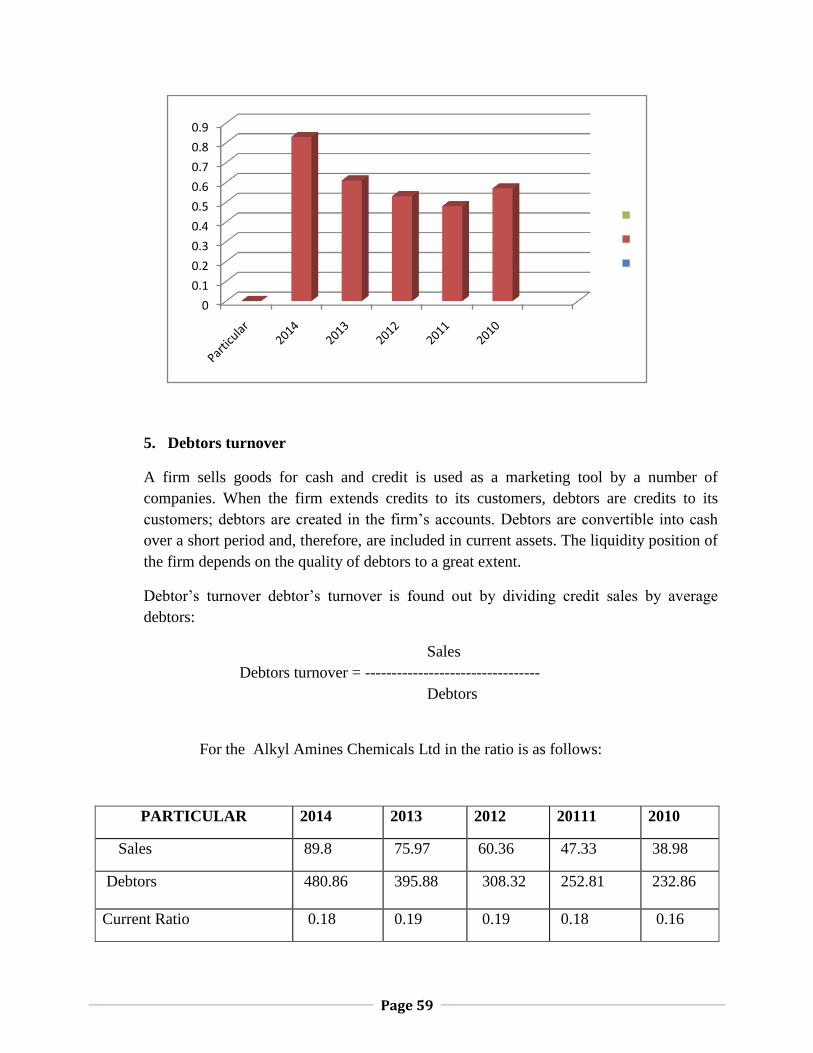
Page 59
5. Debtors turnover
A firm sells goods for cash and credit is used as a marketing tool by a number of
companies. When the firm extends credits to its customers, debtors are credits to its
customers; debtors are created in the firm’s accounts. Debtors are convertible into cash
over a short period and, therefore, are included in current assets. The liquidity position of
the firm depends on the quality of debtors to a great extent.
Debtor’s turnover debtor’s turnover is found out by dividing credit sales by average
debtors:
Sales
Debtors turnover = ---------------------------------
Debtors
For the Alkyl Amines Chemicals Ltd in the ratio is as follows:
PARTICULAR 2014 2013 2012 20111 2010
Sales 89.8 75.97 60.36 47.33 38.98
Debtors 480.86 395.88 308.32 252.81 232.86
Current Ratio 0.18 0.19 0.19 0.18 0.16
0
0.1
0.2
0.3
0.4
0.5
0.6
0.7
0.8
0.9
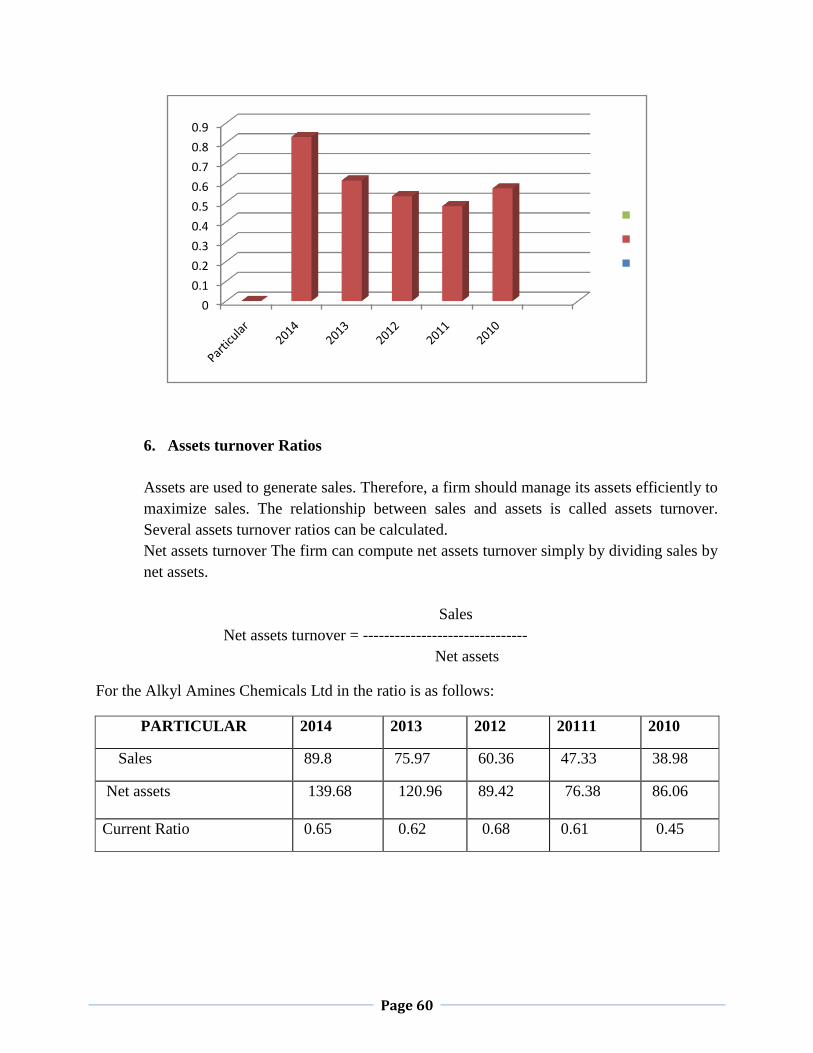
Page 60
6. Assets turnover Ratios
Assets are used to generate sales. Therefore, a firm should manage its assets efficiently to
maximize sales. The relationship between sales and assets is called assets turnover.
Several assets turnover ratios can be calculated.
Net assets turnover The firm can compute net assets turnover simply by dividing sales by
net assets.
Sales
Net assets turnover = -------------------------------
Net assets
For the Alkyl Amines Chemicals Ltd in the ratio is as follows:
PARTICULAR 2014 2013 2012 20111 2010
Sales 89.8 75.97 60.36 47.33 38.98
Net assets 139.68 120.96 89.42 76.38 86.06
Current Ratio 0.65 0.62 0.68 0.61 0.45
0
0.1
0.2
0.3
0.4
0.5
0.6
0.7
0.8
0.9

Page 61
7. Gross profit Margin
The first profitability ratio in relation to sales is the gross profit margin. It is calculated by
dividing the gross profit by sales:
Gross profit
Gross profit margin = -----------------------------------
Sales
For the Alkyl Amines Chemicals Ltd in the ratio is as follows:
PARTICULAR 2014 2013 2012 20111 2010
Gross profit 74.36 45.96 32.59 22.78 23.39
Sales 89.8 75.97 60.36 47.33 38.98
Current Ratio 0.83 0.61 0.53 0.48 0.57
0
0.1
0.2
0.3
0.4
0.5
0.6
0.7
0.8
0.9
Particular 2014 2013 2012 2011 2010

Page 62
4.3.3 Pidilite Industries Ltd
1. Current ratio
Current ratio is calculated by dividing current assets by current liabilities:
Current assets
Current ratio = --------------------------
Current liabilities
Pidilite Industries Ltd
PARTICULAR 2014 2013 2012 20111 2010
Current Assets 1220.99 1009.37 1075.42 813.12 624.05
Current Liability 771.52 723.24 609.19 523.53 407.87
Current Ratio 1.58 1.39 1.76 1.55 1.53
0
0.1
0.2
0.3
0.4
0.5
0.6
0.7
0.8
0.9
Particular 2014 2013 2012 2011 2010

Page 63
2. Quick Ratio
Quick ratio, also called acid –test ratio, establishes a relationship between quick, or
liquid, assets and current liabilities. An asset is liquid if it can be converted into cash is
the most liquid asset.
Current assets – inventories
Quick ratio = ---------------------------------------------
Current liabilities
For the Pidilite Industries Ltd in the ratio
PARTICULAR 2014 2013 2012 20111 2010
Current Assets - inventories 694.79 558.21 679.12 458.68 373.42
Current Liability 771.52 723.24 609.19 523.53 407.87
Current Ratio 0.90 0.77 1.11 0.87 0.91
0
0.02
0.04
0.06
0.08
0.1
0.12
0.14
0.16
0.18
0.2
Particular 2014 2013 2012 2011 2010

Page 64
3. Cash Ratio
Since cash is the most liquid asset, a financial analyst may examine cash ratio and its
equivalent to current liabilities. Trade investment or marketable securities are equivalent
of cash; therefore, they may be included in the computation of cash ratio:
Cash + Marketable securities
Cash ratio = -------------------------------------------------
Current liabilities
For the Pidilite Industries Ltd in the ratio is as follows:
PARTICULAR 2014 2013 2012 20111 2010
Cash+Marketabal securities 145.18 136.82 257.72 92.34 33.12
Current Liability 771.52 723.24 609.19 523.53 407.87
Current Ratio 0.18 0.19 0.42 0.17 0.08
0
0.02
0.04
0.06
0.08
0.1
0.12
0.14
0.16
0.18
0.2
Particular 2014 2013 2012 2011 2010

Page 65
4. Debt Ratio
Several debt ratios may be used to analyze the long-term solvency of a firm. The firm
may be interested in knowing the proportion of the interest-bearing debt in the capital
structure. It may, therefore, compute debt ratio by dividing total debt by capital employed
or net assets. Total debt will include short and long-term borrowings from financial
institutions, debentures/bonds, deferred payment arrangements for buying capital
equipments, bank borrowings, public deposits and any other interest-bearing loan. Capital
employed will include debt and net worth.
Total debt
Debt ratio = ----------------------------------
Net Assets
For the Pidilite Industries Ltd in the ratio is as follows:
PARTICULAR 2014 2013 2012 20111 2010
Total Debt 7.68 60.24 264.14 286.73 421.43
Net Assets 431.48 286.13 466.23 289.59 196.18
Current Ratio 0.01 0.21 0.56 0.99 2.14
0
0.02
0.04
0.06
0.08
0.1
0.12
0.14
0.16
0.18
0.2
Particular 2014 2013 2012 2011 2010
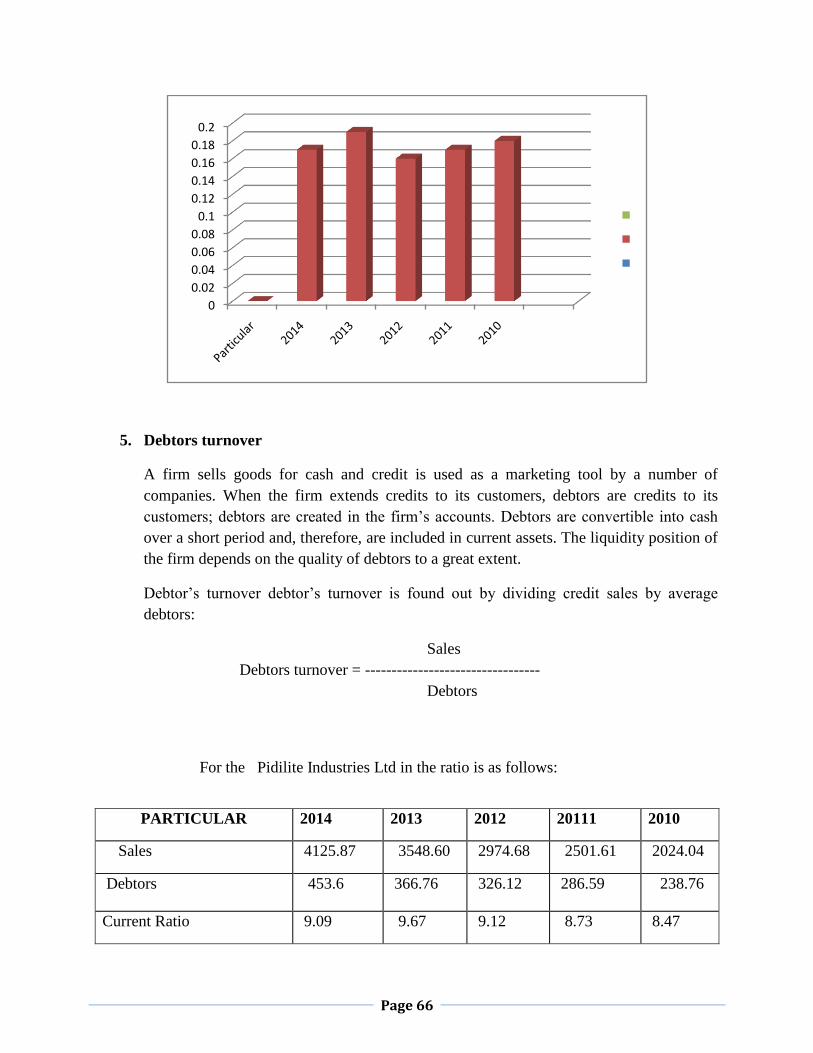
Page 66
5. Debtors turnover
A firm sells goods for cash and credit is used as a marketing tool by a number of
companies. When the firm extends credits to its customers, debtors are credits to its
customers; debtors are created in the firm’s accounts. Debtors are convertible into cash
over a short period and, therefore, are included in current assets. The liquidity position of
the firm depends on the quality of debtors to a great extent.
Debtor’s turnover debtor’s turnover is found out by dividing credit sales by average
debtors:
Sales
Debtors turnover = ---------------------------------
Debtors
For the Pidilite Industries Ltd in the ratio is as follows:
PARTICULAR 2014 2013 2012 20111 2010
Sales 4125.87 3548.60 2974.68 2501.61 2024.04
Debtors 453.6 366.76 326.12 286.59 238.76
Current Ratio 9.09 9.67 9.12 8.73 8.47
0
0.02
0.04
0.06
0.08
0.1
0.12
0.14
0.16
0.18
0.2

Page 67
6. Assets turnover Ratios
Assets are used to generate sales. Therefore, a firm should manage its assets efficiently to
maximize sales. The relationship between sales and assets is called assets turnover.
Several assets turnover ratios can be calculated.
Net assets turnover The firm can compute net assets turnover simply by dividing sales by
net assets.
Sales
Net assets turnover = -------------------------------
Net assets
For the Pidilite Industries Ltd in the ratio is as follows:
PARTICULAR 2014 2013 2012 20111 2010
Sales 4125.87 3548.60 2974.68 2501.61 2024.04
Net assets 431.48 286.13 466.23 289.59 196.18
Current Ratio 9.57 12.41 6.39 8.63 10.31
0
0.05
0.1
0.15
0.2
Particular 2014 2013 2012 2011 2010
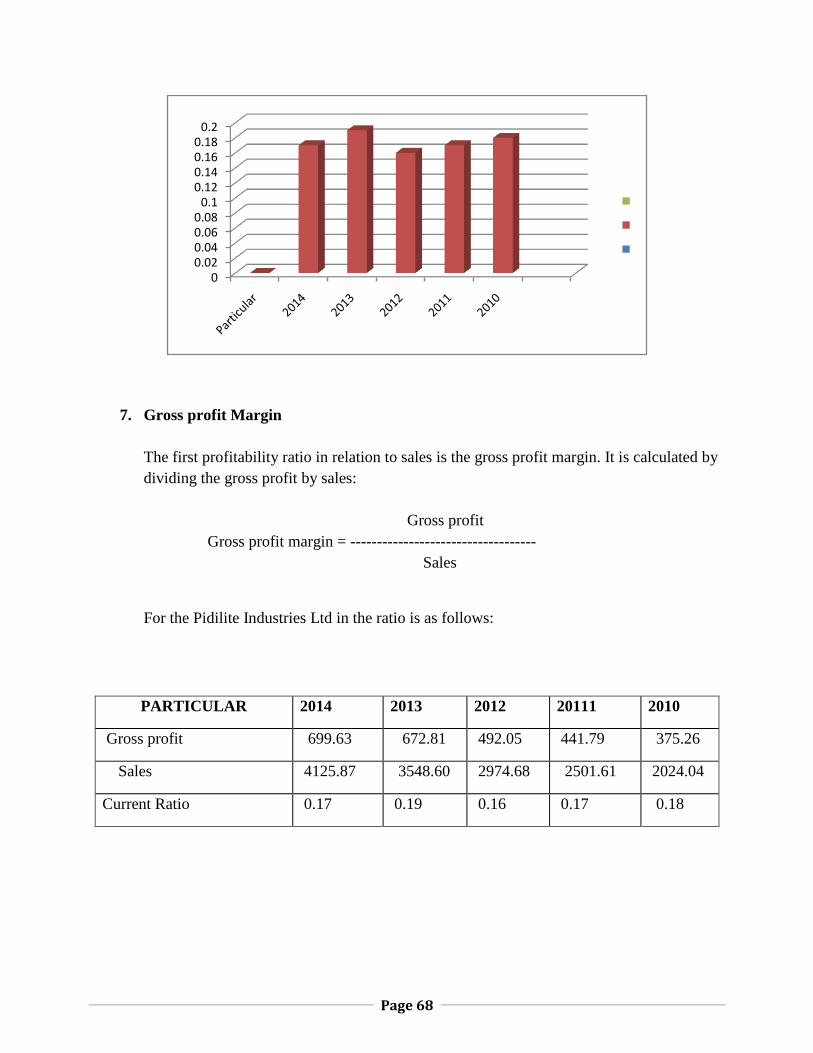
Page 68
7. Gross profit Margin
The first profitability ratio in relation to sales is the gross profit margin. It is calculated by
dividing the gross profit by sales:
Gross profit
Gross profit margin = -----------------------------------
Sales
For the Pidilite Industries Ltd in the ratio is as follows:
PARTICULAR 2014 2013 2012 20111 2010
Gross profit 699.63 672.81 492.05 441.79 375.26
Sales 4125.87 3548.60 2974.68 2501.61 2024.04
Current Ratio 0.17 0.19 0.16 0.17 0.18
00.020.040.060.08
0.10.120.140.160.18
0.2
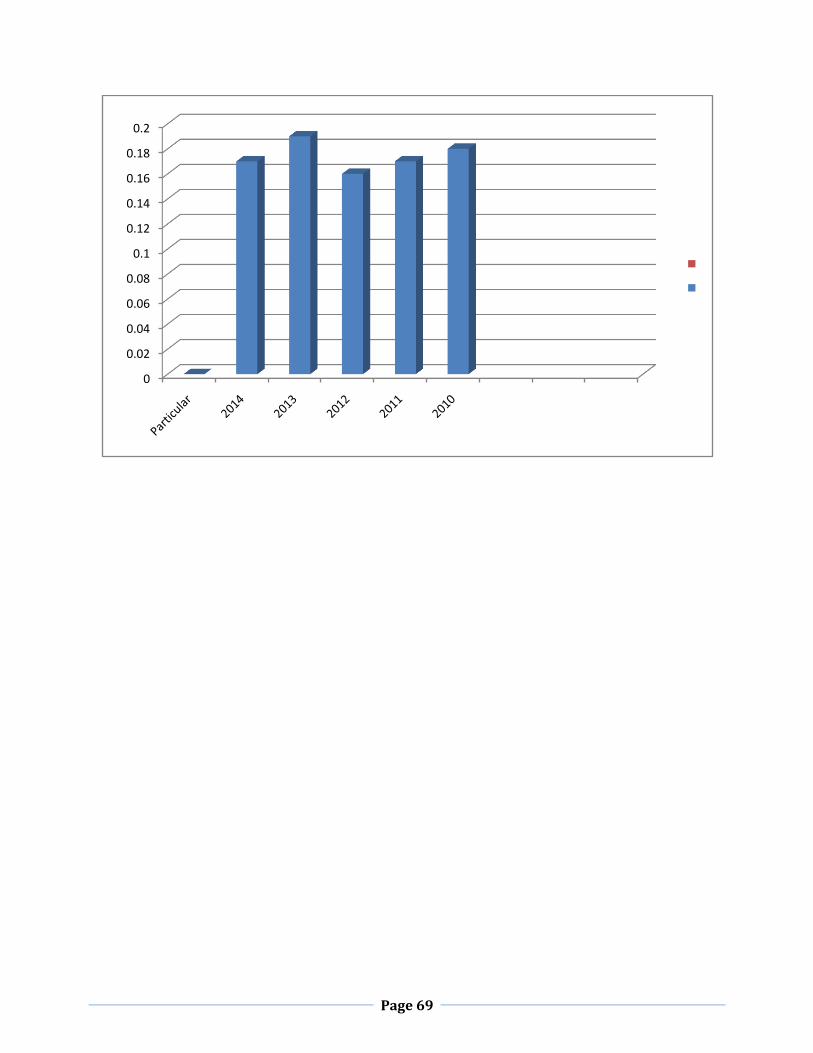
Page 69
0
0.02
0.04
0.06
0.08
0.1
0.12
0.14
0.16
0.18
0.2

Page 70
CHAPTER : 5
BUSINESS PLAN
Page 71
What is a business plan?
A Business plan is just a plan for how your business is going to work, and how you’re going to
make it succeed. Its includes an executive summary, a company overview, some information
about products and/or services, marketing plan, a list of major company milestones, some
information about each member of the management team and their role in the company, and
details of company’s financial plan.
Business plans are vital for running a business, whether or not it needs new loans or new
investments. Existing businesses should have business plans that they maintain and update as
market conditions change and as new opportunities arise.Every business has long-term and short-
term goals, sales targets, and expense budgets—a business plan encompasses all of those things,
and is as useful to a startup trying to raise funds as it is to a 10-year-old business that’s looking to
grow.
Executive Summary
Granite Industries is a specialty chemical formulator, lab analysis agency, and toll
manufacturer, selling products to companies from cosmetics manufacturers to food supplement
marketers. We manufacture and distribute Creatine Monohydrate, an approved food supplement
used to improve strength, endurance, and muscle mass. Granite also produces five other specialty
chemicals that will be detailed later in this document. A strong knowledge-based management
team, with combined thirty-years of experience in this industry, incorporated Granite.
Granite is a niche player in the speciality- and industrial-chemicals business, focusing on value-
added products which are not widely or readily available in the United States. We have perfected
unique manufacturing processes resulting in lower manufacturing costs and high profitability.
We have established a network of strategic alliances with distribution companies who lack our
capability to ascend from laboratory to commercial scale and manufacture products in
accordance with quality specifications.
Our distributors and our customers have given us an opportunity to provide products beyond our
present capability. We need to add equipment, increase our inventory, and establish marketing
and support activities.
Sales and Projections
We have had sales increase steadily over the last three years. These numbers give us a strong
reference point on which we have based our sales projection for the upcoming three fiscal years.
Our projected sales for the three years of this plan are shown in the Sales Forecast table.

Page 72
Funding Requirements
We are seeking adequate capital to enable us to expand our operation and become a major factor
in the production of chemicals in the industrial, consumer, and textile markets our signature
product is Creatine Monohydrate; we manufacture both the powdered and liquid forms. We are
the only company in the world capable of manufacturing this product in liquid form. Our market
research shows that the demand for this product alone justifies the expansion of our facilities.
5.1 Objectives
The objectives of this business plan are outlined below:
1. Sales increasing by leaps and bounds through Year 3.
2. Gross Margin the envy of the industry.
3. Net Profits increases commensurate with sales growth
5.2 Mission
We have the management team and the chemical formulations to become a major player in the
specialized niche we serve. We have developed new technology and processes that are in
demand by other chemical manufacturers as well as by major distributors who do not have the
ability to produce our specialty products. We see our mission as not only that of toll and custom
manufacturer, but as a trade supplier where we can reach the end-user market with products we
consider to be proprietary. We seek a fair and responsible profit, enough to keep the company
financially healthy for the long term and to satisfactorily compensate owners and investors for
their money and risk.
5.3 Company Summary
Granite began operations as a custom and toll chemical manufacturer. The management team
consists of a president and CEO, a vice president of operations and marketing and a physician.

Page 73
5.3.1 Company History
Beginning in June, we spent the remainder of our first year outfitting our manufacturing facility,
which included equipment installation and build-out. We became fully operational the first
quarter of our second year. Our concentration was on small lot toll manufacturing and custom
orders. In that same quarter we were approached by Customer A, LLC to become a subcontractor
for a $23 million order they had from Manufacturer A. They offered us a mirror contract to
produce Creatine Monohydrate. It was necessary for us to expand facilities to meet the
requirements and we were successful in obtaining an SBA loan through Wachovia Bank. The
loan process took 12 months and we were only able to accommodate a small part of the
Customer A order during that period through financial support from the principals. Customer
A had to have a back-up producer during this period. Unfortunately that producer failed to meet
Manufacturer A's quality standards and Customer A defaulted on the contract. This also ended
our contract.
We returned to our original plan which has continued to the present time. Our experience
with Customer A brought us to realize that the market for Creatine Monohydrate exceeds $300
million. Creatine is an FDA approved food supplement which is used by athletes and weekend
sports enthusiasts alike. More importantly, we realized that we would be the only domestic
source of this product. Proceeding from that point, and with no marketing program other than
word-of-mouth, we achieved increasing sales in the succeeding years. Our financials in this
document provide the details as well as our projections. We are convinced that this is a lucrative
market and that, with adequate equipment and marketing, we can capture a significant part of it.
5.3.2 Market Needs
Granite Industries is serving their customers with specialty industrial chemicals. The chemicals
provided will consistently be of high quality and are not widely available. Granite Industries
seeks to fulfill the following benefits that are important to their customers:
High quality- Granites chemicals are typically one of many chemicals in a customer's end
product. The need for high quality is therefore intuitive and necessary.
Consistency- Because Granite's product is just one ingredient in the customer's product,
there must be consistency in the ingredients in order to achieve the same final product,
regardless of the batch produced.
Customer Service- Exceeding the customer's expectations is an imperative. Another
element of customer satisfaction is consistent deliveries. Many of the customers employ
just-in-time (JIT) manufacturing, so shipments must arrive when they are promised,
otherwise production schedules are significantly affected.
Page 74
5.3.3 Market Trends
The chemical industry is characterized by a wide variety of companies ranging in size from the
large companies such as DuPont and Monsanto to smaller specialty firms such as ours. The
companies are generally organized by either end-use markets or product technology. In the past
decade there has been a general trend in the industry to change emphasis from chemicals to
biotechnology and pharmaceuticals. The cost of product development and the need to operate
factories at high levels of capacity have caused chemical companies of every size to outsource
parts of the chemical and manufacturing processes. This has created opportunities for smaller
companies to create and occupy niches in development and contract manufacturing. The
outsource industry providers occupy a market segment commonly identified as custom and toll
manufacturers.
The trend of outsourcing components or ingredients of the final product has occurred for the last
seven to nine years. Granite has seen no indicators to indicate that this trend will change anytime
soon.
5.3.4 Market Growth
With the proliferation of smaller companies producing chemicals for larger companies, or more
complex products, there has been a 8% industry growth rate for subcontracting. As the capital
market has been dealing with the recent Internet and capital fallout, capital has become more
scarce, particularly venture capital. The industry growth rate is forecasted to continue to grow at
the current rate.
5.4 SWOT Analysis
The following SWOT analysis captures the key strengths and weaknesses within the company,
and describes the opportunities facing Granite Industries.
Strengths
Strong relationships with vendors. Unique, cost effective manufacturing processes. Strategic alliances with many distributors.
Weaknesses
A lack of brand equity, a result of being a relatively new company. The struggle to maintain the unique manufacturing process as a trade secret. Significant research and development costs.
Page 75
Opportunities
Participation within a growing industry. Increased sales opportunities with the perfection of new chemicals or more cost effective
manufacturing techniques. The ability to increase the capture of human capital developed within the organization.
Threats
Future/ potential competition from large, multi-national chemical manufactures. A slump in the national/world economy. Unforeseen governmental regulatory actions.
Competition
In the mainstream business, channels are critical to volume. Manufacturers and distributors with
impact in the international chemical market desperately need specialty and toll manufacturers
like Granite to meet the demand. There are many specialty manufacturers, all of whom seem to
have carved out a specific niche of expertise, and upon whom these major manufacturers depend
for products. In competition, it seems that the line is drawn at the level of quality performance.
Granite has achieved that level and is recognized for a high standard of quality performance.
Companies who would seem to be competitors have subcontracted production to Granite because
they do not have the ability to supply that level of quality.
Granite has achieved another milestone in the industry by developing certain formulations that
they estimate would cost another firm $450,000 to duplicate. The Creatine Monohydrate
formulation and process is one of them. Granite Industries has the only process in the world that
can produce this supplement in liquid form. It is extremely important that the opportunity is
seized and exclusive marketing for this product begins.
Company Ownership
Granite incorporated in Delaware as a C Corporation. The company is owned in equal shares by
the five members of the management team.
ProductsOffering
Creatine Monohydrate. This is a dietary supplement commonly used by athletes to improve
strength, endurance, and muscle mass. Creatine has become the most popular body building
supplement in use today. It is sold in many forms through health food stores, drug stores, and
discount chains. The leading producers of Creatine are in Europe, and only a few recently in the
United States. The distribution system is complex, with manufacturers selling through a layered
system. We have developed a Creatine-based drink which is one-of-a-kind. We hope to begin
marketing the product in 2001. Sales potential is well over $1 million per year.
Page 76
Kelate Cu. This is a specialty product used in cosmetics. It is distributed through Distributor A
by special arrangement. Their largest customers are Estee Lauder and Revlon. We project sales
of this product to be between $140,000 and $175,000 per year.
Melasyn 100. This is a synthetic form of natural melanin. It is used as a pigment for vitiligo
preparation and as a self tanning agent. It is water soluble, which makes it easy to formulate in
cosmetic preparations. We are working with Customer A to supply this product to Distributor A.
We project sales of $250,000 in 2001.
G-REZ DB. This is a specialty coating material used on industrial buffing pads. We developed
the product at the request of the Customer C and sales can reach $300,000 in 2001.
Becrosan 2128A. This is a corrosion inhibitor with a bright future. Similar chemistry has been
very successful in Europe for several years. We have manufactured this product on a toll
arrangement for Customer B at a level of $65,000 per year. With marketing, we estimate the
potential to be $260,000.
Ion Exchange Resins. We provide a toll drying service for Customer D at a level of $35,000 per
year. We feel this can increase substantially with additional equipment.
Recrystallized Flavoring Product A. This is a crude Flavor A extract. We purify the extract
into an edible grade flavoring using our proprietary recrystallization process. It is then used in
both food and tobacco industries. We teamed with Distributor B, the world's largest distributor of
Flavor A, to develop the process. Broker A is the broker. Estimated sales based on current
demand levels are $75,000 in 2001.
Keys to Success
The following variables are the keys to success:
Meeting market demands. Consistent and high quality products. Superior customer service.
Critical Issues
The critical issues that Granite faces are:
Pursue controlled growth that dictates that payroll expenses will never exceed sales revenue. Constantly monitor customer satisfaction, ensuring that the growth strategy will never
compromise service and satisfaction levels.
Page 77
Market Analysis Summary
We are a highly technical niche player with a specialized product line that is in great demand.
Our target markets are the distributors who have established relationships with speciality
products firms, textile chemical companies, and consumer products outlets. We are essentially
the manufacturing arm for these distributors and can provide development services, as well as
products for them.
Marketing Strategy
Granite addresses the market through three business segments: industrial products, consumer
products, and textile chemicals. Granite is a highly technical niche player who has developed
strong alliances with distributors who have powerful channel relationships but lack
manufacturing or product development capabilities.
The marketing strategy assumes that Granite will serve these distributors in three ways:
Toll Manufacturers, customer provides the raw materials and the formulation and we mix
to their specifications.
Custom Manufacturers, customers may provide materials but Granite provides the
formulation and the processes.
Trade Supplier, Granite develops and sells their own lines of products based on industry
and customer needs.
5.5 Market Segmentation
Our market is divided into three segments:
Industrial Products: In this segment our customers include Customer B, Customer D and Distributor A.
Consumer Products: Handled primarily through distributors. Textile Products: Customers are: Customer E, Customer C, Customer F and Customer G.
Mission
Granite Industries' mission is to provide the highest quality, lowest cost specialty chemicals for
the chemical industry. We exist to attract and maintain customers. With the strict adherence to
this maxim and scrutinized financial controls, success will be ensured. Our products will exceed
the expectations of our customers.
Page 78
Marketing Objectives
1. Maintain, steady, sustainable growth each quarter. 2. Continue to increase market penetration by 1.5% per quarter. 3. Increase brand awareness of Granite and its superior products and service.
Financial Objectives
1. Never decrease research and development relative to sales levels. 2. Continue to generate manufacturing efficiencies, helping expand the profit margin. 3. Attempt to decrease overhead costs as a percentage of revenue.
Target Markets
Our market is divided into three segments:
Industrial Products: In this segment our customers include Customer B, Customer D and Distributor A.
Consumer Products: Handled primarily through distributors. Textile Products: Customers are: Customer E, Customer C, Customer F and Customer G.
Positioning
Granite Industries will position themselves as a premier niche chemical manufacturer for the
chemical industry. This positioning will be achieved by leveraging Granite's competitive edge is
in the formulations and manufacturing processes that has been developed for the production of
the seven specialized products. This has created a sustainable competitive advantage relative to
the other industry participants.
Strategies
The single objective that Granite faces is to position themselves as the premier niche chemical
supplier, continually increasing market share. The market strategy will seek to generate brand
awareness and build the customer base.
The message that Granite Industries will seek to communicate is that they are the highest quality,
most customer service orientated specialty chemical supplier in the industry. This message will
be communicated through several methods:
1. Advertisements- They will be placed in trade journals.
2. Networking/ Lobbying- It takes significant effort and contacts to generate large, long
term contracts.
Page 79
3. Trade show participation- These activities could be grouped under the
networking/lobbying, however they will be separated in order to more accurately
highlight the expenses.
Marketing Mix
Granite Industries' marketing mix is comprised of the following approaches to pricing,
distribution, advertising and promotion, and customer service.
Pricing- The pricing structures are totally flexible, ranging from per unit costs, to
developmental costs, to futures.
Distribution- Granite's products can be distributed anywhere.
Advertising and Promotion- Several different strategies will be undertaken to accomplish
the advertising and promotion goals.
Customer Service- Superior customer service is imperative. Several non-industry
companies, such as L.L. Bean, Northstroms, and Siemens will be benchmarked to
achieve this lofty but necessary goal.
Marketing Research
Throughout Granite Industries existence, there has been an ongoing campaign to collect market
research. Granite has dedicated one full time employee and three graduate student interns to
collect valuable market research.
5.6 Target Market Segment Strategy
Consumer Market: This is potentially our biggest market for Creatine Monohydrate; it is
limited only by our ability to produce. We have distributors who are begging for the product and
we have back orders now, so it is only logical that we will devote most of our time meeting this
demand. We look at the potential in this market as the basis for our growth.
Industrial Products: Here, we are selling both through distributors as well as direct to
manufacturers. This is an untapped market and has been sustained by our reputation and ability
to meet formulation criteria. We know that a marketing effort in this segment will produce sales
that could quite possibly bring this segment to an equal level with the consumer market.
Textile Products: We have enough experience within this segment to know that once our
manufacturing capability is up and running we could actually devote an entire marketing effort to
this segment alone. Both our toll and custom manufacturing capability is strategically attractive
to all textile manufacturers, including growing markets outside the U.S.
Page 80
5.7 Industry Analysis
The chemical industry is characterized by a wide variety of companies ranging in size from the
large companies such as DuPont and Monsanto to smaller specialty firms such as ours. The
companies are generally organized by either end-use markets or product technology. In the past
decade there has been a general trend in the industry to change emphasis from chemicals to
biotechnology and pharmaceuticals. The cost of product development and the need to operate
factories at high levels of capacity have caused chemical companies of every size to outsource
parts of the chemical and manufacturing processes. This has created opportunities for smaller
companies to create and occupy niches in development and contract manufacturing. The
outsource industry providers occupy a market segment commonly identified as custom and toll
manufacturers.
5.7.1 Competition and Buying Patterns
In the mainstream business, channels are critical to volume. Manufacturers and distributors with
impact in the international chemical market desperately need speciality and toll manufacturers
like us to meet the demand. There are many specialty manufacturers, all of whom seem to have
carved out a specific niche of expertise, and upon whom these major manufacturers depend for
products. In competition, it seems that the line is drawn at the level of quality performance. We
have achieved that level and are recognized for a high standard of quality performance.
Companies who would seem to be our competition have subcontracted production to us because
they do not have the ability to supply that level of quality.
We have achieved another milestone in the industry by developing certain formulations which
we estimate would cost another firm $450,000 to duplicate. The Creatine Monohydrate
formulation and process is one of them. We have the only process in the world that can produce
this supplement in liquid form. It is extremely important that we seize this opportunity and begin
to exclusively market this product.
5.7.2 Strategy and Implementation Summary
We address the market through three business segments: speciality products, textile chemicals,
and consumer products. We are a highly technical niche player who has developed strong
alliances with distributors who have powerful channel relationships but lack manufacturing or
product development capabilities.

Page 81
Our marketing strategy assumes that we will serve these distributors in three ways:
Toll Manufacturers, where our customer provides the raw materials and the formulation and we mix to his/her specifications.
Custom Manufacturers, where our customer may provide materials but we provide the formulation and the processes.
Trade Supplier, where we develop and sell our own lines of products based on industry and customer needs.
.
5.8 Sales Strategy
Our sales strategy is outlined below in three phases.
Phase One is to accommodate our existing customers and to make sure that current orders and subsequent orders are maintained.
Phase Two will commence when our facilities are expanded. We will then be able to accept new clients and contact companies who have shown interest in our products and be able to accommodate their orders.We plan to hire a high-quality sales person to assist in defining our marketing program.
Both phase one and two will primarily be toll and custom manufacturing.
Phase Three will begin with the hiring of two additional sales representatives who will develop our end-user program wherein we will begin to sell our own product lines.
5.8.1 Sales Forecast
Our sales forecast assumes no significant change in costs or prices, which is a reasonable
assumption for the past two years.
Our sales increased from 1997 to 1999. We anticipate a slight drop in 2000 due to financial
constraints. All of these sales were without the benefit of a marketing program. We feel that with
a good marketing program and adequate manufacturing facilities we can achieve substantially
increased sales goals in 2001 and 2002. While this seems ambitious, we rely on our distributors'
projections and based on that, we know we will be able to literally sell to the production capacity
of our manufacturing facilities.
Page 82
5.9 Milestones
The following table shows specific milestones, with responsibilities assigned, dates, and budgets.
We are focusing, in this plan, on a few key milestones that can be accomplished. In addition,
shortly following funding we will hire a vice president of marketing and two office personnel.
Plant personnel will be added as equipment and facilities are operational.
Management Summary
We have a strong management team that can boast of over 30 years experience in technical and
management expertise. Each member has a specific contribution. The president and CEO has
spent 20 years working in the chemical industry, and is adept at expanding companies that are
well-grounded, but lacking in funding. The vice president of Granite is a specialist in consulting
for small business on strategic planning and growth programs. And the final member of the team
contributes expertise in start-ups among the pharmaceutical industry. Together, this team has a
proven background of expertise and is more than capable of transforming Granite into a leading
specialty chemical manufacturer.
5.10 Personnel Plan
Our present plan is to immediately bring two people into the manufacturing operation, followed
by an additional two or three throughout the next year. We need to begin looking for a capable
marketing professional who has a background in chemical sales. We would like to bring that
person on board mid 2001. Followed by one or two sales representatives with both interpersonal
and telephone marketing skills. We will also employ support personnel as required.
Personnel Plan
FY 2001 FY 2002 FY 2003
Manufacturing $214,026 $220,000 $230,000
Sales $15,000 $30,000 $80,000
Page 83
Financial Plan
We plan to support our growth and debt obligations through increased sales and cash flow. Our
major debt with Wachovia Bank is secured by personal and company collateral. Our financials
do not include our estimate of the value of proprietary chemical formulations, nor the value of
assignable customer contracts.
5.11 Break-even Analysis
Our Break-even Analysis is based on running costs, the "burn rate" costs we incur to keep the
business running, not on theoretical fixed costs that would be relevant only if we were closing.
Between payroll, rent, utilities, and other basic day to day costs, we think the monthly figure
shown below is a good estimate of fixed costs. Our average variable costs are shown as well. Our
COS will be approximately 44% of sales, and we anticipate a healthy profit margin before taxes
and debt service in 2001, increasing in 2002.
Our assumptions in average unit sales and average cost per kilogram depend on averaging. We
do not really need to calculate an exact average because this is sufficiently close to help us to
understand what the real break-even point will be.
Sales Forecast
The sales strategy is outlined below in three phases.
Phase One is to accommodate existing customers and to make sure that current orders and subsequent orders are maintained.
Phase Two will commence when the facilities are expanded. Granite will then be able to accept new clients and contact companies who have shown interest in the products and be able to accommodate their orders. Granite plans to hire a high-quality sales person to assist in defining our marketing program.
Both phase one and two will primarily be toll and custom manufacturing.
Phase Three will begin with the hiring of two additional sales representatives who will develop the end-user program.
The sales forecast assumes no significant change in costs or prices, which is a reasonable
assumption for the past two years.
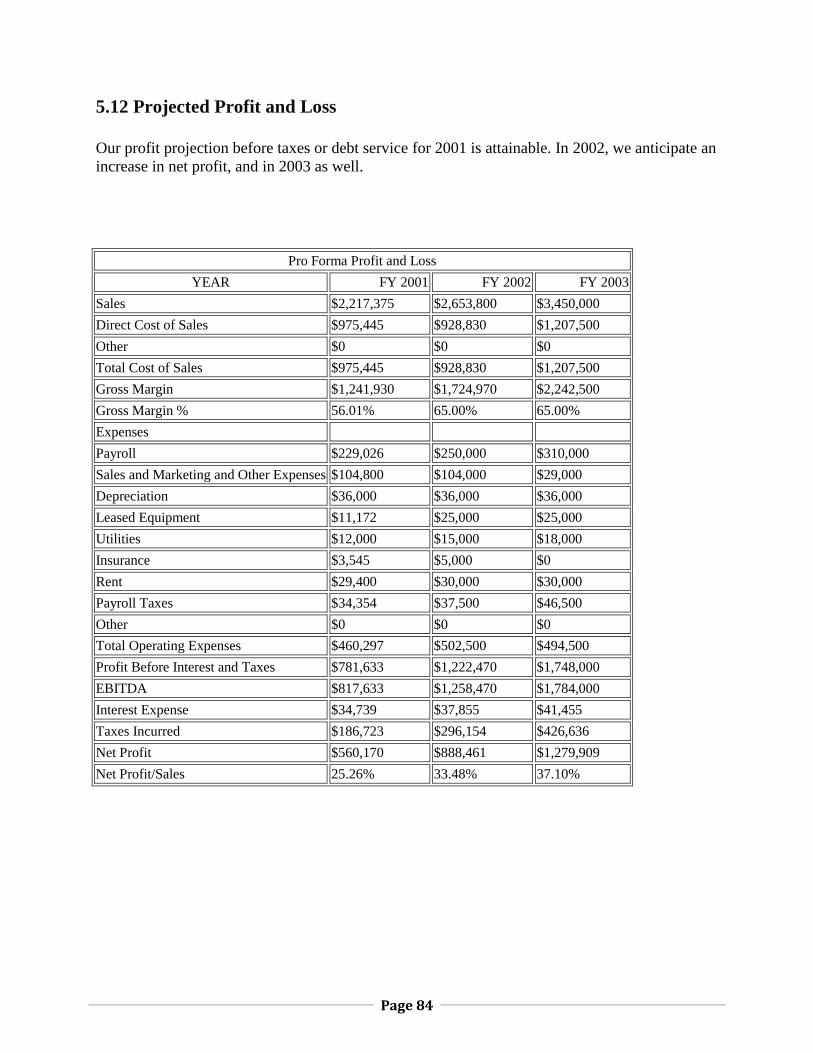
Page 84
5.12 Projected Profit and Loss
Our profit projection before taxes or debt service for 2001 is attainable. In 2002, we anticipate an
increase in net profit, and in 2003 as well.
Pro Forma Profit and Loss
YEAR FY 2001 FY 2002 FY 2003
Sales $2,217,375 $2,653,800 $3,450,000
Direct Cost of Sales $975,445 $928,830 $1,207,500
Other $0 $0 $0
Total Cost of Sales $975,445 $928,830 $1,207,500
Gross Margin $1,241,930 $1,724,970 $2,242,500
Gross Margin % 56.01% 65.00% 65.00%
Expenses
Payroll $229,026 $250,000 $310,000
Sales and Marketing and Other Expenses $104,800 $104,000 $29,000
Depreciation $36,000 $36,000 $36,000
Leased Equipment $11,172 $25,000 $25,000
Utilities $12,000 $15,000 $18,000
Insurance $3,545 $5,000 $0
Rent $29,400 $30,000 $30,000
Payroll Taxes $34,354 $37,500 $46,500
Other $0 $0 $0
Total Operating Expenses $460,297 $502,500 $494,500
Profit Before Interest and Taxes $781,633 $1,222,470 $1,748,000
EBITDA $817,633 $1,258,470 $1,784,000
Interest Expense $34,739 $37,855 $41,455
Taxes Incurred $186,723 $296,154 $426,636
Net Profit $560,170 $888,461 $1,279,909
Net Profit/Sales 25.26% 33.48% 37.10%
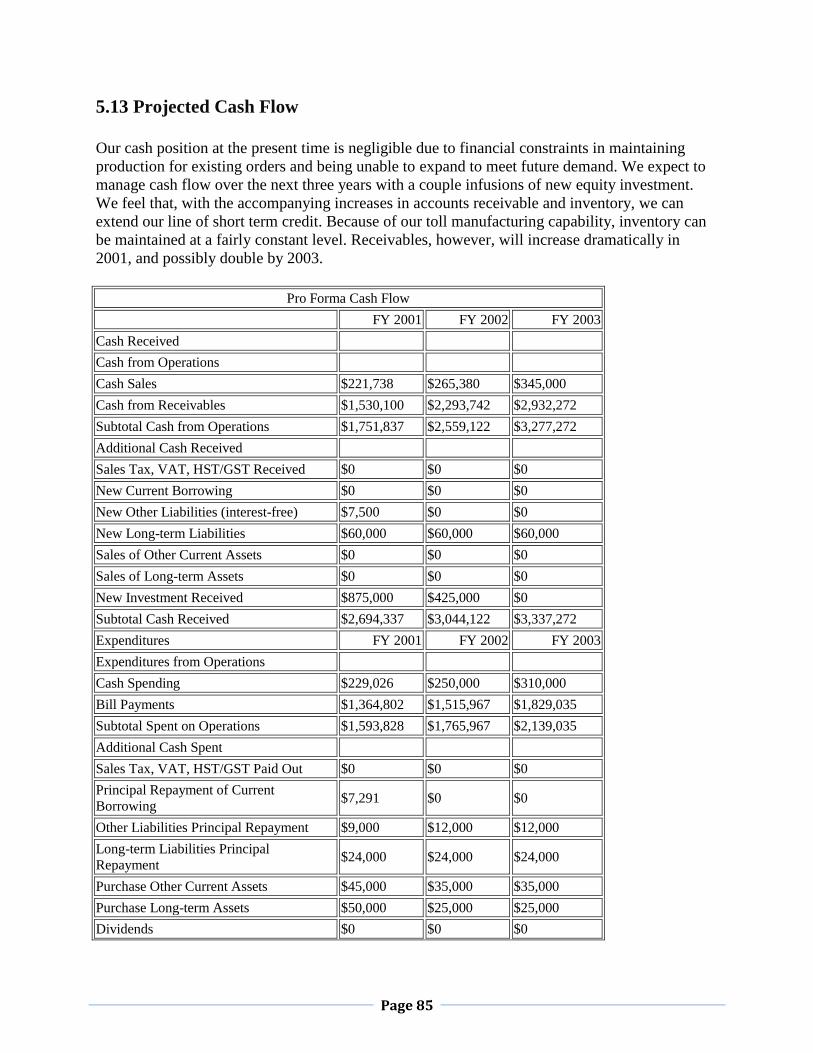
Page 85
5.13 Projected Cash Flow
Our cash position at the present time is negligible due to financial constraints in maintaining
production for existing orders and being unable to expand to meet future demand. We expect to
manage cash flow over the next three years with a couple infusions of new equity investment.
We feel that, with the accompanying increases in accounts receivable and inventory, we can
extend our line of short term credit. Because of our toll manufacturing capability, inventory can
be maintained at a fairly constant level. Receivables, however, will increase dramatically in
2001, and possibly double by 2003.
Pro Forma Cash Flow
FY 2001 FY 2002 FY 2003
Cash Received
Cash from Operations
Cash Sales $221,738 $265,380 $345,000
Cash from Receivables $1,530,100 $2,293,742 $2,932,272
Subtotal Cash from Operations $1,751,837 $2,559,122 $3,277,272
Additional Cash Received
Sales Tax, VAT, HST/GST Received $0 $0 $0
New Current Borrowing $0 $0 $0
New Other Liabilities (interest-free) $7,500 $0 $0
New Long-term Liabilities $60,000 $60,000 $60,000
Sales of Other Current Assets $0 $0 $0
Sales of Long-term Assets $0 $0 $0
New Investment Received $875,000 $425,000 $0
Subtotal Cash Received $2,694,337 $3,044,122 $3,337,272
Expenditures FY 2001 FY 2002 FY 2003
Expenditures from Operations
Cash Spending $229,026 $250,000 $310,000
Bill Payments $1,364,802 $1,515,967 $1,829,035
Subtotal Spent on Operations $1,593,828 $1,765,967 $2,139,035
Additional Cash Spent
Sales Tax, VAT, HST/GST Paid Out $0 $0 $0
Principal Repayment of Current
Borrowing $7,291 $0 $0
Other Liabilities Principal Repayment $9,000 $12,000 $12,000
Long-term Liabilities Principal
Repayment $24,000 $24,000 $24,000
Purchase Other Current Assets $45,000 $35,000 $35,000
Purchase Long-term Assets $50,000 $25,000 $25,000
Dividends $0 $0 $0
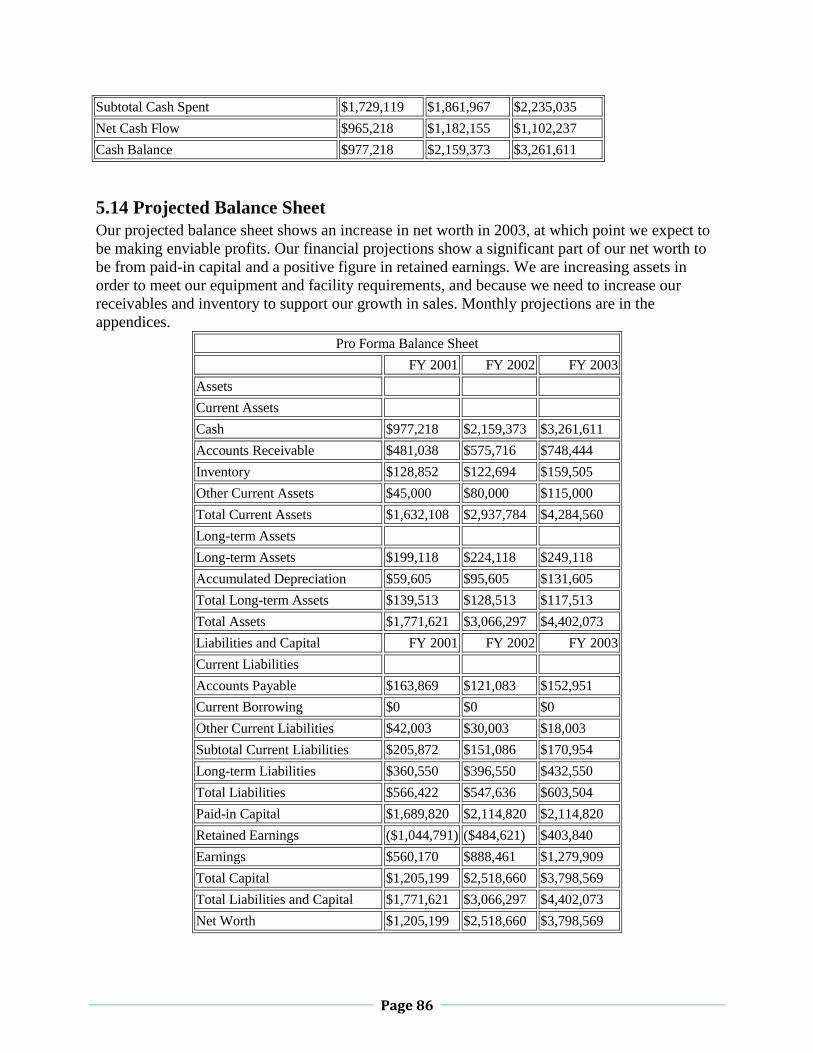
Page 86
Subtotal Cash Spent $1,729,119 $1,861,967 $2,235,035
Net Cash Flow $965,218 $1,182,155 $1,102,237
Cash Balance $977,218 $2,159,373 $3,261,611
5.14 Projected Balance Sheet
Our projected balance sheet shows an increase in net worth in 2003, at which point we expect to
be making enviable profits. Our financial projections show a significant part of our net worth to
be from paid-in capital and a positive figure in retained earnings. We are increasing assets in
order to meet our equipment and facility requirements, and because we need to increase our
receivables and inventory to support our growth in sales. Monthly projections are in the
appendices.
Pro Forma Balance Sheet
FY 2001 FY 2002 FY 2003
Assets
Current Assets
Cash $977,218 $2,159,373 $3,261,611
Accounts Receivable $481,038 $575,716 $748,444
Inventory $128,852 $122,694 $159,505
Other Current Assets $45,000 $80,000 $115,000
Total Current Assets $1,632,108 $2,937,784 $4,284,560
Long-term Assets
Long-term Assets $199,118 $224,118 $249,118
Accumulated Depreciation $59,605 $95,605 $131,605
Total Long-term Assets $139,513 $128,513 $117,513
Total Assets $1,771,621 $3,066,297 $4,402,073
Liabilities and Capital FY 2001 FY 2002 FY 2003
Current Liabilities
Accounts Payable $163,869 $121,083 $152,951
Current Borrowing $0 $0 $0
Other Current Liabilities $42,003 $30,003 $18,003
Subtotal Current Liabilities $205,872 $151,086 $170,954
Long-term Liabilities $360,550 $396,550 $432,550
Total Liabilities $566,422 $547,636 $603,504
Paid-in Capital $1,689,820 $2,114,820 $2,114,820
Retained Earnings ($1,044,791) ($484,621) $403,840
Earnings $560,170 $888,461 $1,279,909
Total Capital $1,205,199 $2,518,660 $3,798,569
Total Liabilities and Capital $1,771,621 $3,066,297 $4,402,073
Net Worth $1,205,199 $2,518,660 $3,798,569
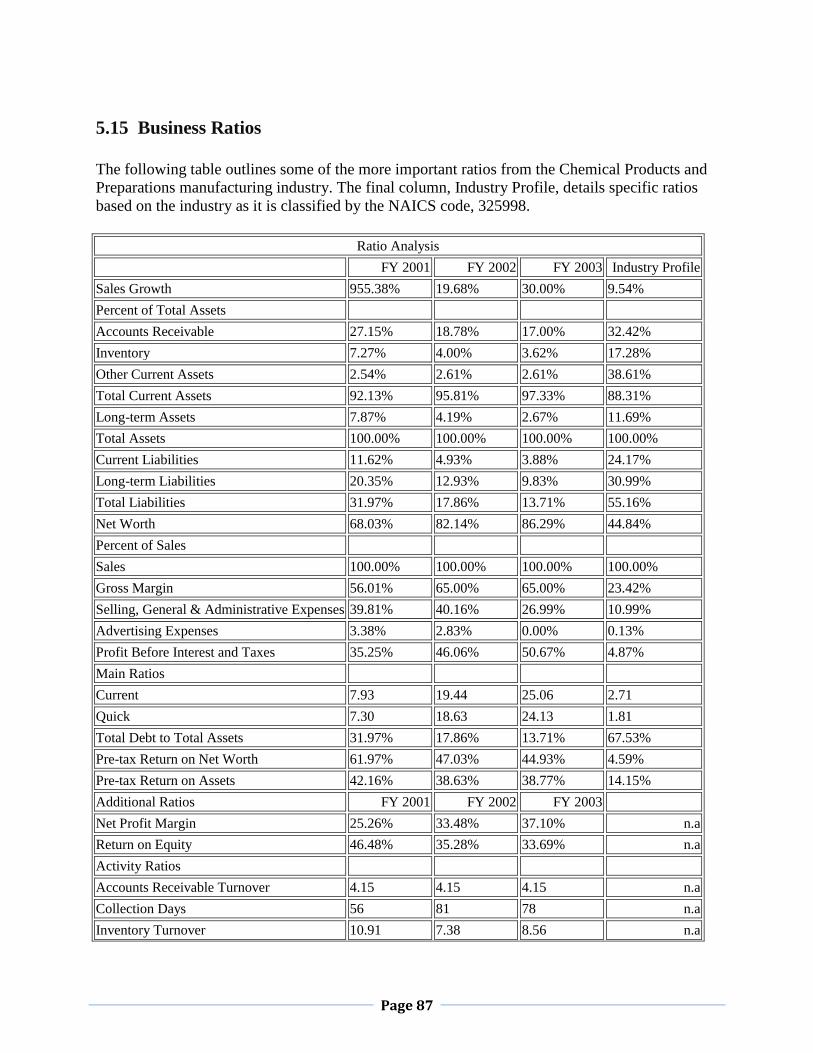
Page 87
5.15 Business Ratios
The following table outlines some of the more important ratios from the Chemical Products and
Preparations manufacturing industry. The final column, Industry Profile, details specific ratios
based on the industry as it is classified by the NAICS code, 325998.
Ratio Analysis
FY 2001 FY 2002 FY 2003 Industry Profile
Sales Growth 955.38% 19.68% 30.00% 9.54%
Percent of Total Assets
Accounts Receivable 27.15% 18.78% 17.00% 32.42%
Inventory 7.27% 4.00% 3.62% 17.28%
Other Current Assets 2.54% 2.61% 2.61% 38.61%
Total Current Assets 92.13% 95.81% 97.33% 88.31%
Long-term Assets 7.87% 4.19% 2.67% 11.69%
Total Assets 100.00% 100.00% 100.00% 100.00%
Current Liabilities 11.62% 4.93% 3.88% 24.17%
Long-term Liabilities 20.35% 12.93% 9.83% 30.99%
Total Liabilities 31.97% 17.86% 13.71% 55.16%
Net Worth 68.03% 82.14% 86.29% 44.84%
Percent of Sales
Sales 100.00% 100.00% 100.00% 100.00%
Gross Margin 56.01% 65.00% 65.00% 23.42%
Selling, General & Administrative Expenses 39.81% 40.16% 26.99% 10.99%
Advertising Expenses 3.38% 2.83% 0.00% 0.13%
Profit Before Interest and Taxes 35.25% 46.06% 50.67% 4.87%
Main Ratios
Current 7.93 19.44 25.06 2.71
Quick 7.30 18.63 24.13 1.81
Total Debt to Total Assets 31.97% 17.86% 13.71% 67.53%
Pre-tax Return on Net Worth 61.97% 47.03% 44.93% 4.59%
Pre-tax Return on Assets 42.16% 38.63% 38.77% 14.15%
Additional Ratios FY 2001 FY 2002 FY 2003
Net Profit Margin 25.26% 33.48% 37.10% n.a
Return on Equity 46.48% 35.28% 33.69% n.a
Activity Ratios
Accounts Receivable Turnover 4.15 4.15 4.15 n.a
Collection Days 56 81 78 n.a
Inventory Turnover 10.91 7.38 8.56 n.a
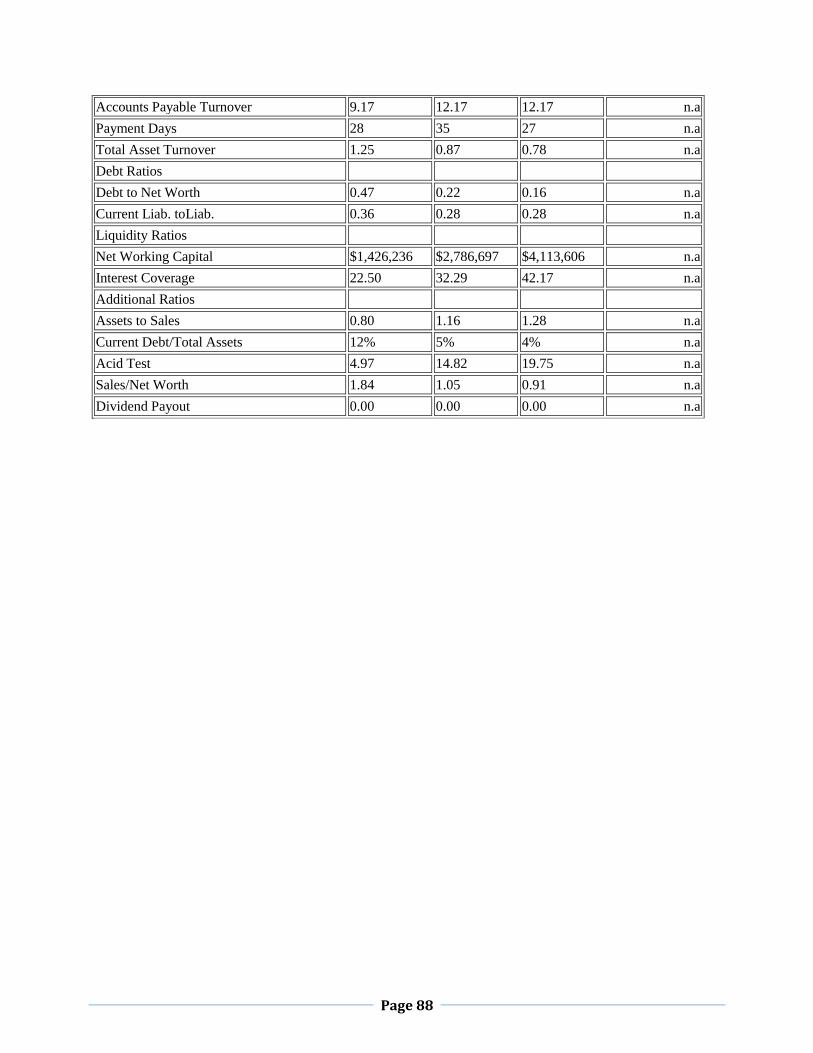
Page 88
Accounts Payable Turnover 9.17 12.17 12.17 n.a
Payment Days 28 35 27 n.a
Total Asset Turnover 1.25 0.87 0.78 n.a
Debt Ratios
Debt to Net Worth 0.47 0.22 0.16 n.a
Current Liab. toLiab. 0.36 0.28 0.28 n.a
Liquidity Ratios
Net Working Capital $1,426,236 $2,786,697 $4,113,606 n.a
Interest Coverage 22.50 32.29 42.17 n.a
Additional Ratios
Assets to Sales 0.80 1.16 1.28 n.a
Current Debt/Total Assets 12% 5% 4% n.a
Acid Test 4.97 14.82 19.75 n.a
Sales/Net Worth 1.84 1.05 0.91 n.a
Dividend Payout 0.00 0.00 0.00 n.a

Page 89
CHAPTER : 6
CONCLUSION

Page 90
Indian chemical industry has come a long way. Today, India has significant presence in
production of basic organic and inorganic chemicals, pesticides, paints, dyestuffs and
intermediates, petrochemicals, fine and specialty chemicals, cosmetic and toiletry product
segments. Thus, by virtue of its diversity, the chemical industry bears a close correlation not only
with the quantum of overall economic growth but also with the contents and quality of growth.
On the one hand, the range of products of the industry’s constituent segments are used in most
productive activities, and on the other, the chemical industry’s diversity relates to the pattern of
demand to the changing standards of living. Specific to mention is the significant contribution of
Indian chemical industry for the growth of India’s agriculture and healthcare sectors.
The performance and outlook of the chemical industry, particularly in the context of India’s
development process, depends upon and determines the trends in the overall economy, as also
the linkages with the rest of the world in terms of international trade, investment flows and
technology transfers. On the domestic front, with the reduction in tariffs, Indian chemical
companies with strong systems and organized operations are likely to be benefited further.
Companies with competitive advantages, like having competence in the areas of high value
added chemicals, conforming to international quality standards, could translate their capabilities
and establish a dominant presence in both international and domestic markets.
In the years to come, various new avenues are likely to arise in chemical industry like structural
transformation, strategic marketing alliances with multinationals and trading companies for
domestic sales and exports, stricter enforcement of good manufacturing practices, opportunity
for value addition using contract manufacturing or contract research.
Use of advanced technology, strong research capabilities, backward and forward linkages and
development of domestic capacity to reduce dependence on importedraw materials are key
success factors for Indian chemical industry. In addition, safety, health and environment
protection issues are becoming important challenges for the Indian chemical industry. Indian
manufacturers are addressing such challenges in an organized way.
Indian chemical industry has major strengths in basic research facilities available with CSIR
laboratories such as National Chemical Laboratory, Indian Institute of Chemical Technology, as
also corporate R&D centers. This ensures that development of process know- how, plant process
Page 91
design, detailed engineering design, commissioning assistance and even consultancy for re-
engineering are available at low cost.
The need for globalization has made many Indian chemical companies enter into strategic
alliances or merge operations to achieve economies of scale. Foreign collaboration is also
bringing solutions for clean technology, process consultancy, feedstock linkages, R&D, waste
management,safe manufacture and environmental protection. In addition, Indian chemical
companies are attempting to achieve global standards by improving productivity through various
measures such as better raw material utilization, bi-product reduction and use, energy reduction
and conservation, effluent management, water management, up gradation of plant and
equipment, skill development.
The International Council of Chemical Associations (ICCA), an association representing 80% of
the world manufacturers of chemicals has reiterated its support for a new round of multilateral
trade negotiations in the World Trade Organization. ICCA’s priorities include elimination of
chemical tariffs by the year 2010, harmonization of anti-dumping practices, simplification of
customs procedures and full implementation of TRIPs agreement. While the harmonization of
anti- dumping practices would benefit developing countries like India, the tariff-free world
would pose stiff competition.
Page 92
Recommendations
The following section lists down the key recommendations and levers which stakeholders such
as industry, government and academia can use to overcome the challenges faced by the domestic
chemical industry
1. Improve infrastructure
There is an urgent need to build better infrastructure and provide adequate power/ water to
support industrial growth of chemicals. Infrastructure is inadequate with respect to safe
transportation of products as well as proper goods storage and exports. Significant investments
are needed in roads, railways, waterways, ports, warehouses etc. to support the overall industrial
growth in India. Various levers could be explored to provide adequate infrastructure to the
chemical industry
a. PPP model for building necessary infrastructure, especially for ports and roads
b. Availability of finance to improve infrastructural facilities for SMEs: Setting up of an
Empowered Group of Ministers (EGoM) has worked well in recent years to coordinate with
states. The EGoM would be empowered to resolve infrastructure and other regular industry
issues. It could expedite large scale infrastructure projects, especially those involving multiple
states
c. Creation of cluster/ inter-linkages map: An all India chemical cluster map could be formed
highlighting linkages with roads to pipelines, effluent treatment plants, power, utilities, etc.
d. Making the Petroleum, Chemicals and Petrochemicals Investment Regions (PCPIRs) more
effective and encouraging additional investments in already planned PCPIRs
i. Infrastructure such as roads and ports near the SEZs/ PCPIRs could be developed.
ii. Anchor companies could undertake responsibility to make raw material available for
downstream units in the cluster, thereby facilitating integration of the entire value chain
iii. A site operator with the right functional expertise should be appointed to market and manage
each PCPIR. The site operator will be responsible for establishing comprehensive services and
Page 93
marketing of the site to potential manufacturers to ensure timely participation from companies in
the PCPIR. The site operator could be a joint venture with any of the top 10 EPC players in India
and/or any of the experienced global chemical infrastructure service providers (e.g., Infraserv,
Currenta, Infracor) with relevant functional expertise.
e. Facilitating land acquisition: Land acquisition is another roadblock faced by the private sector
in setting up new infrastructure. States/ Centre have adequate capability to resolve the issue by
coming together to develop a common policy for land acquisition and identify/ earmark areas for
green-field plants
f. Pooling of common infrastructure at existing clusters
i. Industry can benefit from common production and distribution infrastructure for industries
with similar characteristics and complementary requirements
ii. Government could encourage development of clusters around the large existing plants by
extending benefits similar to those provided to PCPIRs.
2. Ensure feedstock availability
a. Encourage “Consortium Cracker” project: Every PCPIR must have a cracker which produces
all the building blocks. Government could endorse a consortium cracker project
b. Export of surplus naphtha from the country should be dis-incentivized. Investment to use
naphtha in the country must be incentivized.
c. Government could facilitate industry to participate in securing feedstock and mining rights (for
coal) from gas and oil rich countries, such as in Middle East and Russia and coal rich countries,
like Indonesia, South Africa, and Australia, respectively. PSU’s may set up refineries in oil-rich
countries & supply the feedstock back to India for domestic industry for further conversion into
value added products. Similar approach could also be adopted for inorganic feedstocks such as
Sulfur, Rock Phosphate and Potassium Chloride. Initiation of Govt. to Govt. agreements for
longterm supply of basic minerals at competitive prices could be considered and may involve
setting up infrastructure in those countries.

Page 94
d. Certain technologies which are capital intensive require support from the government by way
of long term steady policies and fund support, such as Coal gasification (simultaneously
production of power and fertilizer based on coal gasification) and Coal to Methanol/ Olefins/
Acetic Acid
e. Government and industry could develop strategies for allocation of feedstocks to best suited
products (Gas for fertilizers, Coal for power, Naphtha for petrochemicals)
f. For better processing and value addition to feedstocks it is necessary that India develops better
catalysts and processes. The government could consider the option of spinning of research
centers such as those belonging to PSUs into autonomous research centers. The current research
centers such as IIP and CSIR units such as NCL need to be made more focused and strengthened
in resources.
g. Government must ensure supply of Ethylene Oxide (EO) and mandate stringent manufacturing
standards for EO. The anchor petrochemical tenant in the PCPIR should put up an EO plant to
cater to the aggregated demand (25 to 50 per cent of a typical EO plant capacity). The additional
EO requirement by the specialty chemical industry by 2020 will be around 260,000 TPA, which
could comfortably support 1 to 2 EO plants and/or multiple EO derivatives plants within the
PCPIRs.
3. Provide support for new technologies and establish technology up-gradation fund (TUF)
a. To promote investments in R&D and green technologies, fiscal incentives such as accelerated
depreciation, tax benefits, subsidies etc. could be provided
b. Promote investments in alternate technologies such as coal to methanol. This will help
leverage India’s coal reserves and promote investments in formaldehyde, MTBE, DMT, DME
etc.
c. A technology up-gradation fund (similar to textiles) should be set up for chemicals. A fund
size of Rs. 500 Crore for the XIIth plan period is proposed.

Page 95
4. Implement the 6-point plan for strengthening R&D
a. Establish chemical sector council for innovation having representatives from the government,
chemical companies, industry associations and reputed research/ educational institutes (e.g.,
NCL, ICT)
b. Establish an autonomous USD 100 million chemical innovation fund by securing 10% of the
total inclusive national innovation fund set up by the National Innovation Council to encourage
commercialization efforts for innovations generating inclusive growth
c. Develop three regional clusters and two innovation centers in universities dedicated to
chemical industry
d. Sign international collaboration agreements with Germany and Singapore which could be
good partners for India to learn and develop capabilities in chemical product and process
innovation. Both of these countries have world class examples of large scale chemical parks
(e.g., Ludwigshafen in Germany, Jurong in Singapore) with integrated infrastructure, knowledge
management and R&D facilities; India can benefit significantly from their experience while
establishing PCPIRs
e. Launch an outreach program with the target of building a chemical innovation eco-system
between several constituents like innovators, venture capitalists, research institutes, companies
and industry associations.
f. Chemical Innovation Council shall recommend and help government in creation of dedicated
fast track court to handle IP issues and enable stricter enforcement of IP rights, which will
significantly reduce the time required for judicial dispositions.

Page 96
5. Set-up talent development infrastructure
a. India will need over 14,000 highly skilled, chemical engineers within the next decade to join
the specialty chemical industry alone. A potential short fall of 8,000 to 10,000 chemical
engineers is indicated driven by limited talent from Tier 1 universities and lack of attractiveness
of the chemical sector for employment. To resolve this shortfall, the industry must improve the
value proposition for chemical engineers while the Government should work in collaboration
with industries toupgrade the current chemical departments in Tier 2 universities to become
state- of-the-art departments (in terms of infrastructure, faculty qualifications, industry
interaction, and administration)
b. To meet the future demand, 1,000 new ITIs, vocational training institutes and diploma
institutes should be set up
c. Government could set up specialized universities, vocational training institutes and develop
skill base. Institutes could be set up closer to clusters and government could provide rebate on
training & development as given for R&D. Corporates could be incentivized to engage trainees/
students from these institutes on projects to provide industry exposure. This could lead to a
closer bonding between industry and academia which has been observed as a best practice
followed by China and lead to the development of indigenous technology and intellectual
property.
6. Improve image of the industry
a. Government could provide incentives for bio-based raw materials to reduce dependence on
crude oil, encourage companies to seek “Responsible Care Certification” and facilitate priority
loans to those who meet environment norms
b. Providing greater autonomy to Pollution Control Boards (PCBs) for stricter enforcement could
be considered.
c. A fund of Rs 25 Crore is proposed for promotional activities for the Chemical Promotion and
Development Scheme which includes holding of various events such as India Chem and holding
international and national conferences etc. for development and promotion of chemical industry.

Page 97
7. Consolidate acts into an Integrated Chemical Legislation, simplify regulatory structure
and strengthen regulations
a. It will be expedient in the interest of development of chemical industry to consolidate multiple
legislations governing the chemical industry into one Integrated Chemical Legislation. This
legislation should cover the entire life cycle of chemicals. This will act as REACH like
legislation for safe use of chemicals for protection of human health & environment.
b. There has to be a system of positive incentives for compliant industries. The best way could be
to use the internationally recognized measures of excellence forchemical company performance
in environment, safety, health, community perception: viz “Responsible Care Certification”; and
encourage companies with such certification through star rating and fast track clearance for
expansions, product diversification etc.
c. Government should expedite swift implementation of GST to lower transaction costs and
avoid cascading of taxes; involvement of states in policy formulation should be encouraged, e.g.
Central government constituted empowered committee of state finance ministers led to smoother
and faster VAT implementation
d. Government should also focus on removing redundancy associated with multiple regulatory
bodies (e.g. crop protection comes under Dept. of Chemicals, Ministry of Agriculture & Health
Ministry) and simplifying registration approval procedures, especially for pharmaceuticals and
agrochemicals.
Page 98
8. Rationalize taxes and duties
a. Feedstocks and basic building blocks for the downstream chemical products should be
preferably at zero duty. This should be followed by slightly higher duty for primary chemicals,
still higher for secondary chemicals and still higher for final products/ chemicals, to provide an
opportunity for value addition and also provide adequate competitive protection. Example,
Naphtha which is a basic feedstock, should have zero duty, followed by slightly higher duty for
primary products like Ethylene, Propylene, Butadiene etc. and still higher duty for secondary
products like polyethylene, polypropylene etc.
b. Chemical industry could be granted tax and duty reductions for specific identified products
such as import duty reduction on inputs like coal, furnace oil, naphtha, etc., inclusion of a wider
range of inputs under CENVAT credit, making power cost VATable and encouraging companies
to set up captive power plants etc.
c. CENVAT and MODVAT returns process should be rationalized and made smooth; processing
of refund claims should be faster
9. Develop usage standards for chemicals
Consumption standards are policies implemented by the government to promote the safe use of
products. These standards are necessary for both improving society’s standard of living and
enhancing consumer safety. Most developed have implementedstringent consumption standards
across various end-use markets. As the economy develops, India will need to regulate products
more stringently, and strengthen consumption standards, which in turn will promote increased
usage of specialty chemicals. For e.g. limit on VOCs (volatile organic compounds) in paints.
Mandating the usage of water-based paints (that contain 5-15% petrochemicals) will help ensure
health and safety of consumers and encourage the consumption of higher cost, water based
paints.

Page 99
10. Develop India’s chemical inventory
A chemical inventory is a listing of industrial chemicals manufactured in, or imported by, a
country created from information submitted to government authorities by manufacturers,
processors, users, and/or importers. Such an inventory can allow authorities to maintain an
updated overview of chemicals marketed in their country, reveal whether substance
manufactured is used within a country or exported therefore the applicability of new research
knowledge to the country and identify risk zones to facilitate the setting of risk reduction
priorities. The government should setup a dedicated cell of 5 to 10 competent scientists and
chemical engineers to lead the development of India’s chemical inventory along with
establishing the relevant funding mechanism, infrastructure (e.g., research laboratories), and a
state-wise administrative support (e.g., the US required $2 million to set up their chemical
inventory database and $9 million to implement it). It is proposed that the government allocate a
budget of Rs 50 Crore for the establishment of the Indian chemical inventory during the XIIth
plan period. Post the setting up of the chemical inventory, the government will also need to
allocate a budget to keep the database current (e.g., the US spends $400,000 annually to maintain
their database).

Page 100
CHAPTER : 7
BIBLOGRAPHY
Page 101
Abell, D. E. Defining the Business, Prentice-Hall, Englewood Cliffs, NJ, 1980.
Ackoff, R. L. A Concept of Corporate Planning, John Wiley, New York, 1970.
Aldrich, H. Organizations and Environments, Prentice-Hall, Englewood Cliffs, NJ, 1979.
Andrews, P. W. S. ‘Industrial analysis in economics’, in Andrews, P. W. S. and T.
Wilson (eds), Oxford Studies in the Price Mechanism, Oxford University Press, Oxford,
1951.
Bain, J. S. Barriers to New Competition, Harvard University Press, Cambridge, Mass.,
1956.
Bain, J. S. Industrial Organization, second edition, Wiley, New York, 1968.
Bower, J. Managing the Resource Allocation Process, Division of Research, Harvard
Business School, Harvard University Press, 1970.
Hay, D. A. and D. J. Morris, Industrial Economics: Theory and Evidence, Oxford University
Press, Oxford, 1979.
Hayes, S. L. Ill, A. M. Spence and D. V. P. Marks, ‘Competition in the investment banking
industry’, Harvard University Press, Cambridge, Mass., 1983.
Hergert, M. ‘The incidence and implications of strategic grouping in U.S. manufacturing
industries’, unpublished doctoral dissertation, Harvard University, 1983.
Howell, R. D. and G. L. Frazier, ‘Business definition and performance’, Journal of
Marketing, 47, Spring 1983, pp. 59-67.
Huff, A. S. ‘Industry influences on strategy reformulation’, Strategic Management
Journal, 3(2), April-June 1982, pp. 119-131.
Websites
Www.Capitaline.com
Www.Proquest.com
Www.nse.com
Www.Bse.com
Www.moneymarket.com