Macquarie Telecom Annual Report 2010 For personal use · PDF fileon providing secure,...
72
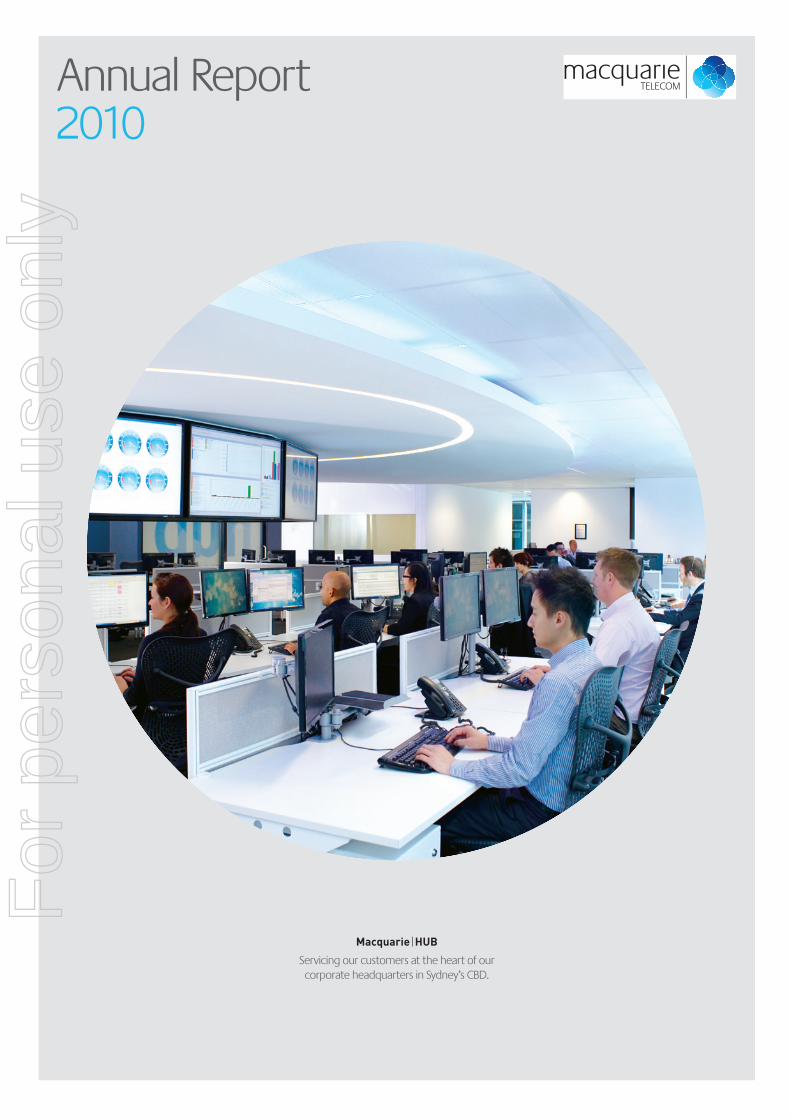
Annual Report 2010 Macquarie | HUB Servicing our customers at the heart of our corporate headquarters in Sydney’s CBD. For personal use only
Transcript of Macquarie Telecom Annual Report 2010 For personal use · PDF fileon providing secure,...
macquarietelecom.com
Sydney Level 20 2 Market Street Sydney NSW 2000 T (02) 8221 7777 F (02) 8221 7788
Melbourne Level 1 441 St Kilda Road Melbourne VIC 3004 T (03) 9206 6800 F (03) 9206 6888
Brisbane Level 10 26 Wharf Street Brisbane QLD 4000 T (07) 3874 2300 F (07) 3874 2388
Perth Level 10 251 Adelaide Terrace Perth WA 6000 T (08) 9229 0000 F (08) 9229 0088
Hobart 49 Davey Street Hobart TAS 7000 T (03) 6214 0000 F (03) 6214 0888
Adelaide 297 Pirie Street Adelaide SA 5000 T (08) 8363 9700 F (08) 8363 9788
Canberra Level 7 54 Marcus Clarke Street Canberra ACT 2600 T (02) 6257 6277 F (02) 6257 7188
Intellicentre Level 16 477 Pitt Street Sydney NSW 2000 T (02) 8204 5100 F (02) 8204 5188
Toll Free numbers T 1800 653 053 F 1800 676 373
Macquarie Telecom
Annual Report 2010
Annual Report2010
Macquarie | HUB
Servicing our customers at the heart of our corporate headquarters in Sydney’s CBD.
For
per
sona
l use
onl
y

Des
ign
by W
ar D
esig
n St
udio
s
For
per
sona
l use
onl
y

Macquarie Telecom Annual Report 2010 01
Contents02 Company Snapshot 04 Company Highlights 06 Financial Highlights 08 Company Feature 10 Chairman’s Message 13 Chief Executive’s Message 14 Board of Directors 16 Financial Statements
Notice of Annual General Meeting
Notice is hereby given that the Annual General Meeting of the members of Macquarie Telecom Group Limited be held at the Museum of Sydney Auditorium (at the corner of Phillip and Bridge Streets) in Sydney on Friday, 26 November 2010 at 9.00am.
Macquarie Telecom Group Limited ACN 056 712 228
Macquarie TelecomBest Telco in the World for Customer Care
For
per
sona
l use
onl
y

02
Company SnapshotMacquarie Telecom at a glanceMacquarie Telecom delivers a range of hosting, data, voice and mobiles services specifically to the business and government market.
Hosting DivisionMacquarie Telecom’s Hosting division focuses on providing secure, scalable, high-availability, fully managed hosting services for our customers’ critical applications. For more information on Macquarie Telecom’s Hosting division visit:
www.macquarietelecom.com/hosting
Data Network DivisionMacquarie Telecom’s Data Network division provides reliable and secure IP data network services. We offer the highest level of network service availability and optimum network solutions to support our customers’ business application environments. For more information on Macquarie Telecom’s Data Network division visit:
www.macquarietelecom.com/data
For
per
sona
l use
onl
y

Macquarie Telecom Annual Report 2010 03
Voice DivisionMacquarie Telecom’s Voice division delivers secure, flexible and cost-effective telephony solutions developed to meet the specific business requirements of our customers and to maximise productive use of telecommunications and control unnecessary spending. For more information on Macquarie Telecom’s Voice division visit:
www.macquarietelecom.com/voice
Mobiles DivisionMacquarie Telecom’s Mobiles division provides tailored mobile solutions together with a wide range of enhanced management, reporting and cost control tools that enable our customers to effectively manage and control their mobile fleet and its expenditure. For more information on Macquarie Telecom’s Mobile division visit:
www.macquarietelecom.com/mobile
For
per
sona
l use
onl
y
04
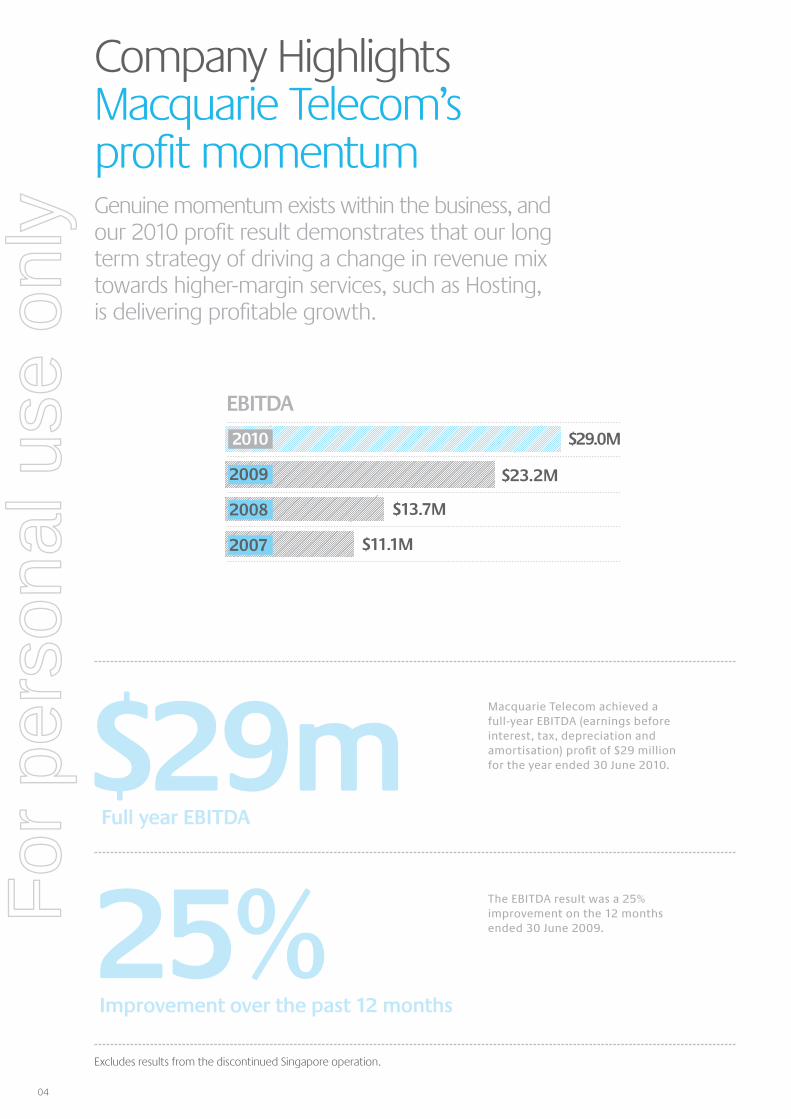
Macquarie Telecom achieved a full-year EBITDA (earnings before interest, tax, depreciation and amortisation) profit of $29 million for the year ended 30 June 2010.
The EBITDA result was a 25% improvement on the 12 months ended 30 June 2009. 25%
$29m
Improvement over the past 12 months
Full year EBITDA
Company HighlightsMacquarie Telecom’s profit momentumGenuine momentum exists within the business, and our 2010 profit result demonstrates that our long term strategy of driving a change in revenue mix towards higher-margin services, such as Hosting, is delivering profitable growth.
EBITDA
$29.0M
$23.2M
$13.7M
$11.1M
2010
2009
2008
2007
Excludes results from the discontinued Singapore operation.
For
per
sona
l use
onl
y
Macquarie Telecom Annual Report 2010 05
Cash and cash equivalents
Our strategic objective is to be Australia’s number one Managed Hosting and integrated Telco provider to business and government customers through the delivery of service excellence.
Hosting EBITDA profit rose 55% to $15.2 million. This result supports the strategic direction we have taken as we build momentum in our higher margin Hosting business.
Macquarie Telecom maintains a healthy balance sheet with cash and cash equivalents of $56.3 million, having generated strong operating cash flows of $28.9 million.
UP 55%Hosting EBITDA
$56.3mFor
per
sona
l use
onl
y

06
Service revenue* 243.6 234.7 241.6 236.0
EBITDA* 11.1 13.7 23.2 29.0
EBIT* (4.0) (1.5) 8.4 13.3
Net profit/(loss) after tax* (3.4) (0.9) 6.1 10.4
Operating cash flow 14.3 18.8 27.6 28.9
Gross margin %* 33.3% 38.1% 43.0% 49.0%
• Revenue mix continues to improve• Operating cash flow of $28.9 million • Fully franked special dividend of 20 cents per share • Fully franked ordinary dividend of 20 cents per share
Financial HighlightsProfitable growth
* Excludes results from the discontinued Singapore operation.** The Corporate Office figure represents overhead costs associated with Macquarie Telecom’s corporate and regulatory activities.
Financial summaryFor the year ended 30 June, in $m
Hosting Division 44.5 15.2
Data Division 58.6 3.4
Voice Division 104.1 15.0
Mobiles Division 28.8 1.9
Corporate Office** 0.0 (6.5)
236.0 29.0
2010 Operating results by divisions*For the year ended 30 June 2010, in $m
2010
EBITDARevenue
200920082007
For
per
sona
l use
onl
y

Macquarie Telecom Annual Report 2010 07
EBITDA
Operating Cash Flow
Service Revenue
Gross Margin %
2010
2010
2010
2010
$29.0M
$28.9M
$236.0M
49.0%
$23.2M
$27.6M
$241.6M
43.0%
$13.7M
$18.8M
$234.7M
38.1%
$11.1M
$14.3M
$243.6M
33.3%
70.8%Net profit after tax improvement
2009
2009
2009
2009
2008
2008
2008
2008
2007
2007
2007
2007
For
per
sona
l use
onl
y
08
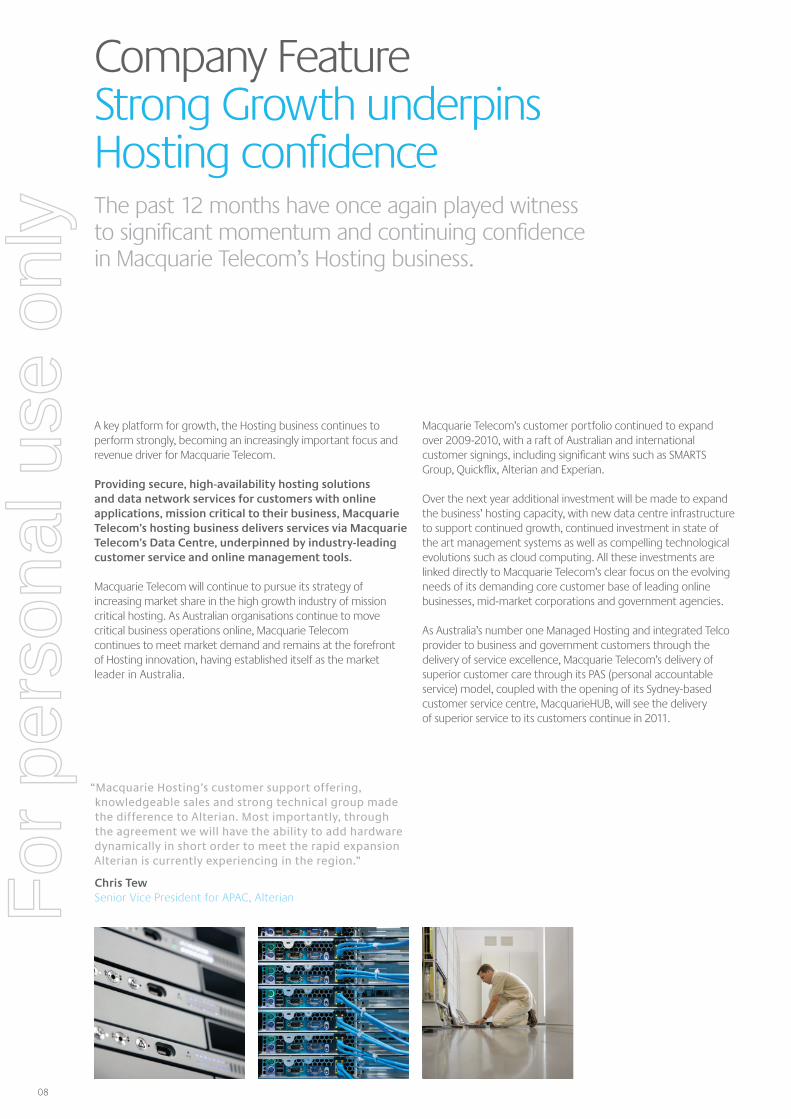
Company FeatureStrong Growth underpins Hosting confidenceThe past 12 months have once again played witness to significant momentum and continuing confidence in Macquarie Telecom’s Hosting business.
A key platform for growth, the Hosting business continues to perform strongly, becoming an increasingly important focus and revenue driver for Macquarie Telecom.
Providing secure, high-availability hosting solutions and data network services for customers with online applications, mission critical to their business, Macquarie Telecom’s hosting business delivers services via Macquarie Telecom’s Data Centre, underpinned by industry-leading customer service and online management tools.
Macquarie Telecom will continue to pursue its strategy of increasing market share in the high growth industry of mission critical hosting. As Australian organisations continue to move critical business operations online, Macquarie Telecom continues to meet market demand and remains at the forefront of Hosting innovation, having established itself as the market leader in Australia.
Macquarie Telecom’s customer portfolio continued to expand over 2009-2010, with a raft of Australian and international customer signings, including significant wins such as SMARTS Group, Quickflix, Alterian and Experian.
Over the next year additional investment will be made to expand the business’ hosting capacity, with new data centre infrastructure to support continued growth, continued investment in state of the art management systems as well as compelling technological evolutions such as cloud computing. All these investments are linked directly to Macquarie Telecom’s clear focus on the evolving needs of its demanding core customer base of leading online businesses, mid-market corporations and government agencies.
As Australia’s number one Managed Hosting and integrated Telco provider to business and government customers through the delivery of service excellence, Macquarie Telecom’s delivery of superior customer care through its PAS (personal accountable service) model, coupled with the opening of its Sydney-based customer service centre, MacquarieHUB, will see the delivery of superior service to its customers continue in 2011.
“Macquarie Hosting’s customer support offering, knowledgeable sales and strong technical group made the difference to Alterian. Most importantly, through the agreement we will have the ability to add hardware dynamically in short order to meet the rapid expansion Alterian is currently experiencing in the region.”
Chris TewSenior Vice President for APAC, AlterianF
or p
erso
nal u
se o
nly
Macquarie Telecom Annual Report 2010 09
For
per
sona
l use
onl
y

10
Genuine momentum exists within the business, and our 2010 profit result demonstrates that our long term strategy of driving a change in revenue mix towards higher-margin services, such as Hosting, is delivering profitable growth. Significantly, Macquarie Telecom’s announcement of both an ordinary and special dividend highlights our confidence that our strategy will continue to deliver sustained profitable growth into the future.
Supporting this profitable growth has been the ongoing progress we have made in becoming an integral part of our customers’ businesses, as we assist them in adapting to change. In our continued pursuit of an ongoing strategy of differentiation, we are committed to ensuring that we provide our customers with higher levels of service through personal accountability, as well as offering them the management tools they need to manage their communication needs.
Our business is built on a culture of exceptional customer service and personal accountability, which we call “Personal Accountable Service”. In last year’s report I noted that our culture of exceptional customer service was recognised at the 2008 World Communications Awards in London, where Macquarie Telecom was judged Best Telco in the world for Customer Care. During fiscal year 2010 we continued to invest in delivering exceptional customer service, launching our world class Contact Centre the “MacquarieHUB”.
Located in-house at the heart of our corporate headquarters in Sydney’s CBD, the MacquarieHUB has been specifically designed for business, based on world’s best practice in contact centre technology, recruitment and management. The MacquarieHUB is staffed by highly trained customer service professionals, carefully selected from thousands of applicants, and enabled by the latest technology and customer support methodology. Importantly, we measure our success on customer satisfaction levels, not call volume. We believe our world class customer service is a clear differentiator and will be even more relevant in a high speed bandwidth world.
Macquarie Telecom remains focused on being Australia’s number one Managed Hosting and integrated Telco provider to business and government customers through the delivery of service excellence.
For our Hosting business the trend of selective outsourcing of internal IT presents a massive opportunity and when combined with virtualisation technologies extends the existing Hosting market dramatically.
Our Hosting business is a key growth platform and we continue to pursue our strategy of increasing market share in the high growth industry of mission critical hosting. In fiscal year 2010 we successfully delivered strong revenue and profit growth from our Hosting business, firmly establishing Macquarie Telecom as the recognised leader in delivering managed hosting of mission critical applications for business and government customers in Australia.
Our Telco business, consisting of Data, Voice and Mobiles services, increased profitability during the financial year despite continued revenue decline in the Voice business driven by further price competition and fixed to mobile and data substitution. Our Telco business will continue to be a core offering of Macquarie Telecom and the company remains focused on delivering superior customer service through operational and service excellence, and on growing our corporate client base.
Macquarie Telecom exited the year in a strong financial position, with a robust balance sheet and $56.3 million in cash and cash equivalents. Combined with our strong operating cash flows Macquarie Telecom is well positioned to take advantage of future organic and inorganic growth opportunities as they emerge, as well as distributing free cash to shareholders via fully franked dividends.
In the year ahead we expect growth in profitability to continue, moderated by ongoing investment in our Hosting business, and in maintaining operational and service excellence. Capital expenditure on customer equipment, network and facility maintenance, and support in fiscal 2011 is expected to be approximately $17 to $18 million, driven by continued strong Hosting sales. In addition, further investment will be made in fiscal year 2011 to expand our Hosting capacity to support the strong growth in that business.
Macquarie Telecom has a highly skilled and experienced management team that is executing effectively on the company’s growth strategy. We enter the new financial year confident that our strategies are working and that profitable growth will continue to be delivered in the future.
Chairman’s MessageHosting is a key growth platformMacquarie Telecom delivered a strong operational and financial performance during the 2010 financial year.
Robert KayeChairman
For
per
sona
l use
onl
y

Macquarie Telecom Annual Report 2010 11
Macquarie | HUB
A 24/7 contact centre specifically designed for business, based on the world’s best practice in contact centre technology,
recruitment and management.
For
per
sona
l use
onl
y

12
Macquarie | HUB
Staffed by highly trained customer service professionals, carefully selected from thousands of applicants, enabled by the
latest technology and customer support methodology.
For
per
sona
l use
onl
y

Macquarie Telecom Annual Report 2010 13
We delivered another strong profit result and generated solid operational cash flows whilst expanding our market leadership position in the provision of mission critical application hosting to Australian business and government customers.
Macquarie Telecom delivered a net profit after tax from continuing operations of $10.4 million for fiscal year 2010, an increase of 71% on 2009. This strong result supports the strategic direction we have taken to be Australia’s number one Managed Hosting and integrated Telco provider to business and government customers through the delivery of service excellence.
Total service revenue for the year was $236 million with our revenue mix continuing to improve and our higher margin Hosting business once again making increased contributions to total service revenue year on year.
Macquarie Telecom’s Hosting business displayed continued strong revenue growth of 31.3% from the previous year, contributing $44.5 million or 19% to total revenue. The profitability of the Hosting business also grew strongly during the fiscal year with an EBITDA of $15.2 million, up 55% on 2009. Combined with a record year for sales orders, this strong growth in revenue and EBITDA further solidified Macquarie Telecom’s market leading position in the mission critical hosting market.
Over the next fiscal year we intend to expand our Hosting capacity and ensure we capitalise on the strong growth we are experiencing in this sector and extend our market leadership. In addition we will increase investment in automation, systems and processes to improve efficiency and costs to serve.
Macquarie Telecom’s Telco business, consisting of Data, Voice and Mobiles services business remains an important part of the Company’s overall offering, also delivering $191.5 million in revenue and an EBITDA profit of $20.3 million, up 5.4% on the previous year. Strict margin management and cost control improved margins in the Telco business in fiscal year 2010. We remain focused on continuously improving operational efficiency in our Telco business to enhance our customers’ experience and margins.
Last year I committed that Macquarie Telecom would continue to invest in delivering exceptional customer service in the future to ensure we maintain leadership in this area. The launch of our world class contact centre facility in Sydney, the MacquarieHUB, fulfils that commitment.
We remain committed to making a real investment into delivering a superior customer experience. In the National Broadband Network era, decisions should no longer be made based on the ownership of services, but instead on the treatment customers receive with the delivery and support of services and how well providers can help their customers’ businesses. For too long the telecoms industry has focussed on infrastructure as its differentiator.
We recognise that in the future, the business with a focus on customer care will be the business that differentiates and succeeds. By leveraging the MacquarieHUB, maintaining our focus on customer care as a key differentiator and delivering operational excellence to our customers we believe we can extend our leadership in customer service.
Whilst uncertainty remains as to the final form the National Broadband Network will take, we believe increasing bandwidth speeds will elevate the importance of mission critical web applications in business and fuel growth in Hosting. In addition, the National Broadband Network open access model means telco competition is focused around customer service and services, not infrastructure which will be beneficial for Macquarie Telecom and our customers in the long term. Macquarie Telecom maintains an active thought leadership role surrounding the long term implications of the National Broadband Network to the telecommunication industry and our customers.
Our focus in the year ahead is to continue to execute on our strategy of growing our higher margin businesses and continue to deliver exceptional service to our customers. In 2010 we have demonstrated that this strategy is working and we remain confident that the momentum we have created will lead to continued profitable growth in 2011 and beyond.
None of the achievements outlined would have been possible without the support and dedication of Macquarie’s staff, and the loyalty and contribution of our business partners and customers. On behalf of the Board and management, I thank them for their continuing efforts and support.
Chief Executive’s MessageStrong profit resultDuring the 2010 fiscal year Macquarie Telecom continued on its journey of profitable growth.
David TudehopeChief Executive
For
per
sona
l use
onl
y
14
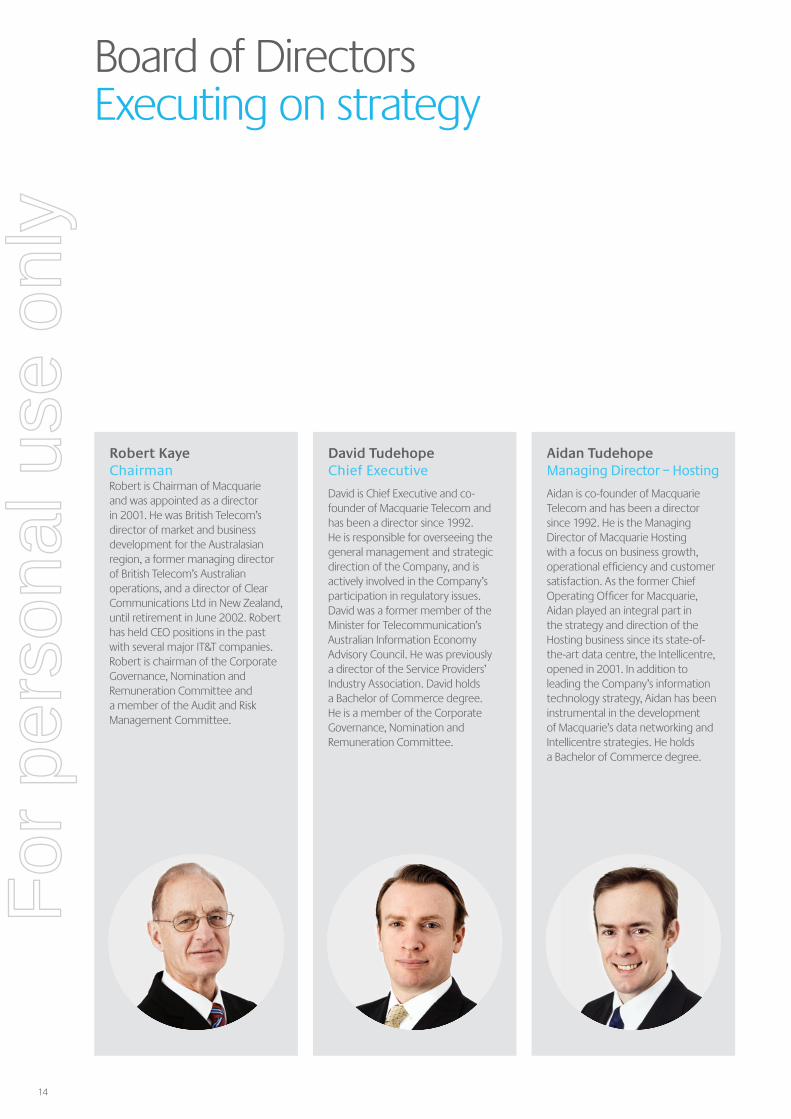
Robert Kaye ChairmanRobert is Chairman of Macquarie and was appointed as a director in 2001. He was British Telecom’s director of market and business development for the Australasian region, a former managing director of British Telecom’s Australian operations, and a director of Clear Communications Ltd in New Zealand, until retirement in June 2002. Robert has held CEO positions in the past with several major IT&T companies. Robert is chairman of the Corporate Governance, Nomination and Remuneration Committee and a member of the Audit and Risk Management Committee.
David Tudehope Chief Executive
David is Chief Executive and co-founder of Macquarie Telecom and has been a director since 1992. He is responsible for overseeing the general management and strategic direction of the Company, and is actively involved in the Company’s participation in regulatory issues. David was a former member of the Minister for Telecommunication’s Australian Information Economy Advisory Council. He was previously a director of the Service Providers’ Industry Association. David holds a Bachelor of Commerce degree. He is a member of the Corporate Governance, Nomination and Remuneration Committee.
Aidan Tudehope Managing Director – Hosting
Aidan is co-founder of Macquarie Telecom and has been a director since 1992. He is the Managing Director of Macquarie Hosting with a focus on business growth, operational efficiency and customer satisfaction. As the former Chief Operating Officer for Macquarie, Aidan played an integral part in the strategy and direction of the Hosting business since its state-of-the-art data centre, the Intellicentre, opened in 2001. In addition to leading the Company’s information technology strategy, Aidan has been instrumental in the development of Macquarie’s data networking and Intellicentre strategies. He holds a Bachelor of Commerce degree.
Board of DirectorsExecuting on strategy
For
per
sona
l use
onl
y
Macquarie Telecom Annual Report 2010 15
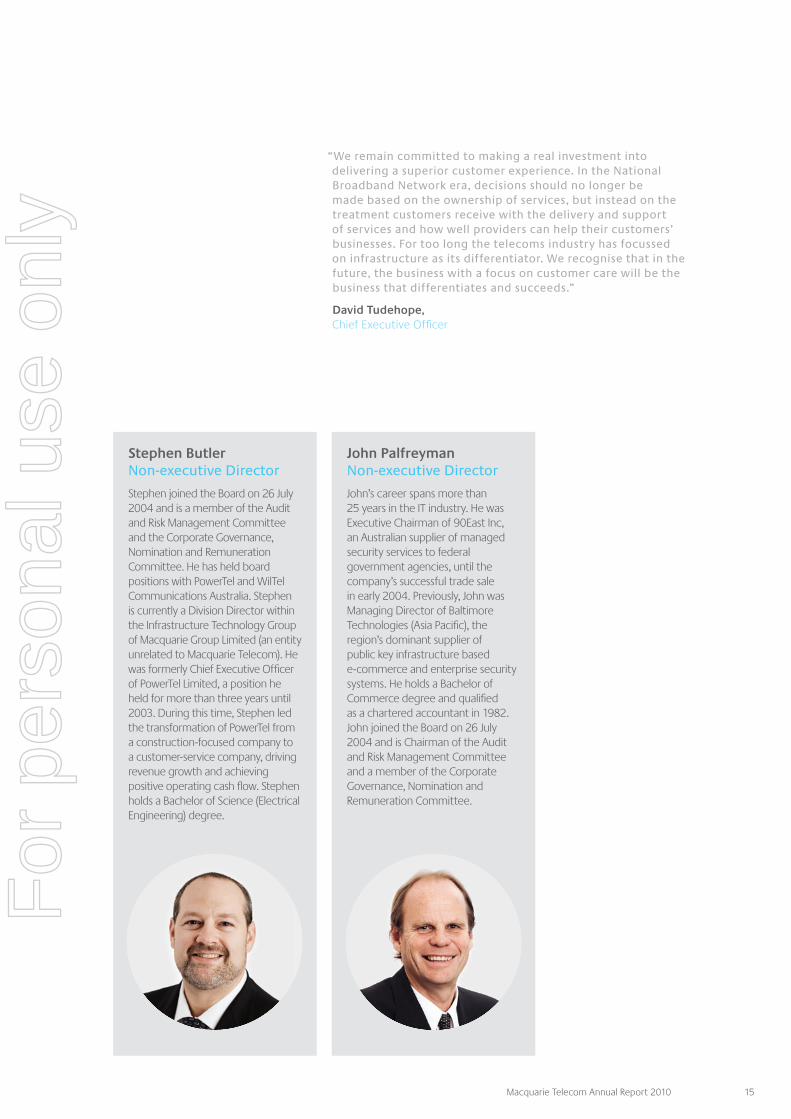
Stephen Butler Non-executive Director
Stephen joined the Board on 26 July 2004 and is a member of the Audit and Risk Management Committee and the Corporate Governance, Nomination and Remuneration Committee. He has held board positions with PowerTel and WilTel Communications Australia. Stephen is currently a Division Director within the Infrastructure Technology Group of Macquarie Group Limited (an entity unrelated to Macquarie Telecom). He was formerly Chief Executive Officer of PowerTel Limited, a position he held for more than three years until 2003. During this time, Stephen led the transformation of PowerTel from a construction-focused company to a customer-service company, driving revenue growth and achieving positive operating cash flow. Stephen holds a Bachelor of Science (Electrical Engineering) degree.
John Palfreyman Non-executive Director
John’s career spans more than 25 years in the IT industry. He was Executive Chairman of 90East Inc, an Australian supplier of managed security services to federal government agencies, until the company’s successful trade sale in early 2004. Previously, John was Managing Director of Baltimore Technologies (Asia Pacific), the region’s dominant supplier of public key infrastructure based e-commerce and enterprise security systems. He holds a Bachelor of Commerce degree and qualified as a chartered accountant in 1982. John joined the Board on 26 July 2004 and is Chairman of the Audit and Risk Management Committee and a member of the Corporate Governance, Nomination and Remuneration Committee.
“We remain committed to making a real investment into delivering a superior customer experience. In the National Broadband Network era, decisions should no longer be made based on the ownership of services, but instead on the treatment customers receive with the delivery and support of services and how well providers can help their customers’ businesses. For too long the telecoms industry has focussed on infrastructure as its differentiator. We recognise that in the future, the business with a focus on customer care will be the business that differentiates and succeeds.”
David Tudehope, Chief Executive Officer
For
per
sona
l use
onl
y

16
Contents17 Directors’ Report 26 Corporate Governance Statement 29 Statement of Comprehensive Income 30 Statement of Financial Position 31 Statement of Changes in Equity 32 Statement of Cash Flows 33 Notes to the Financial Statements 63 Directors’ Declaration 64 Independent Auditor’s Report 65 Auditor’s Independence Declaration 66 ASX Additional Information
For
per
sona
l use
onl
y

Macquarie Telecom Annual Report 2010 17
Directors’ Report
Your directors submit their report for the year ended 30 June 2010.
Directors The names and details of the directors of Macquarie Telecom Group Limited (“Macquarie” or the “Company”) in office during the financial year and until the date of this report are as follows. Directors were in office for this entire period unless otherwise stated.
Names, qualifications, experience and special responsibilities
Robert Kaye (Chairman), Age 72
Robert is Chairman of Macquarie and was appointed as a director in 2001. He was British Telecom’s director of market and business development for the Australasian region, a former managing director of British Telecom’s Australian operations, and a director of Clear Communications Ltd in New Zealand, until retirement in June 2002. Robert has held CEO positions in the past with several major IT&T companies. Robert is chairman of the Corporate Governance, Nomination and Remuneration Committee and a member of the Audit and Risk Management Committee.
David Tudehope (Chief Executive), Age 43
David is Chief Executive and co-founder of Macquarie Telecom and has been a director since 1992. He is responsible for overseeing the general management and strategic direction of the Company, and is actively involved in the Company’s participation in regulatory issues. He was previously a director of the Service Providers’ Industry Association. He is a member of the Australian School of Business Advisory Council. David holds a Bachelor of Commerce degree from the University of NSW. He is a member of the Corporate Governance, Nomination and Remuneration Committee.
Aidan Tudehope (Managing Director – Hosting), Age 38
Aidan is co-founder of Macquarie Telecom and has been a director since 1992. He is the managing director of Macquarie Hosting with a focus on business growth, operational efficiency and customer satisfaction. As the former Chief Operating Officer for Macquarie, Aidan played an integral part in the strategy and direction of the Hosting business since its state-of-the-art data centre, the Intellicentre opened in 2001, as well as being instrumental in the development of Macquarie’s data networking strategy. He holds a Bachelor of Commerce degree.
Stephen Butler (Non-Executive Director), Age 43
Stephen joined the Board on 26 July 2004 and is a member of the Audit and Risk Management Committee and the Corporate Governance, Nomination and Remuneration Committee. He has held board positions with PowerTel and WilTel Communications Australia. Stephen is currently a division director within the Infrastructure Technology Group of Macquarie Group Limited (an entity unrelated to Macquarie Telecom). He was formerly chief executive officer of PowerTel Limited, a position he held for more than three years until 2003. During this time, Stephen led the transformation of PowerTel from a construction focused company to a customer service company, driving revenue growth and achieving positive operating cash flow. Stephen holds a Bachelor of Science (Electrical Engineering) degree.
John Palfreyman (Non-Executive Director), Age 51
John’s career spans more than 25 years in the IT industry. He was executive chairman of 90East Inc, an Australian supplier of managed security services to federal government agencies, until the company’s successful trade sale in early 2004. Previously, John was managing director of Baltimore Technologies (Asia Pacific), the region’s dominant supplier of public key infrastructure based e-commerce and enterprise security systems. He holds a Bachelor of Commerce degree and qualified as a chartered accountant in 1982. John joined the Board on 26 July 2004 and is chairman of the Audit and Risk Management Committee and a member of the Corporate Governance, Nomination and Remuneration Committee.
For
per
sona
l use
onl
y

18
Directors’ Report
Directors’ interests in the shares and options of the Company and related bodies corporate
As at the date of this report, the interests of the directors in the shares and options of the Company and related bodies corporate were as follows:
(a) D Tudehope and A Tudehope collectively wholly own Claiward Pty Ltd, an entity which holds 12,501,390 (60%) of the ordinary shares of Macquarie. The relevant ownership interests in Claiward Pty Ltd are held by Semark Pty Ltd at 84% and Fenton Australia Pty Ltd at 16%. The shares in these latter companies are held by D Tudehope and A Tudehope respectively;
(b) a director-related entity of D Tudehope and A Tudehope holds 7,183 ordinary shares issued under the Employee Discretionary Share Plan and Share Purchase Plan;
(c) a director-related entity of D Tudehope holds 350,149 ordinary shares;
(d) 5,000 ordinary shares were on issue to a director-related entity of R Kaye. R Kaye also has an interest in 40,000 ordinary shares.
(e) S Butler has an interest in 40,000 ordinary shares; and
(f) A director-related entity of J Palfreyman holds 10,000 ordinary shares. J Palfreyman also has an interest in 40,000 ordinary shares and 40,000 options over ordinary shares.
Company Secretaries Michael Simmonds Age 44
Michael was appointed as company secretary of the Company in March 2006. Prior to this he held a number of positions as finance director in the UK. Michael has been a chartered accountant for over 15 years.
Richard Lutterbeck Age 39
Richard was appointed as company secretary of the Company in February 2009. In addition, he holds the position of Group Commercial, Strategic and Risk Manager. Richard has been with the Company since 2001 holding a number of commercial and strategic positions. Richard holds a Bachelor of Economics degree and a Masters of Business Administration.
Independent Professional Advice Directors and board committees have the right, in connection with their duties and responsibilities, to seek independent professional advice at the company’s expense. Prior written approval of the Chairman is required, but this will not be unreasonably withheld.
Principal Activities Macquarie is the head entity of a consolidated group comprising Macquarie Telecom Pty Limited (“MT”), Macquarie Hosting Pty Limited (“MH”), Macquarie Telecom Carrier Services Pty Limited (“MTCS”) and Macquarie Telecom Network Carrier Services Pty Limited (“MTNCS”). Formerly part of the consolidated group, Macquarie Telecom Pte Limited was sold on 31 July 2009 (see Note 29).
The principal activities of the consolidated entity were the provision of telecommunication and hosting services to corporate and government customers within Australia and Singapore.
Earnings Per Share 2010 2009 cents cents
Earnings per share for profit from continuing operations attributable to the ordinary equity holders of the company
Basic profit/(loss) per share 50.6 29.7Diluted profit/(loss) per share 50.1 29.7
Earnings per share for profit attributable to the ordinary equity holders of the company
Basic profit/(loss) per share 86.8 36.1Diluted profit/(loss) per share 86.1 36.1
For
per
sona
l use
onl
y

Macquarie Telecom Annual Report 2010 19
In the 12 months to 30 June 2010, Macquarie Telecom’s service revenue from continuing operations was $236.0 million, a decrease of 2.3% compared to the corresponding period.
Macquarie Telecom’s Hosting business, which provides secure, high-availability hosting solutions for companies with online applications, mission critical to their business, continued to perform strongly with revenue increasing 31.3% to $44.5 million. It generated an EBITDA profit of $15.2 million, up 55.1% on the corresponding period. Hosting now represents 18.8% of Macquarie Telecom’s revenue.
Macquarie Telecom’s Telco (Data, Voice and Mobile) business remains an important part of the company’s overall offering, delivering $191.5 million in revenue and an EBITDA profit of $20.3 million, up 5.2% on the previous corresponding period.
Capital expenditure for the full year was $16.6 million, up from $13.0 million in 2009.
Macquarie Telecom has generated operating cash flows of $28.9 million and held cash and cash equivalents of $56.3 million as at 30 June 2010.
The consolidated entity employed 389 employees at 30 June 2010 (2009: 384 employees).
Significant Changes in The State of Affairs On 30 July 2009 Macquarie Telecom Group Limited, the parent entity of the consolidated group, announced that it had entered into a Share Sale Agreement in respect of its Singapore subsidiary Macquarie Telecom Pte Limited, with CITIC 1616 Holdings Limited. The transaction was completed on 31 July 2009 with Macquarie Telecom and CITIC subsequently agreeing on a final sale consideration of SG$11.3 million (A$9.4 million).
Significant Events After the Balance Date Refer to Note 32 for significant events occurring after the balance date.
Likely Developments and Expected Results The directors believe, on reasonable grounds, that to include in this report detailed information regarding likely developments in the operations of the consolidated entity and the expected results of those operations in years after the current year would be likely to result in unreasonable prejudice to the Company. Accordingly, this information has not been included in this report. Further developments by the time of the Annual General Meeting will be reported in the Chairman’s address to that meeting.
Review and Results of Operations The consolidated entity achieved earnings before interest, tax, depreciation and amortisation (“EBITDA”) of $29.0 million in the year ended 30 June 2010, up from $23.2 million in the corresponding period from continuing operations.
The following tables summarise the revenue and EBITDA performance of Macquarie Telecom’s major lines of business for the past three comparable reporting periods.
Revenue (A$ million) Full Year 2010 Full Year 2009 Full Year 2008
HostingHosting Total 44.5 33.9 26.2
TelcoVoice 104.1 118.0 125.1Data 58.6 61.6 55.0Mobiles 28.8 28.1 28.3Telco Total 191.5 207.7 208.4
Total Continuing Operations 236.0 241.6 234.6
EBITDA (A$ million) Full Year 2010 Full Year 2009 Full Year 2008
HostingHosting Total 15.2 9.8 6.6
TelcoVoice 15.0 16.0 8.2Data 3.4 1.2 2.8Mobiles 1.9 2.1 1.6Telco Total 20.3 19.3 12.6
Corporate OfficeCorporate Office Total (6.5) (5.9) (5.5)
Total Continuing Operations 29.0 23.2 13.7
For
per
sona
l use
onl
y

20
Directors’ Report
Share Options Details of options on issue at 30 June 2010 and movements in options on issue during the year are included in Note 17 to the financial statements.
Indemnification and Insurance of Directors and Officers During the year, the Company paid premiums in respect of a contract insuring all the directors of Macquarie against costs incurred in defending proceedings for conduct involving:
(a) a wilful breach of duty; or
(b) a contravention of sections 182 or 183 of the Corporations Act 2001, as permitted by section 199B of the Corporations Act 2001.
The contract of insurance prohibits disclosure of the nature of the liability and the amount of the premiums.
Remuneration Report (Audited) This report outlines the remuneration arrangements in place for directors and executives of Macquarie.
Remuneration philosophy
The performance of the Company depends upon the quality of its directors and senior managers. To prosper, the Company must attract, motivate and retain highly skilled directors and executives.
To this end, the Company embodies the following principles in its remuneration framework:
– Provide competitive rewards to attract high calibre senior managers;
– Link senior manager rewards to shareholder value;
– Significant portion of senior manager remuneration ‘at risk’, dependent upon meeting predetermined performance benchmarks; and
– Establish appropriate, demanding performing hurdles in relation to variable senior manager remuneration.
Responsibility for evaluating the Board’s performance falls to the Corporate Governance, Nomination and Remuneration Committee. The performance of key executives is evaluated by the Chief Executive and where considered appropriate, the Board as a whole.
Remuneration link to performance
Macquarie’s remuneration philosophy directly aligns a percentage of short term incentives, such as bonuses, and all long-term incentives granted to employees with key business outcomes such as investment returns, company profit growth and total shareholder return.
Remuneration structure
In accordance with best practice corporate governance, the structure of non-executive director and senior manager remuneration is separate and distinct.
Non-executive director remuneration
ObjectiveThe Board seeks to set aggregate remuneration at a level which provides the Company with the ability to attract and retain non-executive directors of the highest calibre, whilst incurring a cost which is acceptable to shareholders.
StructureThe Company’s constitution and the ASX Listing Rules specify that the aggregate remuneration of non-executive directors will be determined from time to time by a general meeting. An amount not exceeding the amount determined is then divided between the non-executive directors as agreed. The latest determination was at the Annual General Meeting held on 26 November 2003 when shareholders approved an aggregate remuneration of $500,000 per year.
The amount of aggregate remuneration sought to be approved by shareholders and the manner in which it is apportioned amongst non-executive directors is reviewed annually. The Board considers advice from external consultants as well as the fees paid to non-executive directors of comparable companies when undertaking the annual review process.
Each non-executive director receives a fee for being a director of the Company.
The non-executive directors of the Company may hold shares and options over shares in the Company. The issue of any options to non-executive directors must be approved by shareholders in general meeting.
The remuneration of non-executive directors for the period ending 30 June 2010 is detailed in the table on page 22 and 23 of this report.
Senior manager and executive director remuneration
ObjectiveThe Company aims to reward senior managers with a level of remuneration commensurate with their position and responsibilities within the Company and so as to:
– Reward senior managers for Company, business unit and individual performance against targets set by reference to appropriate benchmarks;
– Align the interests of the executives with those of the shareholders;
– Link reward with the strategic goals and performance of the Company; and
– Ensure total remuneration is competitive by market standards.
For
per
sona
l use
onl
y

Macquarie Telecom Annual Report 2010 21
StructureService agreements have been entered into with each of the Chief Executive and the Managing Director – Hosting, but not with any other senior managers, each of whom is employed under the terms of a letter of appointment. Details of the service agreements are provided below.
Remuneration for all senior managers consists of the following key elements:
– Fixed remuneration
– Variable remuneration- Short Term Incentive (“STI”); and- Long Term Incentive (“LTI”).
Fixed remuneration
ObjectiveThe level of fixed remuneration is set so as to provide a base level of remuneration, which is both appropriate to the position and is competitive in the market.
Fixed remuneration of the Chief Executive and Managing Director – Hosting is reviewed annually by the Corporate Governance, Nomination and Remuneration Committee and the process consists of a review of Company-wide and individual performance; relevant comparative remuneration in the market; and internally and, where appropriate, external advice on policies and practices. The Committee has access to external advice independent of management.
StructureSenior managers are given the opportunity to receive their fixed (primary) remuneration in certain forms including cash and allowances such as motor vehicle allowances. It is intended that the manner of payment chosen will be optimal for the recipient without creating undue cost for the Company.
The fixed remuneration component of the key management personnel is detailed on page 22 and 23.
Variable remuneration – Short Term Incentive (“STI”)
ObjectiveThe objective of the STI program is to link the achievement of the Company’s operational targets with the remuneration received by the senior managers charged with meeting those targets. The total potential STI available is set at a level so as to provide sufficient incentive to the senior manager to achieve the operational targets and such that the cost to the Company is reasonable in the circumstances.
StructureActual STI payments granted to each senior manager and executive director depend on the extent to which specific operating targets set at the beginning of the financial year are met or exceeded. The operational targets consist of a number of Key Performance Indicators (‘KPIs’) covering both financial and non-financial measures of performance. Typically included are
measures such as contribution to profit, operational performance and staff management. The Company has predetermined benchmarks which must be met in order to trigger payments under the STI scheme. There is an overachievement element to these payments, meaning it is possible to achieve greater than 100% of the base incentive amount.
On a half-yearly basis, after consideration of performance against KPIs, an overall performance rating for the Company is approved by the Corporate Governance, Nomination and Remuneration Committee. The individual performance of each senior manager and executive director is also rated and taken into account when determining the amount, if any, of the STI component to be paid to each senior manager and executive director. This structure was in place for all financial years disclosed in this report, and continues for the present financial year.
Variable pay – Long Term Incentive (“LTI”)
ObjectiveThe objective of the LTI plan is to reward senior managers in a manner which aligns this element of remuneration with the creation of shareholder wealth.
As such, LTI grants are made to senior managers who are able to influence the generation of shareholders’ wealth and thus have a direct impact on the Company’s performance against the relevant long-term performance hurdle.
StructureLTI grants to senior managers are delivered in the form of options, discretionary shares or cash payments.
Service agreements
The Chief Executive and the Managing Director – Hosting are each employed under a service agreement. The current agreements commenced in August 1999 and continue until terminated by either the Company or the Chief Executive or the Managing Director – Hosting (as the case may be). Under the terms of the present agreements:
– Each of the Chief Executive and the Managing Director – Hosting may resign from their position and thus terminate their agreement by giving six months’ written notice;
– The Company may terminate the agreements by providing six months’ written notice or provide payment in lieu of the notice period, based on the fixed component of the Chief Executive or the Managing Director – Hosting’s remuneration (as the case may be). The Company may also terminate the agreements on a lesser period of notice if, for example, the Chief Executive or the Managing Director – Hosting (as the case may be) become incapacitated.
– The Company may terminate the agreements at any time without notice if serious misconduct has occurred. Where termination with cause occurs the Chief Executive or the Managing Director – Hosting (as the case may be) is only entitled to that portion of remuneration which is fixed, and only up to the date of termination.
For
per
sona
l use
onl
y
22
Directors’ Report
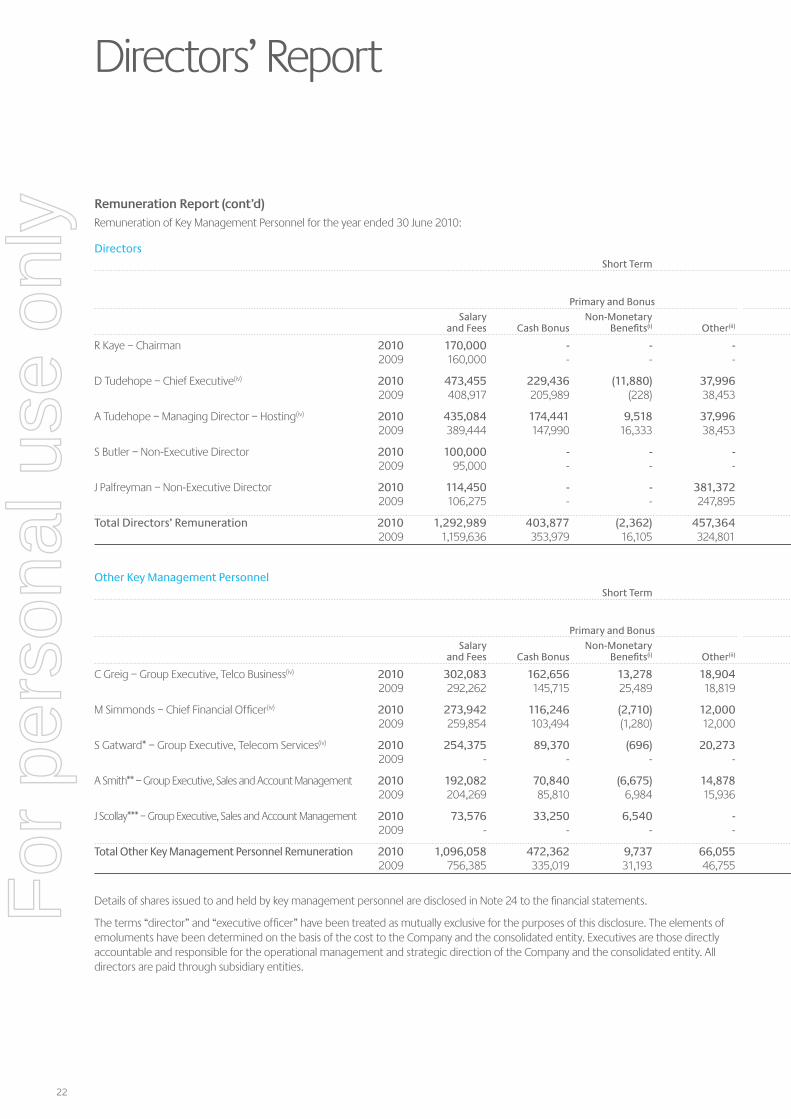
Remuneration Report (cont’d) Remuneration of Key Management Personnel for the year ended 30 June 2010:
Directors Short Term Long Term
Total Post % Bonus Share-based Performance Primary and Bonus Employment Granted Payments Total Related
Salary Non-Monetary and Fees Cash Bonus Benefits(i) Other(ii) Superannuation Options(iii)
R Kaye – Chairman 2010 170,000 - - - 14,461 - - 184,461 0.0% 2009 160,000 - - - 13,745 - 4,083 177,828 2.3%
D Tudehope – Chief Executive(iv) 2010 473,455 229,436 (11,880) 37,996 14,461 134.7% - 743,468 30.9% 2009 408,917 205,989 (228) 38,453 13,745 135.1% - 666,876 30.9%
A Tudehope – Managing Director – Hosting(iv) 2010 435,084 174,441 9,518 37,996 14,461 145.8% - 671,500 26.0% 2009 389,444 147,990 16,333 38,453 13,745 153.2% - 605,965 24.4%
S Butler – Non-Executive Director 2010 100,000 - - - 9,000 - - 109,000 0.0% 2009 95,000 - - - 8,550 - - 103,550 0.0%
J Palfreyman – Non-Executive Director 2010 114,450 - - 381,372 - - 16,148 511,970 3.2% 2009 106,275 - - 247,895 - - - 354,170 0.0%
Total Directors’ Remuneration 2010 1,292,989 403,877 (2,362) 457,364 52,383 16,148 2,220,399 2009 1,159,636 353,979 16,105 324,801 49,785 4,083 1,908,389
Other Key Management Personnel Short Term Long Term
Total Post % Bonus Share-based Performance Primary and Bonus Employment Granted Payments Total Related
Salary Non-Monetary and Fees Cash Bonus Benefits(i) Other(ii) Superannuation Options(iii)
C Greig – Group Executive, Telco Business(iv) 2010 302,083 162,656 13,278 18,904 14,461 133.3% 1,750 513,132 32.0% 2009 292,262 145,715 25,489 18,819 13,745 119.4% 1,631 497,661 29.6%
M Simmonds – Chief Financial Officer(iv) 2010 273,942 116,246 (2,710) 12,000 14,461 129.2% 8,750 422,689 29.6% 2009 259,854 103,494 (1,280) 12,000 13,745 143.7% 9,772 397,585 28.5%
S Gatward* – Group Executive, Telecom Services(iv) 2010 254,375 89,370 (696) 20,273 14,461 98.6% - 377,783 23.7% 2009 - - - - - - - - -
A Smith** – Group Executive, Sales and Account Management 2010 192,082 70,840 (6,675) 14,878 10,846 50.6% - 281,971 25.1% 2009 204,269 85,810 6,984 15,936 10,309 84.6% - 323,308 26.5%
J Scollay*** – Group Executive, Sales and Account Management 2010 73,576 33,250 6,540 - 3,615 103.2% - 116,981 28.4% 2009 - - - - - - - - -
Total Other Key Management Personnel Remuneration 2010 1,096,058 472,362 9,737 66,055 57,844 10,500 1,712,556 2009 756,385 335,019 31,193 46,755 37,799 11,403 1,218,554
Details of shares issued to and held by key management personnel are disclosed in Note 24 to the financial statements.
The terms “director” and “executive officer” have been treated as mutually exclusive for the purposes of this disclosure. The elements of emoluments have been determined on the basis of the cost to the Company and the consolidated entity. Executives are those directly accountable and responsible for the operational management and strategic direction of the Company and the consolidated entity. All directors are paid through subsidiary entities.
For
per
sona
l use
onl
y

Macquarie Telecom Annual Report 2010 23
Remuneration Report (cont’d) Remuneration of Key Management Personnel for the year ended 30 June 2010:
Directors Short Term Long Term
Total Post % Bonus Share-based Performance Primary and Bonus Employment Granted Payments Total Related
Salary Non-Monetary and Fees Cash Bonus Benefits(i) Other(ii) Superannuation Options(iii)
R Kaye – Chairman 2010 170,000 - - - 14,461 - - 184,461 0.0% 2009 160,000 - - - 13,745 - 4,083 177,828 2.3%
D Tudehope – Chief Executive(iv) 2010 473,455 229,436 (11,880) 37,996 14,461 134.7% - 743,468 30.9% 2009 408,917 205,989 (228) 38,453 13,745 135.1% - 666,876 30.9%
A Tudehope – Managing Director – Hosting(iv) 2010 435,084 174,441 9,518 37,996 14,461 145.8% - 671,500 26.0% 2009 389,444 147,990 16,333 38,453 13,745 153.2% - 605,965 24.4%
S Butler – Non-Executive Director 2010 100,000 - - - 9,000 - - 109,000 0.0% 2009 95,000 - - - 8,550 - - 103,550 0.0%
J Palfreyman – Non-Executive Director 2010 114,450 - - 381,372 - - 16,148 511,970 3.2% 2009 106,275 - - 247,895 - - - 354,170 0.0%
Total Directors’ Remuneration 2010 1,292,989 403,877 (2,362) 457,364 52,383 16,148 2,220,399 2009 1,159,636 353,979 16,105 324,801 49,785 4,083 1,908,389
Other Key Management Personnel Short Term Long Term
Total Post % Bonus Share-based Performance Primary and Bonus Employment Granted Payments Total Related
Salary Non-Monetary and Fees Cash Bonus Benefits(i) Other(ii) Superannuation Options(iii)
C Greig – Group Executive, Telco Business(iv) 2010 302,083 162,656 13,278 18,904 14,461 133.3% 1,750 513,132 32.0% 2009 292,262 145,715 25,489 18,819 13,745 119.4% 1,631 497,661 29.6%
M Simmonds – Chief Financial Officer(iv) 2010 273,942 116,246 (2,710) 12,000 14,461 129.2% 8,750 422,689 29.6% 2009 259,854 103,494 (1,280) 12,000 13,745 143.7% 9,772 397,585 28.5%
S Gatward* – Group Executive, Telecom Services(iv) 2010 254,375 89,370 (696) 20,273 14,461 98.6% - 377,783 23.7% 2009 - - - - - - - - -
A Smith** – Group Executive, Sales and Account Management 2010 192,082 70,840 (6,675) 14,878 10,846 50.6% - 281,971 25.1% 2009 204,269 85,810 6,984 15,936 10,309 84.6% - 323,308 26.5%
J Scollay*** – Group Executive, Sales and Account Management 2010 73,576 33,250 6,540 - 3,615 103.2% - 116,981 28.4% 2009 - - - - - - - - -
Total Other Key Management Personnel Remuneration 2010 1,096,058 472,362 9,737 66,055 57,844 10,500 1,712,556 2009 756,385 335,019 31,193 46,755 37,799 11,403 1,218,554
Notes:* Appointed 3 August 2009** Ceased employment 26 February 2010*** Appointed 7 April 2010(i) The category “Non-Monetary Benefits” represent amounts
accrued or released in respect of annual leave and long service leave.
(ii) The category “Other” includes the value of any non-cash benefits provided including expatriate package costs and motor vehicle allowances, and in the case of non-executive directors, consulting services to the consolidated entity. All amounts paid were on normal commercial terms and conditions and at market rates.
(iii) The directors have issued options over ordinary shares to a number of eligible employees. The terms of the Employee Option Plan stipulate that options will vest over certain timeframes. The plan is designed to encourage superior performance and provide opportunity to all eligible employees to participate in the future success of the Company.
Whilst LTIs may include discretionary shares, no such shares have been issued either in this financial year or the previous year.
(iv) Denotes one of the five highest remunerated executives.
For
per
sona
l use
onl
y
24
Directors’ Report
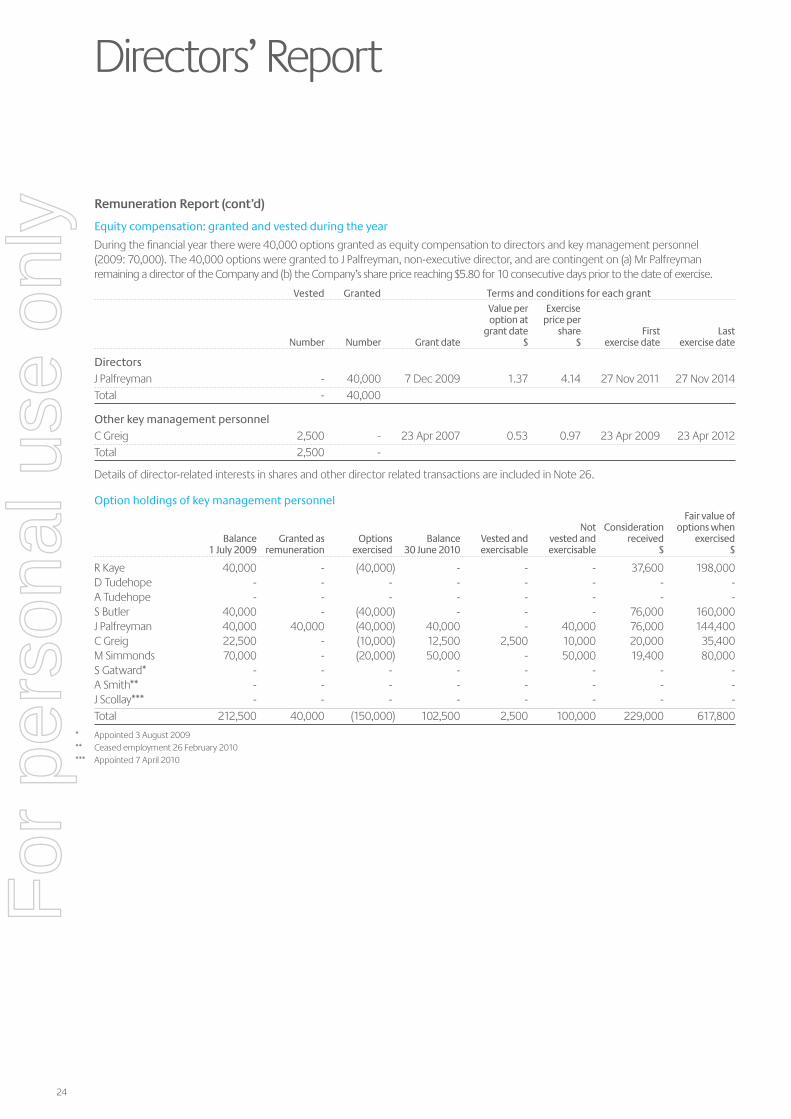
Remuneration Report (cont’d)
Equity compensation: granted and vested during the year
During the financial year there were 40,000 options granted as equity compensation to directors and key management personnel (2009: 70,000). The 40,000 options were granted to J Palfreyman, non-executive director, and are contingent on (a) Mr Palfreyman remaining a director of the Company and (b) the Company’s share price reaching $5.80 for 10 consecutive days prior to the date of exercise.
Vested Granted Terms and conditions for each grant
Value per Exercise option at price per grant date share First Last Number Number Grant date $ $ exercise date exercise date
DirectorsJ Palfreyman - 40,000 7 Dec 2009 1.37 4.14 27 Nov 2011 27 Nov 2014Total - 40,000
Other key management personnelC Greig 2,500 - 23 Apr 2007 0.53 0.97 23 Apr 2009 23 Apr 2012Total 2,500 -
Details of director-related interests in shares and other director related transactions are included in Note 26.
Option holdings of key management personnel Fair value of Not Consideration options when Balance Granted as Options Balance Vested and vested and received exercised 1 July 2009 remuneration exercised 30 June 2010 exercisable exercisable $ $
R Kaye 40,000 - (40,000) - - - 37,600 198,000D Tudehope - - - - - - - -A Tudehope - - - - - - - -S Butler 40,000 - (40,000) - - - 76,000 160,000J Palfreyman 40,000 40,000 (40,000) 40,000 - 40,000 76,000 144,400C Greig 22,500 - (10,000) 12,500 2,500 10,000 20,000 35,400M Simmonds 70,000 - (20,000) 50,000 - 50,000 19,400 80,000S Gatward* - - - - - - - -A Smith** - - - - - - - -J Scollay*** - - - - - - - -Total 212,500 40,000 (150,000) 102,500 2,500 100,000 229,000 617,800
* Appointed 3 August 2009** Ceased employment 26 February 2010*** Appointed 7 April 2010
For
per
sona
l use
onl
y
Macquarie Telecom Annual Report 2010 25
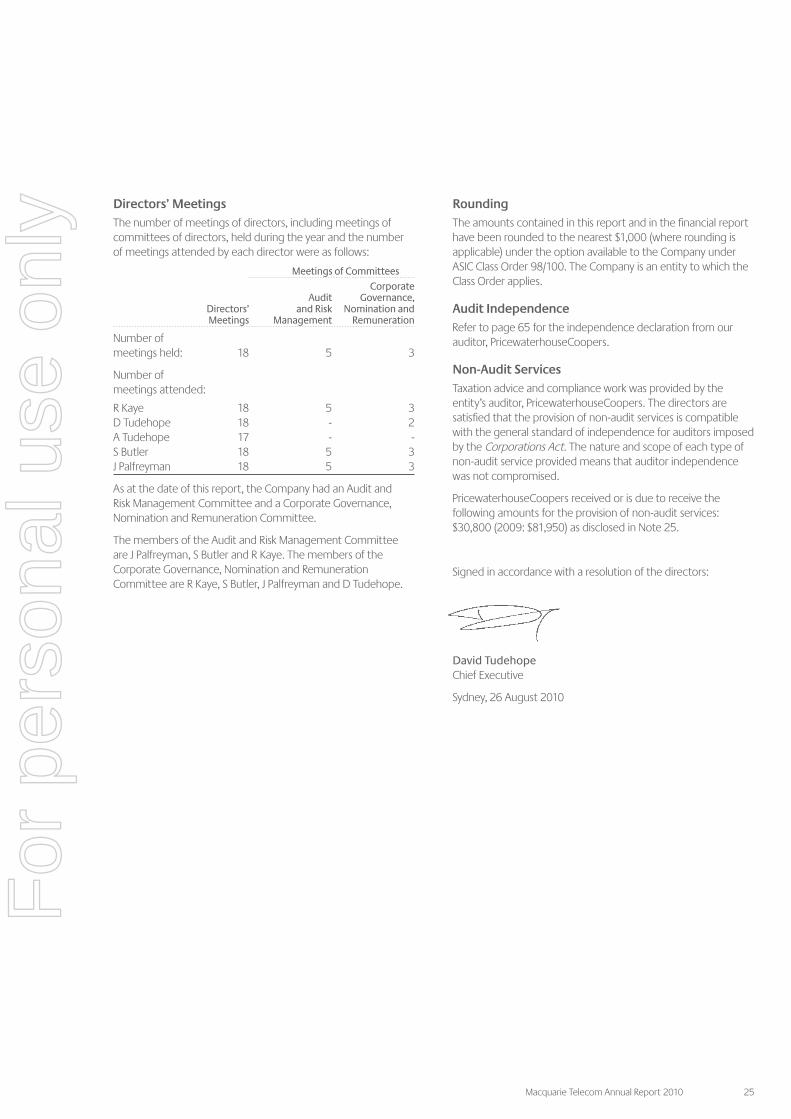
Directors’ Meetings The number of meetings of directors, including meetings of committees of directors, held during the year and the number of meetings attended by each director were as follows:
Meetings of Committees
Corporate Audit Governance, Directors’ and Risk Nomination and Meetings Management Remuneration
Number of meetings held: 18 5 3
Number of meetings attended:
R Kaye 18 5 3D Tudehope 18 - 2A Tudehope 17 - -S Butler 18 5 3J Palfreyman 18 5 3
As at the date of this report, the Company had an Audit and Risk Management Committee and a Corporate Governance, Nomination and Remuneration Committee.
The members of the Audit and Risk Management Committee are J Palfreyman, S Butler and R Kaye. The members of the Corporate Governance, Nomination and Remuneration Committee are R Kaye, S Butler, J Palfreyman and D Tudehope.
Rounding The amounts contained in this report and in the financial report have been rounded to the nearest $1,000 (where rounding is applicable) under the option available to the Company under ASIC Class Order 98/100. The Company is an entity to which the Class Order applies.
Audit Independence Refer to page 65 for the independence declaration from our auditor, PricewaterhouseCoopers.
Non-Audit Services Taxation advice and compliance work was provided by the entity’s auditor, PricewaterhouseCoopers. The directors are satisfied that the provision of non-audit services is compatible with the general standard of independence for auditors imposed by the Corporations Act. The nature and scope of each type of non-audit service provided means that auditor independence was not compromised.
PricewaterhouseCoopers received or is due to receive the following amounts for the provision of non-audit services: $30,800 (2009: $81,950) as disclosed in Note 25.
Signed in accordance with a resolution of the directors:
David Tudehope Chief Executive
Sydney, 26 August 2010
For
per
sona
l use
onl
y
26
Corporate Governance Statement
Introduction The Board is responsible for the corporate governance practices of the Company. The major processes by which the Board fulfils that responsibility are described in this statement.
The Board considers that except to the extent expressly indicated in this statement, those corporate governance practices comply with the ASX Corporate Governance Council’s (“ASXCGC”) Principles of Good Corporate Governance and Best Practice Recommendations, dated August 2007. Also, except to the extent expressly indicated in this statement, those practices were followed throughout the year.
A copy of the Corporate Governance Statement, the Audit and Risk Management Committee Charter and the Company’s Code of Conduct are available in the corporate governance section of the Company’s website at www.macquarietelecom.com, together with all other information which the ASXCGC recommends be made publicly available.
Principle 1
Lay solid foundations for management and oversight by the Board
The Board acts on behalf of and is accountable to the shareholders. The expectations of shareholders together with regulatory and ethical expectations and obligations are taken into consideration when defining the Board’s responsibilities.
The Board’s key responsibilities are:
– establishing, monitoring and modifying the Company’s corporate strategies;
– monitoring the performance of management;
– reporting to shareholders and the market;
– ensuring that appropriate risk management systems, internal control and reporting systems and compliance frameworks are in place and are operating effectively;
– monitoring financial results;
– reviewing business results and monitoring budgetary control and corrective actions (if required);
– authorising and monitoring budgets and major investments and strategic commitments;
– monitoring Board composition, director selection and Board processes and performance;
– reviewing the performance of the Chief Executive, the Managing Director – Hosting and senior management;
– endorsing key executive appointments and ensuring executive succession planning;
– reviewing and approving remuneration of the Chief Executive and the Managing Director – Hosting;
– reviewing and approving remuneration policies for senior management; and
– ensuring best practice corporate governance.
The responsibility for the day-to-day operation and administration of the Company has been delegated to the Chief Executive and the executive team. The Board ensures that this team is appropriately qualified and experienced. The Board is also responsible for ensuring that management’s objectives and activities are aligned with the expectations and risks identified by the Board.
A performance assessment for senior management last took place in July 2010. The process for these assessments is described in the Corporate Governance statement on the Company’s website.
For
per
sona
l use
onl
y
Macquarie Telecom Annual Report 2010 27
Principle 2
Structure the Board to add value
The Board has adopted a policy of ensuring that it is composed of a majority of non-executive directors with an appropriate mix of skills to provide the necessary breadth and depth of knowledge and experience. Each of the current non-executive directors is an independent director for the purposes of the criteria for independence outlined by the ASXCGC. The Chairman is selected from the non-executive directors and appointed by the Board.
The same person does not exercise the roles of Chairman and Chief Executive. The Board has agreed the division of responsibilities between these roles. That division is sufficiently clear and understood as to not require a formal statement of position.
Information about the directors, including their qualifications, experience and special responsibilities, appears in the Directors’ Report.
Directors and Board committees have the right in connection with their duties and responsibilities to seek independent professional advice at the company’s expense.
Principle 3
Promote ethical and responsible decision making
The Board is committed to the highest standards of conduct. To ensure that the Board, management and employees have guidance in the performance of their duties, the Board has adopted a Code of Conduct that reinforces the requirement that the business be conducted ethically and with professionalism.
In order to guard against the misuse of price-sensitive information, the Board has established a share trading policy relating to the Board, senior managers and other employees dealing in the Company’s shares.
Principle 4
Safeguard integrity in financial reporting
The Board has established an Audit and Risk Management Committee, which operates under a Charter approved by the Board in September 2003 and amended by the Board in August 2006. Each of the members of the Committee is an independent director. The names of the members of the Committee and their attendances at meetings of the Committee appear in the Directors’ Report.
The Chief Executive, Chief Financial Officer, Managing Director – Hosting, Company Secretary and the external auditor attend meetings at the discretion of the Committee. The Committee also meets privately with the external auditor without management present.
Minutes of all Committee meetings are provided to the Board.
The Board has delegated to the Committee responsibility for making recommendations on the appointment, evaluation and dismissal of the external auditor, setting its fees and ensuring that the auditor reports to the Committee and the Board.
The Company is committed to audit independence. The Committee reviews the independence and objectivity of the external auditors. Those reviews include:
– seeking confirmation that the auditor is, in their professional judgement, independent of the Company. The external auditor, PricewaterhouseCoopers, has declared its independence to the Board; and
– considering whether, taken as a whole, the various relationships between the Company and the external auditor impair the auditor’s judgement or independence. The Committee is satisfied that the existing relationships between the Company and the external auditor do not give rise to any such impairment.
The Company’s audit engagement partners will rotate every five years.
Principle 5
Make timely and balanced disclosure
The Board has adopted a formal continuous disclosure plan, the object of which is to ensure that material information is identified and disclosed in a timely manner. The Board is advised of any notifiable events. In addition, the Board has developed a guidance paper on the Company’s disclosure obligations, which is intended to provide guidance for all managers on those obligations.
The Board approves all releases that are made to ASX Limited.
The Company Secretary is responsible for communications with the ASX.
For
per
sona
l use
onl
y

28
Corporate Governance Statement
Principle 6
Respect the rights of shareholders
In addition to complying with its continuous disclosure obligations under the ASX Listing Rules, the Company ensures that shareholders are kept informed in a variety of other ways:
– shareholders can gain access to information about the Company, including Annual Reports and financial statements, half-year financial statements, Board commentaries on those financial statements, information provided to analysts during briefings on those financial statements, notices of meeting and explanatory materials and all relevant announcements made to the market, through the website at www.macquarietelecom.com;
– in conducting analyst briefings, the Company takes care to ensure that any information provided to analysts is made available to the market prior to it being provided to analysts;
– the principal method of communication with shareholders is through the provision of the Annual Report and financial statements, the half-year financial statements and Annual General Meetings. Shareholders are encouraged to use these meetings to ask questions on any matters related to the Company, its business and the performance of that business; and
– the Company requests the external auditor to attend the Annual General Meeting and be available to answer questions about the conduct of the audit and the preparation and content of the auditor’s report.
Principle 7
Recognise and manage risk
The Board is responsible for ensuring that the Company has in place a system of risk management and internal compliance and control that effectively safeguards assets and enhances the value of shareholders’ investments.
The Board has adopted a formal risk management strategy and policy. In addition, the Company has established a formal framework for risk management and internal compliance, which includes the establishment of an internal business risk management function. The Audit and Risk Management Committee is responsible for reviewing and reporting to the Board on the effectiveness of the Company’s management of risk, including systems for internal controls. The business risk management function reports to the Board on a quarterly basis as to the effectiveness of the company’s management of its material business risks.
The assets of the Company and its controlled entities are insured under a comprehensive insurance program which is reviewed annually.
The Chief Executive and the Chief Financial Officer have stated to the Board in writing:
– that the Company’s financial reports are complete and present a true and fair view, in all material respects, of the financial condition and operational results of the Company and are in accordance with relevant accounting standards; and
– that the above statement is founded on a sound system of risk management and internal control and that the system is operating effectively in all material respects in relation to financial reporting risks.
Principle 8
Remunerate fairly and responsibly
The functions of the Corporate Governance, Nomination and Remuneration Committee include reviewing the remuneration arrangements for non-executive and executive directors and reviewing and approving the issue of shares and options under the Company’s employee share and option plans. The Committee also reviews remuneration for the senior management team and monitors, reviews and makes recommendations to the Board as to the remuneration policies of the Company generally. The name of the members of the Committee and their attendances at meetings of the Committee appear in the Directors’ Report.
Non-executive directors receive fees determined by the Board, but within the aggregate limits approved by shareholders at general meetings of the Company.
The remuneration of senior managers consists of a combination of fixed and variable (at risk) remuneration. The bonus paid to a senior manager is based on a review of the individual manager’s performance.
Details of shares and options issued to employees of controlled entities of the Company are included in Note 21 to the financial statements.
For
per
sona
l use
onl
y

Macquarie Telecom Annual Report 2010 29
Statement of Comprehensive IncomeYear ended 30 June 2010
Consolidated
2010 2009 Notes $’000 $’000
Revenue from continuing operations 3 238,117 242,863Expenses 3 (222,731) (233,259)Profit before income tax and finance costs 15,386 9,604
Finance costs (204) (402)Profit before income tax 15,182 9,202
Income tax expense 5 (4,742) (3,076)Profit from continuing operations 10,440 6,126
Profit from discontinued operation (net of tax) 29 7,485 1,321Net profit for year 18(b) 17,925 7,447
Other comprehensive incomeExchange differences on translation of foreign operations 18(a) 74 42Total comprehensive income for the year 17,999 7,489
cents cents
Earnings per share from continuing operations attributable to the ordinary equity holders of the company:
Basic profit per share 23 50.6 29.7Diluted profit per share 23 50.1 29.7
Earnings per share for profit attributable to the ordinary equity holders of the company:
Basic profit per share 23 86.8 36.1Diluted profit per share 23 86.1 36.1
The above statement of comprehensive income should be read in conjunction with the accompanying notes.
For
per
sona
l use
onl
y

30
Statement of Financial PositionAs at 30 June 2010
Consolidated
2010 2009 Notes $’000 $’000
Current Assets
Cash and cash equivalents 6 56,304 35,313Receivables 7 10,268 12,687Accrued income 8 9,074 10,373Other financial assets 9 - 1,506Other 10 2,091 2,947Total current assets 77,737 62,826
Non-Current Assets
Plant and equipment 11 26,169 25,581Deferred tax assets 5 6,157 5,712Other 12 1,565 1,868Total non-current assets 33,891 33,161Total assets 111,628 95,987
Current Liabilities
Payables 13 34,058 37,628Borrowings 14 342 1,430Current tax liabilities 5 4,360 1,754Provisions 15 1,260 971Other 16 262 479Total current liabilities 40,282 42,262
Non-Current Liabilities
Borrowings 14 - 342Deferred tax liabilities 5 - 3Provisions 15 981 1,136Other 16 1,170 1,420Total non-current liabilities 2,151 2,901Total liabilities 42,433 45,163Net assets 69,195 50,824
Equity
Contributed equity 17 42,723 87,025Reserves 18 148 43Retained profit/(loss) 18 26,324 (36,244)Total equity 69,195 50,824
The above statement of financial position should be read in conjunction with the accompanying notes.
For
per
sona
l use
onl
y
Macquarie Telecom Annual Report 2010 31
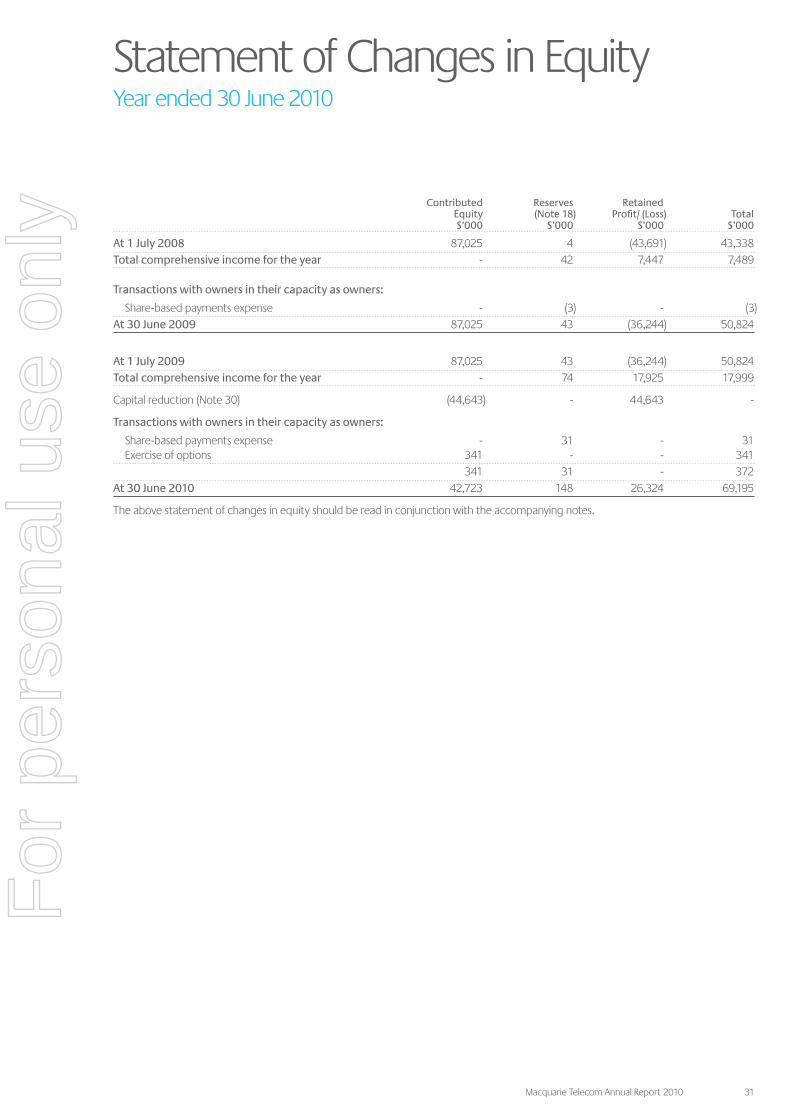
Statement of Changes in EquityYear ended 30 June 2010
Contributed Reserves Retained Equity (Note 18) Profit/ (Loss) Total $’000 $’000 $’000 $’000
At 1 July 2008 87,025 4 (43,691) 43,338Total comprehensive income for the year - 42 7,447 7,489
Transactions with owners in their capacity as owners:
Share-based payments expense - (3) - (3)At 30 June 2009 87,025 43 (36,244) 50,824
At 1 July 2009 87,025 43 (36,244) 50,824Total comprehensive income for the year - 74 17,925 17,999
Capital reduction (Note 30) (44,643) - 44,643 -
Transactions with owners in their capacity as owners:
Share-based payments expense - 31 - 31 Exercise of options 341 - - 341 341 31 - 372At 30 June 2010 42,723 148 26,324 69,195
The above statement of changes in equity should be read in conjunction with the accompanying notes.
For
per
sona
l use
onl
y
32
Statement of Cash FlowsYear ended 30 June 2010
Consolidated
2010 2009 Notes $’000 $’000
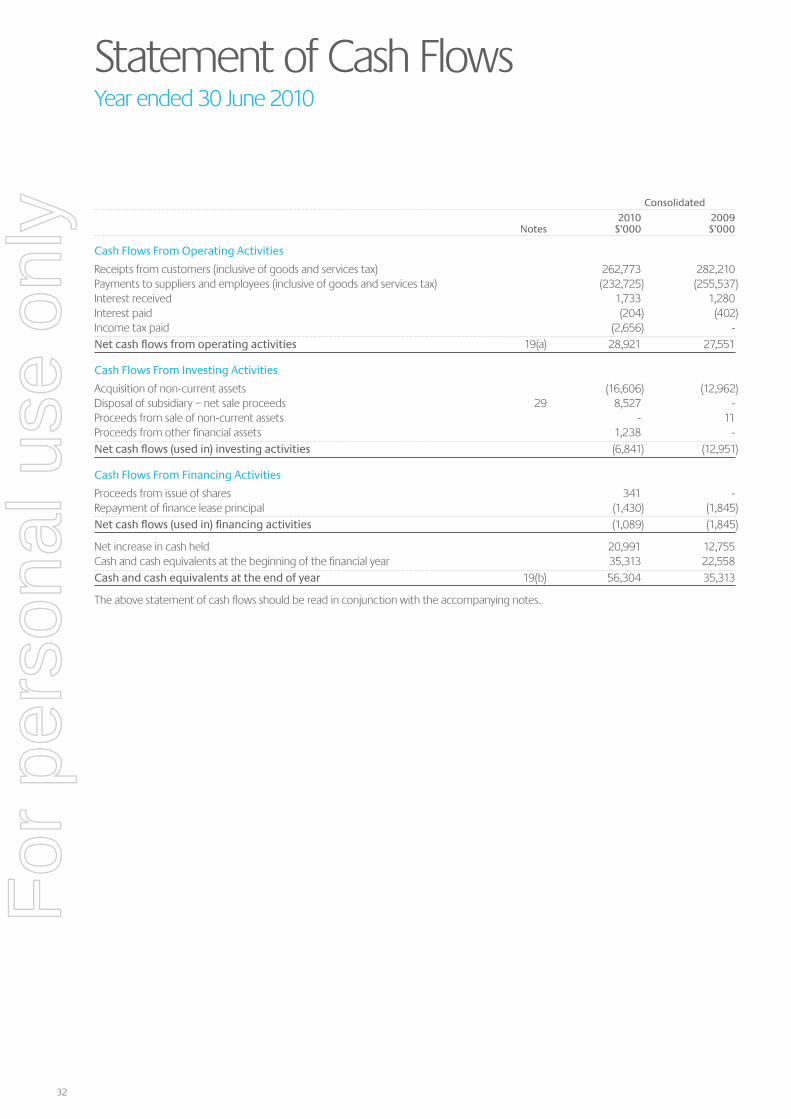
Cash Flows From Operating Activities
Receipts from customers (inclusive of goods and services tax) 262,773 282,210Payments to suppliers and employees (inclusive of goods and services tax) (232,725) (255,537)Interest received 1,733 1,280Interest paid (204) (402)Income tax paid (2,656) -Net cash flows from operating activities 19(a) 28,921 27,551
Cash Flows From Investing Activities
Acquisition of non-current assets (16,606) (12,962)Disposal of subsidiary – net sale proceeds 29 8,527 -Proceeds from sale of non-current assets - 11Proceeds from other financial assets 1,238 -Net cash flows (used in) investing activities (6,841) (12,951)
Cash Flows From Financing Activities
Proceeds from issue of shares 341 -Repayment of finance lease principal (1,430) (1,845)Net cash flows (used in) financing activities (1,089) (1,845)
Net increase in cash held 20,991 12,755Cash and cash equivalents at the beginning of the financial year 35,313 22,558Cash and cash equivalents at the end of year 19(b) 56,304 35,313
The above statement of cash flows should be read in conjunction with the accompanying notes.
For
per
sona
l use
onl
y
Macquarie Telecom Annual Report 2010 33
Notes to the Financial StatementsAt 30 June 2010
1. Basis of Preparation of the Financial Report
(a) Corporate information
The financial report of Macquarie Telecom Group Limited (“Macquarie” or the “Company”) for the year ended 30 June 2010 was authorised for issue in accordance with a resolution of directors on 26 August 2010.
Macquarie is the head entity of a consolidated group comprising Macquarie Telecom Pty Limited (“MT”), Macquarie Hosting Pty Limited (“MH”), Macquarie Telecom Carrier Services Pty Limited (“MTCS”) and Macquarie Telecom Network Carrier Services Pty Limited (“MTNCS”). Formerly part of the consolidated group, Macquarie Telecom Pte Limited was sold on 31 July 2009 (see Note 29).
Macquarie is a company limited by shares incorporated in Australia whose shares are publicly traded on the ASX.
The nature of the operations and principal activities of the Group are described in Note 27.
(b) Basis of preparation
The financial report is a general purpose financial report which has been prepared in accordance with the requirements of the Corporations Act 2001 and Australian Accounting Standards.
The financial report has been prepared in accordance with the historical cost convention except for equity based payments that have been measured at fair value.
Compliance with IFRSThis financial report also complies with International Financial Reporting Standards (“IFRS”) as issued by the International Accounting Standards Board (“IASB”).
Financial statement presentationThe group has applied the revised AASB 101 Presentation of Financial Statements which became effective on 1 January 2009. The revised standard requires the separate presentation of a statement of comprehensive income and a statement of changes in equity. All non-owner changes in equity must now be presented in the statement of comprehensive income. As a consequence, the Group had to change the presentation of its financial statements. Comparative information has been re-presented so that it is also in conformity with the revised standard.
2. Summary of Significant Accounting Policies
(a) Principles of consolidation
The consolidated financial statements are those of the consolidated entity, comprising Macquarie and all entities that Macquarie controlled during the year and at balance sheet date. Consolidation is based on control, which is the power to govern the financial and operating policies of an entity so as to obtain benefits from its activities.
The financial statements of subsidiaries are prepared for the same reporting period as that of the parent entity, using consistent accounting policies. All inter-company balances and transactions have been eliminated in full. Subsidiaries are deconsolidated from the date that control ceases.
(b) Significant accounting judgements, estimates and assumptions
In preparing the financial report, the consolidated entity is required to make estimates and assumptions about carrying values of assets and liabilities. The key estimates and accounting judgements for Macquarie relate to income taxes, revenue recognition (see (j)) and the depreciation of non-current assets. These estimates and assumptions are based on historical experience and various other factors that are believed to be reasonable under the circumstances. Actual results may differ from these estimates. The estimates and underlying assumptions are reviewed on an ongoing basis.
(c) Foreign currencies
Translation of foreign currency transactionsTransactions denominated in a foreign currency are translated at the rates in existence at the date of the transactions.
Exchange gains and losses are brought to account in determining the net profit or loss for the year.
Amounts payable to and by the entities within the consolidated entity that are outstanding at balance date and are denominated in foreign currencies have been converted to local currency using rates of exchange ruling at the end of the financial year.
Translation of financial reports of overseas operationThe functional and presentation currency of the parent company and its Australian subsidiaries is Australian dollars. The functional currency of the former overseas subsidiary is Singapore dollars. The financial reports of the former overseas subsidiary are translated using the average rate for the profit and loss with any exchange differences taken directly to the foreign currency translation reserve. Foreign currency differences on intra-group investments, including long-term loans, were taken through the foreign currency translation reserve. This reserve was recycled into the income statement when the Singapore subsidiary was sold.
For
per
sona
l use
onl
y
34
Notes to the Financial StatementsAt 30 June 2010
2. Summary of Significant Accounting Policies (cont’d)
(d) Plant and equipment
Cost and valuationPlant and equipment is stated at cost less accumulated depreciation and any impairment in value. Plant and equipment includes costs in relation to Information Technology (“IT”) development and infrastructure development projects where future benefits are probable to exceed these costs.
DepreciationDepreciation is calculated on a straight-line basis on all plant and equipment commencing from the time the asset is ready for use.
2010 2009
Major depreciation periods are:
Plant and equipment 1 to 10 years 1 to 10 years
Leasehold improvements are amortised over the lease term.
(e) Transmission capacity
Expenditure, relating to the acquisition of transmission capacity, is capitalised to the extent that it is expected to provide future economic benefits to the Company. Capitalised expenditure less rebates are amortised over the period in which the related benefits are expected to be realised.
(f) Impairment of assets
At each reporting date, the consolidated entity assesses whether there is any indication that an asset may be impaired. Where an indicator of impairment exists, the consolidated entity makes a formal estimate of recoverable amount. Where the carrying amount of an asset exceeds its recoverable amount, the asset is considered impaired and is written down to its recoverable amount.
Recoverable amount is the greater of fair value less costs to sell and value in use. It is determined for an individual asset, unless the asset’s value in use cannot be estimated to be close to its fair value less costs to sell and it does not generate cash inflows that are largely independent of those from other assets or groups of assets, in which case, the recoverable amount is determined for the cash-generating unit to which the asset belongs.
In assessing value in use, the estimated future cash flows are discounted to their present value using a pre-tax discount rate that reflects current market assessments of the time value of money and the risks specific to the asset.
Impairment losses are recognised in the income statement.
(g) Cash and cash equivalents
For the purpose of presentation in the statement of cash flows, cash and cash equivalents includes cash on hand, deposits held at call with financial institutions and other short-term highly liquid investments that are readily convertible to known amounts of cash and which are subject to insignificant risk of changes in value.
(h) Trade and other receivables
Trade receivables are recognised and carried at original invoice amount, less a provision for any uncollectible debts.
An allowance for doubtful debts is made when there is objective evidence that the Group will not be able to collect the debts. Bad debts are written off when identified.
Receivables from related parties are recognised at amortised cost.
Other receivables are recognised at cost.
(i) Other financial assets
Bank deposits are measured at their nominal amount.
Investments in subsidiaries are recorded at the lower of cost and net recoverable amount.
(j) Accrued income
Accrued income represents the estimated amounts of unbilled services provided to all customers as at the balance date after taking into account all discounts as applicable.
(k) Payables
Liabilities for carrier suppliers (trade creditors) are carried at the net amount the consolidated entity expects to have to pay each carrier, in respect of the services received.
Liabilities for other trade creditors and other amounts are carried at cost which is the fair value of the consideration to be paid in the future for goods and services received, whether or not billed to the consolidated entity.
Payables to related parties are carried at amortised cost.
(l) Leases
Leases are classified at their inception as either operating or finance leases based on the economic substance of the agreement so as to reflect the risks and benefits incidental to ownership.
Operating leasesThe minimum lease payments of operating leases, where the lessor effectively retains substantially all of the risks and benefits of ownership of the leased item, are recognised as an expense on a straight-line basis.
In the event that lease incentives are received to enter into non-cancellable operating leases, such incentives are recognised as a liability. Lease payments are allocated between rental expenses, reduction of the liability and, where appropriate, interest expense over the term of the lease.
For
per
sona
l use
onl
y
Macquarie Telecom Annual Report 2010 35
Finance leasesLeases which effectively transfer substantially all of the risks and benefits incidental to ownership of the leased item to the consolidated entity are capitalised at the fair value of the leased property or, if lower, at the present value of the minimum lease payments and disclosed as property, plant and equipment under lease. A lease liability of equal value is also recognised.
Capitalised lease assets are depreciated over the shorter of the estimated useful life of the assets and the lease term. Minimum lease payments are allocated between interest expense and reduction of the lease liability.
(m) Employee benefits
The liability for employees’ benefits to wages, salaries, bonuses and annual leave is accrued to balance date based on the consolidated entity’s present obligation to pay resulting from employees’ services provided. The liability for employees’ benefits to long service leave is provided to balance date based on the present value of the estimated future cash flows to be paid by the consolidated entity resulting from the employees’ services provided.
(n) Share-based payment transactions
The consolidated entity provides benefits to employees, including directors, in the form of share-based payment transactions.
The cost of these equity-settled transactions with employees is measured by reference to the fair value at the date at which they are granted. The fair value is determined using the Monte Carlo Simulation model for those options subject to performance hurdles.
The cost of equity-settled transactions is recognised, together with a corresponding increase in equity, over the period in which the performance conditions are fulfilled, ending on the date on which the relevant employees become fully entitled to the award (Vesting date).
The cumulative expense recognised for equity-settled transactions at each reporting date until vesting reflects (i) the extent to which the vesting period has expired; and (ii) the number of awards that, in the opinion of the directors, will vest ultimately. This opinion is formed based on the best available information at balance date. No adjustment is made for the likelihood of market performance conditions being met as the effect of those conditions is included in the determination of fair value at grant date.
No expense is recognised for awards that do not vest based on non-market conditions.
(o) Contributed equity
Issued capital is recognised at the fair value of the consideration received by the Company.
Any transaction costs arising on the issue of ordinary shares are recognised directly in equity as a reduction of the share proceeds received.
(p) Revenue recognition
Revenue is recognised to the extent that it is probable that the economic benefits will flow to the entity and the revenue can be reliably measured. The following specific recognition criteria must also be met before revenue is recognised:
Service revenueService revenue is recognised when the telecommunication services have been provided to the customer. Revenue is recognised net of customer discounts and allowances.
InterestInterest income is recognised using the effective interest method. This is a method of calculating the amortised cost of a financial asset and allocating the interest income over the relevant period using the effective interest rate, which is the rate that exactly discounts estimated future cash receipts through the expected life of the financial asset to the net carrying amount of the financial asset.
(q) Taxes
Income taxesThe income tax expense or revenue for the period is the tax payable on the current period’s taxable income based on the applicable income tax rate for each jurisdiction, adjusted by changes in deferred tax assets and liabilities attributable to temporary differences and to unused tax losses.
The current income tax charge is calculated on the basis of the tax laws enacted or substantively enacted at the end of the reporting period. Management periodically evaluates positions taken in tax returns with respect to situations in which applicable tax regulation is subject to interpretation. It establishes provisions, where appropriate, on the basis of amounts expected to be paid to the tax authorities.
Deferred income tax is provided in full, using the liability method, on temporary differences arising between the tax bases of assets and liabilities and their carrying amounts in the consolidated financial statements. Deferred income tax is determined using tax rates (and laws) that have been enacted or substantially enacted by the end of the reporting period and are expected to apply when the related deferred income tax asset is realised or the deferred income tax liability is settled.
Deferred tax assets are recognised for deductible temporary differences and unused tax losses only if it is probable that future taxable amounts will be available to utilise those temporary differences and losses.
Deferred tax assets and liabilities are offset when there is a legally enforceable right to offset current tax assets and liabilities and when the deferred tax balances relate to the same taxation authority. Current tax assets and tax liabilities are offset where the entity has a legally enforceable right to offset and intends either to settle on a net basis, or to realise the asset and settle the liability simultaneously.
For
per
sona
l use
onl
y
36
Notes to the Financial StatementsAt 30 June 2010
2. Summary of Significant Accounting Policies (cont’d)
(q) Taxes (cont’d)
Current and deferred tax is recognised in profit or loss, except to the extent that it relates to items recognised in other comprehensive income or directly in equity. In this case, the tax is also recognised in other comprehensive income or directly in equity, respectively.
(i) Investment allowancesCompanies within the Group may be entitled to claim special tax deductions for investments in qualifying assets (investment allowances). The Group accounts for such allowances as tax credits, which means that the allowance reduces income tax payable and current tax expense. A deferred tax asset is recognised for unclaimed tax credits that are carried forward as deferred tax assets.
(ii) Tax consolidation legislationMacquarie Telecom Group Limited and its wholly owned Australian controlled entities have implemented the tax consolidation legislation.
The head entity, Macquarie Telecom Group Limited, and the controlled entities in the tax consolidation group, account for their own current and deferred tax amounts. These tax amounts are measured as if each entity in the tax consolidated group continues to be a stand-alone taxpayer in its own right.
In addition to its own current and deferred tax amounts, Macquarie Telecom Group Limited also recognises the current tax liabilities or assets and the deferred tax assets arising from unused tax losses and unused tax credits assumed from controlled entities in the tax consolidated group.
Assets or liabilities arising under tax funding agreements with the tax consolidated entities are recognised as amounts receivable from or payable to other entities in the Group. Details of the tax funding agreement are disclosed in Note 5.
Any differences between the amounts assumed and amounts receivable or payable under the tax funding agreement are recognised as a contribution to (or distribution from) wholly owned tax consolidated entities.
Goods and Services Tax (GST)Revenues, expenses and assets are recognised net of the amount of GST except:
– where the GST incurred on a purchase of goods and services is not recoverable from the taxation authority, in which case the GST is recognised as part of the cost of acquisition of the asset or as part of the expense item as applicable; and
– receivables and payables are stated with the amount of GST included.
The net amount of GST recoverable from, or payable to, the taxation authority is included as part of receivables or payables in the balance sheet.
Cash flows are included in the Statement of Cash Flows on a gross basis and the GST component of cash flows arising from investing and financing activities, which is recoverable from, or payable to, the taxation authority are classified as operating cash flows.
Commitments and contingencies are disclosed net of the amount of GST recoverable from, or payable to, the taxation authority.
(r) Borrowings
Borrowings are initially recognised at fair value, net of transaction costs incurred. Borrowings are subsequently measured at amortised cost. Any difference between proceeds (net of transaction costs) and the redemption amount is recognised in the income statement over the period of the borrowings using the effective interest rate method.
Borrowings are removed from the balance sheet when the obligation specified in the contract is discharged, cancelled or expired. The difference between the carrying amount of a financial liability that has been extinguished or transferred to another party and the consideration paid, including any non-cash assets transferred or liabilities assumed, is recognised in other income or other expenses.
Borrowings are classified as current liabilities unless the Group has an unconditional right to defer settlement of the liability for at least 12 months after the balance sheet date.
(s) Segment reporting
A business segment is identified for a group of assets and operations engaged in providing services that are subject to risks and returns that are different to those of other business segments. A geographical segment is identified when products or services are provided within a particular economic environment subject to risks and returns that are different from those of segments operating in other economic environments.
Change in accounting policyThe group has adopted AASB 8 Operating Segments from 1 July 2009. AASB 8 replaces AASB 114 Segment Reporting. The new standard requires a ‘management approach’, under which segment information is presented on the same basis as that used for internal reporting purposes. This has resulted in an increase in the number of reportable segments presented. In addition, the segments are reported in a manner that is consistent with the internal reporting provided to the chief operating decision maker. There has been no impact on the measurement of the Company’s assets and liabilities. Comparatives for 2009 have been restated.
For
per
sona
l use
onl
y
Macquarie Telecom Annual Report 2010 37
(t) Provisions
Provisions are recognised when the Group has a present legal or constructive obligation as a result of past events, it is probable that an outflow of resources will be required to settle the obligation and the amount has been reliably estimated. Provisions are not recognised for future operating losses.
Provisions are measured at the present value of management’s best estimate of the expenditure required to settle the present obligation at the balance sheet date. The discount rate used to determine the present value reflects current market assessment of the time value of money and the risks specific to the liability.
(u) Earnings per share
Basic earnings per shareBasic earnings per share is calculated by dividing the profit attributable to equity holders of the company, excluding any costs of servicing equity other than ordinary shares, by the weighted average number of shares outstanding during the financial year.
Diluted earnings per shareDiluted earnings per share adjusts the figures used in the determination of basic earnings per share to take into account the after income tax effect of interest and other financing costs associated with dilutive potential ordinary shares and the weighted average number of shares assumed to have been issued for no consideration in relation to dilutive potential ordinary shares.
(v) Discontinued operations
A discontinued operation is a component of the entity that has been disposed of or is classified as held for sale and that represents a separate major line of business or geographical area of operations, or is part of a single coordinated plan to dispose of such a line of business or area of operations. The results of discontinued operations are presented separately on the face of the income statement.
(w) Rounding of amounts
Amounts contained in the financial report have been rounded to the nearest $1,000, where rounding is applicable, under the option available to the Company under ASIC Class Order 98/100. The Company is an entity to which the Class Order applies.
(x) Parent entity financial information
The financial information for the parent entity, Macquarie Telecom Group Limited, disclosed in Note 31 has been prepared on the same basis as the consolidated financial statements except as set out in Note 2(q) above “Tax consolidation legislation”.
(y) New accounting standards and interpretations
Certain new accounting standards and UIG interpretations have been published that are not mandatory for 30 June 2010 reporting periods. The consolidated entity’s assessment of the impact of relevant new standards and interpretations are set out below.
AASB 9 Financial Instruments and AASB 2009-11 Amendments to Australian Accounting Standards arising from AASB 9AASB 9 Financial Instruments addresses the classification and measurement of financial assets. The standard is not applicable until 1 January 2013 but is available for early adoption. The Group is yet to assess its full impact and has not decided when to adopt AASB 9.
(z) Comparatives
Prior year comparatives have been restated where necessary to conform with current presentation.
For
per
sona
l use
onl
y
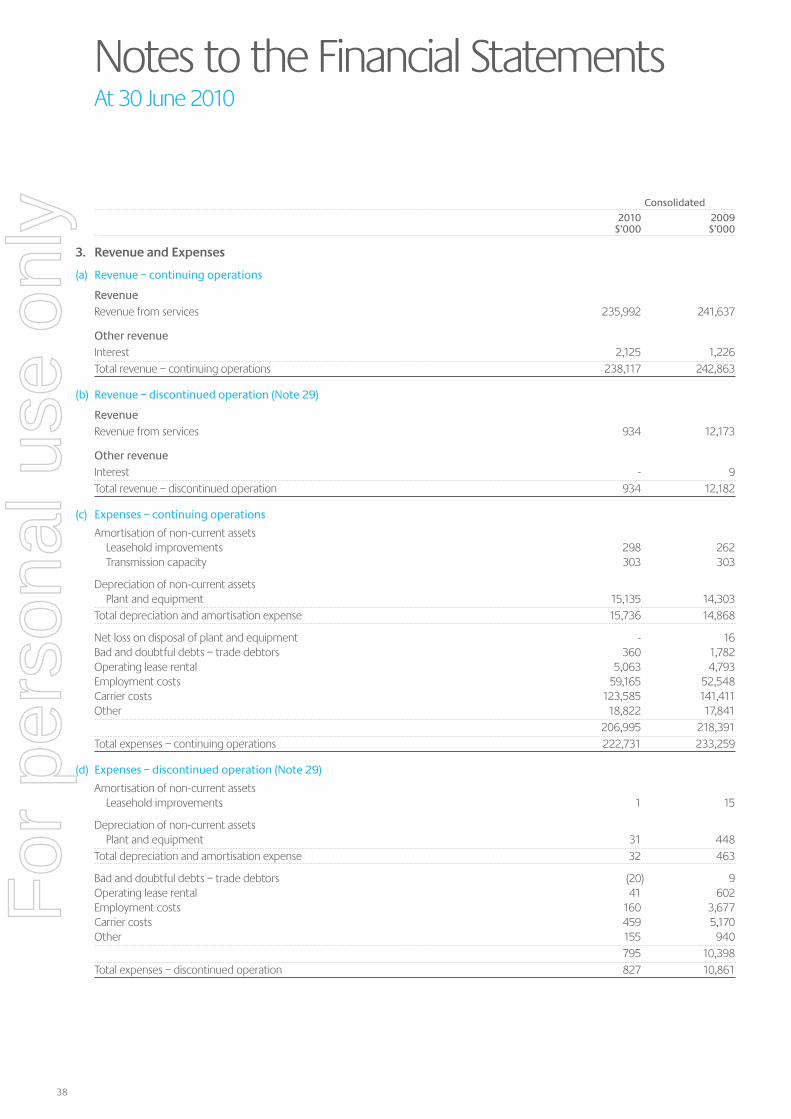
38
Notes to the Financial StatementsAt 30 June 2010
Consolidated
2010 2009 $’000 $’000
3. Revenue and Expenses
(a) Revenue – continuing operations
RevenueRevenue from services 235,992 241,637
Other revenueInterest 2,125 1,226Total revenue – continuing operations 238,117 242,863
(b) Revenue – discontinued operation (Note 29)
RevenueRevenue from services 934 12,173
Other revenueInterest - 9Total revenue – discontinued operation 934 12,182
(c) Expenses – continuing operations
Amortisation of non-current assets Leasehold improvements 298 262 Transmission capacity 303 303
Depreciation of non-current assets Plant and equipment 15,135 14,303Total depreciation and amortisation expense 15,736 14,868
Net loss on disposal of plant and equipment - 16Bad and doubtful debts – trade debtors 360 1,782Operating lease rental 5,063 4,793Employment costs 59,165 52,548Carrier costs 123,585 141,411Other 18,822 17,841 206,995 218,391Total expenses – continuing operations 222,731 233,259
(d) Expenses – discontinued operation (Note 29)
Amortisation of non-current assets Leasehold improvements 1 15
Depreciation of non-current assets Plant and equipment 31 448Total depreciation and amortisation expense 32 463
Bad and doubtful debts – trade debtors (20) 9Operating lease rental 41 602Employment costs 160 3,677Carrier costs 459 5,170Other 155 940 795 10,398Total expenses – discontinued operation 827 10,861
For
per
sona
l use
onl
y

Macquarie Telecom Annual Report 2010 39
4. Dividends
(a) There were no dividends proposed or paid during the year (2009: nil).
(b) Dividends not recognised at the end of the reporting period
Since year end, the directors declared the payment of a special dividend of 20 cents per ordinary share fully franked and an ordinary dividend of 20 cents per ordinary share fully franked based on tax paid of 30%.
The aggregate amount of the declared dividends expected to be paid on 14 October 2010 out of retained earnings at 30 June 2010, but not recognised as a liability at year end is $8.33 million (2009: Nil)
Consolidated
2010 2009 $’000 $’000
(c) Franking account balance
The amount of franking credits available for the subsequent financial years based on a tax rate of 30% (2009: 30%) 7,016 1,754
The above amount represents the balance of the franking account as at the reporting date, adjusted for:
(i) franking credits that will arise from the payment of the amount of the provision for income tax, and
(ii) franking debits that will arise from the payment of dividends recognised as a liability at the reporting date
The impact on the franking account of the dividends recommended by the directors since the end of the reporting period, but not recognised as a liability at the reporting date, will be a reduction in the franking account of $3,568,221 (2009: nil)
5. Income Tax
(a) Income tax expense
Current tax 5,190 1,439Deferred tax (448) 1,637 4,742 3,076
Income tax expense is attributable to:Profit from continuing operations 4,742 3,076Profit from discontinued operation - -Aggregate income tax expense 4,742 3,076
Deferred income tax (revenue)/expense included in income tax expense comprises:(Increase)/decrease in deferred tax assets (314) 1,640(Decrease) in deferred tax liabilities (134) (3) (448) 1,637
(b) Numerical reconciliation of income tax expense to prima facie tax payable
Profit from continuing operations before income tax expense 15,182 9,202Profit from discontinued operation before income tax expense 7,485 1,321 22,667 10,523
Tax at the Australian tax rate of 30% (2009: 30%) 6,800 3,157
Tax effect of amounts which are not deductible/(taxable) in calculating taxable income:Singapore taxable amounts not brought to account 67 (21)Difference in overseas tax rates 2 (14)Expenditure not allowable for income tax purposes 311 208Government investment allowance concession (112) (402)Decrease in foreign tax credits carried forward 58 3Research and development concession - (340)Adjustments to tax in respect of prior years (171) 91Exempt gain on sale of discontinued operation (2,213) -Other - 394Income tax expense 4,742 3,076
For
per
sona
l use
onl
y
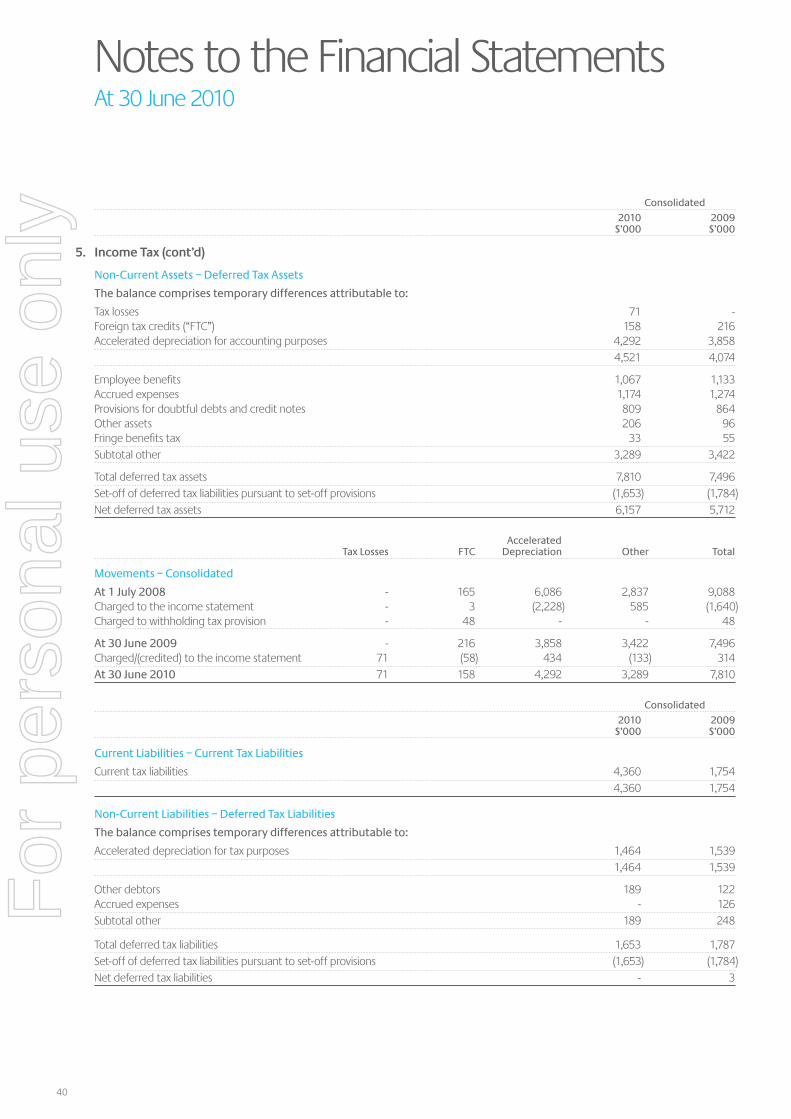
40
Notes to the Financial StatementsAt 30 June 2010
Consolidated
2010 2009 $’000 $’000
5. Income Tax (cont’d)
Non-Current Assets – Deferred Tax Assets
The balance comprises temporary differences attributable to:
Tax losses 71 -Foreign tax credits (“FTC”) 158 216Accelerated depreciation for accounting purposes 4,292 3,858 4,521 4,074
Employee benefits 1,067 1,133Accrued expenses 1,174 1,274Provisions for doubtful debts and credit notes 809 864Other assets 206 96Fringe benefits tax 33 55Subtotal other 3,289 3,422
Total deferred tax assets 7,810 7,496Set-off of deferred tax liabilities pursuant to set-off provisions (1,653) (1,784)Net deferred tax assets 6,157 5,712
Accelerated Tax Losses FTC Depreciation Other Total
Movements – Consolidated
At 1 July 2008 - 165 6,086 2,837 9,088Charged to the income statement - 3 (2,228) 585 (1,640)Charged to withholding tax provision - 48 - - 48
At 30 June 2009 - 216 3,858 3,422 7,496Charged/(credited) to the income statement 71 (58) 434 (133) 314At 30 June 2010 71 158 4,292 3,289 7,810
Consolidated
2010 2009 $’000 $’000
Current Liabilities – Current Tax Liabilities
Current tax liabilities 4,360 1,754 4,360 1,754
Non-Current Liabilities – Deferred Tax Liabilities
The balance comprises temporary differences attributable to:
Accelerated depreciation for tax purposes 1,464 1,539 1,464 1,539
Other debtors 189 122Accrued expenses - 126Subtotal other 189 248
Total deferred tax liabilities 1,653 1,787Set-off of deferred tax liabilities pursuant to set-off provisions (1,653) (1,784)Net deferred tax liabilities - 3
For
per
sona
l use
onl
y

Macquarie Telecom Annual Report 2010 41
Accelerated Depreciation Other Total
Movements – Consolidated
At 1 July 2008 1,670 120 1,790Charged/(credited) to the income statement (131) 128 (3)
At 30 June 2009 1,539 248 1,787Charged/(credited) to the income statement (75) (59) (134)Disposal of discontinued operation - - -At 30 June 2010 1,464 189 1,653
Tax consolidationMacquarie and its 100% owned Australian resident subsidiaries have formed a tax consolidated group with effect from 1 July 2002. Macquarie is the head entity of the tax consolidated group. The agreement provides for the allocation of income tax liabilities between the entities should the head entity default on its tax obligations. At balance date, the possibility of default is remote.
Tax effect accounting by members of the tax consolidated groupMembers of the tax consolidated group have entered into a tax funding agreement. The tax funding agreement provides for the allocation of current taxes to members of the tax consolidated group in accordance with their accounting profit/(loss) for the period, while deferred taxes are allocated to members of the tax consolidated group in accordance with AASB 112 Income Taxes and UIG 1052 Tax Consolidation Accounting.
Consolidated
2010 2009 Notes $’000 $’000
6. Cash and Cash Equivalents Cash at bank and on hand 19(b) 56,304 35,313
7. Receivables
Current
Trade debtors 12,189 14,398Provision for doubtful debts (2,688) (2,907)Provision for credit notes (1,513) (760)Receipts due from trade debt purchase facility 19(d) - 1,391Other receivables 2,280 565 10,268 12,687
(a) Australian dollar equivalents
Australian dollar equivalent of amounts receivable in foreign currencies not effectively hedged:– Singapore dollars - 418
(b) Terms and conditions relating to the above financial instruments:
(i) Sales are normally on 14 day terms; and
(ii) Details of impairment of trade receivables are set out in Note 28(b)
(c) Movements in provision for doubtful debts/credit notes are as follows:
At 1 July (3,667) (3,484)Amounts written off 560 2,097Net additional amounts provided (1,147) (2,280)Disposal of discontinued operation 52 -At 30 June (4,202) (3,667)
8. Accrued Income Accrued income 9,074 10,373
For
per
sona
l use
onl
y
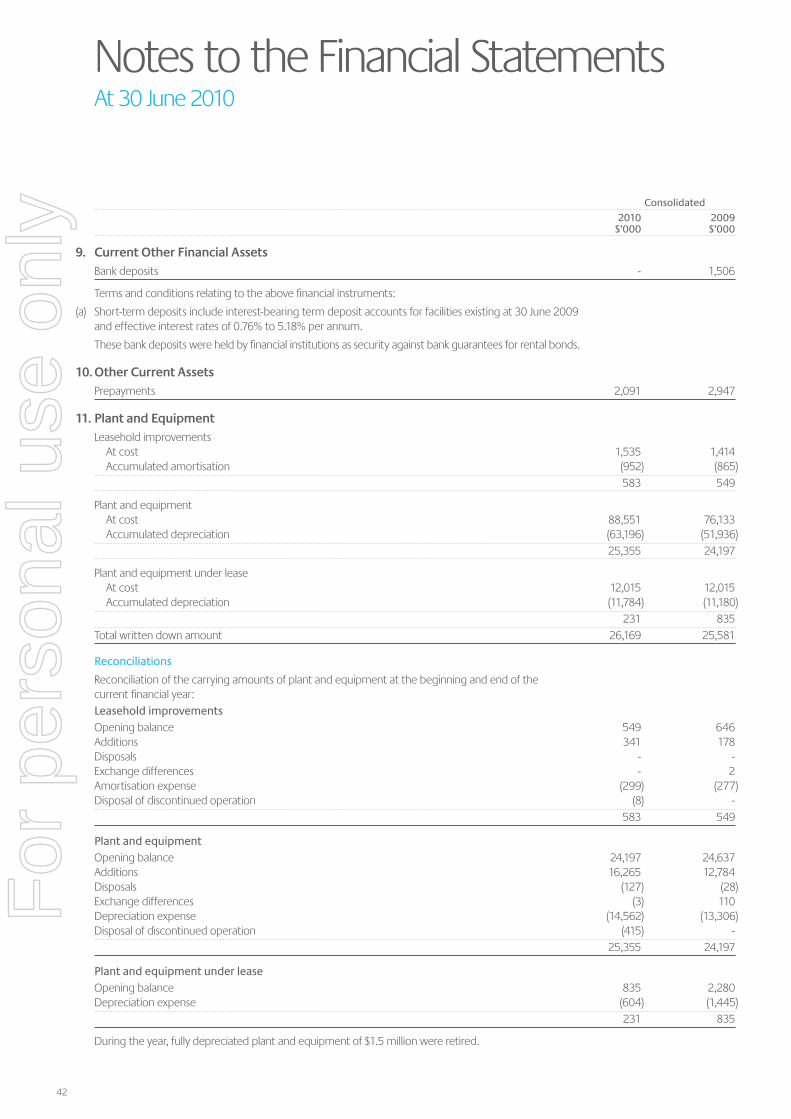
42
Notes to the Financial StatementsAt 30 June 2010
Consolidated
2010 2009 $’000 $’000
9. Current Other Financial Assets Bank deposits - 1,506
Terms and conditions relating to the above financial instruments:
(a) Short-term deposits include interest-bearing term deposit accounts for facilities existing at 30 June 2009 and effective interest rates of 0.76% to 5.18% per annum.
These bank deposits were held by financial institutions as security against bank guarantees for rental bonds.
10. Other Current Assets Prepayments 2,091 2,947
11. Plant and Equipment Leasehold improvements At cost 1,535 1,414 Accumulated amortisation (952) (865) 583 549
Plant and equipment At cost 88,551 76,133 Accumulated depreciation (63,196) (51,936) 25,355 24,197
Plant and equipment under lease At cost 12,015 12,015 Accumulated depreciation (11,784) (11,180) 231 835Total written down amount 26,169 25,581
Reconciliations
Reconciliation of the carrying amounts of plant and equipment at the beginning and end of the current financial year:Leasehold improvementsOpening balance 549 646Additions 341 178Disposals - -Exchange differences - 2Amortisation expense (299) (277)Disposal of discontinued operation (8) - 583 549
Plant and equipmentOpening balance 24,197 24,637Additions 16,265 12,784Disposals (127) (28)Exchange differences (3) 110Depreciation expense (14,562) (13,306)Disposal of discontinued operation (415) - 25,355 24,197
Plant and equipment under leaseOpening balance 835 2,280Depreciation expense (604) (1,445) 231 835
During the year, fully depreciated plant and equipment of $1.5 million were retired.
For
per
sona
l use
onl
y
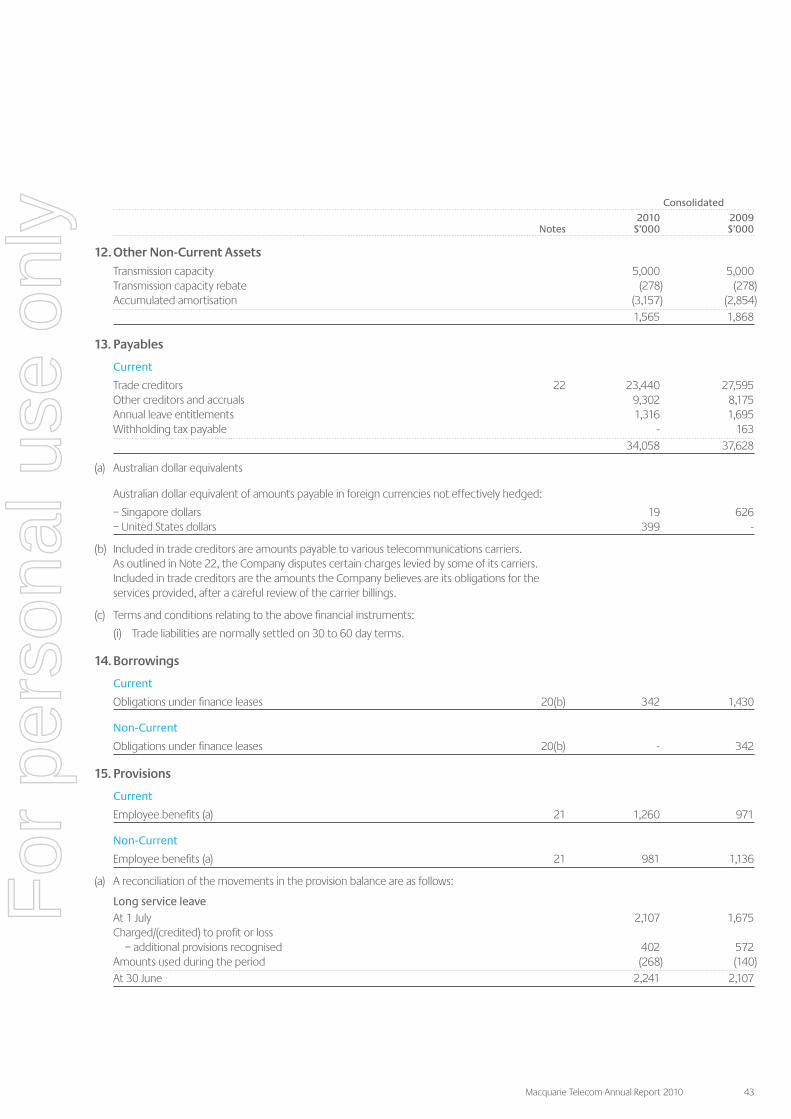
Macquarie Telecom Annual Report 2010 43
Consolidated
2010 2009 Notes $’000 $’000
12. Other Non-Current AssetsTransmission capacity 5,000 5,000Transmission capacity rebate (278) (278)Accumulated amortisation (3,157) (2,854) 1,565 1,868
13. Payables
Current
Trade creditors 22 23,440 27,595Other creditors and accruals 9,302 8,175Annual leave entitlements 1,316 1,695Withholding tax payable - 163 34,058 37,628
(a) Australian dollar equivalents
Australian dollar equivalent of amounts payable in foreign currencies not effectively hedged:
– Singapore dollars 19 626– United States dollars 399 -
(b) Included in trade creditors are amounts payable to various telecommunications carriers. As outlined in Note 22, the Company disputes certain charges levied by some of its carriers. Included in trade creditors are the amounts the Company believes are its obligations for the services provided, after a careful review of the carrier billings.
(c) Terms and conditions relating to the above financial instruments:
(i) Trade liabilities are normally settled on 30 to 60 day terms.
14. Borrowings
Current
Obligations under finance leases 20(b) 342 1,430
Non-Current
Obligations under finance leases 20(b) - 342
15. Provisions
Current
Employee benefits (a) 21 1,260 971
Non-Current
Employee benefits (a) 21 981 1,136
(a) A reconciliation of the movements in the provision balance are as follows:
Long service leaveAt 1 July 2,107 1,675Charged/(credited) to profit or loss – additional provisions recognised 402 572Amounts used during the period (268) (140)At 30 June 2,241 2,107
For
per
sona
l use
onl
y
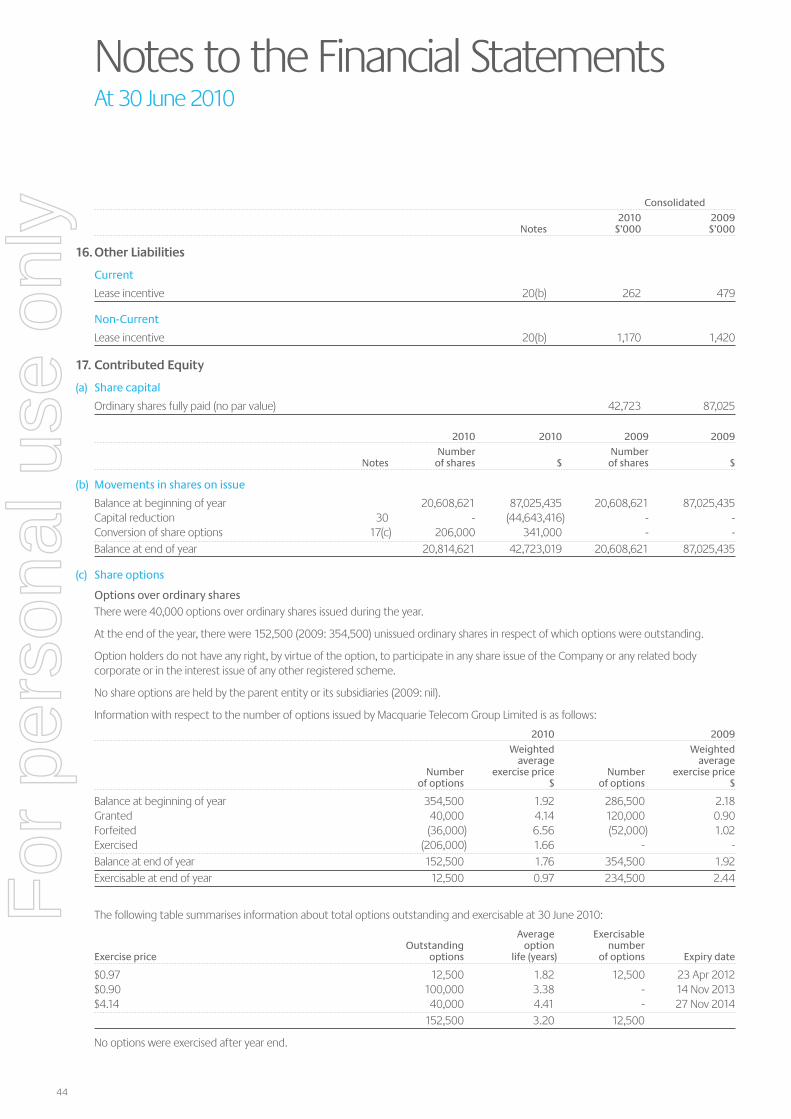
44
Notes to the Financial StatementsAt 30 June 2010
Consolidated
2010 2009 Notes $’000 $’000
16. Other Liabilities
Current
Lease incentive 20(b) 262 479
Non-Current
Lease incentive 20(b) 1,170 1,420
17. Contributed Equity
(a) Share capital
Ordinary shares fully paid (no par value) 42,723 87,025
2010 2010 2009 2009
Number Number Notes of shares $ of shares $
(b) Movements in shares on issue
Balance at beginning of year 20,608,621 87,025,435 20,608,621 87,025,435Capital reduction 30 - (44,643,416) - -Conversion of share options 17(c) 206,000 341,000 - -Balance at end of year 20,814,621 42,723,019 20,608,621 87,025,435
(c) Share options
Options over ordinary sharesThere were 40,000 options over ordinary shares issued during the year.
At the end of the year, there were 152,500 (2009: 354,500) unissued ordinary shares in respect of which options were outstanding.
Option holders do not have any right, by virtue of the option, to participate in any share issue of the Company or any related body corporate or in the interest issue of any other registered scheme.
No share options are held by the parent entity or its subsidiaries (2009: nil).
Information with respect to the number of options issued by Macquarie Telecom Group Limited is as follows:
2010 2009
Weighted Weighted average average Number exercise price Number exercise price of options $ of options $
Balance at beginning of year 354,500 1.92 286,500 2.18Granted 40,000 4.14 120,000 0.90Forfeited (36,000) 6.56 (52,000) 1.02Exercised (206,000) 1.66 - -Balance at end of year 152,500 1.76 354,500 1.92Exercisable at end of year 12,500 0.97 234,500 2.44
The following table summarises information about total options outstanding and exercisable at 30 June 2010:
Average Exercisable Outstanding option number Exercise price options life (years) of options Expiry date
$0.97 12,500 1.82 12,500 23 Apr 2012$0.90 100,000 3.38 - 14 Nov 2013$4.14 40,000 4.41 - 27 Nov 2014 152,500 3.20 12,500
No options were exercised after year end.
For
per
sona
l use
onl
y

Macquarie Telecom Annual Report 2010 45
(d) Terms and conditions of contributed equity
Ordinary shares have the right to receive dividends as declared and, in the event of winding up the Company, to participate in the proceeds from the sale of all surplus assets in proportion to the number of and amounts paid up on shares held.
Ordinary shares entitle their holder to one vote, either in person or by proxy, at a meeting of the Company.
Consolidated
2010 2009 Notes $’000 $’000
18. Reserves and Retained Earnings Other reserves 18(a) 148 43
Retained profits/(accumulated losses) 18(b) 26,324 (36,244)
(a) Other reserves
(i) Nature and purpose of reservesThe foreign currency translation reserve is used to record exchange differences arising from the translation of foreign subsidiaries.
The employee equity benefits reserve is used to record the value of equity benefits provided to employees as part of their remuneration. Refer to Note 21 for further details of these plans.
(ii) Movements in reserves
Foreign currency translation reserve:
Balance at beginning of year (74) (116)Gain/(loss) on translation of foreign controlled entity (3) 42Disposal of discontinued operation 77 -Balance at end of year - (74)
Employee equity benefits reserve:
Balance at beginning of year 117 120Share-based payments 31 (3)Balance at end of year 148 117 148 43
(b) Retained profits/(accumulated losses)
Balance at beginning of year (36,244) (43,691)Capital reduction 30 44,643 -Profit attributable to members 17,925 7,447Total available for appropriation 26,324 (36,244)
Dividends paid or provided for - -Balance at end of year 26,324 (36,244)
For
per
sona
l use
onl
y
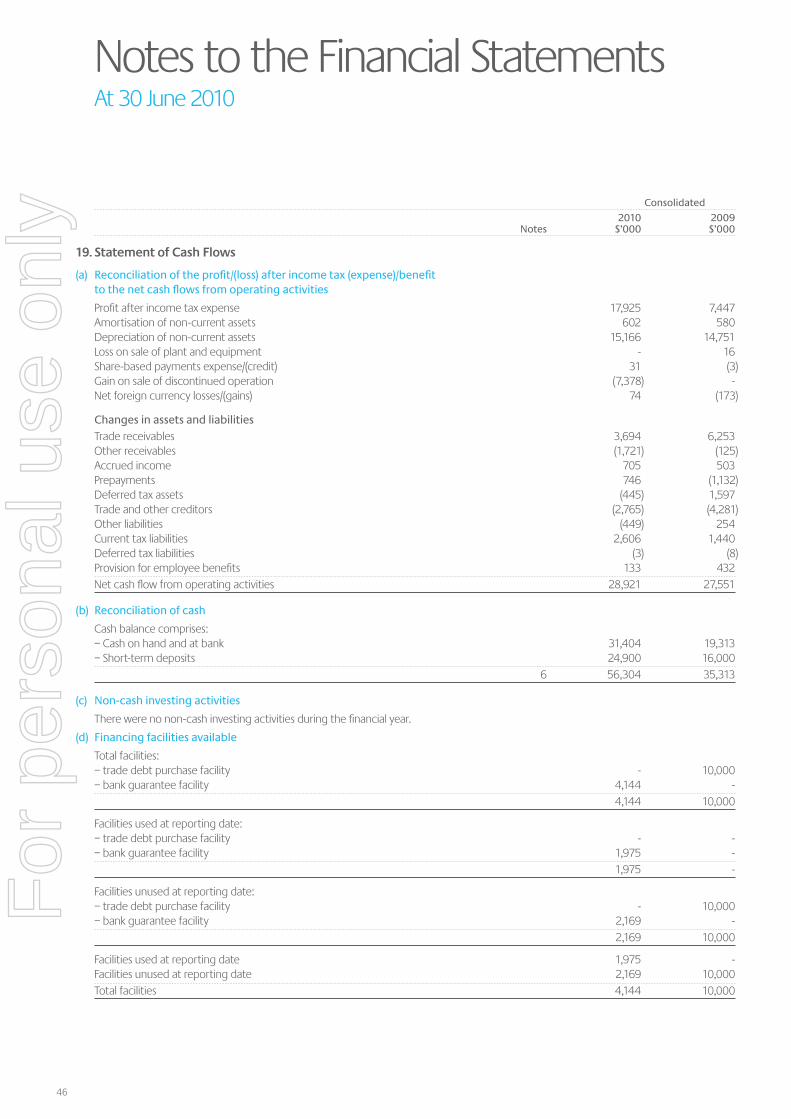
46
Notes to the Financial StatementsAt 30 June 2010
Consolidated
2010 2009 Notes $’000 $’000
19. Statement of Cash Flows
(a) Reconciliation of the profit/(loss) after income tax (expense)/benefit to the net cash flows from operating activities
Profit after income tax expense 17,925 7,447Amortisation of non-current assets 602 580Depreciation of non-current assets 15,166 14,751Loss on sale of plant and equipment - 16Share-based payments expense/(credit) 31 (3)Gain on sale of discontinued operation (7,378) -Net foreign currency losses/(gains) 74 (173)
Changes in assets and liabilitiesTrade receivables 3,694 6,253Other receivables (1,721) (125)Accrued income 705 503Prepayments 746 (1,132)Deferred tax assets (445) 1,597Trade and other creditors (2,765) (4,281)Other liabilities (449) 254Current tax liabilities 2,606 1,440Deferred tax liabilities (3) (8)Provision for employee benefits 133 432Net cash flow from operating activities 28,921 27,551
(b) Reconciliation of cash
Cash balance comprises:– Cash on hand and at bank 31,404 19,313– Short-term deposits 24,900 16,000 6 56,304 35,313
(c) Non-cash investing activities
There were no non-cash investing activities during the financial year.
(d) Financing facilities available
Total facilities:– trade debt purchase facility - 10,000– bank guarantee facility 4,144 - 4,144 10,000
Facilities used at reporting date:– trade debt purchase facility - -– bank guarantee facility 1,975 - 1,975 -
Facilities unused at reporting date:– trade debt purchase facility - 10,000– bank guarantee facility 2,169 - 2,169 10,000
Facilities used at reporting date 1,975 -Facilities unused at reporting date 2,169 10,000Total facilities 4,144 10,000
For
per
sona
l use
onl
y

Macquarie Telecom Annual Report 2010 47
Trade debt purchase facilityDuring the financial year 2006, the consolidated entity entered into an agreement with an unrelated third party for the purchase of its trade debts. The facility was renegotiated and renewed in 2008. Upon acceptance, funds were made available to the consolidated entity of an amount not exceeding the facility limit of $10 million.
The facility was discontinued on 22 February 2010.
Bank guarantee facilityThe consolidated entity has a guarantee facility with a financial institution for rental bonds. During the financial year this facility was renegotiated and as a result the consolidated entity is no longer required to provide bank deposits as security against the guarantees.
Consolidated
2010 2009 $’000 $’000
20. Expenditure Commitments
(a) Capital expenditure commitments
Estimated capital expenditure contracted for at the reporting date but not recognised as liabilities is as follows:
Not later than one year 131 129Payable later than one year - - 131 129
(b) Lease expenditure commitments
Operating leases
All operating leases relate to premises, parking spaces and office equipment in various locations and have a lease term of between six months and six years. There are no restrictions placed upon the lessee by entering into these leases.
Minimum lease payments:
Not later than one year 5,082 4,891Later than one year and not later than five years 19,853 8,146Later than five years 874 856 25,809 13,893
Aggregate expenditure commitments comprise:
Amounts provided for: Lease incentive liability – current 262 479 Lease incentive liability – non-current 1,170 1,420
Amounts not provided for: Rental commitments 25,809 13,893 27,241 15,792
For
per
sona
l use
onl
y

48
Notes to the Financial StatementsAt 30 June 2010
Consolidated
2010 2009 $’000 $’000
20. Expenditure Commitments (cont’d)
Finance lease and hire purchase commitmentsThe consolidated entity leases various plant and equipment with a carrying amount of $0.2 million under finance leases expiring within one year subject to interest rates between 8% and 9%.
Minimum lease payments:
Not later than one year 349 1,529Payable later than one year - 349Total minimum lease payments 349 1,878
Less future finance charges (7) (106)Total lease liability 342 1,772
Aggregate expenditure commitments comprise:
Amounts provided for: Lease liabilities – current 342 1,430 Lease liabilities – non-current - 342 342 1,772
21. Employee Benefits and Superannuation Commitments
Employee benefits
The aggregate employee benefits liability is comprised of:
Accrued wages, salaries, annual leave and on costs 6,449 5,426Provisions (current) 1,260 971Provisions (non-current) 981 1,136 8,690 7,533
Employee share schemesThe consolidated entity has adopted the following three employee share plans:
(a) Employee Option Plan;
(b) Discretionary Share Plan; and
(c) Share Purchase Plan.
Full-time and part-time employees of Macquarie or its subsidiaries are eligible to participate in these plans at the discretion of the directors. Directors, both executive and non-executive, are also eligible to participate in the plans. However, their participation is subject to the Corporations Act 2001 and the ASX Listing Rules. The plans are administered by the Board, which determines the directors or employees that will be made offers to participate in the plans and the terms of those offers. There are currently 389 employees and directors eligible for these plans.
Each of the plans contains provisions dealing with matters such as administration of the plans, variation of the plan rules, and termination or suspension of the plans. The plans are subject to the overriding application of the Corporations Act 2001 and the ASX Listing Rules.
The plans restrict the total number of shares issued under all of the plans, including as a result of the exercise of options, in the previous five years and the number of unexercised options issued to no more than 5% of the issued share capital of Macquarie.
During the year, there were nil options (2009: 120,000) issued under the Employee Option Plan to eligible employees. At 30 June 2010, there were 112,500 (2009: 219,500) options on issue under this plan. During the year, 86,000 options were exercised (2009: nil) and 21,000 (2009: 52,000) options were forfeited. Employee options are contingent on (a) the employee remaining in employment with the company and (b) the Company’s share price reaching an amount equal to or greater than 25% higher than the option exercise price for 20 consecutive days prior to the date of exercise.
During the year, there were nil shares (2009: nil) issued under the Discretionary Share Plan to eligible employees, and nil shares (2009: nil) issued under the Share Purchase Plan. Ordinary shares issued under the Discretionary Share Plan are not disposable for two years from the date of issuance, and are forfeited upon termination of employment with Macquarie. Ordinary shares issued under the Share Purchase Plan are not disposable until the earlier of the date of termination of employment with Macquarie, or three years from the date of issuance.
For
per
sona
l use
onl
y
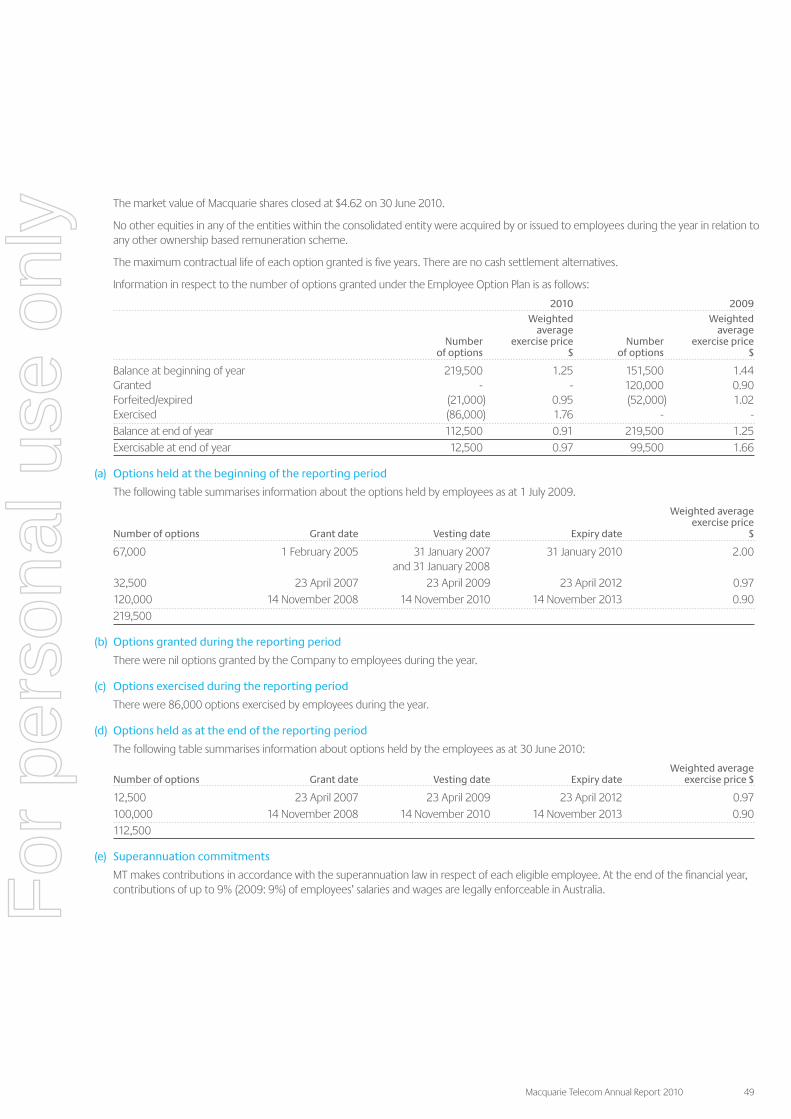
Macquarie Telecom Annual Report 2010 49
The market value of Macquarie shares closed at $4.62 on 30 June 2010.
No other equities in any of the entities within the consolidated entity were acquired by or issued to employees during the year in relation to any other ownership based remuneration scheme.
The maximum contractual life of each option granted is five years. There are no cash settlement alternatives.
Information in respect to the number of options granted under the Employee Option Plan is as follows:
2010 2009
Weighted Weighted average average Number exercise price Number exercise price of options $ of options $
Balance at beginning of year 219,500 1.25 151,500 1.44Granted - - 120,000 0.90Forfeited/expired (21,000) 0.95 (52,000) 1.02Exercised (86,000) 1.76 - -Balance at end of year 112,500 0.91 219,500 1.25Exercisable at end of year 12,500 0.97 99,500 1.66
(a) Options held at the beginning of the reporting period
The following table summarises information about the options held by employees as at 1 July 2009.
Weighted average exercise price Number of options Grant date Vesting date Expiry date $
67,000 1 February 2005 31 January 2007 31 January 2010 2.00 and 31 January 200832,500 23 April 2007 23 April 2009 23 April 2012 0.97120,000 14 November 2008 14 November 2010 14 November 2013 0.90219,500
(b) Options granted during the reporting period
There were nil options granted by the Company to employees during the year.
(c) Options exercised during the reporting period
There were 86,000 options exercised by employees during the year.
(d) Options held as at the end of the reporting period
The following table summarises information about options held by the employees as at 30 June 2010:
Weighted average Number of options Grant date Vesting date Expiry date exercise price $
12,500 23 April 2007 23 April 2009 23 April 2012 0.97100,000 14 November 2008 14 November 2010 14 November 2013 0.90112,500
(e) Superannuation commitments
MT makes contributions in accordance with the superannuation law in respect of each eligible employee. At the end of the financial year, contributions of up to 9% (2009: 9%) of employees’ salaries and wages are legally enforceable in Australia.F
or p
erso
nal u
se o
nly

50
Notes to the Financial StatementsAt 30 June 2010
22. Contingent Liabilities The consolidated entity currently disputes certain charges levied by some of its suppliers which total $0.1 million (2009: $0.1 million) on the grounds of incorrect billing, including that the services were not provided to the consolidated entity or its customers, and services supplied were not in accordance with agreed criteria. The consolidated entity is currently in discussion with each of the suppliers to resolve the disputes and expects that satisfactory solutions will be agreed. The consolidated entity has recorded an amount in trade creditors, which excludes the disputed amounts. A contingent liability exists for the difference between the amount recorded in the trade creditors and the negotiated settlement of these disputes, up to a maximum of $0.1 million.
Consolidated
2010 2009 cents cents
23. Earnings per share
(a) Basic earnings per share
From continuing operations 50.6 29.7From discontinued operation 36.2 6.4Total basic earnings per share 86.8 36.1
(b) Diluted earnings per share
From continuing operations 50.1 29.7From discontinued operation 36.0 6.4Total diluted earnings per share 86.1 36.1
Consolidated
2010 2009 $’000 $’000
(c) Reconciliation of earnings used in calculating earnings per share
Profit attributable to the ordinary equity holders of the company used in calculating basic and diluted earnings per share
Profit from continuing operations 10,440 6,126Profit from discontinued operation 7,485 1,321 17,925 7,447
2010 2009 Number of shares Number of shares
(d) Weighted average number of ordinary shares used in calculating basic profit/(loss) per share 20,659,729 20,608,621
Effect of dilutive securities:
Share options 156,915 41,503Adjusted weighted average number of ordinary shares used in calculating diluted profit/(loss) per share: 20,816,644 20,650,124
Number of options that are not dilutive and not included in the calculation of diluted profit/(loss) per share
– Options over ordinary shares - 312,997
Since the end of the financial year, no ordinary shares have been issued upon the exercise of options.For
per
sona
l use
onl
y
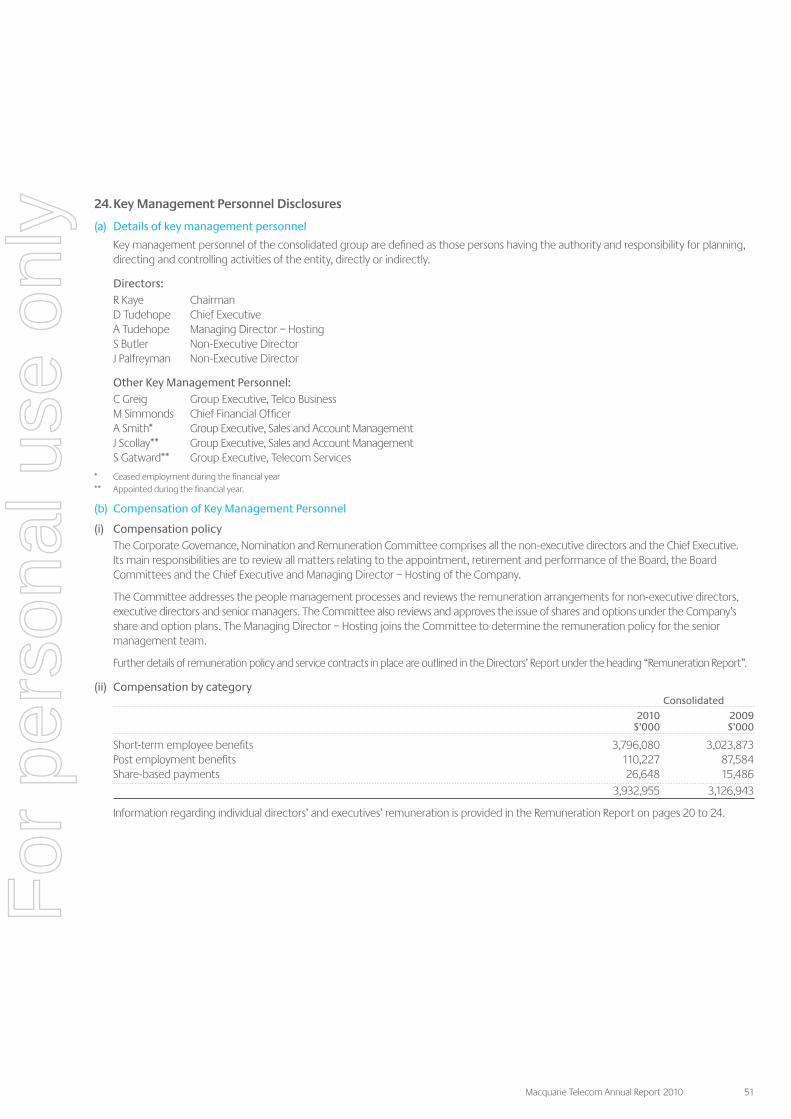
Macquarie Telecom Annual Report 2010 51
24. Key Management Personnel Disclosures
(a) Details of key management personnel
Key management personnel of the consolidated group are defined as those persons having the authority and responsibility for planning, directing and controlling activities of the entity, directly or indirectly.
Directors:R Kaye Chairman D Tudehope Chief Executive A Tudehope Managing Director – Hosting S Butler Non-Executive Director J Palfreyman Non-Executive Director
Other Key Management Personnel:C Greig Group Executive, Telco Business M Simmonds Chief Financial Officer A Smith* Group Executive, Sales and Account Management J Scollay** Group Executive, Sales and Account Management S Gatward** Group Executive, Telecom Services
* Ceased employment during the financial year** Appointed during the financial year.
(b) Compensation of Key Management Personnel
(i) Compensation policyThe Corporate Governance, Nomination and Remuneration Committee comprises all the non-executive directors and the Chief Executive. Its main responsibilities are to review all matters relating to the appointment, retirement and performance of the Board, the Board Committees and the Chief Executive and Managing Director – Hosting of the Company.
The Committee addresses the people management processes and reviews the remuneration arrangements for non-executive directors, executive directors and senior managers. The Committee also reviews and approves the issue of shares and options under the Company’s share and option plans. The Managing Director – Hosting joins the Committee to determine the remuneration policy for the senior management team.
Further details of remuneration policy and service contracts in place are outlined in the Directors’ Report under the heading “Remuneration Report”.
(ii) Compensation by category Consolidated
2010 2009 $’000 $’000
Short-term employee benefits 3,796,080 3,023,873Post employment benefits 110,227 87,584Share-based payments 26,648 15,486 3,932,955 3,126,943
Information regarding individual directors’ and executives’ remuneration is provided in the Remuneration Report on pages 20 to 24.
For
per
sona
l use
onl
y
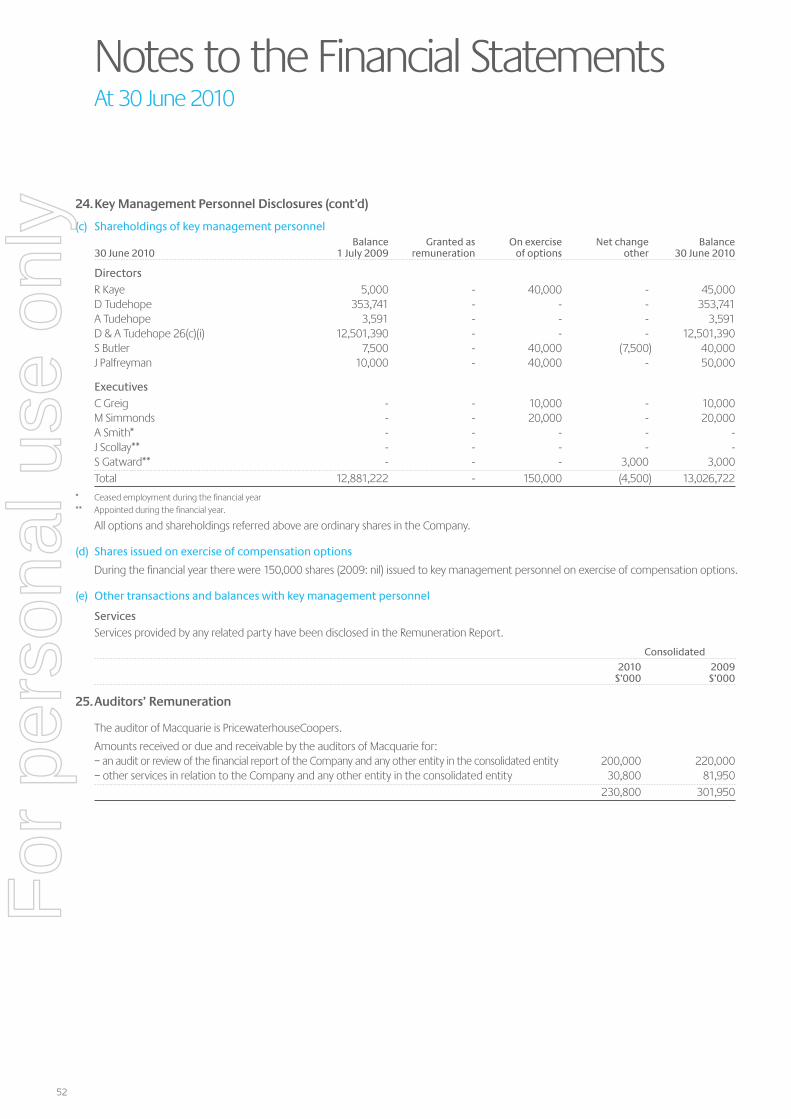
52
Notes to the Financial StatementsAt 30 June 2010
24. Key Management Personnel Disclosures (cont’d)
(c) Shareholdings of key management personnel Balance Granted as On exercise Net change Balance 30 June 2010 1 July 2009 remuneration of options other 30 June 2010
DirectorsR Kaye 5,000 - 40,000 - 45,000D Tudehope 353,741 - - - 353,741A Tudehope 3,591 - - - 3,591D & A Tudehope 26(c)(i) 12,501,390 - - - 12,501,390S Butler 7,500 - 40,000 (7,500) 40,000J Palfreyman 10,000 - 40,000 - 50,000
ExecutivesC Greig - - 10,000 - 10,000M Simmonds - - 20,000 - 20,000A Smith* - - - - -J Scollay** - - - - -S Gatward** - - - 3,000 3,000Total 12,881,222 - 150,000 (4,500) 13,026,722
* Ceased employment during the financial year** Appointed during the financial year.
All options and shareholdings referred above are ordinary shares in the Company.
(d) Shares issued on exercise of compensation options
During the financial year there were 150,000 shares (2009: nil) issued to key management personnel on exercise of compensation options.
(e) Other transactions and balances with key management personnel
ServicesServices provided by any related party have been disclosed in the Remuneration Report.
Consolidated
2010 2009 $’000 $’000
25. Auditors’ Remuneration
The auditor of Macquarie is PricewaterhouseCoopers.
Amounts received or due and receivable by the auditors of Macquarie for:– an audit or review of the financial report of the Company and any other entity in the consolidated entity 200,000 220,000– other services in relation to the Company and any other entity in the consolidated entity 30,800 81,950 230,800 301,950
For
per
sona
l use
onl
y
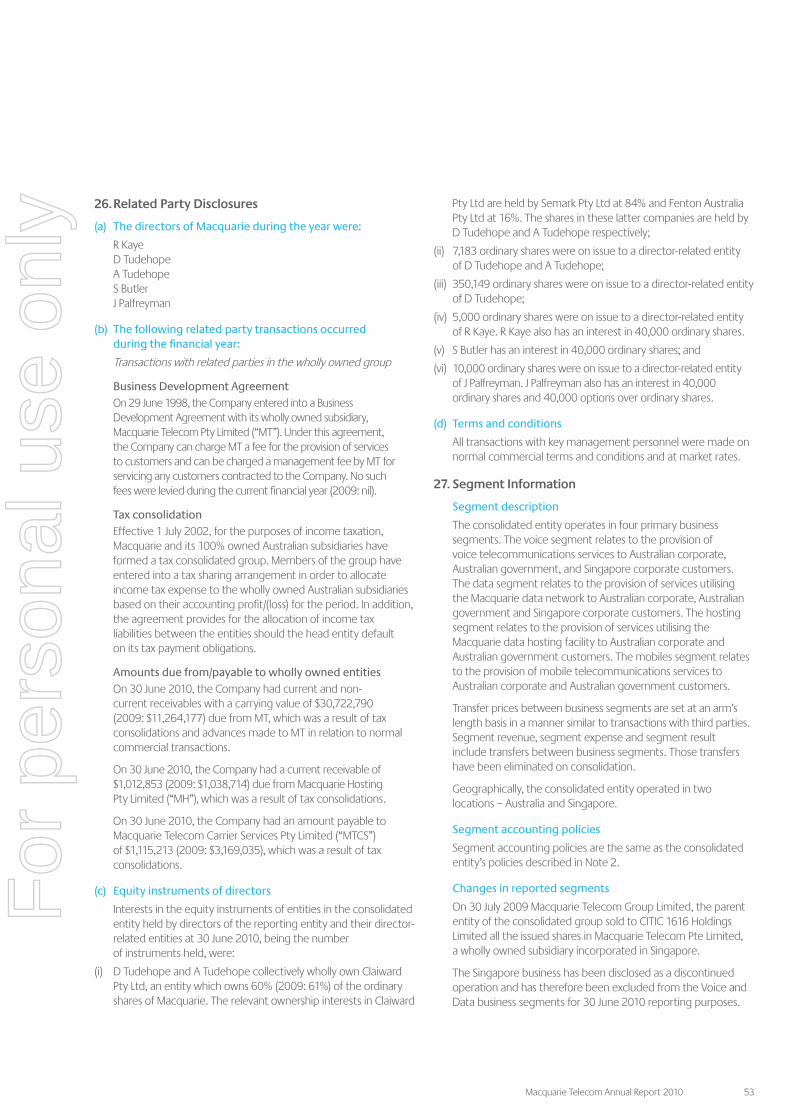
Macquarie Telecom Annual Report 2010 53
26. Related Party Disclosures
(a) The directors of Macquarie during the year were:
R Kaye D Tudehope A Tudehope S Butler J Palfreyman
(b) The following related party transactions occurred during the financial year:
Transactions with related parties in the wholly owned group
Business Development AgreementOn 29 June 1998, the Company entered into a Business Development Agreement with its wholly owned subsidiary, Macquarie Telecom Pty Limited (“MT”). Under this agreement, the Company can charge MT a fee for the provision of services to customers and can be charged a management fee by MT for servicing any customers contracted to the Company. No such fees were levied during the current financial year (2009: nil).
Tax consolidationEffective 1 July 2002, for the purposes of income taxation, Macquarie and its 100% owned Australian subsidiaries have formed a tax consolidated group. Members of the group have entered into a tax sharing arrangement in order to allocate income tax expense to the wholly owned Australian subsidiaries based on their accounting profit/(loss) for the period. In addition, the agreement provides for the allocation of income tax liabilities between the entities should the head entity default on its tax payment obligations.
Amounts due from/payable to wholly owned entitiesOn 30 June 2010, the Company had current and non-current receivables with a carrying value of $30,722,790 (2009: $11,264,177) due from MT, which was a result of tax consolidations and advances made to MT in relation to normal commercial transactions.
On 30 June 2010, the Company had a current receivable of $1,012,853 (2009: $1,038,714) due from Macquarie Hosting Pty Limited (“MH”), which was a result of tax consolidations.
On 30 June 2010, the Company had an amount payable to Macquarie Telecom Carrier Services Pty Limited (“MTCS”) of $1,115,213 (2009: $3,169,035), which was a result of tax consolidations.
(c) Equity instruments of directors
Interests in the equity instruments of entities in the consolidated entity held by directors of the reporting entity and their director-related entities at 30 June 2010, being the number of instruments held, were:
(i) D Tudehope and A Tudehope collectively wholly own Claiward Pty Ltd, an entity which owns 60% (2009: 61%) of the ordinary shares of Macquarie. The relevant ownership interests in Claiward
Pty Ltd are held by Semark Pty Ltd at 84% and Fenton Australia Pty Ltd at 16%. The shares in these latter companies are held by D Tudehope and A Tudehope respectively;
(ii) 7,183 ordinary shares were on issue to a director-related entity of D Tudehope and A Tudehope;
(iii) 350,149 ordinary shares were on issue to a director-related entity of D Tudehope;
(iv) 5,000 ordinary shares were on issue to a director-related entity of R Kaye. R Kaye also has an interest in 40,000 ordinary shares.
(v) S Butler has an interest in 40,000 ordinary shares; and
(vi) 10,000 ordinary shares were on issue to a director-related entity of J Palfreyman. J Palfreyman also has an interest in 40,000 ordinary shares and 40,000 options over ordinary shares.
(d) Terms and conditions
All transactions with key management personnel were made on normal commercial terms and conditions and at market rates.
27. Segment Information
Segment description
The consolidated entity operates in four primary business segments. The voice segment relates to the provision of voice telecommunications services to Australian corporate, Australian government, and Singapore corporate customers. The data segment relates to the provision of services utilising the Macquarie data network to Australian corporate, Australian government and Singapore corporate customers. The hosting segment relates to the provision of services utilising the Macquarie data hosting facility to Australian corporate and Australian government customers. The mobiles segment relates to the provision of mobile telecommunications services to Australian corporate and Australian government customers.
Transfer prices between business segments are set at an arm’s length basis in a manner similar to transactions with third parties. Segment revenue, segment expense and segment result include transfers between business segments. Those transfers have been eliminated on consolidation.
Geographically, the consolidated entity operated in two locations – Australia and Singapore.
Segment accounting policies
Segment accounting policies are the same as the consolidated entity’s policies described in Note 2.
Changes in reported segments
On 30 July 2009 Macquarie Telecom Group Limited, the parent entity of the consolidated group sold to CITIC 1616 Holdings Limited all the issued shares in Macquarie Telecom Pte Limited, a wholly owned subsidiary incorporated in Singapore.
The Singapore business has been disclosed as a discontinued operation and has therefore been excluded from the Voice and Data business segments for 30 June 2010 reporting purposes.
For
per
sona
l use
onl
y
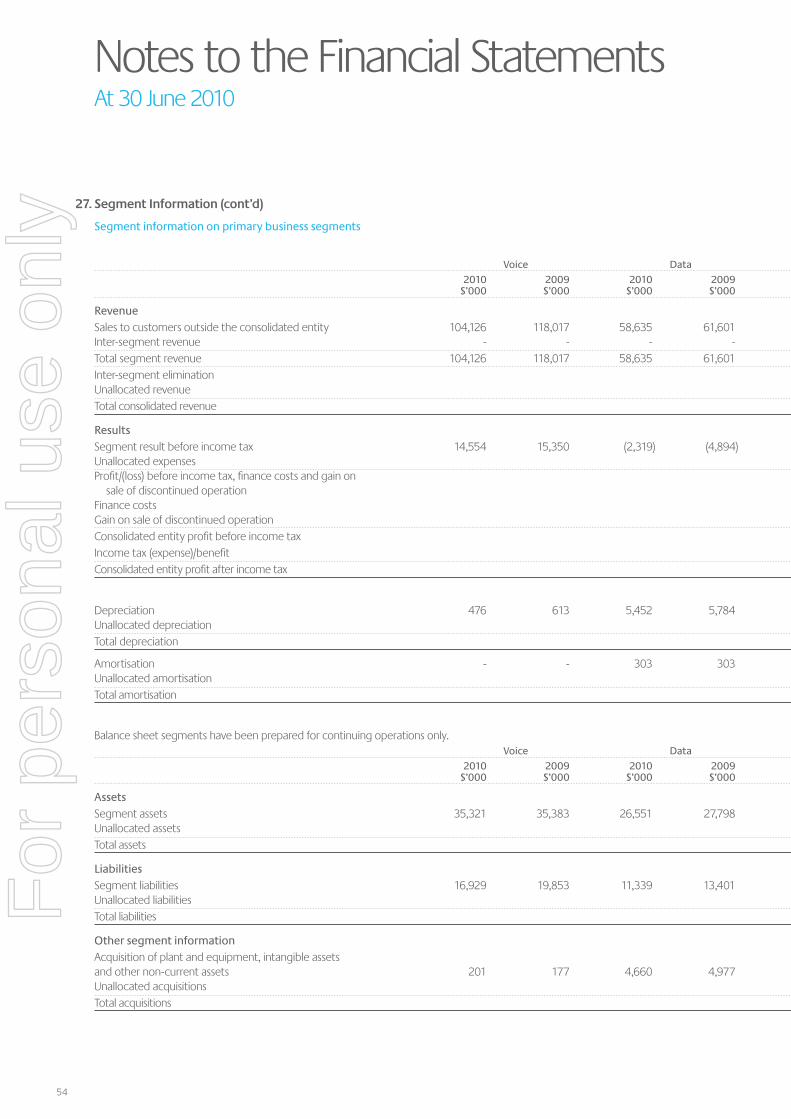
54
Notes to the Financial StatementsAt 30 June 2010
27. Segment Information (cont’d)
Segment information on primary business segments Discontinued Voice Data Hosting Mobiles Operation Consolidated
2010 2009 2010 2009 2010 2009 2010 2009 2010 2009 2010 2009 $’000 $’000 $’000 $’000 $’000 $’000 $’000 $’000 $’000 $’000 $’000 $’000
RevenueSales to customers outside the consolidated entity 104,126 118,017 58,635 61,601 44,489 33,879 28,742 28,140 934 12,173 236,926 253,810Inter-segment revenue - - - - - - - - 305 3,796 305 3,796Total segment revenue 104,126 118,017 58,635 61,601 44,489 33,879 28,742 28,140 1,239 15,969 237,231 257,606Inter-segment elimination (305) (3,796) (305) (3,796)Unallocated revenue - 9 2,125 1,235Total consolidated revenue 934 12,182 239,051 255,045
ResultsSegment result before income tax 14,554 15,350 (2,319) (4,894) 8,142 3,857 1,795 2,097 139 1,783 22,311 18,193Unallocated expenses (32) (462) (6,818) (7,268)Profit/(loss) before income tax, finance costs and gain on sale of discontinued operation 107 1,321 15,493 10,925Finance costs - - (204) (402)Gain on sale of discontinued operation 7,378 - 7,378 -Consolidated entity profit before income tax 7,485 1,321 22,667 10,523Income tax (expense)/benefit - - (4,742) (3,076)Consolidated entity profit after income tax 7,485 1,321 17,925 7,447
Depreciation 476 613 5,452 5,784 7,047 5,980 76 36 - - 13,051 12,413Unallocated depreciation 31 447 2,115 2,338Total depreciation 31 447 15,166 14,751
Amortisation - - 303 303 - - - - - - 303 303Unallocated amortisation 1 15 299 277Total amortisation 1 15 602 580
Balance sheet segments have been prepared for continuing operations only. Voice Data Hosting Mobiles Consolidated
2010 2009 2010 2009 2010 2009 2010 2009 2010 2009 $’000 $’000 $’000 $’000 $’000 $’000 $’000 $’000 $’000 $’000
AssetsSegment assets 35,321 35,383 26,551 27,798 24,365 19,429 10,434 8,557 96,671 91,167Unallocated assets 14,957 4,820Total assets 111,628 95,987
LiabilitiesSegment liabilities 16,929 19,853 11,339 13,401 6,992 5,472 5,135 4,885 40,395 43,611Unallocated liabilities 2,038 1,552Total liabilities 42,433 45,163
Other segment informationAcquisition of plant and equipment, intangible assets and other non-current assets 201 177 4,660 4,977 7,629 5,226 225 151 12,715 10,531Unallocated acquisitions 3,891 2,431Total acquisitions 16,606 12,962
For
per
sona
l use
onl
y

Macquarie Telecom Annual Report 2010 55
27. Segment Information (cont’d)
Segment information on primary business segments Discontinued Voice Data Hosting Mobiles Operation Consolidated
2010 2009 2010 2009 2010 2009 2010 2009 2010 2009 2010 2009 $’000 $’000 $’000 $’000 $’000 $’000 $’000 $’000 $’000 $’000 $’000 $’000
RevenueSales to customers outside the consolidated entity 104,126 118,017 58,635 61,601 44,489 33,879 28,742 28,140 934 12,173 236,926 253,810Inter-segment revenue - - - - - - - - 305 3,796 305 3,796Total segment revenue 104,126 118,017 58,635 61,601 44,489 33,879 28,742 28,140 1,239 15,969 237,231 257,606Inter-segment elimination (305) (3,796) (305) (3,796)Unallocated revenue - 9 2,125 1,235Total consolidated revenue 934 12,182 239,051 255,045
ResultsSegment result before income tax 14,554 15,350 (2,319) (4,894) 8,142 3,857 1,795 2,097 139 1,783 22,311 18,193Unallocated expenses (32) (462) (6,818) (7,268)Profit/(loss) before income tax, finance costs and gain on sale of discontinued operation 107 1,321 15,493 10,925Finance costs - - (204) (402)Gain on sale of discontinued operation 7,378 - 7,378 -Consolidated entity profit before income tax 7,485 1,321 22,667 10,523Income tax (expense)/benefit - - (4,742) (3,076)Consolidated entity profit after income tax 7,485 1,321 17,925 7,447
Depreciation 476 613 5,452 5,784 7,047 5,980 76 36 - - 13,051 12,413Unallocated depreciation 31 447 2,115 2,338Total depreciation 31 447 15,166 14,751
Amortisation - - 303 303 - - - - - - 303 303Unallocated amortisation 1 15 299 277Total amortisation 1 15 602 580
Balance sheet segments have been prepared for continuing operations only. Voice Data Hosting Mobiles Consolidated
2010 2009 2010 2009 2010 2009 2010 2009 2010 2009 $’000 $’000 $’000 $’000 $’000 $’000 $’000 $’000 $’000 $’000
AssetsSegment assets 35,321 35,383 26,551 27,798 24,365 19,429 10,434 8,557 96,671 91,167Unallocated assets 14,957 4,820Total assets 111,628 95,987
LiabilitiesSegment liabilities 16,929 19,853 11,339 13,401 6,992 5,472 5,135 4,885 40,395 43,611Unallocated liabilities 2,038 1,552Total liabilities 42,433 45,163
Other segment informationAcquisition of plant and equipment, intangible assets and other non-current assets 201 177 4,660 4,977 7,629 5,226 225 151 12,715 10,531Unallocated acquisitions 3,891 2,431Total acquisitions 16,606 12,962
For
per
sona
l use
onl
y
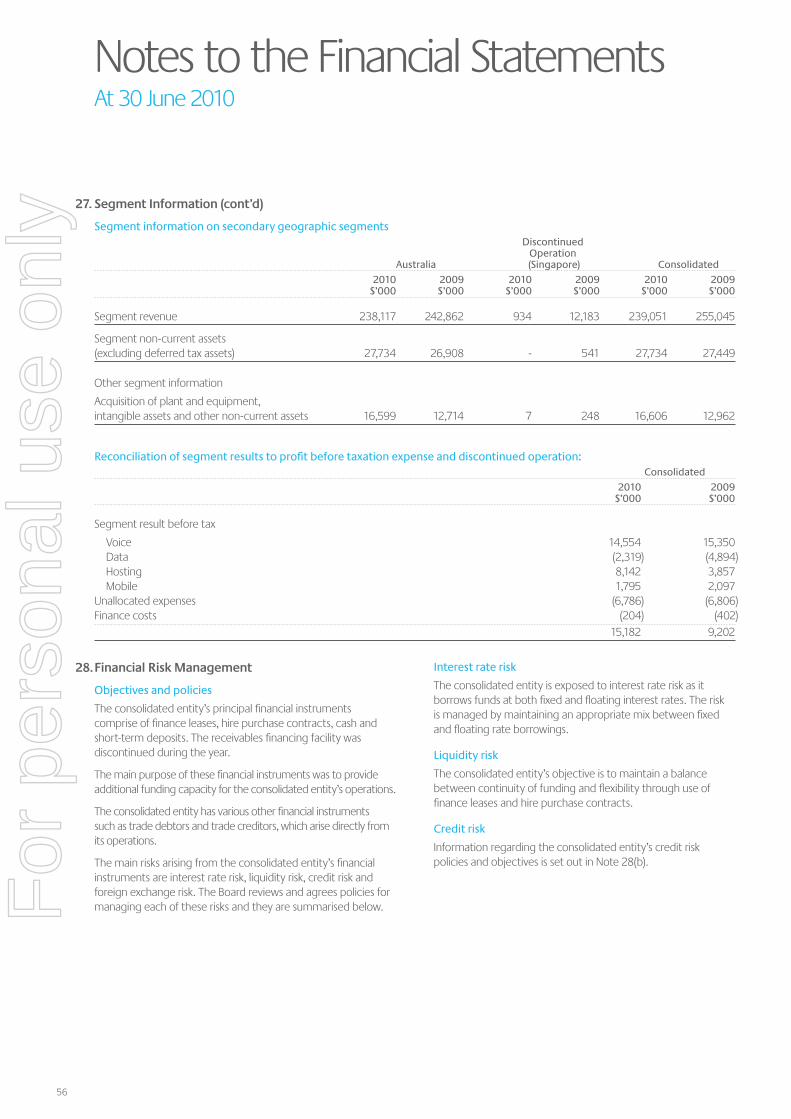
56
Notes to the Financial StatementsAt 30 June 2010
27. Segment Information (cont’d)
Segment information on secondary geographic segments Discontinued Operation Australia (Singapore) Consolidated
2010 2009 2010 2009 2010 2009 $’000 $’000 $’000 $’000 $’000 $’000
Segment revenue 238,117 242,862 934 12,183 239,051 255,045
Segment non-current assets (excluding deferred tax assets) 27,734 26,908 - 541 27,734 27,449
Other segment information
Acquisition of plant and equipment, intangible assets and other non-current assets 16,599 12,714 7 248 16,606 12,962
Reconciliation of segment results to profit before taxation expense and discontinued operation: Consolidated
2010 2009 $’000 $’000
Segment result before tax
Voice 14,554 15,350 Data (2,319) (4,894) Hosting 8,142 3,857 Mobile 1,795 2,097Unallocated expenses (6,786) (6,806)Finance costs (204) (402) 15,182 9,202
28. Financial Risk Management
Objectives and policies
The consolidated entity’s principal financial instruments comprise of finance leases, hire purchase contracts, cash and short-term deposits. The receivables financing facility was discontinued during the year.
The main purpose of these financial instruments was to provide additional funding capacity for the consolidated entity’s operations.
The consolidated entity has various other financial instruments such as trade debtors and trade creditors, which arise directly from its operations.
The main risks arising from the consolidated entity’s financial instruments are interest rate risk, liquidity risk, credit risk and foreign exchange risk. The Board reviews and agrees policies for managing each of these risks and they are summarised below.
Interest rate risk
The consolidated entity is exposed to interest rate risk as it borrows funds at both fixed and floating interest rates. The risk is managed by maintaining an appropriate mix between fixed and floating rate borrowings.
Liquidity risk
The consolidated entity’s objective is to maintain a balance between continuity of funding and flexibility through use of finance leases and hire purchase contracts.
Credit risk
Information regarding the consolidated entity’s credit risk policies and objectives is set out in Note 28(b).
For
per
sona
l use
onl
y

Macquarie Telecom Annual Report 2010 57
Foreign exchange risk
The consolidated entity is exposed to changes in foreign exchange risk in relation to the earnings of its international data operations, which have not been hedged on the basis of its significance to the Group’s results.
The consolidated entity holds the following financial instruments:
Consolidated
2010 2009 $’000 $’000
Financial assetsCash and cash equivalents 56,304 35,313Trade and other receivables 10,268 12,687Accrued income 9,074 10,373Other financial assets - 1,506Other current assets 2,091 2,947 77,737 62,826
Financial liabilitiesTrade and other payables 34,058 37,628 34,058 37,628
(a) Market risk
(i) Foreign exchange riskThe consolidated entity operates primarily in Australia and is exposed to foreign exchange risk arising mainly from its international data operation. Commercial transactions in Australia are mainly in AUD. Foreign currency transactions are not significant to the consolidated operations. As such, the consolidated entity chooses not to hedge its foreign exchange risk using forward exchange contracts. The consolidated entity’s exposure to foreign currency risk at the reporting date was as follows:
2010 2009
$’000 $’000 $’000 $’000 $’000 $’000 $’000 $’000 USD SGD HKD NZD USD SGD HKD NZD
Cash and cash equivalents 2,327 - - - 188 254 - -Trade and other receivables - - - - 148 270 - -Other current assets - - - - - 76 - -Accrued income - - - - - 593 - -Other financial assets - - - - 211 72 - -Trade and other payables 399 19 - - (222) (870) (18) (83)
Consolidated entity sensitivityBased on the financial instruments held at 30 June 2010, had the Australian dollar weakened/strengthened by 10% against the US dollar with all other variables held constant, the consolidated entity’s post-tax profit for the year would have been $303,000 higher/$248,000 lower (2009: $36,000 higher/$30,000 lower) mainly as a result of foreign exchange gains/losses on translation of US denominated financial instruments as detailed in the above table.
Consolidated entity sensitivity to Australian dollar movements against the Singapore dollar has decreased following the sale of the Singapore subsidiary on 31 July 2009 (Note 29). As such, foreign exchange risk to the Singapore dollar is no longer regarded as significant.
(ii) Interest rate riskThe consolidated entity’s and parent entity’s main interest risk arises from cash and cash equivalents with banks. The consolidated entity’s borrowings are at fixed interest rates.
Based on the cash and cash equivalents at 30 June 2010, if interest rates had changed by +/- 10% from the year end rates with all other variables held constant, post-tax profit would have been $145,000 higher/lower (2009: $88,000 higher/lower) as a result of higher/lower interest income from these financial assets.
(iii) Other price riskNeither the consolidated entity nor parent entity carries any other price risk.
For
per
sona
l use
onl
y
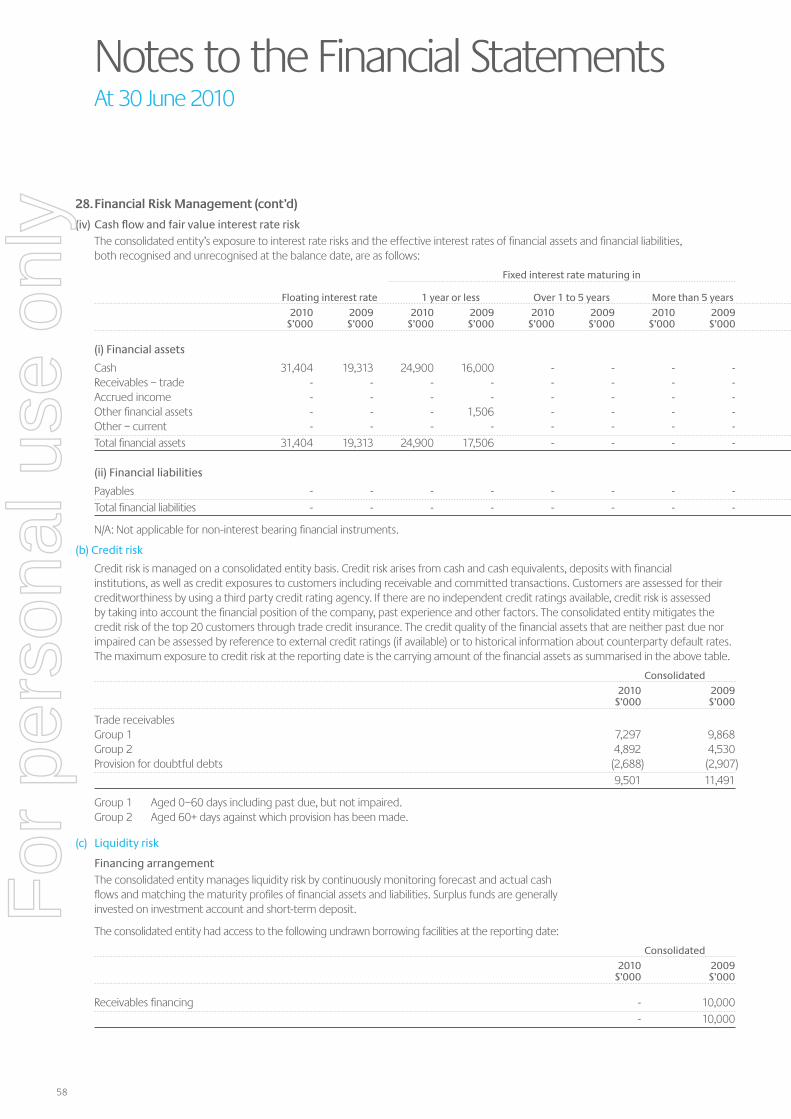
58
Notes to the Financial StatementsAt 30 June 2010
28. Financial Risk Management (cont’d)
(iv) Cash flow and fair value interest rate riskThe consolidated entity’s exposure to interest rate risks and the effective interest rates of financial assets and financial liabilities, both recognised and unrecognised at the balance date, are as follows:
Fixed interest rate maturing in Total carrying Weighted amount as per average effective Floating interest rate 1 year or less Over 1 to 5 years More than 5 years Non-interest bearing the Balance Sheet interest rate
2010 2009 2010 2009 2010 2009 2010 2009 2010 2009 2010 2009 2010 2009 $’000 $’000 $’000 $’000 $’000 $’000 $’000 $’000 $’000 $’000 $’000 $’000 % pa % pa
(i) Financial assets
Cash 31,404 19,313 24,900 16,000 - - - - - - 56,304 35,313 4.85 4.48Receivables – trade - - - - - - - - 10,268 12,687 10,268 12,687 N/A N/AAccrued income - - - - - - - - 9,074 10,373 9,074 10,373 N/A N/AOther financial assets - - - 1,506 - - - - - - - 1,506 N/A 4.24Other – current - - - - - - - - 2,091 2,947 2,091 2,947 N/A N/ATotal financial assets 31,404 19,313 24,900 17,506 - - - - 21,433 26,007 77,737 62,826
(ii) Financial liabilities
Payables - - - - - - - - 34,058 37,628 34,058 37,628 N/A N/ATotal financial liabilities - - - - - - - - 34,058 37,628 34,058 37,628
N/A: Not applicable for non-interest bearing financial instruments.
(b) Credit risk
Credit risk is managed on a consolidated entity basis. Credit risk arises from cash and cash equivalents, deposits with financial institutions, as well as credit exposures to customers including receivable and committed transactions. Customers are assessed for their creditworthiness by using a third party credit rating agency. If there are no independent credit ratings available, credit risk is assessed by taking into account the financial position of the company, past experience and other factors. The consolidated entity mitigates the credit risk of the top 20 customers through trade credit insurance. The credit quality of the financial assets that are neither past due nor impaired can be assessed by reference to external credit ratings (if available) or to historical information about counterparty default rates. The maximum exposure to credit risk at the reporting date is the carrying amount of the financial assets as summarised in the above table.
Consolidated
2010 2009 $’000 $’000
Trade receivablesGroup 1 7,297 9,868Group 2 4,892 4,530Provision for doubtful debts (2,688) (2,907) 9,501 11,491
Group 1 Aged 0–60 days including past due, but not impaired. Group 2 Aged 60+ days against which provision has been made.
(c) Liquidity risk
Financing arrangementThe consolidated entity manages liquidity risk by continuously monitoring forecast and actual cash flows and matching the maturity profiles of financial assets and liabilities. Surplus funds are generally invested on investment account and short-term deposit.
The consolidated entity had access to the following undrawn borrowing facilities at the reporting date:
Consolidated
2010 2009 $’000 $’000
Receivables financing - 10,000 - 10,000
For
per
sona
l use
onl
y

Macquarie Telecom Annual Report 2010 59
28. Financial Risk Management (cont’d)
(iv) Cash flow and fair value interest rate riskThe consolidated entity’s exposure to interest rate risks and the effective interest rates of financial assets and financial liabilities, both recognised and unrecognised at the balance date, are as follows:
Fixed interest rate maturing in Total carrying Weighted amount as per average effective Floating interest rate 1 year or less Over 1 to 5 years More than 5 years Non-interest bearing the Balance Sheet interest rate
2010 2009 2010 2009 2010 2009 2010 2009 2010 2009 2010 2009 2010 2009 $’000 $’000 $’000 $’000 $’000 $’000 $’000 $’000 $’000 $’000 $’000 $’000 % pa % pa
(i) Financial assets
Cash 31,404 19,313 24,900 16,000 - - - - - - 56,304 35,313 4.85 4.48Receivables – trade - - - - - - - - 10,268 12,687 10,268 12,687 N/A N/AAccrued income - - - - - - - - 9,074 10,373 9,074 10,373 N/A N/AOther financial assets - - - 1,506 - - - - - - - 1,506 N/A 4.24Other – current - - - - - - - - 2,091 2,947 2,091 2,947 N/A N/ATotal financial assets 31,404 19,313 24,900 17,506 - - - - 21,433 26,007 77,737 62,826
(ii) Financial liabilities
Payables - - - - - - - - 34,058 37,628 34,058 37,628 N/A N/ATotal financial liabilities - - - - - - - - 34,058 37,628 34,058 37,628
N/A: Not applicable for non-interest bearing financial instruments.
For
per
sona
l use
onl
y
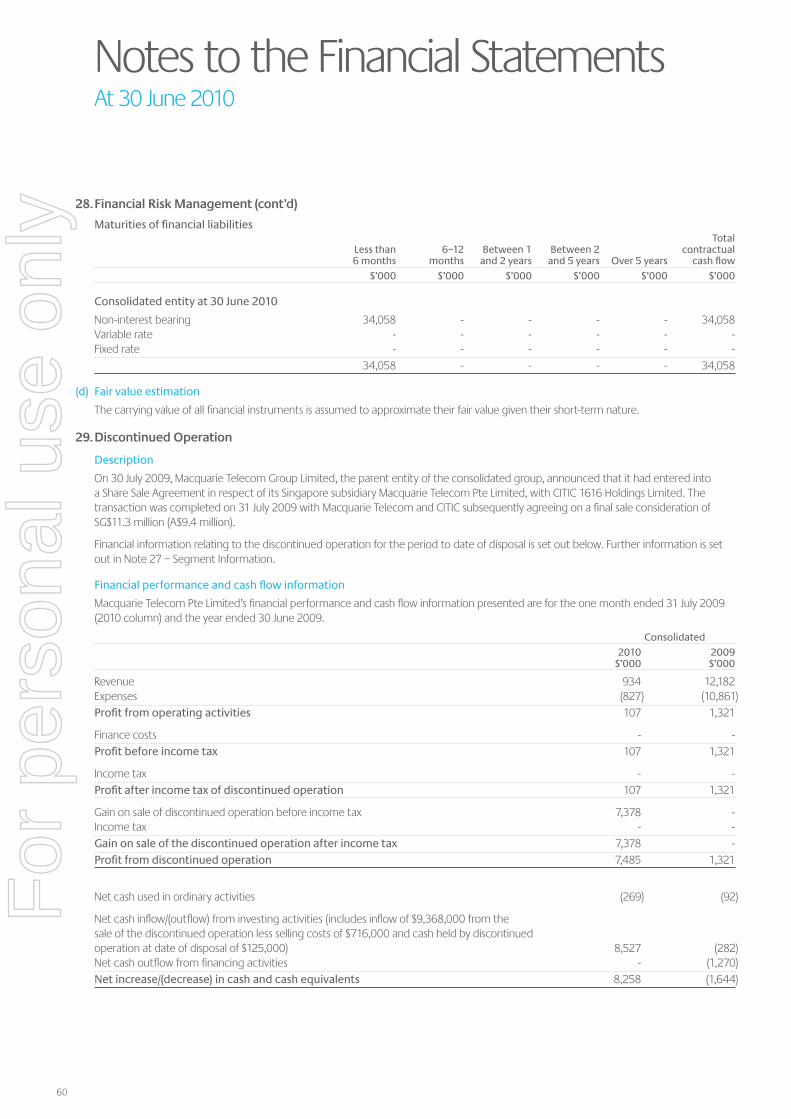
60
Notes to the Financial StatementsAt 30 June 2010
28. Financial Risk Management (cont’d)
Maturities of financial liabilities Total Less than 6–12 Between 1 Between 2 contractual 6 months months and 2 years and 5 years Over 5 years cash flow
$’000 $’000 $’000 $’000 $’000 $’000
Consolidated entity at 30 June 2010
Non-interest bearing 34,058 - - - - 34,058Variable rate - - - - - -Fixed rate - - - - - - 34,058 - - - - 34,058
(d) Fair value estimation
The carrying value of all financial instruments is assumed to approximate their fair value given their short-term nature.
29. Discontinued Operation
Description
On 30 July 2009, Macquarie Telecom Group Limited, the parent entity of the consolidated group, announced that it had entered into a Share Sale Agreement in respect of its Singapore subsidiary Macquarie Telecom Pte Limited, with CITIC 1616 Holdings Limited. The transaction was completed on 31 July 2009 with Macquarie Telecom and CITIC subsequently agreeing on a final sale consideration of SG$11.3 million (A$9.4 million).
Financial information relating to the discontinued operation for the period to date of disposal is set out below. Further information is set out in Note 27 – Segment Information.
Financial performance and cash flow information
Macquarie Telecom Pte Limited’s financial performance and cash flow information presented are for the one month ended 31 July 2009 (2010 column) and the year ended 30 June 2009.
Consolidated
2010 2009 $’000 $’000
Revenue 934 12,182Expenses (827) (10,861)Profit from operating activities 107 1,321
Finance costs - -Profit before income tax 107 1,321
Income tax - -Profit after income tax of discontinued operation 107 1,321
Gain on sale of discontinued operation before income tax 7,378 -Income tax - -Gain on sale of the discontinued operation after income tax 7,378 -Profit from discontinued operation 7,485 1,321
Net cash used in ordinary activities (269) (92)
Net cash inflow/(outflow) from investing activities (includes inflow of $9,368,000 from the sale of the discontinued operation less selling costs of $716,000 and cash held by discontinued operation at date of disposal of $125,000) 8,527 (282)Net cash outflow from financing activities - (1,270)Net increase/(decrease) in cash and cash equivalents 8,258 (1,644)
For
per
sona
l use
onl
y

Macquarie Telecom Annual Report 2010 61
Details of the sale of the discontinued operation Consolidated
2010 2009 $’000 $’000
Consideration received:Total disposal consideration 9,368 -Loan repaid (5,933) -Value of shares 3,435 -
Carrying amount of net liabilities 4,789 -Components of equity to be reclassified to profit and loss (77) -Intercompany elimination adjustment 8 -Costs to sell (777) -Gain on sale before income tax 7,378 -
Income tax expense - -Gain on sale after income tax 7,378 -
Carrying amounts of assets and liabilities
The carrying amounts of assets and liabilities, excluding cash and intercompany accounts, as at the date of sale (31 July 2009) were:
31 July 2009
$’000
Trade and other receivables 397Accrued income 594Other financial assets 282Other debtors 303Plant and equipment 423Total assets 1,999
Trade and other payables 958Provision and other liabilities 24Total liabilities 982
Net assets 1,017
30. Capital Reduction On 27 November 2009, the shareholders resolved at the Annual General Meeting that the paid-up capital of the parent company Macquarie Telecom Group Limited be reduced in the amount of $44,643,416 by debiting the capital account and crediting accumulated losses of the Company in accordance with section 256B of the Corporations Act 2001. The capital reduction does not affect any existing shareholder rights.
For
per
sona
l use
onl
y

62
Notes to the Financial StatementsAt 30 June 2010
31. Parent Entity Financial Information
(a) Summary financial information
The individual financial statements for Macquarie Telecom Group Limited, the parent entity, show the following aggregate amounts:
2010 2009 $’000 $’000
Statement of financial positionCurrent assets 9,156 4,593Total assets 73,504 47,499Current liabilities 5,573 5,000Total liabilities 5,573 5,000
Shareholders’ equity:Contributed equity 42,723 87,025Reserves Employee equity benefits reserve 148 117Retained profit 25,060 (44,643) 67,931 42,499
Profit/(loss) for the year 25,060 (4,926)
Total comprehensive income 25,060 (4,926)
(b) Guarantees entered into by the parent entity
Macquarie Telecom Group Limited, Macquarie Telecom Pty Limited, Macquarie Hosting Pty Limited, Macquarie Telecom Carrier Services Pty Limited, Macquarie Telecom Network Carrier Services Pty Limited and Macquarie Telecom Pte Ltd (the “Closed Group”) entered into a Deed of Cross Guarantee on 28 June 2005. The effect of the deed is that Macquarie Telecom Group Limited has guaranteed to pay any deficiency in the event of winding up of any of its controlled entities. The controlled entities have also given a similar guarantee in the event that Macquarie Telecom Group Limited is wound up. Macquarie Telecom Pte Ltd left the Closed Group on its sale on 31 July 2009. The Closed Group is the same as the consolidated group.
(c) Contingent liabilities of the parent entity
The Company has guaranteed MT’s performance, including payments owed, under various wholesale supply agreements between MT and Telstra Corporation Limited (“Telstra”). It is not practical to disclose the maximum amount payable under the guarantee.
(d) Contractual commitments for the acquisition of property, plant or equipment
Macquarie Telecom Group Limited did not have any contractual commitments for the acquisition of property, plant or equipment as at 30 June 2010 or 30 June 2009.
32. Events Occuring After the Reporting Date On 26 August 2010, the directors declared a fully franked special dividend of 20 cents per share and a fully franked ordinary dividend of 20 cents per share to the holders of fully paid ordinary shares in respect of the financial year ended 30 June 2010, to be paid to the shareholders on 14 October 2010.
These dividends have not been included as a liability in these financial statements. The total estimated dividends to be paid is $8.33 million.
For
per
sona
l use
onl
y

Macquarie Telecom Annual Report 2010 63
Directors’ Declaration
In accordance with a resolution of the directors of Macquarie Telecom Group Limited, we state that:
(1) In the opinion of the directors:
(a) the financial report, the additional disclosures included in the directors’ report designated as audited, and notes of the consolidated entity are in accordance with the Corporations Act 2001, including:
(i) giving a true and fair view of the consolidated entity’s financial position as at 30 June 2010 and of its performance for the year ended on that date; and
(ii) complying with Accounting Standards and Corporations Regulations 2001 and other mandatory professional reporting requirements.
(b) there are reasonable grounds to believe that the Company will be able to pay its debts as and when they become due and payable.
(2) This declaration has been made after receiving the declarations required to be made to the directors in accordance with section 295A of the Corporations Act 2001 for the financial period ending 30 June 2010.
(3) In the opinion of the directors, as at the date of this declaration, there are reasonable grounds to believe that the members of the Closed Group identified in Note 31(b) will be able to meet any obligations or liabilities to which they are or may become subject, by virtue of the Deed of Cross Guarantee.
Note 1(b) confirms that the financial statements also comply with International Financial Reporting Standards as issued by the International Accounting Standards Board.
On behalf of the Board:
David Tudehope Chief Executive
Sydney, 26 August 2010
For
per
sona
l use
onl
y

64
Independent Auditor’s Report
Independent Auditor’s Report to the Members of Macquarie Telecom Group Limited
Report on the financial report
We have audited the accompanying financial report of Macquarie Telecom Group Limited (the Company), which comprises the statement of financial position as at 30 June 2010, the statement of comprehensive income, statement of changes in equity and statement of cash flows for the year ended on that date, a summary of significant accounting policies, other explanatory notes and the directors’ declaration for Macquarie Telecom Group (the consolidated entity). The consolidated entity comprises the Company and the entities it controlled at the year’s end.
Directors’ responsibility for the financial report
The directors of the Company are responsible for the preparation and fair presentation of the financial report in accordance with Australian Accounting Standards (including the Australian Accounting Interpretations) and the Corporations Act 2001. This responsibility includes establishing and maintaining internal controls relevant to the preparation and fair presentation of the financial report that is free from material misstatement, whether due to fraud or error; selecting and applying appropriate accounting policies; and making accounting estimates that are reasonable in the circumstances. In Note 1(b), the directors also state, in accordance with Accounting Standard AASB 101 Presentation of Financial Statements, that compliance with the Australian equivalents to International Financial Reporting Standards ensures that the financial report, comprising the financial statements and notes, complies with International Financial Reporting Standards.
Auditor’s responsibility
Our responsibility is to express an opinion on the financial report based on our audit. We conducted our audit in accordance with Australian Auditing Standards. These Auditing Standards require that we comply with relevant ethical requirements relating to audit engagements and plan and perform the audit to obtain reasonable assurance whether the financial report is free from material misstatement.
An audit involves performing procedures to obtain audit evidence about the amounts and disclosures in the financial report. The procedures selected depend on the auditor’s judgement, including the assessment of the risks of material misstatement of the financial report, whether due to fraud or error. In making those risk assessments, the auditor considers internal control relevant to the entity’s preparation and fair presentation of the financial report in order to design audit procedures that are appropriate in the circumstances, but not for the purpose of expressing an opinion on the effectiveness of the entity’s internal control. An audit also includes evaluating the appropriateness of accounting policies used and the reasonableness of accounting estimates made by the directors, as well as evaluating the overall presentation of the financial report.
Our procedures include reading the other information in the Annual Report to determine whether it contains any material inconsistencies with the financial report.
Our audit did not involve an analysis of the prudence of business decisions made by directors or management.
We believe that the audit evidence we have obtained is sufficient and appropriate to provide a basis for our audit opinions.
Independence
In conducting our audit, we have complied with the independence requirements of the Corporations Act 2001.
Auditor’s opinion
In our opinion:
(a) the financial report of Macquarie Telecom Group Limited is in accordance with the Corporations Act 2001, including:
(i) giving a true and fair view of the consolidated entity’s financial position as at 30 June 2010 and of their performance for the year ended on that date; and
(ii) complying with Australian Accounting Standards (including the Australian Accounting Interpretations) and the Corporations Regulations 2001; and
(b) the financial report and notes also comply with International Financial Reporting Standards as disclosed in Note 1(b).
Report on the Remuneration Report
We have audited the Remuneration Report included in pages 20 to 24 of the directors’ report for the year ended 30 June 2010. The directors of the Company are responsible for the preparation and presentation of the Remuneration Report in accordance with section 300A of the Corporations Act 2001. Our responsibility is to express an opinion on the Remuneration Report, based on our audit conducted in accordance with Australian Auditing Standards.
Auditor’s opinion
In our opinion, the Remuneration Report of Macquarie Telecom Group Limited for the year ended 30 June 2010, complies with section 300A of the Corporations Act 2001.
PricewaterhouseCoopers
Wayne Andrews Partner
Sydney 26 August 2010
For
per
sona
l use
onl
y
Macquarie Telecom Annual Report 2010 65
Auditor’s Independence Declaration
Auditor’s Independence Declaration As lead auditor for the audit of Macquarie Telecom Group Limited for the year ended 30 June 2010, I declare that to the best of my knowledge and belief, there have been:
(a) no contraventions of the auditor independence requirements of the Corporations Act 2001 in relation to the audit; and
(b) no contraventions of any applicable code of professional conduct in relation to the audit.
This declaration is in respect of Macquarie Telecom Group Limited and the entities it controlled during the period.
Wayne Andrews Partner PricewaterhouseCoopers
Sydney 26 August 2010
For
per
sona
l use
onl
y

66
ASX Additional Information
Additional information required by the Australian Securities Exchange and not shown elsewhere in the Annual Report as follows:
The shareholder information set out below was applicable as at 27 September 2010.
A. Distribution of Equity Securities
Analysis of numbers of equity security holders by size of holding: Ordinary Shares ESP DSP Share Discretionary Purchase Plan Share Plan Shares Options Shares Shares
1–1,000 398 - 46 261,001–5,000 233 - - 18 5,001–10,000 61 1 - 5 10,001–100,000 61 6 - - 100,001–and over 11 - - - 764 7 46 49
The number of shareholders holding less than a marketable parcel of shares 14 13 -
B. Equity Security Holders
Twenty largest shareholders
The names of the 20 largest holders of quoted shares at 27 September 2010 Quoted Ordinary Shares
Number shares % Held
1 Claiward Pty Limited 12,501,390 60.36%2 Cogent Nominees Pty Limited 1,841,088 8.89%3 National Nominees Limited 1,395,937 6.74%4 Citicorp Nominees Pty Limited 381,520 1.84%5 Ms Elizabeth Dibbs 329,699 1.59%6 RBC Dexia Investor Services Australia Nominees Pty Limited 312,519 1.51%7 Moat Investments Pty Ltd 228,000 1.10%8 Carrier International Pty Limited 189,500 0.92%9 Mr Richard Mews & Mrs Wee Khoon Mews 186,426 0.90%10 Aust Executor Trustees NSW Ltd 150,000 0.72%11 Mr Richard Ewan Mews 119,688 0.58%12 J P Morgan Nominees Australia Limited 99,865 0.48%13 Mr Neville Clyde Martin & Mrs Lauren Carol Martin 96,000 0.46%14 Mrs Vicky Teoh 85,001 0.41%15 Mast Capital Pty Ltd 79,499 0.38%16 Mr Dinshaw Homi Katrak & Mrs Goolestan Dinshaw Katrak 79,106 0.38%17 Mr Robert Brydon Rudd 64,100 0.31%18 Mr Matthew James Wallace 55,000 0.27%19 Mr Denis Alan Aitken 50,000 0.24%20 Prius Healthcare Solutions Pty Ltd 46,704 0.23% 18,291,042 88.31%
Unquoted Equity Holders Number Number on issue of holders
Share Purchase Plan Shares 5,292 46Discretionary Share Plan Shares 96,400 49Options issued under the Employee Option Plan 112,500 6Options issued to directors to take up ordinary shares 40,000 1
For
per
sona
l use
onl
y
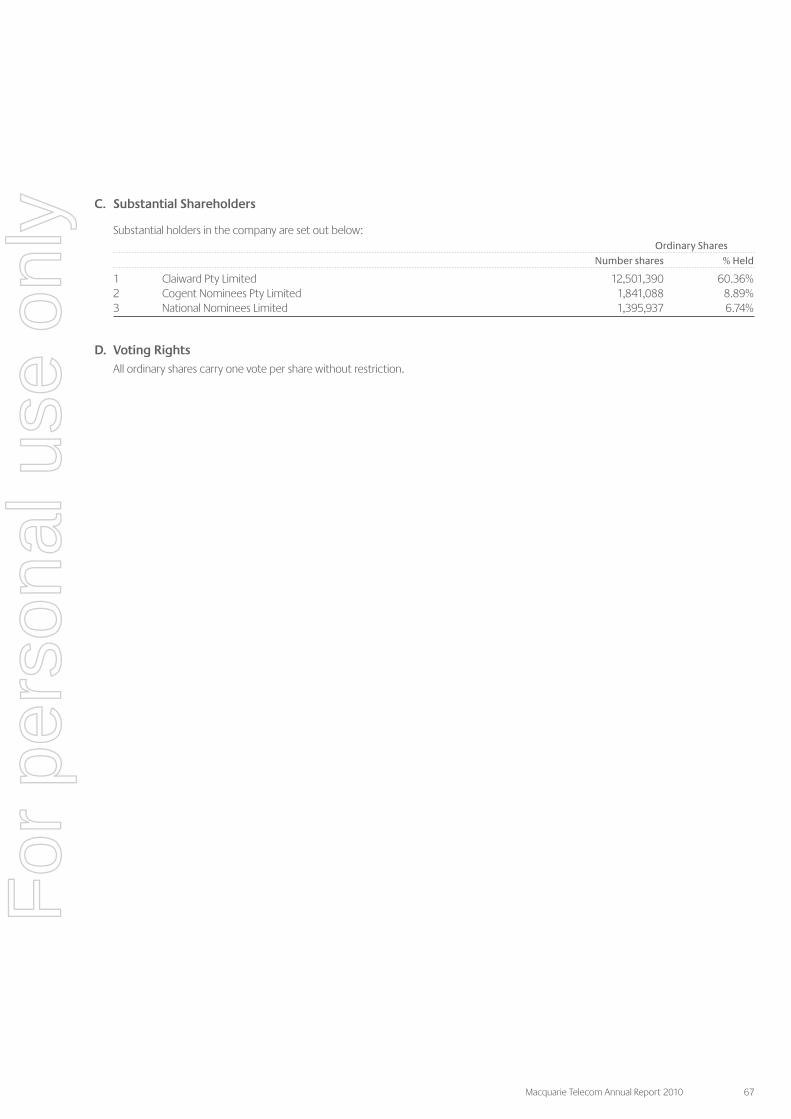
Macquarie Telecom Annual Report 2010 67
C. Substantial Shareholders
Substantial holders in the company are set out below: Ordinary Shares
Number shares % Held
1 Claiward Pty Limited 12,501,390 60.36%2 Cogent Nominees Pty Limited 1,841,088 8.89%3 National Nominees Limited 1,395,937 6.74%
D. Voting Rights All ordinary shares carry one vote per share without restriction.
For
per
sona
l use
onl
y
68
Directors
Robert KayeChairmanDavid TudehopeChief ExecutiveAidan TudehopeManaging Director – HostingStephen ButlerNon-Executive DirectorJohn PalfreymanNon-Executive Director
Company Secretaries
Michael SimmondsRichard Lutterbeck
Registered Office
Level 202 Market StreetSydney NSW 2000
Internet Address
macquarietelecom.com
MacquarieHUB
T 1800 789 999
Share Registry
Registries LimitedLevel 2207 Kent StreetSydney NSW 2000T 1300 737 760F 1300 653 459
Auditor
PricewaterhouseCoopers
Bankers
Australia and New Zealand Banking Group Limited
Solicitors
Gilbert & Tobin
Environment Note
This report is printed on environmentally responsible paper stock, HannoArt, using organic inks.
HannoArt paper stock is manufactured using low environmental impact FSC accredited pulps and is also made totally chlorine free. It is accredited under the Environmental Management System ISO 14001.
Company InformationThank you for your continued investment
For
per
sona
l use
onl
y

Des
ign
by W
ar D
esig
n St
udio
s
For
per
sona
l use
onl
y

macquarietelecom.com
Sydney Level 20 2 Market Street Sydney NSW 2000 T (02) 8221 7777 F (02) 8221 7788
Melbourne Level 1 441 St Kilda Road Melbourne VIC 3004 T (03) 9206 6800 F (03) 9206 6888
Brisbane Level 10 26 Wharf Street Brisbane QLD 4000 T (07) 3874 2300 F (07) 3874 2388
Perth Level 10 251 Adelaide Terrace Perth WA 6000 T (08) 9229 0000 F (08) 9229 0088
Hobart 49 Davey Street Hobart TAS 7000 T (03) 6214 0000 F (03) 6214 0888
Adelaide 297 Pirie Street Adelaide SA 5000 T (08) 8363 9700 F (08) 8363 9788
Canberra Level 7 54 Marcus Clarke Street Canberra ACT 2600 T (02) 6257 6277 F (02) 6257 7188
Intellicentre Level 16 477 Pitt Street Sydney NSW 2000 T (02) 8204 5100 F (02) 8204 5188
Toll Free numbers T 1800 653 053 F 1800 676 373
Macquarie Telecom
Annual Report 2010
Annual Report2010
Macquarie | HUB
Servicing our customers at the heart of our corporate headquarters in Sydney’s CBD.
For
per
sona
l use
onl
y