Macquarie 2015 Global Metals, Mining % Materials Conference, New York
43
MACQUARIE 2015 GLOBAL METALS, MINING & MATERIALS CONFERENCE New York June 10- 11, 2015
-
Upload
agnico-eagle-mines -
Category
Documents
-
view
13 -
download
2
Transcript of Macquarie 2015 Global Metals, Mining % Materials Conference, New York

MACQUARIE 2015 GLOBAL METALS, MINING & MATERIALS CONFERENCE
New York June 10- 11, 2015

AGNICO EAGLE | MACQUARIE 2015 GLOBAL METALS, MINING & MATERIALS CONFERENCE | 2
Forward Looking Statements
The information in this presentation has been prepared as at June 10 2015. Certain statements contained in this document constitute “forward-looking statements” within the meaning of the United States Private Securities Litigation Reform Act of 1995 and “forward-looking information” under the provisions of Canadian provincial securities laws and are referred to herein as “forward-looking statements”. When used in this document, the words “anticipate”, “expect”, “estimate”, “forecast”, “will”, “planned” and similar expressions are intended to identify forward-looking statements. Such statements include without limitation: the Company's forward-looking production guidance, including estimated ore grades, project timelines, drilling results, metal production, mine estimates horizons, production, total cash costs per ounce, minesite costs per tonne; all-in sustaining costs and cash flows; the estimated timing and conclusions of technical reports and other studies; the methods by which ore will be extracted or processed; statements concerning expansion projects, recovery rates, mill throughput, and projected exploration expenditures, including costs and other estimates upon which such projections are based; estimates of depreciation expense, general and administrative expense and tax rates; the impact of maintenance shutdowns; statements regarding timing and amounts of capital expenditures and other assumptions; estimates of future reserves, resources, mineral production, optimization efforts and sales; estimates of mine life; estimates of future mining costs, total cash costs, minesite costs, all-in sustaining costs and other expenses; estimates of future capital expenditures and other cash needs, and expectations as to the funding thereof; statements and information as to the projected development of certain ore deposits, including estimates of exploration, development and production and other capital costs, and estimates of the timing of such exploration, development and production or decisions with respect to such exploration, development and production; estimates of reserves and resources, and statements and information regarding anticipated future exploration; the anticipated timing of events with respect to the Company’s mine sites and statements and information regarding the sufficiency of the Company’s cash resources and other statements and information regarding anticipated trends with respect to the Company's operations, exploration and the funding thereof. Such statements and information reflect the Company’s views as at the date of this document and are subject to certain risks, uncertainties and assumptions, and undue reliance should not be placed on such statements and information. Forward-looking statements are necessarily based upon a number of factors and assumptions that, while considered reasonable by Agnico Eagle as of the date of such statements, are inherently subject to significant business, economic and competitive uncertainties and contingencies. The material factors and assumptions used in the preparation of the forward looking statements contained herein, which may prove to be incorrect, include, but are not limited to, the assumptions set forth herein and in management's discussion and analysis (“MD&A”) and the Company's Annual Information Form (“AIF”) for the year ended December 31, 2014 filed with Canadian securities regulators and that are included in its Annual Report on Form 40-F for the year ended December 31, 2014 (“Form 40-F”) filed with the U.S. Securities and Exchange Commission (the “SEC”) as well as: that there are no significant disruptions affecting operations; that production, permitting and expansion at each of Agnico Eagle's properties proceeds on a basis consistent with current expectations and plans; that the relevant metals prices, exchange rates and prices for key mining and construction supplies will be consistent with Agnico Eagle's expectations; that Agnico Eagle's current estimates of mineral reserves, mineral resources, mineral grades and metal recovery are accurate; that there are no material delays in the timing for completion of ongoing growth projects; that the Company's current plans to optimize production are successful; and that there are no material variations in the current tax and regulatory environment. Many factors, known and unknown could cause the actual results to be materially different from those expressed or implied by such forward looking statements and information. Such risks include, but are not limited to: the volatility of prices of gold and other metals; uncertainty of mineral reserves, mineral resources, mineral grades and mineral recovery estimates; uncertainty of future production, capital expenditures, and other costs; currency fluctuations; financing of additional capital requirements; cost of exploration and development programs; mining risks; community protests; risks associated with foreign operations; governmental and environmental regulation; the volatility of the Company’s stock price; and risks associated with the Company’s by-product metal derivative strategies. For a more detailed discussion of such risks and other factors that may affect the Company’s ability to achieve the expectations set forth in the forward-looking statements contained in this document, see the AIF and MD&A filed on SEDAR at www.sedar.com and included in the Form 40-F filed on EDGAR at www.sec.gov, as well as the Company’s other filings with the Canadian securities regulators and the SEC. The Company does not intend, and does not assume any obligation, to update these forward-looking statements and information. For a detailed breakdown of the Company’s reserve and resource position see the Company’s press release dated February 11, 2015.

AGNICO EAGLE | MACQUARIE 2015 GLOBAL METALS, MINING & MATERIALS CONFERENCE | 3
Notes to Investors
Note Regarding the Use of Non-GAAP Financial Measures
This presentation discloses certain measures, including ‘‘total cash costs per ounce’’ and ‘‘minesite costs per tonne’’ that are not recognized measures under IFRS. This data may not be comparable to data presented by other gold producers. For a reconciliation of these measures to the most directly comparable financial information presented in the consolidated financial statements prepared in accordance with IFRS and for an explanation of how management uses these measures, see “Reconciliation of Non-GAAP Financial Performance Measures” below. Total cash costs per ounce of gold produced is presented on both a by-product basis (deducting by-product metal revenues from production costs) and co-product basis (before by-product metal revenues). Total cash costs per ounce of gold produced on a by-product basis is calculated by adjusting production costs as recorded in the consolidated statements of income (loss) for by-product revenues, unsold concentrate inventory production costs, smelting, refining and marketing charges and other adjustments, and then dividing by the number of ounces of gold produced. Total cash costs per ounce of gold produced on a co-product basis is calculated in the same manner as total cash costs per ounce of gold produced on a by-product basis except that no adjustment for by-product metal revenues is made. Accordingly, the calculation of total cash costs per ounce of gold produced on a co-product basis does not reflect a reduction in production costs or smelting, refining and marketing charges associated with the production and sale of by-product metals. Total cash costs per ounce of gold produced is intended to provide information about the cash generating capabilities of the Company’s mining operations. Management also uses these measures to monitor the performance of the Company’s mining operations. As market prices for gold are quoted on a per ounce basis, using the total cash cost per ounce of gold produced on a by-product basis measure allows management to assess a mine’s cash generating capabilities at various gold prices. Management is aware that these per ounce measures of performance can be affected by fluctuations in and exchange rates. and, in the case of total cash costs per ounce of gold produced on a by-product basis, by-product metal prices. Management compensates for these inherent limitations by using these measures in conjunction with minesite costs per tonne (discussed below) as well as other data prepared in accordance with IFRS. Management also performs sensitivity analyses in order to quantify the effects of fluctuating exchange rates and metal prices. This presentation also contains information as to estimated future total cash costs per ounce, all-in sustaining costs and minesite costs per tonne. The estimates are based upon the total cash costs per ounce, all-in sustaining costs and minesite costs per tonne that the Company expects to incur to mine gold at its mines and projects and, consistent with the reconciliation of these actual costs referred to above, do not include production costs attributable to accretion expense and other asset retirement costs, which will vary over time as each project is developed and mined. It is therefore not practicable to reconcile these forward-looking Non-GAAP financial measures to the most comparable IFRS measure.
Note Regarding Production Guidance
The gold production guidance is based on the Company’s mineral reserves but includes contingencies and assumes metal prices and foreign exchange rates that are different from those used in the reserve estimates. These factors and others mean that the gold production guidance presented in this disclosure does not reconcile exactly with the production models used to support these mineral reserves.
AGNICO EAGLE | MACQUARIE 2015 GLOBAL METALS, MINING & MATERIALS CONFERENCE | 4
Agnico Eagle – Running a High Quality, Manageable Business
Reserve Quality – Highest Grade Amongst North American Peers
Improved Financial Flexibility
Declining Operating Costs
Long Track Record of Exploration
Success
Assets Delivering – 2015 Record Gold
Production Disciplined Share
Issuance
Project Pipeline Expected
to Drive Future Production Growth
Consistent Dividend Payer
Low Political Risk Operating Regions
Experienced Management,
Proven Strategy
A PREMIUM GOLD COMPANY

AGNICO EAGLE | MACQUARIE 2015 GLOBAL METALS, MINING & MATERIALS CONFERENCE | 5
Nunavut Finland
Mexico
Abitibi Region NORTHERN BUSINESS
SOUTHERN BUSINESS
Focused in Four Low Risk Mining Jurisdictions
2015E Gold Production
$618
$890
2015ECash Costs
2015EAISC
1.6M ounces

AGNICO EAGLE | MACQUARIE 2015 GLOBAL METALS, MINING & MATERIALS CONFERENCE | 6
235 219 294 315 310 310
809 880
1,135 1,285 1,290
1,190
1,044 1,099
1,429
1,600 1,600 1,500
$640 $648
$637
$618*
2012A 2013A 2014A 2015E 2016E 2017E
Stable Production and Cost Profile LaRonde, Kittila, La India and Canadian Malartic are key production drivers over the next three years
Payable Gold Production Profile Northern Business (‘000 oz) Southern Business (‘000 oz) Annual Production (‘000 oz) Cash Cost
* Approximate mid range of estimated 2015 cost guidance

AGNICO EAGLE | MACQUARIE 2015 GLOBAL METALS, MINING & MATERIALS CONFERENCE | 7
Opportunities to Enhance Future Production
Estimated production level in 2017 is currently forecast to be approximately 1.5 million ounces. However, studies are underway at the following projects (which have not yet been approved for construction) which could further enhance the Company’s production profile:
Expansion of the Vault Deposit at Meadowbank - Potential for a portion of previous reserve (246,000 oz) to be added back into the mine plan starting in 2017
Development of the Deep Zone at Goldex - Goal of outlining a mineable reserve and completion of a technical study by late 2015 or early 2016
Production from Akasaba West - Permitting and technical studies are underway with the goal of moving towards a production decision and utilization of extra mill capacity at Goldex
Rimpi Zone Development at Kittilä - Underground ramp is being extended to provide further underground drill access to test for additional depth extensions of the Rimpi, Suuri and Roura mineralized zones
Development of the Kuotko satellite deposit at Kittilä

AGNICO EAGLE | MACQUARIE 2015 GLOBAL METALS, MINING & MATERIALS CONFERENCE | 8
2014 Reserve Highlights Highest average reserve grade amongst North American peers
Gold reserves* increased to 20.0 million ounces from 16.9 million with the acquisition of Canadian Malartic
Gold grades increased at key operations: LaRonde, Kittilä and Pinos Altos
Approximately 92% of current reserves (not including Canadian Malartic) mineable at cash costs below $950 per ounce
Reserve sensitivity: A $150 per ounce move in the gold price (all other assumptions unchanged) results in approximately a 6% change in reserves
*For a detailed breakdown of Agnico Eagle’s reserve and resource position see the Company’s press release dated February 11, 2015
Source: Company reports *Reserve December 31, 2014 Source: Barclays Research
2.40
1.37 1.30 1.22 1.08 1.04 0.95 0.78 0.72
0
1
2
3
AEM
ABX
IAG
EGO
AVER
AGE
NEM G
G
AUY
KGC
Reserve Grade (g/t)
43% 41%
26% 25% 19%
12%
-10%
-19% -30%
-20%
-10%
0%
10%
20%
30%
40%
50%
ABX
EGO
NEM G
G
AUY
KGC
IAG
AEM
5-Year Difference Between Production and Reserve Grade

AGNICO EAGLE | MACQUARIE 2015 GLOBAL METALS, MINING & MATERIALS CONFERENCE | 9
ODYSSEY*
PANDORA*
LARONDE III
RIMPI AND NEW PARALLEL ZONE AT KITTILA
PINOS ALTO SATELLIITES
LA INDIA EXPANSION POTENTIAL
UPPER BEAVER*
EL BARQUENO
MELIADINE GOLDEX DEEP
AMARUQ
Strong Exploration/Development Pipeline Supports Future Growth
ADVANCED EXPLORATION DEVELOPMENT MINE SITE
HAMMOND REEF*
*50% AEM Ownership

AGNICO EAGLE | MACQUARIE 2015 GLOBAL METALS, MINING & MATERIALS CONFERENCE | 10
Financial Position Cash position remains strong and debt levels reduced in Q1 2015
Long-term Debt Maturities
2015 2016 2017 2020 2022 2024 Notes Outstanding (millions) $115 $360 $225 $100
Coupon 6.13% 6.67% 5.93% 5.02%
Canadian Malartic Debt (50% share) (millions) C$20 C$20 C$58
Coupon 6.875% 6.875% 6.875%
All Amounts Are In US$ (Unless Otherwise Indicated) March 31, 2015
Cash And Cash Equivalents (millions) $172
Outstanding Debt (millions) $1,272
Available Credit Facilities (millions) $800
Common Shares Outstanding, Basic (Q1 2015 Weighted Average, millions) 215
Common Shares Outstanding, Fully Diluted (Q1 2015 Weighted Average, millions) 216

AGNICO EAGLE | MACQUARIE 2015 GLOBAL METALS, MINING & MATERIALS CONFERENCE | 11
Largest Gold Producer in the Abitibi Region Four mines within 50 kilometers

AGNICO EAGLE | MACQUARIE 2015 GLOBAL METALS, MINING & MATERIALS CONFERENCE | 12
PRODUCTION Q1 2015 PRODUCTION HIGHLIGHTS
LaRonde 58,893 ozs at a total cash cost of $703/oz
Steady ramp up of production through 2017 with increasing mining grades in the deeper portion of the mine (reserve grade is 5.2 g/t gold)
Commissioning of ore conveyor expected in the second half of 2015 Studies underway to assess the potential to extend the reserve base
and carry out mining activities between the 311 and 371 levels
Canadian Malartic GP
67,893 ozs at a total cash cost of $632/oz
Record production in March 2015 Optimization and cost savings initiatives ongoing In March 2015, the Partnership acquired a 100% interest in the Malartic
CHL project from Abitibi Royalties clearing the way to drill test both the North and South Odyssey targets
Goldex 29,250 ozs at a total cash cost of $541/oz
M2 and M5 zones have been added to the mine plan, M3 and M4 satellites will likely be added later this year
Accelerated development of the exploration ramp into the top of the Deep zone continues. The ramp will provide access for additional drilling, with a goal of outlining a mineable reserve and completion of a technical study by late 2015 or early 2016
Lapa 25,920 ozs at a total cash cost of $568/oz
In Q1 2015, higher grades and recoveries continued from the Zulapa Z7 zone
An underground drift is being developed from the 101 level of the Lapa mine onto the adjoining Pandora property (50% Agnico). Exploration drilling at Pandora and in the Zulapa Z7 zone could potentially extend the mine life
Abitibi Region Solid and growing production base in Quebec

AGNICO EAGLE | MACQUARIE 2015 GLOBAL METALS, MINING & MATERIALS CONFERENCE | 13
Approximately 80% of ore now accessed from below level 245
Three mining horizons now operational providing improved access to higher grade reserves
Annual gold production expected to reach 350,000 ozs in 2019
Deposit continues to expand at depth
Laronde - Lower Mine Production Increasing

AGNICO EAGLE | MACQUARIE 2015 GLOBAL METALS, MINING & MATERIALS CONFERENCE | 14
Canadian Malartic – One of Canada’s Largest Gold Mines Drilling underway to test both the North and South Odyssey targets

AGNICO EAGLE | MACQUARIE 2015 GLOBAL METALS, MINING & MATERIALS CONFERENCE | 15
Goal is to outline a mineable reserve by late 2015 or early 2016
Development of additional satellites could potentially extend mine life and improve costs given the mill has capacity for 8,000 tpd (currently operating at ~6,200 tpd)
Akasaba West deposit could potentially create flexibility and synergies for the Company's operations in the Abitibi region by utilizing extra milling capacity at Goldex
Recent drilling shows good continuity between the upper and lower D zone (Intersection of 4.18 g/t Au over 157.5m)
Goldex Deep Zone Ramp Development Accelerated

AGNICO EAGLE | MACQUARIE 2015 GLOBAL METALS, MINING & MATERIALS CONFERENCE | 16
Nunavut – Production, Development And Exploration Nunavut platform supported by logistical centre in the Abitibi

AGNICO EAGLE | MACQUARIE 2015 GLOBAL METALS, MINING & MATERIALS CONFERENCE | 17
EXPLORATION AND DEVELOPMENT HIGHLIGHTS
Meliadine
Updated technical study filed March 12, 2015 Meliadine reserves increased by approximately 500,000 ounces to 3.3 million ounces
(at a grade of 7.44 g/t gold) 2015 capital budget expected to be $64 million with a focus on continued ramp development and
permitting activities
Amaruq
2015 drill program underway to expand the initial 1.5 million ounce inferred resource base (not included in Meadowbank resources) . Infill drilling under Whale Lake yielding positive results
Amaruq could potentially be developed as a satellite to Meadowbank Baseline environmental and exploration road studies continuing
Nunavut Arctic platform starting to gain momentum
PRODUCTION Q1 2015 PRODUCTION HIGHLIGHTS
Meadowbank 88,523 ozs at a total cash cost of $655/oz
Current favorable US$/C$ exchange rate and lower fuel costs have potential to add 150koz to 200koz from the Vault Pit extension back into the mine plan starting in 2017. Decision expected by mid 2015

AGNICO EAGLE | MACQUARIE 2015 GLOBAL METALS, MINING & MATERIALS CONFERENCE | 18
Amaruq – 2015 Exploration Program Focus on expanding the Whale Tail zone and testing other target areas
I,V,R Winter Phase
Hole Total
18 3,370
Mammoth Winter Phase
Hole Priority Total
15 1 3,000
11 23 2,200
Total 5,200
Whale Tail Winter Phase
Hole Type Total
89 Conversion 27,000
14 Explo/ Resource 5,000
Total 32,000
Amaruq Winter Phase
Total 40,570

AGNICO EAGLE | MACQUARIE 2015 GLOBAL METALS, MINING & MATERIALS CONFERENCE | 19
Amaruq Studies underway for construction of an all-weather exploration road linking to Meadowbank mine
Meadowbank +/- 50km Road proposal +/- 60km
Whale Tail zone surface expression
300m

AGNICO EAGLE | MACQUARIE 2015 GLOBAL METALS, MINING & MATERIALS CONFERENCE | 20
Amaruq – Highlights From Current 2015 Drill Program Area under Whale Lake continues to infill, new structure found north of Whale Tail zone
AMQ15-179 5.2 g/t Au / 8.5 m
And 11.3 g/t Au / 8.5 m
AMQ15-178 3.4 g/t Au / 5.8 m
And 3.6 g/t Au / 3.5 m And 7.5 g/t Au / 11.2 m Incl. 10.4 g/t Au / 6.2 m
And 5.3 g/t Au / 4.1 m
AMQ15-181 11.7 g/t Au / 22.5 m
Incl. 15.9 g/t Au / 14.6 m
AMQ15-176 18.7 g/t Au / 3.8 m
And 3.5 g/t Au / 3.5 m And 4.8 g/t Au / 6.2 m
AMQ15-177 5.2 g/t Au / 4.0 m
And 10.2 g/t Au / 3.2 m And 6.3 g/t Au / 4.1 m And 6.1 g/t Au / 4.0 m And 9.7 g/t Au / 3.8 m
AMQ15-184 7.2 g/t Au / 11.5 m
Incl. 11.1 g/t Au / 5.4 m 4.4 g/t Au / 4.2 m 3.6 g/t Au / 4.6 m
AMQ15-188 9.3 g/t Au / 3.5 m
AMQ15-186 3.5 g/t Au / 4.8 m
AMQ15-185 7.6 g/t Au / 10.2 m
Incl. 9.5 g/t Au / 7.6 m
AMQ15-187 3.7 g/t Au / 4.5 m
19.8 g/t Au / 5.0 m Incl. 31.9 g/t Au / 3.1 m
3.2 g/t Au / 5.2 m
AMQ15-200 8.9 g/t Au / 3.4 m
AMQ15-208 18.3 g/t Au / 4.3 m
AMQ15-165 16.8 g/t Au / 3.1 m
IVR14-145 6.9 g/t Au / 2.9 m
IVR14-150 5.9 g/t Au / 5.4 m

AGNICO EAGLE | MACQUARIE 2015 GLOBAL METALS, MINING & MATERIALS CONFERENCE | 21
Amaruq – Whale Tail Resource Model The Whale Tail deposit is continuous over at least 1.2 kilometres strike length and extends from surface to more than 370 metres depth. It remains open at depth and to the southwest
AMQ15-178 3.4 g/t Au / 5.8 m
And 3.6 g/t Au / 3.5 m And 7.5 g/t Au / 11.2 m Incl. 10.4 g/t Au / 6.2 m And 5.3 g/t Au / 4.1 m
AMQ15-181 11.7 g/t Au / 22.5 m
Incl. 15.9 g/t Au / 14.6 m
AMQ15-177 And 6.1 g/t Au / 4.0 m And 9.7 g/t Au / 3.8 m
AMQ15-179 5.2 g/t Au / 8.5 m
And 11.3 g/t Au / 8.5 m
AMQ15-176 18.7 g/t Au / 3.8 m
And 3.5 g/t Au / 3.5 m And 4.8 g/t Au / 6.2 m
AMQ15-177 5.2 g/t Au / 4.0 m
And 10.2 g/t Au / 3.2 m And 6.3 g/t Au / 4.1 m
AMQ15-185 7.6 g/t Au / 10.2 m
Incl. 9.5 g/t Au / 7.6 m
AMQ15-187 3.7 g/t Au / 4.5 m
19.8 g/t Au / 5.0 m Incl. 31.9 g/t Au / 3.1 m
3.2 g/t Au / 5.2 m
AMQ15-184 7.2 g/t Au / 11.5 m
Incl. 11.1 g/t Au / 5.4 m 4.4 g/t Au / 4.2 m 3.6 g/t Au / 4.6 m
AMQ15-186 3.5 g/t Au / 4.8 m
AMQ15-188 9.3 g/t Au / 3.5 m
AMQ15-208 18.3 g/t Au / 4.3 m
AMQ15-200 8.9 g/t Au / 3.4 m
AMQ15-165 16.8 g/t Au / 3.1 m
IVR14-145 6.9 g/t Au / 2.9 m
IVR14-150 5.9 g/t Au / 5.4 m

AGNICO EAGLE | MACQUARIE 2015 GLOBAL METALS, MINING & MATERIALS CONFERENCE | 22
Meliadine Development Project Focus on ramp development and permitting activities in 2015

AGNICO EAGLE | MACQUARIE 2015 GLOBAL METALS, MINING & MATERIALS CONFERENCE | 23
European gold mine production, Moz Regional Overview
Finland Kittilä Mine - a significant European producer with long life reserves
Source: Metals Focus – Gold Focus 2015
-
0.05
0.10
0.15
0.20
0.25
0.30
2011 2012 2013 2014
Kittila Finland Sweden Bulgaria Others

AGNICO EAGLE | MACQUARIE 2015 GLOBAL METALS, MINING & MATERIALS CONFERENCE | 24
EXPLORATION AND DEVELOPMENT HIGHLIGHTS
Rimpi Development
Drilling on the Rimpi Zone has outlined a significant zone of mineralization with potentially wider widths and better grades than those currently being mined
Main underground ramp at Kittilä is being extended to reach the Rimpi Zone and facilitate further exploration. A surface ramp is also being driven into the Rimpi Zone
Kuotko Satellite Deposit
Located just 15 km north of the Kittilä mine, studies are underway to assess the viability of mining the deposit by open pit. Drilling is underway to infill and potentially expand the existing 170,000 ounce inferred resource
Kittilä Reviewing opportunities to increase production
PRODUCTION Q1 2015 PRODUCTION HIGHLIGHTS
Kittilä 44,654 ozs at a total cash cost of $681/oz
During the fourth quarter of 2014, mill expansion ramped up to the 4,000 tpd nameplate capacity (early indications have shown that the plant can potentially exceed this capacity)
Q1 2015 drilling yields deepest intersection to date and indications of a new parallel zone of mineralization

AGNICO EAGLE | MACQUARIE 2015 GLOBAL METALS, MINING & MATERIALS CONFERENCE | 25
Kittilä – Suuri Trend Recent deep drilling of the Suuri trend has intersected 5.3 g/t gold over 10 meters at a depth of approximately 1,600 meters below surface
AGNICO EAGLE | MACQUARIE 2015 GLOBAL METALS, MINING & MATERIALS CONFERENCE | 26
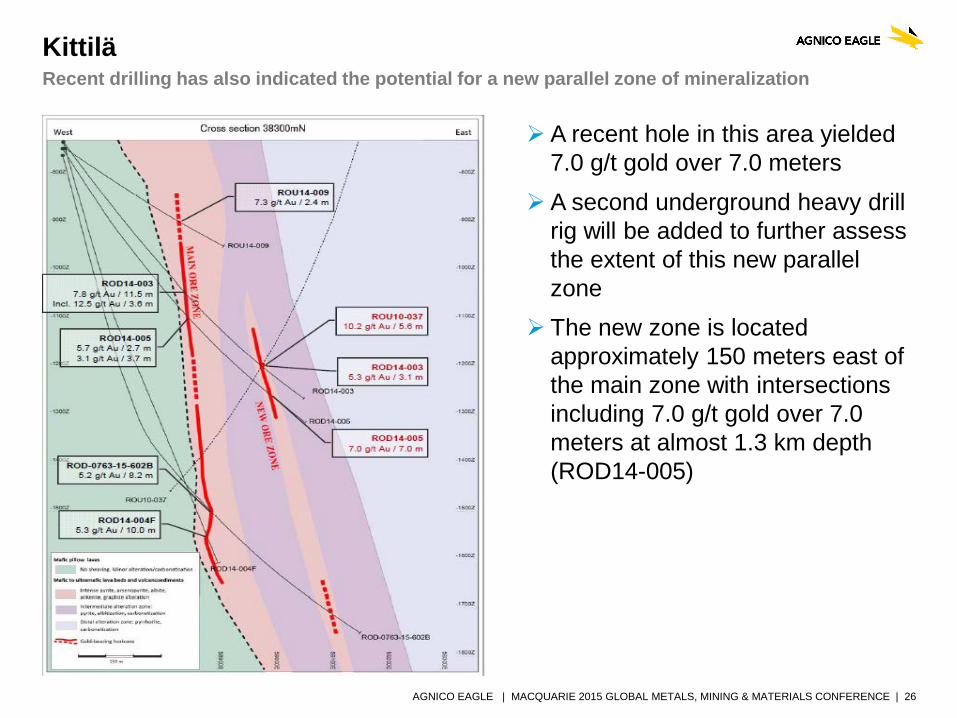
Kittilä Recent drilling has also indicated the potential for a new parallel zone of mineralization
A recent hole in this area yielded 7.0 g/t gold over 7.0 meters
A second underground heavy drill rig will be added to further assess the extent of this new parallel zone
The new zone is located approximately 150 meters east of the main zone with intersections including 7.0 g/t gold over 7.0 meters at almost 1.3 km depth (ROD14-005)

AGNICO EAGLE | MACQUARIE 2015 GLOBAL METALS, MINING & MATERIALS CONFERENCE | 27
Mexico – Three Mines and an Advanced Exploration Project Growing production with low and stable costs
Annual AEM Mexico Production and Costs Regional Overview
La India
Pinos Altos & Mascota
$10
$60
$110
$160
$210
$260
-
50
100
150
200
250
300
2010 2011 2012 2013 2014
Production (koz) Costs ('000)

AGNICO EAGLE | MACQUARIE 2015 GLOBAL METALS, MINING & MATERIALS CONFERENCE | 28
PRODUCTION Q1 2015 PRODUCTION HIGHLIGHTS
Pinos Altos 50,106 ozs at a total cash cost of $357/oz
Shaft sinking is ongoing (currently at a depth of approx. 532 metres), with completion expected in early 2016
Creston Mascota
12,448 ozs at a total cash cost of $444/oz
In 2015, construction is expected to begin on the Phase 4 leach pad at Creston Mascota
La India 26,523 ozs at a total cash cost of $418/oz
Earthworks are in progress on the second phase leach pad. This pad expansion will provide capacity for the current planned life-of-mine production at La India
In Q1 2015, the El Realito concession was acquired from Alamos Gold, which consolidates the land position between the La India and Main Zones, and could provide additional resource potential at La India
Mexico Record quarterly precious metal production in Q1 2015

AGNICO EAGLE | MACQUARIE 2015 GLOBAL METALS, MINING & MATERIALS CONFERENCE | 29
Pinos Altos/Mascota Satellite Zones Infill drill programs planned at Sinter and Bravo deposits in 2015

AGNICO EAGLE | MACQUARIE 2015 GLOBAL METALS, MINING & MATERIALS CONFERENCE | 30
Potential additional heap leach
Exploration potential between the pits
La India Exploration Upside
Resource halos around current pits require additional drilling Good exploration potential between Main and La India Zones and surrounding
claim packages Exploring bulk tonnage porphyry targets close to La India (i.e. Arroyo Hondo)
Evaluating potential to expand production

AGNICO EAGLE | MACQUARIE 2015 GLOBAL METALS, MINING & MATERIALS CONFERENCE | 31
El Barqueño – 2015 Exploration Program A $15 million exploration program is underway with the first resource expected by year-end 2015

AGNICO EAGLE | MACQUARIE 2015 GLOBAL METALS, MINING & MATERIALS CONFERENCE | 32
El Barqueño – Highlights from Current Drill Program Potential to delineate mineralization along an eight kilometer strike length
Infill drilling at Azteca has yielded 4.02 g/t gold and 0.03% copper (uncapped) over 12.2 metres at 31 metres depth (hole BDD0119).
The Angostura prospect is being extended to the southwest and deeper, including the BRQ15-153 intercept of 1.79 g/t gold and 1.54% copper (uncapped) over 5.9 metres at 217 metres below surface.
At Peña de Oro, hole BRQ15-148 intersected 3.95 g/t gold and 1.34% copper (uncapped) over 9.6 metres at 135 metres below surface, suggesting continuity and extension of the mineralization to the southwest.
Source: Cayden Resources

SUMMARY
AGNICO EAGLE | MACQUARIE 2015 GLOBAL METALS, MINING & MATERIALS CONFERENCE | 34
Agnico Eagle – A High Quality, Manageable Gold Mining Business
Stable production and costs expected through 2017 – Production in 2015 forecast to be 1.6M ounces at a total cash costs of approximately $618/oz with AISC of $880 to $900/oz Numerous Opportunities to enhance 2017 production forecast - Expansion of the Vault Deposit at Meadowbank,
Development of the Deep Zone at Goldex, Production from Akasaba West, Rimpi Zone Development and evaluation of the Kuotko satellite deposit at Kittilä
Exploration upside at most operating mines – Expansion of resource base below 3.1km at LaRonde; Evaluation of targets on the Pandora property which adjoins Lapa; Deep Zone at Goldex; Further drill testing of Odyssey North and South zones at Canadian Malartic; Drill testing of satellite zones at Pinos Altos and Creston Mascota; Exploring Bulk Tonnage porphyry targets close to La India
Continued focus on reserve quality and improved grades - Highest reserve grade amongst the North American peer group and increased y-o-y gold reserve grades at LaRonde, Kittilä and Pinos Altos
Advanced exploration and development pipeline expected to drive future production growth - Amaruq and Meliadine projects provide upside to the Nunavut operating platform; El Barqueno has the potential to further expand production in the Southern Business region
Existing cash and credit facilities provide financial flexibility

AGNICO EAGLE | MACQUARIE 2015 GLOBAL METALS, MINING & MATERIALS CONFERENCE | 35
AEM US Equity XAU Index Gold Spot
AEM US Equity CAGR
12.69% Gold Spot CAGR
8.81% XAU Index CAGR
0.59%
Indexed Share Performance Since 1998 Agnico equity poised for outperformance
0%
500%
1000%
1500%
2000%
2500%

APPENDIX

AGNICO EAGLE | MACQUARIE 2015 GLOBAL METALS, MINING & MATERIALS CONFERENCE | 37
Q1 2015 Operating Results Record quarterly production and strong cost performance
Q1 2015 2015 Forecast All amounts are in US$ (Unless Otherwise Indicated)
Production (Gold oz)
Total Cash Cost* ($/oz)
Operating Margin ($000’s)
Production (Gold oz)
Total Cash Cost* ($/oz)
Northern Business
LaRonde 58,893 $703 $30,015 245,000 $576 Lapa 25,920 $568 $14,687 75,000 $769 Goldex 29,250 $541 $19,253 100,000 $618 Canadian Malartic (50%) 67,893 $632 $34,718 280,000 $609 Kittila 44,654 $681 $27,415 185,000 $711 Meadowbank 88,523 $655 $46,577 400,000 $656
315,133 $645 $172,665 1,285,000 $642 Southern Business
Pinos Altos 50,106 $357 $34,652 175,000 $526 Creston Mascota 12,448 $444 $8,409 50,000 $559 La India 26,523 $418 $20,590 90,000 $491
89,077 $387 $63,651 315,000 $521 Total 404,210 $588 $236,316 1,600,000 $618
Q1 2015 Total Operating Margin – $236.3 M Q1 2015 Revenue by Metal
Gold 96%
Silver 3%
Base Metals 1%
Meadowbank, 20%
Canadian Malartic, 15%
Pinos Altos, 15%
LaRonde, 13%
Kittila, 12%
La India, 8%
Goldex, 8%
Lapa, 6%
Creston Mascota, 3%
*Total cash costs are presented on a by-product basis, that is net of by-product revenue

AGNICO EAGLE | MACQUARIE 2015 GLOBAL METALS, MINING & MATERIALS CONFERENCE | 38
Gold and Silver Reserves and Resources December 31, 2014
Gold Silver Tonnes (000’s)
Gold (g/t)
Gold (ounces) (000’s)
Tonnes (000’s)
Silver (g/t)
Silver (ounces) (000’s)
Proven & Probable Reserves
Northern Business 209,756 2.57 17,299 20,532 19.38 12,793
Southern Business 48,955 1.70 2,678 24,073 63.59 49,212
Total 258,711 2.40 19,976 44,605 43.24 62,005
Measured & Indicated Resources
Northern Business 248,346 1.70 13,575 6,791 23.35 5,097
Southern Business 68,633 0.65 1,439 14,167 37.93 17,277
Total 316,979 1.47 15,013 20,958 33.21 22,374
Inferred Resources
Northern Business 109,177 3.38 11,867 8,794 17.40 4,920
Southern Business 99,669 0.51 1,621 17,107 23.47 12,908
Total 208,847 2.01 13,487 25,901 21.41 17,828
See AEM Feb 11, 2015 press release for detailed breakdown of reserves and resources. Reserves are not a subset of resources.

AGNICO EAGLE | MACQUARIE 2015 GLOBAL METALS, MINING & MATERIALS CONFERENCE | 39
Copper, Zinc and Lead Reserves and Resources December 31, 2014
Copper Zinc Lead Tonnes (000’s)
Copper (%)
Copper (tonnes)
Tonnes (000’s)
Zinc (%)
Zinc (tonnes)
Tonnes (000’s)
Lead (%)
Lead (tonnes)
Proven & Probable Reserves
Northern Business 20,532 0.25 51,250 20,532 0.64 131,231 20,532 0.04 8,076
Southern Business
Total 20,532 0.25 51,250 20,532 0.64 131,231 20,532 0.04 8,076
Measured & Indicated Resources
Northern Business 6,791 0.24 16,076 6,791 1.01 68,645 6,791 0.11 7,622
Southern Business
Total 6,791 0.24 16,076 6,791 1.01 68,645 6,791 0.11 7,622
Inferred Resources
Northern Business 8,794 0.26 22,552 8,794 0.84 73,977 8,794 0.07 6,359
Southern Business
Total 8,794 0.26 22,552 8,794 0.84 73,977 8,794 0.07 6,359
See AEM Feb 11, 2015 press release for detailed breakdown of reserves and resources. Reserves are not a subset of resources.

AGNICO EAGLE | MACQUARIE 2015 GLOBAL METALS, MINING & MATERIALS CONFERENCE | 40
Mineral Reserves and Resources by Project December 31, 2014
See AEM Feb 11, 2015 press release for detailed breakdown of mineral reserves and resources. Reserves are not a subset of resources.
Northern Business Gold Tonnes (Mt) Gold (g/t) Gold (Moz)
LaRonde mine
Proven Reserves 4.5 3.76 0.5 Probable Reserves 16.1 5.60 2.9 Measured & Indicated Resource 6.8 3.26 0.7 Inferred Resource 8.8 4.23 1.2
Meadowbank mine
Proven Reserves 1.1 1.50 0.1 Probable Reserves 10.7 3.24 1.1 Measured & Indicated Resource 7.5 3.30 0.8 Inferred Resource 3.3 3.96 0.4
Canadian Malartic mine (50% Interest)
Proven Reserves 25.0 0.92 0.7 Probable Reserves 102.0 1.10 3.6 Measured & Indicated Resource (Undiluted) 35.6 0.85 1.0 Inferred Resource 22.7 0.76 0.6
Meliadine project
Proven Reserves 0.03 7.31 0.01 Probable Reserves 13.9 7.44 3.3 Indicated Resource 20.2 5.06 3.3 Inferred Resource 14.1 7.65 3.5
Kittila mine
Proven Reserves 0.9 4.41 0.1 Probable Reserves 27.6 4.95 4.4 Measured & Indicated Resource 14.2 2.96 1.4 Inferred Resource 8.9 4.30 1.2
Goldex mine
Proven Reserves 0.2 1.70 0.01 Probable Reserves 6.9 1.49 0.3 Measured & Indicated Resource 33.8 1.93 2.1 Inferred Resource 29.2 1.64 1.5
Lapa mine
Proven Reserves 0.8 5.87 0.2 Probable Reserves 0.1 5.50 0.01 Indicated Resource 1.1 4.29 0.1
Inferred Resource 1.1 6.30 0.2
Southern Business Gold Tonnes (Mt) Gold (g/t) Gold (Moz)
Pinos Altos mine
Proven Reserves 2.4 3.27 0.3 Probable Reserves 15.8 2.97 1.5 Indicated Resource 11.9 1.84 0.7 Inferred Resource 12.6 1.22 0.5
Creston Mascota mine
Proven Reserves 0.2 0.76 0.005 Probable Reserves 5.7 1.27 0.2 Indicated Resource 2.2 0.68 0.05 Inferred Resource 4.5 1.07 0.2
La India mine
Proven Reserves 0.1 0.53 0.002 Probable Reserves 24.8 0.85 0.7 Measured & Indicated Resource 54.5 0.39 0.7
Inferred Resource 82.6 0.37 1.0

AGNICO EAGLE | MACQUARIE 2015 GLOBAL METALS, MINING & MATERIALS CONFERENCE | 41
Notes to Investors Regarding the Use of Resources
Cautionary Note to Investors Concerning Estimates of Measured and Indicated Resources
This document uses the terms “measured resources” and “indicated resources”. Investors are advised that while those terms are recognized and required by Canadian regulations, the SEC does not recognize them. Investors are cautioned not to assume that any part or all of mineral deposits in these categories will ever be converted into reserves.
Cautionary Note to Investors Concerning Estimates of Inferred Resources
This document also uses the term “inferred resources”. Investors are advised that while this term is recognized and required by Canadian regulations, the SEC does not recognize it. “Inferred resources” have a great amount of uncertainty as to their existence, and great uncertainty as to their economic and legal feasibility. It cannot be assumed that all or any part of an inferred mineral resource will ever be upgraded to a higher category. Under Canadian rules, estimates of inferred mineral resources may not form the basis of feasibility or pre-feasibility studies, except in rare cases. Investors are cautioned not to assume that part or all of an inferred resource exists, or is economically or legally mineable.
Scientific and Technical Data
Cautionary Note To U.S. Investors - The SEC permits U.S. mining companies, in their filings with the SEC, to disclose only those mineral deposits that a company can economically and legally extract or produce. Agnico Eagle Mines Limited reports mineral resource and reserve estimates in accordance with the CIM guidelines for the estimation, classification and reporting of resources and reserves in accordance with the Canadian securities regulatory authorities' (the "CSA") National Instrument 43-101 Standards of Disclosure for Mineral Projects ("NI 43-101"). These standards are similar to those used by the SEC’s Industry Guide No. 7, as interpreted by Staff at the SEC ("Guide 7"). However, the definitions in NI 43-101 differ in certain respects from those under Guide 7. Accordingly, mineral reserve information contained herein may not be comparable to similar information disclosed by U.S. companies. Under the requirements of the SEC, mineralization may not be classified as a "reserve" unless the determination has been made that the mineralization could be economically and legally produced or extracted at the time the reserve determination is made. A "final" or "bankable" feasibility study is required to meet the requirements to designate reserves under Industry Guide 7. Agnico Eagle uses certain terms in this presentation, such as "measured", "indicated", and "inferred", and "resources" that the SEC guidelines strictly prohibit U.S. registered companies from including in their filings with the SEC.
In prior periods, reserves for all properties were typically estimated using historic three-year average metals prices and foreign exchange rates in accordance with the SEC guidelines. These guidelines require the use of prices that reflect current economic conditions at the time of reserve determination, which the Staff of the SEC has interpreted to mean historic three-year average prices. Given the current lower commodity price environment, Agnico Eagle has decided to use price assumptions that are below the three-year averages. The assumptions used for the mineral reserves estimates at all mines and advanced projects as of December 31, 2014, reported by the Company on February 11, 2015, are $1,150 per ounce gold, $18.00 per ounce silver, $1.00 per pound zinc, $3.00 per pound copper, $0.91 per pound lead and C$/US$, US$/Euro and MXP/US$ exchange rates of 1.08, 1.30 and 13.00, respectively.
For the reserves estimate at the Canadian Malartic mine, the Company has decided to continue to report the reserves estimated as of June 15, 2014, reported by the Company in a news release dated August 13, 2014, minus the production to the end of 2014. The assumptions used were $1,300 per ounce gold, a cut-off grade between 0.28 g/t and 0.35 g/t gold (depending on the deposit), and a C$/US$ exchange rate of 1.10.
NI 43-101 requires mining companies to disclose reserves and resources using the subcategories of "proven" reserves, "probable" reserves, "measured" resources, "indicated" resources and "inferred" resources. Mineral resources that are not mineral reserves do not have demonstrated economic viability.

AGNICO EAGLE | MACQUARIE 2015 GLOBAL METALS, MINING & MATERIALS CONFERENCE | 42
Notes to Investors Regarding the Use of Resources
A mineral reserve is the economically mineable part of a measured and/or indicated mineral resource. It includes diluting materials and allowances for losses, which may occur when the material is mined or extracted and is defined by studies at pre-feasibility or feasibility level as appropriate that include application of modifying factors. Such studies demonstrate that, at the time of reporting, extraction could reasonably be justified.
Modifying factors are considerations used to convert mineral resources to mineral reserves. These include, but are not restricted to, mining, processing, metallurgical, infrastructure, economic, marketing, legal, environmental, social and governmental factors.
A proven mineral reserve is the economically mineable part of a measured mineral resource. A proven mineral reserve implies a high degree of confidence in the modifying factors. A probable mineral reserve is the economically mineable part of an indicated and, in some circumstances, a measured mineral resource. The confidence in the modifying factors applying to a probable mineral reserve is lower than that applying to a proven mineral reserve.
A mineral resource is a concentration or occurrence of solid material of economic interest in or on the Earth's crust in such form, grade or quality and quantity that there are reasonable prospects for eventual economic extraction. The location, quantity, grade or quality, continuity and other geological characteristics of a mineral resource are known, estimated or interpreted from specific geological evidence and knowledge, including sampling.
A measured mineral resource is that part of a mineral resource for which quantity, grade or quality, densities, shape and physical characteristics are estimated with confidence sufficient to allow the application of modifying factors to support detailed mine planning and final evaluation of the economic viability of the deposit. Geological evidence is derived from detailed and reliable exploration, sampling and testing and is sufficient to confirm geological and grade or quality continuity between points of observation. An indicated mineral resource is that part of a mineral resource for which quantity, grade or quality, densities, shape and physical characteristics are estimated with sufficient confidence to allow the application of modifying factors in sufficient detail to support mine planning and evaluation of the economic viability of the deposit. Geological evidence is derived from adequately detailed and reliable exploration, sampling and testing and is sufficient to assume geological and grade or quality continuity between points of observation. An inferred mineral resource is that part of a mineral resource for which quantity and grade or quality are estimated on the basis of limited geological evidence and sampling. Geological evidence is sufficient to imply but not verify geological and grade or quality continuity.
Investors are cautioned not to assume that part or all of an inferred resource exists, or is economically or legally mineable.
A feasibility study is a comprehensive technical and economic study of the selected development option for a mineral project that includes appropriately detailed assessments of applicable modifying factors together with any other relevant operational factors and detailed financial analysis that are necessary to demonstrate, at the time of reporting, that extraction is reasonably justified (economically mineable). The results of the study may reasonably serve as the basis for a final decision by a proponent or financial institution to proceed with, or finance, the development of the project. The confidence level of the study will be higher than that of a Pre-Feasibility Study.
The effective date for all of the Company's mineral resource and reserve estimates in this presentation is December 31, 2014. Additional information about each of the mineral projects that is required by NI 43-101, sections 3.2 and 3.3 and paragraphs 3.4 (a), (c) and (d) can be found in the Technical Reports filed by Agnico Eagle, which may be found at www.sedar.com. Other important operating information can be found in the Company's AIF and Form 40-F.
The scientific and technical information contained herein has been approved by Daniel Doucet, Senior Corporate Director, Reserve Development, and/or Alain Blackburn, Senior Vice-President, Exploration. Both Mr. Doucet and Mr. Blackburn are designated Ing. with the Ordre des ingenieurs du Québec and qualified persons as defined by NI 43-101.

Trading Symbol: AEM on TSX & NYSE
Investor Relations: 416-947-1212 [email protected]
agnicoeagle.com