MACOM DRIVE - LoopNet · sale 1315 Macom Dr, a prominent three-story office building in the...
49
1315 MACOM DRIVE Naperville, Illinois
Transcript of MACOM DRIVE - LoopNet · sale 1315 Macom Dr, a prominent three-story office building in the...

1315MACOM DRIVENaperville, Illinois

CONFIDENTIALITY AGREEMENTThe information contained in the following Marketing Brochure is proprietary and strictly confidential. It is intended to be reviewed only by the party receiving it from Institutional Property Advisors, a Division of Marcus & Millichap (“IPA”) and should not be made available to any other person or entity without the written consent of IPA. This Marketing Brochure has been prepared to provide summary, unverified information to prospective purchasers, and to establish only a preliminary level of interest in the subject property. The information contained herein is not a substitute for a thorough due diligence investigation. IPA and Marcus & Millichap have not made any investigation, and make no warranty or representation, with respect to the income or expenses for the subject property, the future projected financial performance of the property, the size and square footage of the property and improvements, the presence or absence of contaminating substances, PCB’s or asbestos, the compliance with State and Federal regulations, the physical condition of the improvements thereon, or the financial condition or business prospects of any tenant, or any tenant’s plans or intentions to continue its occupancy of the subject property. The information contained in this Marketing Brochure has been obtained from sources we believe to be reliable; however, IPA and Marcus & Millichap have not verified, and will not verify, any of the information contained herein, nor has IPA or Marcus & Millichap conducted any investigation regarding these matters and they make no warranty or representation whatsoever regarding the accuracy or completeness of the information provided. All potential buyers must take appropriate measures to verify all of the information set forth herein.
Seller retains all rights and discretion to determine the offer and acceptance process including but not limited to the right to accept or reject any offer in its sole and absolute discretion. Seller shall only be bound by duly executed and enforceable agreements entered into, if any. ALL MATTERS PRIVILEGED AND CONFIDENTIAL.
Institutional Property Advisors, a Division of Marcus & Millichap (“IPA”) is not affiliated with, sponsored by, or endorsed by any commercial tenant or lessee identified in this marketing package. The presence of any corporation’s logo or name is not intended to indicate or imply affiliation with, or sponsorship or endorsement by, said corporation of IPA or Marcus & Millichap, its affiliates or subsidiaries, or any agent, product, service, or commercial listing of IPA or Marcus & Millichap, and is solely included for the purpose of providing tenant lessee information about this listing to prospective customers.
ALL PROPERTY SHOWINGS ARE BY APPOINTMENT ONLY. PLEASE CONSULT YOUR IPA ADVISOR FOR MORE DETAILS.
NON-ENDORSEMENT NOTICE

EXCLUSIVELY LISTED BY:
Krysti C. GalvinFirst Vice President | Director(312) [email protected]: IL 475.168469
John Abuja, CCIM, SIOR, NAIOPSenior Director(312) [email protected]: IL 471.007675
Kenneth J. Szady, SIOR, CCIMNational Director(312) [email protected]: IL 471.016178


TABLE OF CONTENTS
EXECUTIVE SUMMARY...............................................................................1
PROPERTY DESCRIPTION..........................................................................11
FINANCIAL ANALYSIS.................................................................................19
MARKET OVERVIEW....................................................................................35


E X E C U T I V E S U M M A R Y
This information has been secured from sources we believe to be reliable, but we make no representations or warranties, express or implied, as to the accuracy of the information. References to square footage or age are approximate. Buyer must verify the information and bears all risk for any inaccuracies. Institutional Property Advisors, IPA, and Marcus & Millichap are service marks of Marcus & Millichap Real Estate Investment Services, Inc. © 2018 Marcus & Millichap. All rights reserved. ACT ID Z0300358

THE OFFERING
Marcus & Millichap has been selected to exclusively market for sale 1315 Macom Dr, a prominent three-story office building in the Naperville submarket of Chicago. The 28,112 square foot property is a 100% occupied with twelve tenants. Tenants include users of office and medical office space such as; Edward Jones, Associated Allergists, White Eagle Family Dentistry and Illinois Wellness. The property is located in Naperville, IL and has immediate access to route 59, Reagan Memorial Tollway (Interstate 88) and Walter Payton Memorial highway (route 34) which offer rapid access to the Chicago metro area and western suburbs. The building was constructed in 2004, with 81 surface parking spaces, 8 office suites per floor, and a low core factor. 1315 Macom Dr has been vastly improved by ownership with nearly 12,000 square feet of new leases over the past 2 years. The weighted average remaining lease in-place is currently at 4 years and 3 months, with 68% of the tenants expiring in 2023 or later. Average in-place rents in the building are $16.95 per square foot on a Net basis with only one tenant on a gross lease. This is a stabilized investment in Naperville, IL backed by a diverse mix of medical and office tenants on net leases.
23.30%Q1-2018
$21.15/SFQ1-2018
9.5%2018
NAPERVILLE OFFICE VACANCY NAPERVILLE GROSS ASKING
$21.27/SFQ2-2018
22.60%Q2-2018
0.00%
10.00%
20.00%
30.00%
40.00%
50.00%
60.00%
0
2,000
4,000
6,000
8,000
10,000
12,000
14,000
16,000
2019 2020 2021 2022 2023 2024 2025
EXPIRATION SCHEDULE
Square Feet Percent
1 3 1 5 M A C O M D R I V E

1315 MACOM DRIVE SPRINGBROOKSQUARE MALL
WHEATLANDINDUSTRIAL PARK
E X E C U T I V E S U M M A R Y | 3

STABILIZED68% of tenants expiring in 2023 or later.
76% MEDICAL TENANCYTenant practices include Endocrinology, Pediatrics, Allergies, Dentistry,Orthopedics and Chiropractic.
NET LEASEDStrong NOI insulated from operating expense increases by Net Lease Agreements.
1 3 1 5 M A C O M D R I V E

TRANSIT ORIENTED DESTINATIONExcellent highway access and heavy traffic counts (nearly 60,000vehicles per day) make this an attractive location for tenants.
PROXIMITY TO RETAIL CORRIDOR AND MEDICAL CENTERNearby attractions include various golf clubs, retail & entertainment centers, and restaurants. Rush Copley Medical Center is located less than 10 minutes away.
$ Returns10-Year Unleveraged Cash-on-Cash 9.08%10-Year Leveraged Cash-on-Cash 13.17%10-Year Unleveraged IRR 9.50%10-Year Leveraged IRR 15.81%
E X E C U T I V E S U M M A R Y | 5

LOCATION HIGHLIGHTS1315 Macom Dr is located in suburban Naperville, IL. Access to the property is provided via IL-59, which boasts nearly 60,000 cars in daily traffic. IL-59 connects to Reagan Memorial Highway (IL-88) and IL-55, which lead into Downtown Chicago and provide East-West and North-South access. IL-88 provides periph-eral access to all of the Western Chicago suburbs and direct access to Chicago, IL via interchange with IL-290. IL-55 provides direct access to Chicago, IL and leads to St. Louis, MI. The property is located roughly 5 minutes from Fox Valley Mall, which boasts of 1.4 million square feet in high-end retail and dining. The area also boasts numerous grocery retail centers, a movie theater and numerous apartment developments. Cal-vary Church is also located within a quarter mile of the Property hosting numerous large scale Christian faith events with current membership at over 7,000 for the Naperville location. The Property is 40 minutes from O’Hare international Airport and Midway Airport.
ll Over 5,800,000 SF of retail within a 2-mile radius
ll Short walk to White Eagle and Springbrook Golf Courses
ll Direct Access to I-88 and I-55
ll Access to O’Hare international and Downtown Chicago
ll Located near Fox Valley Mall
ll Specialty restaurants in the vicinity include: Panera, Houlihan’s, Potbelly, Starbucks,
Chipotle and Lou Malnati’s
1 3 1 5 M A C O M D R I V E

11/9/2018 Google Maps
https://www.google.com/maps/@41.768417,-88.165655,10z 1/1
Map data ©2018 Google 5 mi
SUBJECT PROPERTY
E X E C U T I V E S U M M A R Y | 7

FINANCIAL HIGHLIGHTSll List Price: $5,500,000ll 100% In-Place Occupancy ll Stabilized Cap Rate of 8.18%
ll Average Cap Rate over hold period: 8.92%
YIELD & RETURN HIGHLIGHTS
Year 1 NOI $ 449,757Year 1 Cap Rate 8.18%10-Year Unleveraged IRR 9.50%10-Year Leveraged IRR 15.81%10-Year Average Unleveraged Cash-on-Cash 9.08%10-Year Average Leveraged Cash-on-Cash 13.17%
1 3 1 5 M A C O M D R I V E

FINANCIAL HIGHLIGHTS
PROPOSED FINANCING
Loan Amount $3,850,000
LTV% 70%
Interest Rate 5.25%
Term 10 Year
Amortization Period 25 Years
Annnual Debt Service $276,852
Loan Fee 1.00%
The following debt terms have been provided by Marcus & Millichap Capital Corporation (MMCC) at the time of listing. These terms are provided as a guideline for our underwriting and subject to market conditions.
0.00%
20.00%
40.00%
60.00%
80.00%
100.00%
$0
$100,000
$200,000
$300,000
$400,000
$500,000
$600,000
2019 2020 2021 2022 2023 2024 2025 2026 2027 2028
NOI vs. Occupancy
NOI Occupancy
E X E C U T I V E S U M M A R Y | 9


P R O P E R T Y D E S C R I P T I O N
This information has been secured from sources we believe to be reliable, but we make no representations or warranties, express or implied, as to the accuracy of the information. References to square footage or age are approximate. Buyer must verify the information and bears all risk for any inaccuracies. Institutional Property Advisors, IPA, and Marcus & Millichap are service marks of Marcus & Millichap Real Estate Investment Services, Inc. © 2018 Marcus & Millichap. All rights reserved. ACT ID Z0300358

LOCATION 1315 Macom Dr, Naperville, ILCOUNTY DuPageRBA 28,112 SFPARKING SPACES 81YEAR BUILT 2004NUMBER OF FLOORS Three (3)PARCEL # 07-33-400-048ZONING C, CommercialPARCEL SIZE 80586TAXES $97,088 (2016)
CONSTRUCTION Masonry
ROOF Gabled Roof with Shingles
PROPERTY DESCRIPTIONThis well-designed and constructed office building offers 12 corner offices on each of its three floors. The quality of the building is obvious from the moment you set sight on premises. The combination of contemporary materials and nearby waterscapes provide a sense of richness, warmth and spaciousness. Tasteful design and the highest quality construction are the hallmarks of this fine medical office building. Located in Naperville’s retail corridor, this office facility is highly adaptable to a wide variety of layouts and functions. The building is designed to provide maximum flexibility. The corporate and medical atmosphere and ambiance are further enhanced by extensive landscaping and conveniently located White Eagle and Springbrook golf clubs. 1315 Macom Dr is the choice of suburban Naperville’s medical and professional community.CAPITAL IMPROVEMENTS DESCRIPTION
Item Cost DescriptionLOBBY & COMMON
AREA
Upgraded lobby and common areas with new flooring, lighting, wall covering and furniture
GRAB ‘N GO $40,000 24/7 grab ‘n go food market off the lobby
RESTROOMSTotal upgrade to all of the building restrooms, with all new finishes
SITEWORK $15,000 External walkway improvements
TOTAL
1 3 1 5 M A C O M D R I V E

LOCATION 1315 Macom Dr, Naperville, ILCOUNTY DuPageRBA 28,112 SFPARKING SPACES 81YEAR BUILT 2004NUMBER OF FLOORS Three (3)PARCEL # 07-33-400-048ZONING C, CommercialPARCEL SIZE 80586TAXES $97,088 (2016)
CONSTRUCTION Masonry
ROOF Gabled Roof with Shingles
FLOOR PLANS
P R O P E R T Y D E S C R I P T I O N | 13

AERIAL PHOTOS1 3 1 5 M A C O M D R I V E
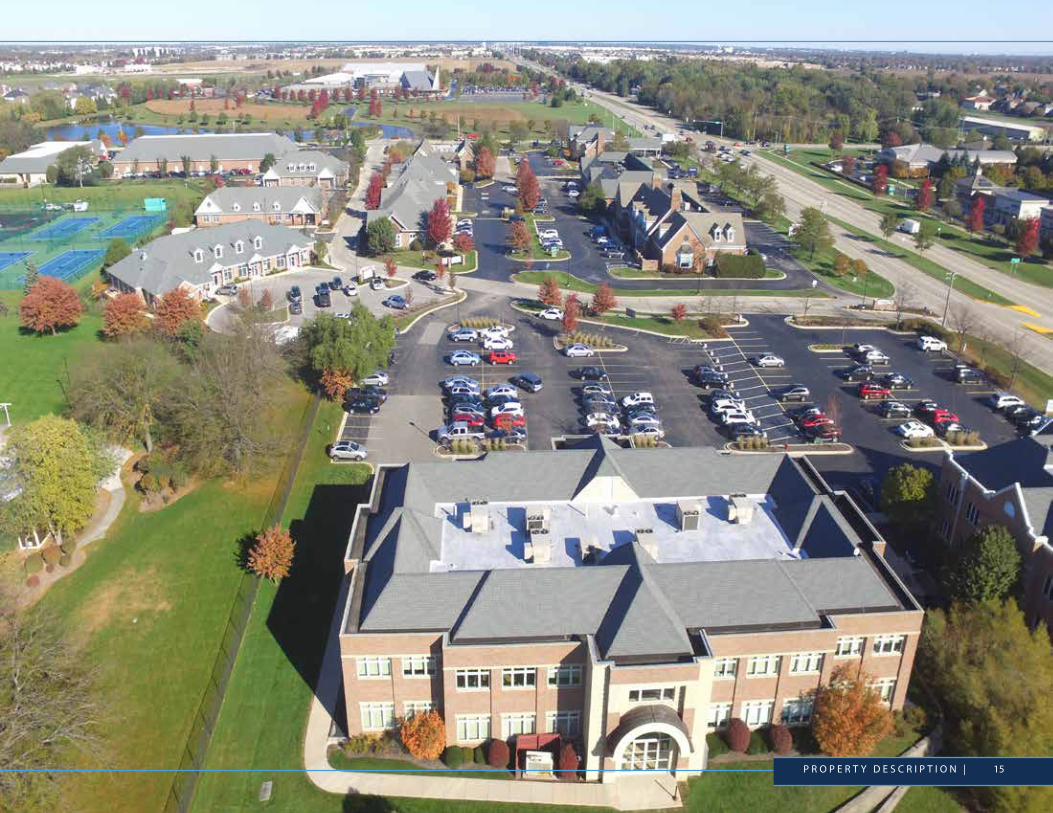
AERIAL PHOTOS AERIAL PHOTOS
P R O P E R T Y D E S C R I P T I O N | 15

INTERIOR PHOTOS1 3 1 5 M A C O M D R I V E
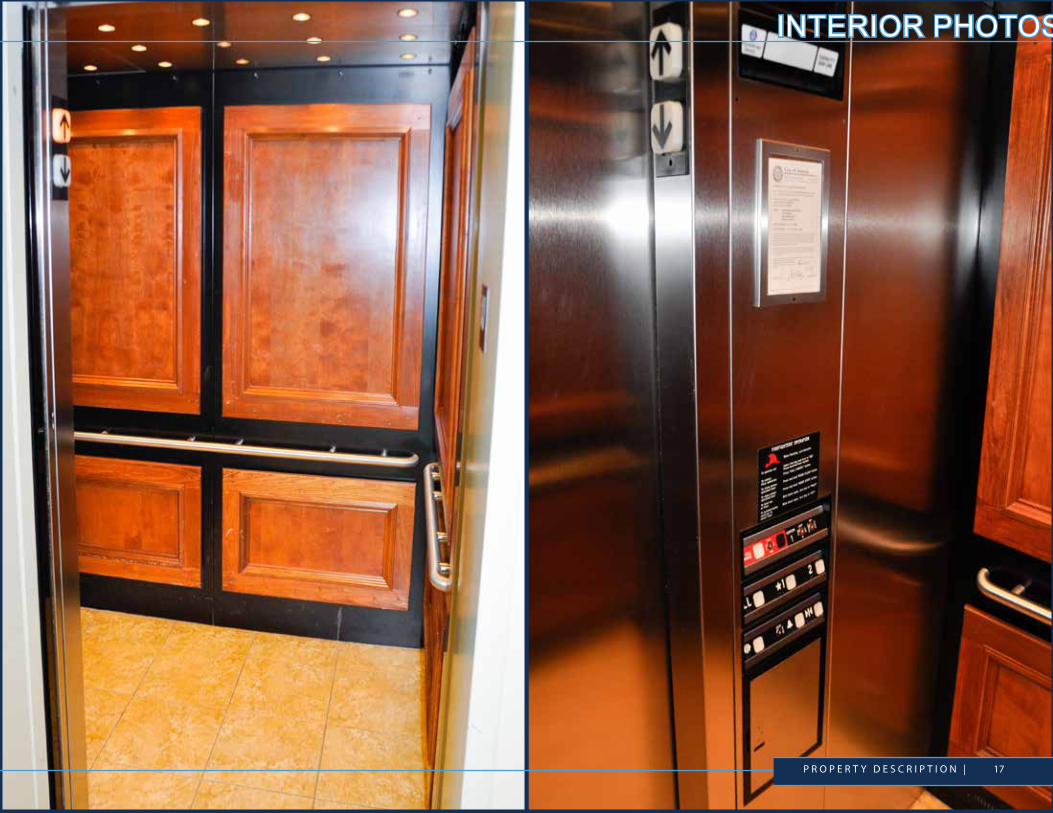
INTERIOR PHOTOS INTERIOR PHOTOS
P R O P E R T Y D E S C R I P T I O N | 17


F I N A N C I A L A N A L Y S I S
This information has been secured from sources we believe to be reliable, but we make no representations or warranties, express or implied, as to the accuracy of the information. References to square footage or age are approximate. Buyer must verify the information and bears all risk for any inaccuracies. Institutional Property Advisors, IPA, and Marcus & Millichap are service marks of Marcus & Millichap Real Estate Investment Services, Inc. © 2018 Marcus & Millichap. All rights reserved. ACT ID Z0300358
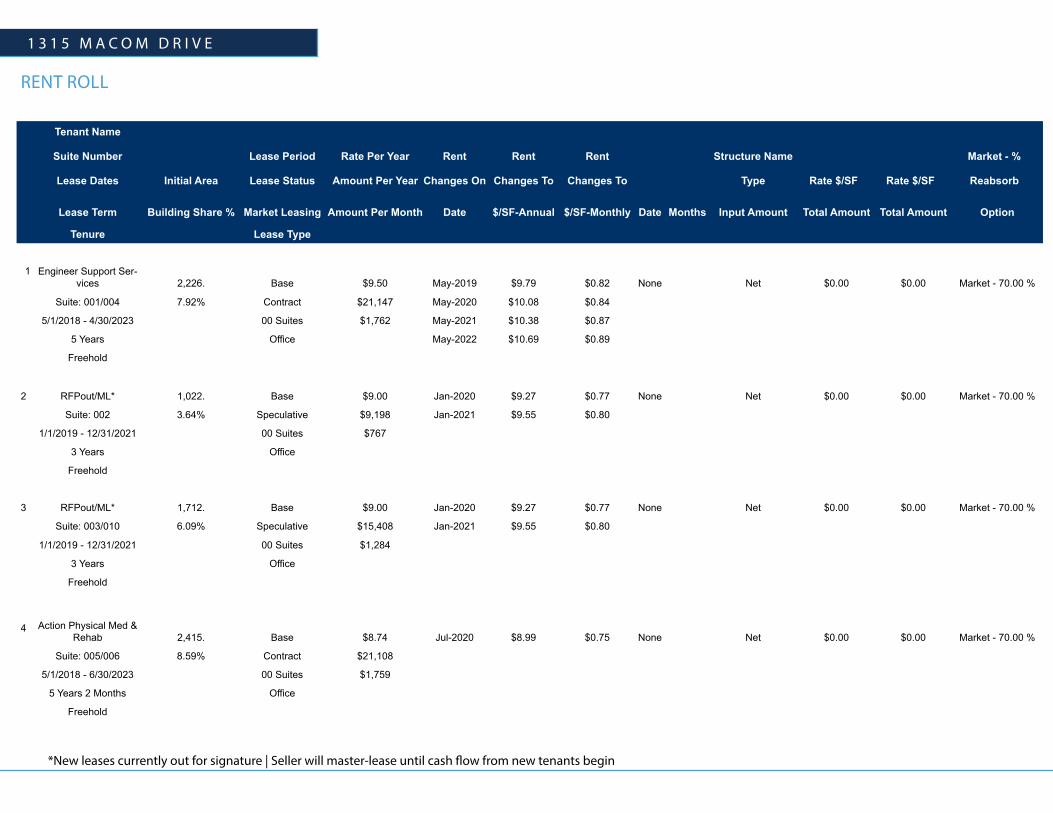
RENT ROLL
Tenant Name
Suite Number Lease Period Rate Per Year Rent Rent Rent Structure Name Market - %
Lease Dates Initial Area Lease Status Amount Per Year Changes On Changes To Changes To Type Rate $/SF Rate $/SF Reabsorb
Lease Term Building Share % Market Leasing Amount Per Month Date $/SF-Annual $/SF-Monthly Date Months Input Amount Total Amount Total Amount Option
Tenure Lease Type
1 Engineer Support Ser-vices 2,226. Base $9.50 May-2019 $9.79 $0.82 None Net $0.00 $0.00 Market - 70.00 %
Suite: 001/004 7.92% Contract $21,147 May-2020 $10.08 $0.84
5/1/2018 - 4/30/2023 00 Suites $1,762 May-2021 $10.38 $0.87
5 Years Office May-2022 $10.69 $0.89
Freehold
2 RFPout/ML* 1,022. Base $9.00 Jan-2020 $9.27 $0.77 None Net $0.00 $0.00 Market - 70.00 %
Suite: 002 3.64% Speculative $9,198 Jan-2021 $9.55 $0.80
1/1/2019 - 12/31/2021 00 Suites $767
3 Years Office
Freehold
3 RFPout/ML* 1,712. Base $9.00 Jan-2020 $9.27 $0.77 None Net $0.00 $0.00 Market - 70.00 %
Suite: 003/010 6.09% Speculative $15,408 Jan-2021 $9.55 $0.80
1/1/2019 - 12/31/2021 00 Suites $1,284
3 Years Office
Freehold
4 Action Physical Med & Rehab 2,415. Base $8.74 Jul-2020 $8.99 $0.75 None Net $0.00 $0.00 Market - 70.00 %
Suite: 005/006 8.59% Contract $21,108
5/1/2018 - 6/30/2023 00 Suites $1,759
5 Years 2 Months Office
Freehold
*New leases currently out for signature | Seller will master-lease until cash flow from new tenants begin
1 3 1 5 M A C O M D R I V E

RENT ROLL
Tenant Name
Suite Number Lease Period Rate Per Year Rent Rent Rent Structure Name Market - %
Lease Dates Initial Area Lease Status Amount Per Year Changes On Changes To Changes To Type Rate $/SF Rate $/SF Reabsorb
Lease Term Building Share % Market Leasing Amount Per Month Date $/SF-Annual $/SF-Monthly Date Months Input Amount Total Amount Total Amount Option
Tenure Lease Type
5 Academic Endocrine 1,320. Base $10.13 Mar-2019 $10.13 $0.84 None Net $0.00 $0.00 Market - 70.00 %
Suite: 007 4.70% Contract $13,371 Mar-2022 $10.50 $0.88
10/1/2013 - 2/29/2024 00 Suites $1,114
10 Years 5 Months Office
Freehold
6 Sovereign Rehabilitation 3,660. Base $16.39 Jan-2019 $20.13 $1.68 None Net $0.00 $0.00 Market - 70.00 %
Suite: 101/102 13.02% Contract $60,000
10/1/2014 - 9/30/2021 100&200 Suites $5,000
7 Years Office
Freehold
7 Illinois Wellness 1,408. Base $17.60 Oct-2018 $18.04 $1.50 None Net $0.00 $0.00 Market - 70.00 %
Suite: 104 5.01% Contract $24,781 Oct-2019 $18.95 $1.58
7/15/2017 - 9/30/2023 100&200 Suites $2,065 Oct-2020 $19.34 $1.61
6 Years 2 Months 17 Days Office Oct-2021 $19.42 $1.62
Freehold Oct-2022 $19.91 $1.66
8 Achieve Orthopedic 2,393. Base $17.97 Oct-2018 $18.51 $1.54 None Net $0.00 $0.00 Market - 70.00 %
Suite: 105/108 8.51% Contract $43,002 Oct-2019 $19.07 $1.59
10/1/2012 - 2/28/2023 100&200 Suites $3,584 Oct-2020 $19.64 $1.64
10 Years 5 Months Office Oct-2021 $20.23 $1.69
Freehold Oct-2022 $20.84 $1.74
F I N A N C I A L A N A L Y S I S | 21

RENT ROLL
Tenant Name
Suite Number Lease Period Rate Per Year Rent Rent Rent Structure Name Market - %
Lease Dates Initial Area Lease Status Amount Per Year Changes On Changes To Changes To Type Rate $/SF Rate $/SF Reabsorb
Lease Term Building Share % Market Leasing Amount Per Month Date $/SF-Annual $/SF-Monthly Date Months Input Amount Total Amount Total Amount Option
Tenure Lease Type
9 Ian Elliott 2,399. Base $24.81 Jan-2019 $25.00 $2.08 None Net $0.00 $0.00 Market - 70.00 %
Suite: 106/107 8.53% Contract $59,527 Jan-2021 $25.50 $2.13
1/1/2014 - 12/31/2023 100&200 Suites $4,961
10 Years Office
Freehold
10 White Eagle Family Dentistry 2,307. Base $28.12 Jun-2019 $28.62 $2.39 None None $0.00 $0.00 Market - 70.00 %
Suite: 201/204 8.21% Contract $64,873 Jun-2021 $29.12 $2.43 N/A
6/1/2013 - 5/31/2025 100&200 Suites $5,406 Jun-2023 $29.62 $2.47
12 Years Office
Freehold
11 IT Lighthouse 982. Base $18.03 Dec-2018 $18.57 $1.55 None Net $0.00 $0.00 Market - 70.00 %
Suite: 202 3.49% Contract $17,706 Dec-2019 $19.13 $1.59
12/1/2015 - 4/30/2021 100&200 Suites $1,475 Dec-2020 $19.70 $1.64
5 Years 5 Months Office
Freehold
12 Associated Allergists 1,664. Base $19.31 Jun-2019 $19.89 $1.66 None Net $0.00 $0.00 Market - 70.00 %
Suite: 203 5.92% Contract $32,136
6/1/2017 - 5/31/2020 100&200 Suites $2,678
3 Years Office
Freehold
1 3 1 5 M A C O M D R I V E

Tenant Name
Suite Number Lease Period Rate Per Year Rent Rent Rent Structure Name Market - %
Lease Dates Initial Area Lease Status Amount Per Year Changes On Changes To Changes To Type Rate $/SF Rate $/SF Reabsorb
Lease Term Building Share % Market Leasing Amount Per Month Date $/SF-Annual $/SF-Monthly Date Months Input Amount Total Amount Total Amount Option
Tenure Lease Type
9 Ian Elliott 2,399. Base $24.81 Jan-2019 $25.00 $2.08 None Net $0.00 $0.00 Market - 70.00 %
Suite: 106/107 8.53% Contract $59,527 Jan-2021 $25.50 $2.13
1/1/2014 - 12/31/2023 100&200 Suites $4,961
10 Years Office
Freehold
10 White Eagle Family Dentistry 2,307. Base $28.12 Jun-2019 $28.62 $2.39 None None $0.00 $0.00 Market - 70.00 %
Suite: 201/204 8.21% Contract $64,873 Jun-2021 $29.12 $2.43 N/A
6/1/2013 - 5/31/2025 100&200 Suites $5,406 Jun-2023 $29.62 $2.47
12 Years Office
Freehold
11 IT Lighthouse 982. Base $18.03 Dec-2018 $18.57 $1.55 None Net $0.00 $0.00 Market - 70.00 %
Suite: 202 3.49% Contract $17,706 Dec-2019 $19.13 $1.59
12/1/2015 - 4/30/2021 100&200 Suites $1,475 Dec-2020 $19.70 $1.64
5 Years 5 Months Office
Freehold
12 Associated Allergists 1,664. Base $19.31 Jun-2019 $19.89 $1.66 None Net $0.00 $0.00 Market - 70.00 %
Suite: 203 5.92% Contract $32,136
6/1/2017 - 5/31/2020 100&200 Suites $2,678
3 Years Office
Freehold
RENT ROLL
Tenant Name
Suite Number Lease Period Rate Per Year Rent Rent Rent Structure Name Market - %
Lease Dates Initial Area Lease Status Amount Per Year Changes On Changes To Changes To Type Rate $/SF Rate $/SF Reabsorb
Lease Term Building Share % Market Leasing Amount Per Month Date $/SF-Annual $/SF-Monthly Date Months Input Amount Total Amount Total Amount Option
Tenure Lease Type
13 Illinois Wellness 3,259. Base $17.60 Oct-2018 $18.04 $1.50 None Net $0.00 $0.00 Market - 70.00 %
Suite: 205 11.59% Contract $57,358 Oct-2019 $18.49 $1.54
10/1/2015 - 9/30/2023 100&200 Suites $4,780 Oct-2020 $18.95 $1.58
8 Years Office Oct-2021 $19.42 $1.62
Freehold Oct-2022 $19.91 $1.66
14 Edward Jones 1,345. Base $19.31 Jan-2019 $19.89 $1.66 None Net $0.00 $0.00 Market - 70.00 %
Suite: 206 4.78% Contract $25,972 Jan-2020 $20.49 $1.71
1/1/2017 - 12/31/2024 100&200 Suites $2,164 Jan-2021 $21.10 $1.76
8 Years Office Jan-2022 $21.73 $1.81
Freehold Jan-2023 $22.38 $1.87
Jan-2024 $23.05 $1.92
F I N A N C I A L A N A L Y S I S | 23

Analysis Period An Ten(10) year cash flow projection has been prepared, on a fiscal year basis, beginning on January 1, 2019 and ending on December 31, 2028
Building Size 28,112 Square Feet
Market Rental Rate Market Rent is $20.00/SF/Net for the 100 & 200 Suites and $9.00/SF/Net for the 00 Suites
Downtime 6 months of downtime has been used
Base Rent Escalations 3% Annual Increases for new leases
Inflation Rate 3% inflation has been used for all market assumptions.
Lease Terms A 5 Year term has been assumed for new leases. 3 months has been added to the 100 & 200 suites to account for free rent months.
Expense Reimbursements A Net lease recovery structure has been used
Leasing Commissions A Leasing Commission structure of $1.50 per square foot per lease year has been used to model new leases. Renewals have been modeled at half the new rate.
Tenant Improvements
Tenant Improvements of $10.00 per square foot for new leases and $2.50 per square foot for renewals were used when modeling 100 & 200 level suites. Tenant Improvements of $5.00 per square foot for new leases were modeled for the 00 suites. No tenant improvements were modeled for renewals at the 00 suite level.
Capital Reserves Capital Reserves are estimated at $0.10 per square foot
Vacancy and Credit Loss 2.5% General Vacancy and Credit Loss amount has been used
l
ASSUMPTIONS
1 3 1 5 M A C O M D R I V E
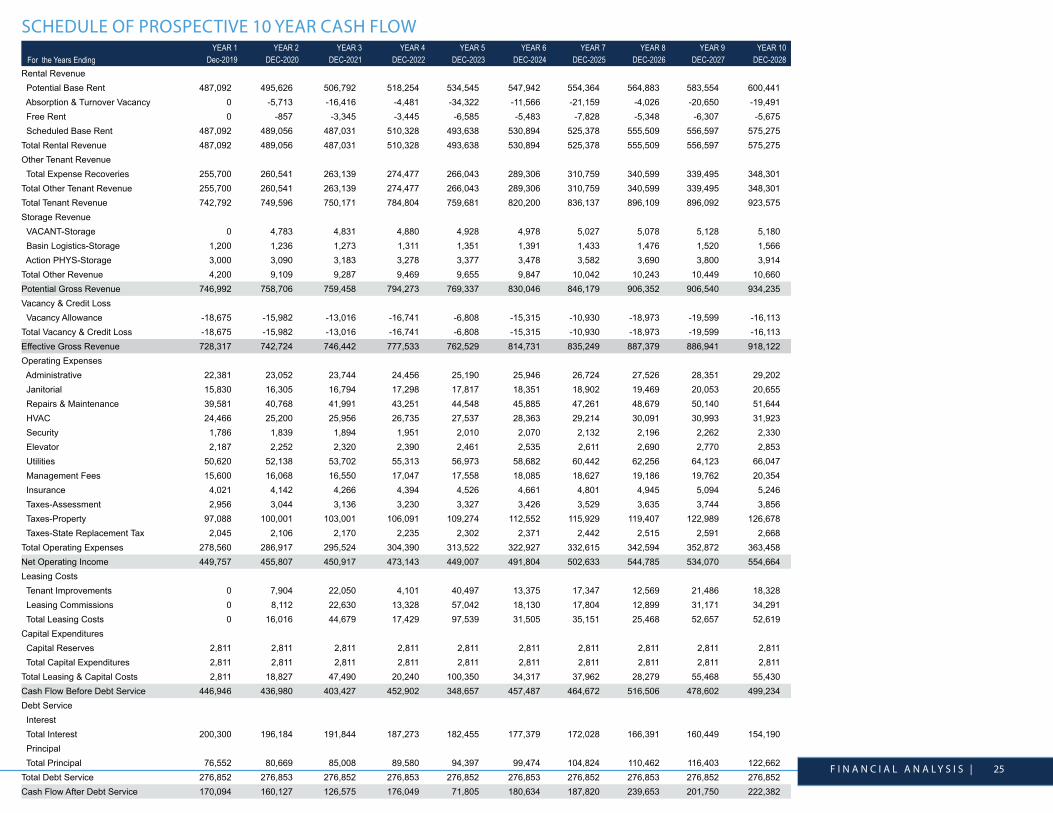
SCHEDULE OF PROSPECTIVE 10 YEAR CASH FLOW YEAR 1 YEAR 2 YEAR 3 YEAR 4 YEAR 5 YEAR 6 YEAR 7 YEAR 8 YEAR 9 YEAR 10
For the Years Ending Dec-2019 DEC-2020 DEC-2021 DEC-2022 DEC-2023 DEC-2024 DEC-2025 DEC-2026 DEC-2027 DEC-2028Rental Revenue Potential Base Rent 487,092 495,626 506,792 518,254 534,545 547,942 554,364 564,883 583,554 600,441 Absorption & Turnover Vacancy 0 -5,713 -16,416 -4,481 -34,322 -11,566 -21,159 -4,026 -20,650 -19,491 Free Rent 0 -857 -3,345 -3,445 -6,585 -5,483 -7,828 -5,348 -6,307 -5,675 Scheduled Base Rent 487,092 489,056 487,031 510,328 493,638 530,894 525,378 555,509 556,597 575,275Total Rental Revenue 487,092 489,056 487,031 510,328 493,638 530,894 525,378 555,509 556,597 575,275Other Tenant Revenue Total Expense Recoveries 255,700 260,541 263,139 274,477 266,043 289,306 310,759 340,599 339,495 348,301Total Other Tenant Revenue 255,700 260,541 263,139 274,477 266,043 289,306 310,759 340,599 339,495 348,301Total Tenant Revenue 742,792 749,596 750,171 784,804 759,681 820,200 836,137 896,109 896,092 923,575Storage Revenue VACANT-Storage 0 4,783 4,831 4,880 4,928 4,978 5,027 5,078 5,128 5,180 Basin Logistics-Storage 1,200 1,236 1,273 1,311 1,351 1,391 1,433 1,476 1,520 1,566 Action PHYS-Storage 3,000 3,090 3,183 3,278 3,377 3,478 3,582 3,690 3,800 3,914Total Other Revenue 4,200 9,109 9,287 9,469 9,655 9,847 10,042 10,243 10,449 10,660Potential Gross Revenue 746,992 758,706 759,458 794,273 769,337 830,046 846,179 906,352 906,540 934,235Vacancy & Credit Loss Vacancy Allowance -18,675 -15,982 -13,016 -16,741 -6,808 -15,315 -10,930 -18,973 -19,599 -16,113Total Vacancy & Credit Loss -18,675 -15,982 -13,016 -16,741 -6,808 -15,315 -10,930 -18,973 -19,599 -16,113Effective Gross Revenue 728,317 742,724 746,442 777,533 762,529 814,731 835,249 887,379 886,941 918,122Operating Expenses Administrative 22,381 23,052 23,744 24,456 25,190 25,946 26,724 27,526 28,351 29,202 Janitorial 15,830 16,305 16,794 17,298 17,817 18,351 18,902 19,469 20,053 20,655 Repairs & Maintenance 39,581 40,768 41,991 43,251 44,548 45,885 47,261 48,679 50,140 51,644 HVAC 24,466 25,200 25,956 26,735 27,537 28,363 29,214 30,091 30,993 31,923 Security 1,786 1,839 1,894 1,951 2,010 2,070 2,132 2,196 2,262 2,330 Elevator 2,187 2,252 2,320 2,390 2,461 2,535 2,611 2,690 2,770 2,853 Utilities 50,620 52,138 53,702 55,313 56,973 58,682 60,442 62,256 64,123 66,047 Management Fees 15,600 16,068 16,550 17,047 17,558 18,085 18,627 19,186 19,762 20,354 Insurance 4,021 4,142 4,266 4,394 4,526 4,661 4,801 4,945 5,094 5,246 Taxes-Assessment 2,956 3,044 3,136 3,230 3,327 3,426 3,529 3,635 3,744 3,856 Taxes-Property 97,088 100,001 103,001 106,091 109,274 112,552 115,929 119,407 122,989 126,678 Taxes-State Replacement Tax 2,045 2,106 2,170 2,235 2,302 2,371 2,442 2,515 2,591 2,668Total Operating Expenses 278,560 286,917 295,524 304,390 313,522 322,927 332,615 342,594 352,872 363,458Net Operating Income 449,757 455,807 450,917 473,143 449,007 491,804 502,633 544,785 534,070 554,664Leasing Costs Tenant Improvements 0 7,904 22,050 4,101 40,497 13,375 17,347 12,569 21,486 18,328 Leasing Commissions 0 8,112 22,630 13,328 57,042 18,130 17,804 12,899 31,171 34,291 Total Leasing Costs 0 16,016 44,679 17,429 97,539 31,505 35,151 25,468 52,657 52,619Capital Expenditures Capital Reserves 2,811 2,811 2,811 2,811 2,811 2,811 2,811 2,811 2,811 2,811 Total Capital Expenditures 2,811 2,811 2,811 2,811 2,811 2,811 2,811 2,811 2,811 2,811Total Leasing & Capital Costs 2,811 18,827 47,490 20,240 100,350 34,317 37,962 28,279 55,468 55,430Cash Flow Before Debt Service 446,946 436,980 403,427 452,902 348,657 457,487 464,672 516,506 478,602 499,234Debt Service Interest Total Interest 200,300 196,184 191,844 187,273 182,455 177,379 172,028 166,391 160,449 154,190 Principal Total Principal 76,552 80,669 85,008 89,580 94,397 99,474 104,824 110,462 116,403 122,662Total Debt Service 276,852 276,853 276,852 276,853 276,852 276,853 276,852 276,853 276,852 276,852Cash Flow After Debt Service 170,094 160,127 126,575 176,049 71,805 180,634 187,820 239,653 201,750 222,382
F I N A N C I A L A N A L Y S I S | 25
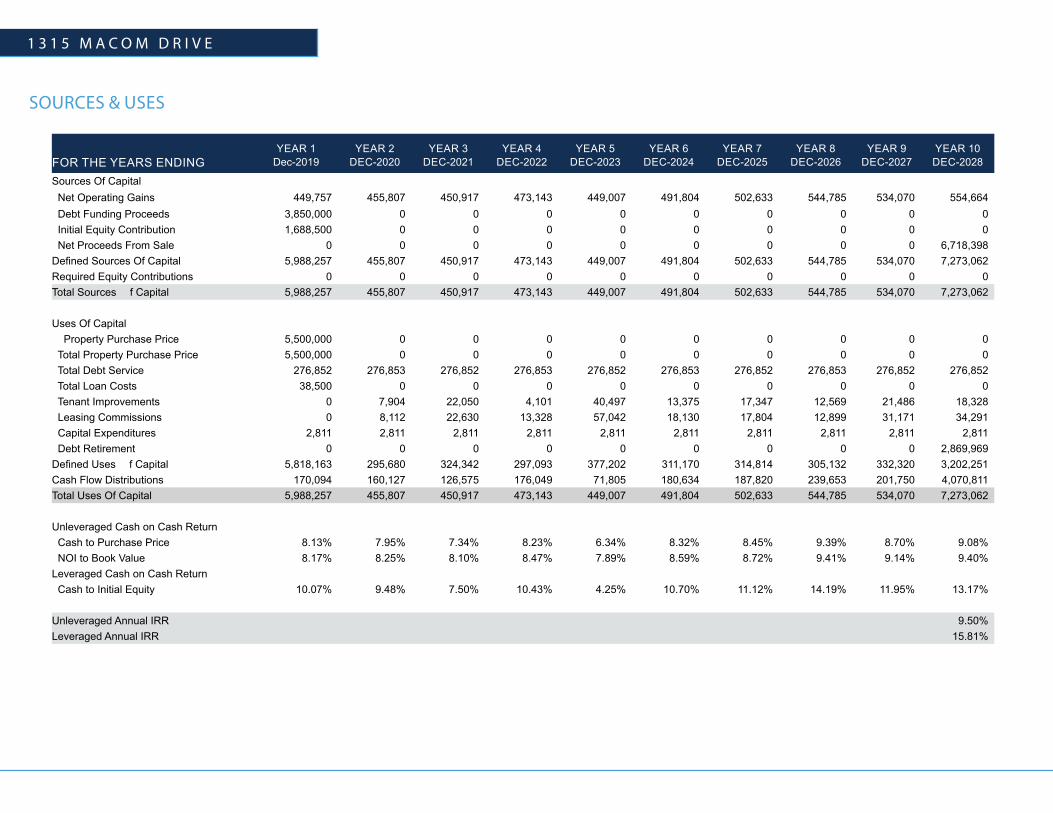
SOURCES & USES
YEAR 1 YEAR 2 YEAR 3 YEAR 4 YEAR 5 YEAR 6 YEAR 7 YEAR 8 YEAR 9 YEAR 10FOR THE YEARS ENDING Dec-2019 DEC-2020 DEC-2021 DEC-2022 DEC-2023 DEC-2024 DEC-2025 DEC-2026 DEC-2027 DEC-2028
Sources Of Capital Net Operating Gains 449,757 455,807 450,917 473,143 449,007 491,804 502,633 544,785 534,070 554,664 Debt Funding Proceeds 3,850,000 0 0 0 0 0 0 0 0 0 Initial Equity Contribution 1,688,500 0 0 0 0 0 0 0 0 0 Net Proceeds From Sale 0 0 0 0 0 0 0 0 0 6,718,398Defined Sources Of Capital 5,988,257 455,807 450,917 473,143 449,007 491,804 502,633 544,785 534,070 7,273,062Required Equity Contributions 0 0 0 0 0 0 0 0 0 0Total Sources Of Capital 5,988,257 455,807 450,917 473,143 449,007 491,804 502,633 544,785 534,070 7,273,062
Uses Of Capital Property Purchase Price 5,500,000 0 0 0 0 0 0 0 0 0 Total Property Purchase Price 5,500,000 0 0 0 0 0 0 0 0 0 Total Debt Service 276,852 276,853 276,852 276,853 276,852 276,853 276,852 276,853 276,852 276,852 Total Loan Costs 38,500 0 0 0 0 0 0 0 0 0 Tenant Improvements 0 7,904 22,050 4,101 40,497 13,375 17,347 12,569 21,486 18,328 Leasing Commissions 0 8,112 22,630 13,328 57,042 18,130 17,804 12,899 31,171 34,291 Capital Expenditures 2,811 2,811 2,811 2,811 2,811 2,811 2,811 2,811 2,811 2,811 Debt Retirement 0 0 0 0 0 0 0 0 0 2,869,969Defined Uses Of Capital 5,818,163 295,680 324,342 297,093 377,202 311,170 314,814 305,132 332,320 3,202,251Cash Flow Distributions 170,094 160,127 126,575 176,049 71,805 180,634 187,820 239,653 201,750 4,070,811Total Uses Of Capital 5,988,257 455,807 450,917 473,143 449,007 491,804 502,633 544,785 534,070 7,273,062
Unleveraged Cash on Cash Return Cash to Purchase Price 8.13% 7.95% 7.34% 8.23% 6.34% 8.32% 8.45% 9.39% 8.70% 9.08% NOI to Book Value 8.17% 8.25% 8.10% 8.47% 7.89% 8.59% 8.72% 9.41% 9.14% 9.40%Leveraged Cash on Cash Return Cash to Initial Equity 10.07% 9.48% 7.50% 10.43% 4.25% 10.70% 11.12% 14.19% 11.95% 13.17%
Unleveraged Annual IRR 9.50%Leveraged Annual IRR 15.81%
1 3 1 5 M A C O M D R I V E

LOAN SUMMARY
Loan Size 70% LTV has been used in the analysis
Amort 25 years
Term 10 Year
Interest Rate 5.25% Fixed Interest Rate Assumption.
Loan Cost A 1% loan fee has been used
l
LOAN AMORITIZATION
DATE 2019 2020 2021 2022 2023 2024 2025 2026 2027 2028 FINAL TOTALSBeginning Balance 0 3,773,448 3,692,779 3,607,771 3,518,191 3,423,794 3,324,320 3,219,496 3,109,034 2,992,631 0Proceeds 3,850,000 0 0 0 0 0 0 0 0 0 3,850,000Loan Costs 38,500 0 0 0 0 0 0 0 0 0 38,500Interest Rate 5.25% 5.25% 5.25% 5.25% 5.25% 5.25% 5.25% 5.25% 5.25% 5.25% 5.25%Amortized Payments 276,852 276,853 276,852 276,853 276,852 276,853 276,852 276,853 276,852 276,852 2,768,524Interest Payments 200,300 196,184 191,844 187,273 182,455 177,379 172,028 166,391 160,449 154,190 1,788,493Principal Payments 76,552 80,669 85,008 89,580 94,397 99,474 104,824 110,462 116,403 122,662 980,031Balloon Payment 0 0 0 0 0 0 0 0 0 2,869,969 2,869,969Ending Balance 3,773,448 3,692,779 3,607,771 3,518,191 3,423,794 3,324,320 3,219,496 3,109,034 2,992,631 0 0
F I N A N C I A L A N A L Y S I S | 27
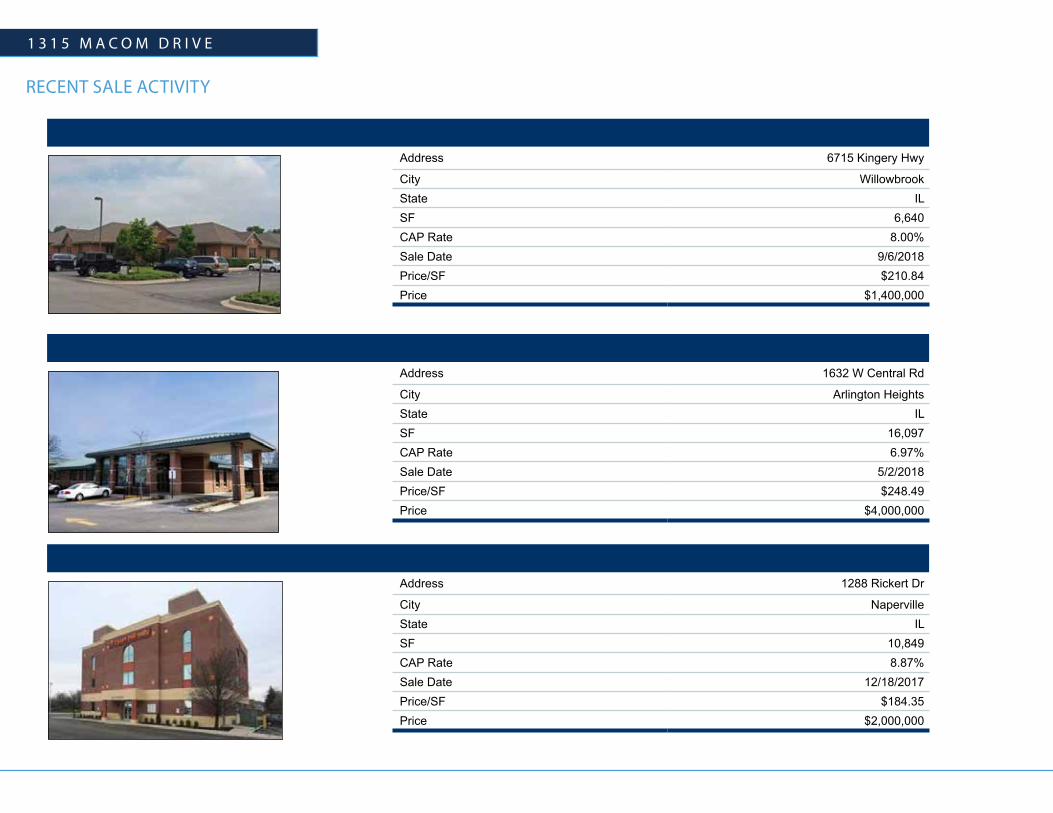
RECENT SALE ACTIVITY
Address 6715 Kingery Hwy
City WillowbrookState ILSF 6,640 CAP Rate 8.00%Sale Date 9/6/2018Price/SF $210.84Price $1,400,000
Address 1632 W Central Rd
City Arlington HeightsState ILSF 16,097 CAP Rate 6.97%Sale Date 5/2/2018Price/SF $248.49Price $4,000,000
Address 1288 Rickert Dr
City NapervilleState ILSF 10,849 CAP Rate 8.87%Sale Date 12/18/2017Price/SF $184.35Price $2,000,000
1 3 1 5 M A C O M D R I V E

Address 16101 S La Grange Rd
City Tinley ParkState ILSF 22,878 CAP Rate N/ASale Date 6/9/2017
Price/SF $218.55Price $5,000,000
Address 10043 Lincoln Hwy
City FrankfortState ILSF 23,005 CAP Rate 5.65%Sale Date 3/21/2017Price/SF $273.85Price $6,300,000
Address 552 Houbolt Rd
City JolietState ILSF 13,774 CAP Rate 8.92%Sale Date 3/15/2017Price/SF $217.80Price $3,000,000
RECENT SALE ACTIVITY
F I N A N C I A L A N A L Y S I S | 29

Address 1980 Three Farms Ave
City NapervilleState ILSF 6,400 CAP Rate N/ASale Date 7/15/2016
Price/SF $197.66Price $1,265,000
Address 10719 160th St
City Orland ParkState ILSF 34,000 CAP Rate N/A
Sale Date 6/2/2016Price/SF $252.94Price $8,600,000
RECENT SALE ACTIVITY
1 3 1 5 M A C O M D R I V E

F I N A N C I A L A N A L Y S I S | 31

RENT COMPARABLES
Transaction Quarter Tenant Name Street Address City Transaction SQFT Starting Rent (USD) (per year) Lease Type Lease Term
2018 - Q3 Acrisure 55 Shuman Boulevard Naperville 17,631 $16.75 NNN 11 years
2018 - Q2 WSP USA 2200 Western Court Lisle 15,724 $16.76 NNN 5 years
2018 - Q2 Dugan & Lopatka 4320 Winfield Road Warrenville 10,895 $16.25 NNN 8 years
2017 - Q4 True North Investments 1100 Warrenville Road Naperville 4,445 $15.25 NNN 7 years,5 months
2017 - Q3 Morgan Stanley & Company 3333 Warrenville Road Lisle 16,378 $20.50 NNN 10 years,10 months
2017 - Q3 MuleSoft 55 Shuman Boulevard Naperville 5,706 $16.75 NNN 5 years
2017 - Q2 Farmers Insurance 4225 Naperville Road Lisle 29,351 $20.00 NNN 6 years,11 months
2017 - Q2 Urgent Care Association of America 28600 Bella Vista Parkway Warrenville 6,276 $18.75 NNN 6 years,4 months
1 3 1 5 M A C O M D R I V E

F I N A N C I A L A N A L Y S I S | 33


M A R K E T O V E R V I E W
This information has been secured from sources we believe to be reliable, but we make no representations or warranties, express or implied, as to the accuracy of the information. References to square footage or age are approximate. Buyer must verify the information and bears all risk for any inaccuracies. Institutional Property Advisors, IPA, and Marcus & Millichap are service marks of Marcus & Millichap Real Estate Investment Services, Inc. © 2018 Marcus & Millichap. All rights reserved. ACT ID Z0300358
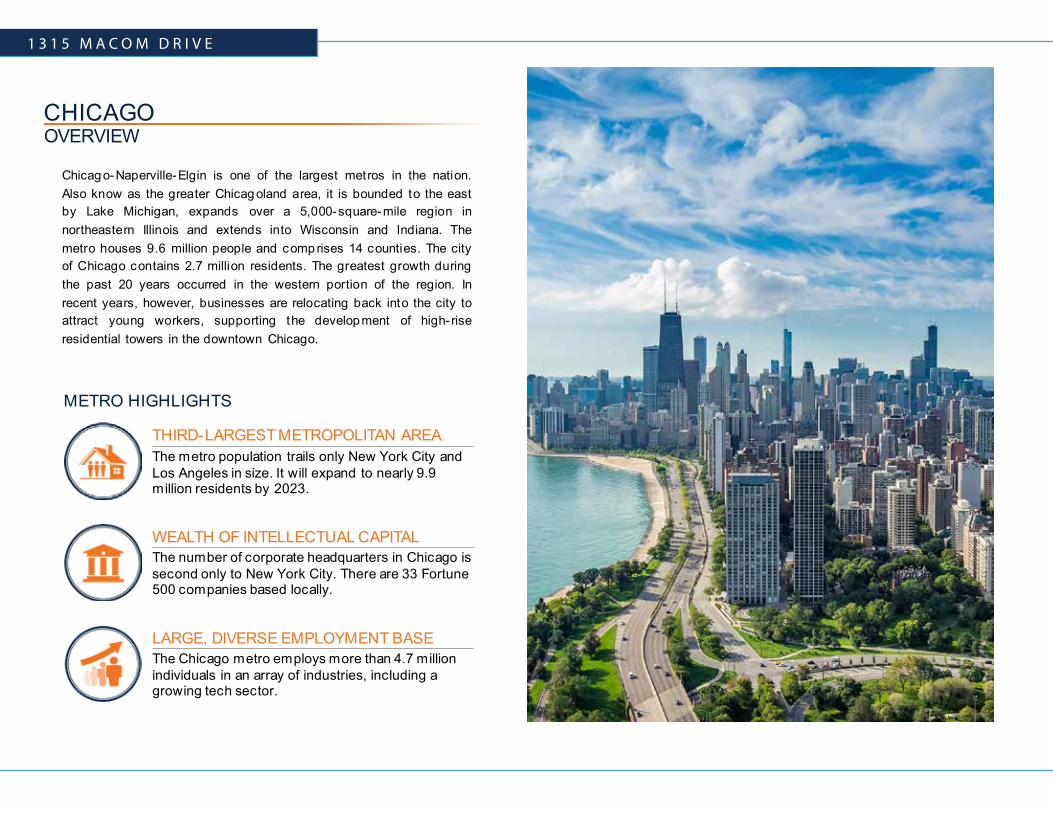
OVERVIEWCHICAGO
Chicago-Naperville-Elgin is one of the largest metros in the nation.Also know as the greater Chicagoland area, it is bounded to the eastby Lake Michigan, expands over a 5,000-square-mile region innortheastern Illinois and extends into Wisconsin and Indiana. Themetro houses 9.6 million people and comprises 14 counties. The cityof Chicago contains 2.7 million residents. The greatest growth duringthe past 20 years occurred in the western portion of the region. Inrecent years, however, businesses are relocating back into the city toattract young workers, supporting the development of high- riseresidential towers in the downtown Chicago.
METRO HIGHLIGHTS
THIRD-LARGEST METROPOLITAN AREAThe metro population trails only New York City and Los Angeles in size. It will expand to nearly 9.9 million residents by 2023.
WEALTH OF INTELLECTUAL CAPITALThe number of corporate headquarters in Chicago is second only to New York City. There are 33 Fortune 500 companies based locally.
LARGE, DIVERSE EMPLOYMENT BASEThe Chicago metro employs more than 4.7 million individuals in an array of industries, including a growing tech sector.
1 3 1 5 M A C O M D R I V E

TRANSPORTATION
The region’s transit network ranks among the largest and most efficient in the world.
The vast network of freeways, centralized location, largest rail- truck intermodal facility in the U.S., and the Port of Chicago contribute to the metro’s position as a major distribution and logistics hub.
Chicago is the nation’s premier freight rail hub, with four carriers, BNSF, Union Pacific, CSX, and Norfolk Southern, that service the region.
Amtrak routes originate from Union Station, while the Metra commuter rail and the Chicago L provide passenger service throughout the metro area and beyond.
International airports include O’Hare, Midway and Gary/Chicago. Seven smaller airports also provide air service for the region.
MORE THAN OF ILLINOIS RESIDENTS LIVE IN THE SUBURBS OF CHICAGO, MANY OF WHOM COMMUTE INTO THE CITY FOR WORK40%
16.3Million TEU’s
MOVED THROUGH METROIN 2016
3CHICAGO HAS
INTERNATIONALAIRPORTS
7FOR FREIGHT, PASSENGER
AND COMMUTER
RAIL LINES
M A R K E T O V E R V I E W | 37

ECONOMY The metro has one of the biggest economies in the nation
and is buoyed by its distribution, finance, manufacturing operations and growing high- tech sectors.
Fortune 500 companies headquartered in the metro include Boeing, Walgreens, Allstate and McDonald’s.
The area is a major global tourist and convention destination. Last year, a record 55.2 million people visited the metro, supporting 146,500 jobs.
Large tech firms such as Amazon, Groupon and Google attract startup companies.
The workforce is considered one of the most diverse and well trained among major U.S. metros.
MAJOR AREA EMPLOYERS
Amazon.com, Inc.
Advocate Healthcare
Walmart
Northwestern University
United Continental Holdings Inc.
Allstate Corp.
Walgreens Boots Alliance, Inc.
Abbott Labs
JPMorgan Chase
AT&T
SHARE OF 2017 TOTAL EMPLOYMENT
MANUFACTURING GOVERNMENT
HEALTH SERVICESEDUCATION AND
+
LEISURE AND HOSPITALITY FINANCIAL ACTIVITIES
CONSTRUCTION
PROFESSIONAL ANDBUSINESS SERVICES
OTHER SERVICES AND UTILITIES
TRADE, TRANSPORTATION INFORMATION
* Forecast
9% 18% 7%12% 10%
4%20% 2%4% 15%
1 3 1 5 M A C O M D R I V E

Chicago is the third most populous metro in the U.S. and is expected to grow by approximately 270,000 people during the next five years.
Younger professionals moving to the area for employment provide a skilled workforce and contribute to the median age of 37 years, below that of the nation.
World-class education institutions including Northwestern University and the University of Chicago help provide a skilled labor pool. Nearly 35 percent of residents age 25 and older hold a bachelor’s degree and of these, 13 percent have also earned a graduate or professional degree, which is well above the national level.
Local homeownership of 65 percent is slightly above the national rate of 64 percent.
QUICK FACTS
* Forecast
DEMOGRAPHICS
372017
MEDIAN AGE:
U.S. Median:37.8
$65,400 2017 MEDIAN
HOUSEHOLD INCOME:
U.S. Median:$56,300
3.5M2017
HOUSEHOLDS:
Growth2017-2022*:4.2%
9.6M2017
POPULATION:
Growth2017-2022*:2.8%
M A R K E T O V E R V I E W | 39

Sources: Marcus & Millichap Research Services; BLS; Bureau of Economic Analysis; Experian; Fortune; Moody’s Analytics; U.S. Census Bureau
QUALITY OF LIFE
The Chicago metro has something to offer every one of its residents and visitors,whether it is legendary blues and jazz music, cultural and educational venues,professional sports, dining, entertainment, shopping or recreational amenities.
The Chicago area’s relative affordability is largely due to its lower housing costs. Themedian home price is significantly less than in other cities of its size and is below thatof many smaller cities, including Seattle and Denver.
Cultural activities and venues underpin the metro’s cosmopolitan lifestyle. The regionis home to various well- known museums, including the world-class Field Museum,Shedd Aquarium, Art Institute of Chicago and Adler Planetarium. The theater scenerivals the world’s best, and troupes, dance companies, symphony orchestras andmusic venues abound.
29 MILESOF SHORELINE
$248,800MEDIAN HOME PRICE VARIOUS MUSUEMS
70
ARTS & ENTERTAINMENT
1 3 1 5 M A C O M D R I V E

M A R K E T O V E R V I E W | 41


EXCLUSIVELY LISTED BY:
Kenneth J. Szady, SIOR, CCIMNational Director(312) [email protected]: IL 471.016178
Krysti C. GalvinFirst Vice President | Director(312) [email protected]: IL 475.168469
John Abuja, CCIM, SIOR, NAIOPSenior Director(312) [email protected]: IL 471.007675
RJ HayesAssociate(312) [email protected]: IL 475.178041
Tyler TuraskyAssociate(312) [email protected]: IL 475.182833
Ryan MenkeAssociate(314) [email protected]: MO 2014004966
Jack GriffithAssociate(312) [email protected]: IL 475.177508
Marcus & MillichapDowntown Chicago333 West Wacker Drive, Suite 200Chicago, IL 60606
Julian ZunarelliAssociate(312) [email protected]: IL 475.167583
SENIOR LEADERSHIP INVESTMENT CONTACTS