Mackenzie, Podsakoff, Jarvis (2005) JAP 90
21
The Problem of Measurement Model Misspecification in Behavioral and Organizational Research and Some Recommended Solutions Scott B. MacKenzie and Philip M. Podsakoff Indiana University Bloomington Cheryl Burke Jarvis Arizona State University The purpose of this study was to review the distinction between formative- and reflective-indicator measurement models, articulate a set of criteria for deciding whether measures are formative or reflective, illustrate some commonly researched constructs that have formative indicators, empirically test the effects of measurement model misspecification using a Monte Carlo simulation, and recommend new scale development procedures for latent constructs with formative indicators. Results of the Monte Carlo simulation indicated that measurement model misspecification can inflate unstandardized structural parameter estimates by as much as 400% or deflate them by as much as 80% and lead to Type I or Type II errors of inference, depending on whether the exogenous or the endogenous latent construct is misspecified. Implications of this research are discussed. A substantial amount of attention has been paid in the past 25 years to the issue of construct validation in the behavioral and organizational sciences. Construct validation is important because, as Schwab (1980) has noted, establishing the substantive validity of a construct before examining its construct validity may lead to the accumulation of knowledge that later must be discarded: “Or- ganizational behavior has suffered because investigators have not accorded construct validity the same deference as substantive validity.... As a consequence, substantive conclusions have been generated that may not be warranted” (p. 34). Thus, it is not surprising that a considerable amount of effort has been devoted to developing procedures to improve the scale de- velopment process (cf. Hinkin, 1995; Nunnally & Bernstein, 1994; Schwab, 1980; Spector, 1992). These efforts are evident in the rise in the reporting of confirmatory factor analyses, convergent and discriminant validity, and internal consistency reliability as part of the scale validation process. However, these procedures are all founded on classical test theory and its assumptions about the relationships between latent constructs and their measures. Classical test theory assumes that the variance in scores on a measure of a latent construct is a function of the true score plus error. Thus, meaning flows from the latent construct to the measures in the sense that each measure is viewed as an imperfect reflection of the underlying latent construct (cf. Bollen, 1989; Nunnally & Bernstein, 1994). For example, one could view a person’s performance on a series of two-digit addi- tion problems as a reflection of his or her “two-digit addition skill.” Or one could view the following four items developed by Wong and Law (2002) as reflections of a person’s ability to assess the emotions of others: “I always know my friends’ emotions from their behavior,” “I am a good observer of others’ emotions,” “I am sensitive to the feelings and emotions of others,” and “I have good understanding of the emotions of people around me.” The key point is that in this type of measurement model, the latent construct is empirically defined in terms of the common variance among the indicators. Although this type of measurement model is conceptually ap- propriate in many instances, Bollen and Lennox (1991) have noted that it does not make sense for all constructs. Indeed, they argued that measures do not always reflect underlying latent constructs but sometimes combine to form them. This is consistent with the views of several other researchers (cf. Blalock, 1964; Bollen, 1984, 1989; Law & Wong, 1999; MacCallum & Browne, 1993) who have argued that for some latent constructs, it makes more sense to view meaning as emanating from the measures to the construct in a definitional sense rather than vice versa. For exam- ple, most researchers today conceptualize job satisfaction as com- prising a variety of distinct facets, including satisfaction with one’s work, pay, coworkers, supervisor, and promotion opportunities. From a conceptual perspective, these distinct facets of satisfaction together determine a person’s overall level of job satisfaction. Thus, in this type of measurement model, the latent construct is empirically defined in terms of the total variance among its indi- cators, and the indicators only capture the entire conceptual do- main as a group. This is a critically important distinction, because many of the scale development procedures recommended in the literature only apply to constructs with reflective measures, and if they are ap- plied to constructs with formative measures, they can undermine construct validity. For example, most texts on scale development processes (cf. Schwab, 1980; Spector, 1992) recommend that items that possess low item-to-total correlations should be dropped from a scale to enhance internal consistency reliability. Although this recommendation is appropriate in the case of reflective indicators, because the items are all sampled from the same content domain, if this recommendation is followed for constructs with formative Scott B. MacKenzie, Department of Marketing, Kelley School of Busi- ness, Indiana University Bloomington; Philip M. Podsakoff, Department of Management, Kelley School of Business, Indiana University Bloomington; Cheryl Burke Jarvis, Department of Marketing, W. P. Carey School of Business, Arizona State University. Correspondence concerning this article should be addressed to Scott B. MacKenzie, Department of Marketing, Kelley School of Business, Indiana University Bloomington, 1309 East 10th Street, Bloomington, IN 47405- 1701. E-mail: [email protected] Journal of Applied Psychology Copyright 2005 by the American Psychological Association 2005, Vol. 90, No. 4, 710 –730 0021-9010/05/$12.00 DOI: 10.1037/0021-9010.90.4.710 710
-
Upload
benitoyanezaraque8358 -
Category
Documents
-
view
21 -
download
1
Transcript of Mackenzie, Podsakoff, Jarvis (2005) JAP 90

The Problem of Measurement Model Misspecification in Behavioral andOrganizational Research and Some Recommended Solutions
Scott B. MacKenzie and Philip M. PodsakoffIndiana University Bloomington
Cheryl Burke JarvisArizona State University
The purpose of this study was to review the distinction between formative- and reflective-indicatormeasurement models, articulate a set of criteria for deciding whether measures are formative or reflective,illustrate some commonly researched constructs that have formative indicators, empirically test theeffects of measurement model misspecification using a Monte Carlo simulation, and recommend newscale development procedures for latent constructs with formative indicators. Results of the Monte Carlosimulation indicated that measurement model misspecification can inflate unstandardized structuralparameter estimates by as much as 400% or deflate them by as much as 80% and lead to Type I or TypeII errors of inference, depending on whether the exogenous or the endogenous latent construct ismisspecified. Implications of this research are discussed.
A substantial amount of attention has been paid in the past 25years to the issue of construct validation in the behavioral andorganizational sciences. Construct validation is important because,as Schwab (1980) has noted, establishing the substantive validityof a construct before examining its construct validity may lead tothe accumulation of knowledge that later must be discarded: “Or-ganizational behavior has suffered because investigators have notaccorded construct validity the same deference as substantivevalidity. . . . As a consequence, substantive conclusions have beengenerated that may not be warranted” (p. 34).
Thus, it is not surprising that a considerable amount of effort hasbeen devoted to developing procedures to improve the scale de-velopment process (cf. Hinkin, 1995; Nunnally & Bernstein, 1994;Schwab, 1980; Spector, 1992). These efforts are evident in the risein the reporting of confirmatory factor analyses, convergent anddiscriminant validity, and internal consistency reliability as part ofthe scale validation process.
However, these procedures are all founded on classical testtheory and its assumptions about the relationships between latentconstructs and their measures. Classical test theory assumes thatthe variance in scores on a measure of a latent construct is afunction of the true score plus error. Thus, meaning flows from thelatent construct to the measures in the sense that each measure isviewed as an imperfect reflection of the underlying latent construct(cf. Bollen, 1989; Nunnally & Bernstein, 1994). For example, onecould view a person’s performance on a series of two-digit addi-tion problems as a reflection of his or her “two-digit additionskill.” Or one could view the following four items developed by
Wong and Law (2002) as reflections of a person’s ability to assessthe emotions of others: “I always know my friends’ emotions fromtheir behavior,” “I am a good observer of others’ emotions,” “I amsensitive to the feelings and emotions of others,” and “I have goodunderstanding of the emotions of people around me.” The keypoint is that in this type of measurement model, the latent constructis empirically defined in terms of the common variance among theindicators.
Although this type of measurement model is conceptually ap-propriate in many instances, Bollen and Lennox (1991) have notedthat it does not make sense for all constructs. Indeed, they arguedthat measures do not always reflect underlying latent constructsbut sometimes combine to form them. This is consistent with theviews of several other researchers (cf. Blalock, 1964; Bollen,1984, 1989; Law & Wong, 1999; MacCallum & Browne, 1993)who have argued that for some latent constructs, it makes moresense to view meaning as emanating from the measures to theconstruct in a definitional sense rather than vice versa. For exam-ple, most researchers today conceptualize job satisfaction as com-prising a variety of distinct facets, including satisfaction with one’swork, pay, coworkers, supervisor, and promotion opportunities.From a conceptual perspective, these distinct facets of satisfactiontogether determine a person’s overall level of job satisfaction.Thus, in this type of measurement model, the latent construct isempirically defined in terms of the total variance among its indi-cators, and the indicators only capture the entire conceptual do-main as a group.
This is a critically important distinction, because many of thescale development procedures recommended in the literature onlyapply to constructs with reflective measures, and if they are ap-plied to constructs with formative measures, they can undermineconstruct validity. For example, most texts on scale developmentprocesses (cf. Schwab, 1980; Spector, 1992) recommend that itemsthat possess low item-to-total correlations should be dropped froma scale to enhance internal consistency reliability. Although thisrecommendation is appropriate in the case of reflective indicators,because the items are all sampled from the same content domain,if this recommendation is followed for constructs with formative
Scott B. MacKenzie, Department of Marketing, Kelley School of Busi-ness, Indiana University Bloomington; Philip M. Podsakoff, Department ofManagement, Kelley School of Business, Indiana University Bloomington;Cheryl Burke Jarvis, Department of Marketing, W. P. Carey School ofBusiness, Arizona State University.
Correspondence concerning this article should be addressed to Scott B.MacKenzie, Department of Marketing, Kelley School of Business, IndianaUniversity Bloomington, 1309 East 10th Street, Bloomington, IN 47405-1701. E-mail: [email protected]
Journal of Applied Psychology Copyright 2005 by the American Psychological Association2005, Vol. 90, No. 4, 710–730 0021-9010/05/$12.00 DOI: 10.1037/0021-9010.90.4.710
710

indicators, it may result in the elimination of precisely those itemsthat are most likely to alter the empirical and conceptual meaningof the construct. Thus, as noted by Bollen and Lennox (1991), theconventional wisdom on item selection and scale evaluation mustbe qualified by consideration of the directional relationship be-tween the indicators and the latent construct.
The distinction between formative and reflective indicators isalso important because failure to properly specify measurementrelations can threaten the statistical conclusion validity of a study’sfindings. For example, Law and Wong (1999) have noted thatmeasurement model misspecification can sometimes bias esti-mates of the structural relationships between constructs and po-tentially undermine statistical conclusion validity (although it didnot do so in their study). If this were found to be generally true, itwould suggest that measurement model misspecification maycause Type I and/or Type II errors of inference in hypothesistesting.
However, as yet it is not known just how much impact suchmisspecification might have or under what conditions it is likely tohave biasing effects. In addition, little guidance exists for research-ers about how to distinguish formative from reflective indicators orabout how to develop, model, and evaluate constructs with forma-tive indicators. Therefore, the purposes of this study were to (a)discuss the distinction between formative- and reflective-indicatormeasurement models, (b) develop criteria for deciding whethermeasures are formative or reflective, (c) illustrate constructs thatshould be modeled as having formative indicators, (d) empiricallytest the effects of measurement model misspecification using aMonte Carlo simulation, and (e) recommend new scale develop-ment and validation procedures for constructs with formativeindicators.
Measurement Model Specification
As noted by Cook and Campbell (1979), Nunnally and Bern-stein (1994), Schwab (1980), and others, researchers use multiplemeasures of their constructs because (a) most constructs cannot bemeasured without error, (b) it is difficult for a single indicator toadequately capture the breadth of a construct’s domain, and (c) itis necessary to unconfound the method of measurement from theconstruct of interest. Thus, the use of multiple measures withmaximally different methods is the best way to ensure that themeasures validly and reliably represent the construct of interest.However, once a researcher has developed multiple measures, heor she faces the problem of how to accurately model the relation-ships between the measures and the construct of interest. Generallyspeaking, two different measurement models have been mentionedin the structural equation modeling literature: the common latentconstruct model with reflective indicators and the composite latentconstruct model with formative indicators.
Common Latent Construct Model With ReflectiveIndicators
Models of this type posit that covariation among measures isexplained by variation in an underlying common latent factor. It isfor this reason that the indicators are referred to as effects indica-tors (Bollen, 1989; Bollen & Lennox, 1991; MacCallum &Browne, 1993) that are reflective of the underlying construct they
represent. This is illustrated in Figure 1A by an ellipse with severalarrows emanating from it to a set of indicators. We refer to thefactors in this model as common latent constructs for two reasons.First, this is the most common type of measurement model foundin the behavioral and organizational literature. Second, the latentconstruct is empirically defined in terms of the common (shared)variance among the items.
As noted by Bollen and Lennox (1991), there are several keyfeatures of this type of measurement model that should be recog-nized. First, the direction of causality flows from the construct tothe measures in the sense that the construct explains the variationin the measures. Second, the indicators in this type of measurementmodel should be highly correlated due to the fact they all reflectthe same underlying construct. As a result, they should exhibithigh levels of internal consistency reliability. Third, “for all prac-tical purposes, equally reliable effect indicators of a unidimen-sional [construct] are interchangeable” (Bollen & Lennox, 1991, p.308). This is true because each of the measures is supposed to besampled from the same conceptual domain and to represent allaspects of it. This implies that dropping one of two equally reliableindicators from the measurement model should not alter the mean-ing of the construct. Fourth, in this type of measurement model,error is associated with the individual measures rather than withthe construct as a whole (though an overall calculation of thereliability of a set of measures can be made on the basis of theindividual measure reliabilities). One advantage of this is that it
Figure 1. Factor specification for the common latent construct modelwith reflective indicators (A) and the composite latent construct modelwith formative indicators (B).
711MEASUREMENT MODEL MISSPECIFICATION

permits researchers to evaluate the differential reliability of theindividual items in their scales. This is helpful when designingscales because it provides a basis for identifying weaker items andsuggests areas where the scale could be improved. Finally, becausethe measures are all imperfect reflections of the underlying con-struct, a summed scale score will not adequately represent aconstruct with reflective indicators, and using a scale score in placeof the latent construct will result in inconsistent structural esti-mates of the relationships between the construct and other latentconstructs.
Composite Latent Construct Model With FormativeIndicators
Less well known than the reflective-indicator measurementmodel is the formative-indicator (or causal-indicator) measure-ment model. As indicated in Figure 1B, this model posits that themeasures jointly influence the composite latent construct, andmeaning emanates from the measures to the construct in the sensethat the full meaning of the composite latent construct is derivedfrom its measures. This has two important implications. First,because the measures are not hypothesized to be caused—ordetermined—by the composite latent variable, the model itselfdoes not assume or require the measures to be correlated (cf.Bollen, 1984; Bollen & Lennox, 1991). Indeed, it would be en-tirely consistent with this measurement model for the indicators tobe completely uncorrelated. Therefore, internal consistency reli-ability is not an appropriate standard for evaluating the adequacyof the measures in formative models. Indeed, as noted by Bollenand Lennox (1991), “causal [formative] indicators are not invali-dated by low internal consistency so to assess validity we need toexamine other variables that are effects of the latent construct” (p.312). This would suggest that to assess the validity of formativeindicators, researchers must pay particular attention to nomologi-cal and/or criterion-related validity.
A second implication is that the consequences of dropping aformative indicator from a measurement model are potentiallymuch more damaging than the consequences of dropping a reflec-tive indicator. Although dropping one of two equally reliablemeasures from a reflective-indicator model does not alter theempirical meaning of a construct, that may not be true for aformative-indicator model. Assuming the measures are not redun-dant (i.e., they tap different facets of the conceptual domain),dropping a measure from a formative-indicator model may omit aunique part of the conceptual domain and change the meaning ofthe variable, because the construct is a composite of all theindicators. This is true because unlike reflective measures thatindividually tap the entire conceptual domain, formative measuresonly capture the entire conceptual domain as a group. This sug-gests that for formative-indicator models, following the standardscale development procedures—that is, dropping the items thatpossess the lowest item-to-total correlations or the lowest factorloadings—may result in the removal of precisely those items thatwould most alter the empirical meaning of the composite latentconstruct. Doing so could make the measure deficient by restrict-ing the domain of the construct (cf. Churchill, 1979; Schwab,1980). Thus, this is another reason why measures of internalconsistency reliability should not be used to evaluate the adequacyof formative-indicator models.
Related to the above discussion, because the composite latentvariable is explained by the measures in a formative-indicatormodel, high intercorrelations between formative indicators canmake it difficult to separate the distinct impact of the individualindicators on the construct. This happens because the indicatorcoefficients are analogous to those obtained from a multiple re-gression of the latent construct on the formative indicators, and thestability of these coefficients is influenced by both multicollinear-ity and sample size (cf. Bollen & Lennox, 1991). This makes itdifficult to identify the unique effect of each indicator on theconstruct. This is not the case in the reflective-indicator model, inwhich the coefficients relating the latent construct to its indicatorsare analogous to simple regression coefficients. Thus, althoughmulticollinearity may be viewed as a virtue for reflective indica-tors, it can be a significant problem for measurement-model pa-rameter estimates when the indicators are formative.
A final feature of the formative-indicator model is that like thereflective-indicator model, it includes an error term. However,unlike the reflective-indicator model, error is represented at theconstruct level rather than at the individual-item level. The errorestimate for this model captures the invalidity of the set of mea-sures—caused by measurement error, interactions among the mea-sures, and/or aspects of the construct domain not represented bythe measures—rather than the amount of error attributable to eachindividual measure. The presence of a construct-level error term isalso a reminder of the fact that a formative-indicator construct ismore than just a shorthand way of referring to an empiricalcombination of measures. It possesses what MacCorquodale andMeehl (1948) termed surplus meaning:
These constructs involve terms which are not wholly reducible toempirical terms; they refer to processes or entities that are not directlyobserved (although they need not be in principle unobservable); themathematical expression of them cannot be formed simply by asuitable grouping of terms in a direct empirical equation; and the truthof the empirical laws involved is a necessary but not sufficientcondition for the truth of these conceptions. (p. 104)
Consequently, as is true for reflective-indicator constructs, aconstruct with several formative indicators cannot be adequatelyrepresented by a summed scale score, and using a scale score torepresent a formative-indicator construct will lead to biased esti-mates of the structural relationships involving the construct. Asnoted by Bollen and Lennox (1991),
if the composite [scale score] is the only variable measured with error,then the coefficient estimated for that variable will tend to be too low.In the more realistic situations of more than one explanatory variablecontaining error, the coefficient estimates can tend to be downwardlyor upwardly “biased.” (p. 310)
This is true even if a weighted sum is used instead of an un-weighted sum. The only time this would not be true is in theunlikely event that all of the coefficients relating the measures tothe construct were equal to 1, and construct-level error was equalto 0.
Criteria for Distinguishing Between Reflective- andFormative-Indicator Models
Given the importance of the differences between formative andreflective measurement models, it is important for researchers to
712 MACKENZIE, PODSAKOFF, AND JARVIS

carefully evaluate the nature of the relationships between theirconstructs and measures. The first question to consider is whetherthe indicators are defining characteristics of the construct or man-ifestations of it. If the measures represent defining characteristicsthat collectively explain the meaning of the construct, a formative-indicator measurement model should be specified. However, if themeasures are manifestations of the construct in the sense that theyare each determined by it, a reflective-indicator model is appro-priate. This judgment can be made by carefully thinking aboutwhether it is more likely that changes in the latent construct wouldproduce changes in the measures than it is that changes in themeasures would produce changes in the latent construct.
A second question is whether the indicators appear to be con-ceptually interchangeable. If the measures are reflective, theyshould share a strong common theme, and each of them shouldcapture the essence of the domain of the construct. Indeed, reflec-tive measures are typically viewed as being sampled from the sameconceptual domain. However, this is not generally true for forma-tive measures (cf. Bollen & Lennox, 1991). If the indicators areformative, they may not necessarily share a common theme, andeach of them may capture a unique aspect of the conceptualdomain.
Closely related to this, a third question to consider is whether theindicators would be expected to covary with each other. Areflective-indicator measurement model explicitly predicts that themeasures should be strongly correlated with each other becausethey share a common cause (i.e., they all reflect the same under-lying latent construct). In contrast, a formative-indicator measure-ment model makes no predictions about the correlations among themeasures. They might be high, low, or somewhere in between.Thus, if the indicators are not expected to be highly correlated, areflective-indicator measurement model would seem to be inap-propriate. However, if the indicators are expected to be highlycorrelated, then either model might be appropriate, and one wouldneed to rely on the other criteria.
A final question to consider is whether all of the indicators areexpected to have the same antecedents and/or consequences. Re-flective indicators of a construct should all have the same ante-cedents and consequences because they all reflect the sameunderlying construct and are supposed to be conceptually inter-changeable. However, because formative indicators are not neces-sarily interchangeable and may tap unique aspects of the concep-tual domain, they would not necessarily be expected to havesimilar antecedents and consequences. Therefore, if some of themeasures are expected to have different antecedents and/or con-sequences, they should be modeled as formative indicators,whereas if they all share virtually the same antecedents and con-sequences, they should be modeled as reflective indicators.
A Continuum of Reflective- and Formative-IndicatorMeasurement Models
The distinction between reflective- and formative-indicatormodels can be generalized to higher order factor structures. Up tothis point, the discussion has focused exclusively on the relation-ships between measures and first-order latent constructs. However,it is important to recognize that conceptual definitions of con-structs are often specified at a more abstract, second-order level,with multiple first-order subdimensions serving as reflective or
formative indicators (cf. Bacharach, Bamberger & Sonnenstuhl,2002; Baum, Locke, & Smith, 2001; Demerouti, Bakker, Nachre-iner, & Schaufeli, 2001; Holtom, Lee, & Tidd, 2002; Hom &Kinicki, 2001; Mitchell, Holtom, Lee, Sablynski, & Erez, 2001).Because of this, it is possible for a single multidimensional con-struct to have one type of measurement model relating its measuresto its first-order subdimensions and a different measurement modelrelating its subdimensions to the second-order latent construct theyrepresent. It is also possible for a construct to have a mixture ofsome reflective and some formative indicators at either level ofabstraction.
Figure 2 illustrates a series of three related models with reflec-tive indicators, and Figure 3 depicts a corresponding series ofmodels with a mixture of reflective and formative indicators. Thefirst panel in each figure represents, respectively, the commonlatent construct and composite latent construct models discussedabove. The other panels represent important elaborations of theseinitial models. There are several planes represented in each ofthese figures. The top one represents the conceptual plane, whereasthe bottom one represents the observational plane. The middleplanes represent first- and second-order empirical abstractions.The figures are drawn in this way to emphasize two importantdistinctions: (a) The latent constructs (whether first or secondorder) are empirical abstractions intended to formally represent thehypothetical constructs, but the two are not synonymous (cf.Bollen, 1989), and (b) neither the hypothetical constructs nor thelatent constructs that represent them can be measured directlywithout error (cf. Bacharach, 1989; Schwab, 1980).
Figure 2 depicts the most commonly used measurement modelsin behavioral research. Panel 1 of this figure shows a unidimen-sional first-order latent construct with three reflective indicators.Panel 3 shows a series of first-order latent factors with reflectiveindicators, and it also shows that these first-order factors arethemselves reflective indicators of an underlying second-orderconstruct. Panel 2 also shows a second-order construct, with threefirst-order latent factors as reflective indicators. However, each ofthe facets in this panel has only a single reflective indicator. Thereare a couple of interesting features of these models that areimportant to recognize. First, the model shown in Panel 2 is notidentified, because unique values for the item-level error terms andfacet-level error terms cannot be simultaneously estimated. How-ever, the model can be estimated if one or the other of these errorterms is fixed (usually at the value of 0, although not necessarilyso). Second, if the item-level error terms are fixed at 0, the modelsshown in Panels 1 and 2 are empirically indistinguishable. That is,their predicted covariance matrices are identical. Third, the modelsshown in Panels 2 and 3 are conceptually equivalent, differing onlyin the number of measures reflecting each of the facets. Generallyspeaking, the difference between these models is that the model inPanel 3 permits item-level measurement error to be distinguishedfrom facet-level measurement error. This advantage is a directresult of the fact that multiple indicators of each facet are available.Finally, it is important to recognize that the models represent acontinuum of conceptual differentiation in the sense that all threemight apply to the same hypothetical construct. The choice woulddepend on the generality or specificity of one’s theoreticalinterests.
To clarify this point, consider the case of a hypothetical con-struct such as “liking for a supervisor.” One might define the
713MEASUREMENT MODEL MISSPECIFICATION

domain of this construct as consisting of positive affect toward thesupervisor, the desire to interact with him or her, and positiveevaluations of him or her. If this construct is not the primary focusof a study, a researcher might measure it in fairly general termswith three items using the measurement model shown in Panel 1 ofFigure 2 (e.g., “I really like my supervisor,” “I enjoy working onprojects with my supervisor,” and “I think my supervisor is a niceperson”). However, if this construct is the primary focus of thestudy, it is likely that the researcher will draw sharper conceptualdistinctions between the three facets of liking (i.e., affect toward,interaction with, and evaluation of the supervisor) and spendconsiderably more time and effort on the development and refine-ment of the measures. In this instance, the researcher may developmultiple items to measure each of the key facets of the constructand use a measurement model like the one shown in Panel 3 ofFigure 2. For example, additional measures of the affect subdi-mension might include items such as “I am very fond of mysupervisor” and “I feel positively toward my supervisor”; addi-tional measures of the interaction subdimension might includeitems like “I frequently talk to my supervisor during breaks and mylunch time” and “I enjoy interacting with my supervisor outside ofwork”; and additional measures of the evaluation subdimensionmight include “My supervisor is one of the most pleasant people Iknow” and “I believe my supervisor is an honest person.” Theadvantage of this measurement model is that it allows one toseparate item-level measurement error from measurement error atthe level of the subdimension.
The model shown in Panel 2 is a transitional model that isempirically equivalent to the model in Panel 1 (when the item-level measurement error terms are fixed at 0) but represents aconceptual elaboration of it because Panel 2 draws more of adistinction between the facets. The difference between Panels 1and 2 is that in Panel 2, the researcher has decided that theconceptual distinctions between the facets are important to recog-nize. This measurement model has also been used as a simplifi-cation of the model in Panel 3 when the indicators of each facet arescale scores created by averaging a set of items measuring thefacet. In this case, it is conceptually equivalent to the model inPanel 3 but empirically different.
Figure 3 contains a parallel set of interrelated models that haveformative indicators of the composite latent construct. Panel 1shows a composite latent construct with three formative indicators.Panel 3 shows a second-order composite latent construct with threefirst-order latent constructs as formative indicators, and each ofthese first-order latent constructs has multiple reflective indicators.Panel 2 is a transitional model that is empirically equivalent to themodel in Panel 1, when the item-level measurement error terms arefixed at 0, and conceptually equivalent to the model in Panel 3because both emphasize the importance of the conceptual distinc-tions between the facets. Once again, the choice of measurementmodel would depend on the generality or specificity of one’stheoretical interest.
Overall job performance may be a good example of a constructfor which these measurement models would be appropriate. Many
Figure 2. Reflective-indicator measurement models.
714 MACKENZIE, PODSAKOFF, AND JARVIS

people are now recognizing that job performance is a compositelatent construct that has both in-role and extrarole facets. Forcontextual performance researchers (cf. Borman & Motowidlo,1993), the facets include task performance, job dedication, andinterpersonal facilitation, whereas for organizational citizenshipbehavior researchers (MacKenzie, Podsakoff, & Ahearne, 1998),the facets include in-role performance, helping behavior, sports-manship, and civic virtue. However, regardless of the specificapproach, all of these researchers agree that overall job perfor-mance is a multidimensional construct that comprises severaldistinct subdimensions. Indeed, we would argue that (a) thesesubdimensions are all defining characteristics of job performance,because one cannot even think about evaluating job performancewithout reference to one or more of them; (b) changes in a person’sperformance in these areas produce changes in his or her jobperformance; (c) these subdimensions are likely to have differentantecedents; and (d) each of these subdimensions captures aunique aspect of the job performance construct domain not cap-tured by the others.
Having said this, it is obvious that there are many different waysin which these subdimensions could be measured—ways that areall equally acceptable from a conceptual point of view. Indeed,Organ (1988) has argued that what we have referred to as helpingbehavior may be measured differently in different organizationalcontexts, and Motowidlo (2000) has taken this one step further andargued that this subdimension of contextual performance should be
measured differently in different organizational contexts. But bothauthors view these alternative measures as being equally appro-priate reflections of the underlying construct. An employee’sscores on the measures would be reflections of the extent to whichhe or she engaged in helping behavior. Thus, the relations betweenthe measures and the first-order subdimensions of job performancelook like those depicted in Panel 3 of Figure 3.
If job performance is the focus of the study, researchers willprobably want to use the measurement model shown in Panel 3,because it faithfully represents all of the conceptual distinctionsthat the researcher believes are important, and it provides the mostpowerful means of testing and evaluating the construct. In thismodel, the item-level error terms capture the invalidity and unre-liability of the individual measures. This might be caused bycontaminating constructs or random factors. However, the errorterm associated with the composite latent construct of job perfor-mance captures the invalidity of the set of subdimensions asmeasures of the second-order construct. This invalidity may be dueto several factors, including the imperfect validity of the individualcomponents or their invalidity as a group due to the failure toinclude all of the facets that are important aspects of job perfor-mance in the measure.
If job performance is less central to the research and/or is part ofa complex system of relationships being investigated, researchersmight choose to use either the model shown in Panel 1 or themodel in Panel 2 with a single measure of each subdimension of
Figure 3. Formative- and mixed-indicator measurement models.
715MEASUREMENT MODEL MISSPECIFICATION

performance. And researchers might use the model in Panel 2 withscale scores as single measures of each subdimension when theywish to have some of the benefits of the complete second-orderfactor structure (see Panel 3) without drastically increasing thenumber of measures in their model. However, because these scalescores do not fully represent the subdimensions, there is a trade-offbeing made. Finally, it is important to recognize that none of themodels shown in Figure 3 are identified as they are depicted. Waysof achieving identification in constructs with formative indicatorsare discussed in the Practical Guidelines for Developing andEvaluating Constructs With Formative Indicators section.
Commonly Misspecified Constructs in Organizational andBehavioral Research
We believe that much of what is said above about job perfor-mance also applies to other important constructs in the literature.This is consistent with the view of Law and Wong (1999), whohave noted that “the ubiquity of the composite view . . . is evi-denced in other constructs such as role conflict and role ambiguity,organizational commitment, occupational health, mental health,and dysfunctional thought processes” (p. 149). Our own reading ofthe literature suggests that there are many more constructs forwhich a formative model is appropriate.
For example, another construct that probably should be modeledas a composite latent construct is transformational leadership. Thisconstruct is often conceptualized as being a function of charisma,idealized influence, inspirational leadership, intellectual stimula-tion, and individualized consideration (cf. Bass, 1985, 1998). Inour view, these forms of leader behavior are conceptually distinct,likely to have different antecedents and/or consequences, and arenot interchangeable. Indeed, it is not difficult to imagine a leaderwho is able to demonstrate consideration to followers (e.g., exhibitindividualized consideration) but is not able to get them to ques-tion the appropriateness of critical assumptions they have abouttheir work (e.g., exhibit intellectual stimulation) or able to displaya sense of power and confidence (e.g., exhibit idealized influence).Thus, even though this construct has consistently been modeled inthe literature as having reflective indicators (cf. Bycio, Hackett, &Allen, 1995; Geyer & Steyrer, 1998; Tracey & Hinkin, 1998),Bass’s (1985) transformational leadership construct should bemodeled as having formative indicators, probably as shown inPanel 3 of Figure 3. The same can be said for Podsakoff, Mac-Kenzie, Moorman, and Fetter’s (1990) slightly different concep-tualization of transformational leadership.
Another example of a construct that should be modeled ashaving formative indicators is procedural justice. According toColquitt (2001), procedural justice consists of the perceived fair-ness of the procedures used to arrive at a person’s job outcomes,including whether (a) the procedures are developed with the em-ployee’s input, are applied consistently, are free of bias, and arebased on accurate information; (b) employees have influence overthe outcome; and/or (c) employees have the ability to appeal theoutcome. Clearly, perceptions of the overall fairness of the proce-dures are the result of these things rather than the cause of them.Moreover, the items are not interchangeable, and because all of thecharacteristics mentioned in them are necessary for the proceduresto be perceived as fair, eliminating one or more of the items wouldalter the conceptual domain of the construct and undermine its
validity. Finally, some of the things that one might do to make surethat the procedures are free of bias and consistently applied wouldbe quite different from what one might do to ensure that theprocedures are developed with the employee’s input. Therefore,contrary to how it has been modeled in the literature (cf. Colquitt,2001; Masterson, 2001; Moorman, 1991), procedural justiceshould probably be modeled as having formative indicators.
Of course, we do not mean to imply that every construct, or evenmost constructs, should be modeled as having formative indica-tors. Nor are we suggesting that the authors cited in the aboveexamples should have been aware of the distinction betweenformative and reflective indicators at the time their research wasconducted. Instead, our point is that the specification of the mea-surement model is a critical decision that needs to be made on thebasis of conceptual criteria like the ones that we have discussed.
The Severity of the Effects of Misspecification
The preceding examples demonstrate that measurement modelmisspecification is fairly common among published research stud-ies. This is an important problem, because empirical research (Law& Wong, 1999) has demonstrated that measurement model mis-specification can bias structural parameter estimates. In Law andWong’s study, the parameter estimate for the relationship betweenjob perception and job satisfaction was inflated by 132% (.995 vs..429) when job perception was incorrectly modeled as havingreflective indicators compared with when it was correctly modeledas having formative indicators. However, both estimates werestatistically significant, so no error of inference was made. Lawand Wong also found that measurement model misspecification inone construct can sometimes influence relationships in a modelthat do not involve this construct and result in errors of inference.
Although Law and Wong (1999) provided an important dem-onstration of the potential effects of measurement model misspeci-fication, there are three factors that limit the extent to which thefindings of their study can be generalized. First, because theirresults were only based on data from a single sample, it is difficultto know whether the results might be sample specific. Second,because Law and Wong’s sample was relatively small (N � 204),and error rates are known to be sensitive to sample size, it is notclear how generalizable their findings about the effects of mea-surement model misspecification on error rates might be. Finally,the generalizability of their results may also be limited by the factthat the error term for the job perception construct was not iden-tified when job perception was specified as having formativeindicators. This is because the job perception construct did nothave two paths emanating from it that led to independent con-structs. It had two paths leading from it, but the two constructswere causally related. This causes the error term for the compositelatent construct (job perception) and the structural error terms forthe constructs it influences to be indeterminate (i.e., unique pa-rameter estimates are not obtainable). This is an identificationproblem that was explicitly noted by MacCallum and Browne(1993).
Simulation Objectives
In view of the above limitations, there is still not a very clearpicture of how severe the effects of measurement model misspeci-
716 MACKENZIE, PODSAKOFF, AND JARVIS

fication might be. Therefore, we conducted a Monte Carlo simu-lation designed to investigate three unresolved issues. First, towhat extent is the estimate of a structural relationship between twoconstructs (e.g., �) biased by measurement model misspecifica-tion? We expected that the position of the misspecified construct ina model (e.g., exogenous vs. endogenous) would influence thedegree of bias observed. This is because treating the formativeindicators of a construct as if they were reflective indicatorsreduces the variance of the latent construct, because this definesthe construct in terms of the common variance of the indicatorsrather than in terms of their total variance (cf. Law & Wong, 1999,p. 145). When the misspecified construct is in the exogenousposition, the variance of the exogenous construct will go down,thus resulting in an upward bias in the estimates of the impact ofthis construct on other constructs because the estimate captures theeffect of a one-unit change in the exogenous construct on theendogenous construct. Conversely, when the misspecified con-struct is in the endogenous position, the variance of the endoge-nous construct will be reduced, thereby producing a downwardbias in the structural estimate of the relationship between thisconstruct and an exogenous construct. However, when both theendogenous and exogenous constructs are misspecified, this rea-soning would lead to the prediction that effects would tend topartially cancel each other out, thus producing less of a bias. Themagnitude of the item intercorrelations was also expected to in-fluence the extent of the bias in the structural estimates, becausethe greater the magnitude of the item intercorrelations, the smallerthe change in the variance of a construct produced by measurementmodel misspecification. Therefore, the greater the magnitude ofthe item intercorrelations, the smaller the bias in the structuralestimates produced by measurement model misspecification. Inthis sense, the magnitude of the interitem correlations captures thedegree of measurement model misspecification, with high itemintercorrelations indicating a less severe misspecification thanlower intercorrelations.
The second unresolved question that the simulation was de-signed to address is this: To what extent will measurement modelmisspecification lead to errors of inference in hypothesis testing?The statistical inferences about relationships between constructsare based on the critical ratio of the magnitude of the unstandard-ized structural estimate and the standard error of that estimate.Therefore, things that bias either of these two values have thepotential to lead to errors. It is widely recognized that sample sizeis inversely related to the magnitude of the standard error of thestructural estimate (Cohen, 1988). In addition, we have alreadyargued that the position of a misspecified construct in a model(e.g., exogenous or endogenous) and the strength of the itemintercorrelations will bias the magnitude of the structural param-eter estimates. Consequently, these factors should also influencethe error rate by influencing either the numerator or the denomi-nator of the critical ratio. More specifically, we expected that (a)misspecification of the exogenous construct would inflate thestructural parameter estimate, thus increasing Type I and decreas-ing Type II error rates; (b) misspecification of the endogenousconstruct would deflate the structural parameter estimate, thusdecreasing Type I and increasing Type II error rates; (c) as themagnitude of the item intercorrelations increased, the bias in thestructural estimates produced by either type of measurement modelmisspecification would decrease, and the effects of these factors on
the Type I and Type II error rates should decrease; and (d)increasing the sample size would decrease the standard error of thestructural parameter estimate and increase Type I and decreaseType II error rates. In addition, although we were not necessarilypredicting that these factors would interact to influence the errorrate observed, this possibility was examined in the simulation.
The third question addressed by the simulation is this: To whatextent are the most commonly used goodness-of-fit indices capa-ble of detecting measurement model misspecification? This re-search used the goodness-of-fit index (GFI), comparative fit index(CFI), standardized root-mean-square residual (SRMR), and root-mean-square error of approximation (RMSEA) as the indices ofmodel fit. The GFI was selected because it is one of the mostwidely reported indices in the literature; the SRMR was selectedbecause Hu and Bentler (1998) found it to be the most sensitivegoodness-of-fit index for detecting misspecified relationships be-tween latent constructs; and the CFI and RMSEA were selectedbecause Hu and Bentler (1998) found that they were the mostsensitive goodness-of-fit indices at detecting measurement modelmisspecification. Because high CFI and GFI values and lowSRMR and RMSEA values are associated with better fitting mod-els, we expected the CFI and GFI to be negatively related to thedegree of model misspecification and the SRMR and RMSEA tobe positively related to the degree of model misspecification. Thismeans that we should have observed main effects of the endoge-nous and exogenous construct misspecification manipulations andperhaps an interaction between the two on these goodness-of-fitindices. Similarly, because the degree of measurement modelmisspecification is greater when the item intercorrelations are lowthan when they are high, we expected that our manipulation of themagnitude of the item intercorrelations would have a main effecton the goodness-of-fit indices. More specifically, as intercorrela-tions among the items increased, the CFI and GFI should haveincreased, and the SRMR and RMSEA should have decreased.Finally, on the basis of previous simulation research (cf. Anderson& Gerbing, 1984; Bearden, Sharma, & Teel, 1982; Bollen, 1990;Hu & Bentler, 1998, 1999), we expected that sample size would bepositively related to the GFI, negatively related to the SRMR andRMSEA fit indices, and generally not related to the CFI. However,it is important to note that with the exception of Hu and Bentler(1998), the effects of model misspecification on this pattern ofresults have not been examined.
Simulation Design
Therefore, we conducted a Monte Carlo simulation to investi-gate these issues. More specifically, the simulation examined theempirical consequences of inappropriately applying a reflective-indicator measurement model to a construct that should have beenmodeled with formative indicators. Figure 4 summarizes the mod-els tested in the Monte Carlo simulation conditions. The simulationconditions varied on the basis of whether (a) the measurementmodel of the focal construct was correctly specified as havingformative indicators (as indicated in Figure 4A) or incorrectlyspecified as having reflective indicators (as indicated in Figures4B, 4C, and 4D); (b) the size of the sample used in the simulationwas small (125), medium (500), or large (875); (c) the itemintercorrelations of the focal construct were relatively weak (.20),moderate (.50), or strong (.80); and (d) the relationship between
717MEASUREMENT MODEL MISSPECIFICATION

the exogenous and endogenous constructs was weak (e.g., .10),moderate (e.g., .30), or strong (e.g., .50). It is important to note twothings about these models. First, the correctly specified model (seeFigure 4A) includes two reflective indicators in addition to its fiveformative indicators. As we elaborate on in our discussion ofFigure 8 (presented later), these reflective indicators were included
to ensure that the otherwise formatively measured construct wouldbe identified (cf. MacCallum & Browne, 1993). Second, we didnot include cells in the simulation design where there was norelationship between the exogenous and endogenous constructsbecause we wanted to focus on how measurement model misspeci-fication influences estimates of structural relationships of knownstrength and statistical tests of those relationships, and we wantedto do this under conditions in which the power was great enoughthat any errors of inference (i.e., Type II errors) would be dueprimarily to the manipulated factors rather than chance.
Manipulating whether the exogenous or endogenous constructswere misspecified allowed us to examine the consequences ofmeasurement model misspecification on structural paths emanat-ing from and going into the misspecified constructs. This is im-portant because both types of misspecification are commonlyfound in the literature, and their effects are expected to be differ-ent. The manipulation of the magnitude of the correlations amongthe indicators of the construct with the formative indicators al-lowed us to test the significance of the effects of misspecificationacross a variety of situations, including some in which the itemintercorrelations were high enough (e.g., .50 and .80) that it mightappear that a reflective-indicator model is appropriate. Indeed, afive-item scale with item intercorrelations of .50 would have aCronbach’s alpha of .83, and with intercorrelations of .80, it wouldhave a Cronbach’s alpha of .95. Manipulating sample size in thesimulation permitted us to examine the effects of the size of thesample on the likelihood of Type II errors and the goodness-of-fitindices. The mean sample size in our simulation (500) was selectedto correspond to the mean sample size in articles published inseveral organizational and management journals from 1995–1997(cf. Scandura & Williams, 2000); the small sample size (125) wasselected to roughly correspond to the minimum needed to safelymeet the sample-size requirements for the maximum-likelihoodestimation method; and the large sample size (875) was selected tobe an equal distance from the mean sample size and to roughlycorrespond to a typical “large” sample. Finally, the manipulationof the strengths of the paths emanating from the construct withformative indicators allowed us to evaluate the consequences ofmeasurement model misspecification across the range of relation-ship strengths typically reported in psychological research (cf.Cohen, 1992).
After the population values were set, nine population covariancematrices were calculated for the true model (see Figure 4A)—onefor each of the unique combinations of interitem correlationstrength (.20, .50, .80) and relationship strength (.10, .30, .50).Following this, a Monte Carlo simulation was conducted usingEQS 5.7b (Multivariate Software, Inc., Encino, CA). The simula-tion generated raw data sets of varying sample size (125, 500, 875)from each of the population covariance matrices, assuming anormal distribution. The data were sampled from a normal distri-bution because the maximum-likelihood technique used to esti-mate the model assumes multivariate normality and because mostother researchers have used normally distributed data when con-ducting statistical equation modeling simulation studies. A total of500 data sets were generated for each condition. These data setswere then fit to the models shown in Figure 4, generating param-eter estimates and fit statistics for each replication. We wereparticularly interested in the unstandardized structural parameter
Figure 4. Summary of simulation models.
718 MACKENZIE, PODSAKOFF, AND JARVIS

estimate (�), its standard error, and the overall indices of model fit(CFI, GFI, RMSEA, and SRMR).
Simulation Results
Before turning to the results of the simulation study, it isimportant to note that with 500 cases per cell and 108 cells, thepower to detect statistically significant effects of the manipulationswas quite large. Indeed, according to Cohen (1988), with oursample size and using an alpha level of p � .05, there was virtuallya 100% chance of detecting a small, medium, or large effect.Consequently, most of the manipulated effects and their interac-tions were statistically significant ( p � .05). However, this doesnot mean that they were all equally important in accounting forvariation in the criterion measures. Therefore, we calculated partial�2 estimates to identify the most important effects, and only thoseeffects that accounted for approximately 5% of the variance in thecriterion measure are discussed.
Table 1 reports the means for the criterion measures for thesimulation treatment conditions, and Table 2 reports the analysis ofvariance results. The first four columns of Table 1 indicate thetreatment condition. More specifically, the first two columns in-dicate whether the endogenous and/or exogenous constructs weremisspecified, the third column indicates the interitem correlationvalues, and the fourth column indicates the sample size of each ofthe treatment conditions. Column 1 in Table 2 reports the main andinteractive effects of the manipulations of the misspecification ofthe endogenous construct, exogenous construct, item intercorrela-tions, and sample size. Although it was important for generaliz-ability purposes to also manipulate the magnitude of the effect ofthe exogenous construct on the endogenous construct (�) across arange of effect sizes, the results shown in Tables 1 and 2 arecollapsed across these conditions for several reasons. First, theeffect of this manipulation on the magnitude of the � coefficient istheoretically uninteresting, because this factor is a direct manipu-
Table 1Criterion-Measure Means for All Treatment Conditions of the Monte Carlo Simulation
Treatment condition Measure
Endogenousmisspecified
Exogenousmisspecified
Interitemcorrelation
Samplesize � SE of � CFI GFI RMSEA SRMR
No No .20 125 0.299 0.024 .996 .937 .021 .060No No .20 500 0.301 0.012 .999 .984 .008 .030No No .20 875 0.300 0.009 1.000 .991 .006 .023No No .50 125 0.301 0.019 .997 .937 .022 .058No No .50 500 0.300 0.010 .999 .984 .009 .030No No .50 875 0.300 0.007 1.000 .991 .006 .022No No .80 125 0.300 0.016 .998 .937 .021 .055No No .80 500 0.300 0.008 1.000 .984 .008 .028No No .80 875 0.300 0.006 1.000 .991 .006 .021No Yes .20 125 1.717 0.270 .913 .880 .123 .075No Yes .20 500 1.613 0.126 .916 .927 .121 .052No Yes .20 875 1.608 0.095 .916 .934 .121 .047No Yes .50 125 1.606 0.165 .960 .891 .098 .064No Yes .50 500 1.564 0.081 .962 .939 .096 .038No Yes .50 875 1.559 0.061 .962 .946 .096 .032No Yes .80 125 1.549 0.109 .993 .917 .045 .055No Yes .80 500 1.540 0.054 .995 .968 .043 .028No Yes .80 875 1.543 0.041 .995 .976 .044 .022Yes No .20 125 0.046 0.017 .897 .876 .134 .090Yes No .20 500 0.047 0.009 .898 .922 .133 .077Yes No .20 875 0.047 0.007 .899 .929 .133 .074Yes No .50 125 0.047 0.017 .927 .860 .131 .105Yes No .50 500 0.048 0.008 .929 .903 .129 .096Yes No .50 875 0.048 0.006 .929 .910 .129 .094Yes No .80 125 0.046 0.017 .932 .767 .146 .122Yes No .80 500 0.046 0.008 .932 .797 .145 .119Yes No .80 875 0.046 0.006 .932 .802 .145 .118Yes Yes .20 125 0.263 0.103 .813 .826 .170 .101Yes Yes .20 500 0.251 0.050 .814 .872 .169 .088Yes Yes .20 875 0.253 0.037 .814 .879 .169 .086Yes Yes .50 125 0.246 0.090 .889 .821 .153 .108Yes Yes .50 500 0.249 0.045 .892 .866 .151 .098Yes Yes .50 875 0.247 0.034 .892 .873 .151 .097Yes Yes .80 125 0.234 0.086 .927 .754 .143 .122Yes Yes .80 500 0.239 0.042 .928 .788 .142 .118Yes Yes .80 875 0.235 0.032 .929 .798 .141 .116
Note. All means have been collapsed across levels of gamma. Endogenous � endogenous construct; Exogenous � exogenous construct; � �unstandardized structural parameter estimate; CFI � comparative fit index; GFI � goodness-of-fit index; RMSEA � root-mean-square error ofapproximation; SRMR � standardized root-mean-square residual.
719MEASUREMENT MODEL MISSPECIFICATION

Tab
le2
Ana
lysi
sof
Var
ianc
eR
esul
tsfo
rth
eM
onte
Car
loSi
mul
atio
n
Sour
cedf
a
gam
ma
SEof
gam
ma
CFI
GFI
RM
SEA
SRM
R
Fp
P�
2F
pP
�2
Fp
P�
2F
pP
�2
Fp
P�
2F
pP
�2
End
ogen
ous
138
,999
.90
.00
.21
14,0
65.2
0.0
0.0
515
1,49
2.00
.00
.32
46,9
26.1
0.0
0.2
616
0,30
0.00
.00
.35
47,2
76.9
0.0
0.2
9E
xoge
nous
133
,926
.10
.00
.19
96,6
95.9
0.0
0.2
742
,100
.10
.00
.12
5,58
2.21
.00
.04
38,5
40.6
0.0
0.1
262
4.56
.00
.01
Inte
rite
mco
rrel
atio
nva
lue
218
.93
.00
.00
4712
.72
.00
.03
26,7
12.4
0.0
0.1
42,
922.
47.0
0.0
43,
099.
87.0
0.0
243
9.30
.00
.01
Sam
ple
size
24.
74.0
1.0
015
,776
.00
.00
.11
42.6
4.0
0.0
04,
241.
00.0
0.0
616
0.43
.00
.00
2,23
8.68
.00
.04
End
ogen
ous
�E
xoge
nous
118
,169
.80
.00
.11
12,1
78.8
0.0
0.0
40.
04.8
3.0
059
.45
.00
.00
14,2
87.3
0.0
0.0
597
.72
.00
.00
End
ogen
ous
�C
orre
latio
nV
alue
29.
07.0
0.0
03,
107.
11.0
0.0
22,
687.
55.0
0.0
26,
135.
46.0
0.0
81,
840.
79.0
0.0
12,
318.
00.0
0.0
4E
ndog
enou
s�
Sam
ple
Size
24.
16.0
2.0
01,
397.
07.0
0.0
10.
50.6
1.0
023
.24
.00
.00
74.5
8.0
0.0
062
2.38
.00
.01
Exo
geno
us�
Cor
rela
tion
Val
ue2
18.8
3.0
0.0
03,
797.
47.0
0.0
312
,471
.20
.00
.07
625.
91.0
0.0
15,
128.
06.0
0.0
327
3.67
.00
.00
Exo
geno
us�
Sam
ple
Size
25.
00.0
1.0
09,
340.
97.0
0.0
70.
28.7
6.0
03.
62.0
3.0
073
.68
.00
.00
4.36
.01
.00
Cor
rela
tion
Val
ue�
Sam
ple
Size
41.
65.1
6.0
053
1.52
.00
.01
1.13
.34
.00
5.68
.00
.00
0.20
.94
.00
11.8
1.0
0.0
0E
ndog
enou
s�
Exo
geno
us�
Cor
rela
tion
Val
ue2
9.08
.00
.00
2,50
3.48
.00
.02
0.97
.38
.00
0.20
.82
.00
589.
41.0
0.0
015
.51
.00
.00
End
ogen
ous
�E
xoge
nous
�Sa
mpl
eSi
ze2
3.92
.02
.00
1,24
4.46
.00
.01
1.25
.29
.00
0.20
.82
.00
75.4
9.0
0.0
08.
81.0
0.0
0E
ndog
enou
s�
Cor
rela
tion
Val
ue�
Sam
ple
Size
40.
96.4
3.0
033
6.56
.00
.01
0.56
.69
.00
10.9
7.0
0.0
00.
21.9
3.0
013
.78
.00
.00
Exo
geno
us�
Cor
rela
tion
Val
ue�
Sam
ple
Size
41.
73.1
4.0
044
1.49
.00
.01
0.36
.84
.00
1.64
.16
.00
0.27
.90
.00
3.15
.01
.00
End
ogen
ous
�E
xoge
nous
�C
orre
latio
nV
alue
�Sa
mpl
eSi
ze4
0.98
.42
.00
278.
60.0
0.0
00.
12.9
8.0
00.
18.9
5.0
00.
14.9
7.0
01.
14.3
4.0
0
Not
e.P
�pa
rtia
l;E
ndog
enou
s�
endo
geno
usco
nstr
uct
mis
spec
ifie
d;E
xoge
nous
�ex
ogen
ous
cons
truc
tm
issp
ecif
ied;
CFI
�co
mpa
rativ
efi
tin
dex;
GFI
�go
odne
ss-o
f-fi
tin
dex;
RM
SEA
�ro
ot-m
ean-
squa
reer
ror
ofap
prox
imat
ion;
SRM
R�
stan
dard
ized
root
-mea
n-sq
uare
resi
dual
.a
Err
ordf
for
all
Fs
�51
,244
.
720 MACKENZIE, PODSAKOFF, AND JARVIS

lation of the magnitude of this coefficient. Therefore, testing itwould simply reveal that our manipulation worked. Second, thisfactor was not expected to influence the other criterion measures(CFI, GFI, RMSEA, and SRMR). Indeed, the only consistenteffect of the � manipulation was that the overall goodness-of-fitindices decreased as the � value increased, but only when theendogenous construct was misspecified. Third, the addition of thisfactor would have tripled the size of Table 1 and obscured themore important relationships in the data.
Effects of the manipulations on the structural parameter esti-mate and Type II error rate. As indicated in Table 2, the mag-nitude of the structural parameter estimate (�) was primarilydetermined by the endogenous and exogenous construct manipu-lations and their interactions. These manipulations accounted for21%, 19%, and 11%, respectively, of the variance of this criterionvariable. These same manipulations and their interactions ac-counted for 5%, 27%, and 4%, respectively, of the variance in thestandard error of the structural parameter estimate. These effectsare depicted in Figure 5. Figure 5A shows that when the exogenousconstruct alone was misspecified, the structural parameter estimate(1.59) was 429% higher than its true value of 0.30. However, whenthe endogenous construct alone was misspecified, the structuralparameter estimate (0.048) was 84% lower than its true value of0.30. Finally, when both the endogenous and exogenous constructswere misspecified, the structural parameter estimate (0.246) was18% lower than its true value of 0.30. Figure 5B shows thatmisspecification of the exogenous construct greatly inflates thestandard error of the estimate, misspecification of the endogenousconstruct slightly deflates the standard error of the estimate, andmisspecification of both constructs has the net effect of inflatingthe standard error. Thus, measurement model misspecification wasfound to either inflate or deflate the structural parameter estimateand the standard error of the estimate, depending on whether theexogenous or endogenous construct was misspecified.
We investigated the extent to which misspecification influencedinferences about the statistical significance of this relationship(i.e., the Type II error rate) using logit regression analysis bycalculating the critical ratio of the unstandardized estimate to itsstandard error and examining whether the ratio was greater or lessthan the critical value of 1.96 (for � � .05). When the exogenousconstruct alone was misspecified, the average Type II error ratewas found to be 0. When the endogenous construct alone wasmisspecified, the average Type II error rate was 19%. Finally,when both constructs were misspecified, the average Type II errorrate was 18%. This means that the statistical test falsely indicatedthat there was no relationship between the two constructs whenthere really was one 19% of the time when the endogenousconstruct was misspecified, even though the power was sufficientto detect even the weakest relationship virtually 100% of the time.Thus, consistent with our expectations, (a) misspecification of theexogenous construct inflated the structural parameter estimate butdid not reduce the Type II error rate (because it was already at 0),and (b) misspecification of the endogenous construct deflated thestructural parameter estimate and, consequently, inflated the TypeII error rate. Although we did not have specific hypotheses regard-ing the interactive effects, misspecifying both the exogenous andendogenous constructs had almost exactly the same inflationaryeffect on the Type II error rate as misspecifying the endogenousconstruct alone (18% vs. 19%, respectively). However, as shown
in Figure 5, when both constructs were misspecified, the increasein the Type II error rate was due much more to an inflation of thestandard error of the estimate than to a deflation of the estimateitself, whereas when only the endogenous construct was misspeci-fied, the increase in the Type II error rate was due more to adeflation of the estimate than to an inflation of its standard error.
In addition to the effects discussed above, the standard error ofthe estimate was also influenced by sample size (partial �2 �11%), as expected. As indicated in Table 1, the standard error ofthe estimate decreased as sample size increased. Moreover, thiseffect was found to be stronger when the exogenous construct wasmisspecified than when it was correctly specified (partial �2 �7%).
Finally, as expected, the bias in the structural parameter estimate(�) produced by the misspecification of the exogenous or endog-enous constructs decreased as the item intercorrelations increased.The same was also true for the bias in the standard error of theestimate that was produced by the misspecification of the endog-enous or exogenous constructs. However, contrary to expectations,the Type II error rates did not follow this pattern, because the ratesof decline of the structural parameter estimate and its standarderror were different. The effects of misspecification of the exog-enous construct on the Type II error rate decreased only trivially asthe item intercorrelations increased, whereas the effects of mis-specification of the endogenous construct on the Type II error rateactually increased slightly as the item intercorrelations increased.Thus, the findings provide only partial support for the expectedeffects; however, it is important to note that none of these inter-action effects accounted for a very substantial percentage of thevariance (see Table 2).
Effects of the manipulations on goodness of fit. Generallyspeaking, we expected to observe endogenous, exogenous, anditem intercorrelation main effects (and perhaps their interactions)on the goodness-of-fit indices. We also generally expected samplesize to influence them, although less so for the CFI. Consistentwith these expectations, Tables 1 and 2 indicate that when theendogenous construct was misspecified, the CFI decreased (partial�2 � 32%); when the exogenous construct was misspecified, theCFI decreased (partial �2 � 12%); and as the interitem correlationvalues decreased, the CFI decreased (partial �2 � 14%). In addi-tion, Figure 6A shows that there was also an interaction betweenthe manipulation of the exogenous construct specification and theitem intercorrelation that accounted for 7% of the variance in thiscriterion variable. As indicated in this figure, misspecification ofthe measurement model for the exogenous construct decreasedthe CFI much more when the item intercorrelations were lowthan when they were high. This makes sense, because both ofthese manipulations influenced the severity of the modelmisspecification.
Misspecifying the endogenous construct decreased the GFI (par-tial �2 � 26%), and the GFI also decreased as the sample sizedecreased (partial �2 � 6%). In addition, as shown in Figure 6B,there was an interaction between the manipulation of the specifi-cation of the endogenous construct and the interitem correlationvalue (partial �2 � 8%). The GFI was positively related to theinteritem correlation value when the endogenous construct was notmisspecified, but it was negatively related to the interitem corre-lation value when the endogenous construct was misspecified.With respect to the RMSEA, the results indicated that this criterion
721MEASUREMENT MODEL MISSPECIFICATION

Figure 5. Illustrations of the effects of exogenous and endogenous construct misspecification on the structuralparameter estimate (A) and the standard error of the structural parameter estimate (B).
722 MACKENZIE, PODSAKOFF, AND JARVIS

Figure 6. Illustrations of interaction effects on (A) the comparative fit index (CFI), (B) the goodness-of-fitindex (GFI), and (C) the root-mean-square error of approximation (RMSEA).
723MEASUREMENT MODEL MISSPECIFICATION
variable increased when the exogenous construct was misspecified(partial �2 � 12%) and when the endogenous construct wasmisspecified (partial �2 � 35%). In addition, there was also afairly substantial interaction effect between these two factors (par-tial �2 � 5%), depicted in Figure 6C. As shown in the figure, theRMSEA increased as the degree of measurement model misspeci-fication increased, but not as much as would be expected if theeffects of the endogenous and exogenous misspecification effectswere simply additive. Finally, the results indicated that misspeci-fying the endogenous construct increased the SRMR (partial �2 �29%).
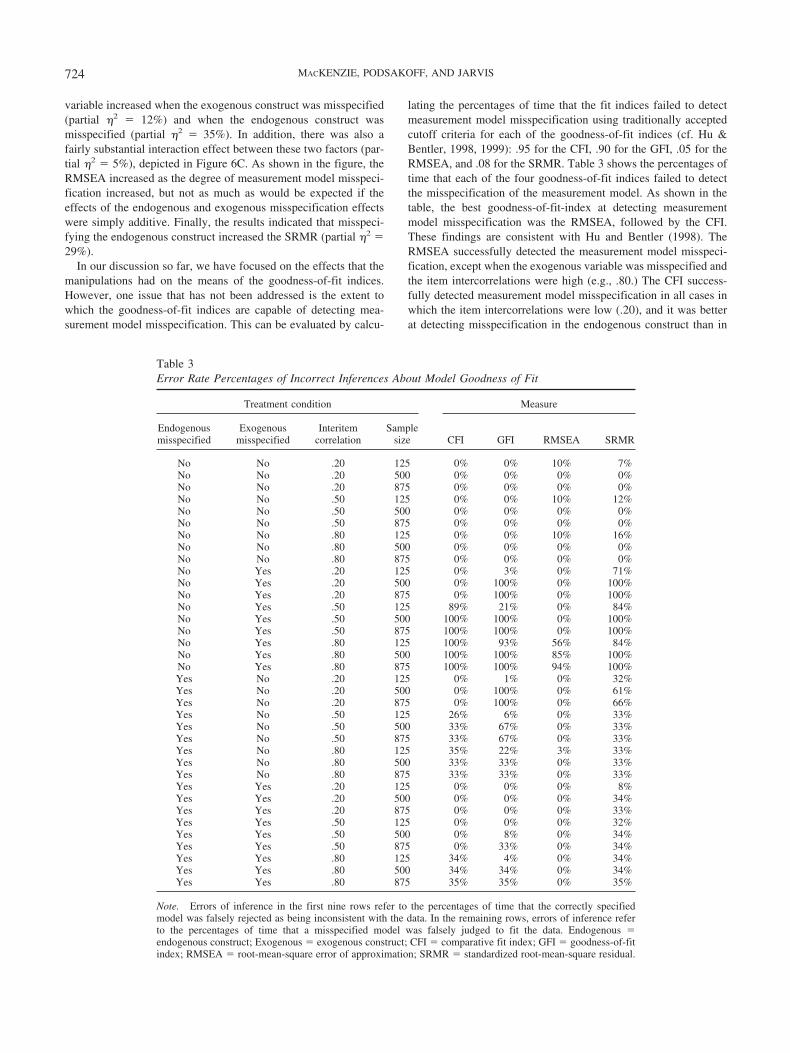
In our discussion so far, we have focused on the effects that themanipulations had on the means of the goodness-of-fit indices.However, one issue that has not been addressed is the extent towhich the goodness-of-fit indices are capable of detecting mea-surement model misspecification. This can be evaluated by calcu-
lating the percentages of time that the fit indices failed to detectmeasurement model misspecification using traditionally acceptedcutoff criteria for each of the goodness-of-fit indices (cf. Hu &Bentler, 1998, 1999): .95 for the CFI, .90 for the GFI, .05 for theRMSEA, and .08 for the SRMR. Table 3 shows the percentages oftime that each of the four goodness-of-fit indices failed to detectthe misspecification of the measurement model. As shown in thetable, the best goodness-of-fit-index at detecting measurementmodel misspecification was the RMSEA, followed by the CFI.These findings are consistent with Hu and Bentler (1998). TheRMSEA successfully detected the measurement model misspeci-fication, except when the exogenous variable was misspecified andthe item intercorrelations were high (e.g., .80.) The CFI success-fully detected measurement model misspecification in all cases inwhich the item intercorrelations were low (.20), and it was betterat detecting misspecification in the endogenous construct than in
Table 3Error Rate Percentages of Incorrect Inferences About Model Goodness of Fit
Treatment condition Measure
Endogenousmisspecified
Exogenousmisspecified
Interitemcorrelation
Samplesize CFI GFI RMSEA SRMR
No No .20 125 0% 0% 10% 7%No No .20 500 0% 0% 0% 0%No No .20 875 0% 0% 0% 0%No No .50 125 0% 0% 10% 12%No No .50 500 0% 0% 0% 0%No No .50 875 0% 0% 0% 0%No No .80 125 0% 0% 10% 16%No No .80 500 0% 0% 0% 0%No No .80 875 0% 0% 0% 0%No Yes .20 125 0% 3% 0% 71%No Yes .20 500 0% 100% 0% 100%No Yes .20 875 0% 100% 0% 100%No Yes .50 125 89% 21% 0% 84%No Yes .50 500 100% 100% 0% 100%No Yes .50 875 100% 100% 0% 100%No Yes .80 125 100% 93% 56% 84%No Yes .80 500 100% 100% 85% 100%No Yes .80 875 100% 100% 94% 100%Yes No .20 125 0% 1% 0% 32%Yes No .20 500 0% 100% 0% 61%Yes No .20 875 0% 100% 0% 66%Yes No .50 125 26% 6% 0% 33%Yes No .50 500 33% 67% 0% 33%Yes No .50 875 33% 67% 0% 33%Yes No .80 125 35% 22% 3% 33%Yes No .80 500 33% 33% 0% 33%Yes No .80 875 33% 33% 0% 33%Yes Yes .20 125 0% 0% 0% 8%Yes Yes .20 500 0% 0% 0% 34%Yes Yes .20 875 0% 0% 0% 33%Yes Yes .50 125 0% 0% 0% 32%Yes Yes .50 500 0% 8% 0% 34%Yes Yes .50 875 0% 33% 0% 34%Yes Yes .80 125 34% 4% 0% 34%Yes Yes .80 500 34% 34% 0% 34%Yes Yes .80 875 35% 35% 0% 35%
Note. Errors of inference in the first nine rows refer to the percentages of time that the correctly specifiedmodel was falsely rejected as being inconsistent with the data. In the remaining rows, errors of inference referto the percentages of time that a misspecified model was falsely judged to fit the data. Endogenous �endogenous construct; Exogenous � exogenous construct; CFI � comparative fit index; GFI � goodness-of-fitindex; RMSEA � root-mean-square error of approximation; SRMR � standardized root-mean-square residual.
724 MACKENZIE, PODSAKOFF, AND JARVIS

the exogenous construct. The goodness-of-fit index that was theleast sensitive at detecting measurement model misspecificationwas the SRMR. Generally speaking, it performed especially poorlywhen the exogenous variable was misspecified, and it was incor-rect about a third of the time when the endogenous variable wasmisspecified. Overall, with the exception of the RMSEA, thegoodness-of-fit indices tested will fail to detect measurementmodel misspecification a substantial proportion of the time.
Practical Guidelines for Developing and EvaluatingConstructs With Formative Indicators
In view of the fact that some of the most widely researchedconstructs in the literature are misspecified and that measure-
ment model misspecification can have potentially serious ef-fects, it appears that the field would benefit from some practicalguidelines for developing, modeling, and evaluating constructswith formative indicators. Figure 7 provides an overview of thesimilarities and differences in the stages of the scale develop-ment and validation process for constructs with reflective indi-cators versus constructs with formative indicators. Most of thestages in this process have been described elsewhere (cf.Churchill, 1979; Nunnally & Bernstein, 1994; Schwab, 1980)and are elaborated on here only when the procedures that oneshould follow for developing and evaluating formative-indicator models differ from those that should be followed forreflective-indicator models.
Figure 7. Comparison of scale development processes for reflective and formative constructs.
725MEASUREMENT MODEL MISSPECIFICATION

As indicated in Figure 7, the initial stages involve defining theconceptual domain and evaluating the conceptual dimensionalityof the hypothetical construct. Our own review of the literaturesuggests that the failure to think carefully about the dimensionalityof constructs is one of the primary causes of measurement modelmisspecification. As shown in Figures 2 and 3, constructs are oftenmultidimensional, and their subdimensions may have either for-mative or reflective measures and may themselves be either for-mative or reflective indicators of a second-order construct.
The next step is to generate a set of items that completelycaptures the conceptual domain of the construct (i.e., is not defi-cient) without being contaminated by other related constructs. Forreflective measures, the goal is to develop a representative sampleof measures for the construct (cf. Nunnally & Bernstein, 1994;Schwab, 1980), whereas for formative measures, the goal is todevelop a set of measures that represents a census of the keyelements of the conceptual domain (Bollen & Lennox, 1991).
Once the measures have been generated, the next step is todetermine whether the measures are reflective or formative indi-cators of the construct(s) of interest. This decision can be based onthe criteria discussed earlier in this article. Generally speaking, theindicators are formative if the following conditions prevail: (a) Theindicators are viewed as defining characteristics of the construct,(b) changes in the indicators are expected to explain changes in theconstruct, (c) the indicators do not necessarily share a commontheme, (d) eliminating an indicator may alter the conceptual do-main of the construct, and (e) the indicators are not necessarilyexpected to have the same antecedents and consequences.
Regardless of whether the indicators are formative or reflective,the next step is to establish the scale of measurement for theconstruct. For reflective-indicator models, this can be done byfixing a path from the latent construct to one of its indicators at 1or by fixing the variance of the construct at 1. Either of thesesolutions is acceptable. For formative-indicator models, the scaleof measurement is set by either fixing a path from one of theindicators to the composite latent construct at 1 or by fixing thevariance of the construct at 1. Once again, either of these solutionsis acceptable.
Once this is done, reflective-indicator models should be estima-ble. However, an additional step is needed to achieve identification
for formative-indicator models. To resolve the indeterminacy as-sociated with the construct-level error term, each construct withformative indicators must emit paths to at least two unrelatedreflective indicators. As shown in Figure 8, this condition can besatisfied if the construct emits paths to at least two unrelated latentconstructs with reflective indicators (see Figure 8A), one reflectiveindicator and one latent construct with reflective indicators (seeFigure 8B), and/or at least two theoretically appropriate reflectiveindicators (see Figure 8C).
As an illustration of these methods of identification, assume thata researcher is interested in job satisfaction and wishes to model itas a composite latent construct with multiple formative indicators(e.g., satisfaction with pay, satisfaction with coworkers, and sat-isfaction with the supervisor). In isolation, without any pathsentering it or emanating from it, this construct would not beidentified. However, one way that it would be identified is if thetheoretical structure being tested included paths from job satisfac-tion to two unrelated latent constructs with reflective indicators, asshown in Figure 8A. Intent to leave the organization and employeevoice might be suitable for this purpose, assuming that theseconstructs had reflective indicators and that they were not causallyrelated. The resulting model would be identified, including theerror terms D1, D2, and D3. As shown in Figure 8B, in a situationin which there is only one path emanating from job satisfaction toa latent construct with reflective indicators, another way of achiev-ing identification would be to add a single reflective indicator (V4)of job satisfaction. An example of a potentially appropriate itemmight be “Overall, how satisfied are you with your job?” Becausethis new indicator captures overall job satisfaction rather than anyone of its individual facets, it is reflective in nature. Therefore,with the addition of this reflective indicator, the job satisfactionconstruct would now have two paths emanating from it and wouldbe identified (including D1 and D2).
A potentially more versatile method of achieving identification(illustrated in Figure 8C) would be to include two reflectiveindicators (V4 and V5) for the job satisfaction construct (e.g.,“Overall, how satisfied are you with your job?” and “Generallyspeaking, I am very satisfied with all facets of my job”). Theadvantage of having two reflective indicators is that it allows (a) aconfirmatory factor model to be estimated and (b) the job satis-
Figure 8. Alternative methods of achieving identification in formative-indicator measurement models. A:Achieving identification by emitting paths to two unrelated latent constructs with reflective indicators. B:Achieving identification by emitting one path to a reflective indicator and one path to a latent construct withreflective indicators. C: Achieving identification by emitting two paths to two theoretically appropriate reflectiveindicators.
726 MACKENZIE, PODSAKOFF, AND JARVIS

faction construct to occupy any position in a structural model (i.e.,endogenous or exogenous). In addition, it is important to note thatthe measurement model in Figure 8C should be viewed as a singlelatent construct with a mixture of formative and reflective indica-tors rather than as a single reflective-indicator latent construct withmultiple causes. This is a subtle but important conceptual distinc-tion that arises from the nature of the indicators. It makes sense tointerpret the structure in this way because the indicators (whetherreflective or formative in nature) all relate to the same conceptualdomain specified in the construct definition and are all content-valid operationalizations of the same construct. Indeed, this modelis analogous to the redundancy analysis model often used to assessthe validity of formative indicators in partial least squares analyses(cf. Chin, 1998).
A final decision that needs to be made when specifying modelsthat include constructs with formative indicators is how to handlethe covariances among the exogenous variables and constructs.Two ways have been proposed (cf. MacCallum & Browne, 1993):(a) Constrain all of the covariances among the exogenous latentconstructs and manifest variables to be equal to 0, or (b) followstandard practice and estimate the covariances among all exoge-nous latent constructs and manifest variables. The advantage of theformer approach is that model parsimony is not undermined by theaddition of a potentially large number of nonhypothesized paths,and as a result, the goodness-of-fit indices will be a better reflec-tion of the veracity of the hypothesized relationships. The advan-tage of the latter is that the overall fit of the model is notunnecessarily penalized for the covariances among the exogenousvariables that are due to factors outside of the model. Of these twoapproaches, we agree with MacCallum and Browne (1993) thatfreeing up all of the covariances is a better solution, because itwould be a very strong theoretical statement to assume that all ofthe exogenous variables are perfectly uncorrelated. Indeed, if thesecovariances were all fixed at 0, it would mean that any commoncauses of these variables that were outside of the system ofrelationships represented in the model would contribute to the lackof fit of the proposed model. For this reason, fixing the covariancesis not an acceptable solution to this problem.
Once the measurement model has been formally specified, thenext step is to collect data for the purposes of evaluating andpurifying the measures. The first step in purifying the measures isto estimate a confirmatory factor model and evaluate whether (a)the individual hypothesized measurement relationships are statis-tically significant, (b) the solution is proper, and (c) the relation-ships (as a group) are consistent with the sample data. Assumingthat these conditions are met, the validity and reliability of theindividual items and constructs can be evaluated. For reflectiveindicators, item validity is equal to �std.
2, and item reliability isequal to the squared multiple correlation coefficient when thespecific variance is equal to 0 (Bollen, 1989). These values are thesame when only one construct influences each measure, as in mostconfirmatory factor models. For formative indicators, item validityis reflected in the significance and strength of the path from theindicator to the composite latent construct. Multicollinearityamong the indicators poses the same problems in this case as itdoes in multiple regression models, because the relationships be-tween the indicators and the composite latent constructs are anal-ogous to a multiple regression in which the construct is thedependent variable and the indicators are the independent vari-
ables. In addition, it is important to note that it is not conceptuallyor empirically possible for one formative indicator to account for100% of the variance in the latent construct. It is not conceptuallypossible for a formative indicator to perfectly represent a compos-ite latent construct, because the construct is defined as being afunction of multiple distinct components or parts, so one indicatorcannot validly represent the entire conceptual domain. Moreover,it is not empirically possible for one indicator to account for all ofthe variance in the composite latent construct unless the indicatorsare perfectly correlated (which is unlikely to be the case). Themore indicators there are, the lower the average variance ac-counted for. Although we are not aware of any absolute standardsfor judging the absolute magnitudes of the item validities forformative indicators, the relative magnitudes can be comparedusing the standardized path coefficient.
Another possibility for assessing item validity for formativeindicators can be applied if the composite latent construct has atleast one reflective indicator that measures the overall compositelatent construct. This method uses the reflective indicator in muchthe same way that a criterion measure would be used to establishcriterion-related validity. The validity estimates for the formativeindicators of a composite latent construct are obtained by request-ing the standardized indirect effects from the structural equationmodeling program. This indirect effect is the estimate of theimpact of the formative indicator on the composite latent constructmultiplied by the estimate of the impact of the composite latentconstruct on the reflective indicator. In Figure 8B, this would berepresented by the indirect effect of V1 on V4. If more than onereflective indicator is available for the construct, the indirecteffects of a given formative indicator on each of the reflectiveindicators could be averaged to provide a more robust estimate ofthe indicator’s validity. This indirect effect represents the relation-ship between the formative indicator and an overall measure of theconstruct, and it can be viewed as an index of item validity if onecan assume that the overall measure is a valid criterion measure onthe basis of its content. Obviously, this technique puts a premiumon the content validity of the reflective indicators. If they areinvalid, then they cannot be used to provide evidence for itemvalidity.
For a reflective indicator, the item reliability is equal to the itemvalidity or the squared multiple correlation for the item as long asonly one latent construct causes each measure. Because itemreliability places an upper bound on item validity, it is desirable forthe squared multiple correlation for each item to be greater than.50. However, for formative indicators, it is difficult to obtain anestimate of item reliability. There is no squared multiple correla-tion coefficient for the item because the measurement model positsthat the item influences the latent construct rather than vice versa.Consequently, reliability must be assessed through other means.One possibility is to use a test–retest procedure, but this wouldonly be an appropriate index of reliability if the item is expected tobe stable over time (cf. Nunnally & Bernstein, 1994, p. 254).Interrater agreement can also be used as an index of item reliabilityfor some types of constructs (e.g., observable performance behav-iors). Still another possibility is to correlate each individual itemwith an alternative measure of the same specific aspect of theconstruct’s domain in a pretest and to use the correlation as anindex of reliability. Although not all of these methods can be usedfor every measure, hopefully at least one will be appropriate.
727MEASUREMENT MODEL MISSPECIFICATION

To purify the measures, one should eliminate items that fail tomeet the desired standards for validity and reliability discussedabove. However, in doing so, a few caveats are important. First, ifthe construct-level validity and reliability are good (see below), donot worry if a few of the individual-item reliabilities or validitiesdo not meet the desired standards. Only items with unacceptablylow validity or reliability should be eliminated (e.g., Hinkin, 1995;Nunnally & Bernstein, 1994; Spector, 1992). Second, althougheliminating the only item that taps an essential aspect of theconstruct domain is always potentially problematic, this is espe-cially important to keep in mind for composite latent constructs,because the formative indicators must provide a census of theconceptual domain, not just a sample of it (cf. Bollen & Lennox,1991).
Once item validity and reliability have been assessed, the nextstep is to evaluate construct-level validity. For constructs withreflective indicators, convergent validity can be assessed by theaverage variance in the items accounted for by the latent constructthey represent (cf. Fornell & Larcker, 1981). This can be calcu-lated by averaging the squared multiple correlations (or thesquared completely standardized loadings—�2s) for the con-struct’s measures. Fornell and Larcker (1981) have argued that fora construct to possess convergent validity, the majority of thevariance in its items (i.e., more than 50%) should be accounted forby the underlying construct rather than by measurement error. Forconstructs with formative indicators, convergent validity at theitem level is not relevant, because the composite latent constructmodel does not imply that the measures should necessarily becorrelated. Instead, assessments of construct validity should bebased on nomological or criterion-related validity (see below).
For constructs with reflective measures, construct-level reliabil-ity can be assessed with an estimate of internal consistency (e.g.,Cronbach’s alpha) or the somewhat different index of reliabilityproposed by Bagozzi (1980, p. 181). Generally speaking, theaccepted standard for these indices is .70 or above (Nunnally &Bernstein, 1994). For formative-indicator constructs, the conceptof internal consistency is not appropriate as a measure of reliabilitybecause the indicators are not assumed to be reflections of anunderlying latent variable. Indeed, as noted by Bollen and Lennox(1991), formative indicators may be negatively correlated, posi-tively correlated, or completely uncorrelated with each other. Con-sequently, Cronbach’s alpha and Bagozzi’s index should not beused to assess reliability and, if applied, may result in the omissionof indicators that are essential to the domain of the construct.
One way to assess discriminant validity that works for bothformative and reflective measures is to test whether the constructsare less than perfectly correlated. This test requires the scale ofmeasurement for each latent construct to be set by fixing itsvariance at 1, and it should be performed for one pair of constructsat a time. One could also test whether the construct intercorrelationis less than .71. This would test whether the constructs havesignificantly less than half of their variance in common. Both ofthese tests can be done by examining the confidence intervalaround the estimate. A more stringent test that can be used forreflective-indicator models is to examine whether the averagevariance extracted for each construct (�vc�) is greater than thesquare of the correlation between the constructs (cf. Fornell &Larcker, 1981). Conceptually, this test requires that each latentconstruct account for more of the variance in its own indicators
than it shares with another construct. This test should be performedfor one pair of constructs at a time by averaging the squaredmultiple correlations for each construct’s indicators (separately)and comparing these values to the square of the intercorrelationbetween the two constructs of interest.
Nomological validity can be assessed using the same procedure,regardless of whether constructs have formative or reflective in-dicators. Its assessment entails estimating the latent constructs andtesting whether their intercorrelations with hypothesized anteced-ents, correlates, and consequences are significantly greater than 0.Of course, for consistency, the magnitude of the correlations usedto establish nomological validity should be greater than the mag-nitude of the correlations used to establish discriminant validity.This type of validity can also be assessed by using groups withrecognized differences on the construct of interest and testingwhether the mean level of the construct differs across these groupsin the hypothesized direction. For example, if one is interested inassessing the validity of the measures of a quality-of-life construct,one could compare the scores of a group of people with knownquality-of-life deficits (e.g., chronic or extended illnesses) withthose of another group that does not possess these quality-of-lifedeficits to see if the scores of the two groups differ in the expecteddirection.
The final step in the scale development process is to cross-validate the psychometric properties of the scale. This is particu-larly important if model modifications were made in the scaledevelopment and refinement process. Regardless of whether themeasures are formative or reflective, either the multigroup ap-proach discussed by Steenkamp and Baumgartner (1998) or thestatistical technique developed by Browne and Cudeck (1989,1993) could be used to cross-validate the scale properties.
Conclusions
In conclusion, this research has shown that there are importantdistinctions between formative- and reflective-indicator measure-ment models. Several of the most commonly researched constructsin the field have formative measures that are incorrectly modeledas though they were reflective measures. This is a problem, be-cause as demonstrated by our Monte Carlo simulation, measure-ment model misspecification can inflate unstandardized structuralparameter estimates by as much as 400% or deflate them by asmuch as 80% and lead to either Type I or Type II errors ofinference, depending on whether the endogenous or the exogenousconstruct is misspecified. Moreover, the simulation results suggestthat there is a substantial probability that measurement modelmisspecification will not be detected with many of the mostcommonly used goodness-of-fit indices, with the exception of theRMSEA.
This research has several important implications. First, it sug-gests that some of the empirical findings reported in the literaturemay be misleading. Even our cursory review of the literaturesuggests that measurement model misspecification is not uncom-mon, and because this misspecification can lead to Type I andType II errors, we have reason to question the validity of thefindings of studies that failed to correctly model measurementrelationships. Thus, it appears that as Schwab (1980) predicted, thefailure to give adequate attention to construct validity and mea-surement model specification has probably led to substantive con-
728 MACKENZIE, PODSAKOFF, AND JARVIS

clusions about the relationships between constructs that are un-warranted. Although the extent to which this is true is difficult toevaluate without access to the actual data from studies in which themeasurement models have been misspecified, in our opinion, thiscould be a fairly serious problem for the field.
A second implication is that it is essential for researchers tothink carefully about the relationships between constructs and theirindicators and to make sure that these relationships are correctlymodeled. Indeed, our findings would suggest that a researcher’simplicit hypotheses about measurement relationships are as im-portant as his or her hypotheses about structural relationships andshould be tested empirically. To help with this, we have provideda set of criteria that can be used for deciding on the appropriatemeasurement model, and we have discussed the specification ofconstructs with formative indicators in some detail.
A final implication of our research that flows directly from theprevious work of Bollen and Lennox (1991) is that it needs to berecognized that some of the procedures for developing and eval-uating constructs with reflective indicators cannot be used forconstructs with formative indicators. Most of the recommendationsfor how to develop and evaluate measures are based on classicaltest theory and its assumption that the measures reflect the under-lying constructs they are intended to represent. However, thisassumption is not appropriate for formative measures. Therefore,we have provided a set of guidelines for developing, evaluating,and validating constructs with formative indicators, and we havecontrasted these recommendations with those for reflective indi-cators. Although additional refinements will undoubtedly have tobe made to our recommendations, we nevertheless believe thatthey represent a good first step in the development of a set ofprocedures that researchers can use for constructs with formativemeasures.
References
Anderson, J. C., & Gerbing, D. W. (1984). The effects of sampling error onconvergence, improper solutions, and goodness-of-fit indices for maxi-mum likelihood confirmatory factor analysis. Psychometrika, 49, 155–173.
Bacharach, S. B. (1989). Organizational theories: Some criteria for eval-uation. Academy of Management Review, 14, 496–515.
Bacharach, S. B., Bamberger, P. A., & Sonnenstuhl, W. J. (2002). Drivento drink: Managerial control, work-related risk factors, and employeeproblem drinking. Academy of Management Journal, 45, 637–658.
Bagozzi, R. P. (1980). Causal models in marketing. New York: Wiley.Bass, B. M. (1985). Leadership and performance beyond expectations.
New York: Free Press.Bass, B. M. (1998). Transformational leadership: Industrial, military, and
educational impact. Mahwah, NJ: Erlbaum.Baum, J. R., Locke, E. A., & Smith, K. G. (2001). A multidimensional
model of venture growth. Academy of Management Journal, 44, 292–303.
Bearden, W. D., Sharma, S., & Teel, J. E. (1982). Sample size effects onchi-square and other statistics used in evaluating causal models. Journalof Marketing Research, 24, 283–291.
Blalock, H. M., Jr. (1964). Causal inferences in nonexperimental research.New York: Norton.
Bollen, K. A. (1984). Multiple indicators: Internal consistency or nonecessary relationship? Quality and Quantity, 18, 377–385.
Bollen, K. A. (1989). Structural equations with latent variables. NewYork: Wiley.
Bollen, K. A. (1990). Overall fit in convariance structure models: Twotypes of sample size effects. Psychological Bulletin, 107, 256–259.
Bollen, K. A., & Lennox, R. (1991). Conventional wisdom on measure-ment: A structural equation perspective. Psychological Bulletin, 110,305–314.
Borman, W. C., & Motowidlo, S. J. (1993). Expanding the criteriondomain to include elements of contextual performance. In N. Schmitt,W. C. Borman, & Associates (Eds.), Personnel selection in organiza-tions (pp. 71–98). San Francisco: Jossey-Bass.
Browne, M. W., & Cudeck, R. (1989). Single sample cross-validationindices for covariance structures. Multivariate Behavioral Research, 24,445–455.
Browne, M. W., & Cudeck, R. (1993). Alternative ways of assessing modelfit. In K. A. Bollen & J. S. Long (Eds.), Testing structural equationmodels (pp. 136–162). Newbury Park, CA: Sage.
Bycio, P., Hackett, R. D., & Allen, J. S. (1995). Further assessments ofBass’s (1985) conceptualization of transactional and transformationalleadership. Journal of Applied Psychology, 80, 468–478.
Chin, W. W. (1998). The partial least squares approach to structuralequation modeling. In G. A. Marcoulides (Ed.), Modern methods forbusiness research (pp. 295–336). Mahwah, NJ: Erlbaum.
Churchill, G. A., Jr. (1979). A paradigm for developing better measures ofmarketing constructs. Journal of Marketing Research, 16, 64–73.
Cohen, J. (1988). Statistical power analysis for the behavioral sciences.Hillsdale, NJ: Erlbaum.
Cohen, J. (1992). A power primer. Psychological Bulletin, 112, 155–159.Colquitt, J. A. (2001). On the dimensionality of organizational justice: A
construct validation of a measure. Journal of Applied Psychology, 86,386–400.
Cook, T. D., & Campbell, D. T. (1979). Quasi-experimentation: Designand analysis issues for field studies. Boston: Houghton Mifflin.
Demerouti, E., Bakker, A. B., Nachreiner, F., & Schaufeli, W. B. (2001).The job demands–resources model of burnout. Journal of Applied Psy-chology, 86, 499–512.
Fornell, C., & Larcker, D. F. (1981). Evaluating structural equation modelswith unobservable variables and measurement error. Journal of Market-ing Research, 18, 39–50.
Geyer, A. L. J., & Steyrer, J. M. (1998). Transformational leadership andobjective performance in banks. Applied Psychology: An InternationalReview, 47, 397–420.
Hinkin, T. R. (1995). A review of scale development practices in the studyof organizations. Journal of Management, 21, 967–988.
Holtom, B. C., Lee, T. W., & Tidd, S. T. (2002). The relationship betweenwork status congruence and work-related attitudes and behaviors. Jour-nal of Applied Psychology, 87, 903–915.
Hom, P. W., & Kinicki, A. J. (2001). Toward and greater understanding ofhow dissatisfaction drives employee turnover. Academy of ManagementJournal, 44, 975–987.
Hu, L., & Bentler, P. M. (1998). Fit indices in covariance structuremodeling: Sensitivity to underparameterized model misspecification.Psychological Methods, 3, 424–453.
Hu, L., & Bentler, P. M. (1999). Cutoff criteria for fit indexes in covariancestructure analysis: Conventional criteria versus new alternatives. Struc-tural Equation Modeling, 6, 1–55.
Law, K. S., & Wong, C. S. (1999). Multidimensional constructs in struc-tural equation analysis: An illustration using the job perception and jobsatisfaction constructs. Journal of Management, 25, 143–160.
MacCallum, R. C., & Browne, M. W. (1993). The use of causal indicatorsin covariance structure models: Some practical issues. PsychologicalBulletin, 114, 533–541.
MacCorquodale, K., & Meehl, P. E. (1948). On a distinction betweenhypothetical constructs and intervening variables. Psychological Review,55, 95–107.
MacKenzie, S. B., Podsakoff, P. M., & Ahearne, M. (1998). Antecedents
729MEASUREMENT MODEL MISSPECIFICATION

and consequences of in-role and extra-role performance. Journal ofMarketing, 62, 87–98.
Masterson, S. S. (2001). A trickle-down model of organizational justice:Relating employees’ and customers’ perceptions of and reactions tofairness. Journal of Applied Psychology, 86, 594–604.
Mitchell, T. R., Holtom, B. C., Lee, T. W., Sablynski, C. J., & Erez, M.(2001). Why people stay: Using job embeddedness to predict voluntaryturnover. Academy of Management Journal, 44, 1102–1121.
Moorman, R. H. (1991). Relationship between organizational justice andorganizational citizenship behaviors: Do fairness perceptions influenceemployee citizenship? Journal of Applied Psychology, 76, 845–855.
Motowidlo, S. J. (2000). Some basic issues related to contextual perfor-mance and organizational citizenship behavior in human behavior. Hu-man Resource Management Review, 10, 115–126.
Nunnally, J. C., & Bernstein, I. H. (1994). Psychometric theory (3rd ed.).New York: McGraw-Hill.
Organ, D. W. (1988). Organizational citizenship behavior: The goodsoldier syndrome. Lexington, MA: Lexington Books.
Podsakoff, P. M., MacKenzie, S. B., Moorman, R., & Fetter, R. (1990).The impact of transformational leader behaviors on employee trust,satisfaction, and organizational citizenship behaviors. Leadership Quar-terly, 1, 107–142.
Scandura, T. A., & Williams, E. A. (2000). Research methodology inmanagement: Current practices, trends, and implications for future re-search. Academy of Management Journal, 4, 1248–1264.
Schwab, D. P. (1980). Construct validity in organizational behavior. InB. M. Staw & L. L. Cummings (Eds.), Research in OrganizationalBehavior (Vol. 2, pp. 3–43). Greenwich, CT: JAI Press.
Spector, P. E. (1992). Summated rating scales: An introduction. NewburyPark, CA: Sage.
Steenkamp, J.-B. E. M., & Baumgartner, H. (1998). Assessing measure-ment invariance in cross-national consumer research. Journal of Con-sumer Research, 25, 78–90.
Tracey, J. B., & Hinkin, T. R. (1998). Transformational leadership oreffective managerial practices? Group and Organization Management,23, 220–236.
Wong, C. S., & Law, K. S. (2002). The effects of leader and followeremotional intelligence on performance and attitude: An exploratorystudy. Leadership Quarterly, 13, 243–274.
Received July 30, 2003Revision received July 28, 2004
Accepted August 24, 2004 �
730 MACKENZIE, PODSAKOFF, AND JARVIS