Building Machine Learning Algorithms on Apache Spark with William Benton
Upload
insembleCategory
view
228download
4
Machine Learning with Big Data
using Apache SparkMukundan Agaram
Amit Singh

Agenda
Machine Learning Concepts1
Econometrics Model for Recession PredictionApache Spark Code Review
4
Platform & Data 3
Prevalent Use Cases2
Other ML Concepts and Wrap UpQA
5

What is Machine Learning
• Branch of AI
– Alan Turing – can machines think???
– “Field of study that gives Computers the ability to learn without
being explicitly programmed” – Arthur Samuel
• Learn from data
• Improve with experience
• Iteratively refine a model that can be used to predict outcomes of
questions based on previous learning
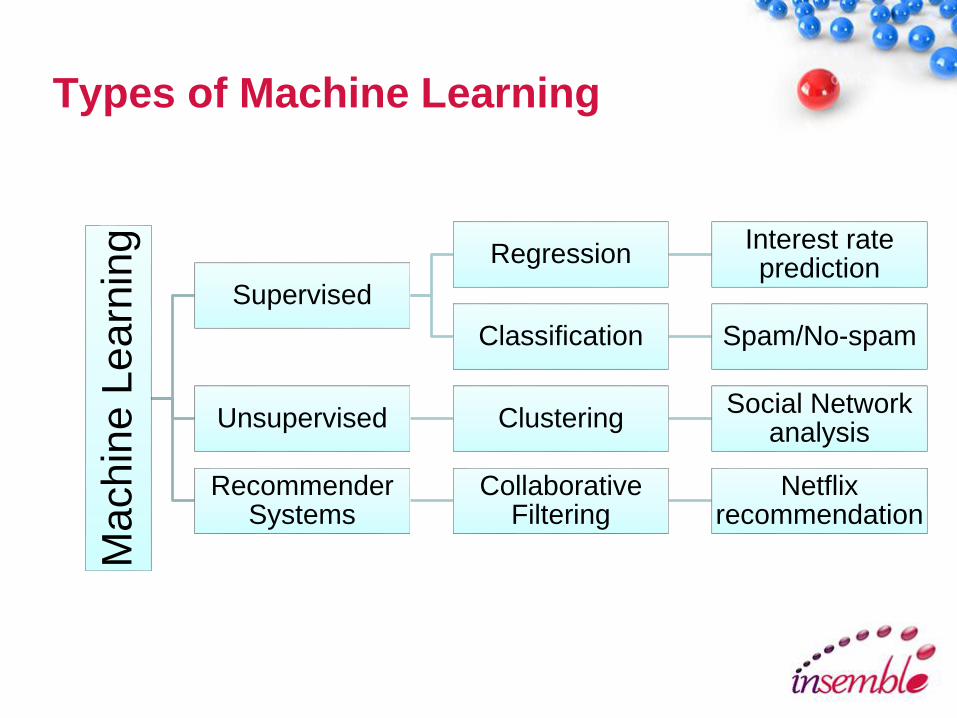
Types of Machine LearningM
ach
ine L
ea
rnin
g
Supervised
RegressionInterest rate prediction
Classification Spam/No-spam
Unsupervised ClusteringSocial Network
analysis
Recommender Systems
Collaborative Filtering
Netflix recommendation

Prevalent Use Cases
• Spam Detection – Google Gmail
• Voice Recognition – Apple Siri
• Stock Trading– High Frequency
– Recommendation Systems
– Algorithmic Trading
• Robotics– Acquire skills – grasping objects, locomotion, automated driving and navigation
• Medicine and Healthcare– Healthcare Analytics, Prediction based on Genomes, Health sensor analysis
• Advertising:– Targeted Advertising based on interests and social media
• Retail and E Commerce: – Frequency club cards, targeting coupons and promotions
– Recommendation Engines

Use Cases
• Gaming Analytics– Predictive Analytics for Sports Games, Console based gaming profiles, upsell and
targeting in-app purchases and mods
• Internet of Things– Large scale sensor data analysis for prediction, classification
• Social Network Analysis
– Facebook, LinkedIn
• Astronomy
– Galaxy formation

Languages and Platforms
• Apache Spark – MLlib
– Scala, Java, Python
• Mahout
• Python Libraries
– Scikit-learn, PyML, PyBrain, matplotlib
• R
– Open Source statistical programming language
• Matlab
• SAS
• Weka
• Octave
• Clojure

Apache Spark

Data Repositories
• UC Irvine Machine Learning Repository
• Infochimps
• Kaggle
• FRED – Federal Reserve Board in Kansas
• Many others...

Logistic Regression (Linear)
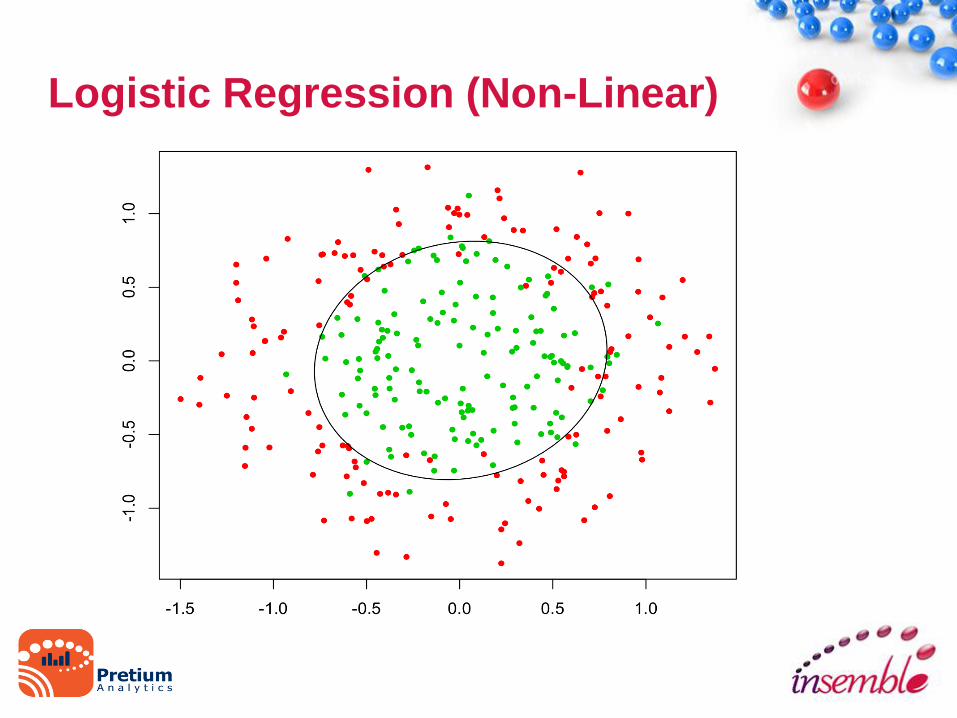
Logistic Regression (Non-Linear)

Logistic Regression

Model Design
• Data Collection
–Identify key inputs to the model
• Data Transformation and Curation
–Human ‘analyst’ should be able to view the data sets make predictions
–Data needs to be cleaned, scrubbed, transformed – normalized
–Generally most important step for any type of supervised learning
algorithm
• Review the data
• Visually make predictions of individual learning indicators

Sample Econometrics Model
• Objective: Predict Economic Conditions (Growth/Recession)
• Supervised Learning
• Widely used algorithms
• Logistic Regression
• SVM
• RandomForest (Decision Trees)
• Current Challenges– Forecasts are either too early – 6-12 months before contraction starts
– Forecasts are too late and reported by NBER (National Bureau of Economic
Research) after recession has started
– Individuals and Corporations cannot plan effectively based on prevailing economic
conditions
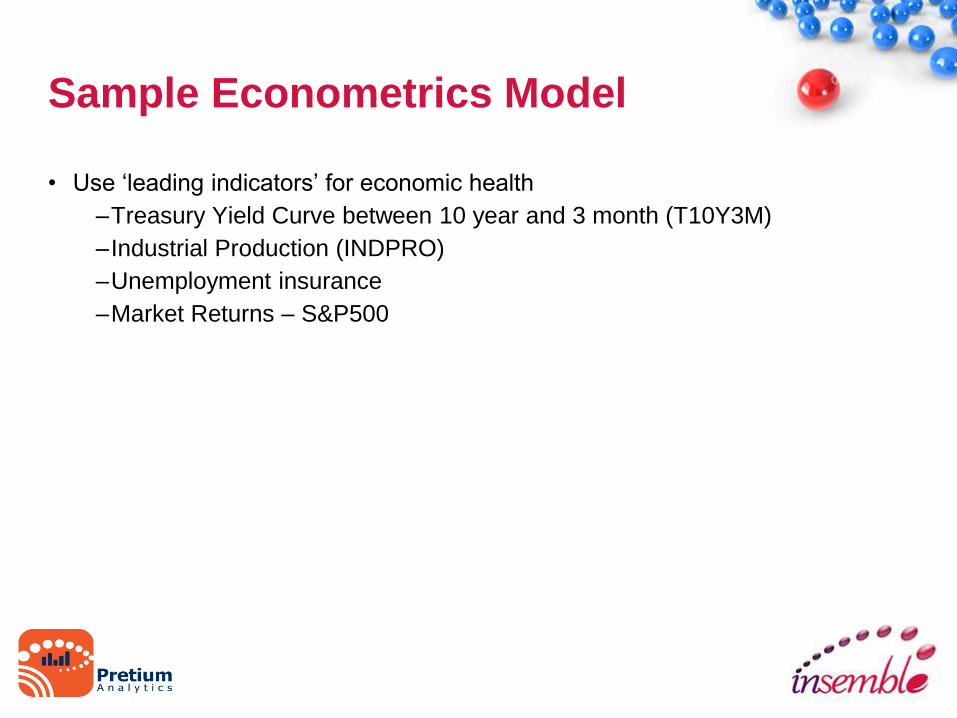
Sample Econometrics Model
• Use ‘leading indicators’ for economic health
–Treasury Yield Curve between 10 year and 3 month (T10Y3M)
–Industrial Production (INDPRO)
–Unemployment insurance
–Market Returns – S&P500

Data Transformation and Curation
-3.
-1.5
0.
1.5
3.
2/2/1986 7/2/1988 12/2/1990 5/2/1993 10/2/1995 3/2/1998 8/2/2000 1/2/2003 6/2/2005 11/2/2007 4/2/2010 9/2/2012 2/2/2015 7/2/2017
Treasury Yield Curve - Normalized
T10Y3M Recession (1/0 - Y/N)

Data Transformation and Curation
-13.5
-9.
-4.5
0.
4.5
2/2/1986 7/2/1988 12/2/1990 5/2/1993 10/2/1995 3/2/1998 8/2/2000 1/2/2003 6/2/2005 11/2/2007 4/2/2010 9/2/2012 2/2/2015 7/2/2017
Industrial Production - Normalized
Frequency: MonthlyINDPRO
Frequency: MonthlyRecession (1/0 - Y/N)

Data Transformation and Curation
-0.875
-0.4375
0.
0.4375
0.875
1.3125
2/2/1986 9/2/1988 4/2/1991 11/2/1993 6/2/1996 1/2/1999 8/2/2001 3/2/2004 10/2/2006 5/2/2009 12/2/2011 7/2/2014 2/2/2017
Unemployment Insurance - Normalized
Frequency: MonthlyCCSA
Frequency: MonthlyRecession (1/0 - Y/N)

Data Transformation and Curation
-3.
-1.5
0.
1.5
3.
2/2/1986 9/2/1988 4/2/1991 11/2/1993 6/2/1996 1/2/1999 8/2/2001 3/2/2004 10/2/2006 5/2/2009 12/2/2011 7/2/2014 2/2/2017
S&P500 - Normalized
Frequency: MonthlyS&P500 - Norm
Frequency: MonthlyRecession (1/0 - Y/N)

Data Plots in Spark Shell
• Data Plots in Spark Shell (Demo)

Bias versus Variance

Model Training and Testing
• Model Data should be divided into
Training
Cross Validation
Testing set
• Splitting into these 3 helps improve model performance in
real world by eliminating bias and variance and helps get
model closer to optimal results
• More features does not necessarily mean a better prediction
• MLlib provides API to help with these operations

Model Performance Measurements
• Precision
• Recall
• F1 Score
• Confusion Matrix
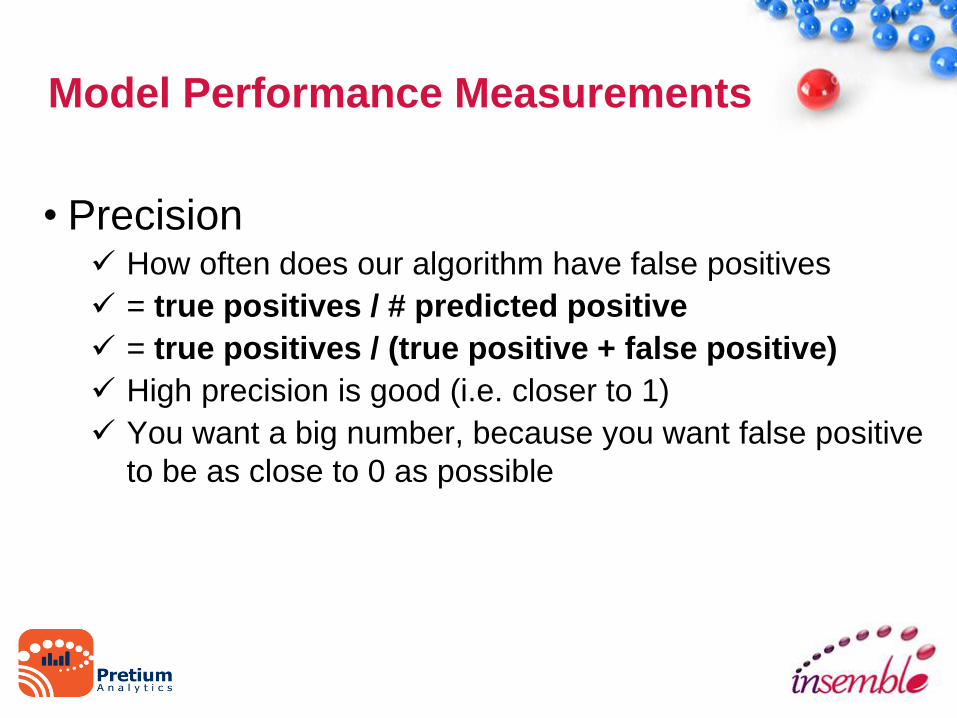
Model Performance Measurements
• Precision How often does our algorithm have false positives
= true positives / # predicted positive
= true positives / (true positive + false positive)
High precision is good (i.e. closer to 1)
You want a big number, because you want false positive
to be as close to 0 as possible

Model Performance Measurements
• Recall
How sensitive is our algorithm?
Of all patients in set that actually have cancer, what
fraction did we correctly detect
= true positives / # actual positives
= true positive / (true positive + false negative)
• High recall is good (i.e. closer to 1)
• You want a big number, because you want false negative to
be as close to 0 as possible

Model Performance Measurements
F1Score (fscore)
• = 2 * (PR/ [P + R])
• Fscore is like taking the average of precision and recall
giving a higher weight to the lower value
Model Results and Code Review
• Logistic Regression
• SVM
• Random Forest

Apache Spark MLlib
• Algorithms Supported:
–Linear SVM
–Logistic Regression SGD
–Classification and Regression Tree
–K-Means Clustering
–Recommendation versus alternating mean squares
–Singular Value Decomposition
–Linear Regression with L1 and L2 Regularization
–Multinomial Naïve Bayes
–Basic Statistics
–Feature Transformations
Unsupervised Learning
• K Means Clustering
– Customer Segmentation
– Social Network Analysis
– Computer Data Center Analysis
– Astronomical Galaxy formations
• Recommendation Engines

Unsupervised Learning – K Means

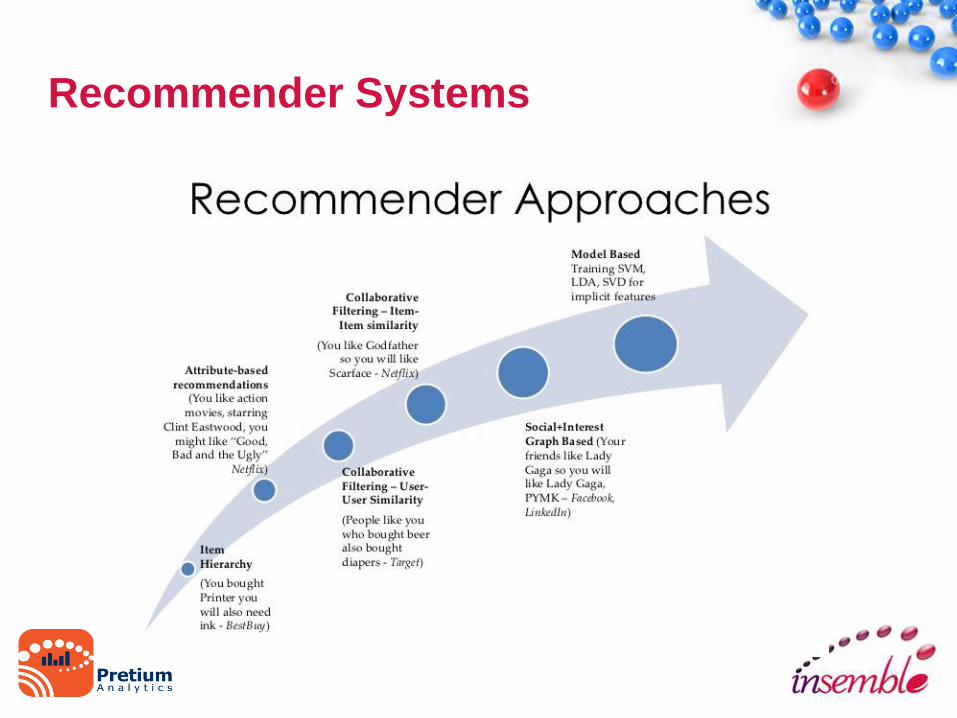
Recommender Systems
• Class of information filtering system that
predicts the ‘rating’ or ‘preference’ user
would give to an item
• Examples:
– NetFlix
– Amazon
– Apple Genius

Recommender
• Collaborative Filtering
– User-User
– Item-Item
Recommender Systems

Q/A