Machine learning meetup
62
Location: QuantUniversity Meetup August 24 th 2016 Boston MA Machine Learning: An intuitive foundation 2016 Copyright QuantUniversity LLC. Presented By: Sri Krishnamurthy, CFA, CAP www.QuantUniversity.com [email protected]
-
Upload
quantuniversity -
Category
Data & Analytics
-
view
322 -
download
0
Transcript of Machine learning meetup

Location:
QuantUniversity Meetup
August 24th 2016
Boston MA
Machine Learning: An intuitive foundation
2016 Copyright QuantUniversity LLC.
Presented By:
Sri Krishnamurthy, CFA, CAP
www.QuantUniversity.com

2
Slides and Code will be available at: http://www.analyticscertificate.com

- Analytics Advisory services- Custom training programs- Architecture assessments, advice and audits
• Founder of QuantUniversity LLC. and www.analyticscertificate.com
• Advisory and Consultancy for Financial Analytics• Prior Experience at MathWorks, Citigroup and
Endeca and 25+ financial services and energy customers.
• Regular Columnist for the Wilmott Magazine• Author of forthcoming book
“Financial Modeling: A case study approach”published by Wiley
• Charted Financial Analyst and Certified Analytics Professional
• Teaches Analytics in the Babson College MBA program and at Northeastern University, Boston
Sri KrishnamurthyFounder and CEO
4

5
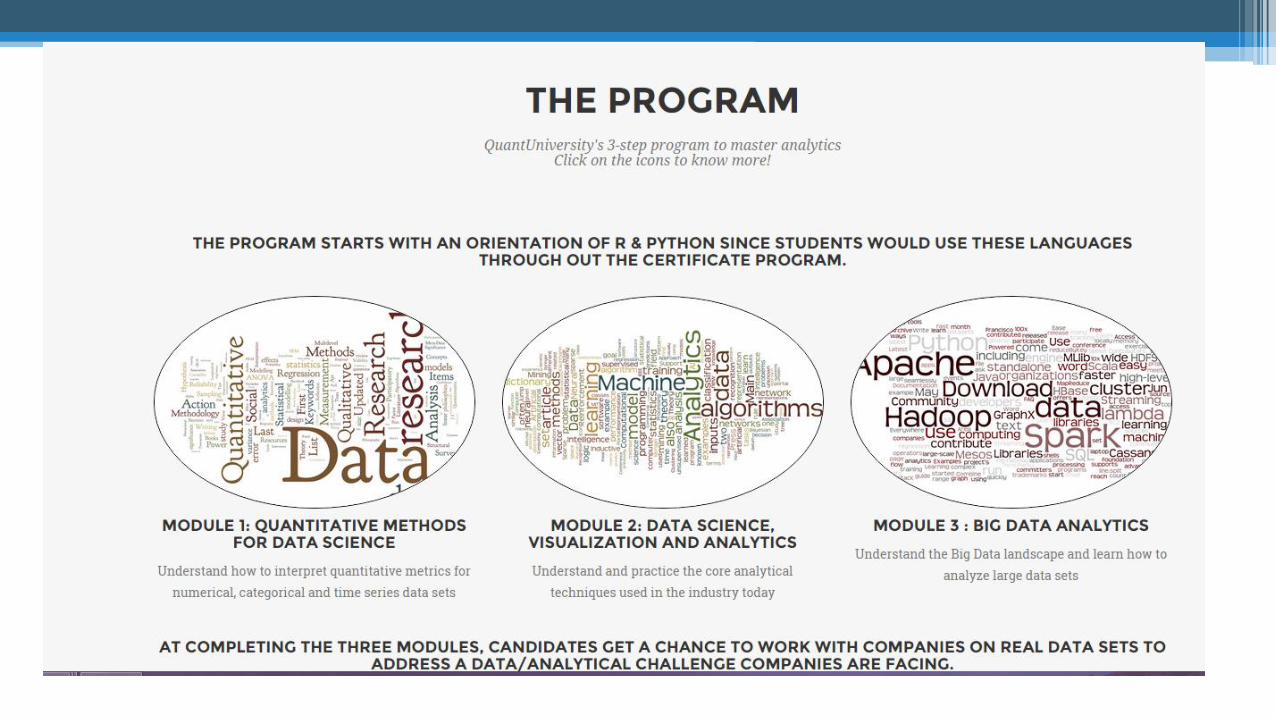
Quantitative Analytics and Big Data Analytics Onboarding
• Trained more than 500 students in Quantitative methods, Data Science and Big Data Technologies using MATLAB, Python and R
• Launching the Analytics Certificate Program in September

7
Quantitative Analytics and Big Data Analytics Onboarding
• Apply at: www.analyticscertificate.com
• Program starting September 18th
• Module 1:▫ Sep 18th , 25th , Oct 2nd, 9th
• Module 2:▫ Oct 16th , 23th , 30th, Nov 6th
• Module 3:▫ Nov 13th, 20th, Dec 4th, Dec 11th
• Capstone + Certification Ceremony▫ Dec 18th

8
• September▫ 11th, 12th : Spark Workshop, Boston
www.analyticscertificate.com/SparkWorkshop
Sponsored by IBM
▫ 19th, 20th : Anomaly Detection Workshop, New York www.analyticscertificate.com/AnomalyNYC
Sponsored by Microsoft
Events of Interest

9

Agenda
1. Data
2. Goals
3. Machine learning algorithms
4. Process
5. Performance Evaluation

11

Dataset, variable and Observations
Dataset: A rectangular array with Rows as observations and columns as variablesVariable: A characteristic of members of a population ( Age, State etc.)Observation: List of Variable values for a member of the population

Variables
A variable could be:
Categorical Yes/No flags
AAA,BB ratings for bonds
Numerical 35 mpg
$170K salary

Datasets
• Longitudinal▫ Observations are dependent
▫ Temporal-continuity is required
• Cross-sectional▫ Observations are independent

15
Data
Cross sectional
Numerical Categorical
Longitudinal
Numerical
Summary
16

17
• Descriptive Statistics▫ Goal is to describe the data at hand
▫ Backward looking
▫ Statistical techniques employed here
• Predictive Analytics▫ Goal is to use historical data to build a model for prediction
▫ Forward looking
▫ Machine learning techniques employed here
Goal

18
• How do you summarize numerical variables ?
• How do you summarize categorical variables ?
• How do you describe variability in numerical variables ?
• How do you summarize relationships between categorical and numerical variables ?
• How do you summarize relationships between 2 numerical variables?
Descriptive Statistics – Cross sectional datasets
See Data Analysis Taxonomy.xlsx

19
• Goal is to extract the various components
Longitudinal datasets

20
• Given a dataset, build a model that captures the similarities in different observations and assigns them to different buckets.
• Given a set of variables, predict the value of another variable in a given data set▫ Predict Salaries given work experience, education etc.
▫ Predict whether a loan would be approved given fico score, current loans, employment status etc.
Predictive Analytics : Cross sectional datasets

21
• Given a time series dataset, build a model that can be used to forecast values in the future
Predictive Analytics : Time series datasets

22
Goal
Descriptive Statistics
Cross sectional
Numerical CategoricalNumerical vs Categorical
Categorical vs Categorical
Numerical vs Numerical
Time series
Predictive Analytics
Cross-sectional
Segmentation Prediction
Predict a number
Predict a category
Time-series
Summary

23

24
Machine Learning Algorithms
Goal
Descriptive Statistics
Cross sectional
Numerical CategoricalNumerical vs Categorical
Categorical vs Categorical
Numerical vs Numerical
Time series
Predictive Analytics
Cross-sectional
Segmentation Prediction
Predict a number
Predict a category
Time-series

25
• Supervised Algorithms▫ Given a set of variables 𝑥𝑖, predict the value of another variable 𝑦 in a
given data set such that
▫ If y is numeric => Prediction
▫ If y is categorical => Classification
Machine Learning
x1,x2,x3… Model F(X) y

26
• Unsupervised Algorithms▫ Given a dataset with variables 𝑥𝑖, build a model that captures the
similarities in different observations and assigns them to different buckets => Clustering
Machine Learning
Obs1, Obs2,Obs3
etc.Model
Obs1- Class 1
Obs2- Class 2
Obs3- Class 1

27
Supervised Learning algorithms
Parametric models
Non-Parametric models
Supervised learning Algorithms - Prediction

28
• Parametric models▫ Assume some functional form
▫ Fit coefficients
• Examples : Linear Regression, Neural Networks
Supervised Learning models - Prediction
𝑌 = 𝛽0 + 𝛽1𝑋1
Linear Regression Model Neural network Model

29
• Non-Parametric models▫ No functional form assumed
• Examples : K-nearest neighbors, Decision Trees
Supervised Learning models
K-nearest neighbor Model Decision tree Model

• Given estimates መ𝛽0, መ𝛽1, … , መ𝛽𝑝We can make predictions using the
formula
ො𝑦 = መ𝛽0 + መ𝛽1𝑥1 + መ𝛽2𝑥2 +⋯+ መ𝛽𝑝𝑥𝑝• The parameters are estimated using the least squares approach to
minimize the sum of squared errors
𝑅𝑆𝑆 =
𝑖=1
𝑛
(𝑦𝑖 − ො𝑦𝑖)2
Multiple linear regression
30

31
• Parametric models▫ Assume some functional form
▫ Fit coefficients
• Examples : Logistic Regression, Neural Networks
Supervised Learning models - Classification
Logistic Regression Model Neural network Model

32
• Non-Parametric models▫ No functional form assumed
• Examples : K-nearest neighbors, Decision Trees
Supervised Learning models
K-nearest neighbor Model Decision tree Model

33
• Unsupervised Algorithms▫ Given a dataset with variables 𝑥𝑖, build a model that captures the
similarities in different observations and assigns them to different buckets => Clustering
Machine Learning
Obs1, Obs2,Obs3
etc.Model
Obs1- Class 1
Obs2- Class 2
Obs3- Class 1

K-means clustering• These methods partition the data into k clusters by assigning each data point to
its closest cluster centroid by minimizing the within-cluster sum of squares (WSS), which is:
𝑘=1
𝐾
𝑖∈𝑆𝑘
𝑗=1
𝑃
(𝑥𝑖𝑗 − 𝜇𝑘𝑗)2
where 𝑆𝑘 is the set of observations in the kth cluster and 𝜇𝑘𝑗 is the mean of jth
variable of the cluster center of the kth cluster.
• Then, they select the top n points that are the farthest away from their nearest cluster centers as outliers.
34

35
Anomaly Detection vs Unsupervised Learning

36
Distance functions• Euclidean distance:

37
Distance functions• Manhattan distance:
D =|𝑋𝐴- 𝑋𝐵|+ |𝑌𝐴- 𝑌𝐵|

38
Distance functions• Correlation distance:

39
Machine Learning Algorithms
Machine Learning
Supervised
Prediction
Parametric
Linear Regression
Neural Networks
Non-parametric
KNN Decision Trees
Classification
Parametric
Logistic Regression
Neural Networks
Non Parametric
Decision Trees KNN
Unsupervised algorithms
K-meansAssociative rule mining

40

41
The Process
Data cleansing
Feature Engineering
Training and Testing
Model building
Model selection

42
• What transformations do I need for the x and y variables ?
• Which are the best features to use?▫ Dimension Reduction – PCA
▫ Best subset selection Forward selection
Backward elimination
Stepwise regression
Feature Engineering

43
Data
Training 80%
Testing 20%
Training the model

44

45
Evaluating Machine learning algorithms
Supervised -Prediction
R-square RMS MAE MAPE
Supervised-Classification
Confusion Matrix
ROC Curves
Evaluation framework

46
• The prediction error for record i is defined as the difference between its actual y value and its predicted y value
𝑒𝑖 = 𝑦𝑖 − ො𝑦𝑖
• 𝑅2 indicates how well data fits the statistical model
𝑅2 = 1 −σ𝑖=1𝑛 (𝑦𝑖 − ො𝑦𝑖)
2
σ𝑖=1𝑛 (𝑦𝑖 − ത𝑦𝑖)
2
Prediction Accuracy Measures

47
• Fit measures in classical regression modeling:• Adjusted 𝑅2 has been adjusted for the number of predictors. It increases only
when the improve of model is more than one would expect to see by chance (p is the total number of explanatory variables)
𝐴𝑑𝑗𝑢𝑠𝑡𝑒𝑑 𝑅2 = 1 −Τσ𝑖=1
𝑛 (𝑦𝑖 − ො𝑦𝑖)2 (𝑛 − 𝑝 − 1)
σ𝑖=1𝑛 𝑦𝑖 − ത𝑦𝑖
2 /(𝑛 − 1)
• MAE or MAD (mean absolute error/deviation) gives the magnitude of the average absolute error
𝑀𝐴𝐸 =1
𝑛σ𝑖=1𝑛 𝑒𝑖
Prediction Accuracy Measures

48
▫ MAPE (mean absolute percentage error) gives a percentage score of how predictions deviate on average
𝑀𝐴𝑃𝐸 =1
𝑛σ𝑖=1𝑛 𝑒𝑖/𝑦𝑖
× 100%
• RMSE (root-mean-squared error) is computed on the training and validation data
𝑅𝑀𝑆𝐸 = 1/𝑛𝑖=1
𝑛
𝑒𝑖2
Prediction Accuracy Measures

49
• Consider a two-class case with classes 𝐶0 and 𝐶1• Classification matrix:
Classification matrix
Predicted Class
Actual Class 𝐶0 𝐶1
𝐶0𝑛0,0= number of 𝐶0 cases classified correctly
𝑛0,1= number of 𝐶0 cases classified incorrectly as 𝐶1
𝐶1𝑛1,0= number of 𝐶1 cases classified incorrectly as 𝐶0
𝑛1,1= number of 𝐶1 cases classified correctly

50
• Estimated misclassification rate (overall error rate) is a main accuracy measure
𝑒𝑟𝑟 =𝑛0,1 + 𝑛1,0
𝑛0,0 + 𝑛0,1 + 𝑛1,0 + 𝑛1,1=𝑛0,1 + 𝑛1,0
𝑛
• Overall accuracy:
𝐴𝑐𝑐𝑢𝑟𝑎𝑐𝑦 = 1 − 𝑒𝑟𝑟 =𝑛0,0 + 𝑛1,1
𝑛
Accuracy Measures

51
• The ROC curve plots the pairs {sensitivity, 1-specificity} as the cutoff value increases from 0 and 1
• Sensitivity (also called the true positive rate, or the recall in some fields) measures the proportion of positives that are correctly identified (e.g., the percentage of sick people who are correctly identified as having the condition).
• Specificity (also called the true negative rate) measures the proportion of negatives that are correctly identified as such (e.g., the percentage of healthy people who are correctly identified as not having the condition).
• Better performance is reflected by curves that are closer to the top left corner
ROC Curve

Agenda
1. Data
2. Goals
3. Machine learning algorithms
4. Process
5. Performance Evaluation

53
Data
Cross sectional
Numerical Categorical
Longitudinal
Numerical
Handling Data

54
Goal
Descriptive Statistics
Cross sectional
Numerical CategoricalNumerical vs Categorical
Categorical vs Categorical
Numerical vs Numerical
Time series
Predictive Analytics
Cross-sectional
Segmentation Prediction
Predict a number
Predict a category
Time-series
Goal

55
Machine Learning Algorithms
Machine Learning
Supervised
Prediction
Parametric
Linear Regression
Neural Networks
Non-parametric
KNN Decision Trees
Classification
Parametric
Logistic Regression
Neural Networks
Non Parametric
Decision Trees KNN
Unsupervised algorithms
K-meansAssociative rule mining

56
The Process
Data cleansing
Feature Engineering
Training and Testing
Model building
Model selection

57
Evaluating Machine learning algorithms
Supervised -Prediction
R-square RMS MAE MAPE
Supervised-Classification
Confusion Matrix
ROC Curves
Evaluation framework


61
Q&A
Slides, code and details about the Apache Spark Workshopat: http://www.analyticscertificate.com/SparkWorkshop/

Thank you!Members & Sponsors!
Sri Krishnamurthy, CFA, CAPFounder and CEO
QuantUniversity LLC.
srikrishnamurthy
www.QuantUniversity.com
Contact
Information, data and drawings embodied in this presentation are strictly a property of QuantUniversity LLC. and shall not bedistributed or used in any other publication without the prior written consent of QuantUniversity LLC.
62