MACHINE LEARNING APPLICATIONS IN EMERGENCY …
106
MACHINE LEARNING APPLICATIONS IN EMERGENCY MANAGEMENT by Dixizi Liu, M.S. A thesis submitted to the Graduate Council of Texas State University in partial fulfillment of the requirements for the degree of Master of Science with a Major in Engineering August 2021 Committee Members: Zhijie (Sasha) Dong, Chair Damian Valles Molina Lawrence Fulton
Transcript of MACHINE LEARNING APPLICATIONS IN EMERGENCY …
MACHINE LEARNING APPLICATIONS IN EMERGENCY MANAGEMENT
by
Dixizi Liu, M.S.
A thesis submitted to the Graduate Council of
Texas State University in partial fulfillment
of the requirements for the degree of
Master of Science
with a Major in Engineering
August 2021
Committee Members:
Zhijie (Sasha) Dong, Chair
Damian Valles Molina
Lawrence Fulton

COPYRIGHT
by
Dixizi Liu
2021
FAIR USE AND AUTHOR’S PERMISSION STATEMENT
Fair Use
This work is protected by the Copyright Laws of the United States (Public Law 94-553,
section 107). Consistent with fair use as defined in the Copyright Laws, brief quotations
from this material are allowed with proper acknowledgement. Use of this material for
financial gain without the author’s express written permission is not allowed.
Duplication Permission
As the copyright holder of this work I, Dixizi Liu, authorize duplication of this work, in
whole or in part, for educational or scholarly purposes only.
DEDICATION
To my dear family and friends. I could not have made this far without you. The
year of 2021 is a very unique yet meaningful year to me. I am so grateful for your
unfailing support and continuous encouragement throughout my years of study at Texas
State University.
v
ACKNOWLEDGEMENTS
Foremost, I would like to express my sincere gratitude to my advisor Dr. Zhijie
(Sasha) Dong, Ph.D., Assistant Professor in the Ingram School of Engineering at Texas
State University, for the continuous support of my master’s study and research, for her
patience, motivation, enthusiasm, and immense knowledge. Her guidance helped me in
all the time of research and writing of this thesis. She has also taught me the methodology
to carry out the research and to present the research works as clear as possible. I am
extremely grateful for her trust, insightful ideas, and constructive criticisms to help me
enhance the quality of my thesis.
Besides my advisor, I would like to deeply gratitude to the rest of my thesis
committee: Dr. Damian Valles Molina, Ph.D., Assistant Professor in the Ingram School
of Engineering at Texas State University, and Dr. Lawrence Fulton, Ph.D., Associate
Professor of Health Administration at Texas State University, for their continued support,
insightful comments, and encouragement throughout my research. They have also been a
source of inspiration in optimizing machine learning models and improve emergency
management. I offer my sincere appreciation for the learning opportunities provided by
my committee.
My sincere thanks also go to Dr. Vishu Viswanathan, Ph.D., Professor in the
Ingram School of Engineering at Texas State University, for his advice, continued
support, and dedication during my master’s study at Texas State University.
I also would like to express my special thanks to Dr. Tongdan Jin, Ph.D.,

vi
Professor in the Ingram School of Engineering at Texas State University, and Dr. Clara
M Novoa, Ph.D., Associate Professor in the Ingram School of Engineering at Texas State
University, for their selfless and kindness in helping and supporting my Ph.D.
application.
I would also like to express my sincere thanks to Dr. Brian David Smith, Ph.D.,
Research Coordinator in the Graduate College at Texas State University for his selfless,
patience, generous help, professional advice, and dedication in supporting my scholarship
applications.
Last but not the least, I would like to thank my parents Yin Liu and Jiangxin Liu,
for their love, caring, and sacrifices for educating and preparing me for my future. I am
sincerely grateful to them for giving birth to me at the first place and supporting me
spiritually throughout my life.
vii
TABLE OF CONTENTS
Page
ACKNOWLEDGEMENTS ................................................................................................v
LIST OF TABLES ............................................................................................................ ix
LIST OF FIGURES ............................................................................................................x
LIST OF ABBREVIATIONS .......................................................................................... xii
ABSTRACT .................................................................................................................... xiii
CHAPTER
1. BACKGROUND AND OVERVIEW .................................................................1
2. PART Ⅰ: OPTIMIZING DEEP NEURAL NETWORKS TO PREDICT THE
EFFECT OF SOCIAL DISTANCING ON COVID-19 SPREAD .....................6
2.1. Introduction ..........................................................................................6
2.2. Literature Review ...............................................................................10
2.2.1. Evolutionary algorithms for deep learning models ...................10
2.2.2. Particle swarm optimization algorithm .....................................11
2.2.3. Deep learning application for COVID-19 research ..................13
2.3. Proposed Approach ............................................................................15
2.3.1. Improved particle swarm optimization algorithm .....................15
2.3.1.1. Basic particle swarm optimization algorithm ................15
2.3.1.2. Generalized opposition-based learning .........................16
2.3.1.3. Self-adaptive strategy ....................................................17
2.3.2. The Proposed hybrid IPSO-DNN model ..................................19
2.3.2.1. Deep neural networks ....................................................19
2.3.2.2. Hybrid IPSO with DNN ................................................20
2.4. Data ....................................................................................................22
2.4.1. Social distancing metrics ..........................................................23
2.4.2. Spread levels of COVID-19 ......................................................24
2.5. Model Performance ............................................................................25
2.5.1. Parameters analysis for IPSO algorithm ...................................25
2.5.1.1. Micro-population size analysis ......................................26
2.5.1.2. Self-adaptive selected probability analysis ...................26
viii
2.5.2. Model comparisons ...................................................................27
2.5.3. Results and discussions .............................................................34
2.6. Conclusions and Future Work ...........................................................46
3. PART Ⅱ: EXPLORING THE CONTAGION EFFECT OF SOCIAL MEDIA
ON MASS SHOOTINGS .................................................................................49
3.1. Introduction ........................................................................................49
3.2. Literature Review ...............................................................................53
3.2.1. Contagion effect of media on mass shootings ..........................53
3.2.2. Contagion model .......................................................................55
3.2.3. Sentiment analysis of Twitter data ............................................56
3.3. Sentiment Analysis of Twitter Data using Machine Learning
Models ...............................................................................................58
3.3.1. Twitter data ...............................................................................58
3.3.2. Machine learning models ..........................................................61
3.3.3. Results and discussions .............................................................64
3.4. Self-excited Contagion Models Integrated with Twitter Prediction ..68
3.4.1. Mass shooting data ....................................................................68
3.4.2. The proposed contagion model .................................................70
3.4.3. Improved contagion model for COVID-19 ...............................73
3.4.4. Results and discussions .............................................................74
3.5. Conclusions and Future Work ...........................................................76
REFERENCES .................................................................................................................79

ix
LIST OF TABLES
Table Page
1. Description of Eight Social Distancing Metrics ..........................................................24
2. Definition of Four Levels of COVID-19 Spread .........................................................24
3. Results Obtained by Friedman and Iman-Davenport Tests under Different
Micro-Population Sizes ...........................................................................................26
4. Ranking Results Obtained by Friedman’s Test under Different Micro-Population
Sizes ........................................................................................................................26
5. Results Obtained by Friedman and Iman-Davenport Tests under Different
Selected Probabilities ..............................................................................................27
6. Ranking Results Obtained by Friedman’s Test under Different Selected
Probabilities .............................................................................................................27
7. Results of Six Models for COVID-19 Social Distancing Prediction ...........................33
8. Results of Five States for COVID-19 Social Distancing Prediction ...........................35
9. Data Preprocessing of Mass Shooting Tweets .............................................................59
10. Prediction Performances Results of SVM on Mass Shooting Tweets .......................65
11. Prediction Performance Results of LR on Mass Shooting Tweets ............................65
12. Prediction Performance Results of the Proposed IPSO-DNN Model on Mass
Shooting Tweets .....................................................................................................66
13. The Notation of the Proposed Self-Excited Contagion Model ..................................72
14. The Additional Notation of the Improved Contagion Model for COVID-19 ............74
15. The Prediction Results of Different Contagion Models from 2013 to 2020 ..............76
x
LIST OF FIGURES
Figure Page
1. A DNN Model with N Hidden Layers .........................................................................20
2. Flowchart of the Proposed IPSO-DNN Model ............................................................22
3. The Exemplary Social Distancing Dataset of Baldwin County, Alabama ..................25
4. Comparison Accuracy Results of Different Models ....................................................32
5. Comparison Computing Time Results of Different Models ........................................32
6. Accuracy Results of All Selected Five States Obtained from IPSO-DNN ..................34
7. Cumulative COVID-19 Cases & Daily Growth Rate in Washington ..........................37
8. Daily New Cases & Time to Double Cumulative Cases in Washington .....................37
9. Cumulative COVID-19 Cases & Daily Growth Rate in California .............................39
10. Daily New Cases & Time to Double Cumulative Cases in California ......................39
11. Cumulative COVID-19 Cases & Daily Growth rate in New York ...........................41
12. Daily New Cases & Time To Double Cumulative Cases in New York ....................42
13. Cumulative COVID-19 Cases & Daily Growth Rate in Florida ...............................44
14. Daily New Cases & Time to Double Cumulative Cases in Florida ...........................45
15. Cumulative COVID-19 Cases & Daily Growth Rate in Texas .................................45
16. Daily New Cases & Time to Double Cumulative Cases in Texas .............................46
17. Examples of The Twitter Raw Dataset ......................................................................59
18. Sentiment Results of Mass Shooting Tweets .............................................................60
xii
19. The Flow Chart of Artificial Neural Networks ..........................................................62
20. The Flow Chart of Sentiment Analysis Using Machine Learning Models ................64
21. The Accuracy Performance Comparison of Different ML Models ...........................67
22. The Precision Measures Comparison of Different ML Models .................................68
23. The Recall Measures Comparison of Different ML Models .....................................68
24. The Number of Mass Shootings from 2013 to 2020 in the United States .................70
25. The Change of Contagious Effects in Power Law Kernel Function ..........................72
26. Prediction Accuracy Results of Different Contagion Models ...................................75
xii
LIST OF ABBREVIATIONS
Abbreviation Description
ML Machine Learning
COVID-19 Coronavirus Disease from 2019
DNN Deep Neural Networks
EAs Evolutionary Algorithms
PSO Particle Swarm Optimization
IPSO Improved Particle Swarm Optimization
IPSO-DNN The Hybrid Model IPSO and DNN
SVM Support Vector Machine
LR Logistics Regression
ANN Artificial Neural Networks

xiii
ABSTRACT
Emergency prediction and management are characterized by high dynamics and
complexity, and inaccurate prediction and inefficient management can result in the loss
of human lives and substantial environmental and economic consequences. Traditional
methods for emergency management, such as linear regression and time series analysis,
have limitations in handling large-scale data and conducting in-depth analysis. Machine
learning (ML) is a branch of artificial intelligence, which plays a vital role in emergency
management through modeling and predicting with high accuracy and efficiency.
A novel coronavirus disease 2019 (COVID-19) has killed and infected millions of
people around the world since late 2019. Controlling the spread of COVID-19 pandemic
is a very important and emergent topic in the United States. Moreover, the number of
mass shootings in the United States has risen sharply in 2020 under the COVID-19
pandemic. Therefore, in this thesis, we explore ML models to improve emergency
management by focusing on two different types of emergency, coronavirus pandemic
(i.e., COVID-19) and mass shootings.
For COVID-19, we focus on exploring the evolution algorithm and ML to model
the effect of social distancing on the spread of COVID-19. Deep Neural Networks (DNN)
form a powerful deep machine learning model that can process unprecedented volumes of
data. The hyperparameters of DNN have a major influence on its prediction performance.
Evolutionary algorithms (EAs) form a heuristic-based approach that provides an
opportunity to optimize deep learning models to obtain good performance. Therefore, we

xvi
propose an evolutionary deep learning model called IPSO-DNN based on DNN for
prediction and improve Particle Swarm Optimization (IPSO) algorithm to optimize the
kernel hyperparameters of DNN in a self-adaptive evolutionary way. In the IPSO
algorithm, not only a micro population size setting is introduced to improve the search
efficiency of the algorithm, but also the generalized opposition-based learning strategy is
used to guide the population evolution. In addition, the IPSO employs a self-adaptive
update strategy to prevent the premature convergence and then improves the exploitation
and exploration parameter optimization performance of DNN. In Part Ⅰ, we show that the
IPSO provides an efficient approach for tuning the hyperparameters of DNN with saving
valuable computational resources. We explore the proposed IPSO-DNN model to predict
the effect of social distancing on the spread of COVID-19 based on mobility and social
distancing metrics. The preliminary experimental results reveal that the proposed IPSO-
DNN model has the least computation cost and yields better prediction accuracy results
when compared to the other comparison models. The experiments of the IPSO-DNN
model also illustrate that aggressive and extensive social distancing interventions is
crucial to help slow the spread of the COVID-19 epidemic in the United States.
For mass shooting, we concentrate on predicting the future number of mass
shooting incidents in the United States based on the public’s attitudes on Twitter. In
recent years, social media plays a prominent and very important role in the spread of
mass shooting incidents and brought about a significant contagious effect on future
similar incidents. Therefore, we propose a self-excited contagion model based on

xvi
sentiment analysis of Twitter data on mass shootings. We explore different ML models to
forecast the change in the public’s attitudes over time. These ML models include Support
Vector Machine (SVM), Logistic Regression (LR), and the proposed IPSO-DNN model.
The performances of different ML models are critically examined based on performance
measures such as precision, recall, and accuracy. The results present that the proposed
IPSO-DNN model has the significant capability to forecast the changes in public attitudes
towards mass shootings on Twitter over time. The proposed self-excited contagion model
is to predict the future number of mass shootings by focusing on the magnitude of
influence of mass shootings and the spread of public attitudes on Twitter. Experiments
indicate that the positive attitude plays an important role in analyzing and predicting
future similar mass shooting incidents. Especially, due to the economic recession and
people's huge pressures related to the lockdowns, the COVID-19 pandemic has
significantly increased the number of mass shootings in 2020. Therefore, we also
improve the proposed self-excited contagion model with the consideration of social
distancing and the daily growth rate of COVID-19 cases to predict and analyze mass
shootings under the COVID-19 pandemic. Experimental results of Part Ⅱ demonstrate
that our proposed contagion models perform very well in predicting the future mass
shootings in the United States.

1
1. BACKGROUND AND OVERVIEW
In the past few decades, the rise of unprecedented emergencies and disasters
occurred in every part of the world, such as September 11 attacks, Fukushima Daiichi
nuclear disaster, Hurricane Katrina, 2017 Las Vegas shooting, Australia fires, and the
currently suffering COVID-19 pandemic. These emergencies are highly dynamic and
complex, which make the emergency management extremely difficult as they are in the
context of dynamic and interdependent social, infrastructure, and natural environments.
The inaccurate prediction and inefficient management can result in the huge loss of
human lives, substantial environmental and economic consequences. Moreover, it is
undoubtedly a very challenging task to effectively deal with large volumes of related
emergency data. Traditional methods for emergency prediction, such as linear regression
and time series analysis, have limitations in handling large-scale data and conducting the
in-depth analysis. Machine learning (ML) is a branch of artificial intelligence and has
been proven to successfully support decision-making processes in managing a wide
variety of complex problem domains. It lets computers mimic human learning to analyze
large-scale data from past emergencies and disasters to generate new insights about
current and future similar events. Therefore, ML plays a vital role in emergency
management by modeling and predicting emergency with high accuracy and efficiency.
Numerous scholars have researched applying ML models to improve the
efficiency of emergency management, such as predicting the occurrence of disasters and
determining crowd evacuation routes. However, most studies focused on natural
disasters, such as floods, earthquakes, and hurricanes, and there is little attention on other
emergencies, such as pandemics and mass shootings. As we know, COVID-19 is a
2
transmissible coronavirus disease that has rapidly stricken around the world since late
2019. The COVID-19 pandemic has caused a devastating loss of life but it has also
devastated the global economy. Slowing the spread of COVID-19 is very essential to
protect human lives and economic prosperity around the world. The COVID-19
pandemic has substantially decreased the employment-to-population ratio in the United
States. Other stresses and pressures related to lockdowns and prolonged periods of
isolation have also carried significant burdens to human beings. The COVID-19 has a
massive impact on crime. For instance, the number of mass shootings in the United States
has risen drastically in 2020 under the COVID-19 pandemic. Gun violence in the United
States results in a great number of deaths and injuries annually. According to Gun
Violence Archive (Gun Violence Archive, 2021), mass shooting is defined as a minimum
of four victims shot (either fatally or not) excluding any shooter or injured in the attack.
Mass shootings in the United States have continued the general year-on-year increase in
terms of frequency, fatalities, and injuries– but 2020 has been far worse than usual. There
were 610 mass shooting incidents in 2020, significantly above the 417 mass shootings
recorded in 2019, and also more than any other year over at least two decades. It is very
critical to reduce the number of mass shootings in the United States. Therefore, in this
thesis, we explore ML models to improve emergency management by focusing on two
different types of emergency, COVID-19 pandemic and mass shootings.
This thesis consists of two parts.
Part Ⅰ is optimizing Deep Neural Networks (DNN) using Improved Particle
Swarm Optimization (IPSO) to predict the effect of social distancing on COVID-19
spread. There is no doubt that social distancing, such as banning gatherings, having
3
people stay at home, and closing schools perform very well in slowing the spread of
COVID-19 pandemic. However, existing epidemiological contagion theories cannot
explicitly measure the effect of these political decisions on the reduction of COVID-19
cases. Therefore, we explore the DNN model to predict and analyze the effect of social
distancing measures on COVID-19 spread. DNN is a very powerful deep machine
learning model that includes neural networks with multiple hidden layers of abstraction to
process large scale data. In order to improve the prediction performance, we propose an
IPSO algorithm to optimize the hyperparameter of DNN in an evolutionary way. Social
distancing is explicitly considered in the hybrid model IPSO-DNN. Then, we explore the
IPSO-DNN model to show how social distancing helps slow the spread of COVID-19
pandemic in the five selected states of the United States, such as Washington, California,
New York, Florida, and Texas.
Part Ⅱ is exploring the contagion effect of social media on mass shootings. In Part
Ⅱ, we follow the definition of mass shooting which is four or more people are shot or
killed in a single incident, at the same general time and location, not involving the
shooter. In the United States, the number of mass shootings has been growing steadily
over the past few years. The ever-increasing social networking sites, such as Twitter,
have made information dissemination about mass shootings nearly effortless. This rise in
mass shooting incidents has recently been linked to “media contagion” theory, which
suggests that society’s never-ending news cycle has a “copycat” effect on these crimes.
The spread of a positive attitude towards mass shootings encourages people to follow and
imitate similar incidents, causing societal turmoil as well as harm to peace and security
for sustainable development in the United States. Therefore, we explore the public
4
attitudes towards mass shootings on social media and measure the associated contagious
effect systematically with the predictions of how these attitudes will change using ML
models. We then propose the self-excited contagion models to predict the number of
mass shootings by focusing on the magnitude of influence of mass shooting incidents and
the spread of public attitudes on Twitter. A maximum likelihood estimation approach is
applied to enhance the proposed model's robustness and prediction performance.
The remainder of this thesis is organized as follows:
Part Ⅰ: In Section 2.1, we introduce the importance of optimizing DNN using
IPSO algorithm to predict the effect of social distancing on COVID-19 spread; Section
2.2 reviews the relevant literature; In Section 2.3, we present the methodology of our
proposed model and develop the IPSO-DNN model to predict the COVID-19 pandemic
based on social distancing influence; Section 2.4 describes the social distancing data
which includes social distancing metrics and levels of COVID-19 spread; Section 2.5
analyzes and discusses model performances, then explores the effect of social distancing
on the spread of COVID-19 in the five selected states; In Section 2.6, we discuss the
implications of our findings in Part Ⅰ and possible directions for future work.
Part Ⅱ: Section 3.1 introduces the contagious effect of social media on mass
shootings in the United States; in Section 3.2, we review the relevant literature of
contagion effects on social media on mass shootings, self-excited contagion model, and
sentiment analysis; Section 3.3 presents the methodology of collecting and pre-
processing mass shooting tweets, describes the two basic ML models and the proposed
IPSO-DNN model to predict and classify the sentiment of mass shooting tweets, and then
discusses the prediction accuracy results of different models; Section 3.4 describes the

5
resource of mass shooting data used in Part Ⅱ, proposes the self-excited contagion
models, explores the contagion effect of social media and the effect of COVID-19 on
mass shootings, as well as discusses prediction accuracy results of the proposed
contagion models; We finally conclude the work of Part Ⅱ and discuss future research
directions in Section 3.5.

6
2. PART Ⅰ: OPTIMIZING DEEP NEURAL NETWORKS TO PREDICT THE
EFFECT OF SOCIAL DISTANCING ON COVID-19 SPREAD
2.1. Introduction
Deep learning is a sub-field of machine learning based on artificial neural
networks, which includes processing neurons organized in input, hidden, and output
layers. As one powerful deep learning model, Deep Neural Networks (DNN) are neural
networks with multiple hidden layers of abstraction, which outperform other basic
machine learning models in processing unprecedented volumes of data (Han et al., 2016).
The hyperparameter setting of DNN has a significant influence on its prediction
performance. The number of hidden layers, the number of neurons in each layer, and the
activation function in each layer are three kernel hyperparameters of DNN, and their
values need to be set appropriately to achieve high-quality results. However, most
traditional methods tune these hyperparameters manually, which is quite time-
consuming, and the solutions are usually not equally distributed in the objective space
(Malitsky, Mehta, & Simonis, 2013).
Evolutionary algorithms (EAs) provide an opportunity to find the optimal or near-
optimal values of the hyperparameters of DNN models in an evolutionary way. EAs are
the generic population-based metaheuristic optimization algorithms that simulate the
natural evolution and they have shown to be effective in solving multiple and
complicated tasks in many fields. EAs exhibit a tangible potential for large-scale
parallelization and distribution in the search space that is especially important for
optimizing the hyperparameters of complex DNN architectures. Particle Swarm
Optimization (PSO) algorithm is one of the most important evolutionary algorithms first
7
proposed by Kennedy and Eberhart in 1995 ( Kennedy & Eberhart, 1995). PSO is easy to
implement and shows rapid convergence towards an optimum (Shi, Liu, Cheng, Li, &
Zhao, 2019). Nevertheless, many researchers have noticed that PSO tends to converge
prematurely to local optima, especially when dealing with complex multimodal functions
(Saeedi et al., 2020). This major weakness has restricted the applications of the PSO to
comprehensively improve the performance of DNN. In order to address this challenge, in
this Part Ⅱ we develop an improved PSO (IPSO) algorithm, which is applied to optimize
the hyperparameters of DNN model. For the IPSO algorithm, we not only employ the
generalized opposition-based learning strategy to guide the population evolution but also
introduce the micro population size setting to improve the search efficiency of the
algorithm. In addition, the IPSO explores a self-adaptive strategy to prevent premature
convergence and thus enhances the global exploitation and local exploration ability of the
algorithm.
Moreover, deep learning models have achieved the state-of-the-art performance
for various application domains over the past few years, such as solving online batching
problems ( Cals, Zhang, Dijkman, & van Dorst, 2021), diagnosing and classification of
faults in industrial rotation machinery (Souza et al., 2021) and forecasting supply chain
demand (Punia, Singh, & Madaan, 2020). Deep learning has also been widely used for
COVID-19 pandemics, including infection detection. Controlling the spread of COVID-
19 has been an important and emerging topic around the world today. Before COVID-19
vaccines can be widely distributed, social distancing is the most powerful effort to control
the pandemic. In Part Ⅰ, social distancing policy includes lockdowns, travel restrictions,
quarantines, and issuing stay-at-home orders. The University of Maryland has developed
8
a social distancing scoreboard together with a map of coronavirus confirmed cases to
show how social distancing works within communities to slow the spread of COVID-19
in each state (Zhang et al., 2020). However, existing epidemiological contagion theories
cannot explicitly measure the effect of these political decisions on the reduction of
COVID-19 cases. There are few studies related to deep learning that explore the
significant influence of social distancing on the mitigation of COVID-19.
In this Part Ⅰ, we explore the evolutionary deep learning model, called IPSO-
DNN, to predict the effect of social distancing on the spread of COVID-19 and provide
new insights for controlling the COVID-19. Social distancing is explicitly considered in
the IPSO-DNN model. The effect of social distancing interventions on COVID-19 can be
measured by two indicators, daily growth rate and time to double cumulative cases
(Tellis, Sood, & Sood, 2020). In order to better describe how COVID-19 spreads, we
propose to define four levels of COVID-19 spread by using these two indicators, which
are growth, moderation, control, and containment. Our first research objective of Part Ⅰ is
to improve the performance of DNN using the developed IPSO algorithm which employs
the self-adaptive strategy to adjust the evolutionary process to find the optimal values of
hyperparameters for the DNN model. Second, we apply the hybrid IPSO-DNN model to
show how social distancing interventions help mitigate the COVID-19 spread.
The major contributions of Part Ⅰ are summarized as follows:
1) An improved PSO (IPSO) algorithm is developed, which employs the self-
adaptive strategy and generalized opposition-based learning ability in a micro-
population setting to conquer the weaknesses of the basic PSO algorithm. The
proposed IPSO algorithm has significantly improved the performance of basic
9
PSO.
2) A parameter selection method for optimizing DNN model using the IPSO
algorithm is proposed. The proposed hybrid IPSO-DNN model optimizes the
hyperparameters of DNN without degrading the DNN prediction precision. For
instance, the number of hidden layers, the number of nodes in each layer, and
the activation functions of each layer in the DNN model are properly tuned in
an evolutionary way. It is found that the proposed IPSO-DNN model
outperforms PSO-DNN, GS-DNN, IPSO-SVM, IPSO-LR, and IPSO-DT
models in terms of computing time and accuracy.
3) The evolutionary deep learning model IPSO-DNN is introduced to predict the
effect of social distancing on the spread of COVID-19. A challenge of this
prediction is how to measure the influence of social distancing in response to
COVID-19 properly. Therefore, we measure the effect of social distancing in
terms of mobility metrics and then explore our proposed evolutionary deep
learning model IPSO-DNN to predict its influence on the spread of COVID-
19. In experiments, the IPSO-DNN model performs very well to predict the
daily new COVID-19 cases and the spread of COVID-19 pandemic in the five
selected states. The experimental results also explicitly show that aggressive
and extensive social distancing is significant to help reduce COVID-19
infections in the United States.
10
2.2. Literature Review
2.2.1. Evolutionary algorithms for deep learning models. The kernel
hyperparameter setting of deep learning models plays a significant role in prediction
accuracy. Traditional tuning hyperparameters methods, such as the manual trial and error
method, cannot find the optimal values of hyperparameters efficiently. Some existing
state-of-the-art hyperparameter optimization methods, such as simple grid and random
search (Chaves, Gonçalves, & Lorena, 2018), model-based approaches (Abbasimehr,
Shabani, & Yousefi, 2020) and Bayesian optimization based on Gaussian processes
(Wang, Ma, Ouyang, & Tu, 2020), show that their performances are approximately
similar to human experts and in some cases even surpass them. However, there are still
many challenges on how to find the optimal hyperparameters for the complex DNN
architectures (Lorenzo et al., 2017). For example, Grid Search is a common method to
tune the hyperparameters for deep learning but it is not efficient in searching a high-
dimensional hyperparameter space (Xu et al., 2021). EAs have been shown very efficient
in solving a plethora of challenging optimization problems, which has the advantages of
both searching the hyperparameter space in a random fashion and utilizing previous
results to direct the search. Therefore, the combination of evolutionary algorithms and
deep learning models is a very popular topic over the past few years since hybrid models
perform very well in many optimization fields.
Most existing studies focus on optimizing the hyperparameters of deep learning
models in an evolutionary way. For instance, Young et al. (2015) presented the multi-
node evolutionary neural networks for automating network selection on computational
clusters through hyperparameters optimization performed via genetic algorithm. It also
11
showed that the PSO technique holds great potential to optimize parameter settings and
thus saves valuable computational resources during the tuning process of deep learning
models (Qolomany et al., 2017). Ye (2017) introduced new automatic hyperparameter
selection approach for determining the optimal network configuration for DNN using
PSO in combination with a steepest gradient descent algorithm. Darwish, Ezzat, &
Hassanien (2020) developed the orthogonal learning particle swarm optimization
algorithm to find optimal values for the hyperparameters of convolutional neural
networks. However, most evolutionary algorithms have high computational cost and
come with premature convergence, especially when solving highly complex problems in
the real world. DNN suffers from a great variety of hyperparameters which all have
specific architectures. These are considered as a challenge when evolutionary algorithms
are applied to identify the optimal or near optimal hyperparameters for the DNN.
Although many studies researched the hyperparameter optimization of deep learning
using an evolutionary algorithm, there is little research exploring improved evolutionary
algorithms to enhance the performance of deep learning models. In this Part Ⅰ, we
propose an improved particle swarm optimization algorithm to avoid the disadvantages of
the PSO algorithm with a self-adaptive strategy to optimize the hyperparameters of the
DNN model.
2.2.2. Particle swarm optimization algorithm. Particle swarm optimization
algorithm is a simple yet powerful evolutionary algorithm for global optimization used in
many real-world research areas, such as logistics and supply chain management, and
engineering design optimization. It also has received increasing attention for the use of
12
optimizing the parameters for machine learning techniques because of its fast-
convergence and easy implementation. However, the PSO algorithm tends to fall into
local optima and its performance is affected by the control parameters and velocity
updating strategy. Therefore, many works have been proposed to improve PSO in order
to avoid the problem of premature convergence. Accelerating convergence speed and
avoiding the local optimal have become two most important and appealing goals in the
PSO research. A number of variant PSO algorithms have, hence, been developed to
achieve these two goals (Gang, Wei, & Xiao, 2012). Major strategies include control of
algorithm parameters and combination with auxiliary search. Moreover, some researchers
used a self-adaptive method by encoding the parameters into the particles and optimizing
them together with the position during run time (Pornsing, Sodhi, & Lamond, 2016). For
instance, an Adaptive Particle Swarm Optimization (APSO) algorithm with all
automatically adjusted parameters of inertia weight, cognitive coefficient and social
coefficient was developed to search for better solutions in scheduling problems (Hop,
Van Hop, & Anh, 2021). Zhang, Li, & Wang (2017) proposed an immune particle swarm
algorithm based on adaptive search and the algorithm can dynamically adjust the subscale
size and automatically adjust the search range using the maximum particle concentration
value.
Nevertheless, so far, it is seen to be difficult to simultaneously achieve both goals
of accelerating convergence speed and avoiding the local optimal. For example, Liang,
Qin, Suganthan, & Baskar (2016) introduced comprehensive-learning PSO (CLPSO)
focuses on avoiding the local optimal but brings in a slower convergence and the higher
computational cost of the algorithm. Therefore, in order to improve the algorithm
13
performance and reduce the computational cost for DNN, an IPSO algorithm with a
micro-population size setting is proposed in this Part Ⅰ. The self-adaptive strategy with
generalized opposition-based learning ability is applied in the IPSO algorithm to adjust
the population evaluation based on the particle updated rate of population in each
iteration. This strategy can balance global exploitation and local exploration in the
algorithm to prevent premature convergence. Moreover, the IPSO employs the
nonparametric statistical tests to choose its best parameters for optimizing the DNN
models. Finally, the proposed optimized evolutionary deep learning model IPSO-DNN is
developed to find the optimal values for the hyperparameters of the DNN in a self-
adaptive evolutionary way.
2.2.3. Deep learning application for COVID-19 research. Since COVID-19
first outbroke in mainland China, it has developed into a global pandemic, infecting
millions of people around the world. Over the past few months, deep learning has shown
good performance in the application of COVID-19 research. For instance, the multi-
objective differential evolution algorithm has been applied to tune the initial parameters
of convolution neural networks to identify the COVID-19 patients from chest CT images
(Singh, Kumar, & Kaur, 2020) and deep learning techniques have been introduced to link
potential patients to suitable clinical trials (Dhayne et al., 2021). Nevertheless, although
many studies have focused on exploring the deep learning techniques for the COVID-19
infection detection, there is little research to measure the effect of social distancing on the
spread of COVID-19.
Social distancing has been implemented around the world as a major community

14
mitigation strategy. Many researchers have studied the relationship between social
distancing measures and the epidemics. For instance, the social distancing index has
been constructed to evaluate people’s mobility pattern changes along with the spread of
COVID-19 (Pan et al., 2020). In addition, Te Vrugt, Bickmann, & Wittkowski (2020)
developed an extended model for disease spread based on combining an SIR model with
a dynamical density functional theory where social distancing is explicitly considered in
it. A developed method was implemented to monetize the impact of moderate social
distancing on deaths from COVID-19 (Greenstone & Nigam, 2020). Fong et al. (2020)
presented the systematic reviews of the evidence base for effectiveness of multiple
mitigation measures, which shows that more drastic social distancing measures might be
reserved for severe pandemic. Farboodi, Jarosch, & Shimer (2020) provided a
quantitative framework for exploring how individuals trade off the utility benefit of social
activity against the internal and external health risks that come with social interactions
during a pandemic While many studies indicated that social distancing is one of the most
important measures in response to COVID-19, a big challenge is how to measure the
influence of social distancing properly and what factors will be the major ones that
determine the influence. In this Part Ⅱ, we measure the effect of social distancing in terms
of mobility metrics and then explore our proposed evolutionary deep learning model
IPSO-DNN to predict the influence on the spread of COVID-19.

15
2.3. Proposed Approach
2.3.1. Improved particle swarm optimization algorithm.
2.3.1.1. Basic particle swarm optimization algorithm. PSO is an iterative
algorithm that engages a number of simple entities, iteratively over the search space of
some functions, and it uses a simple mechanism that mimics swarm behavior in birds
flocking to guide the particles to search for globally optimal solutions. The population of
PSO is called a swarm and its individuals are called particles. The swarm is defined as a
set of N particles ( 1,2, , )i i = ... N . A swarm of particles is represented as a potential
solution, and each particle i is associated with two vectors. One is velocity vector
represented as 1 2( , , )i i, i, i,Dv ,v ... v=v and the other is position vector, represented as
1 2( )i i, i, i,D= x ,x ,...,xx , where D denotes the dimensionality of the solution space. The velocity
determines the next direction and distance to move. PSO remembers both the global best
position found by all particles as well as the historical best position found by each
particle during the search process. The velocity and the position of each particle are
initialized by random vectors within the corresponding ranges. During the evolutionary
process, the velocity and position of particle i on dimension d are updated as
1
1 2 g1 ( ) 2 ( )t t t t t t
i i i i iw v c r c r+ = + − + −v p x p x (1)
1 1t t t
i i i
+ += +x x v (2)
where w is the inertia weight, c1 and c2 are the acceleration coefficients, and r1
and r2 are two uniformly distributed random numbers independently generated within
[0,1] for the dth variable. In the equation (1), t
ip is the position with the best fitness found
so far for the ith particle, and g
tp is the best position in the neighborhood.
1t
i
+v is the new

16
updated velocity of particle i by the end of iteration t. 1t
i
+x is the new updated position of
particle i by the end of iteration t and t= 1,2,… indicates the iteration number.
As mentioned before, rapid convergence is one of the main advantages of PSO.
However, this can also be problematic if an early solution is local optimal. The swarm
may stagnate around the local optimal without any pressure to continue exploration.
Therefore, we develop an IPSO algorithm with generalized opposition-based learning and
self-adaptive update strategy in the micro-population size setting to balance the global
exploitation and local exploration in order to avoid premature convergence and also
enable the swarm to accurately search out local optimum with the lowest computational
cost.
2.3.1.2. Generalized opposition-based learning. Opposition-Based Learning
(OBL) (Tizhoosh, 2005) is a new concept in computational intelligence and is normally
applied to the current population during the evolution. OBL is usually hybridized with
different EAs, such as artificial bee colony algorithm (El-Abd, 2012) and differential
evolution (Wang, Rahnamayan & Wu, 2013). The main idea behind OBL is the
simultaneous consideration of a candidate solution x and its corresponding opposite
solution x* which will provide another chance for finding a candidate solution closer to
the global optimum. In the evolutionary process, let 1 2( , ,..., )Dx x x=X be an n-dimensional
space, where xi ∈[ai, bi] and i = 1, 2, …, n. The opposite vector of X is denoted as
* * * *
1 2( , ,..., )nx x x=X . The opposite point of x is denoted as x* and defined as
*
i i i ix a b x= + − (3)
Generalized opposition-based learning (GOBL) strategy is to transform

17
candidates in current search space to a new search space (Wang, Wu, & Rahnamayan,
2011). By simultaneously evaluating the candidates in the current search space and
transformed search space, it could make the solution jump out from the current search
domain and avoid any information gathered during the search. In the GOBL approach, let
Xi = (xi,1, xi,2,…, xi,D) be a solution for dimension D in the current search space S, xij∈[aj,
bj]. The new solution ijxGO in the transformed space S* is defined as
( ) , [ , ], 1,2,...ij j j ij ij j jk a b a b j D= + − =x x xGO
(4)
where k is a random number coming from a uniform distribution in [0,1], which
can help obtain a good performance of solution in the search space.
[ ( ) , ( ) ]ij j j j j j jk a b b k a b a + − + −xGO
is the generalized opposite candidate solution in the state
space. The GOBL strategy has been shown that it can effectively help evolutionary
algorithms to jump out of the local optimal and improve the algorithm performance
(Chen et al., 2016).
2.3.1.3 Self-adaptive strategy. The performance of PSO algorithm highly depends
on the control of parameters and velocity update strategy. In order to control the PSO
objectively and optimally, a self-adaptive updated strategy is integrated into the GOBL
approach for real-time monitoring algorithm evolution process based on the actual
evolution rate of particles in the swarm. During an IPSO process, a population updated
rate z in each iteration is defined by the ratio of the actual updated number of particles in
the swarm for each iteration, as in
az
N=
(5)

18
where a is the number of updated particles in each iteration and N is the number
of particles in the population.
If z is higher than a selected probability p, the global best position g
tp is used to
update the velocity and position. If the updated rate z is less than or equal to a selected
probability p which means there is a larger probability that PSO would jump into the
local optimal, then the candidate particle ijxGO
instead of g
tp in the velocity updated
strategy is employed to guide the population evolution. To be more specific,
1
1 21 ( ) 2 ( )t t t t t t
i i i i GO iw v c r c r+ = + − + −v p x p x (6)
where t
GOp is the generalized opposition-based point of g
tp in the search domain.
The basic steps of the proposed IPSO algorithm include:
Step 1: Initialization. Establish the initial values of micro- population size, two
acceleration coefficients (c1 and c2), maximum number of iterations, select probability p,
and update probability z; calculate the fitness value for each particle and set the personal
best (pi) and global best (pg) for the population.
Step 2: Employ self-adaptive strategy. Calculate the new update probability z
based on Equation (5) and generate the opposition-based learning particle (pGO) as in
Equation (4).
Step 3: Update the position and velocity of particles. If z ≤ p, then the new
velocity is updated according to Equation (5); otherwise, the new velocity is updated by
Equation (1). After we get the new velocity, the new position is updated based on
Equation (2).
Step 4: Update pi and pg. Calculate the fitness value for each particle. If the fitness
value of the new location is better than the fitness value of pi, the new location is updated
19
to be the pi. Then, if the currently best particle in the population is better than the pg, the
best particle replaces the recorded global best.
Step 5: Stop and output. Repeat Step 2, Step 3, and Step 4 until the global best
solution does not change anymore or the maximum number of iterations has been
reached. Then, we finally return the global best solution.
2.3.2. The proposed hybrid IPSO-DNN model.
2.3.2.1. Deep neural networks. Deep learning (Goodfellow, Bengio, Courville, &
Bengio, 2016) deals with algorithms to endow machines with intelligence without
explicit programming. DNN models have multiple hidden layers located in-between the
input and output layers. The units in the hidden layer are fully connected to the input
layer, and the output layer is fully connected to the hidden layer. Moreover, the activation
function (Wang, Giannakis, & Chen, 2019) is between the input feeding the current
neuron and its output going to the next layer. Activation functions are mathematical
equations that determine the output of neural network. The function is attached to each
neuron in the network and determines whether it should be activated or not, based on
whether each neuron’s input is relevant for the prediction of models. There are many
types of activation functions in DNN models, such as Sigmoid, Tanh, and Softmax
function.
Let L be the number of hidden layers, Ni be the number of neurons in layer i and N
={ N1, N2, …, NL}, Ai be the activation function in layer i and A ={ A1, A2, …, AL}.
Parameters L, N, and A are very important and have major influences on the performance
of DNN models. Therefore, we propose the IPSO algorithm to optimize the

20
hyperparameters of DNN models with self-adaptive strategy and then explore the
evolutionary deep learning hybrid model, called IPSO-DNN, to predict the effect of
social distancing on the spread of the COVID-19. The DNN model is shown in Figure 1.
Figure 1. A DNN Model with N Hidden Layers
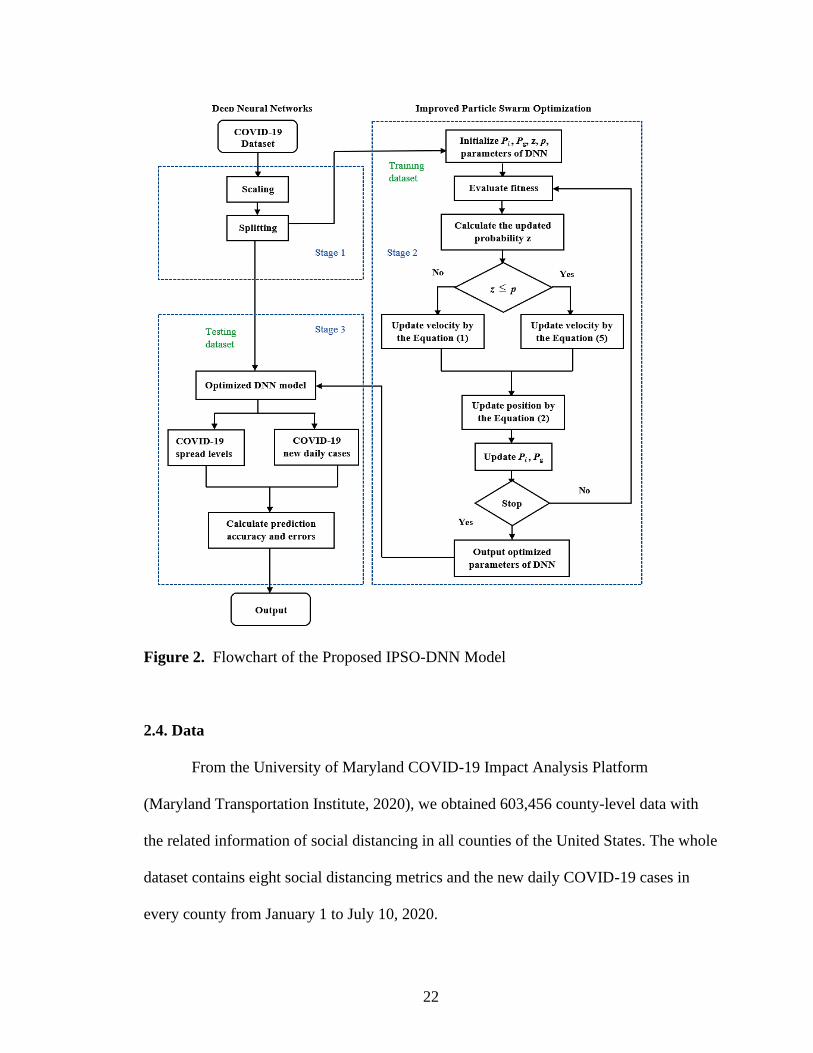
2.3.2.2. Hybrid IPSO with DNN. To better establish an IPSO-based parameter
optimization system for the DNN model, the IPSO algorithm is explored to find the
optimal hyperparameters for the DNN model and the finally optimized IPSO-DNN model
predicts the effect of social distancing on the spread of COVID-19 and output the
prediction results. The flowchart of the hybrid model IPSO-DNN is illustrated in Figure
2. It consists of three major stages.
Stage I. Prerequisites: data scaling and splitting. Firstly, one advantage of scaling
is to avoid features in large numeric ranges dominating those located in smaller numeric
ranges. Another trait is to avoid numerical difficulties during the calculation. Using the
standardization of scaling technique, we center the features at mean 0 with standard
deviation 1 so that the features take the form of a normal distribution, which makes the
DNN model easier to learn a mapping from input variables to an output variable.
21
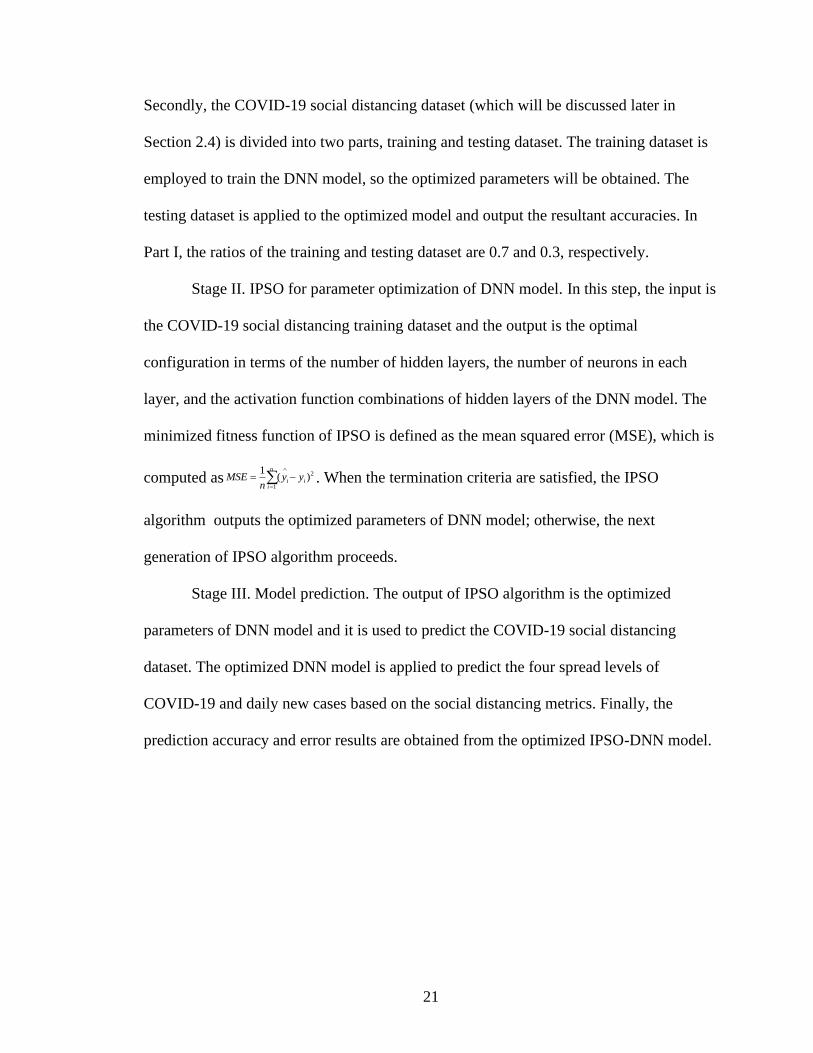
Secondly, the COVID-19 social distancing dataset (which will be discussed later in
Section 2.4) is divided into two parts, training and testing dataset. The training dataset is
employed to train the DNN model, so the optimized parameters will be obtained. The
testing dataset is applied to the optimized model and output the resultant accuracies. In
Part Ⅰ, the ratios of the training and testing dataset are 0.7 and 0.3, respectively.
Stage II. IPSO for parameter optimization of DNN model. In this step, the input is
the COVID-19 social distancing training dataset and the output is the optimal
configuration in terms of the number of hidden layers, the number of neurons in each
layer, and the activation function combinations of hidden layers of the DNN model. The
minimized fitness function of IPSO is defined as the mean squared error (MSE), which is
computed as 2
1
1( )
n
i ii
MSE y yn
=
= − . When the termination criteria are satisfied, the IPSO
algorithm outputs the optimized parameters of DNN model; otherwise, the next
generation of IPSO algorithm proceeds.
Stage III. Model prediction. The output of IPSO algorithm is the optimized
parameters of DNN model and it is used to predict the COVID-19 social distancing
dataset. The optimized DNN model is applied to predict the four spread levels of
COVID-19 and daily new cases based on the social distancing metrics. Finally, the
prediction accuracy and error results are obtained from the optimized IPSO-DNN model.
22
Figure 2. Flowchart of the Proposed IPSO-DNN Model
2.4. Data
From the University of Maryland COVID-19 Impact Analysis Platform
(Maryland Transportation Institute, 2020), we obtained 603,456 county-level data with
the related information of social distancing in all counties of the United States. The whole
dataset contains eight social distancing metrics and the new daily COVID-19 cases in
every county from January 1 to July 10, 2020.

23
2.4.1. Social distancing metrics. The major non-pharmaceutical interventions,
and social distancing policies are essential strategies of the public health response to the
COVID-19 pandemic around the world. From the evidence of implemented social
distancing measures in many countries, such as China and Italy, there is no doubt that
social distancing is considered an effective way to mitigate the spread of COVID-19.
Social distancing related measures include avoiding mass gathering, closing schools and
non-essential business, issuing mandatory stay-at-home orders, and having travel
restrictions. This social distancing takes many forms, and the nature is to keep people
apart from each other by confining them to their homes in order to reduce contact rates.
Therefore, in this study, from COVID-19 Impact Analysis Platform, the values of
mobility and social distancing metrics which represent people’s reactions to social
distancing policies are considered as the effect of social distancing on the spread of
COVID-19. The platform aggregates mobile device location data from more than 100
million devices across the nation on a monthly basis to study human mobility behavior
amid the COVID-19 pandemic. The basic metrics in our research are selected to cover
the frequency, spatial range, and semantic of people’s daily travel. The eight basic
mobility and social distancing metrics are described in Table 1 (Zhang et al., 2020).
24
Table 1. Description of Eight Social Distancing Metrics
Social Distancing Metrics Description
Percentage of residents
staying home
Percentage of residents that make no trips more than
1.61 km away from home.
Daily work trips per person
Average number of work trips made per person. A work
trip is a trip going to or from one’s imputed work
location.
Daily non-work trips per
person Average number of non-work trips made per person.
Distances traveled per person Distances in kilometers traveled per person on all travel
modes (car, train, bus, plane, bike, walk, etc.) per day.
Trips per person Average number of all trips taken per person per day.
Percentage of out-of-county
trips Percentage of all trips that cross county borders.
Percentage of out-of-state
trips Percentage of all trips that cross state borders.
Transit mode share Percentage of rail and bus transit mode share.
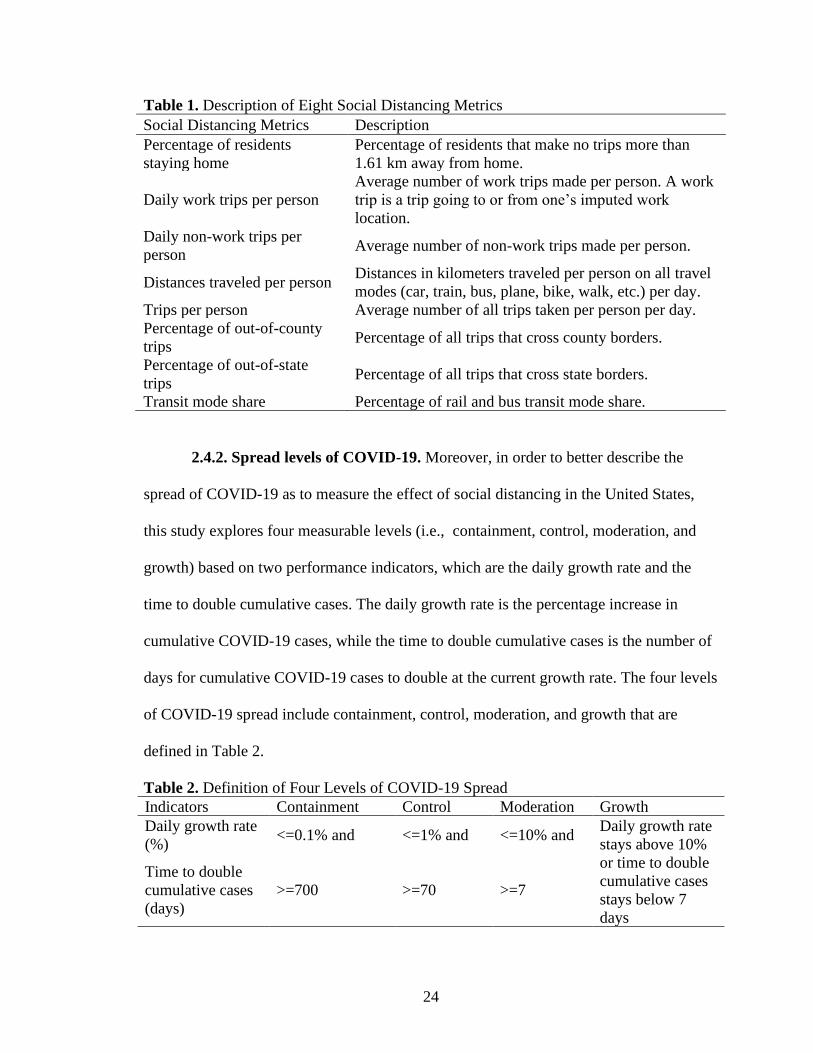
2.4.2. Spread levels of COVID-19. Moreover, in order to better describe the
spread of COVID-19 as to measure the effect of social distancing in the United States,
this study explores four measurable levels (i.e., containment, control, moderation, and
growth) based on two performance indicators, which are the daily growth rate and the
time to double cumulative cases. The daily growth rate is the percentage increase in
cumulative COVID-19 cases, while the time to double cumulative cases is the number of
days for cumulative COVID-19 cases to double at the current growth rate. The four levels
of COVID-19 spread include containment, control, moderation, and growth that are
defined in Table 2.
Table 2. Definition of Four Levels of COVID-19 Spread
Indicators Containment Control Moderation Growth
Daily growth rate
(%) <=0.1% and <=1% and <=10% and
Daily growth rate
stays above 10%
or time to double
cumulative cases
stays below 7
days
Time to double
cumulative cases
(days)
>=700 >=70 >=7
25
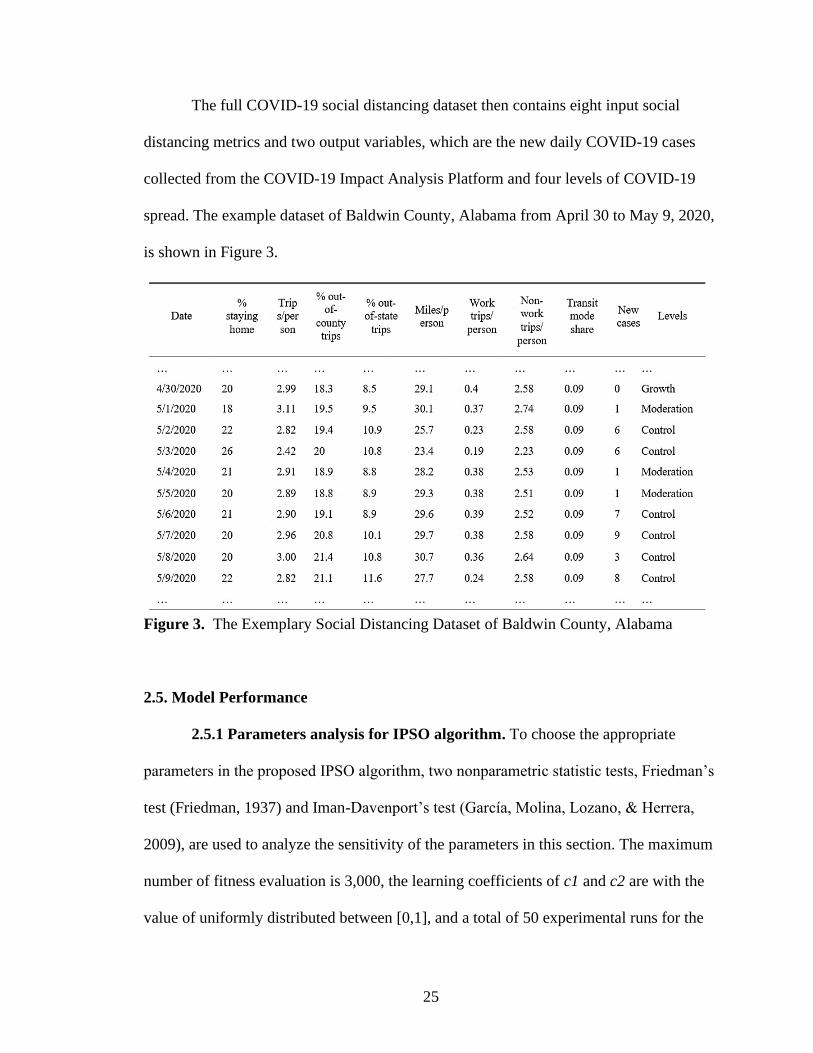
The full COVID-19 social distancing dataset then contains eight input social
distancing metrics and two output variables, which are the new daily COVID-19 cases
collected from the COVID-19 Impact Analysis Platform and four levels of COVID-19
spread. The example dataset of Baldwin County, Alabama from April 30 to May 9, 2020,
is shown in Figure 3.
Figure 3. The Exemplary Social Distancing Dataset of Baldwin County, Alabama
2.5. Model Performance
2.5.1 Parameters analysis for IPSO algorithm. To choose the appropriate
parameters in the proposed IPSO algorithm, two nonparametric statistic tests, Friedman’s
test (Friedman, 1937) and Iman-Davenport’s test (García, Molina, Lozano, & Herrera,
2009), are used to analyze the sensitivity of the parameters in this section. The maximum
number of fitness evaluation is 3,000, the learning coefficients of c1 and c2 are with the
value of uniformly distributed between [0,1], and a total of 50 experimental runs for the
26
fitness function are set in Python, except for two analyzed parameters (i.e., micro-
population size and selected probability p). The significance level of these non-
parametric statistical experiments is 5%.
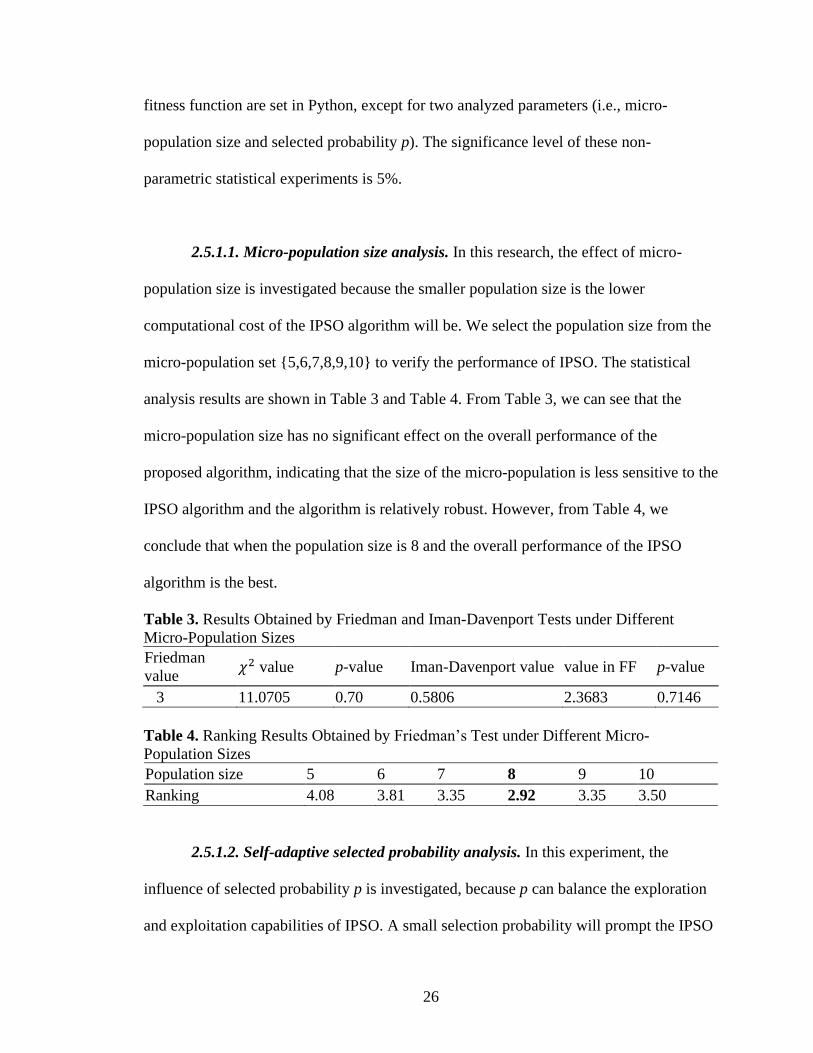
2.5.1.1. Micro-population size analysis. In this research, the effect of micro-
population size is investigated because the smaller population size is the lower
computational cost of the IPSO algorithm will be. We select the population size from the
micro-population set {5,6,7,8,9,10} to verify the performance of IPSO. The statistical
analysis results are shown in Table 3 and Table 4. From Table 3, we can see that the
micro-population size has no significant effect on the overall performance of the
proposed algorithm, indicating that the size of the micro-population is less sensitive to the
IPSO algorithm and the algorithm is relatively robust. However, from Table 4, we
conclude that when the population size is 8 and the overall performance of the IPSO
algorithm is the best.
Table 3. Results Obtained by Friedman and Iman-Davenport Tests under Different
Micro-Population Sizes
Friedman
value 𝜒2 value p-value Iman-Davenport value value in FF p-value
3 11.0705 0.70 0.5806 2.3683 0.7146
Table 4. Ranking Results Obtained by Friedman’s Test under Different Micro-
Population Sizes
Population size 5 6 7 8 9 10
Ranking 4.08 3.81 3.35 2.92 3.35 3.50
2.5.1.2. Self-adaptive selected probability analysis. In this experiment, the
influence of selected probability p is investigated, because p can balance the exploration
and exploitation capabilities of IPSO. A small selection probability will prompt the IPSO
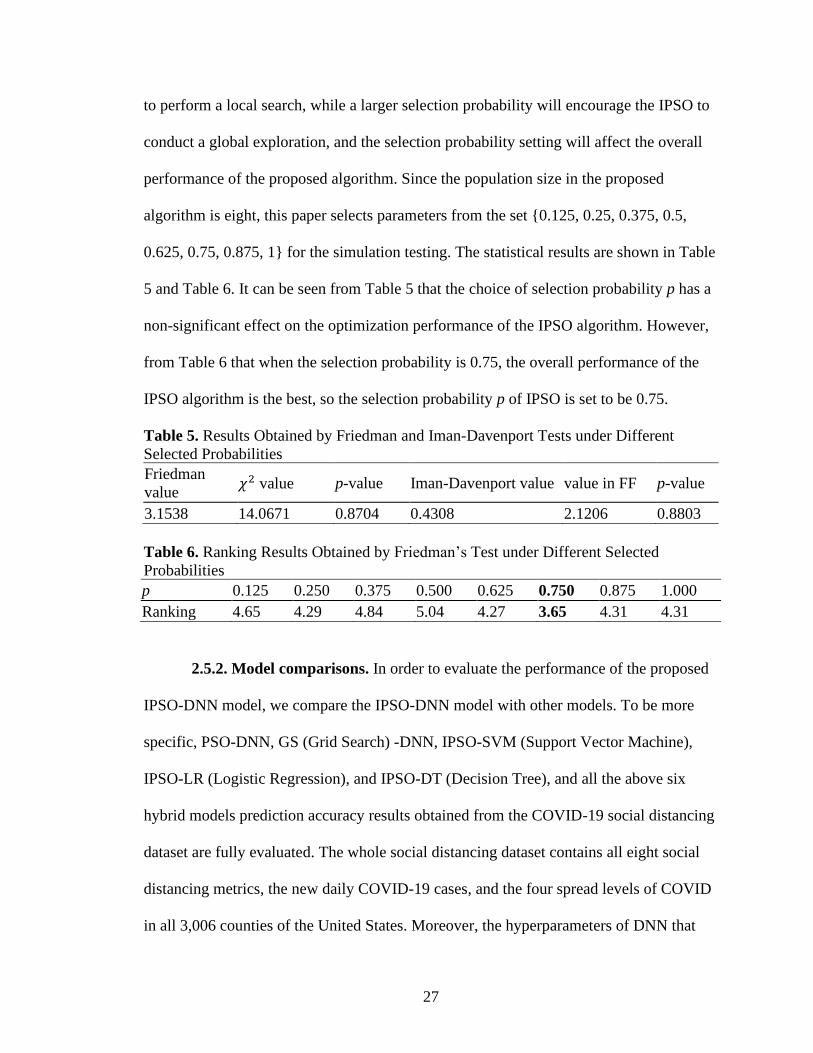
27
to perform a local search, while a larger selection probability will encourage the IPSO to
conduct a global exploration, and the selection probability setting will affect the overall
performance of the proposed algorithm. Since the population size in the proposed
algorithm is eight, this paper selects parameters from the set {0.125, 0.25, 0.375, 0.5,
0.625, 0.75, 0.875, 1} for the simulation testing. The statistical results are shown in Table
5 and Table 6. It can be seen from Table 5 that the choice of selection probability p has a
non-significant effect on the optimization performance of the IPSO algorithm. However,
from Table 6 that when the selection probability is 0.75, the overall performance of the
IPSO algorithm is the best, so the selection probability p of IPSO is set to be 0.75.
Table 5. Results Obtained by Friedman and Iman-Davenport Tests under Different
Selected Probabilities
Friedman
value 𝜒2 value p-value Iman-Davenport value value in FF p-value
3.1538 14.0671 0.8704 0.4308 2.1206 0.8803
Table 6. Ranking Results Obtained by Friedman’s Test under Different Selected
Probabilities
p 0.125 0.250 0.375 0.500 0.625 0.750 0.875 1.000
Ranking 4.65 4.29 4.84 5.04 4.27 3.65 4.31 4.31
2.5.2. Model comparisons. In order to evaluate the performance of the proposed
IPSO-DNN model, we compare the IPSO-DNN model with other models. To be more
specific, PSO-DNN, GS (Grid Search) -DNN, IPSO-SVM (Support Vector Machine),
IPSO-LR (Logistic Regression), and IPSO-DT (Decision Tree), and all the above six
hybrid models prediction accuracy results obtained from the COVID-19 social distancing
dataset are fully evaluated. The whole social distancing dataset contains all eight social
distancing metrics, the new daily COVID-19 cases, and the four spread levels of COVID
in all 3,006 counties of the United States. Moreover, the hyperparameters of DNN that

28
are optimized in this Part Ⅱ include: 1) number of hidden layers on the range [1, 100]; 2)
number of neurons in each layer on the range [1, 8]; 3) activation functions consist of
Sigmoid, ReLU, Softmax, and Tanh; and 4) the learning rate of DNN model on the range
[0.01, 0.99].
All the experiments were conducted using Python language on a 4-core machine
with 3.60 GHz Intel® Core™ i7-7700 CPU and 16 GB RAM. In the case of IPSO and
PSO, the algorithm terminates when the maximum number of iterations 100 is reached or
when there is no difference between the mean squared errors of two consecutive
iterations. For the hybrid models, the models terminate when the maximum running time
1440 minutes is reached.
The performance of hybrid IPSO-DNN model on the validation and test stages is
examined using accuracy and the following three error measures, which are mean bias
error (MBE), mean absolute error (MAE), and root mean squared error (RMSE).
First of all, the accuracy helpful to evaluate performance of deep learning model
is based on the element from a matrix known as confusion matrix. A confusion matrix is
a table that is often used to describe the performance of a classification model on a set of
test data for which the true values are known. The “accuracy” of performance of hybrid
IPSO-DNN model are defined as following: TP TN
AccuracyTP TN FP FN
+=
+ + +, where “TP” is for
True Positive, “FP” is for False Positive, “TN” is for True Negative, and “FN” is for
False Negative. It is the most common measures of classification process, which can be
calculated as the ratio of correctly classified example to total number of examples.
Furthermore, MBE indicates whether the model over- or under-predicted in
general. 1
1( )
n
i ii
MBE y yn
=
= − .The lower MBE is the better the prediction model is. But you
29
might have zero as some differences are positive and others are negative MAE and
RMSE measure residual errors, which give a global idea of the difference between the
observed and forecast values. They are defined as 1
1 n
i ii
MAE y yn
=
= − , 2
1
1( )
n
i ii
RMSE y yn
=
= − where
n is the total number of observations, 𝑦�̂� is the prediction value and the yi is the actual
value of a data point. The lower the absolute values of the MBE, MAE and RMSE
indicate that IPSO-DNN model is better.
1) Comparison with IPSO-SVM, IPSO-LR, and IPSO-DT
In the first scenario, we compare the performance of IPSO algorithm based on
optimizing parameters technique for the deep learning models and three different
machine learning models to explore the effect of social distancing for COVID-19. SVM
is a basic machine learning technique which trains the dataset with feature vectors and
uses large margin for classification. In this Part Ⅱ, RBF kernel function is selected as the
SVM for regression (Yu, 2017). Logistic Regression (LR) technique is applied to
describe data and analyze the relationship between one dependent binary variable and on
or more nominal ordinal interval or ratio-level independent variables. Decision Tree (DT)
uses the tree representation and each leaf node corresponds to a class label and attributes
are represented on the internal node of the tree.
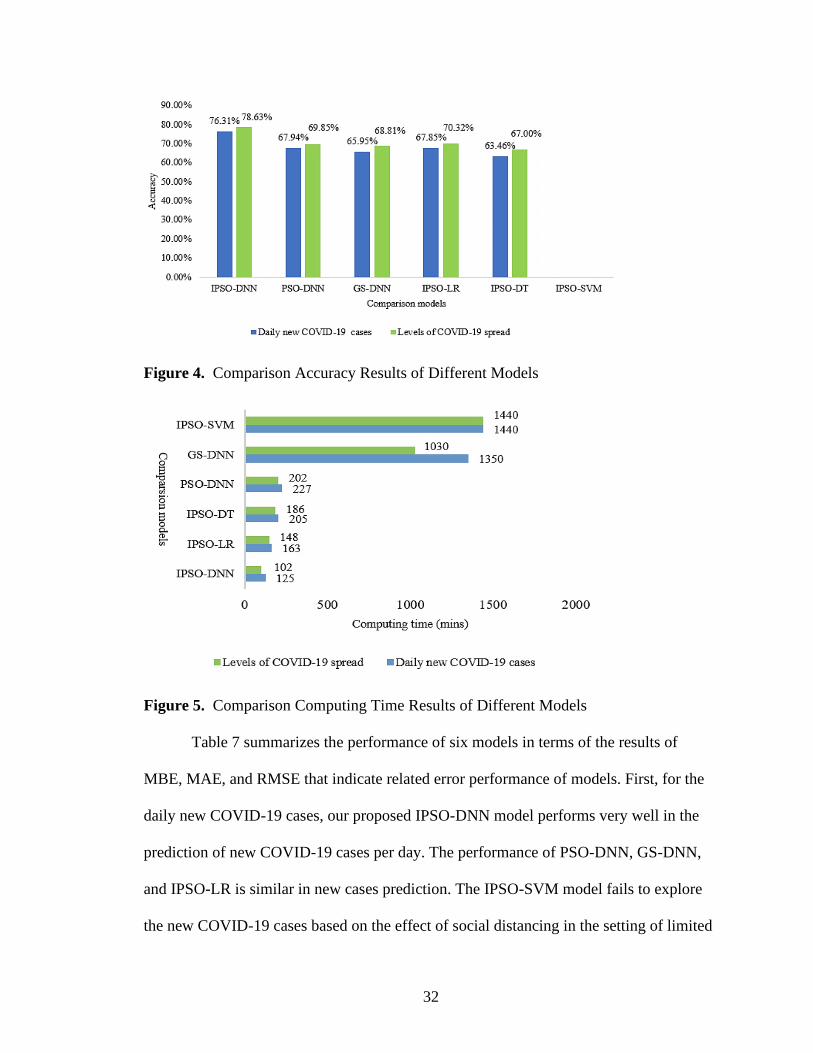
From Figure 4 and Figure 5, we observe that the IPSO-SVM model fails in the
experiments to explore the effect of social distancing for COVID-19 according to the
termination criteria. The learning time required of IPSO-LR, IPSO-DT and IPSO-DNN
models are 148, 186, and 102 minutes on predicting the four spread levels of COVID-19,
respectively; are 163, 205, and 125 minutes on projecting the new daily COVID-19 cases,
respectively. These figures also illustrate that a higher accuracy can be achieved when the

30
proposed IPSO-DNN model while has a minimum computing time compared to the
IPSO-LR and IPSO-DT models. This clearly exhibits the superiority of the DNN model
over basic machine learning models in terms of deal with large-scale dataset. Thus, the
proposed IPSO algorithm can serve as a promising candidate for parameter tuning of the
DNN model for the large-scale COVID-19 social distancing data analysis.
2) Comparison with PSO-DNN model
In the second scenario, the basic PSO algorithm is used to find the best
parameters for the DNN model to explore and predict the effect of social distancing for
COVID-19. The population size of PSO is 30 and other parameters are defined as the
same as IPSO algorithm. The reason of different population size between PSO and IPSO
is that the larger the population size, the more scattered the search performed in the PSO
algorithm. With a larger population size each generation takes more function calls, and a
larger part of the search space may be visited (Piotrowski, Napiorkowski, & Piotrowska,
2020). Therefore, we set the population size of PSO to 30 instead of 8 to give a better
outcome when comparing with the IPSO method. From Figure 4, we can see that the
accuracy of the IPSO-DNN model is higher than the PSO-DNN model. The generalized
opposition-based learning and self-adaptive strategy improve the performance of IPSO
algorithm to optimize the parameters of DNN model. For the PSO-DNN, as there is no
self-adaptive exploitation strategy to help the basic PSO algorithm to jump out of local
optimal and the search and optimization ability is also limited. From Figure 5, the
learning time required of the PSO-DNN model is 202 and 227 minutes on the four levels
of COVID-19 spread and the new daily COVID-19 cases prediction, respectively, which
show that the computing time of IPSO-DNN is much less than the PSO-DNN model, it
31
indicates the micro-population setting in the IPSO algorithm decreases the compute cost
of PSO algorithm. The results demonstrate that the proposed strategy of PSO in the
IPSO-DNN model make it outperforms PSO-DNN model on the COVID-19 social
distancing prediction.
3) Comparison with GS-DNN model
In the third scenario, the selectable parameter ranges of GS to optimize the DNN
model are as the same as the IPSO-DNN model. The GS algorithm is a common
approach for selecting parameter values of the DNN models. However, the GS approach
is time consuming and does not perform well in DNN hyperparameter optimization.
From Figure 4, we know that the prediction accuracy of the GS-DNN model is less than
IPSO-DNN both on the prediction of new daily COVID-19 cases and levels of COVID-
19 spread. From Figure 5, the learning time required of the GS-DNN model to predict the
new daily cases is 1,350 minutes and to forecast the four levels of COVID-19 spread is
1,030 minutes. Therefore, we can see that the performances of GS-DNN on prediction
accuracy and computing time both are worse than that of IPSO-DNN model. The main
reason is that the proposed IPSO-DNN model performs parameters in an evolutionary
way, which has the ability to balance the local exploitation and global exploration ability
during the parameter optimization. Therefore, we learn that our proposed IPSO-DNN
model outperforms the GS-DNN model as the proposed approach has the advantage of
exploring optimization parameters. The results manifest that our proposed IPSO based
parameter selection technique can be computationally efficient to determine the
hyperparameters of DNN model.
32
Figure 4. Comparison Accuracy Results of Different Models
Figure 5. Comparison Computing Time Results of Different Models
Table 7 summarizes the performance of six models in terms of the results of
MBE, MAE, and RMSE that indicate related error performance of models. First, for the
daily new COVID-19 cases, our proposed IPSO-DNN model performs very well in the
prediction of new COVID-19 cases per day. The performance of PSO-DNN, GS-DNN,
and IPSO-LR is similar in new cases prediction. The IPSO-SVM model fails to explore
the new COVID-19 cases based on the effect of social distancing in the setting of limited

33
computation time. Although the results of the MAE and RMSE are similar in the IPSO-
DNN and IPSO-DT models, the MBE result of the IPSO-DT model is negative that
indicates the model under-predict the daily new COVID-19 cases in this situation. The
above results show that the self-adaptive strategy can help IPSO algorithm to adjust the
prediction direction to find out optimization parameter for DNN model. Furthermore, for
the prediction of COVID-19 spread levels, IPSO-SVM model still cannot performs the
analysis of social distancing metrics in a limited experience time. The IPSO-DT is also an
under-predicted model to predict the spread of COVID-19 based on the influence of
social distancing according to the result of the MBE. The performances of PSO-DNN,
GS-DNN, IPSO-LR are similar in the prediction of daily new cases and spread levels for
COVID-19. However, the proposed IPSO-DNN model outperforms the other compared
models in the MBE, MAE, and RMSE results. The summary results demonstrate that the
proposed IPSO-DNN model provides better prediction results than other compared
models as the proposed methods have the advantage of employing optimal parameters.
And it also shows that the IPSO model with self-adaptive strategy and generalized
opposition-based learning strategy is significant to predict the effect of social distancing
on COVID-19 spread.
Table 7. Results of Six Models for COVID-19 Social Distancing Prediction
Model Daily new COVID-19 cases Levels of COVID-19 spread
MBE MAE RMSE MBE MAE RMSE
IPSO-DNN 4.6767 4.8177 45.0471 0.4160 0.4755 1.0313
PSO-DNN 6.4295 6.8436 52.6956 0.6932 0.6636 1.2112
GS-DNN 7.4152 7.4152 65.8293 0.7569 0.7575 1.3121
IPSO-SVM - - - - - -
IPSO-LR 6.3868 6.4229 55.5791 0.6291 0.6562 1.2086
IPSO-DT -0.5064 5.7326 45.7731 -0.0336 0.6385 1.1933
34
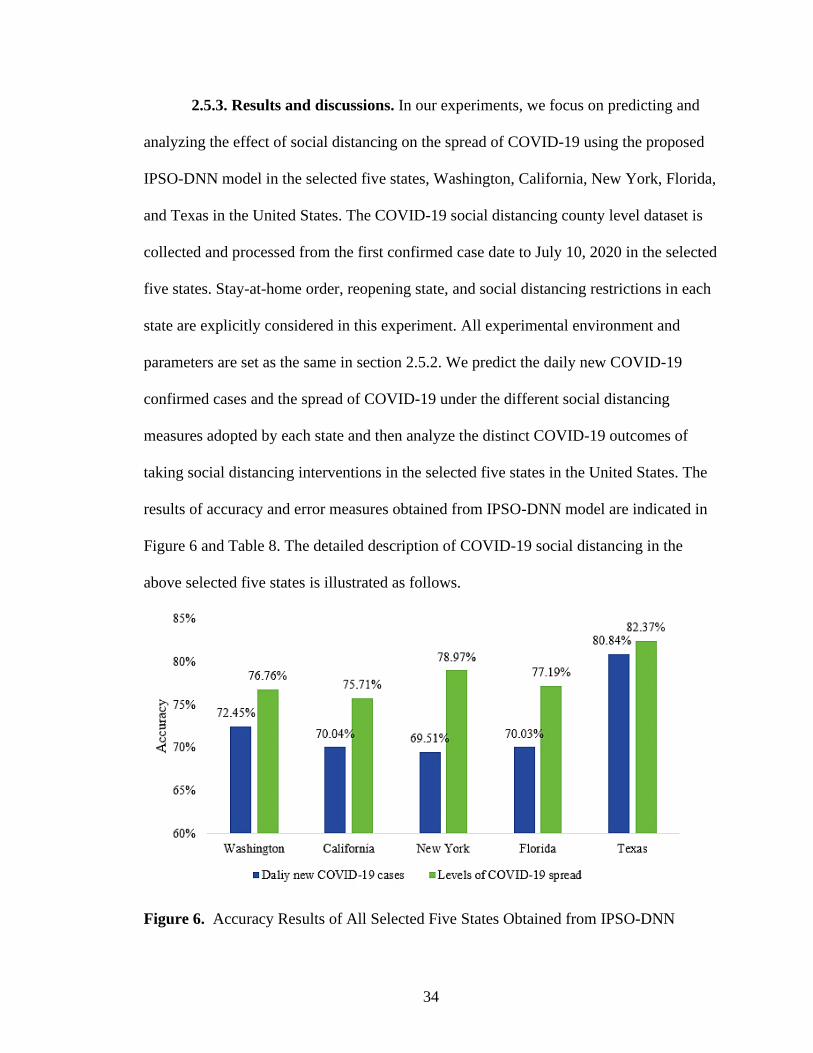
2.5.3. Results and discussions. In our experiments, we focus on predicting and
analyzing the effect of social distancing on the spread of COVID-19 using the proposed
IPSO-DNN model in the selected five states, Washington, California, New York, Florida,
and Texas in the United States. The COVID-19 social distancing county level dataset is
collected and processed from the first confirmed case date to July 10, 2020 in the selected
five states. Stay-at-home order, reopening state, and social distancing restrictions in each
state are explicitly considered in this experiment. All experimental environment and
parameters are set as the same in section 2.5.2. We predict the daily new COVID-19
confirmed cases and the spread of COVID-19 under the different social distancing
measures adopted by each state and then analyze the distinct COVID-19 outcomes of
taking social distancing interventions in the selected five states in the United States. The
results of accuracy and error measures obtained from IPSO-DNN model are indicated in
Figure 6 and Table 8. The detailed description of COVID-19 social distancing in the
above selected five states is illustrated as follows.
Figure 6. Accuracy Results of All Selected Five States Obtained from IPSO-DNN

35
Table 8. Results of Five States for COVID-19 Social Distancing Prediction
State Daily new COVID-19 cases Levels of COVID-19 spread
MBE MAE RMSE MBE MAE RMSE
Washington 6.2397 6.2397 23.9902 0.3738 0.5447 1.1004
California 26.2249 26.2249 30.1224 0.2756 0.5359 1.0723
New York 27.0441 27.5170 35.2950 0.1264 0.5069 0.9628
Florida 16.9829 18.0634 89.2466 0.2382 0.5958 1.0907
Texas 4.7137 5.2478 47.3079 0.3268 0.3877 0.9545
1) Washington
Since the Centers for Disease Control and Prevention (CDC) confirmed the first
case of 2019 Novel Coronavirus in the United States was occurred in the state of
Washington on January 21, 2020, the COVID-19 pandemic first begins to outbreak in the
state of Washington (Branswell, 2020). Because there was no vaccination useful for
COVID-19 pandemic in that time, therefore Washington state issued a stay-at-home order
on March 23 and reopened the state step by step on May 31 later. Using the IPSO-DNN
model, we can obtain the prediction results of the effect of social distancing on the spread
of COVID-19 in Washington state. Firstly, from Figure 6, we can see that our proposed
IPSO-DNN model acquires 72.45% and 76.46% accuracy in the prediction of new daily
COVID-19 cases and levels of COVID-19 spread, respectively. In Table 15, the results of
error measures MBE, MAE, and RMSE are 6.2397, 6.2397, and 23.9902 on the
prediction of new daily COVID-19 cases, respectively. And the results of these error
measures are 0.3738, 0.5447, and 1.1004 on the forecasting of COVID-19 spread levels,
respectively. The above prediction results manifest that the optimized IPSO-DNN model
can self-adaptive tuning parameters of DNN for Washington state to achieve more than
70% prediction accuracy with little errors.
Secondly, Figure 7 presents that the spread of COVID-19 has slowing down with
the efforts of related social distancing measures, though these aggressive interventions do

36
not show immediate results, which are essential to control COVID-19 in the future. The
duration of adopting restricted social distancing is 69 days in Washington. From levels of
COVID-19 spread, we can know that the number of new cases in Washington kept
growing for 34 days from February 29, 2020 to April 2, 2020. And after issued stay-at-
home order on March 23, there was a distinctively outcome that the spread of COVID-19
has been moderated for 32 days and controlled for 30 days in Washington. However,
reopening the state on May 31 which means that social distancing orders would not be
taken as aggressively as before, so that the progress of control this coronavirus has been
slow down and the level of cumulative COVID-19 cases still increased in Washington till
to the end, July 10, 2020. Therefore, following a spike in COVID cases in July,
Washington announced a pause to the Safe Start reopening plan.
Finally, in Figure 8, we can see that the effective social distancing measures
mitigate the spread of COVID-19 pandemic with a significant decline in the new daily
COVID-19 cases and extend the time to double the cumulative cases in Washington
during social distancing period. In addition, we can learn that reopening Washington state
reduces the implementation efforts of social distancing policies and changes the mobility
metrics values in the state, which also makes the daily new COVID-19 cases increasing
and the time to double the cumulative cases decreasing from May 31, 2020 to July 10,
2020. After social distancing, the daily new COVID-19 cases are decreasing in
Washington state. We can see that there is a relationship between social distancing and
the spread of COVID-19, In general, if social distancing intervention has been
implemented strictly and longer, COVID-19 infections would decrease quickly in an even
shorter time. The above results also manifest that our proposed IPSO-DNN model has the

37
ability to adjust the prediction direction continually to predict the effect of social
distancing on the spread of COVID-19 pandemic based on the changing value of mobility
and social distancing metrics in Washington.
Figure 7. Cumulative COVID-19 Cases & Daily Growth Rate in Washington
Figure 8. Daily New Cases & Time to Double Cumulative Cases in Washington
2) California
California is the second state where the COVID-19 pandemic outbroke after the
first state Washington in the United States. Its first case of coronavirus was confirmed in
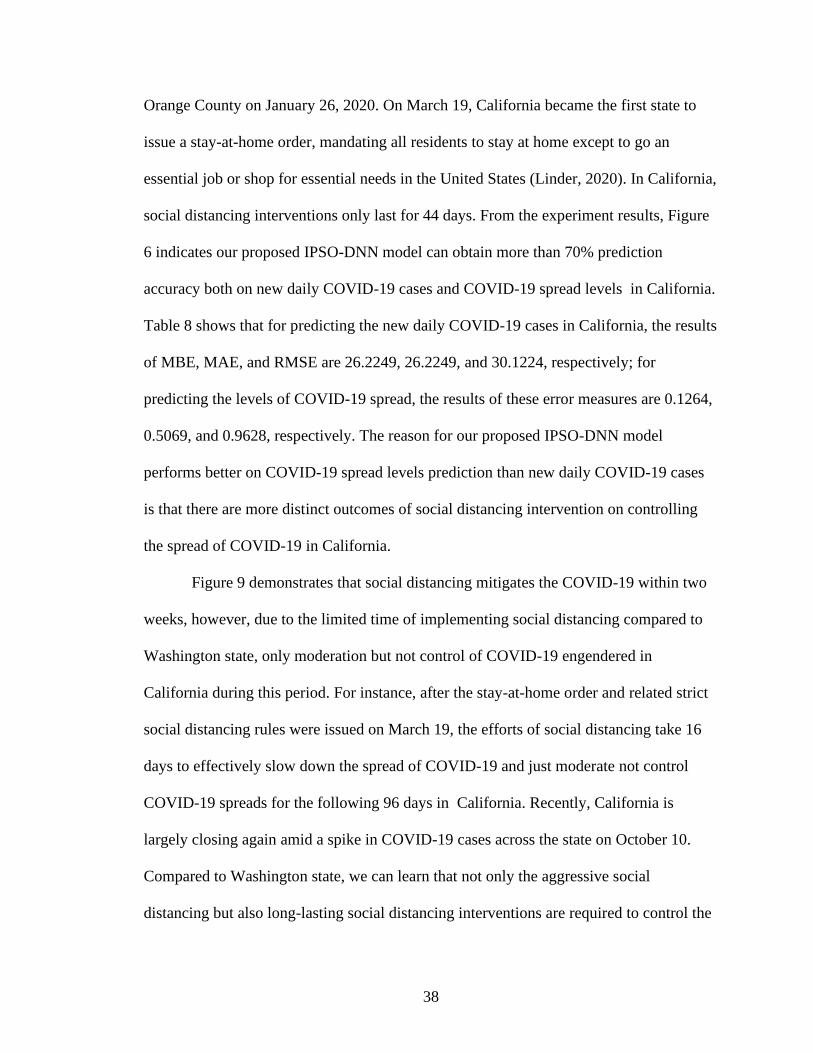
38
Orange County on January 26, 2020. On March 19, California became the first state to
issue a stay-at-home order, mandating all residents to stay at home except to go an
essential job or shop for essential needs in the United States (Linder, 2020). In California,
social distancing interventions only last for 44 days. From the experiment results, Figure
6 indicates our proposed IPSO-DNN model can obtain more than 70% prediction
accuracy both on new daily COVID-19 cases and COVID-19 spread levels in California.
Table 8 shows that for predicting the new daily COVID-19 cases in California, the results
of MBE, MAE, and RMSE are 26.2249, 26.2249, and 30.1224, respectively; for
predicting the levels of COVID-19 spread, the results of these error measures are 0.1264,
0.5069, and 0.9628, respectively. The reason for our proposed IPSO-DNN model
performs better on COVID-19 spread levels prediction than new daily COVID-19 cases
is that there are more distinct outcomes of social distancing intervention on controlling
the spread of COVID-19 in California.
Figure 9 demonstrates that social distancing mitigates the COVID-19 within two
weeks, however, due to the limited time of implementing social distancing compared to
Washington state, only moderation but not control of COVID-19 engendered in
California during this period. For instance, after the stay-at-home order and related strict
social distancing rules were issued on March 19, the efforts of social distancing take 16
days to effectively slow down the spread of COVID-19 and just moderate not control
COVID-19 spreads for the following 96 days in California. Recently, California is
largely closing again amid a spike in COVID-19 cases across the state on October 10.
Compared to Washington state, we can learn that not only the aggressive social
distancing but also long-lasting social distancing interventions are required to control the

39
spread of COVID-19. The new daily COVID-19 cases and time to double the cumulative
cases are described in Figure 10. There is no doubt that social distancing plays an
important role in decreasing the daily new cases and increasing the time to double the
cumulative cases in California. The results obtained from the proposed IPSO-DNN model
demonstrate that the significant effect of social distancing on mitigating COVID-19 in
California, and more importantly, the duration of social distancing interventions needs to
be lasting longer to help flatten the COVID-19 pandemic curve.
Figure 9. Cumulative COVID-19 Cases & Daily Growth Rate in California
Figure 10. Daily New Cases & Time to Double Cumulative Cases in California
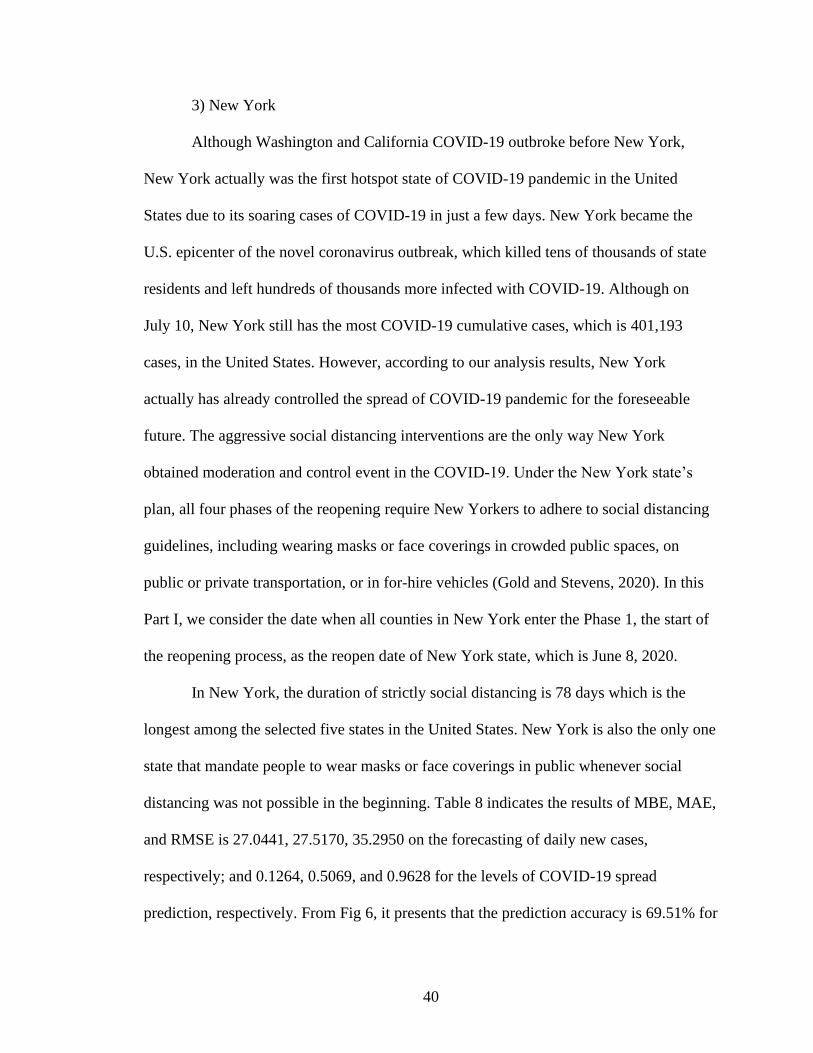
40
3) New York
Although Washington and California COVID-19 outbroke before New York,
New York actually was the first hotspot state of COVID-19 pandemic in the United
States due to its soaring cases of COVID-19 in just a few days. New York became the
U.S. epicenter of the novel coronavirus outbreak, which killed tens of thousands of state
residents and left hundreds of thousands more infected with COVID-19. Although on
July 10, New York still has the most COVID-19 cumulative cases, which is 401,193
cases, in the United States. However, according to our analysis results, New York
actually has already controlled the spread of COVID-19 pandemic for the foreseeable
future. The aggressive social distancing interventions are the only way New York
obtained moderation and control event in the COVID-19. Under the New York state’s
plan, all four phases of the reopening require New Yorkers to adhere to social distancing
guidelines, including wearing masks or face coverings in crowded public spaces, on
public or private transportation, or in for-hire vehicles (Gold and Stevens, 2020). In this
Part Ⅰ, we consider the date when all counties in New York enter the Phase 1, the start of
the reopening process, as the reopen date of New York state, which is June 8, 2020.
In New York, the duration of strictly social distancing is 78 days which is the
longest among the selected five states in the United States. New York is also the only one
state that mandate people to wear masks or face coverings in public whenever social
distancing was not possible in the beginning. Table 8 indicates the results of MBE, MAE,
and RMSE is 27.0441, 27.5170, 35.2950 on the forecasting of daily new cases,
respectively; and 0.1264, 0.5069, and 0.9628 for the levels of COVID-19 spread
prediction, respectively. From Fig 6, it presents that the prediction accuracy is 69.51% for

41
the daily new cases and 78.97% for the levels of COVID-19 spread. The accuracy result
of COVID-19 spread levels is higher than the new daily COVID-19 cases, presumably,
the new cases soaring up abruptly in such a short time that makes it hard to project.
Figure 11 and Figure 12 illustrate New York has controlled the spread of COVID-
19 and its new daily COVID-19 cases continue to decrease with implement aggressive
social distancing interventions for 78 days. After social distancing, the days of
moderation and control of COVID-19 are 33 days and 63 days, respectively. It is obvious
that social distancing helps to flatten the COVID-19 curve in New York. Moreover, it
makes sense that the number of new daily COVID-19 cases has continued decline and
flattened. However, we can see from Figure 12 that the time to double cumulative cases
does not steadily increase. It means that even if New York state has controlled COVID-
19 pandemic, it may be vulnerable to contagion from other states who fail to control the
COVID-19 or not conduct aggressive social distancing interventions. The above results
explicitly explain how social distancing flattens the COVID-19 pandemic curve in New
York using our proposed IPSO-DNN model.
Figure 11. Cumulative COVID-19 Cases & Daily Growth Rate in New York
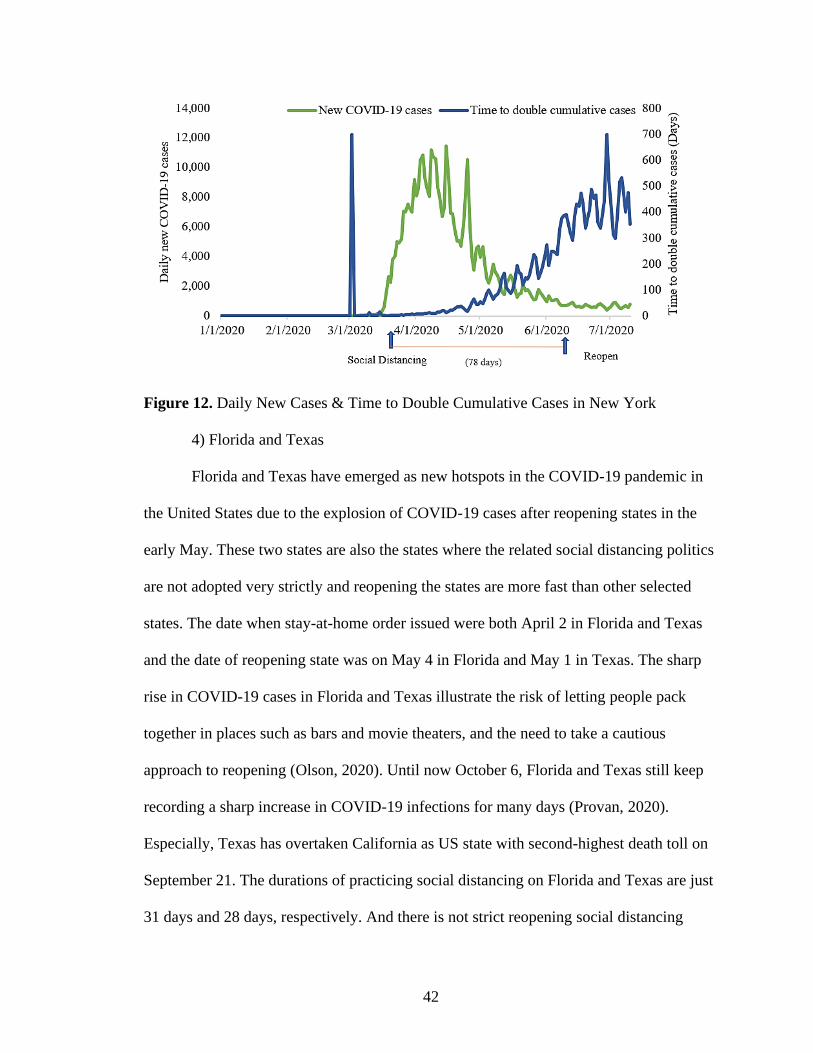
42
Figure 12. Daily New Cases & Time to Double Cumulative Cases in New York
4) Florida and Texas
Florida and Texas have emerged as new hotspots in the COVID-19 pandemic in
the United States due to the explosion of COVID-19 cases after reopening states in the
early May. These two states are also the states where the related social distancing politics
are not adopted very strictly and reopening the states are more fast than other selected
states. The date when stay-at-home order issued were both April 2 in Florida and Texas
and the date of reopening state was on May 4 in Florida and May 1 in Texas. The sharp
rise in COVID-19 cases in Florida and Texas illustrate the risk of letting people pack
together in places such as bars and movie theaters, and the need to take a cautious
approach to reopening (Olson, 2020). Until now October 6, Florida and Texas still keep
recording a sharp increase in COVID-19 infections for many days (Provan, 2020).
Especially, Texas has overtaken California as US state with second-highest death toll on
September 21. The durations of practicing social distancing on Florida and Texas are just
31 days and 28 days, respectively. And there is not strict reopening social distancing
43
guideline in these two states.
From Figure 6, we can know that the prediction accuracy result of Florida
obtained from IPSO-DNN model that is 70.03% on new daily COVID-19 cases and
77.19% on the levels of COVID-19 spread. Meanwhile, the accuracy of Texas on the
prediction of new daily COVID-19 cases and COVID-19 spread levels is 80.84% and
82.37%, respectively. It is noticed that the IPSO-DNN model performs better in Texas
than in Florida. Perhaps it is because Texas paused the state’s reopening plan after
reporting record increase in COVID-19 cases and hospitalizations in June (Jasmine,
2020). Therefore, Texas adopted more strict reopening guidelines and the values of
mobility are more stable to predict the spread of COVID-19 than Florida. From Table 8,
for predicting new daily COVID-19 cases, the result of MBE, MAE, and RMSE is
16.9829, 18.0634, and 89.2466 in Florida, 4.7137, 5.2478, and 47.3079 in Texas,
respectively; for estimating the levels of COVID-19 spread these results are 0.2382,
0.5958, and 1.0907 in Florida, 0.3268, 0.3877, and 0.9545 in Texas, respectively. In
general, these evaluation results demonstrate that our proposed model performs very well
on the spread of COVID-19 in the United States.
In Figure 13 and Figure 15, we can see that the COVID-19 is still rapid spreading
in Florida and Texas. Although these two states still suffer the COVID-19 pandemic,
there is a significant development of social distancing in mitigating the spread of
COVID-19. From Figure 14 and Figure 16, the results illustrate that Florida and Texas
perform very bad in reducing the COVID-19 cases due to the lack of restrict social
distancing guidelines. The new daily COVID-19 confirmed cases in Florida and Texas all
speed up and the time to double the cumulative cases has not reduce significantly after

44
reopening the state. It indicates that the consequence of COVID-19 outbreaks due to a
lack of lasting and aggressive social distancing interventions. Therefore, we learn that
social distancing plays a vital role in mitigating the spread of COVID-19 pandemic in
these states.
Table 8 shows the summary results of the MBE, MAE, and RMSE evaluation
measures acquired from our proposed IPSO-DNN model in the above selected five states.
The performance of IPSO-DNN on predicting levels of COVID-19 spread in all five
states is better than the daily new COVID-19 cases. It is possible that the value of daily
new cases is more random than levels of COVID-19 spread. In general, IPSO-DNN
model performs very well on the prediction of COVID-19 based on social distancing
influence in all the selected five states. Therefore, it reveals that the effect of social
distancing can be represented as mobility metrics which has a significant influence on the
COVID-19 spread. The duration of social distancing is also crucial to control this
COVID-19 pandemic.
Figure 13. Cumulative COVID-19 Cases & Daily Growth Rate in Florida

45
Figure 14. Daily New Cases & Time to Double Cumulative Cases in Florida
Figure 15. Cumulative COVID-19 Cases & Daily Growth Rate in Texas
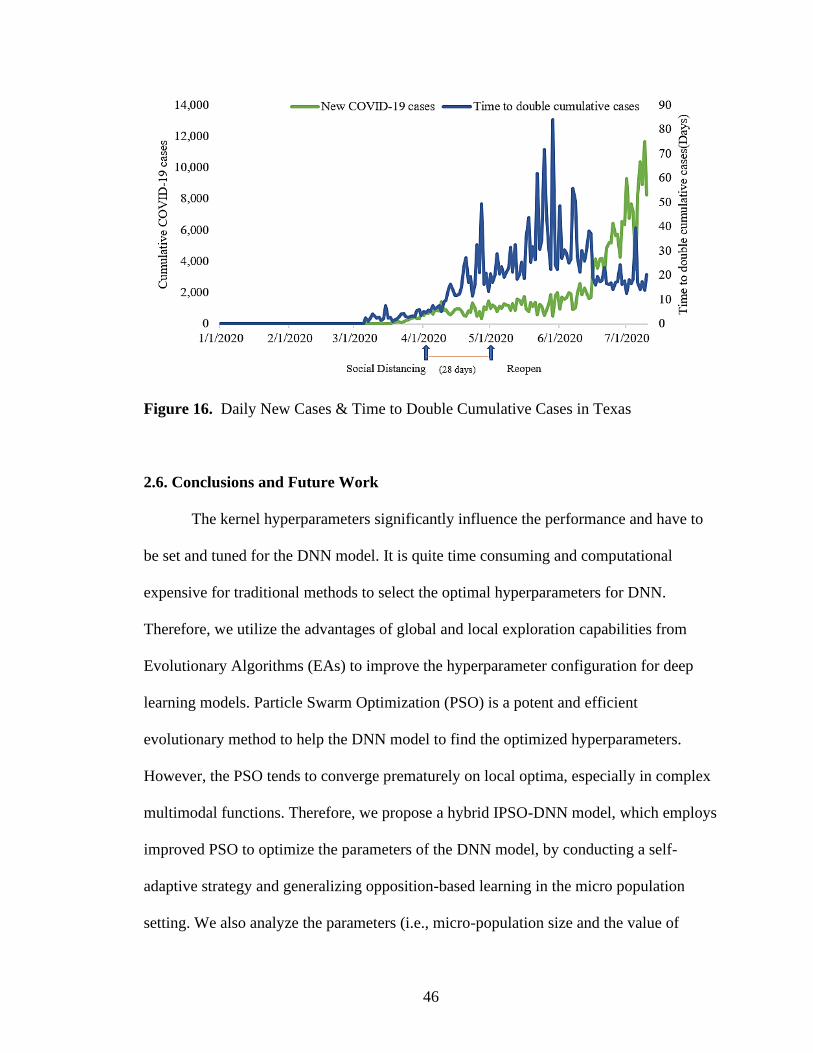
46
Figure 16. Daily New Cases & Time to Double Cumulative Cases in Texas
2.6. Conclusions and Future Work
The kernel hyperparameters significantly influence the performance and have to
be set and tuned for the DNN model. It is quite time consuming and computational
expensive for traditional methods to select the optimal hyperparameters for DNN.
Therefore, we utilize the advantages of global and local exploration capabilities from
Evolutionary Algorithms (EAs) to improve the hyperparameter configuration for deep
learning models. Particle Swarm Optimization (PSO) is a potent and efficient
evolutionary method to help the DNN model to find the optimized hyperparameters.
However, the PSO tends to converge prematurely on local optima, especially in complex
multimodal functions. Therefore, we propose a hybrid IPSO-DNN model, which employs
improved PSO to optimize the parameters of the DNN model, by conducting a self-
adaptive strategy and generalizing opposition-based learning in the micro population
setting. We also analyze the parameters (i.e., micro-population size and the value of

47
selected probability) on two nonparametric statistic tests, Friedman’s and Iman-
Davenport’s tests to find out the best parameters of IPSO algorithm to improve the
performance of DNN.
In Part Ⅰ, we explore the IPSO based parameter value selection technique
optimizes the DNN model by selecting the number of hidden layers, the number of
neurons in each layer, and the activation functions in each layer. Our results show that the
proposed IPSO-DNN model is useful and efficient in exploring the effect of social
distancing in deep learning on the spread of COVID-19. We demonstrate the
performance of our proposed hybrid model outperforms than other comparison models,
such as IPSO-SVM, IPSO-LR, IPSO-DT, PSO-DNN, and GS-DNN, in terms of
prediction accuracy and computing time. The results obtained indicate that the proposed
self-adaptive strategy can help IPSO algorithm to adjust the prediction direction and find
out optimization parameter for DNN model.
The developed model also explains how social distancing helps Washington,
California, New York, Florida, and Texas to flatten the COVID-19 curve in detail and
shows that social distancing is essential to control the spread of COVID-19, and the
duration and degree of implement social distancing interventions also matter. Therefore,
our proposed IPSO-DNN model provides an effective method for tuning the
hyperparameters of DNN in a self-adaptive evolutionary way and holds great potential to
predict the effect of social distancing on the spread of COVID-19.
As for future work, we intend to explore the IPSO and other improved
evolutionary algorithms to optimize larger DNN or other deep learning techniques, such
as Convolutional Neural Networks (CNN) and Recurrent Neural Networks (RNN) for

48
solving multiple and challenging tasks in the emergency management. We will also
consider many new powerful activation functions, such as Softplus, MPELU, PreLU,
EreLU to improve the performance of deep learning models. Moreover, there are some
other improved versions of PSO algorithm, for instance, the proposed exploiting
barebones PSO (BBePSO) and a dynamic exploiting barebones PSO (DBBePSO) that
performance very well on optimizing hyperparameters. Furthermore, we would consider
normalizing the COVID-19 social distancing data to improve model performances and
further explore the effect of social distancing on the spread of COVID-19 in the United
States. Therefore, we will focus on developing evolutionary algorithms and the
systematic adaptation schemes in hyperparameters configurations which will balance the
exploration and exploitation of the hyperparameter space in the deep machine learning
models.
49
3. PART Ⅱ: EXPLORING THE CONTAGION EFFECT OF SOCIAL MEDIA ON
MASS SHOOTINGS
3.1. Introduction
Incidents of mass shooting violence galvanize public attention. There has been
extensive coverage of many mass shooting incidents in the United States in which large
number of people injured or killed over the past decades. Although there is no universally
accepted definition of a mass shooting, we follow the definition of Congressional
Research Service, that is, a multiple homicide incident in which four or more victims are
murdered with firearms—not including the offender(s)—within one event, and at least
some of the murders occurred in a public location or locations in close geographical
proximity (e.g., a workplace, school, restaurant, or other public settings), and the murders
are not attributable to any other underlying criminal activity or commonplace
circumstance (e.g., armed robbery, criminal competition, insurance fraud, argument, or
romantic triangle) (Krouse & Richardson, 2015). These mass shootings are rare events –
they constitute less than 15% of all mass killings in the United States and are responsible
for less than 0.5% of all firearm homicides (Duwe, 2020) – however, they have far-
reaching impacts on citizens’ mental health, anxiety, and live lost (Lowe & Galea, 2017).
In the United States, the number of mass shootings has grown steadily over the
past few years. This rise in mass shootings has been linked to the “media contagion”
theory, which suggests that society’s never-ending news cycle has a “copycat” effect on
these crimes (Surette, 2014). It is important to note that the primary media circulating this
news are not just television and newspapers anymore, but also social media platforms and
online news sources, which become the largest part of communication platforms and
50
information sources in the world. These new media, including Facebook, Twitter, and
online blogs, have made the spread of information about mass shootings nearly effortless.
It is no coincidence that connections have been made between social media milestones
and the number of mass shooting incidents in the United States.
The spread of information on social media has a contagious effect on crimes.
Taking Parkland school shooting on Valentine’s Day in 2018 as an example, survivors
and witnesses sent videos and news of the events on Snapchat, Facebook, Instagram, and
Twitter. In addition, related online communities developed members who treat the
shooters as heroes and create fans and followers who obsess about the shooters, wanting
to imitate them in terms of how they dress, what expressions they use, and how many
people they kill (Raitanen & Oksanen, 2018). Two weeks after the Parkland school
shooting, 638 copycat threats targeted schools nationwide. These threats are often joking
or hoaxes that spread through social media, but they can still be harmful. Moreover,
online platforms like Twitter incite gun violence and spread the manifestos of multiple
mass shooters to the public. In general, the spread of mass shooting incidents on social
media is very contagious and has a bad impact on society. Furthermore, the heavy social
media use leads to higher rates of loneliness, anxiety, and depression, which precipitate
mental health factors that could increase the incidence of similar violent events.
Therefore, social media plays a significant role in facilitating mass shootings incidents,
and if harnessed properly, social media could be used to prevent mass shootings.
As discussed above, the self-excitation contagion effect is found in mass shooting
incidents, as the spread of related gun violence information on social media has a
contagious effect on mass shootings. Therefore, in Part Ⅱ, we explore the spread of mass
51
shooting news and opinions on social media platforms (e.g., Twitter) and how the
contagious effect on these incidents is developed. The well-known self-excited contagion
model proposed by Hawkes (Hawkes, 1971) has been applied to a wide variety of
applications, such as gang violence, civilian deaths, social media data, and financial
markets. In this contagion model, recent prior events increase the probability of another
event happening in the near future. The first research objective of Part Ⅱ is to propose a
self-excited contagion model to predict the future number of mass shooting incidents in
the United States. Second, we explore the contagion effect of social media (i.e., Twitter)
in the proposed contagion model by focusing on sentiment analysis of Twitter data in
mass shootings. In addition, as we know that there was a COVID-19 pandemic outbreaks
in the United States in the unique year of 2020. Despite the response policy of stay-at-
home orders and lockdowns to the coronavirus pandemic, according to the mass shooting
data provided by the Gun Violence Archive (Gun Violence Archive, 2021), mass
shootings in the U.S. have risen sharply of 2020 and there were 610 mass shooting
incidents, this gun violence killed nearly 20,000 Americans, more than any other year in
at least two decades. Therefore, in order to better predict mass shootings under the
COVID-19 pandemic, we also improve the proposed self-excited contagion model with
the consideration of social distance practices and daily growth rate of COVID-19 cases in
2020.
The major contributions of Part Ⅱ are summarized as follows:
1) Sentiment analysis on Twitter data using ML models is conducted to forecast the
change in public attitudes towards mass shootings over time. One of the major
challenges when applying sentiment analysis is how to improve prediction
52
performance, and we propose to use the improved ML model. Therefore, Support
Vector Machine (SVM), Logistics Regression (LR), and IPSO-DNN model are
explored to classify and predict a data corpus of 5,287,396 related mass shooting
tweets collected from 2013 to 2020. Sentiment prediction results demonstrate that
the proposed IPSO-DNN model outperforms SVM and LR models in predicting
the accuracy of public attitudes towards mass shootings on Twitter. The IPSO-
DNN model provides an insight to improve the performance of sentiment analysis
on social media data. Furthermore, experiments present that a positive attitude,
such as thinking about mass shooting incidents in a positive way and intending to
copycat them in the future, is essential to analyze and predict the number of mass
shootings in the United States.
2) A self-excited contagion model is proposed to explore the contagion effect of
Twitter on mass shootings. The goal of this proposed contagion model is to predict
the future number of mass shooting incidents in the United States. The proposed
contagion model employs a Power-law kernel function, which fully considers the
spread of mass shootings on Twitter and the influence magnitude of each mass
shooting incident to explore the contagious effect of Twitter data on mass
shootings. Experimental results show that the proposed contagion model has a
remarkable ability to predict future mass shootings in the United States. It is also
found that the spread of opinions on social media has a convincing contagious
effect on mass shootings.
3) In order to explore the effect of COVID-19 on mass shootings in 2020, we also
improve the proposed contagion model to enhance the prediction performance of
53
future mass shootings under the COVID-19 pandemic. A challenge of this
improvement is how to quantify the impacts of COVID-19 on mass shootings.
Therefore, we measure the effects of COVID-19 on mass shootings by introducing
the social distancing index and the daily growth rate of COVID-19 cases into the
improved contagion model. Results demonstrate that COVID-19 has had a
significant impact on mass shooting incidents in the United States in the unique
year of 2020. In experiments, the improved contagion model performs very well in
predicting the number of mass shootings under the COVID-19 pandemic in 2020.
3.2. Literature Review
3.2.1. Contagion effect of media on mass shootings. Studies indicate that the
more media attention the gun shooters get, the more likely the event will inspire a future
mass shooting incident. A contagion effect has been suggested in which the occurrence of
a mass shooting increases the likelihood of another mass shooting in the near future. For
instance, Lankford & Tomek (2018) found that media coverage of a mass shooting may
increase the frequency and lethality of future shootings in more than two weeks. Jetter &
Walker (2018) explored mass shootings between January 1, 2013, and June 23, 2016, and
found that 58% of mass shootings can be explainable by news coverage, which will
systematically cause future mass shootings. Moreover, the media coverage systematically
raises the number of mass shootings in the following four to ten days and the effect
reverts to statistical insignificance after approximately 12 days. Murray (2017) suggested
that the entertainment-oriented news coverage of mass shootings will provide sources of
information and scripts for potential killers to guide them in formulating motives and
54
organizational behaviors for their violent acts. McGinty, Webster & Barry (2013) tested
the effects of news stories about mass shootings on public attitudes towards people with
serious mental illness and support for gun control polices. Meindl & Ivy (2017) provided
an overview of generalized imitation and discussed how the way the mass shooting is
reported by the media can increase the likelihood of another shooting event.
In recent decades, the emergency of several new forms of media (e.g., websites,
social media, blogs, smartphone applications) has revolutionized the communication and
social interaction paradigms (Ortiz & Khin, 2018). Especially, social media platforms,
such as Twitter, Facebook, and Instagram, constitute a major platform for communicating
and expressing opinions, and people increasingly rely on social media platforms to learn
news and information. Social media is used as the main discussion channel by millions of
people every day. However, little is known about the contagion effects of information
dissemination on social media. Relevant studies of social media have been only focused
on its emotions, information diffusion, and politics, such as Xiong et al. (2018) proposed
an emotional independent cascade model, in which individual emotions can affect the
subsequent emotions of his/her friends to show the detailed process and characteristics of
emotional contagion in social media, and Stieglitz & Dang-Xuan (2013) examined
whether the sentiment occurring in social media content is associated with a user’s
information sharing behavior, and carried out the research in the context of political
communication on Twitter. There is little research analyzing the contagion effect on
social media. Moreover, with the onset of the COVID-19 pandemic, social media has
rapidly become a crucial communication tool for mass shooting information generation,
dissemination, and consumption. Despite the United States response to the coronavirus
55
pandemic using stay-at-home orders and lockdowns, the number of mass shooting
incidents has been greatly increased under COVID-19 pandemic in 2020. Therefore, it is
very emergent and vital to explore the contagion effect of social media on mass shootings
in the United States.
3.2.2. Contagion model. Contagion effects, similar to “copycat” effects, refer to
behaviors that can be “contagious” and spread across a population. Hawkes (1971) was
the first one to develop the well-known self-exciting process based on the counting
process, in which the intensity function explicitly depends on all previous events. The
self-excited Hawkes process has wide applications. For example, Lewis et al. (2012)
developed a self-exciting point process model to characterize temporal patterns of violent
civilian deaths. Mitchell & Cates (2009) simulated time series for the Hawkes process
provides to analyze the dynamics of YouTube viewing numbers. Mohler et al. (2011)
illustrated the implementation of the self-exciting point process model in urban crimes,
and used a fully nonparametric estimation methodology to gain insight into the form of
the space-time triggering function and temporal trends in the background rate of burglary.
Dassios & Zhao (2012) considered the risk process of claim arrival modelled by the
dynamic contagion process, which is a generalization of the Cox process and the Hawkes
process in the finance and insurance. Rizoiu et al. (2018) established a novel connection
between the epidemic model and the Hawkes point processes for online information
modeling in geophysics and finance.
Research on the contagious effects of gun violence has become popular recently,
but more attention is still needed on this topic. In the context of gun violence, the
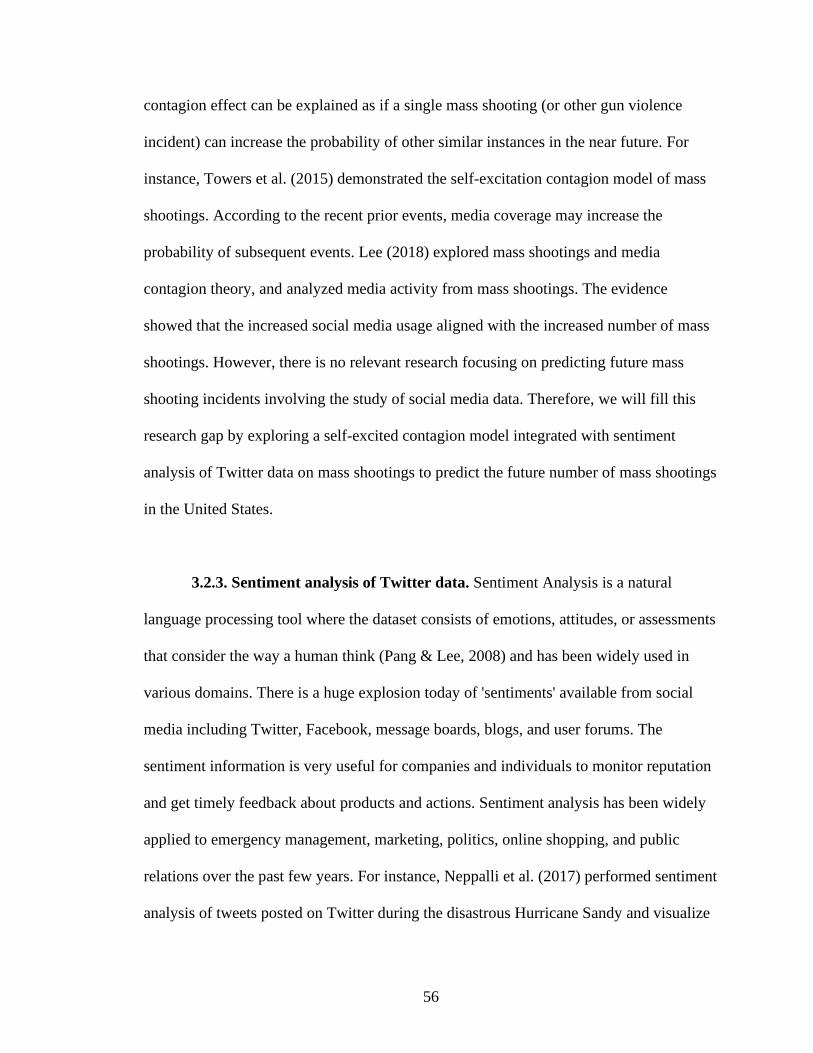
56
contagion effect can be explained as if a single mass shooting (or other gun violence
incident) can increase the probability of other similar instances in the near future. For
instance, Towers et al. (2015) demonstrated the self-excitation contagion model of mass
shootings. According to the recent prior events, media coverage may increase the
probability of subsequent events. Lee (2018) explored mass shootings and media
contagion theory, and analyzed media activity from mass shootings. The evidence
showed that the increased social media usage aligned with the increased number of mass
shootings. However, there is no relevant research focusing on predicting future mass
shooting incidents involving the study of social media data. Therefore, we will fill this
research gap by exploring a self-excited contagion model integrated with sentiment
analysis of Twitter data on mass shootings to predict the future number of mass shootings
in the United States.
3.2.3. Sentiment analysis of Twitter data. Sentiment Analysis is a natural
language processing tool where the dataset consists of emotions, attitudes, or assessments
that consider the way a human think (Pang & Lee, 2008) and has been widely used in
various domains. There is a huge explosion today of 'sentiments' available from social
media including Twitter, Facebook, message boards, blogs, and user forums. The
sentiment information is very useful for companies and individuals to monitor reputation
and get timely feedback about products and actions. Sentiment analysis has been widely
applied to emergency management, marketing, politics, online shopping, and public
relations over the past few years. For instance, Neppalli et al. (2017) performed sentiment
analysis of tweets posted on Twitter during the disastrous Hurricane Sandy and visualize

57
online users' sentiments on a geographical map centered around the hurricane. However,
little attention to sentiment analysis has been paid to gun violence. The most relevant
work is Wang et al. (2016) which focused on mass shooting and the public attitudes
towards gun-control policy. To the best of our knowledge, we are the first to predict the
future number of mass shooting incidents based on the sentiment analysis of Twitter data
on mass shootings.
Applying sentiment analysis using ML techniques on Twitter is the new
upcoming trend with researchers recognizing the advantage of ML and the scientific trials
and its potential applications. For instance, Amolik et al. (2016) proposed a highly
accurate model of sentiment analysis of Twitter data with respect to movie reviews, with
the help of feature vector and supervised machine learning classifiers. Neethu & Rajasree
(2013) analyzed Twitter data by creating a new feature vector in sentiment analysis and
compare its performance with different classifiers based on machine learning approach.
Pak & Paroubek (2010) built a performed sentiment classifier by using corpus which is
automatically collected in tweets, to determine the sentiment polarity in a document. Go,
Gautam & Yadav (2014) applied semantic analysis to select feature list, and then
compare the measurement of the precision parameters on different machine learning
techniques. Kouloumpis & Moore (2011) took a supervised machine learning approach to
investigate the utility of linguistic features for detecting the sentiment of twitter data.
Mittal & Goel (2012) applied sentiment analysis and machine learning techniques to
explore the correlation between public sentiment and market sentiment for the stock
prediction. In Part Ⅱ, one of the major challenges when applying sentiment analysis is
how to improve prediction performance accuracy and we propose to use the improved
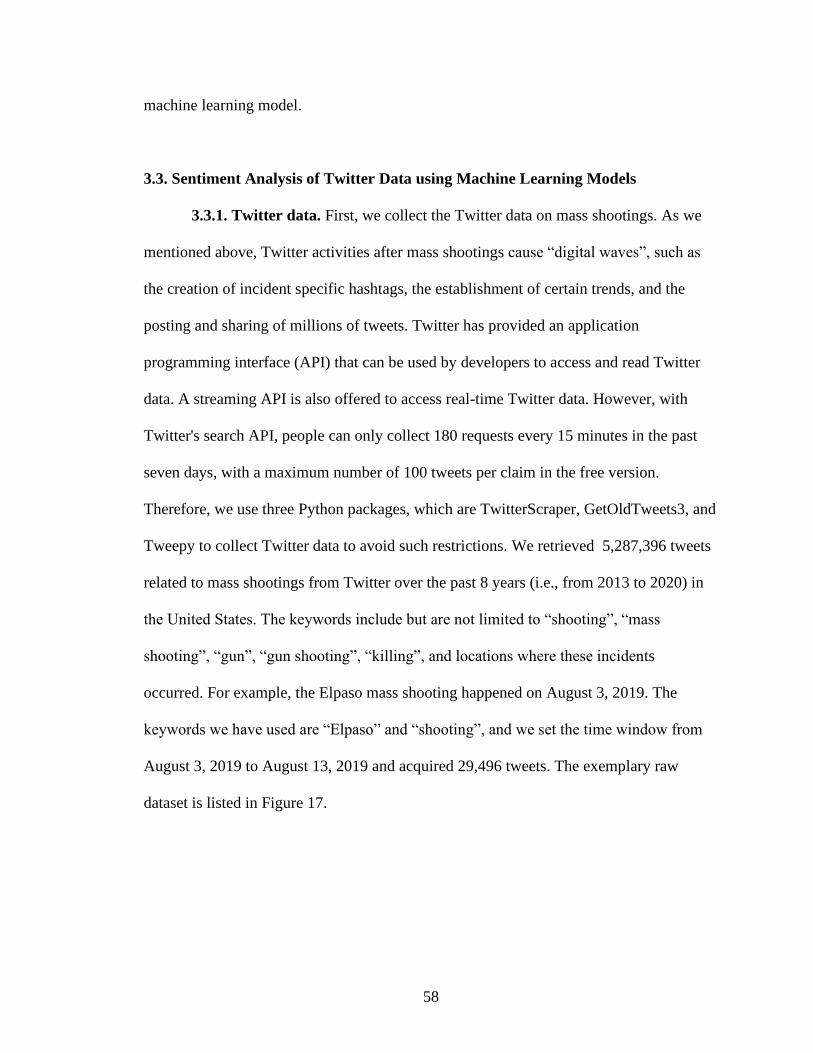
58
machine learning model.
3.3. Sentiment Analysis of Twitter Data using Machine Learning Models
3.3.1. Twitter data. First, we collect the Twitter data on mass shootings. As we
mentioned above, Twitter activities after mass shootings cause “digital waves”, such as
the creation of incident specific hashtags, the establishment of certain trends, and the
posting and sharing of millions of tweets. Twitter has provided an application
programming interface (API) that can be used by developers to access and read Twitter
data. A streaming API is also offered to access real-time Twitter data. However, with
Twitter's search API, people can only collect 180 requests every 15 minutes in the past
seven days, with a maximum number of 100 tweets per claim in the free version.
Therefore, we use three Python packages, which are TwitterScraper, GetOldTweets3, and
Tweepy to collect Twitter data to avoid such restrictions. We retrieved 5,287,396 tweets
related to mass shootings from Twitter over the past 8 years (i.e., from 2013 to 2020) in
the United States. The keywords include but are not limited to “shooting”, “mass
shooting”, “gun”, “gun shooting”, “killing”, and locations where these incidents
occurred. For example, the Elpaso mass shooting happened on August 3, 2019. The
keywords we have used are “Elpaso” and “shooting”, and we set the time window from
August 3, 2019 to August 13, 2019 and acquired 29,496 tweets. The exemplary raw
dataset is listed in Figure 17.
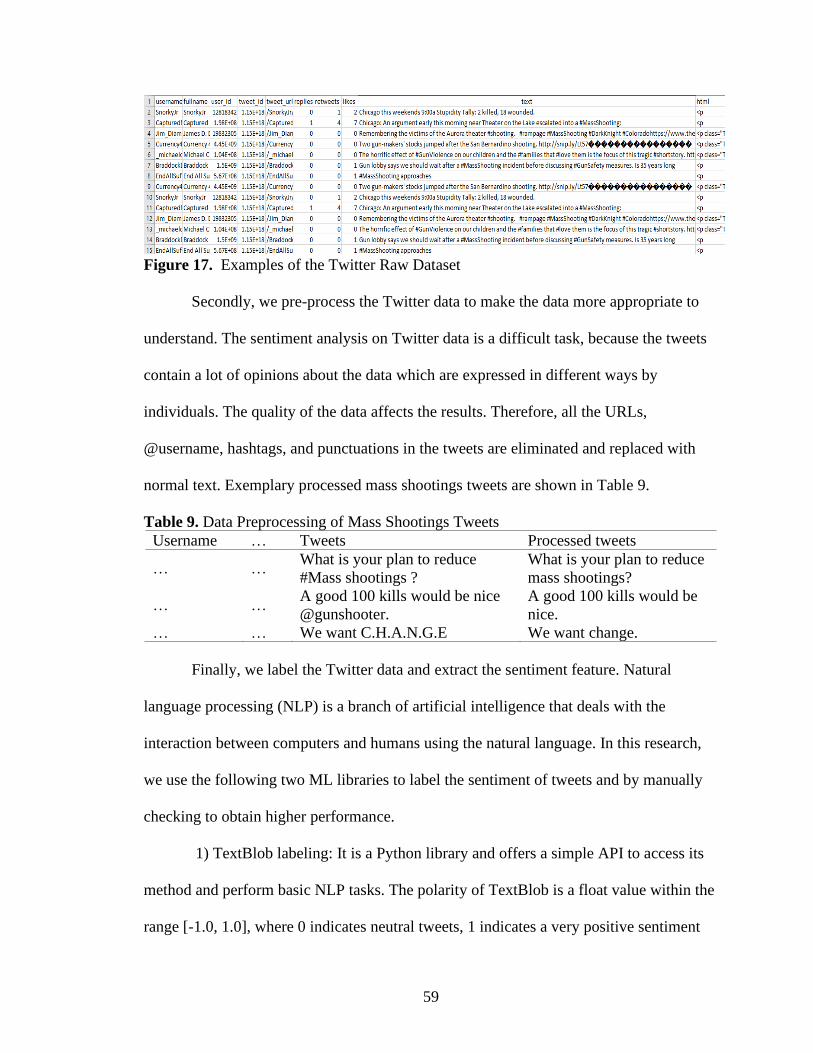
59
Figure 17. Examples of the Twitter Raw Dataset
Secondly, we pre-process the Twitter data to make the data more appropriate to
understand. The sentiment analysis on Twitter data is a difficult task, because the tweets
contain a lot of opinions about the data which are expressed in different ways by
individuals. The quality of the data affects the results. Therefore, all the URLs,
@username, hashtags, and punctuations in the tweets are eliminated and replaced with
normal text. Exemplary processed mass shootings tweets are shown in Table 9.
Table 9. Data Preprocessing of Mass Shootings Tweets
Username … Tweets Processed tweets
… … What is your plan to reduce
#Mass shootings ?
What is your plan to reduce
mass shootings?
… … A good 100 kills would be nice
@gunshooter.
A good 100 kills would be
nice.
… … We want C.H.A.N.G.E We want change.
Finally, we label the Twitter data and extract the sentiment feature. Natural
language processing (NLP) is a branch of artificial intelligence that deals with the
interaction between computers and humans using the natural language. In this research,
we use the following two ML libraries to label the sentiment of tweets and by manually
checking to obtain higher performance.
1) TextBlob labeling: It is a Python library and offers a simple API to access its
method and perform basic NLP tasks. The polarity of TextBlob is a float value within the
range [-1.0, 1.0], where 0 indicates neutral tweets, 1 indicates a very positive sentiment

60
and -1 represents a very negative sentiment.
2) Valence Aware Dictionary and sEntiment Reasoner (VADER) labeling:
VADER is a lexicon and rule-based sentiment analysis tool that is especially attuned to
the sentiment expressed in social media. It not only outputs the positivity and negativity
score but also positive, negative, and neutral sentiment results. VADER text sentiment
analysis uses a human-centric approach, and combining qualitative analysis and empirical
validation by using human raters and the wisdom of the crowd.
Moreover, we convert the positive sentiment of keywords and phrases, such as
“pray”, “wish”, and “stay strong” to neutral sentiment in the mass shootings tweets
dataset. The sentiment results of the whole dataset are shown in Figure 18. The
percentage of Neural, Negative, and Positive attitude tweets are 25%, 56%, and 19%,
respectively.
Figure 18. Sentiment Results of Mass Shooting Tweets
The mass shooting tweets are mainly in text format; but for sentiment analysis of
the tweets using ML models, numerical matrices are required. Thus, the Term frequency
– Inverse document frequency (TF-IDF) method is applied to convert the Twitter data to
61
numerical vectors. TF-IDF reflects the importance of a word in the corpus or the
collection. The value of TF-IDF increases with the increase in the frequency of a
particular word in the document. In order to control the generality of more common
words, the term frequency is offset by the frequency of words in corpus. Term frequency
is the number of times a particular term appears in the text. Inverse document frequency
measures the occurrence of any word in all documents ( Tripathy, Agrawal & Rath,
2016). In part Ⅱ, the TF-IDF is applied to transform the text document into a numerical
vector, which is then considered as input to the supervised ML classifiers.
3.3.2. Machine learning models. There are three ML models, i.e., SVM, LR, as
well as the IPSO-DNN model which is proposed in Part Ⅰ that are explored to classify and
predict the public attitude towards mass shootings in Part Ⅱ. SVM, LR, and the basic
Artificial Neural Network in the proposed IPSO-DNN model are defined as following:
1) Support Vector Machine (SVM): SVM is a popular technique which trains the
dataset with feature vectors and uses large margin for classification. It separates Twitter
data using a hyper plane. SVM uses the discriminative function defined as:
( ) ( )Tg x w x b= + (7)
where x is the feature vector; w is the weights vector, b is the bias vector, and they
are learned automatically on the training set. ϕ is the non-linear mapping from input
space to high dimensional feature space. ‘w’ and ‘b’ are learned automatically on the
training set.
2) Logistic Regression (LR): The logistic regression technique is applied to
describe data and analyze the relationship between one dependent binary variable and one
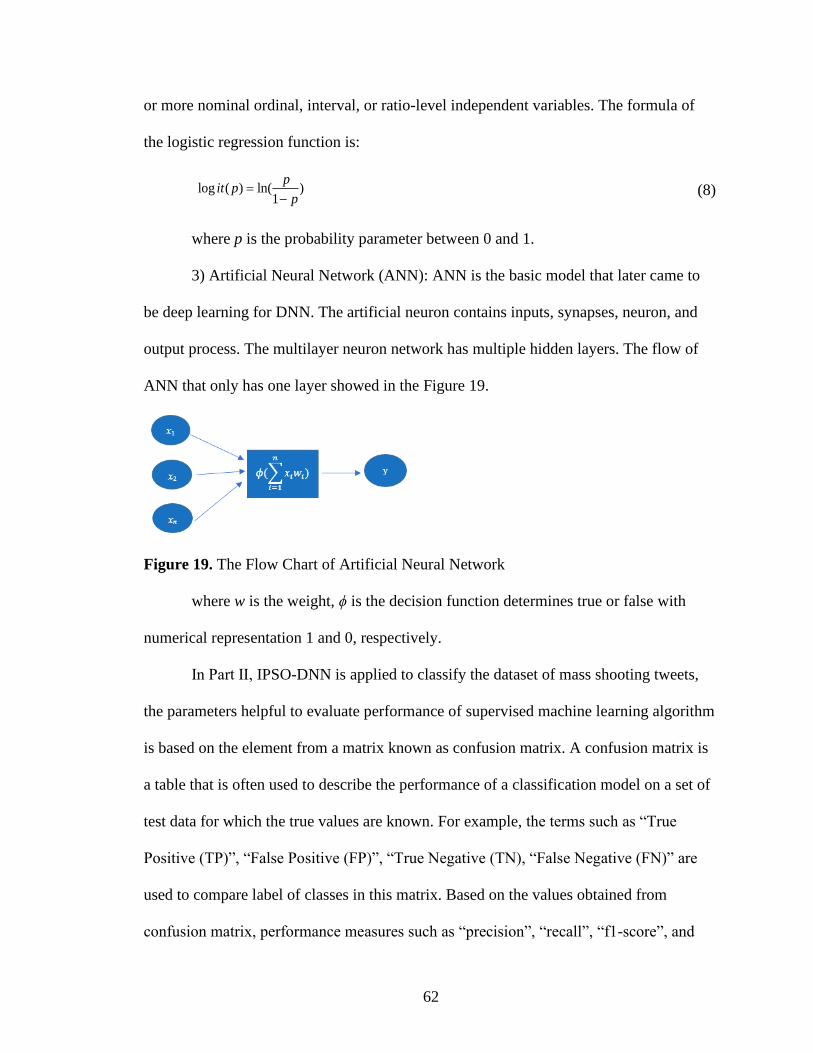
62
or more nominal ordinal, interval, or ratio-level independent variables. The formula of
the logistic regression function is:
log ( ) ln( )1
pit p
p=
− (8)
where p is the probability parameter between 0 and 1.
3) Artificial Neural Network (ANN): ANN is the basic model that later came to
be deep learning for DNN. The artificial neuron contains inputs, synapses, neuron, and
output process. The multilayer neuron network has multiple hidden layers. The flow of
ANN that only has one layer showed in the Figure 19.
Figure 19. The Flow Chart of Artificial Neural Network
where w is the weight, ϕ is the decision function determines true or false with
numerical representation 1 and 0, respectively.
In Part Ⅱ, IPSO-DNN is applied to classify the dataset of mass shooting tweets,
the parameters helpful to evaluate performance of supervised machine learning algorithm
is based on the element from a matrix known as confusion matrix. A confusion matrix is
a table that is often used to describe the performance of a classification model on a set of
test data for which the true values are known. For example, the terms such as “True
Positive (TP)”, “False Positive (FP)”, “True Negative (TN), “False Negative (FN)” are
used to compare label of classes in this matrix. Based on the values obtained from
confusion matrix, performance measures such as “precision”, “recall”, “f1-score”, and

63
“accuracy” are found out for evaluating performance of any classifier. They are defined
as follows:
1) Precision: It measures the exactness of the classifier result. It is the ratio of
number of examples correctly labeled as positive to total number of positively classified
example.
TPPrecision
TP FP=
+ (9)
2) Recall: It measures the completeness of the classifier result. It is the ratio of
total number of positively labeled example to total examples which are truly positive.
ReTP
callTP FN
=+
(10)
3) f1-score: It is the harmonic mean of precision and recall. It is required to
optimize the system towards either precision or recall, which have more influence on
final result.
2*Pr *Re
1Pr Re
ecision callf
ecision call=
+ (11)
(4) Accuracy: It is the most common measures of classification process. It can be
calculated as the ratio of correctly classified example to total number of examples.
TP TN
AccuracyTP TN FP FN
+=
+ + + (12)
The flow chart of methodology is presented in Figure 20.
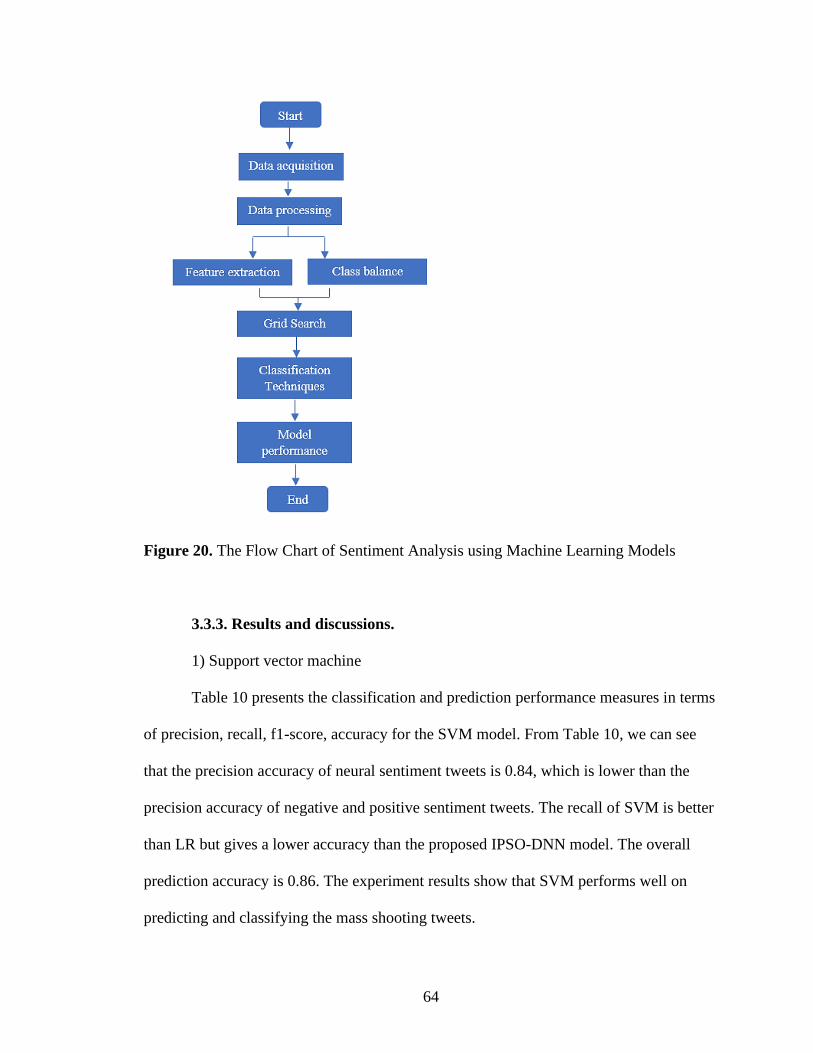
64
Figure 20. The Flow Chart of Sentiment Analysis using Machine Learning Models
3.3.3. Results and discussions.
1) Support vector machine
Table 10 presents the classification and prediction performance measures in terms
of precision, recall, f1-score, accuracy for the SVM model. From Table 10, we can see
that the precision accuracy of neural sentiment tweets is 0.84, which is lower than the
precision accuracy of negative and positive sentiment tweets. The recall of SVM is better
than LR but gives a lower accuracy than the proposed IPSO-DNN model. The overall
prediction accuracy is 0.86. The experiment results show that SVM performs well on
predicting and classifying the mass shooting tweets.
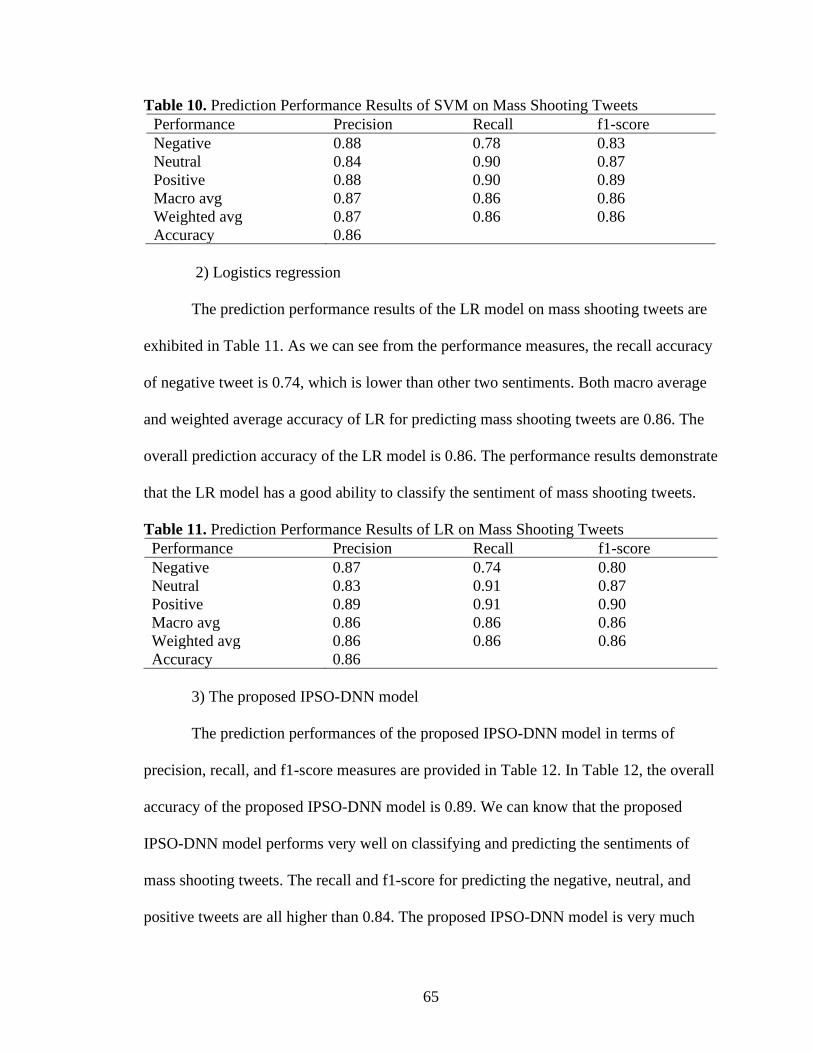
65
Table 10. Prediction Performance Results of SVM on Mass Shooting Tweets
Performance Precision Recall f1-score
Negative 0.88 0.78 0.83
Neutral 0.84 0.90 0.87
Positive 0.88 0.90 0.89
Macro avg 0.87 0.86 0.86
Weighted avg 0.87 0.86 0.86
Accuracy 0.86
2) Logistics regression
The prediction performance results of the LR model on mass shooting tweets are
exhibited in Table 11. As we can see from the performance measures, the recall accuracy
of negative tweet is 0.74, which is lower than other two sentiments. Both macro average
and weighted average accuracy of LR for predicting mass shooting tweets are 0.86. The
overall prediction accuracy of the LR model is 0.86. The performance results demonstrate
that the LR model has a good ability to classify the sentiment of mass shooting tweets.
Table 11. Prediction Performance Results of LR on Mass Shooting Tweets
Performance Precision Recall f1-score
Negative 0.87 0.74 0.80
Neutral 0.83 0.91 0.87
Positive 0.89 0.91 0.90
Macro avg 0.86 0.86 0.86
Weighted avg 0.86 0.86 0.86
Accuracy 0.86
3) The proposed IPSO-DNN model
The prediction performances of the proposed IPSO-DNN model in terms of
precision, recall, and f1-score measures are provided in Table 12. In Table 12, the overall
accuracy of the proposed IPSO-DNN model is 0.89. We can know that the proposed
IPSO-DNN model performs very well on classifying and predicting the sentiments of
mass shooting tweets. The recall and f1-score for predicting the negative, neutral, and
positive tweets are all higher than 0.84. The proposed IPSO-DNN model is very much
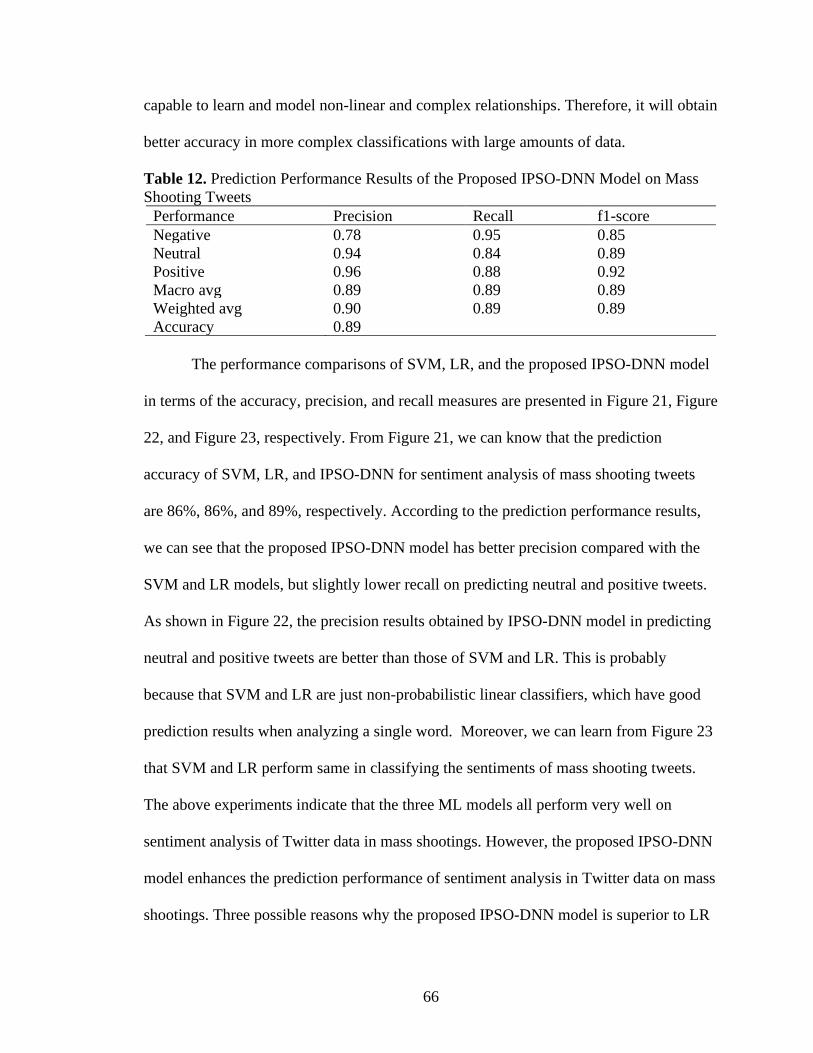
66
capable to learn and model non-linear and complex relationships. Therefore, it will obtain
better accuracy in more complex classifications with large amounts of data.
Table 12. Prediction Performance Results of the Proposed IPSO-DNN Model on Mass
Shooting Tweets
Performance Precision Recall f1-score
Negative 0.78 0.95 0.85
Neutral 0.94 0.84 0.89
Positive 0.96 0.88 0.92
Macro avg 0.89 0.89 0.89
Weighted avg 0.90 0.89 0.89
Accuracy 0.89
The performance comparisons of SVM, LR, and the proposed IPSO-DNN model
in terms of the accuracy, precision, and recall measures are presented in Figure 21, Figure
22, and Figure 23, respectively. From Figure 21, we can know that the prediction
accuracy of SVM, LR, and IPSO-DNN for sentiment analysis of mass shooting tweets
are 86%, 86%, and 89%, respectively. According to the prediction performance results,
we can see that the proposed IPSO-DNN model has better precision compared with the
SVM and LR models, but slightly lower recall on predicting neutral and positive tweets.
As shown in Figure 22, the precision results obtained by IPSO-DNN model in predicting
neutral and positive tweets are better than those of SVM and LR. This is probably
because that SVM and LR are just non-probabilistic linear classifiers, which have good
prediction results when analyzing a single word. Moreover, we can learn from Figure 23
that SVM and LR perform same in classifying the sentiments of mass shooting tweets.
The above experiments indicate that the three ML models all perform very well on
sentiment analysis of Twitter data in mass shootings. However, the proposed IPSO-DNN
model enhances the prediction performance of sentiment analysis in Twitter data on mass
shootings. Three possible reasons why the proposed IPSO-DNN model is superior to LR
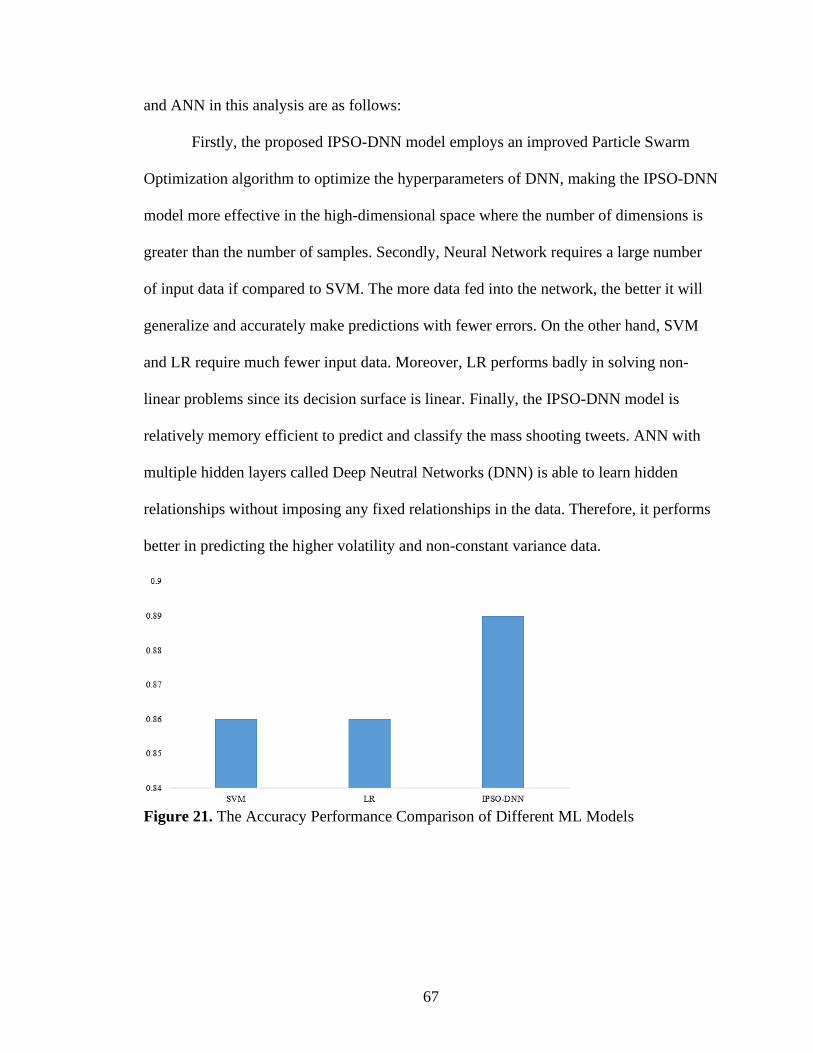
67
and ANN in this analysis are as follows:
Firstly, the proposed IPSO-DNN model employs an improved Particle Swarm
Optimization algorithm to optimize the hyperparameters of DNN, making the IPSO-DNN
model more effective in the high-dimensional space where the number of dimensions is
greater than the number of samples. Secondly, Neural Network requires a large number
of input data if compared to SVM. The more data fed into the network, the better it will
generalize and accurately make predictions with fewer errors. On the other hand, SVM
and LR require much fewer input data. Moreover, LR performs badly in solving non-
linear problems since its decision surface is linear. Finally, the IPSO-DNN model is
relatively memory efficient to predict and classify the mass shooting tweets. ANN with
multiple hidden layers called Deep Neutral Networks (DNN) is able to learn hidden
relationships without imposing any fixed relationships in the data. Therefore, it performs
better in predicting the higher volatility and non-constant variance data.
Figure 21. The Accuracy Performance Comparison of Different ML Models
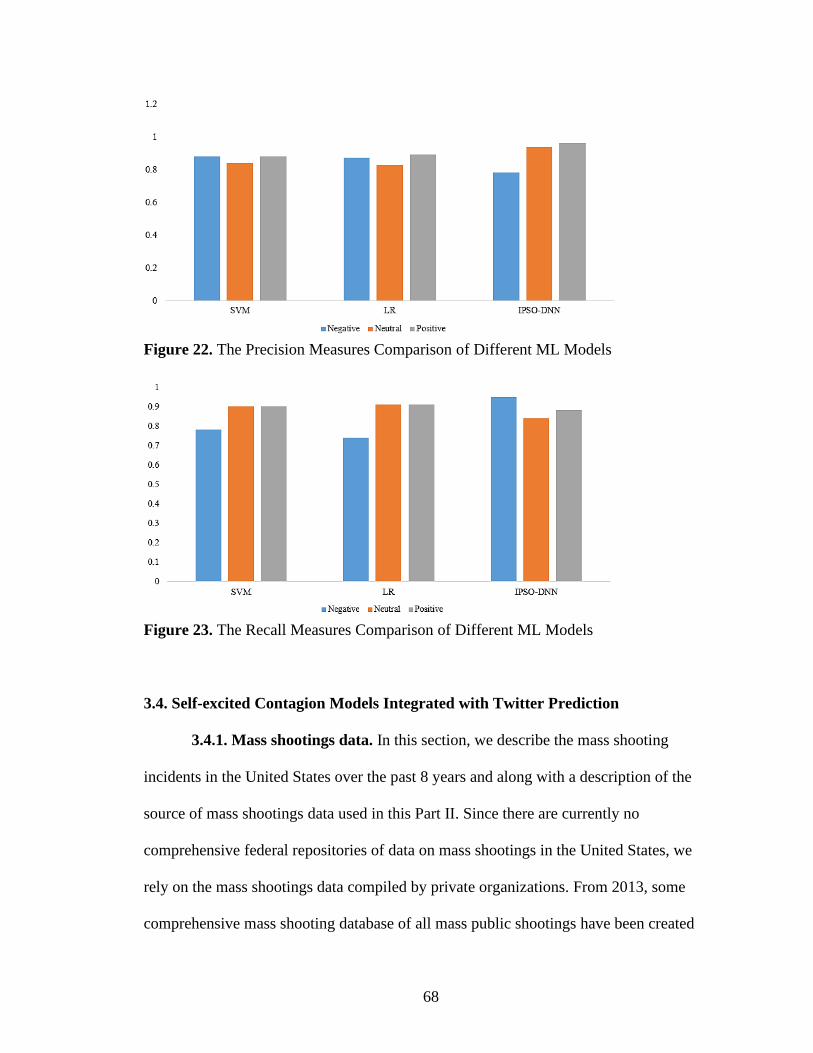
68
Figure 22. The Precision Measures Comparison of Different ML Models
Figure 23. The Recall Measures Comparison of Different ML Models
3.4. Self-excited Contagion Models Integrated with Twitter Prediction
3.4.1. Mass shootings data. In this section, we describe the mass shooting
incidents in the United States over the past 8 years and along with a description of the
source of mass shootings data used in this Part Ⅱ. Since there are currently no
comprehensive federal repositories of data on mass shootings in the United States, we
rely on the mass shootings data compiled by private organizations. From 2013, some
comprehensive mass shooting database of all mass public shootings have been created
69
that examine community-level socio-ecological factors of where mass public shootings
take place, including, but not limited to, crime rates, measures of social inequality,
community mobility, availability of mental health resources, and prevalence of gun
stores.
Therefore, in this Part Ⅱ, we research mass shooting incidents that between 2013
to 2020 from the Gun Violence Archive mass shooting data. It provides more accurate,
unbiased, unfiltered data on gun violence in the United States. The Gun Violence Archive
study did not rely solely upon the Federal Bureau of Investigation (FBI) data from the
FBI Supplemental Homicide Reports, but also collect hundreds of media reports, police
documents, and other resources daily to compile a list of mass shooting incidents that
involved four people or more shot or killed, not including the shooter.
The whole mass shooting incident data is shown in Figure 24. There are 2,950
mass shooting incidents in the United States from 2013 to 2020. From Figure24 , we can
see that mass shooting incidents steadily increase over the past 8 years. Especially,
despite the United States response to the COVID-19 pandemic using sporadic stay-at-
home orders and lockdowns, mass shootings in the United States have risen sharply in
2020. There have been 610 mass shootings in 2020, which is the most mass shooting
incidents recorded from 2013 to 2020 in the United States. Data from the Gun Violence
Archive presents that the number of mass shootings first spiked in April 2020 and has
stayed high since. The rise in mass shootings results in the more damage to families,
communities, and the nation. Therefore, it is very significant to predict future mass
shootings in the United States and reduce future similar tragedies as could as possible.
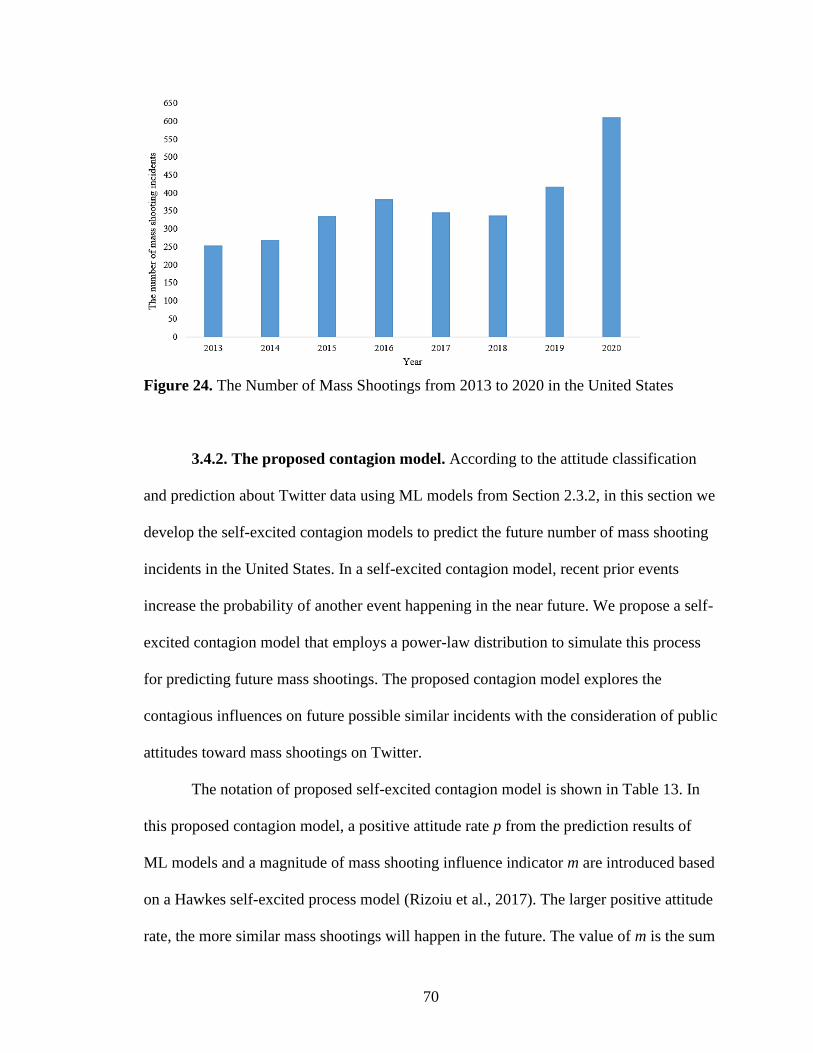
70
Figure 24. The Number of Mass Shootings from 2013 to 2020 in the United States
3.4.2. The proposed contagion model. According to the attitude classification
and prediction about Twitter data using ML models from Section 2.3.2, in this section we
develop the self-excited contagion models to predict the future number of mass shooting
incidents in the United States. In a self-excited contagion model, recent prior events
increase the probability of another event happening in the near future. We propose a self-
excited contagion model that employs a power-law distribution to simulate this process
for predicting future mass shootings. The proposed contagion model explores the
contagious influences on future possible similar incidents with the consideration of public
attitudes toward mass shootings on Twitter.
The notation of proposed self-excited contagion model is shown in Table 13. In
this proposed contagion model, a positive attitude rate p from the prediction results of
ML models and a magnitude of mass shooting influence indicator m are introduced based
on a Hawkes self-excited process model (Rizoiu et al., 2017). The larger positive attitude
rate, the more similar mass shootings will happen in the future. The value of m is the sum
71
of injured and killed in each mass shooting incident. The formulations of proposed self-
excited contagion model are presented in Equations (13) and (14). Equation (13) is the
event intensity function of the proposed contagion model, in which ( )t is conditional
intensity of a non-homogeneous Poisson process over time t. Equation (14) shows the
developed power-law kernel function ( )x that measures the contagious effect of mass
shootings over time. Figure 24 indicates that contagion effects of mass shootings decay
over time in the proposed power-law kernel function. The spread of public attitude and
magnitude of mass shooting influence are introduced in this kernel function to explore
how public attitude impact on future mass shootings.
In the experiments shown in Section 3.4.4, several comparison contagion models
with negative attitude rate and without the attitude rate indicator are applied to indicate
how significant it is to spread positive attitudes on social media to have an impact on
mass shootings. Moreover, a maximum likelihood estimation approach (Wang, Kaplan &
Abdelzaher, 2012) is applied to enhance the proposed model’s robustness and prediction
performance. In short, the proposed self-excited contagion model focuses on the
magnitude of influence on mass shootings from the available dataset of mass shooting
incidents and the spread of public attitudes toward mass shootings on Twitter over the
past 8 years in the United States.

72
Table 13. The Notation of the Proposed Self-Excited Contagion Model
Notation Interpretation
( )t Conditional intensity of a non-homogeneous Poisson process.
( )im t
Triggering kernel. Contribution of event the (m, t) to the total event rate,
calculated at time t + ti.
t The mass shooting incident occur time (days).
k The effect of mass shooting incidents, which scales the subsequent events
occurred rate, k >0.
p Positive attitude rate toward mass shootings in a time period, 0 < p <1.
m The number of being killed and injured in each mass shooting incident.
The warping effect for mass shootings, >0.
( )k pm
The magnitude of mass shooting incidents influence.
c The waiting times. Temporal shift cutoff term so that keep ( )
im t bounded
when t ≈0, 𝑐 > 0.
1+ The power-law exponent, describing how fast an event is forgotten, >0.
The formulation of the proposed self-excited contagion model is shown as
follows:
(1) The event intensity function of contagion:
( ) ( )i
i
m it t
t t t
= − (13)
(2) The power-law kernel function of contagion model:
(1 )( ) ( ) ( )x k pm x c − += + (14)
Figure 25. The Change of Contagious Effects in Power Law Kernel Function
73
3.4.3. Improved contagion model for COVID-19. In order to analyze the reason
of why mass shootings have sharply risen under the COVID-19 pandemic in 2020, we
improve the above proposed contagion model to better predict the number of mass
shootings in the COVID-19 situation. In Part Ⅱ, social distancing index and daily growth
rate of COVID-19 cases are introduced to the improved contagion model. Firstly, social
distancing related measures include avoiding mass gathering, closing schools and non-
essential business, issuing mandatory stay-at-home orders, and having travel restrictions.
The social distancing takes many forms, and the nature is to keep people apart from each
other by confining them to their homes in order to reduce contact rates. From the
University of Maryland COVID-19 Impact Analysis Platform, we can obtain social
distancing index that takes value from 0 to 1. 0 indicates no social distancing is observed
in the community, while 1 indicates all residents are staying at home and no visitors are
entering the county (Maryland Transportation Institute. 2020). Secondly, daily growth
rate of COVID-19 cases is the percentage increase in cumulative COVID-19 cases in the
United States (Tellis et al., 2020). There is a possibility that the spread of COVID-19
hampered anti-crime efforts, and the attendant shutdowns compounded unemployment
and stress at a time when schools and other community programs were closed or online.
The additional notation of the improved contagion model under the COVID-19 pandemic
is described in Table 14. Equation (15) presents the proposed Power Law kernel function
of the improved contagion model formulation. We can learn from it that the larger the
social distancing index, the less mass public shootings in the future, and the larger the
daily growth rate, the more future similar mass shooting incidents.

74
Table 14. The Additional Notation of the Improved Contagion Model for COVID-19
Notation Interpretation
s Social distancing index, it represents the practice degree residents and
visitors are social distancing, 0 < s <1.
d Daily growth rate of COVID-19 in the United States. 0 < d <1.
The proposed power-law kernel function of the improved contagion model:
(1 )( ) ( ) ( )dx sk pm x c − += +
(15)
3.4.4. Results and discussions. In order to evaluate the performance of the
proposed self-excited contagion models on predicting future mass shootings in the United
States, we conduct several experiments with some comparison variant models. All the
experiments in this section are conducted using R language on a 4-core machine with
3.60 GHz Intel® Core™ i7-7700 CPU and 16 GB RAM. All models independently run
30 times in experiments. The significance level of these non-parametric statistical
experiments is 5%.
1) The proposed contagion model prediction results
In this experiment, we compare the performance of the proposed contagion model
with positive attitude rate, one variant contagion model without public attitude, and one
variant contagion model with negative attitude rate on predicting the number of mass
shootings from 2013 to 2020. The public attitude rates are obtained from sentiment
analysis of Twitter data on mass shootings using the proposed IPSO-DNN model. The
comparison prediction results are shown in Figure 26. From Figure 26, we can see that
the prediction accuracy results of positive attitude, non-public attitude, and negative
attitude contagion models are 0.82, 0.60, and 0.51, respectively. The results demonstrate
that the proposed contagion model has a great potential to predict future mass shooting

75
incidents and the spread of positive attitudes toward mass shootings plays a very
significant role on measuring contagious effects of social media on mass shootings.
Figure 26. Prediction Accuracy Results of Different Contagion Models
2) The improved contagion model prediction results
In order to fully evaluate the prediction performance of the improved self-excited
contagion model under the COVID-19 pandemic in 2020, we conduct several
experiments to predict the number of mass shootings based on different time frames. As
we discussed above, the proposed contagion model integrated with positive sentiment
prediction results outperforms other comparison models. Therefore, we compare the
prediction accuracy of the first proposed contagion model with the second improved
contagion model for the COVID-19 in 2020 in this experiment. The prediction results are
shown in Table 15. As we can know from Table 15, the prediction accuracy obtained
from the improved contagion model from 2013 to 2020 are 0.84, 0.85, 0.83, 0.81, 0.86,
0.85, 0.87, and 0.71, respectively. We can learn that the prediction accuracy results of
this proposed contagion model in 2020 is the lowest when compared to the accuracy of
each year from 2013 to 2019. Moreover, in order to better analyze the effect of COVID-
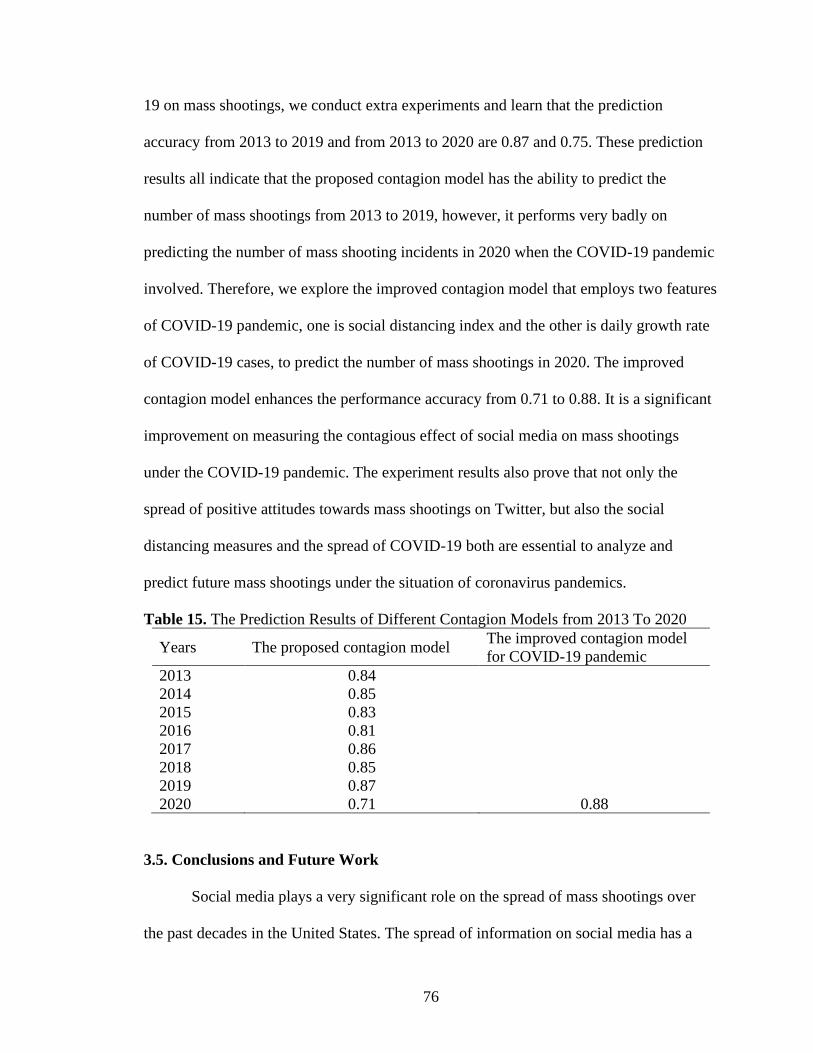
76
19 on mass shootings, we conduct extra experiments and learn that the prediction
accuracy from 2013 to 2019 and from 2013 to 2020 are 0.87 and 0.75. These prediction
results all indicate that the proposed contagion model has the ability to predict the
number of mass shootings from 2013 to 2019, however, it performs very badly on
predicting the number of mass shooting incidents in 2020 when the COVID-19 pandemic
involved. Therefore, we explore the improved contagion model that employs two features
of COVID-19 pandemic, one is social distancing index and the other is daily growth rate
of COVID-19 cases, to predict the number of mass shootings in 2020. The improved
contagion model enhances the performance accuracy from 0.71 to 0.88. It is a significant
improvement on measuring the contagious effect of social media on mass shootings
under the COVID-19 pandemic. The experiment results also prove that not only the
spread of positive attitudes towards mass shootings on Twitter, but also the social
distancing measures and the spread of COVID-19 both are essential to analyze and
predict future mass shootings under the situation of coronavirus pandemics.
Table 15. The Prediction Results of Different Contagion Models from 2013 To 2020
Years The proposed contagion model The improved contagion model
for COVID-19 pandemic
2013 0.84
2014 0.85
2015 0.83
2016 0.81
2017 0.86
2018 0.85
2019 0.87
2020 0.71 0.88
3.5. Conclusions and Future Work
Social media plays a very significant role on the spread of mass shootings over
the past decades in the United States. The spread of information on social media has a
77
contagion effect on crimes. However, compare to traditional media, less attention of the
contagion effect of social media on mass shooting incidents has been given over the past
few years. Therefore, in Part Ⅱ, we explore the public attitudes toward mass shootings on
social media and measure the associated contagious to predict the future number of mass
shootings.
Firstly, we conduct sentiment analysis of Twitter data on mass shootings, collect
and pre-process the related mass shooting tweets in Python, as well as extract people’s
opinions towards mass shootings on Twitter. We then explore different machine learning
(ML) models to forecast the change on the public’s attitudes over time, including the
Support Vector Machine (SVM), Logistic Regression (LR) and the proposed IPSO-DNN
model. The performance results show that the proposed IPSO-DNN model have a good
ability to classify and predict the sentiments of mass shooting tweets.
Secondly, we develop a self-excited contagion model to predict the number of
future mass shootings by focusing on the magnitude of influence of mass shootings and
the spread of public attitudes on Twitter. The experiment results demonstrate that
sentiment analysis is crucial to measure and predict the contagious effect of social media
on mass shootings in the United States. Moreover, in order to explore the contagious
influences on future possible similar mass shooting incidents under the COVID-19
pandemic in 2020, we also improve the proposed contagion model that employs social
distancing index and daily growth rate of COVID-19 cases for mass shooting prediction.
The results demonstrate that the proposed self-excited contagion models perform very
well on predicting future mass shootings in the United States.
In the future work, for the sentiment analysis, the ensemble classifier technique
78
tries to combine different ML classifiers to do the best classification and prediction.
Therefore, we will consider combining ML models and exploring other improved
evolutionary algorithms to optimize other powerful deep learning models to obtain a
higher accuracy on predicting the sentiment of Twitter data on mass shootings. For the
mass shooting prediction, we will explore the relationship between mass shootings and
location information of tweets, mental health treatment, and gun control policy. In
addition, we will collaborate with local law enforcements to develop a “social media
early alerting tool” to proactively identify and reactively monitor mass shooting threats
across platforms in the United States.

79
REFERENCES
Abbasimehr, H., Shabani, M., & Yousefi, M. (2020). An optimized model using LSTM
network for demand forecasting. Computers & industrial engineering, 143, 106435.
Amolik, A., Jivane, N., Bhandari, M., & Venkatesan, M. (2016). Twitter sentiment
analysis of movie reviews using machine learning techniques. international Journal
of Engineering and Technology, 7(6), 1-7.
Beigi, G., Hu, X., Maciejewski, R., & Liu, H. (2016). An overview of sentiment analysis
in social media and its applications in disaster relief. In Sentiment analysis and
ontology engineering, 313-340. https://doi.org/10.1007/978-3-319-30319-2_13
Branswell, H. A. (2020). Washington State could see explosion in coronavirus cases,
study says. STAT. Retrieved from
https://www.statnews.com/2020/03/03/washington-state-risks-seeing-explosion-in-
coronavirus-without-dramatic-action-new-analysis-says/ Accessed Oct 02, 2020.
Cals, B., Zhang, Y., Dijkman, R., & van Dorst, C. (2021). Solving the online batching
problem using deep reinforcement learning. Computers & Industrial
Engineering, 156, 107221.
Chaves, A. A., Gonçalves, J. F., & Lorena, L. A. N. (2018). Adaptive biased random-key
genetic algorithm with local search for the capacitated centered clustering
problem. Computers & Industrial Engineering, 124, 331-346.
Chen, X., Yu, K., Du, W., Zhao, W., & Liu, G. (2016). Parameters identification of solar
cell models using generalized oppositional teaching learning based
optimization. Energy, 99, 170-180.
80
Darwish, A., Ezzat, D., & Hassanien, A. E. (2020). An optimized model based on
convolutional neural networks and orthogonal learning particle swarm optimization
algorithm for plant diseases diagnosis. Swarm and Evolutionary Computation, 52,
100616.
Dassios, A., & Zhao, H. (2012). Ruin by dynamic contagion claims. Insurance:
Mathematics and Economics, 51(1), 93-106.
Dhayne, H., Kilany, R., Haque, R., & Taher, Y. (2021). EMR2vec: Bridging the gap
between patient data and clinical trial. Computers & Industrial Engineering, 156,
107236.
El-Abd, M. (2012). Generalized opposition-based artificial bee colony algorithm. In 2012
IEEE congress on evolutionary computation, 1-4.
https://www.doi.org/10.1109/CEC.2012.6252939
Farboodi, M., Jarosch, G., & Shimer, R. (2020). Internal and external effects of social
distancing in a pandemic. National Bureau of Economic Research.
https://www.doi.org/10.3386/w27059
Fong, M. W., Gao, H., Wong, J. Y., Xiao, J., Shiu, E. Y., Ryu, S., & Cowling, B. J.
(2020). Nonpharmaceutical measures for pandemic influenza in nonhealthcare
settings—social distancing measures. Emerging infectious diseases, 26(5), 976.
Friedman, M. (1937). The use of ranks to avoid the assumption of normality implicit in
the analysis of variance. Journal of the american statistical association, 32(200),
675-701.
81
Gang, M., Wei, Z., & Xiao, L. C. (2012). A novel particle swarm optimization algorithm
based on particle migration. Applied Mathematics and Computation, 218(11), 6620-
6626.
García, S., Molina, D., Lozano, M., & Herrera, F. (2009). A study on the use of non-
parametric tests for analyzing the evolutionary algorithms’ behaviour: a case study
on the CEC’2005 special session on real parameter optimization. Journal of
Heuristics, 15(6), 617-644.
Gaspar, R., Pedro, C., Panagiotopoulos, P., & Seibt, B. (2016). Beyond positive or
negative: Qualitative sentiment analysis of social media reactions to unexpected
stressful events. Computers in Human Behavior, 56, 179-191.
Gautam, G., & Yadav, D. (2014). Sentiment analysis of twitter data using machine
learning approaches and semantic analysis. In 2014 Seventh International
Conference on Contemporary Computing (IC3), 437-442.
https://ieeexplore.ieee.org/document/6897213
Go, A., Huang, L., & Bhayani, R. (2009). Twitter sentiment analysis. Entropy, 17, 252.
Gold, M. and Stevens, M. (2020). “What Restrictions on Reopening Remain in New
York?,” The New York Times. Retrieved from https://www.nytimes.com/article/new-
york-phase-reopening.html Accessed Oct 5, 2020.
Goodfellow, I., Bengio, Y., Courville, A., & Bengio, Y. (2016). Deep learning,
Cambridge: MIT press, 1, 2.
Greenstone, M., & Nigam, V. (2020). Does social distancing matter?. University of
Chicago, Becker Friedman Institute for Economics Working Paper, 2020-26.
http://dx.doi.org/10.2139/ssrn.3561244
82
Gun Violence Archive. (2021). Gun Violence Archive Reports. Retrieved from
https://www.gunviolencearchive.org/reports Accessed Jan 24, 2021.
Han, S., Liu, X., Mao, H., Pu, J., Pedram, A., Horowitz, M. A., & Dally, W. J. (2016).
EIE: Efficient inference engine on compressed deep neural network. ACM
SIGARCH Computer Architecture News, 44(3), 243-254.
Hawkes, A. G. (1971). Point spectra of some mutually exciting point processes. Journal
of the Royal Statistical Society: Series B (Methodological), 33(3), 438-443.
Hop, D. C., Van Hop, N., & Anh, T. T. M. (2021). Adaptive particle swarm optimization
for integrated quay crane and yard truck scheduling problem. Computers &
Industrial Engineering, 153, 107075.
Jasmine, J. (2020). Texas and Florida report record average daily coronavirus deaths as
hospitalizations also rise. CNBC. Retrieved from
https://www.cnbc.com/2020/07/21/texas-and-florida-report-record-average-daily-
coronavirus-deaths-as-hospitalizations-also-rise.html Accessed Oct 5, 2020.
Jetter, M., & Walker, J. (2018). The Effect of Media Coverage on Mass Shootings.
https://www.iza.org/publications/dp/11900/the-effect-of-media-coverage-on-mass-
shootings
Kennedy, J., & Eberhart, R. (1995). Particle swarm optimization. In Proceedings of
ICNN'95-international conference on neural networks, 4, 1942-1948.
Kouloumpis, E., Wilson, T., & Moore, J. (2011). Twitter sentiment analysis: The good
the bad and the omg! In Fifth International AAAI conference on weblogs and social
media. http://crowdsourcing-class.org/assignments/downloads/kouloumpis-et-al.pdf

83
Lankford, A., & Tomek, S. (2018). Mass killings in the United States from 2006 to 2013:
social contagion or random clusters?. Suicide and Life‐Threatening Behavior, 48(4),
459-467.
Lee, K. J. (2018). Mass shootings and media contagion theory: Social media’s influence
on frequency of incidents. Elon Journal of Undergraduate Research in
Communications, 9(2), 27-35.
Lewis, E., Mohler, G., Brantingham, P. J., & Bertozzi, A. L. (2012). Self-exciting point
process models of civilian deaths in Iraq. Security Journal, 25(3), 244-264.
Liang, J. J., Qin, A. K., Suganthan, P. N., & Baskar, S. (2006). Comprehensive learning
particle swarm optimizer for global optimization of multimodal functions. IEEE
transactions on evolutionary computation, 10(3), 281-295.
Linder, M. (2020), “California's First Case of Coronavirus Confirmed in Orange
County,” NBC Bay Area. Retrieved from
https://www.nbcbayarea.com/news/california/first-case-of-coronavirus-confirmed-
in-californias-orange-county/2221025/ Accessed May 25, 2020.
Lorenzo, P. R., Nalepa, J., Kawulok, M., Ramos, L. S., & Pastor, J. R. (2017). Particle
swarm optimization for hyper-parameter selection in deep neural networks.
In Proceedings of the genetic and evolutionary computation conference, 481-488.
https://doi.org/10.1145/3071178.3071208
84
Malitsky, Y., Mehta, D., O’Sullivan, B., & Simonis, H. (2013). Tuning parameters of
large neighborhood search for the machine reassignment problem. In International
Conference on AI and OR Techniques in Constriant Programming for
Combinatorial Optimization Problems, 176-192. https://doi.org/10.1007/978-3-642-
38171-3_12
Maryland Transportation Institute. (2020). University of Maryland COVID-19 Impact
Analysis Platform. Retrieved from https://data.covid.umd.edu/ Accessed May 24,
2020.
McGinty, E. E., Webster, D. W., & Barry, C. L. (2013). Effects of news media messages
about mass shootings on attitudes toward persons with serious mental illness and
public support for gun control policies. American Journal of Psychiatry, 170(5),
494-501.
Meindl, J. N., & Ivy, J. W. (2017). Mass shootings: The role of the media in promoting
generalized imitation. American journal of public health, 107(3), 368-370.
Mitchell, L., & Cates, M. E. (2009). Hawkes process as a model of social interactions: a
view on video dynamics. Journal of Physics A: Mathematical and
Theoretical, 43(4), 045101.
Mittal, A., & Goel, A. (2012). Stock prediction using twitter sentiment
analysis. Standford University, CS229, 15.
http://cs229.stanford.edu/proj2011/GoelMittal-
StockMarketPredictionUsingTwitterSentimentAnalysis.pdf
85
Mohler, G. O., Short, M. B., Brantingham, P. J., Schoenberg, F. P., & Tita, G. E. (2011).
Self-exciting point process modeling of crime. Journal of the American Statistical
Association, 106(493), 100-108.
Murray, J. L. (2017). Mass media reporting and enabling of mass shootings. Cultural
Studies↔ Critical Methodologies, 17(2), 114-124.
Neethu, M. S., & Rajasree, R. (2013). Sentiment analysis in twitter using machine
learning techniques. In 2013 Fourth International Conference on Computing,
Communications and Networking Technologies (ICCCNT), 1-5.
https://ieeexplore.ieee.org/document/6726818
Neppalli, V. K., Caragea, C., Squicciarini, A., Tapia, A., & Stehle, S. (2017). Sentiment
analysis during Hurricane Sandy in emergency response. International journal of
disaster risk reduction, 21, 213-222.
Olson, D. (2020). Medical experts: Florida, Texas illustrate reopening dangers. Newsday.
Retrieved from https://www.newsday.com/news/health/coronavirus/transmission-of-
virus-on-national-scale-1.46107838 Accessed: Oct 5, 2020.
Ortiz, P., & Khin Khin, E. (2018). Traditional and new media's influence on suicidal
behavior and contagion. Behavioral sciences & the law, 36(2), 245-256.
Pak, A., & Paroubek, P. (2010). Twitter as a corpus for sentiment analysis and opinion
mining. In LREc, Vol. 10, 1320-1326.
Pang, B., & Lee, L. (2008). Opinion mining and sentiment analysis. Foundations and
trends in information retrieval, 2(1-2), 1-135.
86
Pang, B., Lee, L., & Vaithyanathan, S. (2002). Thumbs up? : sentiment classification
using machine learning techniques. In Proceedings of the ACL-02 conference on
Empirical methods in natural language processing-Volume 10, 79-86. Association
for Computational Linguistics.
Pan, Y., Darzi, A., Kabiri, A., Zhao, G., Luo, W., Xiong, C., & Zhang, L. (2020).
Quantifying human mobility behavior changes in response to non-pharmaceutical
interventions during the COVID-19 outbreak in the United
States. https://arxiv.org/abs/2005.01224
Piotrowski, A. P., Napiorkowski, J. J., & Piotrowska, A. E. (2020). Population size in
particle swarm optimization. Swarm and Evolutionary Computation, 58, 100718.
Pornsing, C., Sodhi, M. S., & Lamond, B. F. (2016). Novel self-adaptive particle swarm
optimization methods. Soft Computing, 20(9), 3579-3593.
Provan, S. (2020). Coronavirus: Texas overtakes California as US state with second-
highest death toll - as it happened. Subscribe to read | Financial Times. Retrieved
from https://www.ft.com/content/344a3b48-2b62-3ffe-98ae-69c8b15a2d5f
Accessed Oct 10, 2020.
Punia, S., Singh, S. P., & Madaan, J. K. (2020). A cross-temporal hierarchical framework
and deep learning for supply chain forecasting. Computers & Industrial
Engineering, 149, 106796.
87
Qolomany, B., Maabreh, M., Al-Fuqaha, A., Gupta, A., & Benhaddou, D. (2017).
Parameters optimization of deep learning models using Particle swarm optimization.
In 2017 13th International Wireless Communications and Mobile Computing
Conference (IWCMC) (pp. 1285-1290).
https://doi.org//10.1109/IWCMC.2017.7986470
Raitanen, J., & Oksanen, A. (2018). Global online subculture surrounding school
shootings. American behavioral scientist, 62(2), 195-209.
Read, J. (2005). Using emoticons to reduce dependency in machine learning techniques
for sentiment classification. In Proceedings of the ACL student research workshop,
43-48. https://dl.acm.org/doi/10.5555/1628960.1628969
Rizoiu, M. A., Lee, Y., Mishra, S., & Xie, L. (2017). A tutorial on hawkes processes for
events in social media. arXiv preprint arXiv:1708.06401.
Rizoiu, M. A., Mishra, S., Kong, Q., Carman, M., & Xie, L. (2018). SIR-Hawkes:
Linking epidemic models and Hawkes processes to model diffusions in finite
populations. In Proceedings of the 2018 world wide web conference, 419-428.
https://dl.acm.org/doi/abs/10.1145/3178876.3186108
Saeedi, S., Khorsand, R., Bidgoli, S. G., & Ramezanpour, M. (2020). Improved many-
objective particle swarm optimization algorithm for scientific workflow scheduling
in cloud computing. Computers & Industrial Engineering, 147, 106649.
Shi, W., Liu, D., Cheng, X., Li, Y., & Zhao, Y. (2019). Particle swarm optimization-
based deep neural network for digital modulation recognition. IEEE Access, 7,
104591-104600.
88
Singh, D., Kumar, V., & Kaur, M. (2020). Classification of COVID-19 patients from
chest CT images using multi-objective differential evolution–based convolutional
neural networks. European Journal of Clinical Microbiology & Infectious
Diseases, 39(7), 1379-1389.
Souza, R. M., Nascimento, E. G., Miranda, U. A., Silva, W. J., & Lepikson, H. A. (2021).
Deep learning for diagnosis and classification of faults in industrial rotating
machinery. Computers & Industrial Engineering, 153, 107060.
Stieglitz, S., & Dang-Xuan, L. (2013). Emotions and information diffusion in social
media—sentiment of microblogs and sharing behavior. Journal of management
information systems, 29(4), 217-248.
Surette, R. (2014). Estimating the prevalence of copycat crime: A research note. Criminal
Justice Policy Review, 25(6), 703-718.
Te Vrugt, M., Bickmann, J. & Wittkowski, R. (2020). Effects of social distancing and
isolation on epidemic spreading modeled via dynamical density functional
theory. Nat Commun 11, 5576. https://doi.org/10.1038/s41467-020-19024-0
Tellis, G. J., Sood, A., & Sood, N. (2020). How long should social distancing last?
Predicting time to moderation, control, and containment of COVID-19. Marshall
School of Business Research Paper. https://dx.doi.org/10.21319/ssrn.3561996
Tizhoosh, H. R. (2005). Opposition-based learning: a new scheme for machine
intelligence. In International conference on computational intelligence for
modelling, control and automation and international conference on intelligent
agents, web technologies and internet commerce (CIMCA-IAWTIC'06) 1, 695-701.
89
Towers, S., Gomez-Lievano, A., Khan, M., Mubayi, A., & Castillo-Chavez, C. (2015).
Contagion in mass killings and school shootings. PLoS one, 10(7).
https://journals.plos.org/plosone/article?id=10.1371/journal.pone.0117259
Tripathy, A., Agrawal, A., & Rath, S. K. (2016). Classification of sentiment reviews
using n-gram machine learning approach. Expert Systems with Applications, 57,
117-126.
Wang, D., Kaplan, L., Le, H., & Abdelzaher, T. (2012). On truth discovery in social
sensing: A maximum likelihood estimation approach. In Proceedings of the 11th
international conference on Information Processing in Sensor Networks, 233-244.
https://www.ideals.illinois.edu/bitstream/handle/2142/25815/Factfinders.pdf?sequen
ce=2&origin=publication_detail
Wang, G., Giannakis, G. B., & Chen, J. (2019). Learning ReLU networks on linearly
separable data: Algorithm, optimality, and generalization. IEEE Transactions on
Signal Processing, 67(9), 2357-2370.
Wang, H., Rahnamayan, S., & Wu, Z. (2013). Parallel differential evolution with self-
adapting control parameters and generalized opposition-based learning for solving
high-dimensional optimization problems. Journal of Parallel and Distributed
Computing, 73(1), 62-73.
Wang, H., Wu, Z., & Rahnamayan, S. (2011). Enhanced opposition-based differential
evolution for solving high-dimensional continuous optimization problems. Soft
Computing, 15(11), 2127-2140.
Wang, J., Ma, Y., Ouyang, L., & Tu, Y. (2020). Bayesian modeling and optimization for
multi-response surfaces. Computers & Industrial Engineering, 142, 106357.
90
Wang, N., Varghese, B., & Donnelly, P. D. (2016). A machine learning analysis of
Twitter sentiment to the Sandy Hook shootings. In 2016 IEEE 12th International
Conference on e-Science (e-Science), 303-312.
https://ieeexplore.ieee.org/document/7870913
Xiong, X., Li, Y., Qiao, S., Han, N., Wu, Y., Peng, J., & Li, B. (2018). An emotional
contagion model for heterogeneous social media with multiple behaviors. Physica A:
Statistical Mechanics and its Applications, 490, 185-202.
Xu, Q., Liu, A., Yuan, X., Song, Y., Zhang, C., & Li, Y. (2021). Random Mask-based
Estimation of the Distribution Algorithm for Stacked Auto-encoder One-step Pre-
training. Computers & Industrial Engineering, 107400.
https://doi.org/10.1016/j.cie.2021.107400
Ye, F. (2017). Particle swarm optimization-based automatic parameter selection for deep
neural networks and its applications in large-scale and high-dimensional data. PloS
one, 12(12), e0188746.
Young, S. R., Rose, D. C., Karnowski, T. P., Lim, S. H., & Patton, R. M. (2015).
Optimizing deep learning hyper-parameters through an evolutionary algorithm.
In Proceedings of the Workshop on Machine Learning in High-Performance
Computing Environments, 4, 1-5.
Yu, X. (2017). Disaster prediction model based on support vector machine for regression
and improved differential evolution. Natural Hazards, 85(2), 959-976.
Zhang, C., Li, Q., & Wang, W. Q. (2017). Immune particle swarm optimization
algorithm based on the adaptive search strategy. Chinese Journal of
Engineering, 39(1), 125-132.
91
Zhang, L., Ghader, S., Pack, M. L., Xiong, C., Darzi, A., Yang, M., ... & Hu, S. (2020).
An interactive COVID-19 mobility impact and social distancing analysis
platform. https://doi.org/10.1101/2020.04.29.20085472
Zhang, L., Ghosh, R., Dekhil, M., Hsu, M., & Liu, B. (2011). Combining lexicon-based
and learning-based methods for Twitter sentiment analysis. HP Laboratories,
Technical Report HPL-2011, 89.
https://www.researchgate.net/publication/228978262