MAC RF63821 1 - Lloyds Banking · PDF fileSupplementary EV Information 92 Contacts 97 ... HBOS...
98
2008 RESULTS News Release
Transcript of MAC RF63821 1 - Lloyds Banking · PDF fileSupplementary EV Information 92 Contacts 97 ... HBOS...

2008 RESULTSNews Release
HBOS plc
Preliminary Results 2008
27 February 2009
HBOS plc Preliminary Results 2008
Stock Exchange Announcement
HBOS plc
Preliminary Results 2008
Contents
Introduction 3
Financial Highlights 4
Review of Financial Performance 7
Key Divisional Statistics 10
Segmental Analysis 12
Divisional Reviews Retail 14Corporate 20Insurance & Investment 25International 32Treasury & Asset Management 42
Additional Information 50
Financial Information 63Consolidation Income Statement – statutory 68Consolidated Balance Sheet – statutory 69Consolidated Statement of Recognised Income and Expense – statutory 70Consolidated Cash Flow Statement – statutory 71Notes 73
Supplementary EV Information 92
Contacts 97
FORWARD LOOKING STATEMENTS This announcement contains forward looking statements with respect to the business, strategy and plans of HBOS plc, its current goals and expectations relating to its future financial condition and performance. By their nature, forward looking statements involve risk and uncertainty because they relate to events and depend on circumstances that will occur in the future. The Group’s actual future results may differ materially from the results expressed or implied in these forward looking statements as a result of a variety of factors, including UK domestic and global economic and business conditions, risks concerning borrower credit quality, market related risks such as interest rate risk and exchange rate risk in its banking business and equity risk in its insurance businesses, changing demographic trends, unexpected changes to regulation, the policies and actions of governmental and regulatory authorities in the UK or jurisdictions outside the UK, including other European countries and the US, exposure to legal proceedings or complaints, changes in customer preferences, competition and other factors. Please refer to the latest Annual Report for a discussion of such factors. The forward looking statements contained in this announcement are made as at the date of this announcement, and the Group undertakes no obligation to update any of its forward looking statements.
Introduction HBOS plc
Preliminary Results 2008 3
HBOS 2008 Results The HBOS 2008 Preliminary Results contained in this report cover the results of the HBOS Group for the year ended 31 December 2008. Unless otherwise stated, the analysis throughout this document compares the year to 31 December 2008 with the year to 31 December 2007.
Background The continuing global dislocation in financial markets in 2008 has resulted in exceptional instability and volatility, leading to falling market, investor and customer confidence. This has had a profound effect on the banking sector generally and on HBOS specifically. Since the summer of 2007, it had become increasingly difficult for HBOS to raise funds in wholesale markets. Pressures on the banking and financial services sectors were evident through increases in the cost of insurance against bank defaults, deteriorating economic conditions, increased concerns about credit risk and sustained tight conditions in wholesale money markets, despite measures taken by central banks to increase liquidity. The board of HBOS sought to restore confidence and stability through an agreement to be acquired by Lloyds TSB, as announced on 18 September 2008.
However turbulence in the markets continued, fuelled by concerns about credit risk and worsening economic conditions. Measures by national authorities and central banks failed to stem this turbulence and restore inter-bank confidence. The UK Government decided that it would be appropriate for the UK banking sector to increase its level of capitalisation. This led to the UK Government announcing, on 8 October 2008, specific and comprehensive measures to ensure the stability of the UK financial system. This included a significant recapitalisation of the UK banking sector together with the introduction of a guarantee by HM Treasury in respect of future short and medium terms debt issuance. On 13 October 2008, the terms of the acquisition by Lloyds TSB were amended and, as part of the UK Government's co-ordinated package of measures, HBOS announced a Placing and Open Offer to raise £11.5bn of new capital (consisting of £8.5bn in ordinary shares and £3.0bn in preference shares). The capital raising, underwritten by the UK Government, was made available to HBOS on condition that the acquisition by Lloyds TSB completed. On 16 January 2009, the acquisition of HBOS by Lloyds TSB completed and the name of the combined group was changed to Lloyds Banking Group plc ('LBG').
On 13 February 2009, LBG issued a trading update for the year ended 31 December 2008 which stated, in respect of HBOS, that:
"Since its 12 December 2008 trading update, HBOS's 2008 trading has been further impacted by increasingly difficult market conditions, an acceleration in the deterioration of credit quality and falls in estimated asset values. The Group expects HBOS to report an underlying loss before tax of some £8.5 billion for the year ended 31 December 2008. On a statutory basis, adjusting for the impact of short term fluctuations (c.£0.25 billion), loss on sale of businesses (c.£0.85 billion), FSCS levy (c.£0.2 billion) and goodwill impairment (c.£0.15 billion), the loss before tax is expected to be approximately £10 billion, before the policyholder tax charge which is currently expected to be approximately £0.9 billion. The key elements of the loss are the £4 billion impact of market dislocation and approximately £7 billion of impairments in the HBOS corporate division. The market dislocation has been driven by deterioration in asset quality and falling market valuations. The impairments are, principally as a result of applying a more conservative provisioning methodology consistent with that used by Lloyds TSB, and reflecting the acceleration in the deterioration in the economy, some £1.6 billion higher than our expectations when we issued our shareholder circular at the beginning of November last year."
The HBOS 2008 Preliminary Results, published today, are in line with LBG expectations at the time of the 13 February 2009 trading update.
Further information on LBG can be found in the LBG Preliminary Results announcement released on 27 February 2009. This includes pro-forma information (showing the combination of Lloyds TSB and HBOS) including a pro-forma Consolidated Balance Sheet and pro-forma regulatory capital ratios as at 31 December 2008.
Financial Highlights HBOS plc
Preliminary Results 2008 4
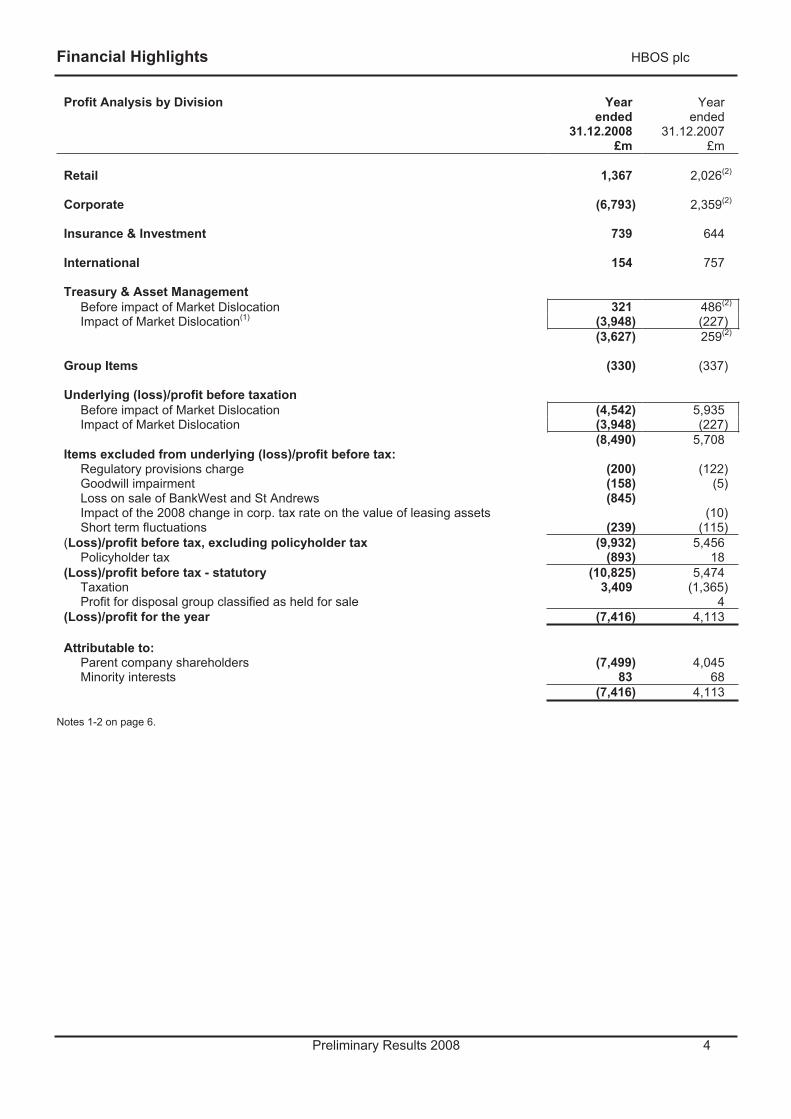
Profit Analysis by Division Yearended
31.12.2008£m
Yearended
31.12.2007£m
Retail 1,367 2,026(2)
Corporate (6,793) 2,359(2)
Insurance & Investment 739 644
International 154 757
Treasury & Asset Management Before impact of Market Dislocation 321 486(2)
Impact of Market Dislocation(1) (3,948) (227)(3,627) 259(2)
Group Items (330) (337)
Underlying (loss)/profit before taxation Before impact of Market Dislocation (4,542) 5,935Impact of Market Dislocation (3,948) (227)
(8,490) 5,708Items excluded from underlying (loss)/profit before tax:
Regulatory provisions charge (200) (122)Goodwill impairment (158) (5)Loss on sale of BankWest and St Andrews (845)Impact of the 2008 change in corp. tax rate on the value of leasing assets (10)Short term fluctuations (239) (115)
(Loss)/profit before tax, excluding policyholder tax (9,932) 5,456Policyholder tax (893) 18
(Loss)/profit before tax - statutory (10,825) 5,474Taxation 3,409 (1,365)Profit for disposal group classified as held for sale 4
(Loss)/profit for the year (7,416) 4,113
Attributable to: Parent company shareholders (7,499) 4,045Minority interests 83 68
(7,416) 4,113
Notes 1-2 on page 6.
Financial Highlights HBOS plc
Preliminary Results 2008 5
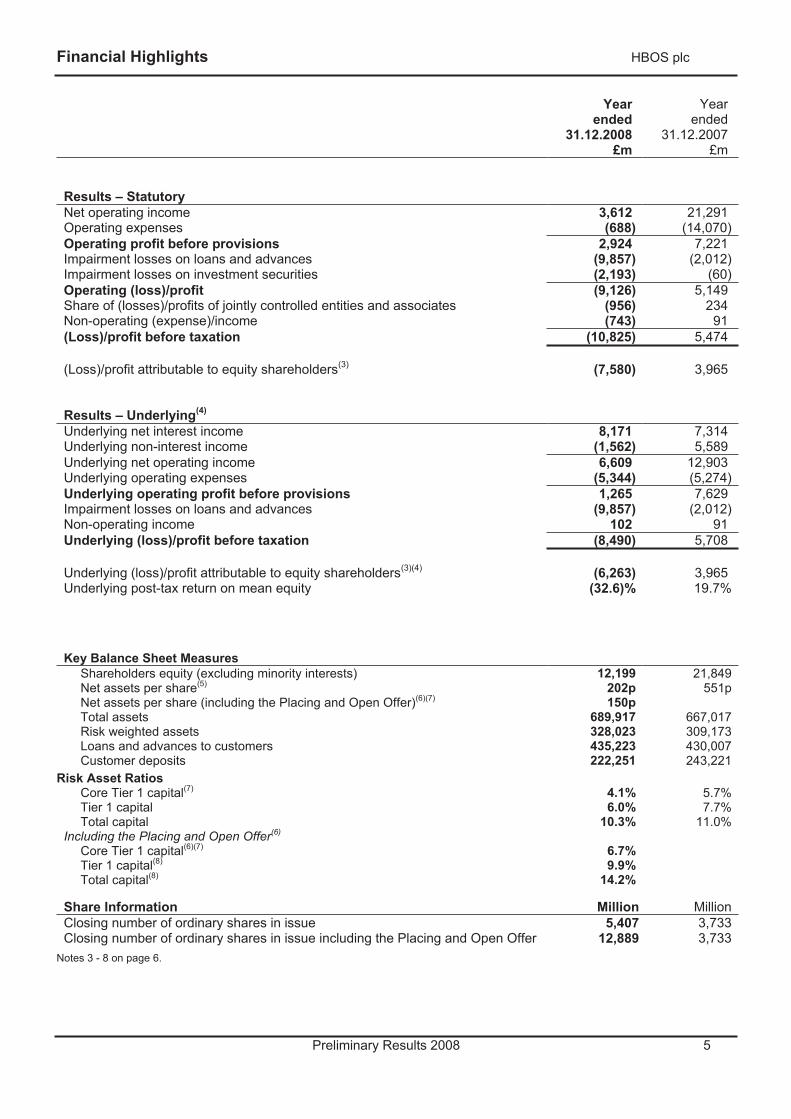
Yearended
31.12.2008 £m
Yearended
31.12.2007 £m
Results – Statutory Net operating income 3,612 21,291Operating expenses (688) (14,070)Operating profit before provisions 2,924 7,221Impairment losses on loans and advances (9,857) (2,012)Impairment losses on investment securities (2,193) (60)Operating (loss)/profit (9,126) 5,149Share of (losses)/profits of jointly controlled entities and associates (956) 234Non-operating (expense)/income (743) 91(Loss)/profit before taxation (10,825) 5,474
(Loss)/profit attributable to equity shareholders(3) (7,580) 3,965
Results – Underlying(4)
Underlying net interest income 8,171 7,314Underlying non-interest income (1,562) 5,589Underlying net operating income 6,609 12,903Underlying operating expenses (5,344) (5,274)Underlying operating profit before provisions 1,265 7,629Impairment losses on loans and advances (9,857) (2,012)Non-operating income 102 91Underlying (loss)/profit before taxation (8,490) 5,708
Underlying (loss)/profit attributable to equity shareholders(3)(4) (6,263) 3,965Underlying post-tax return on mean equity (32.6)% 19.7%
Key Balance Sheet MeasuresShareholders equity (excluding minority interests) 12,199 21,849Net assets per share(5) 202p 551pNet assets per share (including the Placing and Open Offer)(6)(7) 150pTotal assets 689,917 667,017Risk weighted assets 328,023 309,173Loans and advances to customers 435,223 430,007Customer deposits 222,251 243,221
Risk Asset Ratios Core Tier 1 capital(7) 4.1% 5.7%Tier 1 capital 6.0% 7.7%Total capital 10.3% 11.0%
Including the Placing and Open Offer(6)
Core Tier 1 capital(6)(7) 6.7% Tier 1 capital(8) 9.9% Total capital(8) 14.2%
Share Information Million MillionClosing number of ordinary shares in issue 5,407 3,733Closing number of ordinary shares in issue including the Placing and Open Offer 12,889 3,733
Notes 3 - 8 on page 6.
Financial Highlights HBOS plc
Preliminary Results 2008 6
Basis of Presentation In order to provide a clearer representation of the Group’s underlying business performance the Group presents its results on a basis referred to as 'underlying' which incorporates the following adjustments:
• Excluding regulatory provisions, the loss on sale of BankWest and St Andrews, the impact of the change in corporation tax rates, goodwill impairment, policyholder tax, and the impact of short term fluctuations (‘STFs’) and changes to economic assumptions for Long Term Assurance Business accounted for on an embedded value basis;
• Operating lease depreciation, impairment on investment securities, changes in insurance and investment contract liabilities, change in unallocated surplus and net claims incurred on insurance contracts are netted against income;
• Share of (losses)/profits of associates and jointly controlled entities are included within underlying non-interest income.
A reconciliation of underlying (loss)/profit before tax to the statutory profit before tax is shown on page 12.
During 2008, certain businesses were transferred between the Retail, Corporate and Treasury divisions. The 2008 Preliminary Results are reported in line with this new structure and the 2007 divisional comparatives have been restated. There is no impact on the 2007 Group Consolidated Balance Sheet and Income Statement previously published. Further detail is set out in the Additional Information section on pages 61-62.
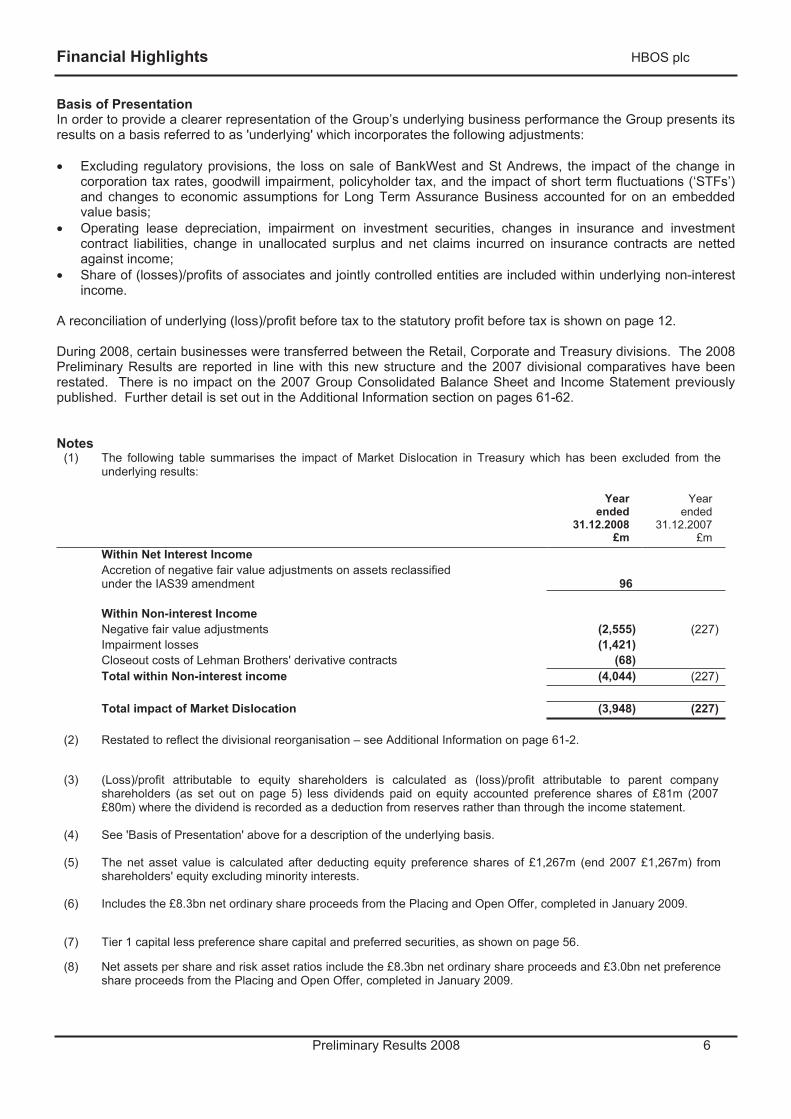
Notes(1) The following table summarises the impact of Market Dislocation in Treasury which has been excluded from the
underlying results:
Year ended
31.12.2008£m
Year ended
31.12.2007£m
Within Net Interest Income Accretion of negative fair value adjustments on assets reclassified
under the IAS39 amendment 96
Within Non-interest Income Negative fair value adjustments (2,555) (227) Impairment losses (1,421) Closeout costs of Lehman Brothers' derivative contracts (68)
Total within Non-interest income (4,044) (227)
Total impact of Market Dislocation (3,948) (227)
(2) Restated to reflect the divisional reorganisation – see Additional Information on page 61-2.
(3) (Loss)/profit attributable to equity shareholders is calculated as (loss)/profit attributable to parent company shareholders (as set out on page 5) less dividends paid on equity accounted preference shares of £81m (2007 £80m) where the dividend is recorded as a deduction from reserves rather than through the income statement.
(4) See 'Basis of Presentation' above for a description of the underlying basis.
(5) The net asset value is calculated after deducting equity preference shares of £1,267m (end 2007 £1,267m) from shareholders' equity excluding minority interests.
(6) Includes the £8.3bn net ordinary share proceeds from the Placing and Open Offer, completed in January 2009.
(7) Tier 1 capital less preference share capital and preferred securities, as shown on page 56.
(8) Net assets per share and risk asset ratios include the £8.3bn net ordinary share proceeds and £3.0bn net preference share proceeds from the Placing and Open Offer, completed in January 2009.
Review of Financial Performance HBOS plc
Preliminary Results 2008 7
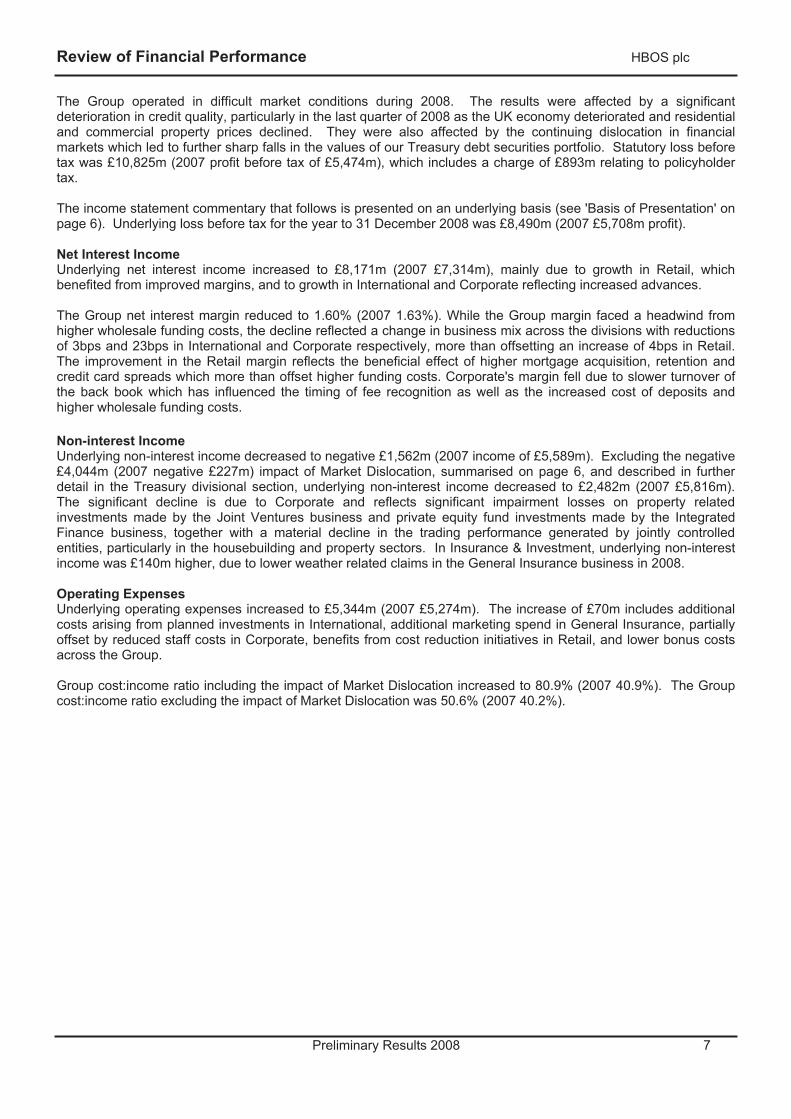
The Group operated in difficult market conditions during 2008. The results were affected by a significant deterioration in credit quality, particularly in the last quarter of 2008 as the UK economy deteriorated and residential and commercial property prices declined. They were also affected by the continuing dislocation in financial markets which led to further sharp falls in the values of our Treasury debt securities portfolio. Statutory loss before tax was £10,825m (2007 profit before tax of £5,474m), which includes a charge of £893m relating to policyholder tax.
The income statement commentary that follows is presented on an underlying basis (see 'Basis of Presentation' on page 6). Underlying loss before tax for the year to 31 December 2008 was £8,490m (2007 £5,708m profit).
Net Interest Income Underlying net interest income increased to £8,171m (2007 £7,314m), mainly due to growth in Retail, which benefited from improved margins, and to growth in International and Corporate reflecting increased advances.
The Group net interest margin reduced to 1.60% (2007 1.63%). While the Group margin faced a headwind from higher wholesale funding costs, the decline reflected a change in business mix across the divisions with reductions of 3bps and 23bps in International and Corporate respectively, more than offsetting an increase of 4bps in Retail. The improvement in the Retail margin reflects the beneficial effect of higher mortgage acquisition, retention and credit card spreads which more than offset higher funding costs. Corporate's margin fell due to slower turnover of the back book which has influenced the timing of fee recognition as well as the increased cost of deposits and higher wholesale funding costs.
Non-interest IncomeUnderlying non-interest income decreased to negative £1,562m (2007 income of £5,589m). Excluding the negative £4,044m (2007 negative £227m) impact of Market Dislocation, summarised on page 6, and described in further detail in the Treasury divisional section, underlying non-interest income decreased to £2,482m (2007 £5,816m). The significant decline is due to Corporate and reflects significant impairment losses on property related investments made by the Joint Ventures business and private equity fund investments made by the Integrated Finance business, together with a material decline in the trading performance generated by jointly controlled entities, particularly in the housebuilding and property sectors. In Insurance & Investment, underlying non-interest income was £140m higher, due to lower weather related claims in the General Insurance business in 2008.
Operating Expenses Underlying operating expenses increased to £5,344m (2007 £5,274m). The increase of £70m includes additional costs arising from planned investments in International, additional marketing spend in General Insurance, partially offset by reduced staff costs in Corporate, benefits from cost reduction initiatives in Retail, and lower bonus costs across the Group.
Group cost:income ratio including the impact of Market Dislocation increased to 80.9% (2007 40.9%). The Group cost:income ratio excluding the impact of Market Dislocation was 50.6% (2007 40.2%).
Review of Financial Performance HBOS plc
Preliminary Results 2008 8
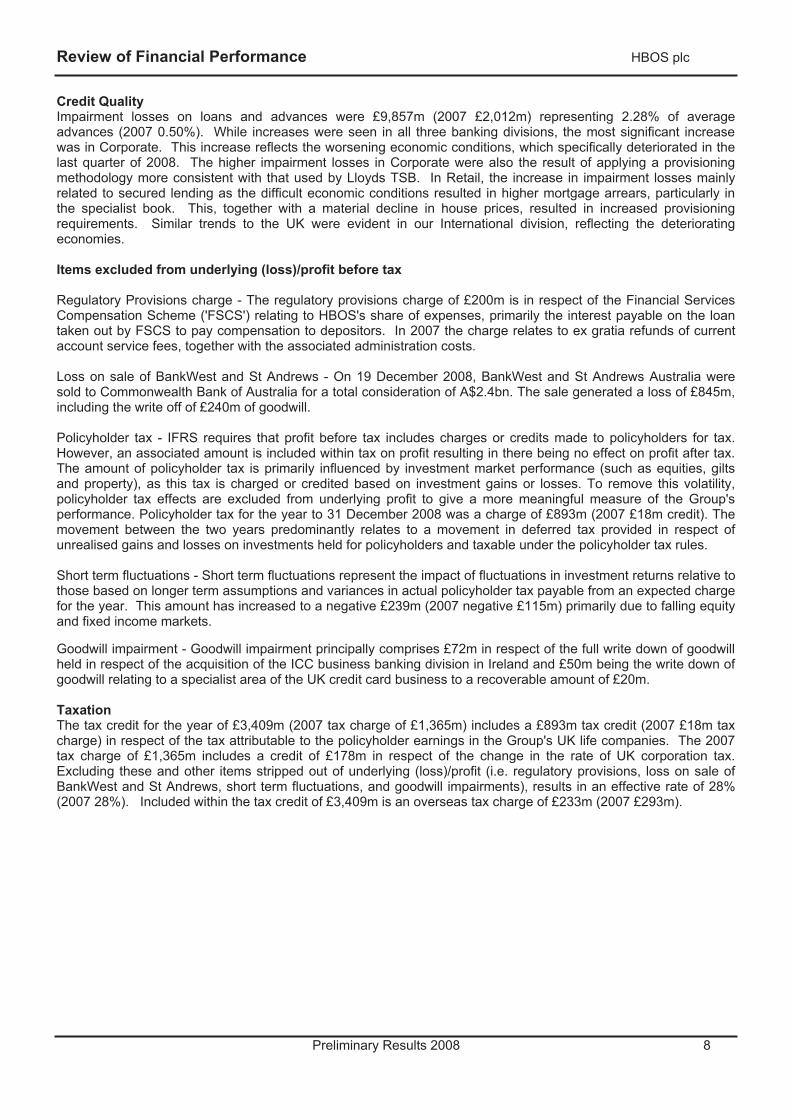
Credit Quality Impairment losses on loans and advances were £9,857m (2007 £2,012m) representing 2.28% of average advances (2007 0.50%). While increases were seen in all three banking divisions, the most significant increase was in Corporate. This increase reflects the worsening economic conditions, which specifically deteriorated in the last quarter of 2008. The higher impairment losses in Corporate were also the result of applying a provisioning methodology more consistent with that used by Lloyds TSB. In Retail, the increase in impairment losses mainly related to secured lending as the difficult economic conditions resulted in higher mortgage arrears, particularly in the specialist book. This, together with a material decline in house prices, resulted in increased provisioning requirements. Similar trends to the UK were evident in our International division, reflecting the deteriorating economies.
Items excluded from underlying (loss)/profit before tax
Regulatory Provisions charge - The regulatory provisions charge of £200m is in respect of the Financial Services Compensation Scheme ('FSCS') relating to HBOS's share of expenses, primarily the interest payable on the loan taken out by FSCS to pay compensation to depositors. In 2007 the charge relates to ex gratia refunds of current account service fees, together with the associated administration costs.
Loss on sale of BankWest and St Andrews - On 19 December 2008, BankWest and St Andrews Australia were sold to Commonwealth Bank of Australia for a total consideration of A$2.4bn. The sale generated a loss of £845m, including the write off of £240m of goodwill.
Policyholder tax - IFRS requires that profit before tax includes charges or credits made to policyholders for tax. However, an associated amount is included within tax on profit resulting in there being no effect on profit after tax. The amount of policyholder tax is primarily influenced by investment market performance (such as equities, gilts and property), as this tax is charged or credited based on investment gains or losses. To remove this volatility, policyholder tax effects are excluded from underlying profit to give a more meaningful measure of the Group's performance. Policyholder tax for the year to 31 December 2008 was a charge of £893m (2007 £18m credit). The movement between the two years predominantly relates to a movement in deferred tax provided in respect of unrealised gains and losses on investments held for policyholders and taxable under the policyholder tax rules.
Short term fluctuations - Short term fluctuations represent the impact of fluctuations in investment returns relative to those based on longer term assumptions and variances in actual policyholder tax payable from an expected charge for the year. This amount has increased to a negative £239m (2007 negative £115m) primarily due to falling equity and fixed income markets.
Goodwill impairment - Goodwill impairment principally comprises £72m in respect of the full write down of goodwill held in respect of the acquisition of the ICC business banking division in Ireland and £50m being the write down of goodwill relating to a specialist area of the UK credit card business to a recoverable amount of £20m.
Taxation The tax credit for the year of £3,409m (2007 tax charge of £1,365m) includes a £893m tax credit (2007 £18m tax charge) in respect of the tax attributable to the policyholder earnings in the Group's UK life companies. The 2007 tax charge of £1,365m includes a credit of £178m in respect of the change in the rate of UK corporation tax. Excluding these and other items stripped out of underlying (loss)/profit (i.e. regulatory provisions, loss on sale of BankWest and St Andrews, short term fluctuations, and goodwill impairments), results in an effective rate of 28% (2007 28%). Included within the tax credit of £3,409m is an overseas tax charge of £233m (2007 £293m).
Review of Financial Performance HBOS plc
Preliminary Results 2008 9
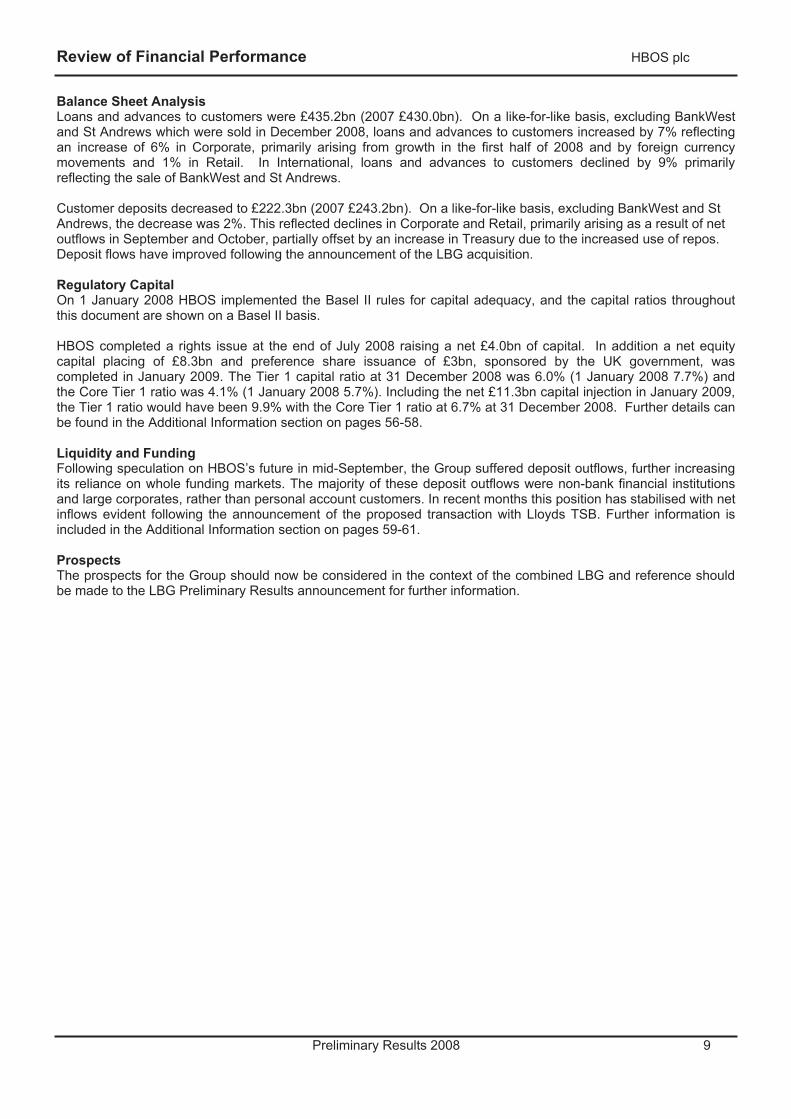
Balance Sheet Analysis Loans and advances to customers were £435.2bn (2007 £430.0bn). On a like-for-like basis, excluding BankWest and St Andrews which were sold in December 2008, loans and advances to customers increased by 7% reflecting an increase of 6% in Corporate, primarily arising from growth in the first half of 2008 and by foreign currency movements and 1% in Retail. In International, loans and advances to customers declined by 9% primarily reflecting the sale of BankWest and St Andrews.
Customer deposits decreased to £222.3bn (2007 £243.2bn). On a like-for-like basis, excluding BankWest and St Andrews, the decrease was 2%. This reflected declines in Corporate and Retail, primarily arising as a result of net outflows in September and October, partially offset by an increase in Treasury due to the increased use of repos. Deposit flows have improved following the announcement of the LBG acquisition.
Regulatory Capital On 1 January 2008 HBOS implemented the Basel II rules for capital adequacy, and the capital ratios throughout this document are shown on a Basel II basis.
HBOS completed a rights issue at the end of July 2008 raising a net £4.0bn of capital. In addition a net equity capital placing of £8.3bn and preference share issuance of £3bn, sponsored by the UK government, was completed in January 2009. The Tier 1 capital ratio at 31 December 2008 was 6.0% (1 January 2008 7.7%) and the Core Tier 1 ratio was 4.1% (1 January 2008 5.7%). Including the net £11.3bn capital injection in January 2009, the Tier 1 ratio would have been 9.9% with the Core Tier 1 ratio at 6.7% at 31 December 2008. Further details can be found in the Additional Information section on pages 56-58.
Liquidity and Funding Following speculation on HBOS’s future in mid-September, the Group suffered deposit outflows, further increasing its reliance on whole funding markets. The majority of these deposit outflows were non-bank financial institutions and large corporates, rather than personal account customers. In recent months this position has stabilised with net inflows evident following the announcement of the proposed transaction with Lloyds TSB. Further information is included in the Additional Information section on pages 59-61.
Prospects The prospects for the Group should now be considered in the context of the combined LBG and reference should be made to the LBG Preliminary Results announcement for further information.
Key Divisional Statistics HBOS plc
Preliminary Results 2008 10
Yearended
31.12.2008
Year ended
31.12.2007(1)
Retail
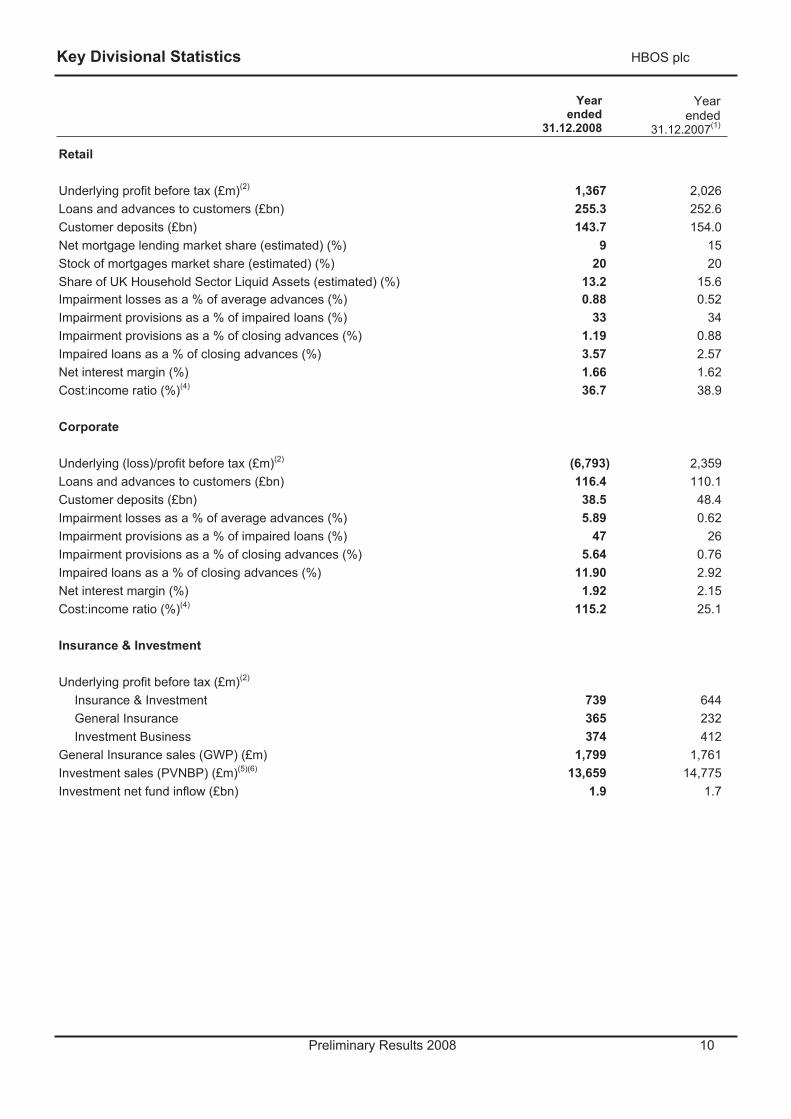
Underlying profit before tax (£m)(2) 1,367 2,026Loans and advances to customers (£bn) 255.3 252.6Customer deposits (£bn) 143.7 154.0Net mortgage lending market share (estimated) (%) 9 15Stock of mortgages market share (estimated) (%) 20 20Share of UK Household Sector Liquid Assets (estimated) (%) 13.2 15.6Impairment losses as a % of average advances (%) 0.88 0.52Impairment provisions as a % of impaired loans (%) 33 34Impairment provisions as a % of closing advances (%) 1.19 0.88Impaired loans as a % of closing advances (%) 3.57 2.57Net interest margin (%) 1.66 1.62Cost:income ratio (%)(4) 36.7 38.9
Corporate
Underlying (loss)/profit before tax (£m)(2) (6,793) 2,359Loans and advances to customers (£bn) 116.4 110.1Customer deposits (£bn) 38.5 48.4Impairment losses as a % of average advances (%) 5.89 0.62Impairment provisions as a % of impaired loans (%) 47 26Impairment provisions as a % of closing advances (%) 5.64 0.76Impaired loans as a % of closing advances (%) 11.90 2.92Net interest margin (%) 1.92 2.15Cost:income ratio (%)(4) 115.2 25.1
Insurance & Investment
Underlying profit before tax (£m)(2)
Insurance & Investment 739 644General Insurance 365 232Investment Business 374 412
General Insurance sales (GWP) (£m) 1,799 1,761Investment sales (PVNBP) (£m)(5)(6) 13,659 14,775Investment net fund inflow (£bn) 1.9 1.7
Key Divisional Statistics HBOS plc
Preliminary Results 2008 11
Yearended
31.12.2008
Year ended
31.12.2007(1)
International
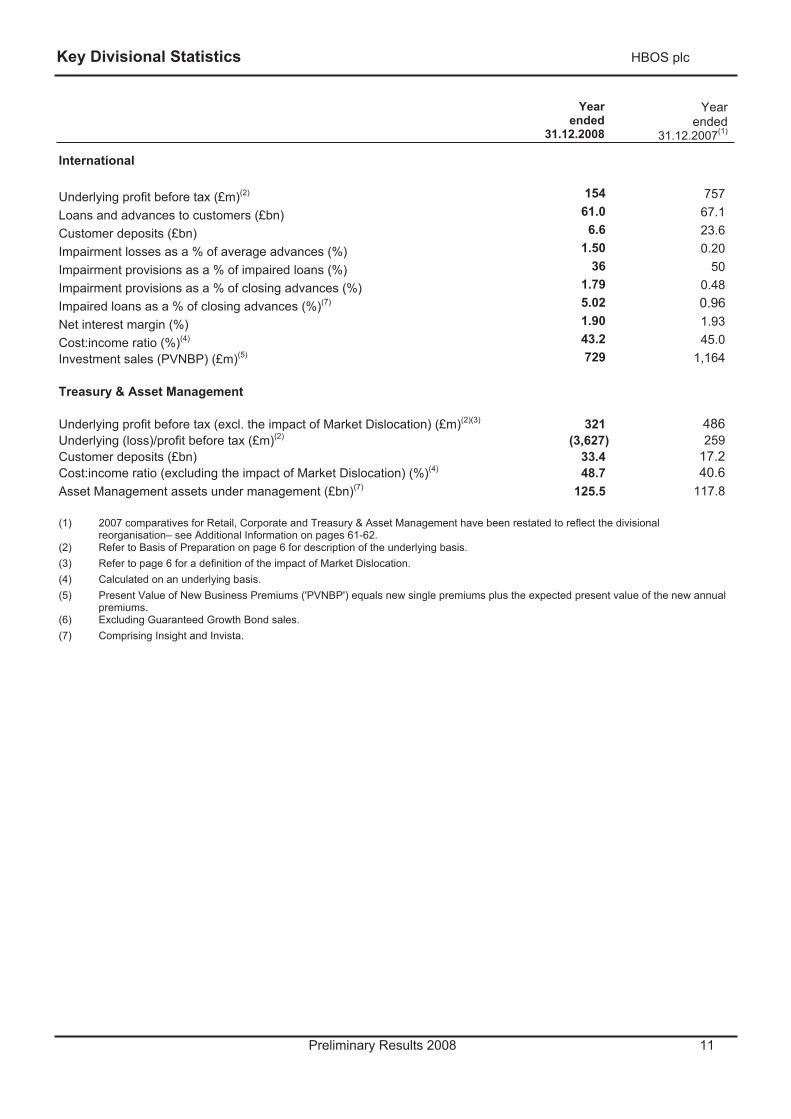
Underlying profit before tax (£m)(2) 154 757
Loans and advances to customers (£bn) 61.0 67.1
Customer deposits (£bn) 6.6 23.6
Impairment losses as a % of average advances (%) 1.50 0.20
Impairment provisions as a % of impaired loans (%) 36 50
Impairment provisions as a % of closing advances (%) 1.79 0.48
Impaired loans as a % of closing advances (%)(7) 5.02 0.96Net interest margin (%) 1.90 1.93
Cost:income ratio (%)(4) 43.2 45.0Investment sales (PVNBP) (£m)(5) 729 1,164
Treasury & Asset Management
Underlying profit before tax (excl. the impact of Market Dislocation) (£m)(2)(3) 321 486Underlying (loss)/profit before tax (£m)(2) (3,627) 259Customer deposits (£bn) 33.4 17.2Cost:income ratio (excluding the impact of Market Dislocation) (%)(4) 48.7 40.6Asset Management assets under management (£bn)(7) 125.5 117.8
(1) 2007 comparatives for Retail, Corporate and Treasury & Asset Management have been restated to reflect the divisional reorganisation– see Additional Information on pages 61-62.
(2) Refer to Basis of Preparation on page 6 for description of the underlying basis. (3) Refer to page 6 for a definition of the impact of Market Dislocation. (4) Calculated on an underlying basis. (5) Present Value of New Business Premiums ('PVNBP') equals new single premiums plus the expected present value of the new annual
premiums.(6) Excluding Guaranteed Growth Bond sales. (7) Comprising Insight and Invista.
Segmental Analysis HBOS plc
Preliminary Results 2008 12
Income Statement
Year ended 31 December 2008
Retail
£m
Corporate
£m
Insurance & Investment
£m
International
£m
Treasury & Asset
Mgmt£m
GroupItems
£m
Yearended
31.12.08£m
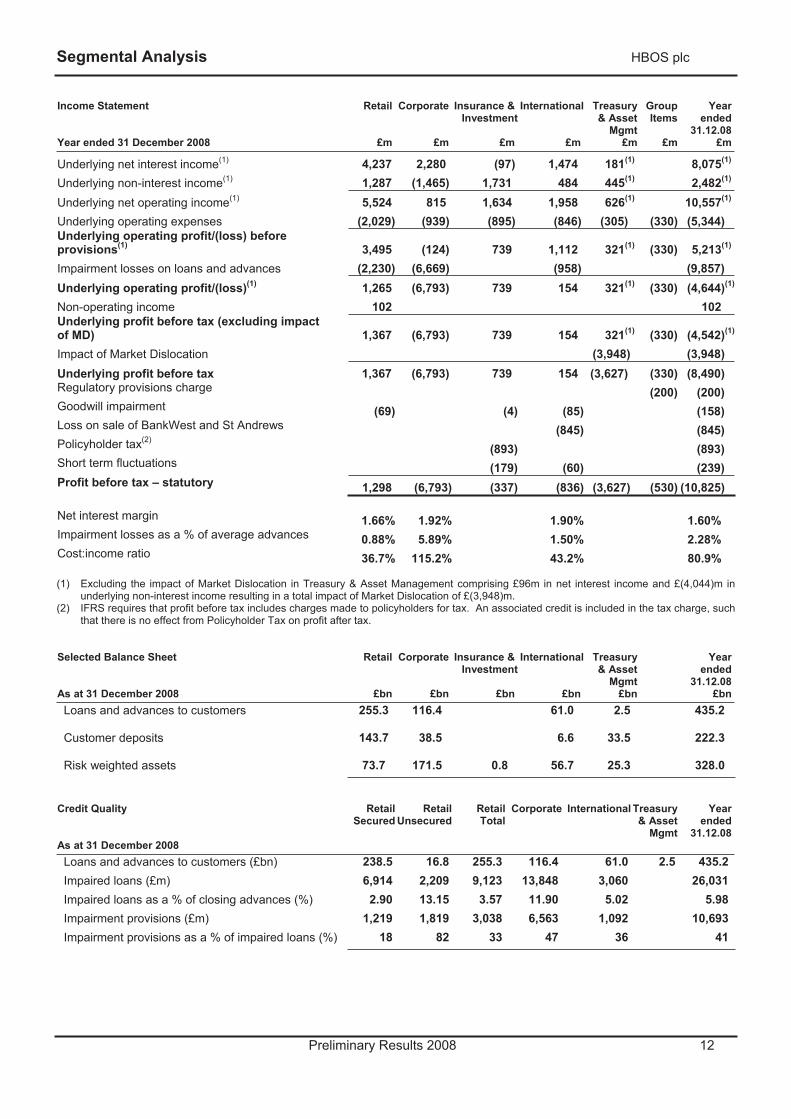
Underlying net interest income(1) 4,237 2,280 (97) 1,474 181(1) 8,075(1)
Underlying non-interest income(1) 1,287 (1,465) 1,731 484 445(1) 2,482(1)
Underlying net operating income(1) 5,524 815 1,634 1,958 626(1) 10,557(1)
Underlying operating expenses (2,029) (939) (895) (846) (305) (330) (5,344) Underlying operating profit/(loss) before provisions(1) 3,495 (124) 739 1,112 321(1) (330) 5,213(1)
Impairment losses on loans and advances (2,230) (6,669) (958) (9,857) Underlying operating profit/(loss)(1) 1,265 (6,793) 739 154 321(1) (330) (4,644)(1)
Non-operating income 102 102 Underlying profit before tax (excluding impact of MD) 1,367 (6,793) 739 154 321(1) (330) (4,542)(1)
Impact of Market Dislocation (3,948) (3,948) Underlying profit before tax 1,367 (6,793) 739 154 (3,627) (330) (8,490) Regulatory provisions charge (200) (200) Goodwill impairment (69) (4) (85) (158) Loss on sale of BankWest and St Andrews (845) (845) Policyholder tax(2)
(893) (893) Short term fluctuations (179) (60) (239) Profit before tax – statutory 1,298 (6,793) (337) (836) (3,627) (530) (10,825)
Net interest margin 1.66% 1.92% 1.90% 1.60% Impairment losses as a % of average advances 0.88% 5.89% 1.50% 2.28% Cost:income ratio 36.7% 115.2% 43.2% 80.9%
(1) Excluding the impact of Market Dislocation in Treasury & Asset Management comprising £96m in net interest income and £(4,044)m in underlying non-interest income resulting in a total impact of Market Dislocation of £(3,948)m.
(2) IFRS requires that profit before tax includes charges made to policyholders for tax. An associated credit is included in the tax charge, such that there is no effect from Policyholder Tax on profit after tax.
Selected Balance Sheet
As at 31 December 2008
Retail
£bn
Corporate
£bn
Insurance & Investment
£bn
International
£bn
Treasury & Asset
Mgmt£bn
Yearended
31.12.08£bn
Loans and advances to customers 255.3 116.4 61.0 2.5 435.2
Customer deposits 143.7 38.5 6.6 33.5 222.3
Risk weighted assets 73.7 171.5 0.8 56.7 25.3 328.0
Credit Quality
As at 31 December 2008
RetailSecured
RetailUnsecured
RetailTotal
Corporate International Treasury& Asset
Mgmt
Yearended
31.12.08
Loans and advances to customers (£bn) 238.5 16.8 255.3 116.4 61.0 2.5 435.2 Impaired loans (£m) 6,914 2,209 9,123 13,848 3,060 26,031 Impaired loans as a % of closing advances (%) 2.90 13.15 3.57 11.90 5.02 5.98 Impairment provisions (£m) 1,219 1,819 3,038 6,563 1,092 10,693 Impairment provisions as a % of impaired loans (%) 18 82 33 47 36 41
Segmental Analysis HBOS plc
Preliminary Results 2008 13
Income Statement
Year ended 31 December 2007
Retail
£m
Corporate
£m
Insurance & Investment
£m
International
£m
Treasury & Asset
Mgmt£m
GroupItems
£m
Year ended
31.12.07(2)
£m
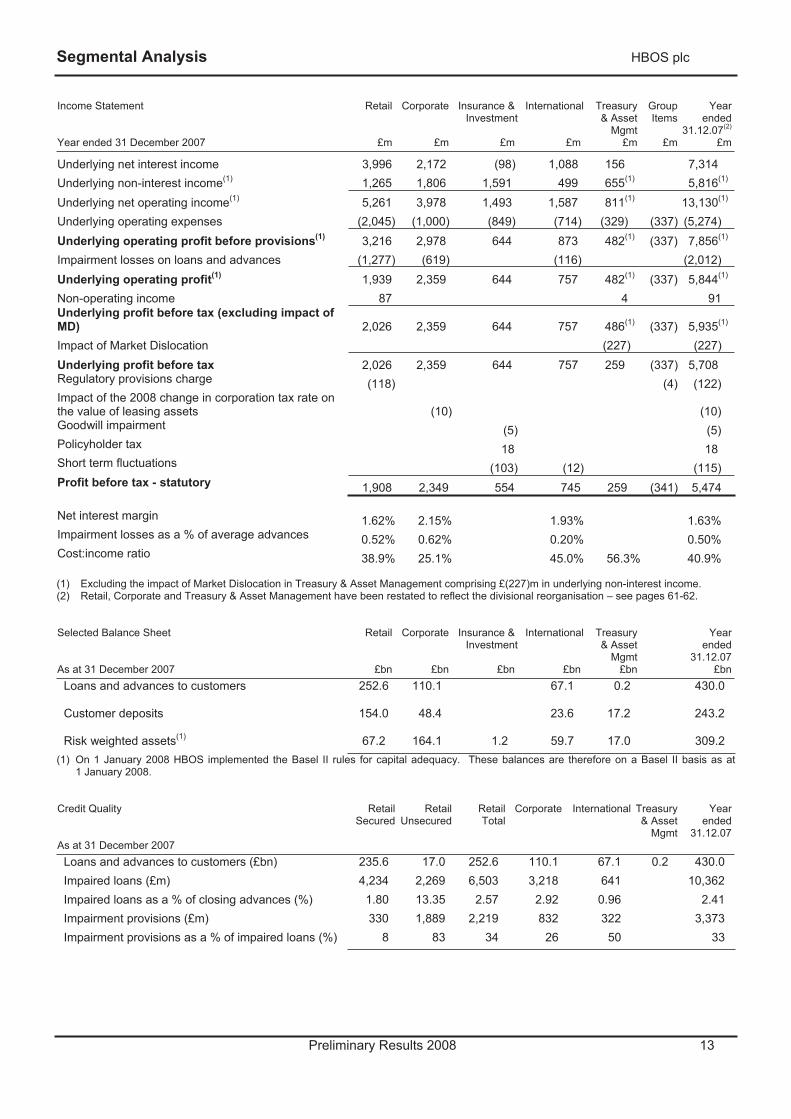
Underlying net interest income 3,996 2,172 (98) 1,088 156 7,314 Underlying non-interest income(1) 1,265 1,806 1,591 499 655(1) 5,816(1)
Underlying net operating income(1) 5,261 3,978 1,493 1,587 811(1) 13,130(1)
Underlying operating expenses (2,045) (1,000) (849) (714) (329) (337) (5,274) Underlying operating profit before provisions(1) 3,216 2,978 644 873 482(1) (337) 7,856(1)
Impairment losses on loans and advances (1,277) (619) (116) (2,012) Underlying operating profit(1) 1,939 2,359 644 757 482(1) (337) 5,844(1)
Non-operating income 87 4 91 Underlying profit before tax (excluding impact of MD) 2,026 2,359 644 757 486(1) (337) 5,935(1)
Impact of Market Dislocation (227) (227) Underlying profit before tax 2,026 2,359 644 757 259 (337) 5,708 Regulatory provisions charge (118) (4) (122) Impact of the 2008 change in corporation tax rate on the value of leasing assets (10) (10) Goodwill impairment (5) (5) Policyholder tax 18 18 Short term fluctuations (103) (12) (115) Profit before tax - statutory 1,908 2,349 554 745 259 (341) 5,474
Net interest margin 1.62% 2.15% 1.93% 1.63% Impairment losses as a % of average advances 0.52% 0.62% 0.20% 0.50% Cost:income ratio 38.9% 25.1% 45.0% 56.3% 40.9%
(1) Excluding the impact of Market Dislocation in Treasury & Asset Management comprising £(227)m in underlying non-interest income.(2) Retail, Corporate and Treasury & Asset Management have been restated to reflect the divisional reorganisation – see pages 61-62.
Selected Balance Sheet
As at 31 December 2007
Retail
£bn
Corporate
£bn
Insurance & Investment
£bn
International
£bn
Treasury & Asset
Mgmt£bn
Year ended
31.12.07£bn
Loans and advances to customers 252.6 110.1 67.1 0.2 430.0
Customer deposits 154.0 48.4 23.6 17.2 243.2
Risk weighted assets(1) 67.2 164.1 1.2 59.7 17.0 309.2 (1) On 1 January 2008 HBOS implemented the Basel II rules for capital adequacy. These balances are therefore on a Basel II basis as at
1 January 2008.
Credit Quality
As at 31 December 2007
RetailSecured
RetailUnsecured
RetailTotal
Corporate International Treasury& Asset
Mgmt
Year ended
31.12.07
Loans and advances to customers (£bn) 235.6 17.0 252.6 110.1 67.1 0.2 430.0 Impaired loans (£m) 4,234 2,269 6,503 3,218 641 10,362 Impaired loans as a % of closing advances (%) 1.80 13.35 2.57 2.92 0.96 2.41 Impairment provisions (£m) 330 1,889 2,219 832 322 3,373 Impairment provisions as a % of impaired loans (%) 8 83 34 26 50 33
Retail HBOS plc
Preliminary Results 2008 14
Retail
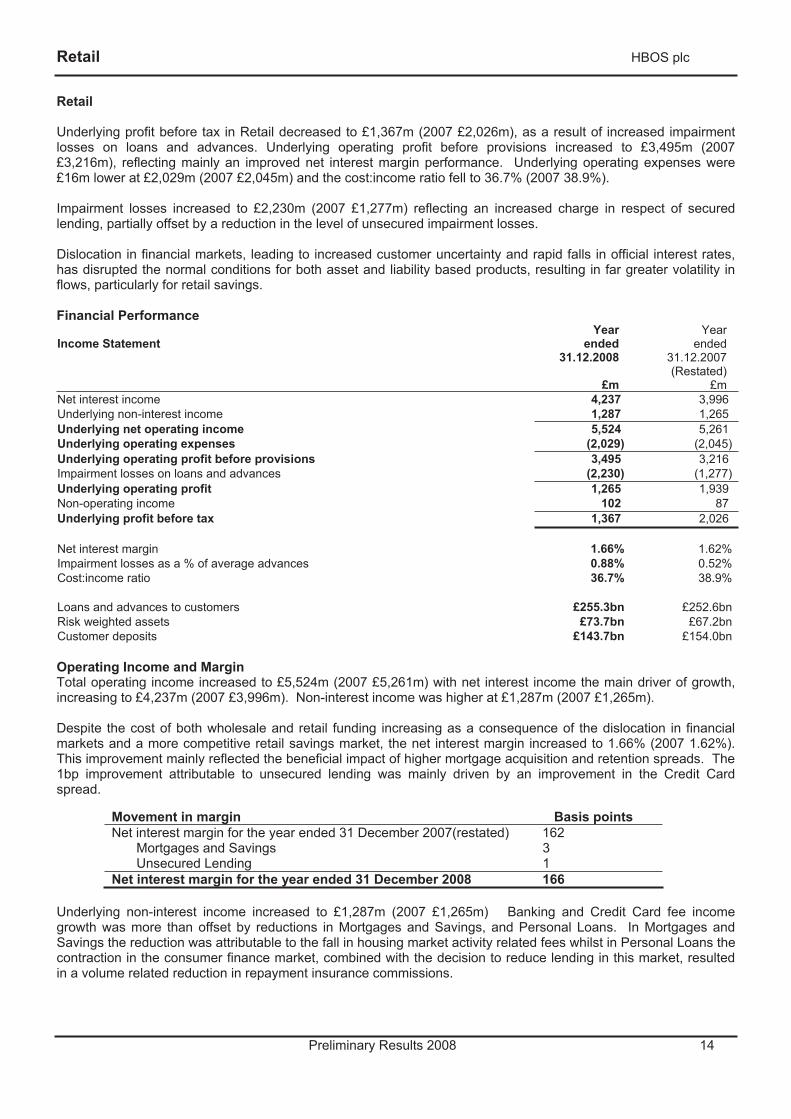
Underlying profit before tax in Retail decreased to £1,367m (2007 £2,026m), as a result of increased impairment losses on loans and advances. Underlying operating profit before provisions increased to £3,495m (2007 £3,216m), reflecting mainly an improved net interest margin performance. Underlying operating expenses were £16m lower at £2,029m (2007 £2,045m) and the cost:income ratio fell to 36.7% (2007 38.9%).
Impairment losses increased to £2,230m (2007 £1,277m) reflecting an increased charge in respect of secured lending, partially offset by a reduction in the level of unsecured impairment losses.
Dislocation in financial markets, leading to increased customer uncertainty and rapid falls in official interest rates, has disrupted the normal conditions for both asset and liability based products, resulting in far greater volatility in flows, particularly for retail savings.
Financial Performance
Income Statement Year
ended 31.12.2008
£m
Yearended
31.12.2007 (Restated)
£mNet interest income 4,237 3,996Underlying non-interest income 1,287 1,265Underlying net operating income 5,524 5,261Underlying operating expenses (2,029) (2,045)Underlying operating profit before provisions 3,495 3,216Impairment losses on loans and advances (2,230) (1,277)Underlying operating profit 1,265 1,939Non-operating income 102 87Underlying profit before tax 1,367 2,026
Net interest margin 1.66% 1.62%Impairment losses as a % of average advances 0.88% 0.52%Cost:income ratio 36.7% 38.9%
Loans and advances to customers £255.3bn £252.6bn Risk weighted assets £73.7bn £67.2bn Customer deposits £143.7bn £154.0bn
Operating Income and Margin Total operating income increased to £5,524m (2007 £5,261m) with net interest income the main driver of growth, increasing to £4,237m (2007 £3,996m). Non-interest income was higher at £1,287m (2007 £1,265m).
Despite the cost of both wholesale and retail funding increasing as a consequence of the dislocation in financial markets and a more competitive retail savings market, the net interest margin increased to 1.66% (2007 1.62%). This improvement mainly reflected the beneficial impact of higher mortgage acquisition and retention spreads. The 1bp improvement attributable to unsecured lending was mainly driven by an improvement in the Credit Card spread.
Movement in margin Basis points Net interest margin for the year ended 31 December 2007(restated) 162
Mortgages and Savings 3Unsecured Lending 1
Net interest margin for the year ended 31 December 2008 166
Underlying non-interest income increased to £1,287m (2007 £1,265m) Banking and Credit Card fee income growth was more than offset by reductions in Mortgages and Savings, and Personal Loans. In Mortgages and Savings the reduction was attributable to the fall in housing market activity related fees whilst in Personal Loans the contraction in the consumer finance market, combined with the decision to reduce lending in this market, resulted in a volume related reduction in repayment insurance commissions.
Retail HBOS plc
Preliminary Results 2008 15
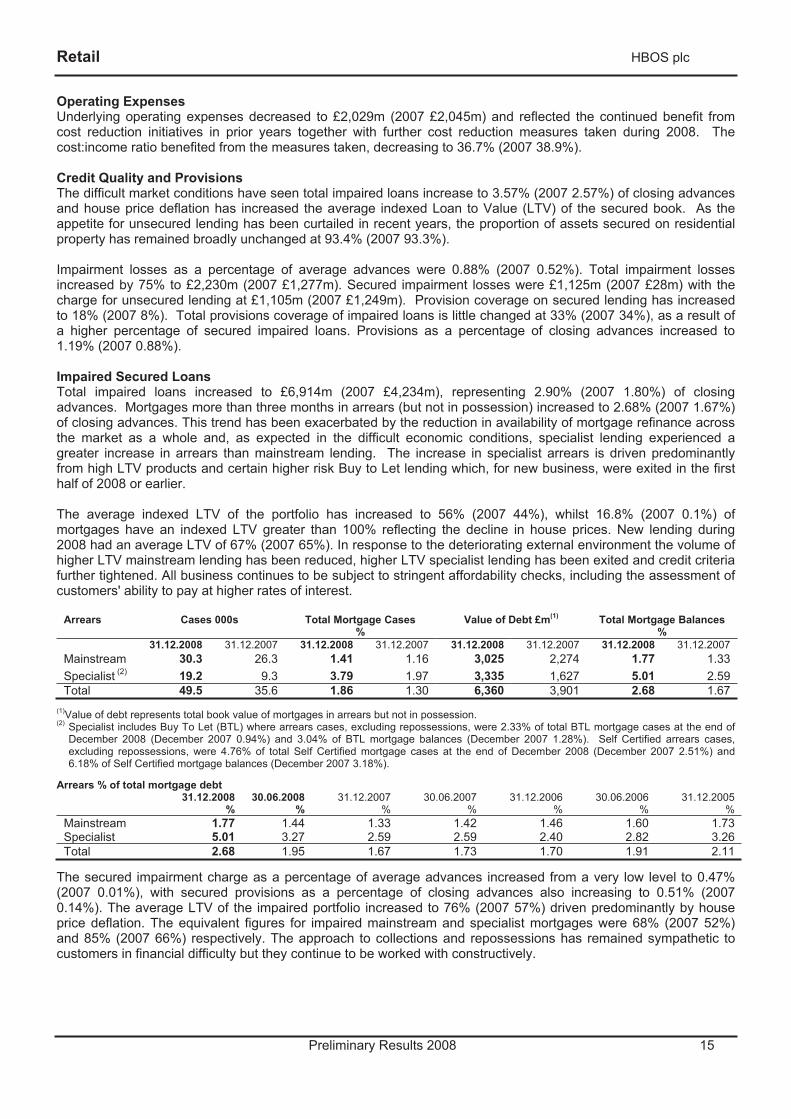
Operating Expenses Underlying operating expenses decreased to £2,029m (2007 £2,045m) and reflected the continued benefit from cost reduction initiatives in prior years together with further cost reduction measures taken during 2008. The cost:income ratio benefited from the measures taken, decreasing to 36.7% (2007 38.9%).
Credit Quality and Provisions The difficult market conditions have seen total impaired loans increase to 3.57% (2007 2.57%) of closing advances and house price deflation has increased the average indexed Loan to Value (LTV) of the secured book. As the appetite for unsecured lending has been curtailed in recent years, the proportion of assets secured on residential property has remained broadly unchanged at 93.4% (2007 93.3%).
Impairment losses as a percentage of average advances were 0.88% (2007 0.52%). Total impairment losses increased by 75% to £2,230m (2007 £1,277m). Secured impairment losses were £1,125m (2007 £28m) with the charge for unsecured lending at £1,105m (2007 £1,249m). Provision coverage on secured lending has increased to 18% (2007 8%). Total provisions coverage of impaired loans is little changed at 33% (2007 34%), as a result of a higher percentage of secured impaired loans. Provisions as a percentage of closing advances increased to 1.19% (2007 0.88%).
Impaired Secured Loans Total impaired loans increased to £6,914m (2007 £4,234m), representing 2.90% (2007 1.80%) of closing advances. Mortgages more than three months in arrears (but not in possession) increased to 2.68% (2007 1.67%) of closing advances. This trend has been exacerbated by the reduction in availability of mortgage refinance across the market as a whole and, as expected in the difficult economic conditions, specialist lending experienced a greater increase in arrears than mainstream lending. The increase in specialist arrears is driven predominantly from high LTV products and certain higher risk Buy to Let lending which, for new business, were exited in the first half of 2008 or earlier.
The average indexed LTV of the portfolio has increased to 56% (2007 44%), whilst 16.8% (2007 0.1%) of mortgages have an indexed LTV greater than 100% reflecting the decline in house prices. New lending during 2008 had an average LTV of 67% (2007 65%). In response to the deteriorating external environment the volume of higher LTV mainstream lending has been reduced, higher LTV specialist lending has been exited and credit criteria further tightened. All business continues to be subject to stringent affordability checks, including the assessment of customers' ability to pay at higher rates of interest.
Arrears Cases 000s Total Mortgage Cases %
Value of Debt £m(1) Total Mortgage Balances %
31.12.2008 31.12.2007 31.12.2008 31.12.2007 31.12.2008 31.12.2007 31.12.2008 31.12.2007Mainstream 30.3 26.3 1.41 1.16 3,025 2,274 1.77 1.33Specialist (2) 19.2 9.3 3.79 1.97 3,335 1,627 5.01 2.59Total 49.5 35.6 1.86 1.30 6,360 3,901 2.68 1.67
(1)Value of debt represents total book value of mortgages in arrears but not in possession. (2) Specialist includes Buy To Let (BTL) where arrears cases, excluding repossessions, were 2.33% of total BTL mortgage cases at the end of
December 2008 (December 2007 0.94%) and 3.04% of BTL mortgage balances (December 2007 1.28%). Self Certified arrears cases, excluding repossessions, were 4.76% of total Self Certified mortgage cases at the end of December 2008 (December 2007 2.51%) and6.18% of Self Certified mortgage balances (December 2007 3.18%).
Arrears % of total mortgage debt 31.12.2008 30.06.2008 31.12.2007 30.06.2007 31.12.2006 30.06.2006 31.12.2005
% % % % % % % Mainstream 1.77 1.44 1.33 1.42 1.46 1.60 1.73 Specialist 5.01 3.27 2.59 2.59 2.40 2.82 3.26 Total 2.68 1.95 1.67 1.73 1.70 1.91 2.11
The secured impairment charge as a percentage of average advances increased from a very low level to 0.47% (2007 0.01%), with secured provisions as a percentage of closing advances also increasing to 0.51% (2007 0.14%). The average LTV of the impaired portfolio increased to 76% (2007 57%) driven predominantly by house price deflation. The equivalent figures for impaired mainstream and specialist mortgages were 68% (2007 52%) and 85% (2007 66%) respectively. The approach to collections and repossessions has remained sympathetic to customers in financial difficulty but they continue to be worked with constructively.
Retail HBOS plc
Preliminary Results 2008 16
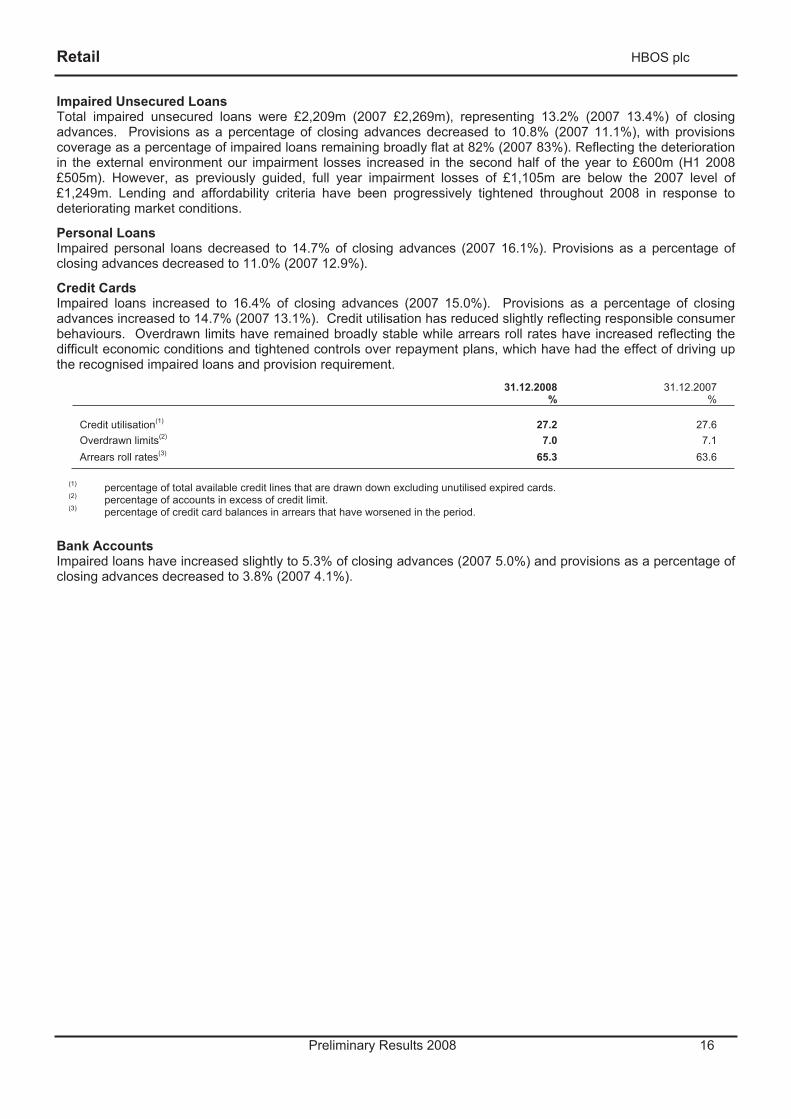
Impaired Unsecured Loans Total impaired unsecured loans were £2,209m (2007 £2,269m), representing 13.2% (2007 13.4%) of closing advances. Provisions as a percentage of closing advances decreased to 10.8% (2007 11.1%), with provisions coverage as a percentage of impaired loans remaining broadly flat at 82% (2007 83%). Reflecting the deterioration in the external environment our impairment losses increased in the second half of the year to £600m (H1 2008 £505m). However, as previously guided, full year impairment losses of £1,105m are below the 2007 level of £1,249m. Lending and affordability criteria have been progressively tightened throughout 2008 in response to deteriorating market conditions.
Personal Loans Impaired personal loans decreased to 14.7% of closing advances (2007 16.1%). Provisions as a percentage of closing advances decreased to 11.0% (2007 12.9%).
Credit Cards Impaired loans increased to 16.4% of closing advances (2007 15.0%). Provisions as a percentage of closing advances increased to 14.7% (2007 13.1%). Credit utilisation has reduced slightly reflecting responsible consumer behaviours. Overdrawn limits have remained broadly stable while arrears roll rates have increased reflecting the difficult economic conditions and tightened controls over repayment plans, which have had the effect of driving up the recognised impaired loans and provision requirement.
31.12.2008%
31.12.2007%
Credit utilisation(1) 27.2 27.6Overdrawn limits(2) 7.0 7.1Arrears roll rates(3) 65.3 63.6
(1) percentage of total available credit lines that are drawn down excluding unutilised expired cards. (2) percentage of accounts in excess of credit limit. (3) percentage of credit card balances in arrears that have worsened in the period.
Bank Accounts Impaired loans have increased slightly to 5.3% of closing advances (2007 5.0%) and provisions as a percentage of closing advances decreased to 3.8% (2007 4.1%).
Retail HBOS plc
Preliminary Results 2008 17
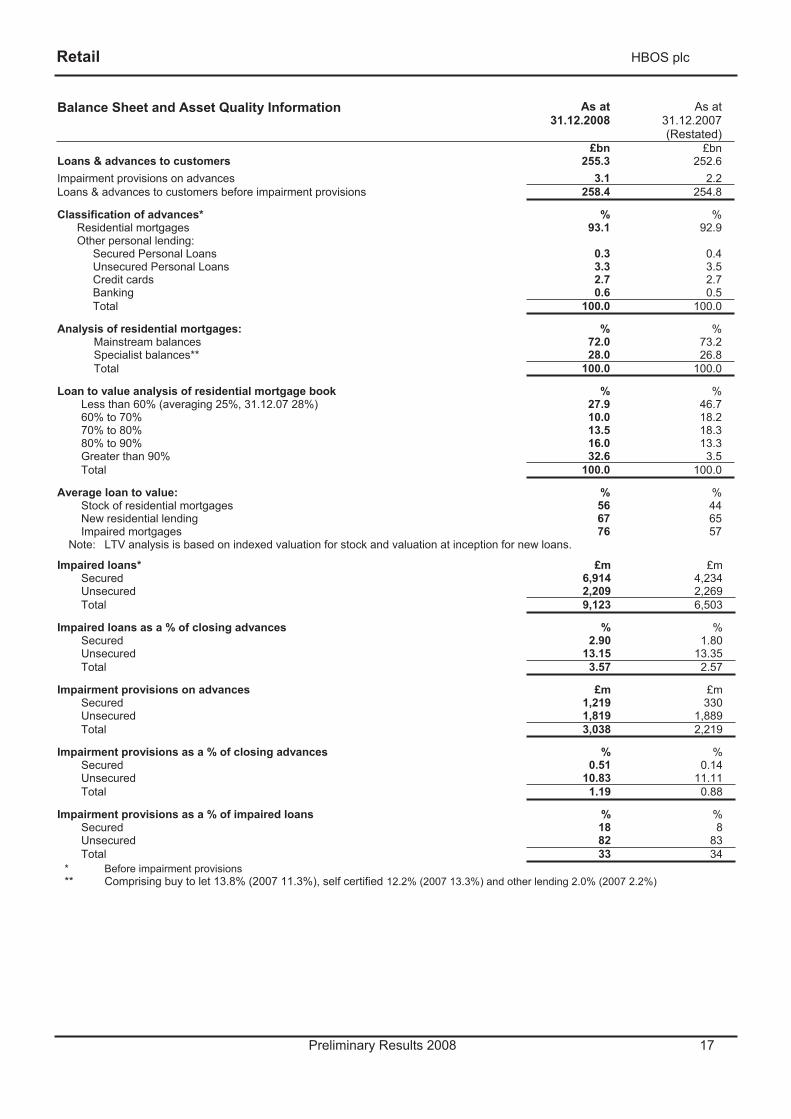
Balance Sheet and Asset Quality Information As at 31.12.2008
As at 31.12.2007 (Restated)
£bn £bn Loans & advances to customers 255.3 252.6 Impairment provisions on advances 3.1 2.2 Loans & advances to customers before impairment provisions 258.4 254.8
Classification of advances* % % Residential mortgages 93.1 92.9 Other personal lending:
Secured Personal Loans 0.3 0.4 Unsecured Personal Loans 3.3 3.5 Credit cards 2.7 2.7 Banking 0.6 0.5 Total 100.0 100.0
Analysis of residential mortgages: % % Mainstream balances 72.0 73.2 Specialist balances** 28.0 26.8 Total 100.0 100.0
Loan to value analysis of residential mortgage book % % Less than 60% (averaging 25%, 31.12.07 28%) 27.9 46.7 60% to 70% 10.0 18.2 70% to 80% 13.5 18.3 80% to 90% 16.0 13.3 Greater than 90% 32.6 3.5 Total 100.0 100.0
Average loan to value: % % Stock of residential mortgages 56 44 New residential lending 67 65 Impaired mortgages 76 57
Note: LTV analysis is based on indexed valuation for stock and valuation at inception for new loans.
Impaired loans* £m £m Secured 6,914 4,234 Unsecured 2,209 2,269 Total 9,123 6,503
Impaired loans as a % of closing advances % % Secured 2.90 1.80 Unsecured 13.15 13.35 Total 3.57 2.57
Impairment provisions on advances £m £m Secured 1,219 330 Unsecured 1,819 1,889 Total 3,038 2,219
Impairment provisions as a % of closing advances % % Secured 0.51 0.14 Unsecured 10.83 11.11 Total 1.19 0.88
Impairment provisions as a % of impaired loans % % Secured 18 8 Unsecured 82 83 Total 33 34
* Before impairment provisions ** Comprising buy to let 13.8% (2007 11.3%), self certified 12.2% (2007 13.3%) and other lending 2.0% (2007 2.2%)
Retail HBOS plc
Preliminary Results 2008 18
Operational Performance
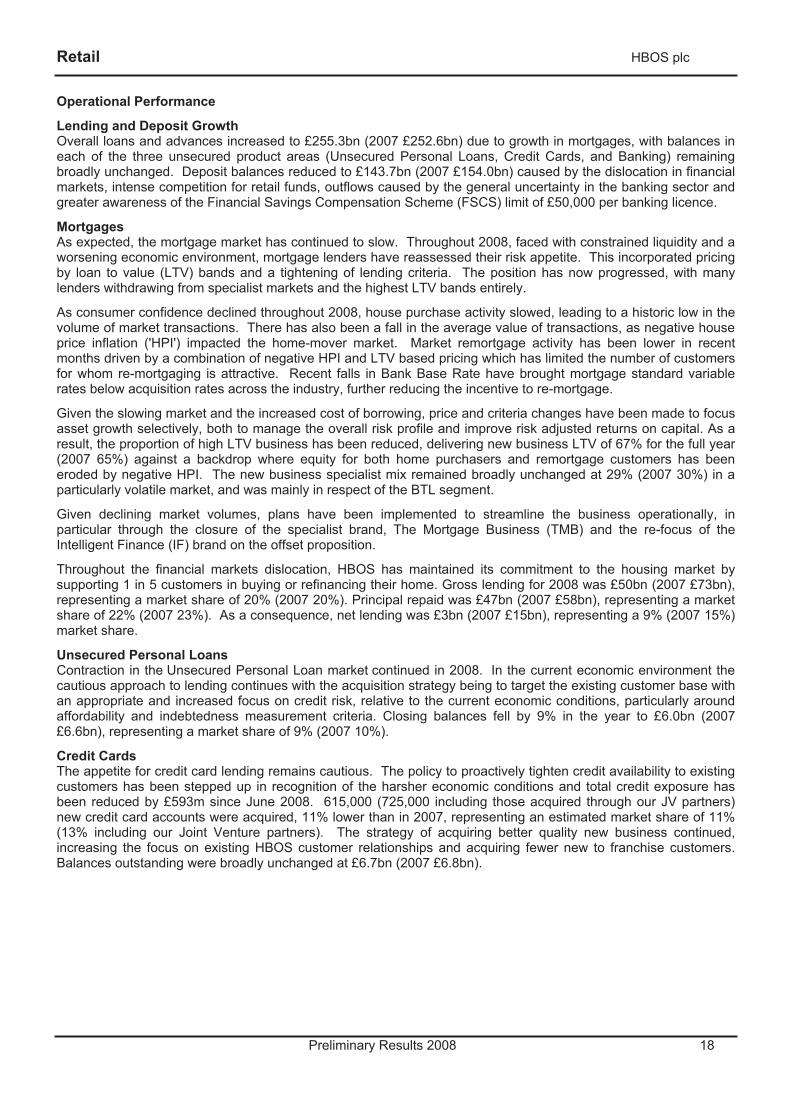
Lending and Deposit Growth Overall loans and advances increased to £255.3bn (2007 £252.6bn) due to growth in mortgages, with balances in each of the three unsecured product areas (Unsecured Personal Loans, Credit Cards, and Banking) remaining broadly unchanged. Deposit balances reduced to £143.7bn (2007 £154.0bn) caused by the dislocation in financial markets, intense competition for retail funds, outflows caused by the general uncertainty in the banking sector and greater awareness of the Financial Savings Compensation Scheme (FSCS) limit of £50,000 per banking licence.
Mortgages As expected, the mortgage market has continued to slow. Throughout 2008, faced with constrained liquidity and a worsening economic environment, mortgage lenders have reassessed their risk appetite. This incorporated pricing by loan to value (LTV) bands and a tightening of lending criteria. The position has now progressed, with many lenders withdrawing from specialist markets and the highest LTV bands entirely.
As consumer confidence declined throughout 2008, house purchase activity slowed, leading to a historic low in the volume of market transactions. There has also been a fall in the average value of transactions, as negative house price inflation ('HPI') impacted the home-mover market. Market remortgage activity has been lower in recent months driven by a combination of negative HPI and LTV based pricing which has limited the number of customers for whom re-mortgaging is attractive. Recent falls in Bank Base Rate have brought mortgage standard variable rates below acquisition rates across the industry, further reducing the incentive to re-mortgage.
Given the slowing market and the increased cost of borrowing, price and criteria changes have been made to focus asset growth selectively, both to manage the overall risk profile and improve risk adjusted returns on capital. As a result, the proportion of high LTV business has been reduced, delivering new business LTV of 67% for the full year (2007 65%) against a backdrop where equity for both home purchasers and remortgage customers has been eroded by negative HPI. The new business specialist mix remained broadly unchanged at 29% (2007 30%) in a particularly volatile market, and was mainly in respect of the BTL segment.
Given declining market volumes, plans have been implemented to streamline the business operationally, in particular through the closure of the specialist brand, The Mortgage Business (TMB) and the re-focus of the Intelligent Finance (IF) brand on the offset proposition.
Throughout the financial markets dislocation, HBOS has maintained its commitment to the housing market by supporting 1 in 5 customers in buying or refinancing their home. Gross lending for 2008 was £50bn (2007 £73bn), representing a market share of 20% (2007 20%). Principal repaid was £47bn (2007 £58bn), representing a market share of 22% (2007 23%). As a consequence, net lending was £3bn (2007 £15bn), representing a 9% (2007 15%) market share.
Unsecured Personal Loans Contraction in the Unsecured Personal Loan market continued in 2008. In the current economic environment the cautious approach to lending continues with the acquisition strategy being to target the existing customer base with an appropriate and increased focus on credit risk, relative to the current economic conditions, particularly around affordability and indebtedness measurement criteria. Closing balances fell by 9% in the year to £6.0bn (2007 £6.6bn), representing a market share of 9% (2007 10%).
Credit Cards The appetite for credit card lending remains cautious. The policy to proactively tighten credit availability to existing customers has been stepped up in recognition of the harsher economic conditions and total credit exposure has been reduced by £593m since June 2008. 615,000 (725,000 including those acquired through our JV partners)new credit card accounts were acquired, 11% lower than in 2007, representing an estimated market share of 11% (13% including our Joint Venture partners). The strategy of acquiring better quality new business continued, increasing the focus on existing HBOS customer relationships and acquiring fewer new to franchise customers.Balances outstanding were broadly unchanged at £6.7bn (2007 £6.8bn).
Retail HBOS plc
Preliminary Results 2008 19
Retail Savings The retail savings market continues to be extremely challenging. Not only has the dislocation in financial markets brought ever-increasing funding pressures on financial institutions, meaning an increasingly competitive market for retail savings, but the retail savings market is showing signs of slowing as the harsher economic conditions impact individuals' personal financial circumstances. 2008 has been characterised by far greater volatility of flows as the media focus on security concerns and awareness of the FSCS limit led many customers to distribute their savings around a number of financial institutions thereby spreading their risk. Despite these difficult market conditions, HBOS retains its market leading position of Household Sector Liquid assets with a market share of 13.2% (2007 15.6%) and this position, combined with the brand and distribution strength together with innovative products, provides an excellent platform from which to attract future inflows.
Given the turmoil in financial markets, HBOS has seen some customers reduce their deposit holdings. However, in the latter part of 2008, our multibrand retail savings franchise attracted strong net inflows during November and December.
Bank Accounts The competitiveness of the range of current accounts has continued to drive the sales momentum. Market share of new current accounts in 2008 was 16% (2007 16%). New bank accounts acquired totalled 960,000 (2007 one million) and of these 75% (2007 75%) were full facility current accounts of which 7% were Ultimate Reward Current Accounts enjoying a package of benefits in return for a monthly fee.
Corporate HBOS plc
Preliminary Results 2008 20
Corporate
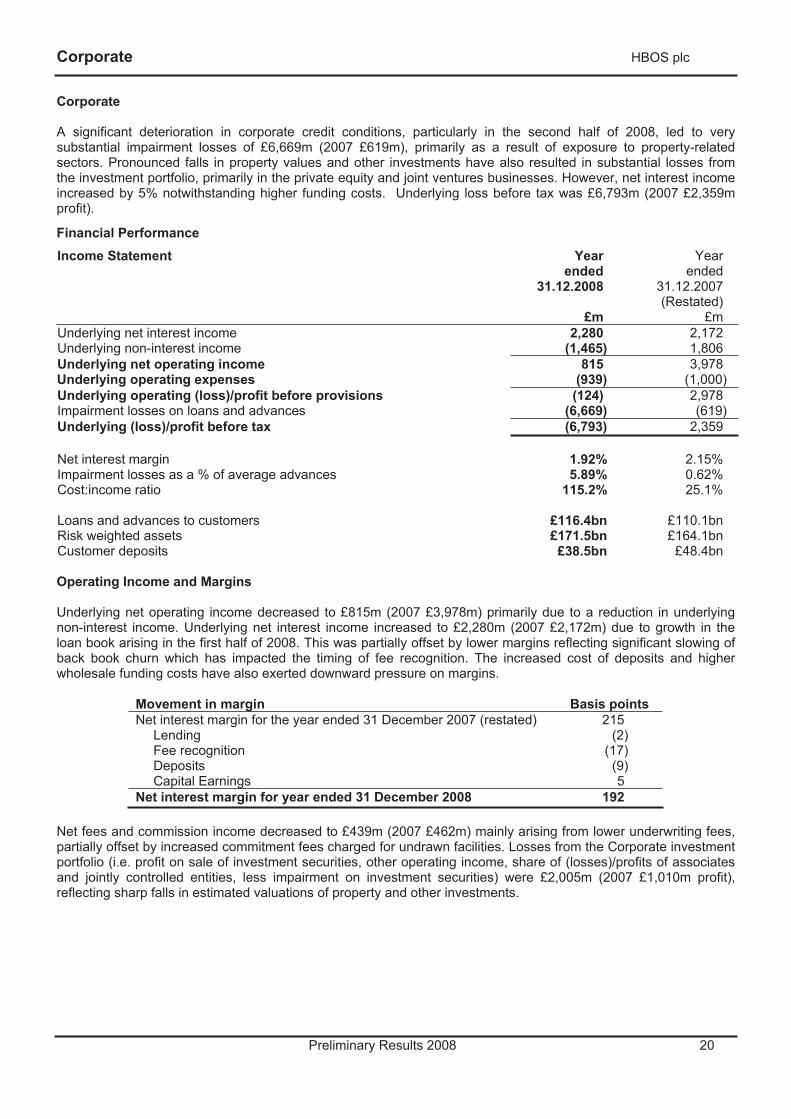
A significant deterioration in corporate credit conditions, particularly in the second half of 2008, led to very substantial impairment losses of £6,669m (2007 £619m), primarily as a result of exposure to property-related sectors. Pronounced falls in property values and other investments have also resulted in substantial losses from the investment portfolio, primarily in the private equity and joint ventures businesses. However, net interest income increased by 5% notwithstanding higher funding costs. Underlying loss before tax was £6,793m (2007 £2,359m profit).
Financial PerformanceIncome Statement Year
ended31.12.2008
£m
Year ended
31.12.2007 (Restated)
£mUnderlying net interest income 2,280 2,172 Underlying non-interest income (1,465) 1,806 Underlying net operating income 815 3,978 Underlying operating expenses (939) (1,000) Underlying operating (loss)/profit before provisions (124) 2,978 Impairment losses on loans and advances (6,669) (619) Underlying (loss)/profit before tax (6,793) 2,359
Net interest margin 1.92% 2.15% Impairment losses as a % of average advances 5.89% 0.62% Cost:income ratio 115.2% 25.1%
Loans and advances to customers £116.4bn £110.1bn Risk weighted assets £171.5bn £164.1bn Customer deposits £38.5bn £48.4bn
Operating Income and Margins
Underlying net operating income decreased to £815m (2007 £3,978m) primarily due to a reduction in underlying non-interest income. Underlying net interest income increased to £2,280m (2007 £2,172m) due to growth in the loan book arising in the first half of 2008. This was partially offset by lower margins reflecting significant slowing of back book churn which has impacted the timing of fee recognition. The increased cost of deposits and higher wholesale funding costs have also exerted downward pressure on margins.
Movement in margin Basis points Net interest margin for the year ended 31 December 2007 (restated) 215
Lending (2) Fee recognition (17) Deposits (9) Capital Earnings 5
Net interest margin for year ended 31 December 2008 192
Net fees and commission income decreased to £439m (2007 £462m) mainly arising from lower underwriting fees, partially offset by increased commitment fees charged for undrawn facilities. Losses from the Corporate investment portfolio (i.e. profit on sale of investment securities, other operating income, share of (losses)/profits of associates and jointly controlled entities, less impairment on investment securities) were £2,005m (2007 £1,010m profit), reflecting sharp falls in estimated valuations of property and other investments.
Corporate HBOS plc
Preliminary Results 2008 21
Corporate investment portfolio Profits on the sale of investment securities decreased to £88m (2007 £463m), reflecting fewer significant exits under current market conditions. Losses from associates and jointly controlled entities were £950m (2007 £232m profit) due to the rapid deterioration in trading performance across the housebuilding and property sectors and falls in the value of investment properties. Impairment on investment securities increased significantly to £737m (2007 £37m), predominantly relating to property sector exposures in the Joint Ventures business and private equity funds in the ISAF business. As at 31 December 2008, the book value of the investment portfolio was £3.9bn (end 2007 £4.2bn). The write-offs detailed above have been partially offset by additions to the portfolio of £1.5bn, including drawdowns of prior commitments on fund investments. Unrealised losses in the investment portfolio, taken through equity in the Available For Sale Reserve ('AFS') were £0.2bn. At 31 December 2008, the AFS reserve had been fully written down (2007 £0.2bn).
Other operating income decreased to a loss of £406m (2007 £352m profit). The decline in 2008 primarily reflects credit provisions in respect of interest rate hedges, which increased in value in the last quarter resulting from the reduction in interest rates.
Operating Expenses Underlying operating expenses decreased to £939m (2007 £1,000m) reflecting lower levels of performance based remuneration and lower headcount.
Credit Quality and Provisions The Corporate book experienced a significant deterioration in credit quality during 2008 with a consequent increase in provisions. The level of impairment experienced, especially in the last quarter, was principally a reflection of the acceleration in the deterioration in the economy and as a result of applying a provisioning methodology more consistent with that used by Lloyds TSB. The shape of the Corporate book, and in particular its exposure to housebuilders, risk capital (loan stock, preference shares and ordinary shares) and large single credit exposures, exacerbated the impact.
The increase in provisions, particularly the final quarter, reflected:
• Severe trading difficulties across an increasing number of lending sectors, driven in part by the sharp decline in consumer confidence.
• Increased uncertainty around the depth of the downturn and timing and speed of the recovery, which led to a downward revision of future cashflows for impaired connections.
• A significant reduction in viable work out options as the UK moved into recession.
Housebuilders – Lending and investment in the housebuilding sector at the end of December 2008 totalled £4.0bn (excluding impairment provisions) (end 2007 £4.0bn), of which £3.5bn was by way of senior debt, £0.2bn in mezzanine and £0.3bn in loan stock. Equity exposure of £0.1bn at the end of 2007 has now been fully written down.
During 2008 the housebuilding sector experienced a sharp downturn in volumes, which accelerated throughout the year. Consequently many companies are now either in breach of, or close to breaching, covenants and are entering into restructuring discussions with their financiers. There are a number of cases in the sector where the asset cover has fallen short of the debt and as a result £1,054m has been provided for in 2008.
Collective Provision – Given the economic environment and the significant deterioration in credit quality and reflecting a provisioning methodology more consistent with that used by Lloyds TSB, the Collective Provision has been strengthened in the year by £1,366m resulting in a provision at the end of the year of £1,500m (2007 £134m).
Corporate HBOS plc
Preliminary Results 2008 22
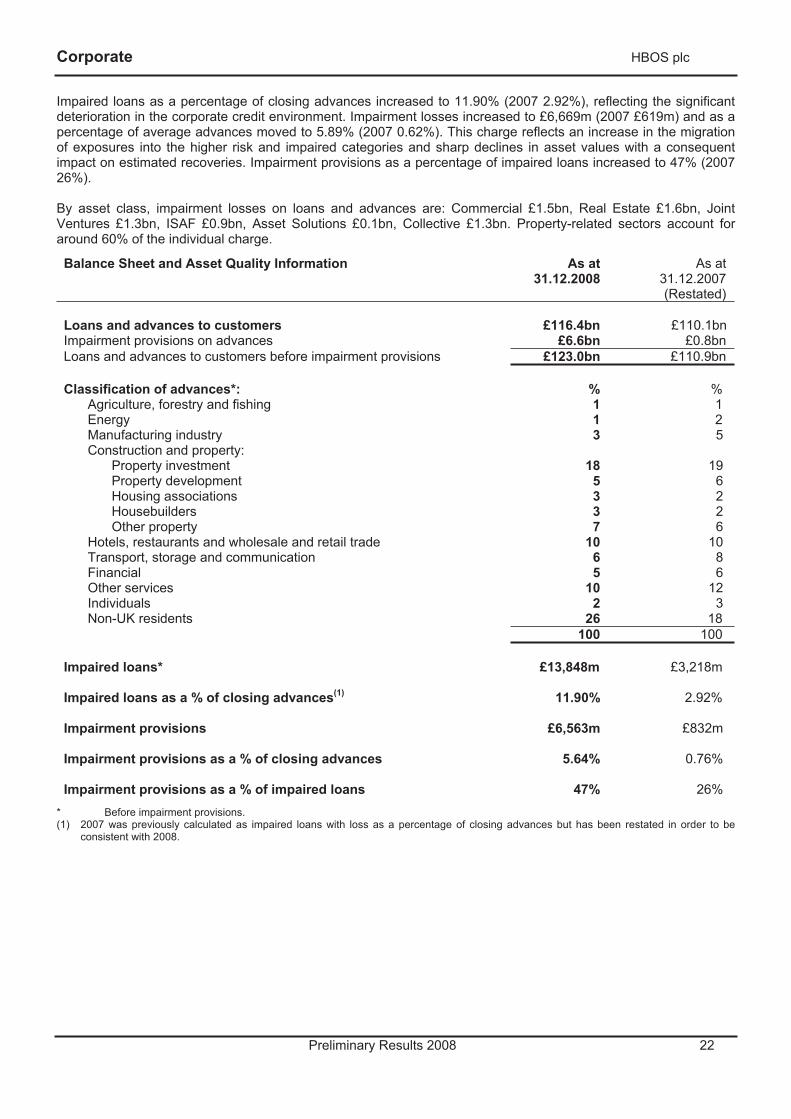
Impaired loans as a percentage of closing advances increased to 11.90% (2007 2.92%), reflecting the significant deterioration in the corporate credit environment. Impairment losses increased to £6,669m (2007 £619m) and as a percentage of average advances moved to 5.89% (2007 0.62%). This charge reflects an increase in the migration of exposures into the higher risk and impaired categories and sharp declines in asset values with a consequent impact on estimated recoveries. Impairment provisions as a percentage of impaired loans increased to 47% (2007 26%).
By asset class, impairment losses on loans and advances are: Commercial £1.5bn, Real Estate £1.6bn, Joint Ventures £1.3bn, ISAF £0.9bn, Asset Solutions £0.1bn, Collective £1.3bn. Property-related sectors account for around 60% of the individual charge.
Balance Sheet and Asset Quality Information As at 31.12.2008
As at 31.12.2007 (Restated)
Loans and advances to customers £116.4bn £110.1bn Impairment provisions on advances £6.6bn £0.8bn Loans and advances to customers before impairment provisions £123.0bn £110.9bn
Classification of advances*: % %Agriculture, forestry and fishing 1 1Energy 1 2Manufacturing industry 3 5Construction and property:
Property investment 18 19Property development 5 6Housing associations 3 2Housebuilders 3 2Other property 7 6
Hotels, restaurants and wholesale and retail trade 10 10Transport, storage and communication 6 8Financial 5 6Other services 10 12Individuals 2 3Non-UK residents 26 18
100 100
Impaired loans* £13,848m £3,218m
Impaired loans as a % of closing advances(1) 11.90% 2.92%
Impairment provisions £6,563m £832m
Impairment provisions as a % of closing advances 5.64% 0.76%
Impairment provisions as a % of impaired loans 47% 26% * Before impairment provisions. (1) 2007 was previously calculated as impaired loans with loss as a percentage of closing advances but has been restated in order to be
consistent with 2008.
Corporate HBOS plc
Preliminary Results 2008 23
Operational Performance
Lending increased to £116.4bn (2007 £110.1bn). This growth was primarily at the start of the year due to a pipeline of business at the end of 2007 and the inactive syndications market. Foreign exchange movements account for 6% of the growth in the year.
Customer deposits have decreased to £38.5bn (end 2007 £48.4bn). The reduction in deposits experienced in the second half of 2008 was due mainly to the dislocation in financial markets, customers spreading their deposits across several institutions and the draw down by corporates for working capital as cashflows came under strain. Great focus has been placed upon maintaining strong customer relationships through the market turmoil and providing competitively priced deposit products.
The business is organised according to the following asset classes:
Real Estate Real Estate accounted for 29% (end 2007 29%) of advances to customers and operates mainly in the property investment, property development and housebuilding sectors throughout the UK. As UK property values have fallen, increases in advances have been restricted to a small number of customers drawing down existing commitments. When loans have come up for renewal facilities have been restructured, where necessary, to reflect the difficult trading conditions that prevail in the market and the continued deterioration of property values.
Commercial Commercial accounted for 21% (end 2007 25%) of advances to customers. In mid-2008 the Business Banking distribution channel, which was previously in Retail, was merged into Commercial. This generated a number of synergies and brought control of all SME distribution channels into the Corporate division
In 2008 existing lending customers and new primarily deposit led, full banking relationships were focused on. Key initiatives, such as the Entrepreneur Challenge, also continued.
Asset Solutions Assets Solutions accounted for 5% (end 2007 6%) of advances to customers. The Asset Solutions businesses operate mainly in the high volume/low value sectors utilising a number of routes to market and a variety of specific products. During 2008 the vehicle finance businesses have been materially impacted by residual value and impairment losses on assets, as a consequence of depressed market conditions.
Specialised Industry Finance ('SIF') SIF accounted for 19% (end 2007 15%) of advances to customers and consists of five discrete asset classes: Housing Finance, Infrastructure Finance, Energy, Telecoms & Media and Transport. These businesses performed well throughout 2008 in a difficult market environment, including a successfully established closed-end fund, Bank of Scotland Infrastructure Partners, L.P. Inc, whose initial investments reflect an equity portfolio of high-quality, predominantly operational, PFI/PPP assets and which attracted external fund investment.
Joint Ventures Joint Ventures accounted for 14% (end 2007 13%) of advances to customers. Some 60% of this portfolio relates to transactions with UK based associate and joint venture companies and 40% to Europe. The underlying industry sectors are predominantly property based and include housebuilders and hotels. 2008 has been an extremely challenging year across all sectors in the UK, with housebuilding particularly suffering in the light of large volume falls in sales and the negative impact on land values. Commercial property has also been adversely impacted by the rapid deterioration in credit markets and the underlying economy, significantly reducing values as evidenced by the relevant Investment Property Databank (IPD) indices. In the fourth quarter of 2008, signs of deterioration in trading performance were evidenced in the hotel book, particularly in the corporate and conference markets. The European property book has seen less stress than the UK although it was evident that transactional activity declined in the second half of 2008 and that values were falling.
Corporate HBOS plc
Preliminary Results 2008 24
Integrated, Structured & Acquisition Finance ('ISAF') ISAF, which is made up of the Fund Investments, Integrated and Leveraged Finance businesses, accounted for 12% (end 2007 12%) of advances to customers. In 2008 the business was materially impacted by the reduced deal volumes and falling asset values experienced across the private equity sector in the UK and continental Europe. The business is structured as follows:
• Fund Investments Valuations have been under considerable pressure during the second half of 2008 due to deteriorating economic conditions. Whilst the portfolio is highly diversified by General Partners (60+), sector, geography and number of underlying investee companies (700+) a view of year end valuations was taken to reflect issues in the wider economy and impairment recognised in 2008.
• Integrated Finance Given the economic climate, the team has focused on working closely with the portfolio companies across the wide range of sectors invested in. Provisioning has been at higher levels than in previous years but this has been partly offset by investment gains and dividends from a number of strongly performing companies.
• Leveraged Finance The drawn LBO portfolio debt totalled £6.7bn (end 2007 £6.0bn) with undrawn facilities totalling £1.3bn (end 2007 £1.3bn). The portfolio is well spread by industry, with the largest sector concentration being in healthcare which accounts for 15% of drawn balances. 70% of the portfolio arises from transactions based in the UK, with 30% based in continental Europe. Credit quality has, however, declined over the year, reflecting the difficult economic conditions faced by customers. Impairment provisions totalled £370m (end 2007 £34m), 5.52% (end 2007 0.57%) as a percentage of drawn debt.
Insurance & Investment HBOS plc
Preliminary Results 2008 25
Insurance & Investment
Underlying profit before tax in Insurance & Investment increased to £739m (2007 £644m). General Insurance profit increased to £365m (2007 £232m), in part reflecting more benign weather conditions this year, following the flood events in 2007. Investment profit decreased to £374m (2007 £412m), reflecting the current challenging trading conditions which offset the benefits of actual versus expected experience in respect of in-force business.
On the Full Embedded Value ('EV') basis, underlying profit before tax in Insurance & Investment was £765m (2007 £884m), £26m (2007 £240m) higher than reported under IFRS. Full EV balance sheet embedded value, net of tax for the UK Investment Business was £6,360m (end 2007 £6,794m) and was £2,170m (end 2007 £2,724m) higher than reported under IFRS.
In 2008, the division contributed, through dividend payments, £1,135m to the Group capital position (2007 £312m). Of this, £595m arose from the Investment business demonstrating the continued focus on improving capital efficiency. The majority of this dividend was paid in December after full consideration of exceptional market conditions and future downside scenarios. The capital strength of the life businesses remains strong.
General Insurance ('GI') sales increased to £1,799m GWP (2007 £1,761m). Investment sales decreased to £13,659m PVNBP (2007 £14,775m). Against challenging market conditions, net fund flows remained positive at £1.9bn (2007 £1.7bn).
Underlying non-interest income increased to £1,731m (2007 £1,591m) and underlying operating expenses increased to £895m (2007 £849m) including the significant marketing spend to support growth in the Motor business – excluding this spend, expenses were in line with 2007, reflecting the focus on delivering cost efficiency.
Financial Performance
Income Statement Year
ended31.12.2008
£m
Year ended
31.12.2007 £m
Net interest expense (97) (98) Underlying non-interest income 1,731 1,591 Underlying net operating income 1,634 1,493 Underlying operating expenses (895) (849) Underlying profit before tax 739 644
Profit before Tax analysis
Investment New business – insurance contracts 254 269 New business – investment contracts (236) (221) Existing business, including development and financing costs 213 249 Expected return on shareholders' assets 143 115
374 412
General Insurance 365 232
Underlying profit before tax (IFRS basis) 739 644
Additional contribution from new business 429 457 Lower contribution from existing business (333) (217) Cost of capital * (70) Increase in underlying profit before tax 26 240
Underlying profit before tax (Full EV basis) 765 884
* Effective 1 July 2008, certain embedded value assumptions were changed to bring them more into line with a market consistent approach to embedded value reporting. The effect of the change in the assumptions on the IFRS EV results is set out on page 28. The effect on the Full EV is set out on page 93 and in 2008 includes an explicit charge for the cost of capital.
Insurance & Investment HBOS plc
Preliminary Results 2008 26
General Insurance Business
Financial Performance
General Insurance profit increased to £365m (2007 £232m). Household insurance performed strongly, driven by increased sales, improved customer retention and claims management, primarily due to lower weather related claims, compared to 2007's claims of £135m. This offset the increased marketing spend within the Motor business, used to drive a significant increase (41%) in sales momentum.
Underlying non-interest income increased to £537m (2007 £358m). Underlying operating expenses increased to £193m (2007 £149m), which included the significant spend in marketing resource in the Motor business to capitalise on growth opportunities available. Excluding this marketing spend, underlying operating expenses were broadly flat.
Income Statement Year
ended 31.12.2008
£m
Year ended
31.12.2007 £m
Net interest income 21 23 Underlying non-interest income 537 358 Underlying net operating income 558 381 Underlying operating expenses (193) (149) Underlying profit before tax 365 232
Operational Performance
General Insurance sales increased to £1,799m GWP (2007 £1,761m). Strong performances in both Motor (up 41%) and Household (up 6%) offset the lower sales in Repayment Insurance (down 15%).
Gross Written Premiums (GWP)
Yearended
31.12.2008 £m
Yearended
31.12.2007 £m
Household 584 549Repayment:
1st party 412 5013rd party 307 345
Motor 472 335Other 24 31Total 1,799 1,761
Insurance & Investment HBOS plc
Preliminary Results 2008 27
Household Insurance The household business was the main driver of overall profit growth, as the business leveraged the Group's distribution strength and market leading mortgage position. Focus on providing innovative products that generated customer advocacy was maintained, both on sale and throughout the life of the policy. Promotions such as the 'Thank You Bonus', where customers receive a £50 reward every year they remain claim free and the policy is renewed, were highly successful. In October, a range of flexible home insurance products were launched, tailored to specific customer needs, further improving the customer offering.
The market remained highly competitive, particularly in direct channels; however, modest growth in average premiums was achieved. Overall, household sales grew by 6% during the year increasing total policies in force by 262,000 (up 9%). Of particular note was the sales performance in direct channels, with internet in particular up 41%. Intermediary channels were up 20%, whilst retail branch sales continued to benefit from the strong UK Retail customer base.
The household insurance loss ratio fell to 38% (2007 47% - both figures excluding the impact of the 2007 floods) driven by favourable claims experience and the efficient claims management approach.
Repayment Insurance Sales of Repayment Insurance decreased to £719m GWP (2007 £846m), with sales to Group customers reducing to £412m (2007 £501m). Sales volumes were impacted by lower lending volumes, reflecting reduced risk appetite at this stage in the economic cycle, together with negative media commentary associated with the uncertainty surrounding the Competition Commission ('CC') investigation.
The Commission published its final report on Payment Protection Insurance on 29 January 2009 setting out its remedies. The remedies included a prohibition on the sale of PPI within seven days of the distributor’s sale of credit, although the customer may initiate this after 24 hours, and a prohibition on a single premium product, together with wide information and reporting requirements. The Commission expects that the measures will come into force during 2010 (information remedies in April 2010 and other measures by October 2010). The adoption of statutory orders implementing the remedies could have a significant adverse impact on the level of sales and thus the revenue generation and profitability of the payment protection insurance products which the Group offers its customers. The ultimate impact will be determined by a number of factors including the extent to which it is able to mitigate the potentially adverse effects of such statutory changes through restructuring the payment protection products it offers its customers and developing alternative products or revenue streams. The Group is actively reviewing customer propositions to ensure that a valuable protection product to customers continues to be offered, and from February 2009, has commenced offering to personal loan customers a more flexible regular premium protection product.
Motor Insurance Sales of Motor Insurance through the esure joint venture have increased to £472m GWP (2007 £335m), supported by the additional spend which has funded incremental marketing and new business acquisition activity. This exceptional performance reflects the strength of the brands, in particular esure and Sheilas' Wheels, whose web-based offerings are supported by state of the art technology, and robust risk pricing and claims management.Although the market remained highly price competitive, modest premium increases were achieved, whilst increasing policies in force by 420,000 to 1.5 million.
Insurance & Investment HBOS plc
Preliminary Results 2008 28
Investment Business
Financial Performance
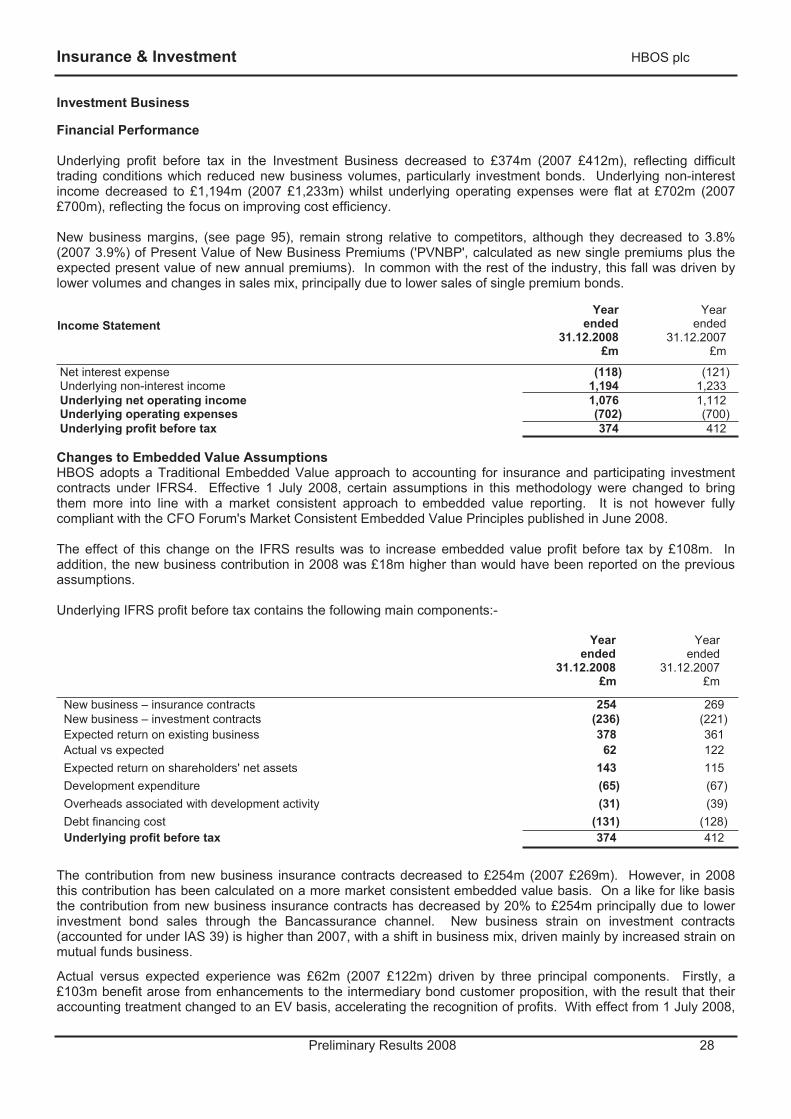
Underlying profit before tax in the Investment Business decreased to £374m (2007 £412m), reflecting difficult trading conditions which reduced new business volumes, particularly investment bonds. Underlying non-interest income decreased to £1,194m (2007 £1,233m) whilst underlying operating expenses were flat at £702m (2007 £700m), reflecting the focus on improving cost efficiency.
New business margins, (see page 95), remain strong relative to competitors, although they decreased to 3.8% (2007 3.9%) of Present Value of New Business Premiums ('PVNBP', calculated as new single premiums plus the expected present value of new annual premiums). In common with the rest of the industry, this fall was driven by lower volumes and changes in sales mix, principally due to lower sales of single premium bonds.
Income Statement Year
ended 31.12.2008
£m
Year ended
31.12.2007 £m
Net interest expense (118) (121) Underlying non-interest income 1,194 1,233 Underlying net operating income 1,076 1,112 Underlying operating expenses (702) (700) Underlying profit before tax 374 412
Changes to Embedded Value Assumptions HBOS adopts a Traditional Embedded Value approach to accounting for insurance and participating investment contracts under IFRS4. Effective 1 July 2008, certain assumptions in this methodology were changed to bring them more into line with a market consistent approach to embedded value reporting. It is not however fully compliant with the CFO Forum's Market Consistent Embedded Value Principles published in June 2008.
The effect of this change on the IFRS results was to increase embedded value profit before tax by £108m. In addition, the new business contribution in 2008 was £18m higher than would have been reported on the previous assumptions.
Underlying IFRS profit before tax contains the following main components:-
Yearended
31.12.2008 £m
Yearended
31.12.2007 £m
New business – insurance contracts 254 269New business – investment contracts (236) (221)Expected return on existing business 378 361Actual vs expected 62 122Expected return on shareholders' net assets 143 115Development expenditure (65) (67)Overheads associated with development activity (31) (39)Debt financing cost (131) (128)Underlying profit before tax 374 412
The contribution from new business insurance contracts decreased to £254m (2007 £269m). However, in 2008 this contribution has been calculated on a more market consistent embedded value basis. On a like for like basis the contribution from new business insurance contracts has decreased by 20% to £254m principally due to lower investment bond sales through the Bancassurance channel. New business strain on investment contracts (accounted for under IAS 39) is higher than 2007, with a shift in business mix, driven mainly by increased strain on mutual funds business.
Actual versus expected experience was £62m (2007 £122m) driven by three principal components. Firstly, a £103m benefit arose from enhancements to the intermediary bond customer proposition, with the result that their accounting treatment changed to an EV basis, accelerating the recognition of profits. With effect from 1 July 2008,
Insurance & Investment HBOS plc
Preliminary Results 2008 29
in line with evolving industry practice, a move to a more market consistent version of embedded value was made, giving a net benefit of £108m. Thirdly, adverse persistency experience (current year and assumption changes), particularly on Bancassurance investment bonds, driven by market uncertainty and adverse publicity, impacted performance by £225m. Additionally a number of individually smaller refinements to the calculation of VIF, actuarial liabilities and other items led to a £76m net benefit.
Life Insurance Regulatory Capital At 31 December 2008 the total provisional available capital for all long term insurance business including the with-profit fund on a realistic basis was 263% (2007 399%) of the provisional Long Term Insurance Capital Requirement and resilience capital requirements of £1,256m (2007 £1,116m), reflecting the capital repatriation of £595m and the adverse market conditions experienced in the year.
Full EV Basis Supplementary Information To assist in the understanding of the underlying performance and value generation of the Investment Business, supplementary information is set out on pages 92-96, providing Income Statement and Balance Sheet information for the UK Investment Business on a consistent EV accounting basis for both insurance and investment contracts. This basis is referred to as the 'Full EV' basis.
Operational Performance
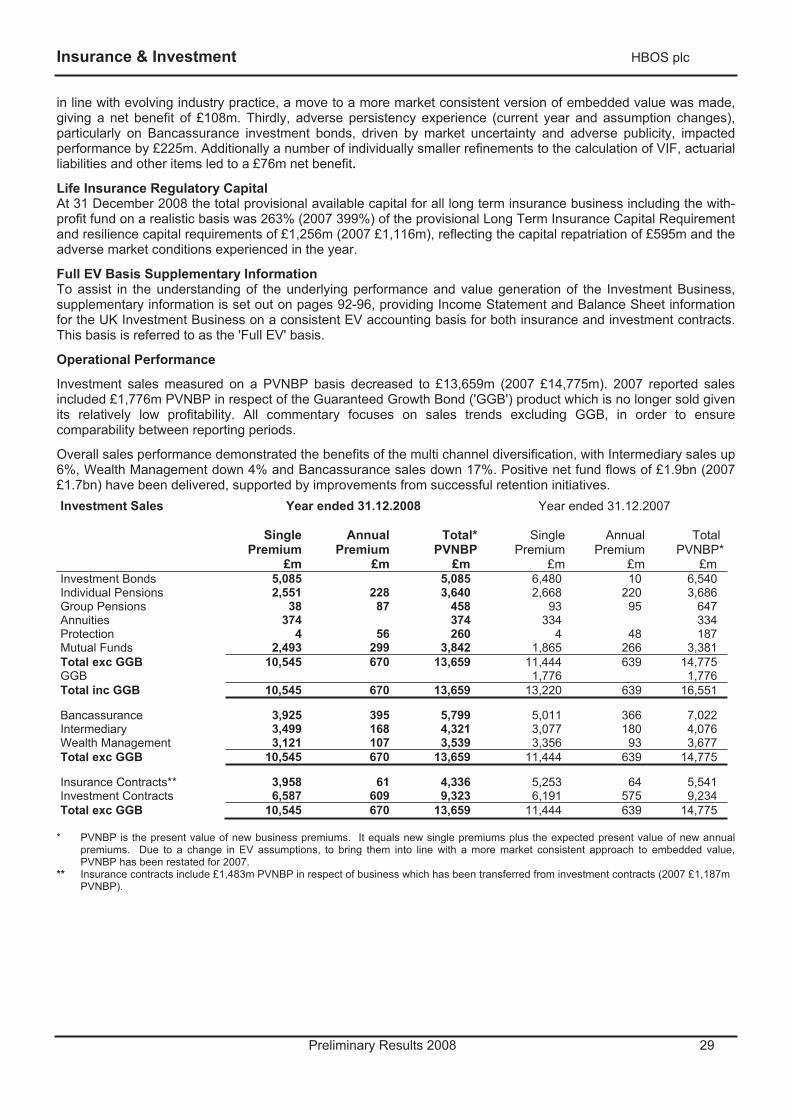
Investment sales measured on a PVNBP basis decreased to £13,659m (2007 £14,775m). 2007 reported sales included £1,776m PVNBP in respect of the Guaranteed Growth Bond ('GGB') product which is no longer sold given its relatively low profitability. All commentary focuses on sales trends excluding GGB, in order to ensure comparability between reporting periods.
Overall sales performance demonstrated the benefits of the multi channel diversification, with Intermediary sales up 6%, Wealth Management down 4% and Bancassurance sales down 17%. Positive net fund flows of £1.9bn (2007 £1.7bn) have been delivered, supported by improvements from successful retention initiatives. Investment Sales Year ended 31.12.2008 Year ended 31.12.2007
Single Premium
£m
AnnualPremium
£m
Total*PVNBP
£m
SinglePremium
£m
AnnualPremium
£m
TotalPVNBP*
£mInvestment Bonds 5,085 5,085 6,480 10 6,540 Individual Pensions 2,551 228 3,640 2,668 220 3,686 Group Pensions 38 87 458 93 95 647 Annuities 374 374 334 334 Protection 4 56 260 4 48 187 Mutual Funds 2,493 299 3,842 1,865 266 3,381 Total exc GGB 10,545 670 13,659 11,444 639 14,775 GGB 1,776 1,776 Total inc GGB 10,545 670 13,659 13,220 639 16,551
Bancassurance 3,925 395 5,799 5,011 366 7,022 Intermediary 3,499 168 4,321 3,077 180 4,076 Wealth Management 3,121 107 3,539 3,356 93 3,677 Total exc GGB 10,545 670 13,659 11,444 639 14,775
Insurance Contracts** 3,958 61 4,336 5,253 64 5,541 Investment Contracts 6,587 609 9,323 6,191 575 9,234 Total exc GGB 10,545 670 13,659 11,444 639 14,775
* PVNBP is the present value of new business premiums. It equals new single premiums plus the expected present value of new annualpremiums. Due to a change in EV assumptions, to bring them into line with a more market consistent approach to embedded value,PVNBP has been restated for 2007.
** Insurance contracts include £1,483m PVNBP in respect of business which has been transferred from investment contracts (2007 £1,187mPVNBP).
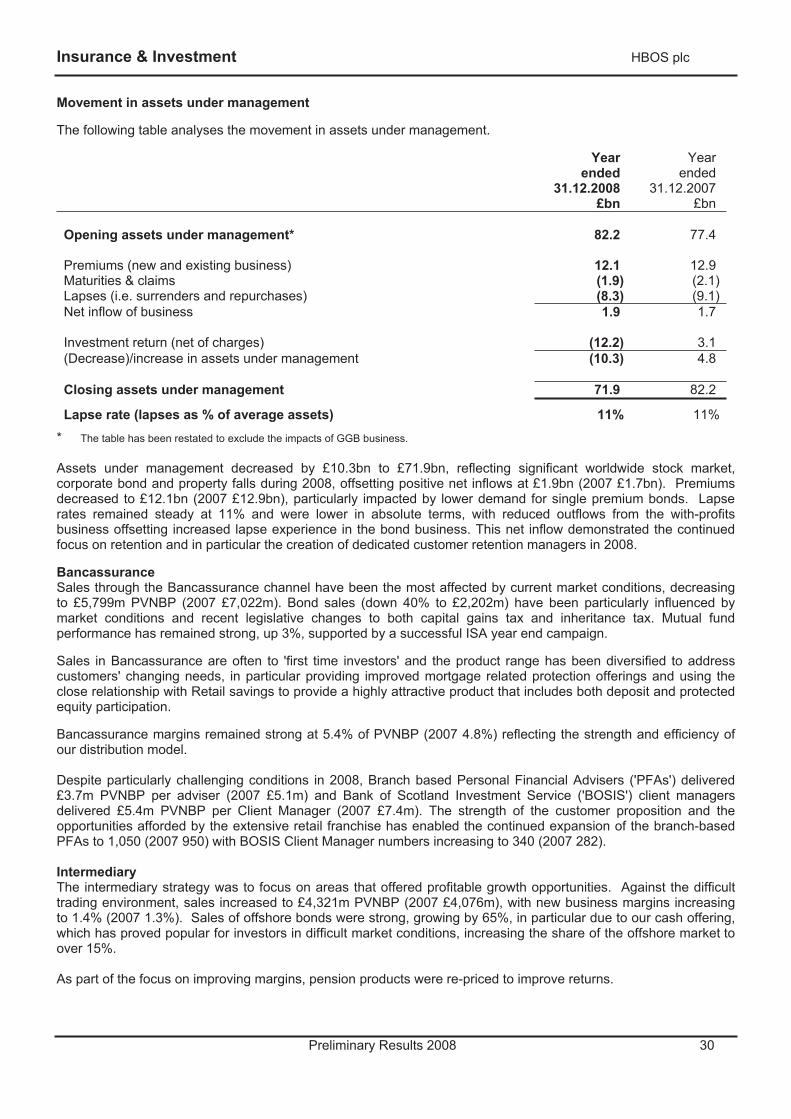
Insurance & Investment HBOS plc
Preliminary Results 2008 30
Movement in assets under management
The following table analyses the movement in assets under management.
Yearended
31.12.2008 £bn
Yearended
31.12.2007 £bn
Opening assets under management* 82.2 77.4
Premiums (new and existing business) 12.1 12.9Maturities & claims (1.9) (2.1)Lapses (i.e. surrenders and repurchases) (8.3) (9.1)Net inflow of business 1.9 1.7
Investment return (net of charges) (12.2) 3.1(Decrease)/increase in assets under management (10.3) 4.8
Closing assets under management 71.9 82.2
Lapse rate (lapses as % of average assets) 11% 11%
* The table has been restated to exclude the impacts of GGB business.
Assets under management decreased by £10.3bn to £71.9bn, reflecting significant worldwide stock market, corporate bond and property falls during 2008, offsetting positive net inflows at £1.9bn (2007 £1.7bn). Premiums decreased to £12.1bn (2007 £12.9bn), particularly impacted by lower demand for single premium bonds. Lapse rates remained steady at 11% and were lower in absolute terms, with reduced outflows from the with-profits business offsetting increased lapse experience in the bond business. This net inflow demonstrated the continued focus on retention and in particular the creation of dedicated customer retention managers in 2008.
Bancassurance Sales through the Bancassurance channel have been the most affected by current market conditions, decreasing to £5,799m PVNBP (2007 £7,022m). Bond sales (down 40% to £2,202m) have been particularly influenced by market conditions and recent legislative changes to both capital gains tax and inheritance tax. Mutual fund performance has remained strong, up 3%, supported by a successful ISA year end campaign.
Sales in Bancassurance are often to 'first time investors' and the product range has been diversified to address customers' changing needs, in particular providing improved mortgage related protection offerings and using the close relationship with Retail savings to provide a highly attractive product that includes both deposit and protected equity participation.
Bancassurance margins remained strong at 5.4% of PVNBP (2007 4.8%) reflecting the strength and efficiency of our distribution model.
Despite particularly challenging conditions in 2008, Branch based Personal Financial Advisers ('PFAs') delivered £3.7m PVNBP per adviser (2007 £5.1m) and Bank of Scotland Investment Service ('BOSIS') client managers delivered £5.4m PVNBP per Client Manager (2007 £7.4m). The strength of the customer proposition and the opportunities afforded by the extensive retail franchise has enabled the continued expansion of the branch-based PFAs to 1,050 (2007 950) with BOSIS Client Manager numbers increasing to 340 (2007 282).
Intermediary The intermediary strategy was to focus on areas that offered profitable growth opportunities. Against the difficult trading environment, sales increased to £4,321m PVNBP (2007 £4,076m), with new business margins increasing to 1.4% (2007 1.3%). Sales of offshore bonds were strong, growing by 65%, in particular due to our cash offering, which has proved popular for investors in difficult market conditions, increasing the share of the offshore market to over 15%.
As part of the focus on improving margins, pension products were re-priced to improve returns.
Insurance & Investment HBOS plc
Preliminary Results 2008 31
Wealth Management Sales at St. James's Place ('SJP') decreased to £3,539m PVNBP (2007 £3,677m) following two years of extremely strong growth. The business model remained robust with an increase in Partner numbers to 1,340 (2007 1,251). The strength of the business model leads to strong investor advocacy for its investment management approach and advisers, and despite current conditions, retention performance has therefore remained very good. Assets under management decreased to £16.3bn (2007 £18.2bn) reflecting market falls although SJP continued to generate positive net inflows of business. Despite business mix impacts, SJP's new business margin on manufactured business was 3.8% of PVNBP (2007 4.4%).
The performance by SJP was further recognised by winning the Daily Telegraph's 'Wealth Manager of the Year' award, for the second consecutive year.
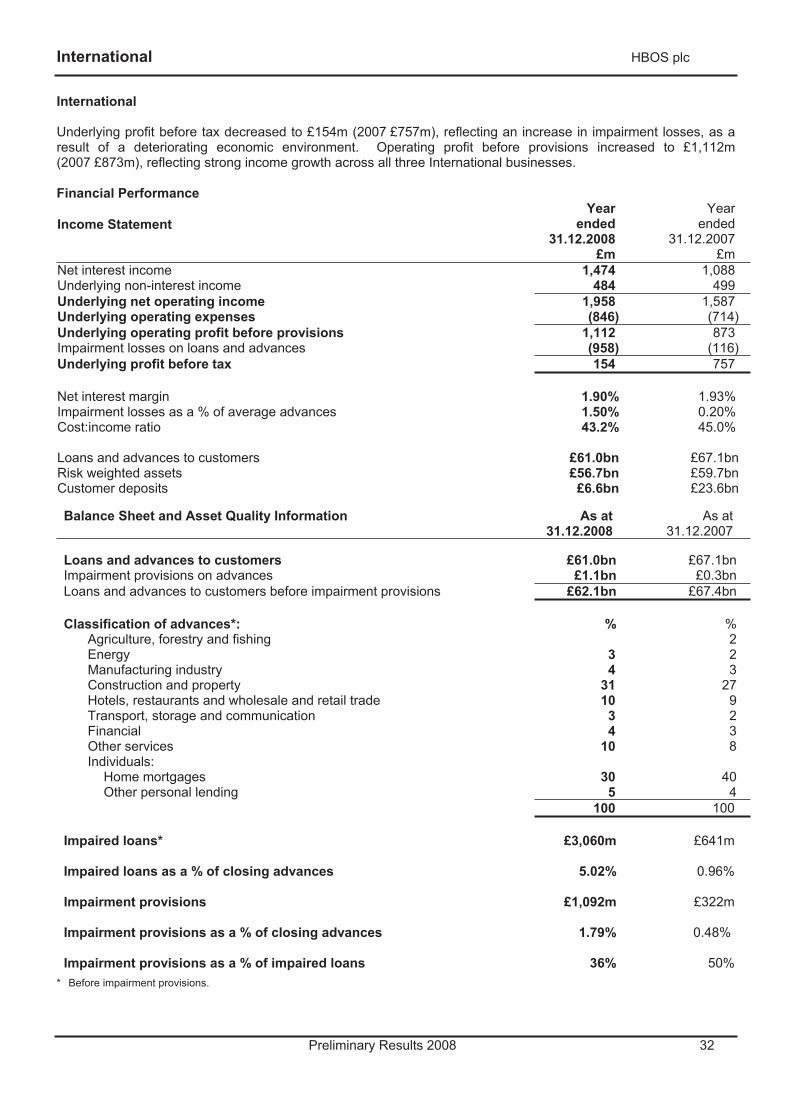
International HBOS plc
Preliminary Results 2008 32
International
Underlying profit before tax decreased to £154m (2007 £757m), reflecting an increase in impairment losses, as a result of a deteriorating economic environment. Operating profit before provisions increased to £1,112m (2007 £873m), reflecting strong income growth across all three International businesses.
Financial Performance
Income Statement Year
ended31.12.2008
£m
Year ended
31.12.2007 £m
Net interest income 1,474 1,088Underlying non-interest income 484 499Underlying net operating income 1,958 1,587Underlying operating expenses (846) (714) Underlying operating profit before provisions 1,112 873Impairment losses on loans and advances (958) (116) Underlying profit before tax 154 757
Net interest margin 1.90% 1.93%Impairment losses as a % of average advances 1.50% 0.20%Cost:income ratio 43.2% 45.0%
Loans and advances to customers £61.0bn £67.1bn Risk weighted assets £56.7bn £59.7bn Customer deposits £6.6bn £23.6bn
Balance Sheet and Asset Quality Information As at 31.12.2008
As at 31.12.2007
Loans and advances to customers £61.0bn £67.1bn Impairment provisions on advances £1.1bn £0.3bnLoans and advances to customers before impairment provisions £62.1bn £67.4bn
Classification of advances*: % %
Agriculture, forestry and fishing 2Energy 3 2Manufacturing industry 4 3Construction and property 31 27Hotels, restaurants and wholesale and retail trade 10 9Transport, storage and communication 3 2Financial 4 3Other services 10 8Individuals:
Home mortgages 30 40Other personal lending 5 4
100 100
Impaired loans* £3,060m £641m
Impaired loans as a % of closing advances 5.02% 0.96%
Impairment provisions £1,092m £322m
Impairment provisions as a % of closing advances 1.79% 0.48%
Impairment provisions as a % of impaired loans 36% 50%* Before impairment provisions.
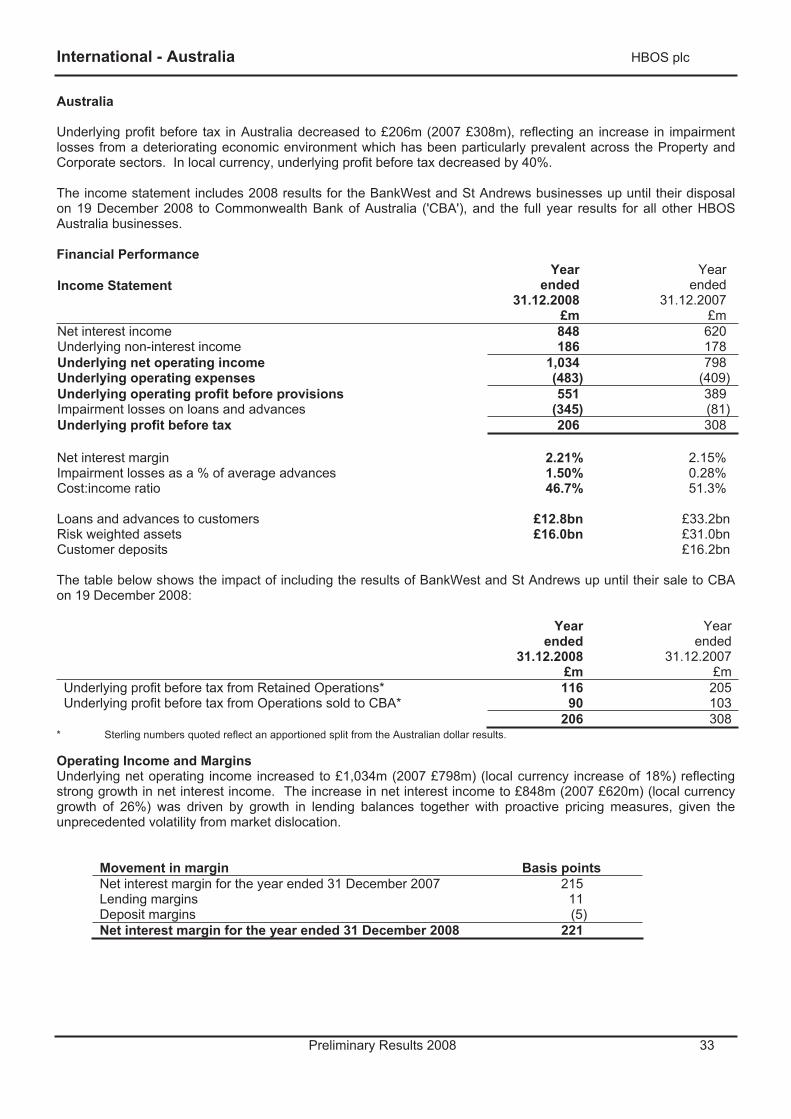
International - Australia HBOS plc
Preliminary Results 2008 33
Australia
Underlying profit before tax in Australia decreased to £206m (2007 £308m), reflecting an increase in impairment losses from a deteriorating economic environment which has been particularly prevalent across the Property and Corporate sectors. In local currency, underlying profit before tax decreased by 40%.
The income statement includes 2008 results for the BankWest and St Andrews businesses up until their disposal on 19 December 2008 to Commonwealth Bank of Australia ('CBA'), and the full year results for all other HBOS Australia businesses.
Financial Performance
Income Statement Year
ended31.12.2008
£m
Yearended
31.12.2007 £m
Net interest income 848 620Underlying non-interest income 186 178Underlying net operating income 1,034 798Underlying operating expenses (483) (409) Underlying operating profit before provisions 551 389Impairment losses on loans and advances (345) (81) Underlying profit before tax 206 308
Net interest margin 2.21% 2.15%Impairment losses as a % of average advances 1.50% 0.28%Cost:income ratio 46.7% 51.3%
Loans and advances to customers £12.8bn £33.2bn Risk weighted assets £16.0bn £31.0bn Customer deposits £16.2bn
The table below shows the impact of including the results of BankWest and St Andrews up until their sale to CBA on 19 December 2008:
Yearended
31.12.2008 £m
Year ended
31.12.2007 £m
Underlying profit before tax from Retained Operations* 116 205Underlying profit before tax from Operations sold to CBA* 90 103
206 308* Sterling numbers quoted reflect an apportioned split from the Australian dollar results.
Operating Income and Margins Underlying net operating income increased to £1,034m (2007 £798m) (local currency increase of 18%) reflecting strong growth in net interest income. The increase in net interest income to £848m (2007 £620m) (local currency growth of 26%) was driven by growth in lending balances together with proactive pricing measures, given the unprecedented volatility from market dislocation.
Movement in margin Basis points Net interest margin for the year ended 31 December 2007 215 Lending margins 11 Deposit margins (5) Net interest margin for the year ended 31 December 2008 221
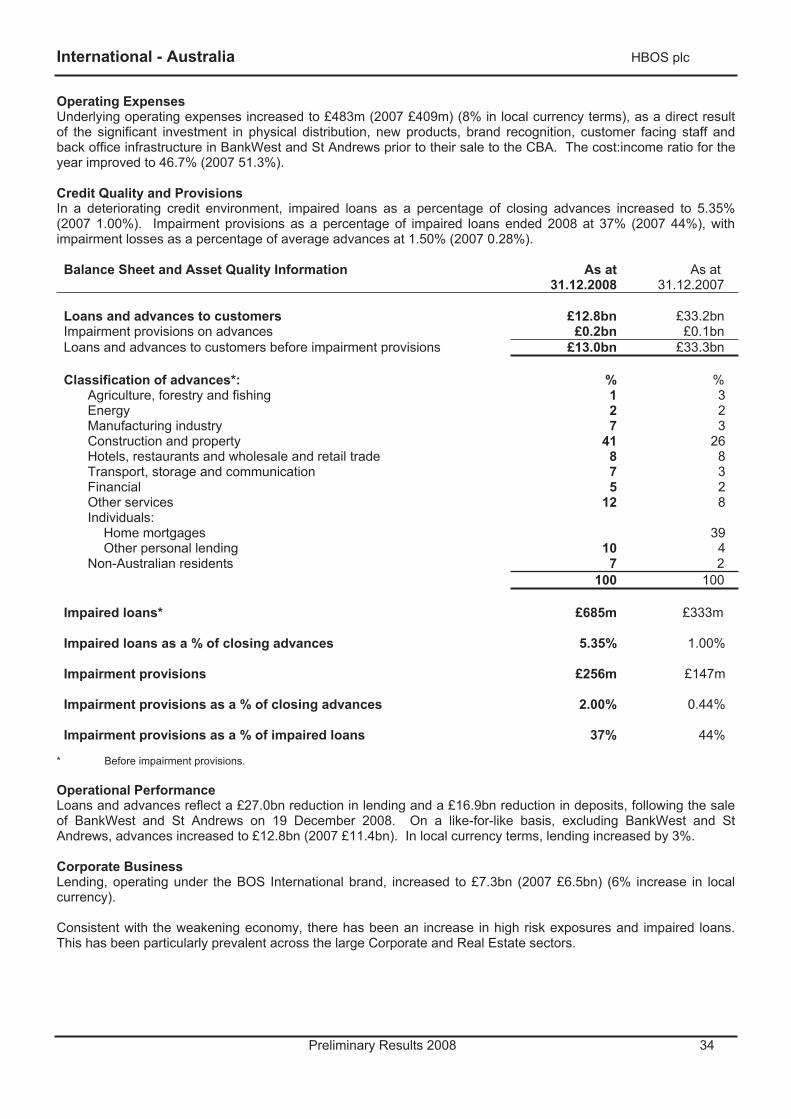
International - Australia HBOS plc
Preliminary Results 2008 34
Operating Expenses Underlying operating expenses increased to £483m (2007 £409m) (8% in local currency terms), as a direct result of the significant investment in physical distribution, new products, brand recognition, customer facing staff and back office infrastructure in BankWest and St Andrews prior to their sale to the CBA. The cost:income ratio for the year improved to 46.7% (2007 51.3%).
Credit Quality and Provisions In a deteriorating credit environment, impaired loans as a percentage of closing advances increased to 5.35% (2007 1.00%). Impairment provisions as a percentage of impaired loans ended 2008 at 37% (2007 44%), with impairment losses as a percentage of average advances at 1.50% (2007 0.28%).
Balance Sheet and Asset Quality Information As at 31.12.2008
As at 31.12.2007
Loans and advances to customers £12.8bn £33.2bn Impairment provisions on advances £0.2bn £0.1bnLoans and advances to customers before impairment provisions £13.0bn £33.3bn
Classification of advances*: % %
Agriculture, forestry and fishing 1 3Energy 2 2Manufacturing industry 7 3Construction and property 41 26Hotels, restaurants and wholesale and retail trade 8 8Transport, storage and communication 7 3Financial 5 2Other services 12 8Individuals:
Home mortgages 39Other personal lending 10 4
Non-Australian residents 7 2100 100
Impaired loans* £685m £333m
Impaired loans as a % of closing advances 5.35% 1.00%
Impairment provisions £256m £147m
Impairment provisions as a % of closing advances 2.00% 0.44%
Impairment provisions as a % of impaired loans 37% 44%
* Before impairment provisions.
Operational Performance Loans and advances reflect a £27.0bn reduction in lending and a £16.9bn reduction in deposits, following the sale of BankWest and St Andrews on 19 December 2008. On a like-for-like basis, excluding BankWest and St Andrews, advances increased to £12.8bn (2007 £11.4bn). In local currency terms, lending increased by 3%.
Corporate Business Lending, operating under the BOS International brand, increased to £7.3bn (2007 £6.5bn) (6% increase in local currency).
Consistent with the weakening economy, there has been an increase in high risk exposures and impaired loans. This has been particularly prevalent across the large Corporate and Real Estate sectors.
International - Australia HBOS plc
Preliminary Results 2008 35
Asset Finance Business Lending, operating under the Capital Finance brand, increased to £5.5bn (2007 £4.9bn) (5% increase in local currency). The business has tightened credit criteria across all sectors but has seen an increase in impaired loans, particularly within the Property Construction portfolio.
Businesses sold to CBA The following business units of HBOS Australia were sold to CBA on 19 December 2008.
Retail Business Strong performance in the Retail business, operating under the BankWest brand, reflected growth in credit cards, mortgages and deposits. Lending increased, at the point of disposal, to £13.5bn (2007 £11.0bn) (17% increase in local currency), with deposits at £7.5bn (2007 £6.2bn) (15% increase in local currency).
Commercial Business Lending, which operated under the BankWest brand, increased to £13.5bn (2007 £10.8bn) (19% increase in local currency). Deposits decreased to £9.4bn (2007 £10.0bn) (10% decrease in local currency). Our strategy focused on an improved service provision, value for money products, fast and simple processes, and the support of highly trained specialist bankers with industry-specific expertise. Investment was made in systems and technology to drive down back office costs and improve customer cycle times. This helped drive growth, brand awareness and customer satisfaction. The roll out of business banking centres was completed in 2008, with 43 centres opened on the East Coast as part of the national expansion plan.
Insurance & Investment BusinessSales of life insurance products prior to the acquisition by CBA continued to experience good growth levels through group and non-group distribution channels. Monthly sales of regular premium policies (net of cancellations) have increased by 181% in the year to 19 December, which translated to an increase in gross written premium of 67% for the period compared to the comparative period last year, driven in particular by the term life product initiatives and a new partnership with Blue Inc which is part of the Hollard Insurance group.
Insurance sales through the new East Coast BankWest stores contributed 10% of new premium written through BankWest.
International - Ireland HBOS plc
Preliminary Results 2008 36
Ireland
Underlying loss before tax in Ireland was £262m (2007 £184m profit). In local currency, underlying loss before tax was €250m and reflects a substantial increase in impairment losses from a low base along with higher funding costs. The extremely challenging economic and market conditions have led to a significant deterioration in credit quality and, as a consequence, higher impairment losses have been recognised. The Sterling performance has been adversely impacted by the timing of significant impairment losses at the end of the year, which were converted at a much stronger Euro exchange rate.
Financial Performance
Income Statement Yearended
31.12.2008 £m
Year ended
31.12.2007 £m
Net interest income 419 330 Underlying non-interest income (28) 31 Underlying net operating income 391 361 Underlying operating expenses (162) (155) Underlying operating profit before provisions 229 206 Impairment losses on loans and advances (491) (22) Underlying (loss)/profit before tax (262) 184
Net interest margin 1.65% 1.81% Impairment losses as a % of average advances 1.87% 0.12% Cost:income ratio 41.4% 42.9%
Loans and advances to customers £30.7bn £21.9bn Risk weighted assets £26.3bn £18.5bn Customer deposits £6.3bn £7.1bn
Operating Income and Margins Net interest income increased to £419m (2007 £330m) (local currency growth of 9%). The increase reflects growth in advances, moderated by a decline in margin due to higher funding costs, slower churn in the back book impacting the timing of fee recognition and a changing asset mix as the Retail business is grown. Whilst price increases have been introduced on new lending activity these have not yet fully materialised in the margin.
Movement in margin Basis points Net interest margin for the year ended 31 December 2007 181 Increased funding costs (16) Fee recognition (3) Asset mix – growth of Retail & Intermediary (4) Margin increase on new business 3 Capital earnings 4 Net interest margin for the year ended 31 December 2008 165
Underlying non-interest income has decreased by £59m, reflecting an increase in impairment losses on investment securities, a reduction in venture capital disposals and lower contingent fees.
Operating Expenses Operating expenses have increased to £162m (2007 £155m) but have declined 9% in local currency terms as a result of substantial action to reduce costs in light of the difficult trading environment partially offset by the full year effect of the expanded Retail network. The cost:income ratio decreased to 41.4% (2007 42.9%).
International - Ireland HBOS plc
Preliminary Results 2008 37
Credit Quality and Provisions Impairment losses as a percentage of average advances increased to 1.87% (2007 0.12%) and impaired loans as a percentage of closing advances increased to 5.78% (2007 1.08%).
The extent and pace of economic deterioration in the Irish market has been unprecedented in recent months and has resulted in rising arrears and falling asset values. As a consequence impairment losses have increased primarily within Property Development where Residential Property Development (9.7% of the portfolio) was the principal area in which increased impairment losses were recognised. In contrast Property Investment, which accounts for 21% of the portfolio, has seen only a modest increase in impairment losses. The balance of the portfolio which included exposures to SMEs and residential mortgages has also some deterioration.
Irish residential property prices have continued to fall and arrears levels have increased from historic lows. 28% of our portfolio was comprised of residential mortgages and the indexed debt to value ratio of the mortgage book at 31 December 2008 was 55% (2007 47%).
Risk management systems have been strengthened and resources have been reassigned to actively manage the position.
Balance Sheet and Asset Quality Information As at 31.12.2008
As at 31.12.2007
Loans and advances to customers £30.7bn £21.9bn Impairment provisions on advances £0.7bn £0.1bn Loans and advances to customers before impairment provisions £31.4bn £22.0bn
Classification of advances*: % %
Agriculture, forestry and fishing 1 Energy 1 1 Manufacturing industry 3 3 Construction and property 29 28 Hotels, restaurants and wholesale and retail trade 13 12 Transport, storage and communication 2 2 Financial 2 2 Other services 6 6 Individuals:
Home mortgages 28 28 Other personal lending 6 6
Non-Irish residents 10 11 100 100
Impaired loans* £1,775m £237m
Impaired loans as a % of closing advances 5.78% 1.08%
Impairment provisions £682m £141m
Impairment provisions as a % of closing advances 2.22% 0.64%
Impairment provisions as a % of impaired loans 38% 59%
* Before impairment provisions.
Operational Performance Lending increased to £30.7bn in sterling terms (end 2007 £21.9bn). Lending increased by 8% in local currency.
The financial markets dislocation has had a significant impact on the margin through higher funding costs of 16bps, including the Euribor spread over base rate. Price increases have been introduced on new lending to seek to recover these higher funding costs but the back book will not re-price until existing loans repay.
Deposits decreased to £6.3bn (end 2007 £7.1bn). In local currency, deposits decreased by €3.1bn reflecting significant outflows caused by uncertainty prior to the announcement of the Lloyds TSB acquisition of HBOS and the Irish government guarantee scheme ('the Scheme'). However deposit capability has been significantly enhanced during the last quarter of the year and the deposit base increased following the announcement of the decision not to join the Scheme.
International – Europe & North America HBOS plc
Preliminary Results 2008 38
Europe & North America ('ENA')
Underlying profit before tax decreased to £210m (2007 £265m), reflecting a deliberate slowdown in new lending activity and an increase in impairment losses, both of which are symptomatic of current economic conditions in a year of economic turbulence across all the operating geographies. ENA's underlying operating profit before provisions increased to £332m (2007 £278m). In local currency terms, underlying profit before tax decreased by 22%.
Financial Performance
Income Statement Year
ended31.12.2008
£m
Year ended
31.12.2007£m
Net interest income 207 138Underlying non-interest income 326 290Underlying net operating income 533 428Underlying operating expenses (201) (150)Underlying operating profit before provisions 332 278Impairment losses on loans and advances (122) (13)Underlying profit before tax 210 265
Net interest margin 1.49% 1.47%Impairment losses as a % of average advances 0.83% 0.13%Cost:income ratio 37.7% 35.0%
Loans and advances to customers £17.5bn £12.0bnRisk weighted assets £14.4bn £10.2bnCustomer deposits £0.3bn £0.3bn
Operating Income and Margins Net interest income increased to £207m in 2008 (2007 £138m) (in local currency increased by 35%), reflecting the strengthening Euro and US Dollar, as well as stronger underlying margins across all ENA banking businesses, as a move to realign the risk reward dynamics in light of underlying economic conditions and scarce liquidity in the market was made. Income levels benefited from selective high margin new business activity combined with increased utilisation of existing facilities which saw the loan book (in local currency terms) grow by 10% from end 2007, and only 5% from the end of the first half of 2008.
Movement in margin Basis points Net interest margin for the year ended 31 December 2007 147 Increased funding costs (9) Business Mix and Repricing initiatives 15 Foreign exchange impact (4) Net interest margin for the year ended 31 December 2008 149
ENA margins have increased to 1.49% (2007 1.47%), but mask significantly higher margin trends on new and variable rate business across all the banking businesses, with the strong Euro resulting in an increasingly high weighting of retail assets throughout 2008. New business continues to be priced upwards to reflect the volatile environment.
Underlying non-interest income increased to £326m (2007 £290m), driven by strong fee and commission income and equity realisations in the US, together with a change to embedded value assumptions in EFS, which have offset the impact of reduced fee income from lower new business levels in BHH and BoS NL.
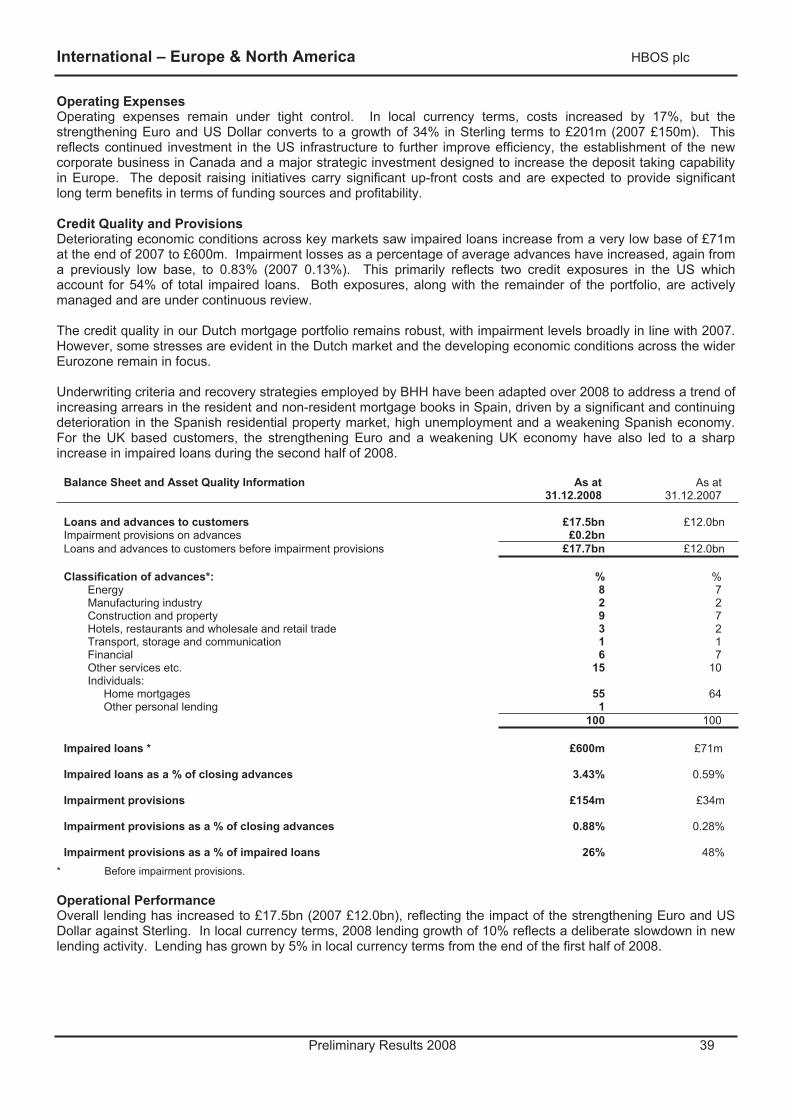
International – Europe & North America HBOS plc
Preliminary Results 2008 39
Operating Expenses Operating expenses remain under tight control. In local currency terms, costs increased by 17%, but the strengthening Euro and US Dollar converts to a growth of 34% in Sterling terms to £201m (2007 £150m). This reflects continued investment in the US infrastructure to further improve efficiency, the establishment of the new corporate business in Canada and a major strategic investment designed to increase the deposit taking capability in Europe. The deposit raising initiatives carry significant up-front costs and are expected to provide significant long term benefits in terms of funding sources and profitability.
Credit Quality and Provisions Deteriorating economic conditions across key markets saw impaired loans increase from a very low base of £71m at the end of 2007 to £600m. Impairment losses as a percentage of average advances have increased, again from a previously low base, to 0.83% (2007 0.13%). This primarily reflects two credit exposures in the US which account for 54% of total impaired loans. Both exposures, along with the remainder of the portfolio, are actively managed and are under continuous review.
The credit quality in our Dutch mortgage portfolio remains robust, with impairment levels broadly in line with 2007. However, some stresses are evident in the Dutch market and the developing economic conditions across the wider Eurozone remain in focus.
Underwriting criteria and recovery strategies employed by BHH have been adapted over 2008 to address a trend of increasing arrears in the resident and non-resident mortgage books in Spain, driven by a significant and continuing deterioration in the Spanish residential property market, high unemployment and a weakening Spanish economy. For the UK based customers, the strengthening Euro and a weakening UK economy have also led to a sharp increase in impaired loans during the second half of 2008.
Balance Sheet and Asset Quality Information As at31.12.2008
As at 31.12.2007
Loans and advances to customers £17.5bn £12.0bnImpairment provisions on advances £0.2bnLoans and advances to customers before impairment provisions £17.7bn £12.0bn
Classification of advances*: % %
Energy 8 7Manufacturing industry 2 2Construction and property 9 7Hotels, restaurants and wholesale and retail trade 3 2Transport, storage and communication 1 1Financial 6 7Other services etc. 15 10Individuals:
Home mortgages 55 64Other personal lending 1
100 100
Impaired loans * £600m £71m
Impaired loans as a % of closing advances 3.43% 0.59%
Impairment provisions £154m £34m
Impairment provisions as a % of closing advances 0.88% 0.28%
Impairment provisions as a % of impaired loans 26% 48%* Before impairment provisions.
Operational Performance Overall lending has increased to £17.5bn (2007 £12.0bn), reflecting the impact of the strengthening Euro and US Dollar against Sterling. In local currency terms, 2008 lending growth of 10% reflects a deliberate slowdown in new lending activity. Lending has grown by 5% in local currency terms from the end of the first half of 2008.
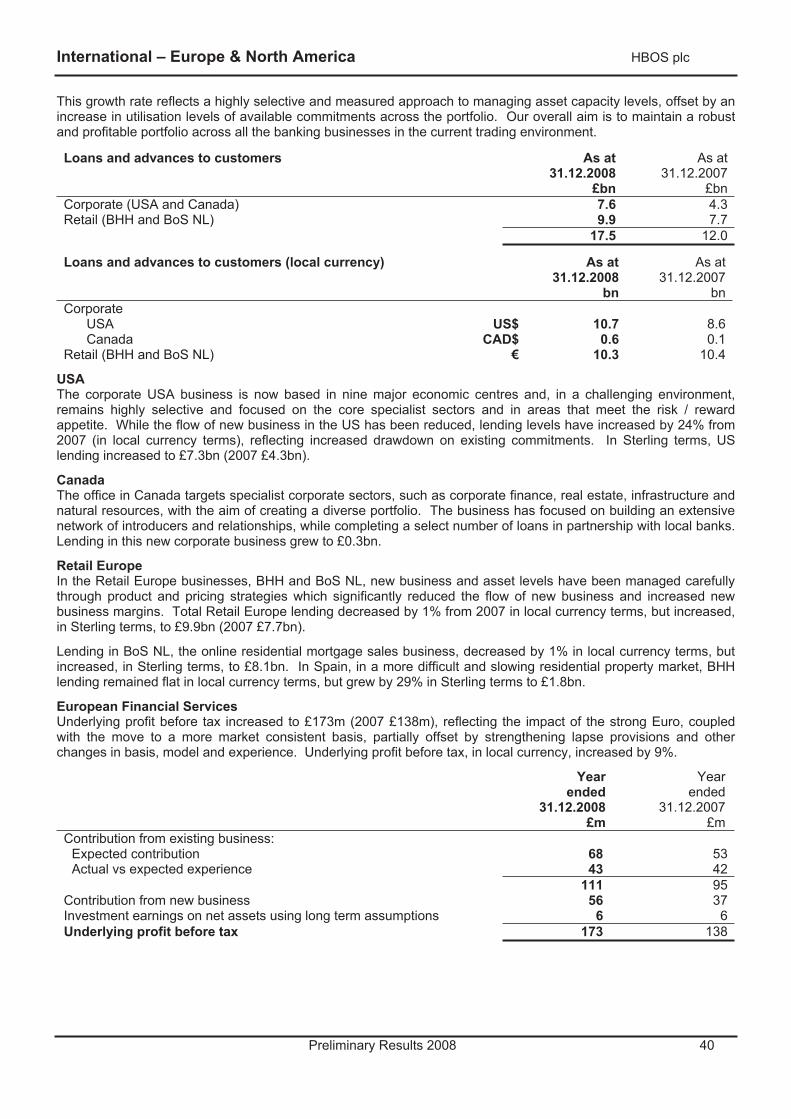
International – Europe & North America HBOS plc
Preliminary Results 2008 40
This growth rate reflects a highly selective and measured approach to managing asset capacity levels, offset by an increase in utilisation levels of available commitments across the portfolio. Our overall aim is to maintain a robust and profitable portfolio across all the banking businesses in the current trading environment.
Loans and advances to customers As at 31.12.2008
£bn
As at 31.12.2007
£bnCorporate (USA and Canada) 7.6 4.3Retail (BHH and BoS NL) 9.9 7.7
17.5 12.0
Loans and advances to customers (local currency) As at 31.12.2008
bn
As at 31.12.2007
bnCorporate
USA US$ 10.7 8.6Canada CAD$ 0.6 0.1
Retail (BHH and BoS NL) € 10.3 10.4
USAThe corporate USA business is now based in nine major economic centres and, in a challenging environment, remains highly selective and focused on the core specialist sectors and in areas that meet the risk / reward appetite. While the flow of new business in the US has been reduced, lending levels have increased by 24% from 2007 (in local currency terms), reflecting increased drawdown on existing commitments. In Sterling terms, US lending increased to £7.3bn (2007 £4.3bn).
Canada The office in Canada targets specialist corporate sectors, such as corporate finance, real estate, infrastructure and natural resources, with the aim of creating a diverse portfolio. The business has focused on building an extensive network of introducers and relationships, while completing a select number of loans in partnership with local banks. Lending in this new corporate business grew to £0.3bn.
Retail Europe In the Retail Europe businesses, BHH and BoS NL, new business and asset levels have been managed carefully through product and pricing strategies which significantly reduced the flow of new business and increased new business margins. Total Retail Europe lending decreased by 1% from 2007 in local currency terms, but increased, in Sterling terms, to £9.9bn (2007 £7.7bn).
Lending in BoS NL, the online residential mortgage sales business, decreased by 1% in local currency terms, but increased, in Sterling terms, to £8.1bn. In Spain, in a more difficult and slowing residential property market, BHH lending remained flat in local currency terms, but grew by 29% in Sterling terms to £1.8bn.
European Financial Services Underlying profit before tax increased to £173m (2007 £138m), reflecting the impact of the strong Euro, coupled with the move to a more market consistent basis, partially offset by strengthening lapse provisions and other changes in basis, model and experience. Underlying profit before tax, in local currency, increased by 9%.
Yearended
31.12.2008 £m
Year ended
31.12.2007 £m
Contribution from existing business: Expected contribution 68 53Actual vs expected experience 43 42
111 95Contribution from new business 56 37Investment earnings on net assets using long term assumptions 6 6Underlying profit before tax 173 138
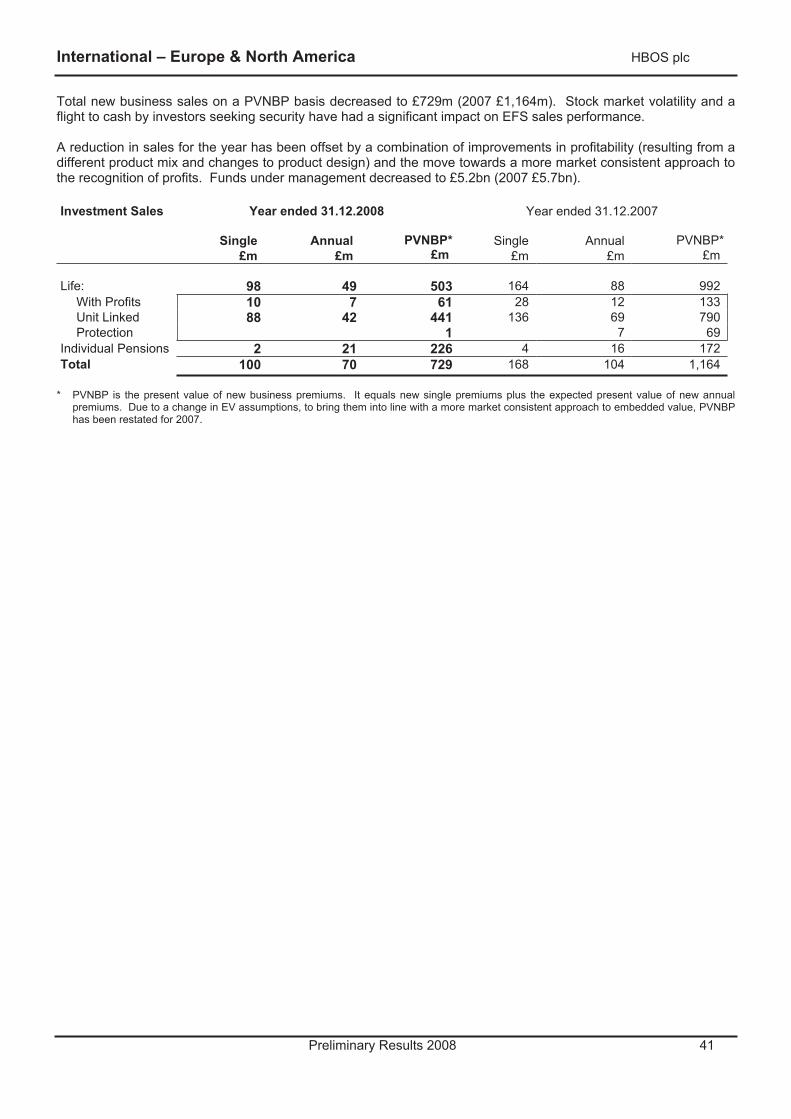
International – Europe & North America HBOS plc
Preliminary Results 2008 41
Total new business sales on a PVNBP basis decreased to £729m (2007 £1,164m). Stock market volatility and a flight to cash by investors seeking security have had a significant impact on EFS sales performance.
A reduction in sales for the year has been offset by a combination of improvements in profitability (resulting from a different product mix and changes to product design) and the move towards a more market consistent approach to the recognition of profits. Funds under management decreased to £5.2bn (2007 £5.7bn).
Investment Sales Year ended 31.12.2008 Year ended 31.12.2007
Single£m
Annual£m
PVNBP*£m
Single£m
Annual£m
PVNBP*£m
Life: 98 49 503 164 88 992 With Profits 10 7 61 28 12 133 Unit Linked 88 42 441 136 69 790 Protection 1 7 69
Individual Pensions 2 21 226 4 16 172 Total 100 70 729 168 104 1,164
* PVNBP is the present value of new business premiums. It equals new single premiums plus the expected present value of new annual premiums. Due to a change in EV assumptions, to bring them into line with a more market consistent approach to embedded value, PVNBP has been restated for 2007.
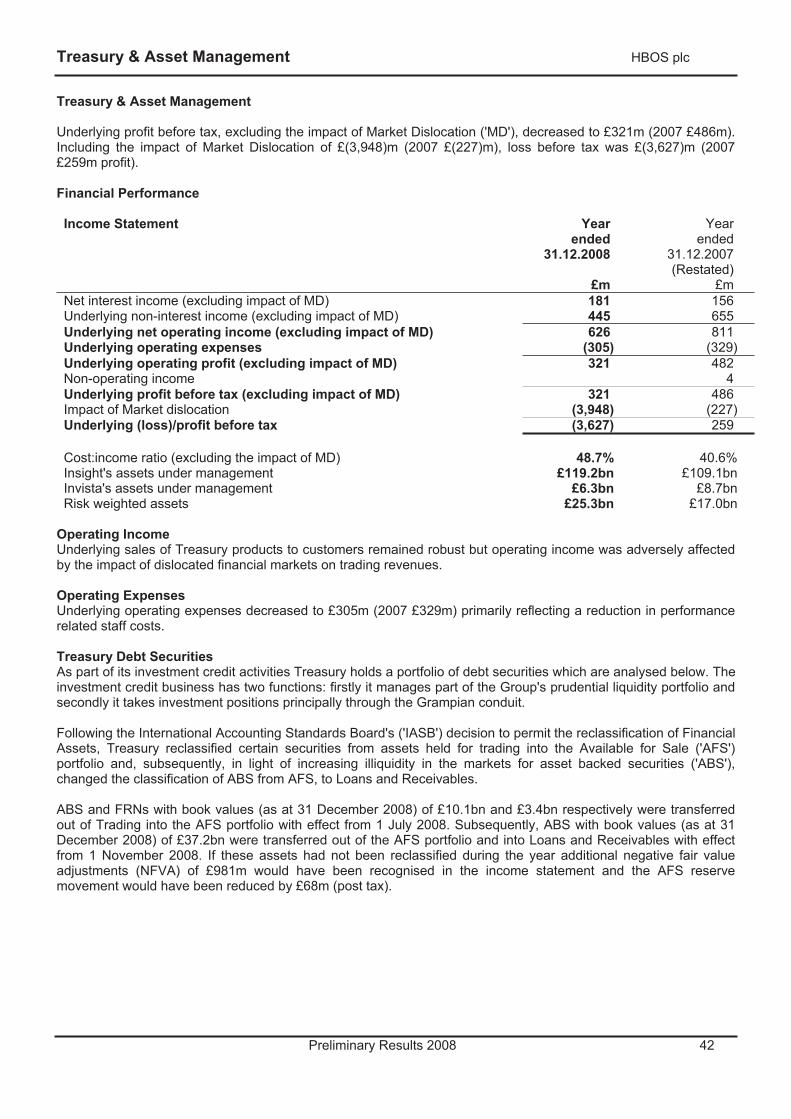
Treasury & Asset Management HBOS plc
Preliminary Results 2008 42
Treasury & Asset Management
Underlying profit before tax, excluding the impact of Market Dislocation ('MD'), decreased to £321m (2007 £486m). Including the impact of Market Dislocation of £(3,948)m (2007 £(227)m), loss before tax was £(3,627)m (2007 £259m profit).
Financial Performance
Income Statement Year ended
31.12.2008
£m
Year ended
31.12.2007 (Restated)
£mNet interest income (excluding impact of MD) 181 156 Underlying non-interest income (excluding impact of MD) 445 655 Underlying net operating income (excluding impact of MD) 626 811Underlying operating expenses (305) (329) Underlying operating profit (excluding impact of MD) 321 482 Non-operating income 4 Underlying profit before tax (excluding impact of MD) 321 486 Impact of Market dislocation (3,948) (227) Underlying (loss)/profit before tax (3,627) 259
Cost:income ratio (excluding the impact of MD) 48.7% 40.6% Insight's assets under management £119.2bn £109.1bn Invista's assets under management £6.3bn £8.7bn Risk weighted assets £25.3bn £17.0bn
Operating Income Underlying sales of Treasury products to customers remained robust but operating income was adversely affected by the impact of dislocated financial markets on trading revenues.
Operating Expenses Underlying operating expenses decreased to £305m (2007 £329m) primarily reflecting a reduction in performance related staff costs.
Treasury Debt Securities As part of its investment credit activities Treasury holds a portfolio of debt securities which are analysed below. The investment credit business has two functions: firstly it manages part of the Group's prudential liquidity portfolio and secondly it takes investment positions principally through the Grampian conduit.
Following the International Accounting Standards Board's ('IASB') decision to permit the reclassification of Financial Assets, Treasury reclassified certain securities from assets held for trading into the Available for Sale ('AFS') portfolio and, subsequently, in light of increasing illiquidity in the markets for asset backed securities ('ABS'), changed the classification of ABS from AFS, to Loans and Receivables.
ABS and FRNs with book values (as at 31 December 2008) of £10.1bn and £3.4bn respectively were transferred out of Trading into the AFS portfolio with effect from 1 July 2008. Subsequently, ABS with book values (as at 31 December 2008) of £37.2bn were transferred out of the AFS portfolio and into Loans and Receivables with effect from 1 November 2008. If these assets had not been reclassified during the year additional negative fair value adjustments (NFVA) of £981m would have been recognised in the income statement and the AFS reserve movement would have been reduced by £68m (post tax).
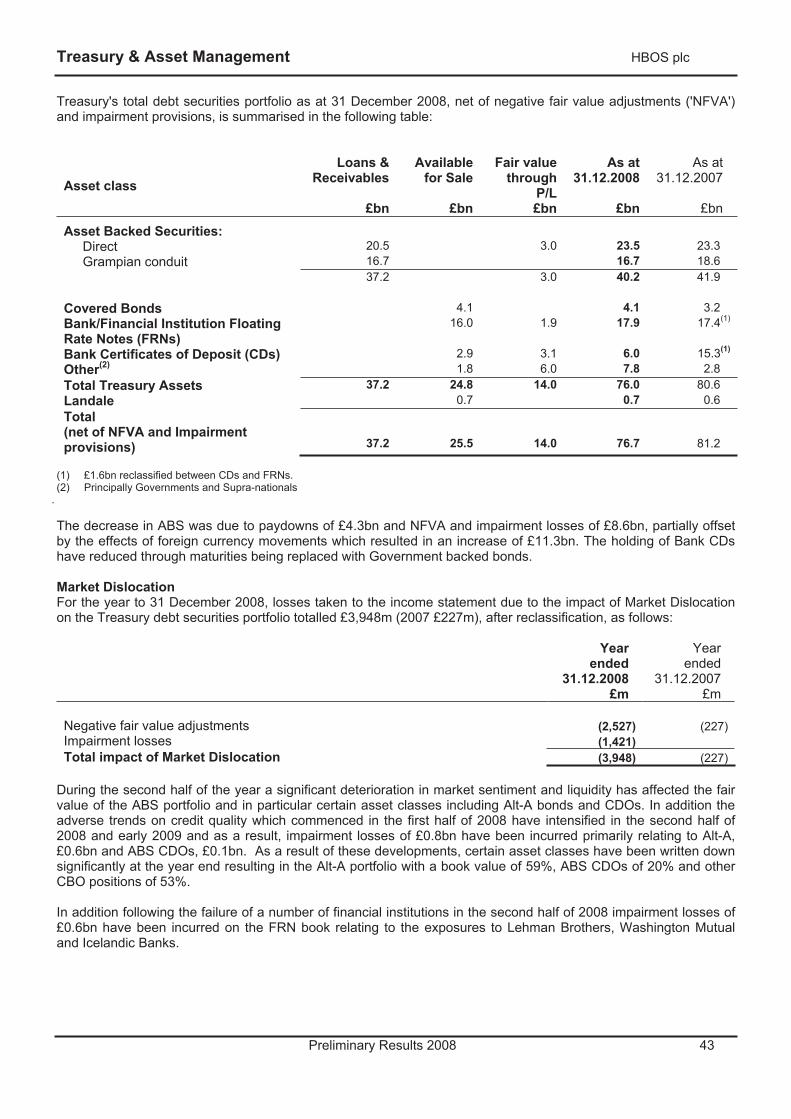
Treasury & Asset Management HBOS plc
Preliminary Results 2008 43
Treasury's total debt securities portfolio as at 31 December 2008, net of negative fair value adjustments ('NFVA') and impairment provisions, is summarised in the following table:
Asset class
Loans & Receivables
£bn
Available for Sale
£bn
Fair valuethrough
P/L£bn
As at 31.12.2008
£bn
As at 31.12.2007
£bn
Asset Backed Securities: Direct 20.5 3.0 23.5 23.3Grampian conduit 16.7 16.7 18.6
37.2 3.0 40.2 41.9
Covered Bonds 4.1 4.1 3.2Bank/Financial Institution Floating Rate Notes (FRNs)
16.0 1.9 17.9 17.4(1)
Bank Certificates of Deposit (CDs) 2.9 3.1 6.0 15.3(1)
Other(2) 1.8 6.0 7.8 2.8Total Treasury Assets 37.2 24.8 14.0 76.0 80.6Landale 0.7 0.7 0.6Total(net of NFVA and Impairment provisions) 37.2 25.5 14.0 76.7 81.2
(1) £1.6bn reclassified between CDs and FRNs. (2) Principally Governments and Supra-nationals
.
The decrease in ABS was due to paydowns of £4.3bn and NFVA and impairment losses of £8.6bn, partially offset by the effects of foreign currency movements which resulted in an increase of £11.3bn. The holding of Bank CDs have reduced through maturities being replaced with Government backed bonds.
Market Dislocation For the year to 31 December 2008, losses taken to the income statement due to the impact of Market Dislocation on the Treasury debt securities portfolio totalled £3,948m (2007 £227m), after reclassification, as follows:
Yearended
31.12.2008 £m
Yearended
31.12.2007 £m
Negative fair value adjustments (2,527) (227)Impairment losses (1,421) Total impact of Market Dislocation (3,948) (227)
During the second half of the year a significant deterioration in market sentiment and liquidity has affected the fair value of the ABS portfolio and in particular certain asset classes including Alt-A bonds and CDOs. In addition the adverse trends on credit quality which commenced in the first half of 2008 have intensified in the second half of 2008 and early 2009 and as a result, impairment losses of £0.8bn have been incurred primarily relating to Alt-A, £0.6bn and ABS CDOs, £0.1bn. As a result of these developments, certain asset classes have been written down significantly at the year end resulting in the Alt-A portfolio with a book value of 59%, ABS CDOs of 20% and other CBO positions of 53%.
In addition following the failure of a number of financial institutions in the second half of 2008 impairment losses of £0.6bn have been incurred on the FRN book relating to the exposures to Lehman Brothers, Washington Mutual and Icelandic Banks.
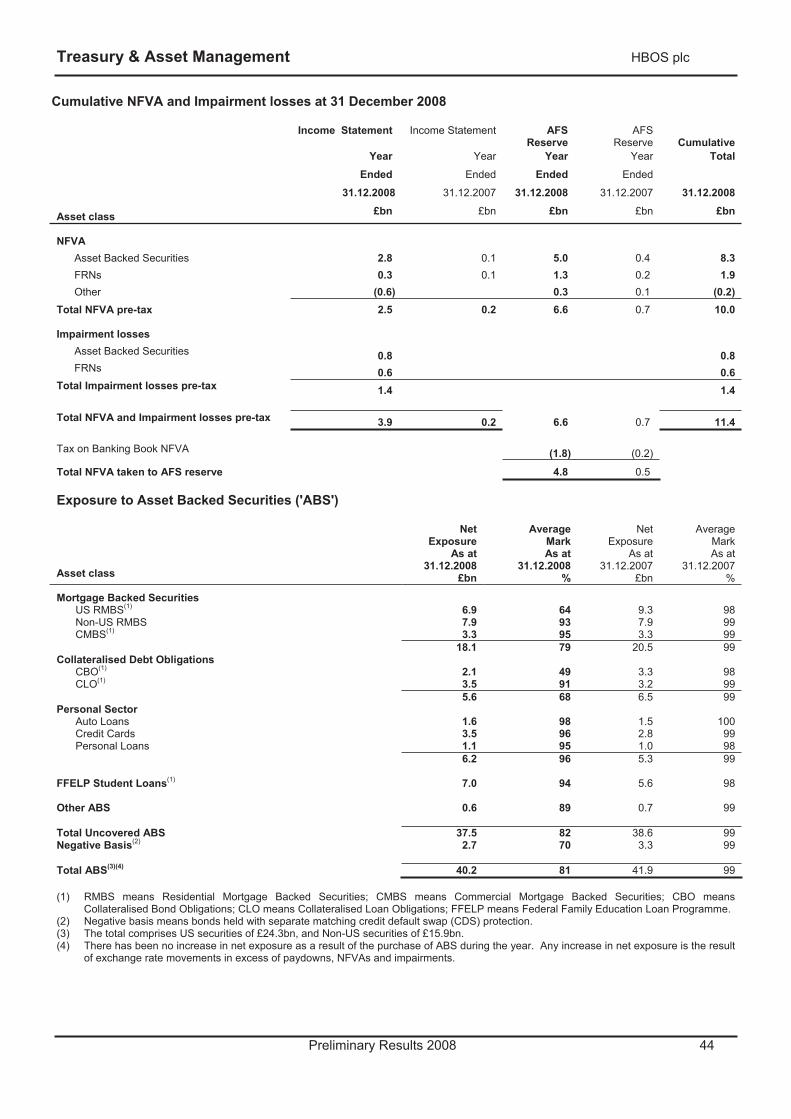
Treasury & Asset Management HBOS plc
Preliminary Results 2008 44
Cumulative NFVA and Impairment losses at 31 December 2008
Income Statement Income Statement AFS Reserve
AFSReserve Cumulative
Year Year Year Year TotalEnded Ended Ended Ended
31.12.2008 31.12.2007 31.12.2008 31.12.2007 31.12.2008
Asset class £bn £bn £bn £bn £bn
NFVA Asset Backed Securities 2.8 0.1 5.0 0.4 8.3FRNs 0.3 0.1 1.3 0.2 1.9Other (0.6) 0.3 0.1 (0.2)
Total NFVA pre-tax 2.5 0.2 6.6 0.7 10.0
Impairment losses Asset Backed Securities 0.8 0.8FRNs 0.6 0.6
Total Impairment losses pre-tax 1.4 1.4
Total NFVA and Impairment losses pre-tax 3.9 0.2 6.6 0.7 11.4
Tax on Banking Book NFVA (1.8) (0.2)
Total NFVA taken to AFS reserve 4.8 0.5
Exposure to Asset Backed Securities ('ABS')
Asset class
NetExposure
As at 31.12.2008
£bn
Average MarkAs at
31.12.2008%
NetExposure
As at 31.12.2007
£bn
AverageMarkAs at
31.12.2007%
Mortgage Backed Securities US RMBS(1) 6.9 64 9.3 98 Non-US RMBS 7.9 93 7.9 99 CMBS(1) 3.3 95 3.3 99
18.1 79 20.5 99 Collateralised Debt Obligations
CBO(1) 2.1 49 3.3 98 CLO(1) 3.5 91 3.2 99
5.6 68 6.5 99 Personal Sector
Auto Loans 1.6 98 1.5 100 Credit Cards 3.5 96 2.8 99 Personal Loans 1.1 95 1.0 98
6.2 96 5.3 99
FFELP Student Loans(1) 7.0 94 5.6 98
Other ABS 0.6 89 0.7 99
Total Uncovered ABS 37.5 82 38.6 99 Negative Basis(2) 2.7 70 3.3 99
Total ABS(3)(4) 40.2 81 41.9 99
(1) RMBS means Residential Mortgage Backed Securities; CMBS means Commercial Mortgage Backed Securities; CBO means Collateralised Bond Obligations; CLO means Collateralised Loan Obligations; FFELP means Federal Family Education Loan Programme.
(2) Negative basis means bonds held with separate matching credit default swap (CDS) protection. (3) The total comprises US securities of £24.3bn, and Non-US securities of £15.9bn. (4) There has been no increase in net exposure as a result of the purchase of ABS during the year. Any increase in net exposure is the result
of exchange rate movements in excess of paydowns, NFVAs and impairments.
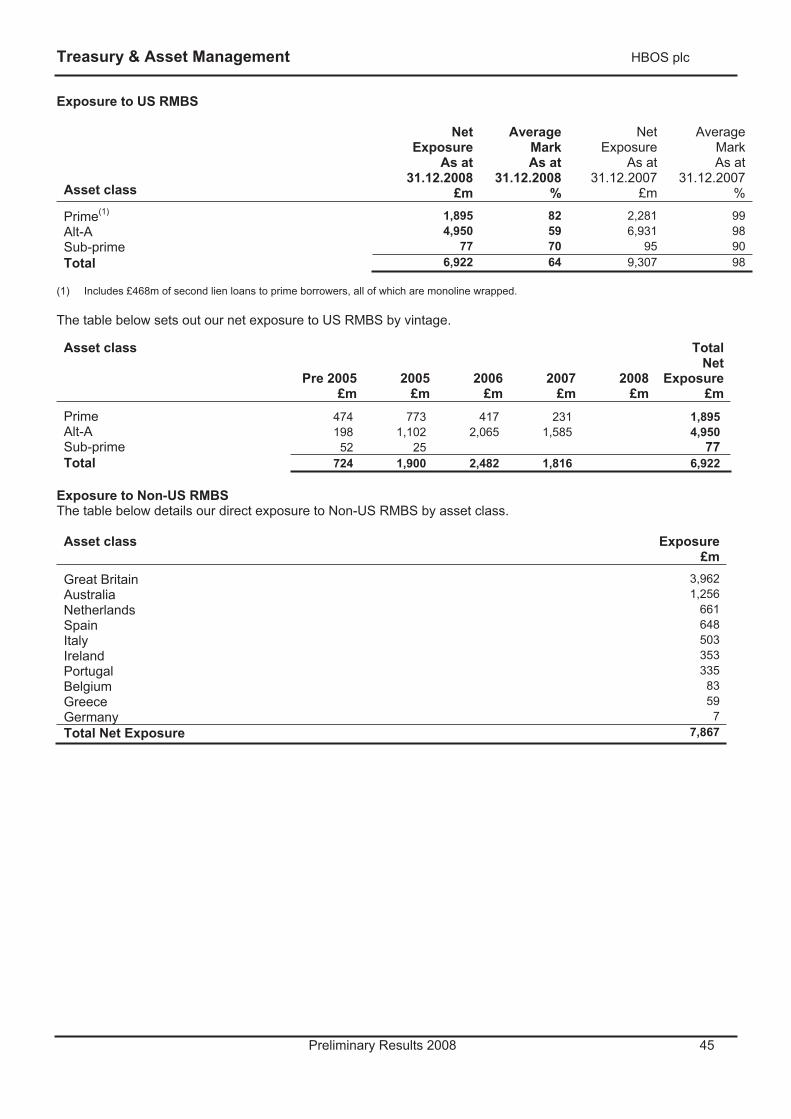
Treasury & Asset Management HBOS plc
Preliminary Results 2008 45
Exposure to US RMBS
Asset class
NetExposure
As at31.12.2008
£m
Average MarkAs at
31.12.2008 %
NetExposure
As at 31.12.2007
£m
AverageMarkAs at
31.12.2007 %
Prime(1) 1,895 82 2,281 99 Alt-A 4,950 59 6,931 98 Sub-prime 77 70 95 90 Total 6,922 64 9,307 98
(1) Includes £468m of second lien loans to prime borrowers, all of which are monoline wrapped.
The table below sets out our net exposure to US RMBS by vintage.
Asset class
Pre 2005£m
2005£m
2006£m
2007£m
2008£m
TotalNet
Exposure£m
Prime 474 773 417 231 1,895Alt-A 198 1,102 2,065 1,585 4,950Sub-prime 52 25 77Total 724 1,900 2,482 1,816 6,922
Exposure to Non-US RMBSThe table below details our direct exposure to Non-US RMBS by asset class.
Asset class Exposure£m
Great Britain 3,962Australia 1,256Netherlands 661Spain 648Italy 503Ireland 353Portugal 335Belgium 83Greece 59Germany 7Total Net Exposure 7,867
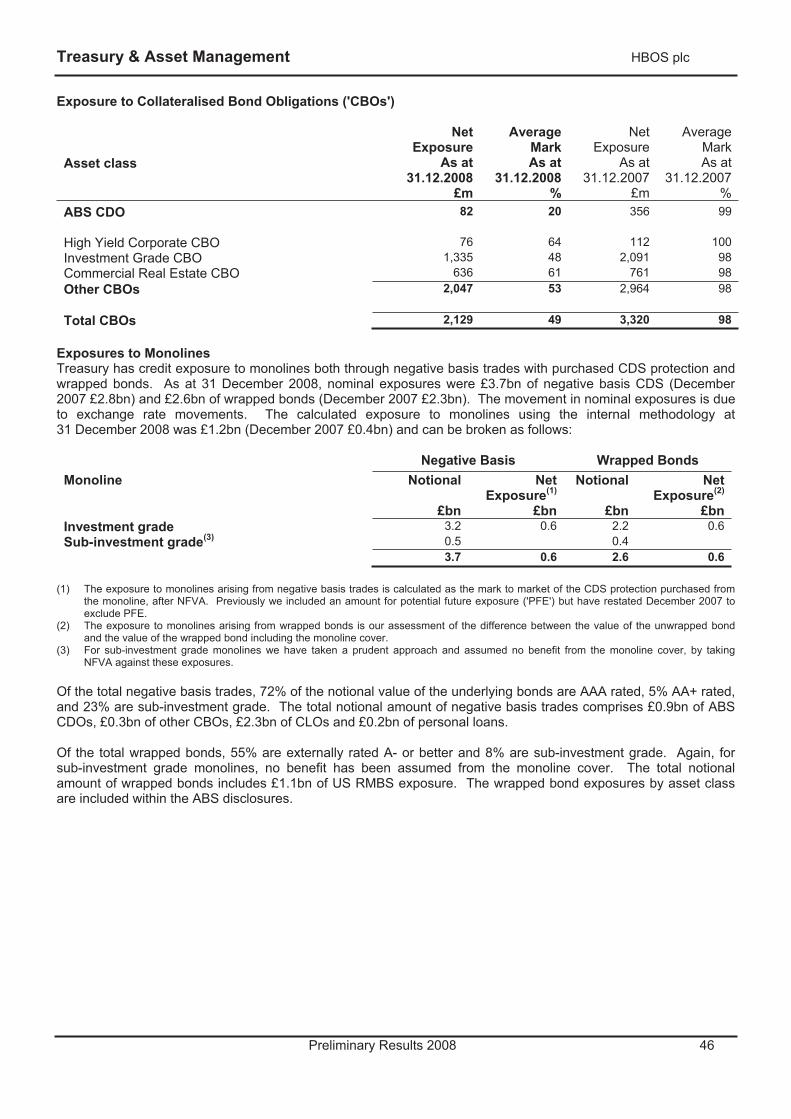
Treasury & Asset Management HBOS plc
Preliminary Results 2008 46
Exposure to Collateralised Bond Obligations ('CBOs')
Asset class
NetExposure
As at31.12.2008
£m
Average MarkAs at
31.12.2008 %
NetExposure
As at 31.12.2007
£m
AverageMarkAs at
31.12.2007 %
ABS CDO 82 20 356 99
High Yield Corporate CBO 76 64 112 100 Investment Grade CBO 1,335 48 2,091 98 Commercial Real Estate CBO 636 61 761 98 Other CBOs 2,047 53 2,964 98
Total CBOs 2,129 49 3,320 98
Exposures to Monolines Treasury has credit exposure to monolines both through negative basis trades with purchased CDS protection and wrapped bonds. As at 31 December 2008, nominal exposures were £3.7bn of negative basis CDS (December 2007 £2.8bn) and £2.6bn of wrapped bonds (December 2007 £2.3bn). The movement in nominal exposures is due to exchange rate movements. The calculated exposure to monolines using the internal methodology at 31 December 2008 was £1.2bn (December 2007 £0.4bn) and can be broken as follows:
Negative Basis Wrapped Bonds Monoline Notional
£bn
NetExposure(1)
£bn
Notional
£bn
NetExposure(2)
£bnInvestment grade 3.2 0.6 2.2 0.6 Sub-investment grade(3) 0.5 0.4
3.7 0.6 2.6 0.6
(1) The exposure to monolines arising from negative basis trades is calculated as the mark to market of the CDS protection purchased from the monoline, after NFVA. Previously we included an amount for potential future exposure ('PFE') but have restated December 2007 to exclude PFE.
(2) The exposure to monolines arising from wrapped bonds is our assessment of the difference between the value of the unwrapped bond and the value of the wrapped bond including the monoline cover.
(3) For sub-investment grade monolines we have taken a prudent approach and assumed no benefit from the monoline cover, by taking NFVA against these exposures.
Of the total negative basis trades, 72% of the notional value of the underlying bonds are AAA rated, 5% AA+ rated, and 23% are sub-investment grade. The total notional amount of negative basis trades comprises £0.9bn of ABS CDOs, £0.3bn of other CBOs, £2.3bn of CLOs and £0.2bn of personal loans.
Of the total wrapped bonds, 55% are externally rated A- or better and 8% are sub-investment grade. Again, for sub-investment grade monolines, no benefit has been assumed from the monoline cover. The total notional amount of wrapped bonds includes £1.1bn of US RMBS exposure. The wrapped bond exposures by asset class are included within the ABS disclosures.
Treasury & Asset Management HBOS plc
Preliminary Results 2008 47
Fair Values of Debt Securities The fair value of debt securities in active markets is based on market prices or broker/dealer valuations. Where quoted prices on instruments are not readily and regularly available from a recognised broker, dealer or pricing service or available prices do not represent regular transactions in the market, the fair value is estimated using quoted market prices for securities with similar credit, maturity and yield characteristics or similar valuation models.
Of the total debt securities carried at fair value on the balance sheet of £39.5bn (ie those classified as AFS and at FV through P/L) the fair values of those determined using models for which the inputs are observable in the market is £30.3bn, the fair values of those determined using quoted market prices is £6.2bn and the fair values of the debt securities calculated using models with inputs that are not observable in the market is £3.0bn.
These models use observed issuance prices in related asset classes, market correlations, prepayment assumptions and external credit ratings. For each asset class within the ABS portfolio, the implied spread arrived at by using this methodology is applied to the securities within that asset class. Additional assessments are then made on possible deterioration in credit risk for each individual security and on additional liquidity considerations for particular asset classes.
Impairment Review Impairment losses in respect of Available For Sale and Loans and Receivable assets totalled £1.4bn (December 2007 £nil), including FRNs £0.6bn, US RMBS, primarily Alt-A, £0.6bn and ABS CBOs £0.1bn. Treasury's portfolio is reviewed regularly, including as at 31 December 2008, for objective evidence of impairment at the specific investment level, in accordance with IFRS. Objective evidence of impairment might include non-receipt of due interest or principal repayment or a measurable decrease in the estimated future cash flows from a group of financial assets since the initial recognition of those assets. The disappearance of active markets, declines in fair values and rating downgrades associated with this asset portfolio do not in themselves constitute objective evidence of impairment and unless a default has occurred, the determination of whether or not objective evidence of impairment is present at the balance sheet date requires the exercise of management judgement. In circumstances where a loans and receivable asset has been individually assessed for impairment and no objective evidence of impairment exists, it will be subject to a collective assessment as part of a group of assets with similar risk characteristics. During the year a collective impairment provision of £0.6bn (2007 £nil) was recognised.
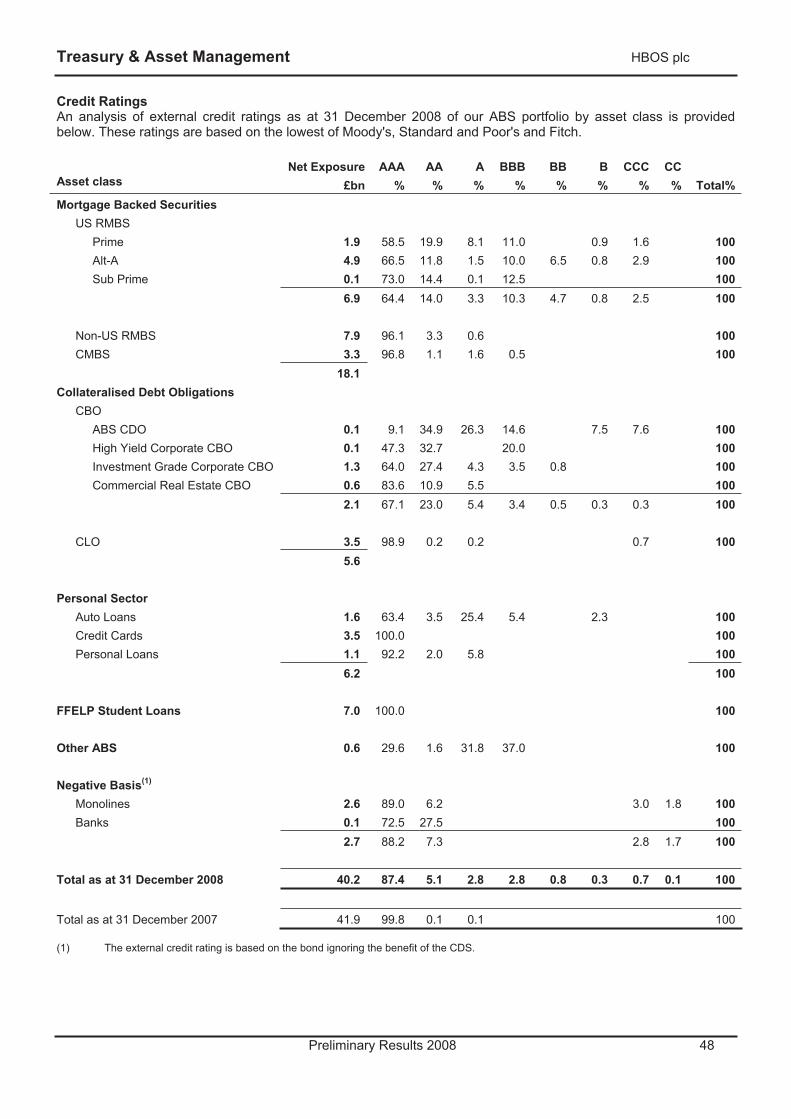
Treasury & Asset Management HBOS plc
Preliminary Results 2008 48
Credit Ratings An analysis of external credit ratings as at 31 December 2008 of our ABS portfolio by asset class is provided below. These ratings are based on the lowest of Moody's, Standard and Poor's and Fitch.
Asset class Net Exposure
£bnAAA
%AA %
A%
BBB%
BB%
B%
CCC%
CC% Total%
Mortgage Backed Securities US RMBS
Prime 1.9 58.5 19.9 8.1 11.0 0.9 1.6 100 Alt-A 4.9 66.5 11.8 1.5 10.0 6.5 0.8 2.9 100Sub Prime 0.1 73.0 14.4 0.1 12.5 100
6.9 64.4 14.0 3.3 10.3 4.7 0.8 2.5 100
Non-US RMBS 7.9 96.1 3.3 0.6 100 CMBS 3.3 96.8 1.1 1.6 0.5 100
18.1 Collateralised Debt Obligations
CBO ABS CDO 0.1 9.1 34.9 26.3 14.6 7.5 7.6 100High Yield Corporate CBO 0.1 47.3 32.7 20.0 100Investment Grade Corporate CBO 1.3 64.0 27.4 4.3 3.5 0.8 100Commercial Real Estate CBO 0.6 83.6 10.9 5.5 100
2.1 67.1 23.0 5.4 3.4 0.5 0.3 0.3 100
CLO 3.5 98.9 0.2 0.2 0.7 100 5.6
Personal Sector
Auto Loans 1.6 63.4 3.5 25.4 5.4 2.3 100 Credit Cards 3.5 100.0 100 Personal Loans 1.1 92.2 2.0 5.8 100
6.2 100
FFELP Student Loans 7.0 100.0 100
Other ABS 0.6 29.6 1.6 31.8 37.0 100
Negative Basis(1) Monolines 2.6 89.0 6.2 3.0 1.8 100Banks 0.1 72.5 27.5 100
2.7 88.2 7.3 2.8 1.7 100
Total as at 31 December 2008 40.2 87.4 5.1 2.8 2.8 0.8 0.3 0.7 0.1 100
Total as at 31 December 2007 41.9 99.8 0.1 0.1 100
(1) The external credit rating is based on the bond ignoring the benefit of the CDS.
Treasury & Asset Management HBOS plc
Preliminary Results 2008 49
Asset Management
InsightEquity markets have fallen dramatically in 2008, but Insight’s strategic focus on Liability Driven Investment ('LDI'), Fixed Income, Cash and Absolute Return products has been effective. Insight has experienced net inflows of £13.4bn in 2008 (2007 £9.8bn). The majority of these sales are within the Institutional channel and largely into the market leading LDI capability. Overall, net inflows have more than offset market depreciation such that assets under management have increased to £119.2bn (2007 £109.1bn).
Investment performance was mixed during the prolonged market volatility throughout 2008, however many funds have maintained their strong long term track records. In Fixed Income, UK Gilt portfolios are ahead of benchmark although UK Corporate Bond funds underperformed. European Fixed Income is ahead of benchmark over one and three years. UK Equity funds have generally underperformed benchmark, but UK Smaller companies outperformed benchmark by 12% during 2008. European and Global Equities were both behind benchmark. Absolute Insight has performed well, delivering a positive return in 2008 despite the significant falls in global markets. The Insight Diversified Target Return Fund has been a strong seller throughout 2008 with consistent top quartile performance in its Cautious Managed sector. Cash funds performed strongly with the flagship £11bn Insight Liquidity Fund ahead of benchmark over all periods.
Insight continues to receive industry accolades. At the 2008 Financial Times Pension and Investor Awards, the LDI Manager of the Year award was won for the second year running as well as Manager of Managers of the Year. Recognition was also gained for the work in Socially Responsible Investment (‘SRI’) as the Ethical Investment/ SRI Manager of the Year award was won at the 2008 Specialist and Alternative Investment Manager Awards along with SRI Manager of the Year at the European Pension Awards 2008.
Invista Despite the major upheaval in the markets and economic environment, with strong downward pressure on property values, 2008 was a year of progress for Invista with new fund developments reflecting diversification both in type of investment style and increasing geographic regions. Operating margins pre fair value adjustments also remained robust, with the new fund launches in 2008 supporting revenue margins which were achieved in conjunction with tight cost control. Assets under management decreased to £6.3bn (2007 £8.7bn) with the decline largely attributable to valuation falls experienced in the wider market.
Additional Information HBOS plc
Preliminary Results 2008 50
1. Net Interest Income 51
2. Non-Interest Income 52
3. Operating Expenses 53
4. Cost:Income Ratios 53
5. Group Embedded Value 54
6. Capital Structure 56
7. Risk 58
8. Foreign Exchange Rates 61
9. Divisional Reorganisation 61
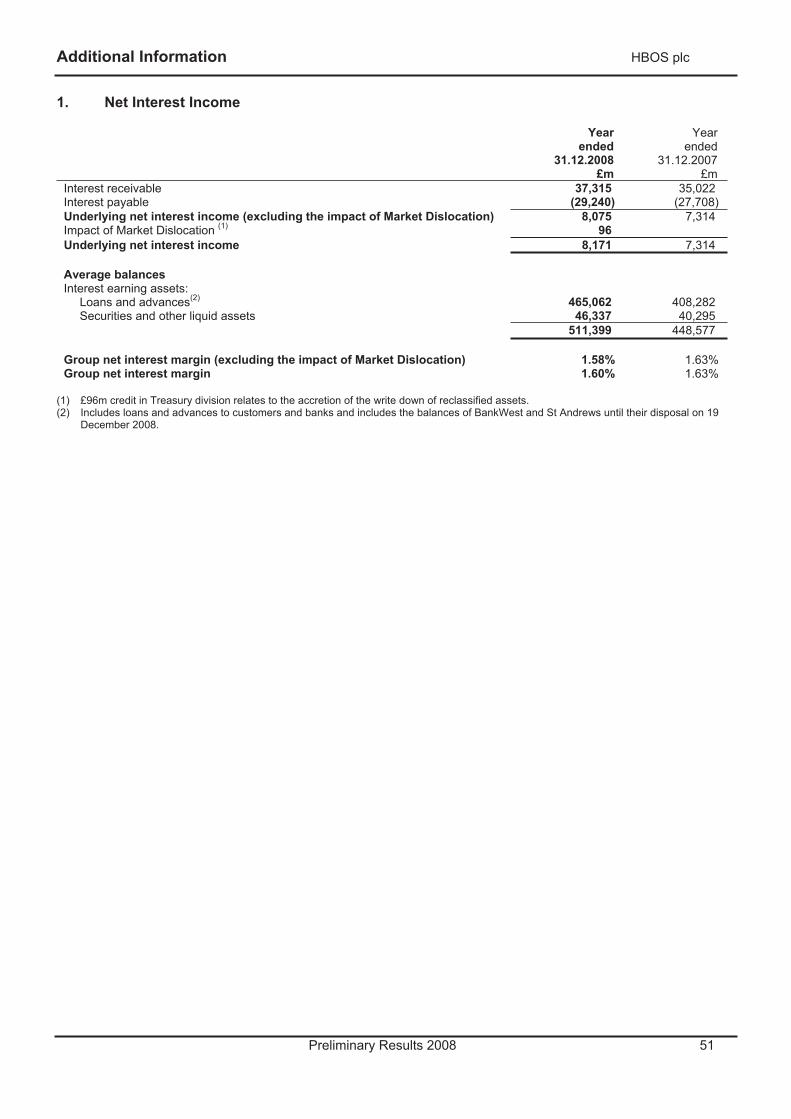
Additional Information HBOS plc
Preliminary Results 2008 51
1. Net Interest Income
Yearended
31.12.2008 £m
Yearended
31.12.2007 £m
Interest receivable 37,315 35,022 Interest payable (29,240) (27,708) Underlying net interest income (excluding the impact of Market Dislocation) 8,075 7,314Impact of Market Dislocation (1) 96Underlying net interest income 8,171 7,314
Average balances Interest earning assets:
Loans and advances(2) 465,062 408,282 Securities and other liquid assets 46,337 40,295
511,399 448,577
Group net interest margin (excluding the impact of Market Dislocation) 1.58% 1.63%Group net interest margin 1.60% 1.63%
(1) £96m credit in Treasury division relates to the accretion of the write down of reclassified assets. (2) Includes loans and advances to customers and banks and includes the balances of BankWest and St Andrews until their disposal on 19
December 2008.
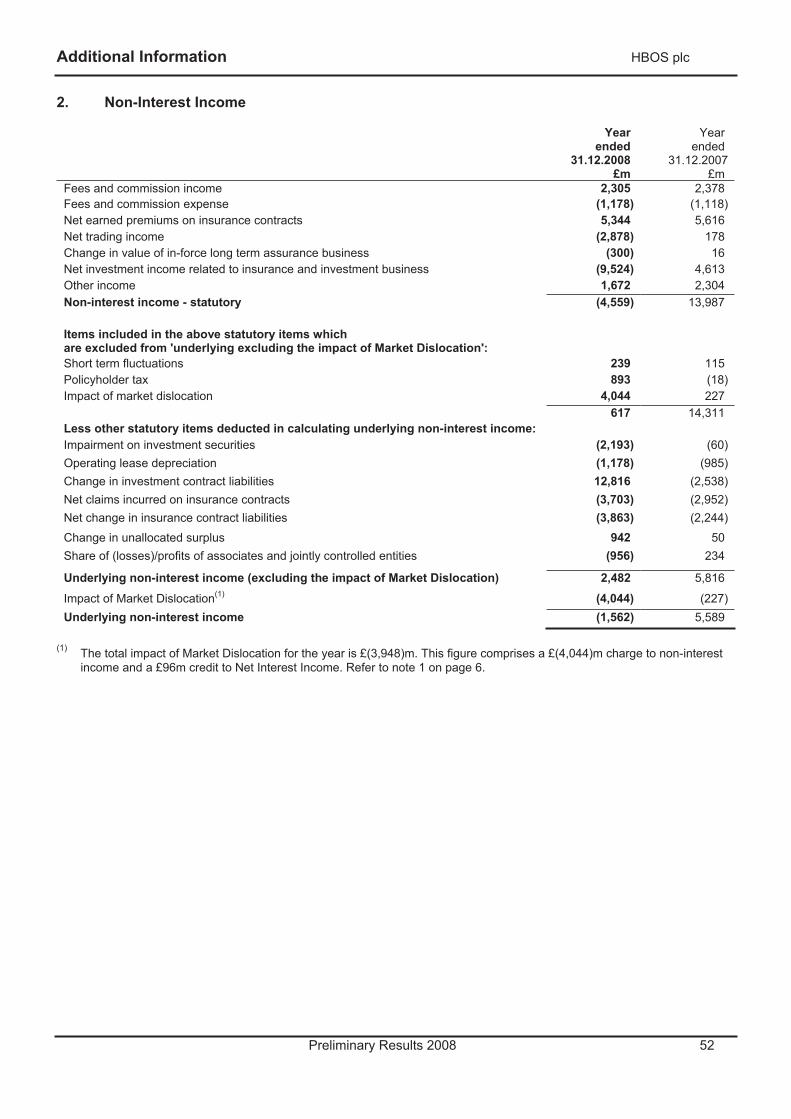
Additional Information HBOS plc
Preliminary Results 2008 52
2. Non-Interest Income
Yearended
31.12.2008 £m
Yearended
31.12.2007 £m
Fees and commission income 2,305 2,378Fees and commission expense (1,178) (1,118)Net earned premiums on insurance contracts 5,344 5,616Net trading income (2,878) 178Change in value of in-force long term assurance business (300) 16Net investment income related to insurance and investment business (9,524) 4,613Other income 1,672 2,304Non-interest income - statutory (4,559) 13,987
Items included in the above statutory items which are excluded from 'underlying excluding the impact of Market Dislocation': Short term fluctuations 239 115Policyholder tax 893 (18)Impact of market dislocation 4,044 227
617 14,311 Less other statutory items deducted in calculating underlying non-interest income: Impairment on investment securities (2,193) (60)Operating lease depreciation (1,178) (985)Change in investment contract liabilities 12,816 (2,538)Net claims incurred on insurance contracts (3,703) (2,952)Net change in insurance contract liabilities (3,863) (2,244)Change in unallocated surplus 942 50Share of (losses)/profits of associates and jointly controlled entities (956) 234
Underlying non-interest income (excluding the impact of Market Dislocation) 2,482 5,816
Impact of Market Dislocation(1) (4,044) (227)Underlying non-interest income (1,562) 5,589
(1) The total impact of Market Dislocation for the year is £(3,948)m. This figure comprises a £(4,044)m charge to non-interest income and a £96m credit to Net Interest Income. Refer to note 1 on page 6.
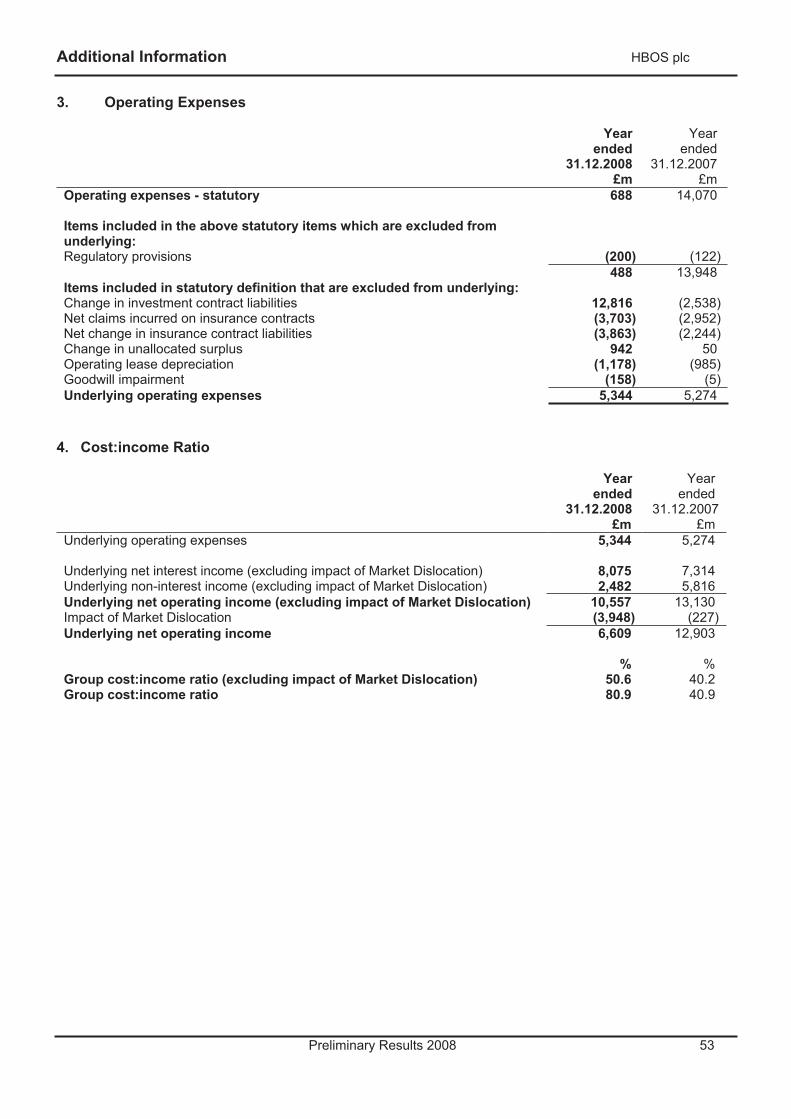
Additional Information HBOS plc
Preliminary Results 2008 53
3. Operating Expenses
Yearended
31.12.2008£m
Yearended
31.12.2007 £m
Operating expenses - statutory 688 14,070
Items included in the above statutory items which are excluded from underlying:Regulatory provisions (200) (122)
488 13,948Items included in statutory definition that are excluded from underlying: Change in investment contract liabilities 12,816 (2,538)Net claims incurred on insurance contracts (3,703) (2,952)Net change in insurance contract liabilities (3,863) (2,244)Change in unallocated surplus 942 50Operating lease depreciation (1,178) (985)Goodwill impairment (158) (5)Underlying operating expenses 5,344 5,274
4. Cost:income Ratio
Yearended
31.12.2008£m
Yearended
31.12.2007 £m
Underlying operating expenses 5,344 5,274
Underlying net interest income (excluding impact of Market Dislocation) 8,075 7,314Underlying non-interest income (excluding impact of Market Dislocation) 2,482 5,816Underlying net operating income (excluding impact of Market Dislocation) 10,557 13,130Impact of Market Dislocation (3,948) (227) Underlying net operating income 6,609 12,903
% %Group cost:income ratio (excluding impact of Market Dislocation) 50.6 40.2Group cost:income ratio 80.9 40.9
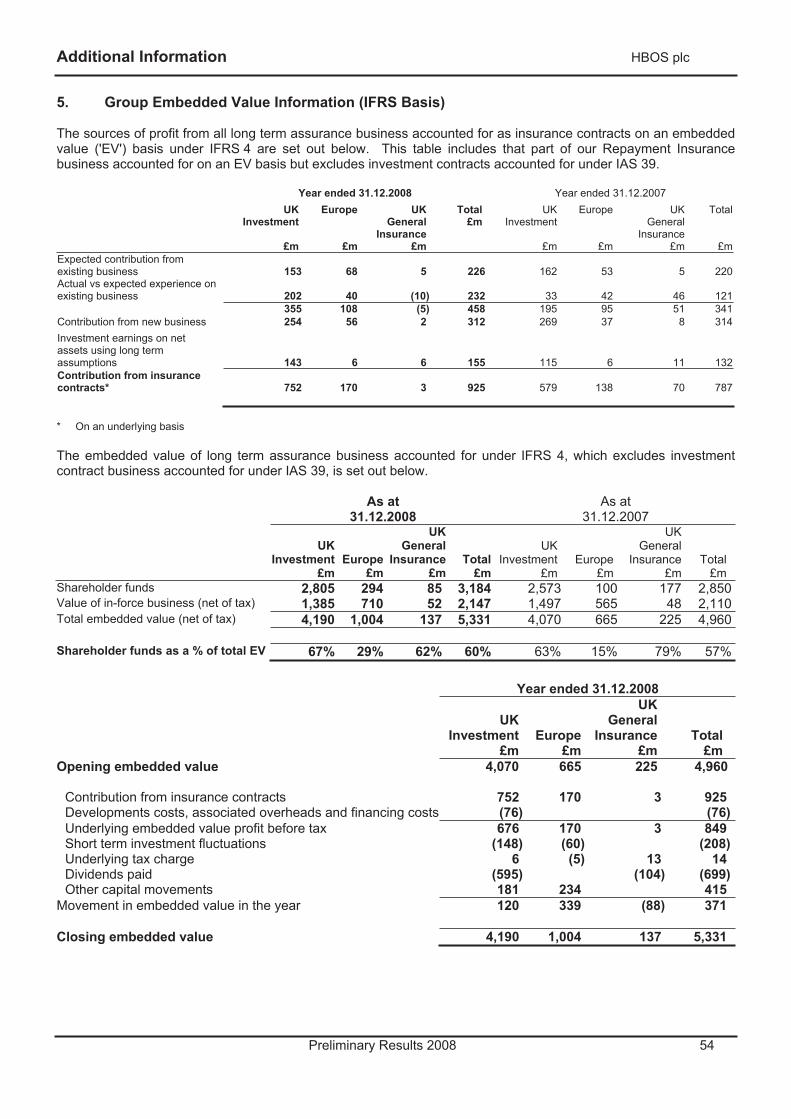
Additional Information HBOS plc
Preliminary Results 2008 54
5. Group Embedded Value Information (IFRS Basis)
The sources of profit from all long term assurance business accounted for as insurance contracts on an embedded value ('EV') basis under IFRS 4 are set out below. This table includes that part of our Repayment Insurance business accounted for on an EV basis but excludes investment contracts accounted for under IAS 39.
Year ended 31.12.2008 Year ended 31.12.2007 UK
Investment
£m
Europe
£m
UKGeneral
Insurance £m
Total £m
UKInvestment
£m
Europe
£m
UKGeneral
Insurance£m
Total
£mExpected contribution from existing business 153 68 5 226 162 53 5 220Actual vs expected experience on existing business 202 40 (10) 232 33 42 46 121
355 108 (5) 458 195 95 51 341Contribution from new business 254 56 2 312 269 37 8 314Investment earnings on net assets using long term assumptions 143 6 6 155 115 6 11 132Contribution from insurance contracts* 752 170 3 925 579 138 70 787
* On an underlying basis
The embedded value of long term assurance business accounted for under IFRS 4, which excludes investment contract business accounted for under IAS 39, is set out below.
As at 31.12.2008
As at 31.12.2007
UKInvestment
£mEurope
£m
UKGeneral
Insurance£m
Total£m
UKInvestment
£mEurope
£m
UKGeneral
Insurance £m
Total £m
Shareholder funds 2,805 294 85 3,184 2,573 100 177 2,850Value of in-force business (net of tax) 1,385 710 52 2,147 1,497 565 48 2,110Total embedded value (net of tax) 4,190 1,004 137 5,331 4,070 665 225 4,960
Shareholder funds as a % of total EV 67% 29% 62% 60% 63% 15% 79% 57%
Year ended 31.12.2008
UKInvestment
£mEurope
£m
UKGeneral
Insurance £m
Total£m
Opening embedded value 4,070 665 225 4,960
Contribution from insurance contracts 752 170 3 925 Developments costs, associated overheads and financing costs (76) (76)Underlying embedded value profit before tax 676 170 3 849 Short term investment fluctuations (148) (60) (208)Underlying tax charge 6 (5) 13 14 Dividends paid (595) (104) (699)Other capital movements 181 234 415
Movement in embedded value in the year 120 339 (88) 371
Closing embedded value 4,190 1,004 137 5,331
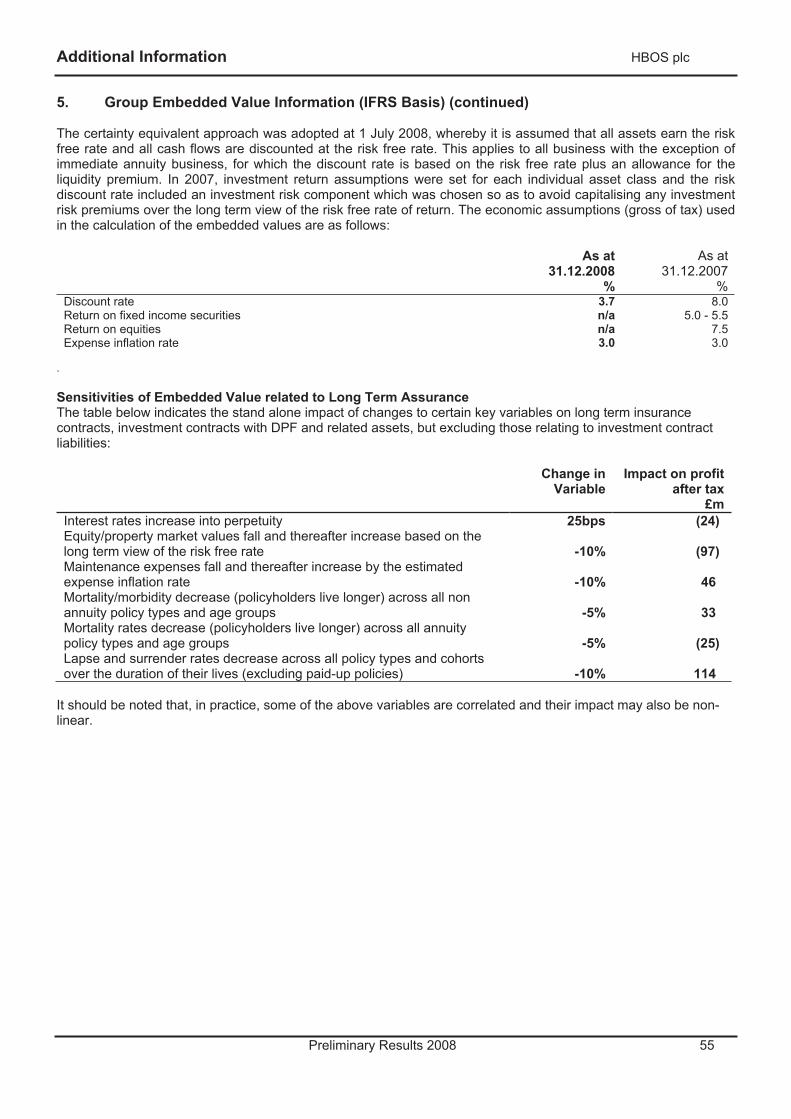
Additional Information HBOS plc
Preliminary Results 2008 55
5. Group Embedded Value Information (IFRS Basis) (continued)
The certainty equivalent approach was adopted at 1 July 2008, whereby it is assumed that all assets earn the risk free rate and all cash flows are discounted at the risk free rate. This applies to all business with the exception of immediate annuity business, for which the discount rate is based on the risk free rate plus an allowance for the liquidity premium. In 2007, investment return assumptions were set for each individual asset class and the risk discount rate included an investment risk component which was chosen so as to avoid capitalising any investment risk premiums over the long term view of the risk free rate of return. The economic assumptions (gross of tax) used in the calculation of the embedded values are as follows:
As at 31.12.2008
%
As at31.12.2007
%Discount rate 3.7 8.0Return on fixed income securities n/a 5.0 - 5.5 Return on equities n/a 7.5Expense inflation rate 3.0 3.0
.
Sensitivities of Embedded Value related to Long Term Assurance The table below indicates the stand alone impact of changes to certain key variables on long term insurance contracts, investment contracts with DPF and related assets, but excluding those relating to investment contract liabilities:
Change in Variable
Impact on profitafter tax
£mInterest rates increase into perpetuity 25bps (24) Equity/property market values fall and thereafter increase based on the long term view of the risk free rate -10% (97) Maintenance expenses fall and thereafter increase by the estimated expense inflation rate -10% 46Mortality/morbidity decrease (policyholders live longer) across all non annuity policy types and age groups -5% 33Mortality rates decrease (policyholders live longer) across all annuity policy types and age groups -5% (25) Lapse and surrender rates decrease across all policy types and cohorts over the duration of their lives (excluding paid-up policies) -10% 114
It should be noted that, in practice, some of the above variables are correlated and their impact may also be non-linear.
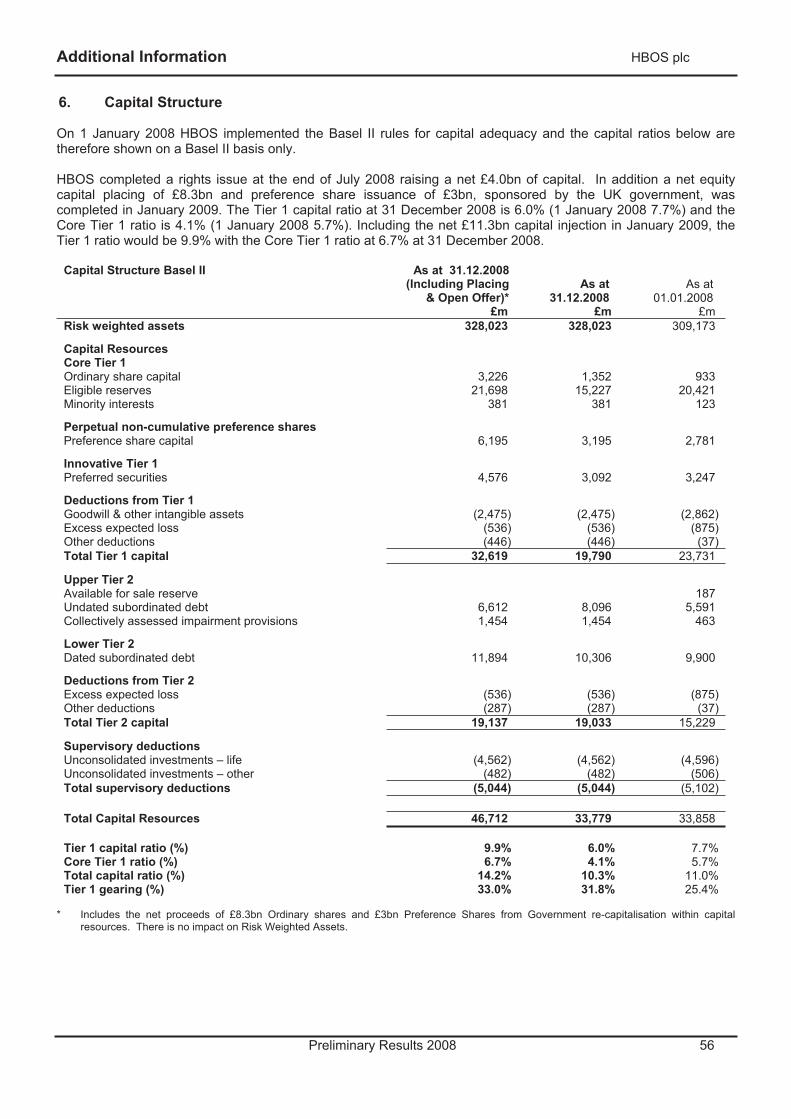
Additional Information HBOS plc
Preliminary Results 2008 56
6. Capital Structure
On 1 January 2008 HBOS implemented the Basel II rules for capital adequacy and the capital ratios below are therefore shown on a Basel II basis only.
HBOS completed a rights issue at the end of July 2008 raising a net £4.0bn of capital. In addition a net equity capital placing of £8.3bn and preference share issuance of £3bn, sponsored by the UK government, was completed in January 2009. The Tier 1 capital ratio at 31 December 2008 is 6.0% (1 January 2008 7.7%) and the Core Tier 1 ratio is 4.1% (1 January 2008 5.7%). Including the net £11.3bn capital injection in January 2009, the Tier 1 ratio would be 9.9% with the Core Tier 1 ratio at 6.7% at 31 December 2008.
Capital Structure Basel II As at 31.12.2008 (Including Placing
& Open Offer)* £m
As at 31.12.2008
£m
As at01.01.2008
£mRisk weighted assets 328,023 328,023 309,173
Capital Resources Core Tier 1 Ordinary share capital 3,226 1,352 933 Eligible reserves 21,698 15,227 20,421 Minority interests 381 381 123
Perpetual non-cumulative preference shares Preference share capital 6,195 3,195 2,781
Innovative Tier 1 Preferred securities 4,576 3,092 3,247
Deductions from Tier 1 Goodwill & other intangible assets (2,475) (2,475) (2,862) Excess expected loss (536) (536) (875) Other deductions (446) (446) (37) Total Tier 1 capital 32,619 19,790 23,731
Upper Tier 2 Available for sale reserve 187 Undated subordinated debt 6,612 8,096 5,591 Collectively assessed impairment provisions 1,454 1,454 463
Lower Tier 2 Dated subordinated debt 11,894 10,306 9,900
Deductions from Tier 2 Excess expected loss (536) (536) (875) Other deductions (287) (287) (37) Total Tier 2 capital 19,137 19,033 15,229
Supervisory deductions Unconsolidated investments – life (4,562) (4,562) (4,596) Unconsolidated investments – other (482) (482) (506) Total supervisory deductions (5,044) (5,044) (5,102)
Total Capital Resources 46,712 33,779 33,858
Tier 1 capital ratio (%) 9.9% 6.0% 7.7%Core Tier 1 ratio (%) 6.7% 4.1% 5.7%Total capital ratio (%) 14.2% 10.3% 11.0%Tier 1 gearing (%) 33.0% 31.8% 25.4%
* Includes the net proceeds of £8.3bn Ordinary shares and £3bn Preference Shares from Government re-capitalisation within capitalresources. There is no impact on Risk Weighted Assets.
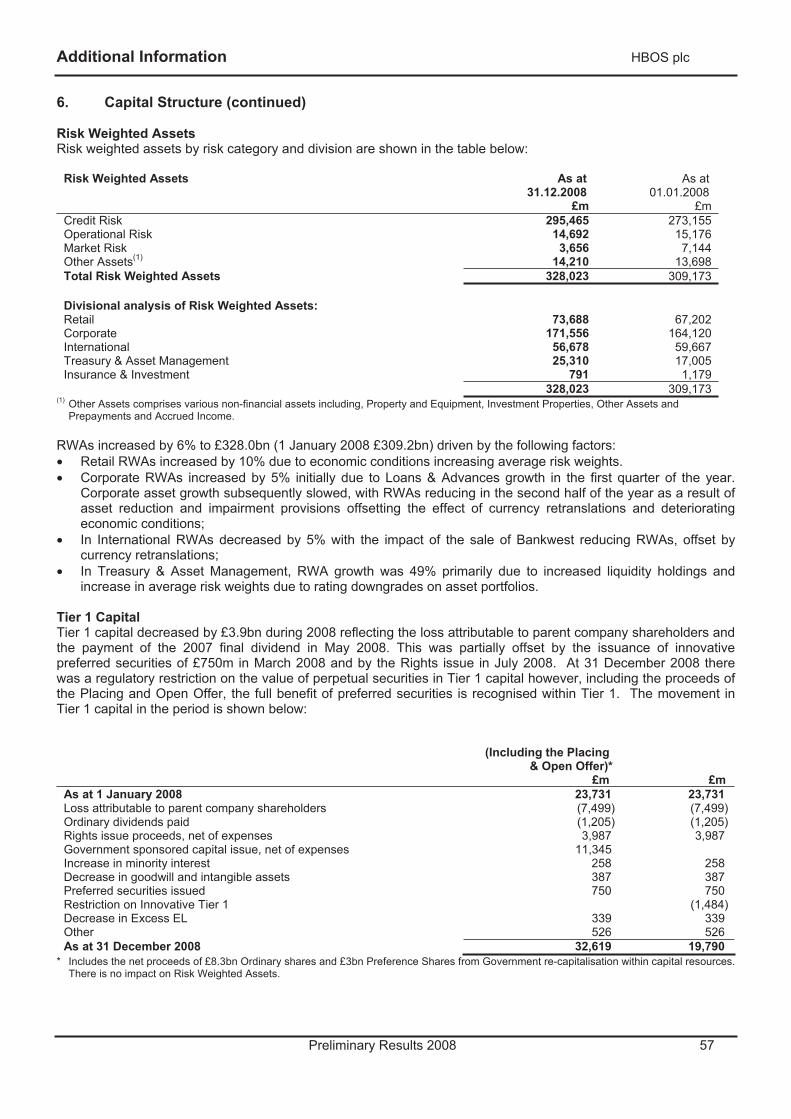
Additional Information HBOS plc
Preliminary Results 2008 57
6. Capital Structure (continued)
Risk Weighted AssetsRisk weighted assets by risk category and division are shown in the table below:
Risk Weighted Assets As at 31.12.2008
£m
As at 01.01.2008
£mCredit Risk 295,465 273,155 Operational Risk 14,692 15,176 Market Risk 3,656 7,144Other Assets(1) 14,210 13,698 Total Risk Weighted Assets 328,023 309,173
Divisional analysis of Risk Weighted Assets: Retail 73,688 67,202 Corporate 171,556 164,120 International 56,678 59,667 Treasury & Asset Management 25,310 17,005 Insurance & Investment 791 1,179
328,023 309,173 (1) Other Assets comprises various non-financial assets including, Property and Equipment, Investment Properties, Other Assets and
Prepayments and Accrued Income.
RWAs increased by 6% to £328.0bn (1 January 2008 £309.2bn) driven by the following factors: • Retail RWAs increased by 10% due to economic conditions increasing average risk weights. • Corporate RWAs increased by 5% initially due to Loans & Advances growth in the first quarter of the year.
Corporate asset growth subsequently slowed, with RWAs reducing in the second half of the year as a result of asset reduction and impairment provisions offsetting the effect of currency retranslations and deteriorating economic conditions;
• In International RWAs decreased by 5% with the impact of the sale of Bankwest reducing RWAs, offset by currency retranslations;
• In Treasury & Asset Management, RWA growth was 49% primarily due to increased liquidity holdings and increase in average risk weights due to rating downgrades on asset portfolios.
Tier 1 Capital Tier 1 capital decreased by £3.9bn during 2008 reflecting the loss attributable to parent company shareholders and the payment of the 2007 final dividend in May 2008. This was partially offset by the issuance of innovative preferred securities of £750m in March 2008 and by the Rights issue in July 2008. At 31 December 2008 there was a regulatory restriction on the value of perpetual securities in Tier 1 capital however, including the proceeds of the Placing and Open Offer, the full benefit of preferred securities is recognised within Tier 1. The movement in Tier 1 capital in the period is shown below:
(Including the Placing & Open Offer)*
£m £mAs at 1 January 2008 23,731 23,731 Loss attributable to parent company shareholders (7,499) (7,499) Ordinary dividends paid (1,205) (1,205) Rights issue proceeds, net of expenses 3,987 3,987 Government sponsored capital issue, net of expenses 11,345 Increase in minority interest 258 258 Decrease in goodwill and intangible assets 387 387 Preferred securities issued 750 750 Restriction on Innovative Tier 1 (1,484) Decrease in Excess EL 339 339 Other 526 526 As at 31 December 2008 32,619 19,790
* Includes the net proceeds of £8.3bn Ordinary shares and £3bn Preference Shares from Government re-capitalisation within capital resources. There is no impact on Risk Weighted Assets.
Additional Information HBOS plc
Preliminary Results 2008 58
6. Capital Structure (continued)
Tier 2 Capital The increase in Tier 2 capital during the year is due to dated subordinated debt issues of €175m and US$2bn. In sterling equivalent terms at 31 December 2008, these new issuances totalled £1,526m. Exchange translations on subordinated debt of £3.5bn also contributed to the increase in Tier 2 capital. At 31 December 2008 there was a regulatory restriction in including the value of debt issues in Tier 2 capital however including the proceeds of the Placing and Open offer, the full benefit of this capital is included within Tier 2.
Supervisory deductions Supervisory deductions mainly reflect investments in subsidiary undertakings that are not within the banking group for regulatory purposes. These unconsolidated investments are primarily Clerical Medical, St. James's Place, St Andrews Group, and Heidelberger Leben. Total supervisory deductions decreased to £5,044m from £5,102m primarily as a result of capital repatriated from the insurance and investment group to the banking group, offsetting increases in embedded value of life policies.
7. Risk
Risks and Uncertainties The divisional reviews on pages 14-49 include a review of 2008. The most significant risks and uncertainties faced by the Group over the next six months are set out below. These should not be regarded as a complete and comprehensive statement of all potential risks and uncertainties.
Credit Risk Credit Risk is the risk of financial loss from counterparty’s failure to settle financial obligations as they fall due.
The Group’s business is affected by economic conditions in the UK, where the majority of earnings are generated, as well as in the other geographical areas in which it operates.
To manage credit risk, a wide range of policies and techniques are used across the Group:
• For retail portfolios, extensive use is made of credit scoring in the assessment of new applications for credit and behavioural scoring in the ongoing assessment of existing customers. Affordability is a vitally important measure and is reviewed in combination with either application and/or behavioural scores. HBOS makes extensive use of credit bureau files to inform the assessment of customer risk and affordability and to aid responsible lending. Small business customers are assessed for their credit-worthiness in a similar manner to retail customers.
• For corporate portfolios, a full credit assessment of the financial strength of each potential transaction and/or customer is undertaken, including a stress test of key financial aspects of the transaction, awarding an internal risk rating which is reviewed regularly. The same approach is also used for larger SME (small to medium enterprise) customers.
• Within Treasury Division (Treasury), focused credit risk policies are established and reviewed by senior management. Basel II Advanced IRB compliant models are used to rate banking and sovereign counterparties. Structured credit bonds are reviewed individually by an independent credit function prior to purchase and an internal rating is applied to all exposures with additional product thresholds and limits in place and monitored across the division.
In common with UK peers HBOS, from 1 January 2008, adopted the Basel II framework through application of the FSA BIPRU rules. HBOS utilises both Standardised and Advanced Internal Ratings Based ('AIRB') approaches and is approved by the FSA to use the AIRB approach for regulatory capital purposes.
During the second half of 2008 the pressures being experienced in wholesale and liquidity markets spread to become severe economic deterioration in the UK. This pressure accelerated significantly in quarter four 2008 and saw substantial issues arising in Corporate lending and Treasury investments.
The Corporate Division's Credit Risk Management was unable to react quickly enough to contain the deterioration, exacerbated by HBOS historic levels of exposure concentration within property and property related sectors, giving little room for manoeuvre in a deteriorating market and resulting in impairment losses increasing dramatically.
Additional Information HBOS plc
Preliminary Results 2008 59
7. Risk (continued)
In addition, Treasury has been materially impacted by the reduction in fair value of our ABS portfolio as a result of credit concerns, poor market sentiment and liquidity pressures. This has been exacerbated following a strategic decision of moving away from using Government bonds to provide liquidity, instead relying on AAA rated Asset backed securities and investment grade bank FRNs, which whilst effective in liquidity terms, significantly increased the credit risk profile of the Group.
The credit risk profile within HBOS is susceptible to further increases in impairments if the UK economy continues to deteriorate. Additional pressure will also be evident in Treasury's ABS portfolio if US real estate values fall further, resulting in increasing fair value and impairment losses.
Liquidity Liquidity risk is the risk that the Group does not have sufficient financial resources to meet its obligations when they fall due or will have to do so at excessive cost. In order to ensure that the Group continues to meet its funding obligations and maintain or grow its business generally, the Group has developed a suite of liquidity policies supported by a diversified funding mix comprising both customer deposits and wholesale funding. Details of the composition of the Group's funding is set out on pages 59-61.
At 31 December 2008, the Group's liquidity portfolio of marketable assets was £77.3bn (2007 £67.0bn), of which £39.5bn (2007 £13.4bn) has been used for repo. The assets in the liquidity portfolio are treated in two forms. Firstly, assets which we know to be eligible under normal arrangements with the Bank of England, the European Central Bank and the Federal Reserve, which for internal purposes we describe as primary liquidity. Secondly, a substantial pool of high quality (secondary) liquidity assets that allow us to manage through periods of stress taking into account the likely behaviours of depositors and wholesale markets. The Group routinely uses the repo market as a liquidity management tool and has well established relationships with a wide range of market participants. The Group also has access to the standing facilities at a number of central banks. In addition on 21 April 2008, the Bank of England launched its Special Liquidity Scheme which allows banks to swap their high quality mortgage-backed and other securities for UK Treasury Bills for a defined period. HBOS has used this facility to provide high quality liquidity assets.
FundingThe wholesale funding capacity of the Group is dependent upon factors such as the strength of the balance sheet, earnings, asset quality, ratings and market position, as well as market sentiment and perception, most evident in share and debt price volatility. The HBOS Group relies and intends to rely increasingly on customer savings and transmission balances, as well as ongoing access to the wholesale lending markets, central bank liquidity facilities such as the Special Liquidity Scheme and the Extended Open Market Operations operated by the Bank of England, and support from HM Treasury’s guarantee scheme.
In response to the strain on financial systems, governments, including the UK Government, have taken substantial measures to ease the current crisis in liquidity, such as the measures announced in the UK on 8 October 2008 and 13 October 2008, albeit there can be no assurance that these global measures will succeed in improving the funding and liquidity of the markets in which the major banks, including HBOS, operate. Going forward HBOS, as a wholly owned subsidiary, will be dependent on Lloyds Banking Group for funding and expects reliance for the foreseeable future on the continued availability of central bank liquidity facilities (particularly those with the Bank of England) as well as HM Treasury’s guarantee scheme for short- and medium-term debt issuance.
The Group's retail and wholesale funding sources by type of instrument are analysed below. Tables are prepared on the basis that "retail" is defined using the current statutory definition, i.e. administered rate products. Wholesale funding, when issued in a foreign currency but swapped into Sterling, is included at the swap exchanged amount. Wholesale funding is shown excluding any Repo activity and the funding raised in the names of the conduits.
Additional Information HBOS plc
Preliminary Results 2008 60
7. Risk (continued)
As at31.12.2008
£bn
As at31.12.2008
%
As at 31.12.2007
£bn
As at 31.12.2007
%Bank deposits 13.7 3.3 33.1 6.7Customer deposits 24.0 5.7 27.8 5.6Debt Securities in issue:
Certificates of deposit 51.0 12.2 63.9 12.9Medium term notes 45.7 10.9 43.2 8.7Covered bonds 29.1 7.0 24.4 4.9Commercial paper 8.9 2.1 16.8 3.4Securitisation 35.8 8.6 45.9 9.3
170.5 40.8 194.2 39.2Subordinated debt 22.2 5.3 18.1 3.7Other 7.6 1.8 6.9 1.3Total Wholesale 238.0 56.9 280.1 56.5Retail 180.1 43.1 215.4 43.5Total Group Funding 418.1 100 495.5 100
The following tables reconcile wholesale figures reported above with those in the Statutory Balance Sheet.
As at 31.12.2008
Accounting Classification
Includedin Funding
Analysis(Above)
£bn
Repos and conduits
£bn
Interestaccruals
and other accounting
adjustments £bn
Statutory Balance
Sheet£bn
Debt securities in issue 170.5 3.0 14.9 188.4Sub debt and Other 29.8 0.3 30.1Deposits by customers 204.1 18.2 222.3Bank deposits 13.7 70.9 12.6 97.2Total 418.1 92.1
As at 31.12.2007
Accounting Classification
Included in Funding Analysis(Above)
£bn
Repos and conduits
£bn
Interest accruals
and other accounting
adjustments £bn
StatutoryBalance
Sheet£bn
Debt securities in issue 194.2 12.0 0.3 206.5Sub debt and Other 25.0 (0.7) 24.3Deposits by customers 243.2 243.2Bank deposits 33.1 7.8 0.6 41.5Total 495.5 19.8
The increased use of repo activity as a funding tool had a material impact on the levels of wholesale funding shown in the tables.
Wholesale funding is analysed by currency as follows:As at
31.12.2008£bn
As at31.12.2008
%
As at 31.12.2007
£bn
As at 31.12.2007
%US dollar 52.8 22.2 105.2 37.6Euro 87.4 36.7 79.6 28.4Sterling 80.1 33.7 70.3 25.1Other 17.7 7.4 25.0 8.9Total Wholesale Funding 238.0 100 280.1 100
Additional Information HBOS plc
Preliminary Results 2008 61
7. Risk (continued) Wholesale funding is analysed by residual maturity as follows:
As at31.12.2008
£bn
As at31.12.2008
%
As at 31.12.2007
£bn
As at 31.12.2007
%Less than one year 119.4 50.2 166.2 59.3One to two years 25.2 10.6 21.6 7.7Two to five years 44.1 18.5 46.3 16.5More than five years 49.3 20.7 46.0 16.5Total Wholesale Funding 238.0 100 280.1 100
8. Foreign Exchange Rates
The results of our International businesses are converted to Sterling monthly at the average exchange rate for the month. The average exchange rates for the respective reporting periods were:
Yearended
31.12.2008
Yearended
31.12.2007 £1 : Australian dollar 2.19 2.39£1 : Euro 1.26 1.46£1 : US dollar 1.85 2.00£1 : Canadian dollar 1.96 2.15
The closing exchange rates used in the conversion of the International balance sheets were: As at
31.12.2008 As at
31.12.2007 £1 : Australian dollar 2.12 2.28£1 : Euro 1.05 1.36£1 : US dollar 1.46 2.00£1 : Canadian dollar 1.79 1.97
9. Divisional Reorganisation
During 2008, certain businesses were transferred between the Retail, Corporate and Treasury divisions. The 2008 Preliminary Results are reported in line with this new structure and the 2007 comparatives have been restated to reflect the transfers. There is no impact on the 2007 Group Consolidated Balance Sheet and Income Statement previously published. The main changes to the divisional structure following the internal reorganisation are: • The transfer of Business Banking from the Retail division to the Corporate division. • The transfer of Trading Cash Management from the Treasury division to the Corporate division. • The transfer of the Loans Distribution business from the Corporate division to the Treasury division.
Divisional Reorganisation – Summary
Year ended 31 December 2007 Aspublished(1)
Businesstransfers(2) Restated
£m £m £mRetail 2,049 (23) 2,026Corporate 2,320 39 2,359Insurance & Investment 644 644International 757 757Treasury & Asset Management 502 (16) 486Group Items (337) (337)Underlying profit before tax (excl. the impact of Market Dislocation) 5,935 5,935Impact of Market Dislocation (227) (227)Underlying profit before tax 5,708 5,708
(1) The results for the year ended December 2007 are those that were published in the 2008 Interim Results on 31 July 2008. (2) These amounts reflect the impact on the comparative results from the transfers of business between divisions, principally the transfer
into Corporate of the Business Banking and Trading Cash Management from Retail and Treasury.
Additional Information HBOS plc
Preliminary Results 2008 62
9. Divisional Reorganisation (continued)
Divisional Income Statements The following tables show the effects of the divisional reorganisation on the results for the year ended 31 December 2007.
Year ended 31 December 2007
As published Retail
£m
Corporate
£m
Insurance & Investment
£m
International
£m
Treasury & Asset Mgt
£m
Group Items
£m
Total
£mUnderlying net interest income 4,099 2,061 (98) 1,088 164 7,314 Underlying non-interest income(1) 1,304 1,746 1,591 499 676 5,816 Underlying net operating income 5,403 3,807 1,493 1,587 840 13,130 Underlying operating expenses (2,147) (885) (849) (714) (342) (337) (5,274) Underlying operating profit before provisions 3,256 2,922 644 873 498 (337) 7,856 Impairment losses on loans and advances (1,294) (602) (116) (2,012) Non-operating income 87 4 91Impact of Market Dislocation (227) (227) Underlying profit before tax 2,049 2,320 644 757 275 (337) 5,708
Divisional transfers Retail
£m
Corporate
£m
Insurance & Investment
£m
International
£m
Treasury & Asset Mgt
£m
Group Items
£m
Total
£mUnderlying net interest income (103) 111 (8) Underlying non-interest income(1) (39) 60 (21) Underlying net operating income (142) 171 (29) Underlying operating expenses 102 (115) 13 Underlying operating profit before provisions (40) 56 (16) Impairment losses on loans and advances 17 (17) Non-operating income Impact of Market Dislocation Underlying profit before tax (23) 39 (16)
Restated Retail
£m
Corporate £m
Insurance & Investment
£m
International
£m
Treasury & Asset Mgt
£m
Group Items
£m
Total
£mUnderlying net interest income 3,996 2,172 (98) 1,088 156 7,314 Underlying non-interest income(1) 1,265 1,806 1,591 499 655 5,816 Underlying net operating income 5,261 3,978 1,493 1,587 811 13,130 Underlying operating expenses (2,045) (1,000) (849) (714) (329) (337) (5,274) Underlying operating profit before provisions 3,216 2,978 644 873 482 (337) 7,856 Impairment losses on loans and advances (1,277) (619) (116) (2,012) Non-operating income 87 4 91Impact of Market Dislocation (227) (227) Underlying profit before tax 2,026 2,359 644 757 259 (337) 5,708
(1) Excluding the impact of Market Dislocation in Treasury & Asset Management.
Financial Information HBOS plc
Preliminary Results 2008 63
FINANCIAL INFORMATION (In accordance with the Listing Rules of the Financial Services Authority)
Basis of Preparation
a) Principles Underlying Going Concern Assumption During 2008, global financial markets experienced difficult conditions which have been characterised by a marked reduction in liquidity. As a consequence of this, governments and central banks carried out a series of actions to address the lack of liquidity within their respective banking systems. In the UK these actions have included the introduction by the Bank of England of liquidity support, through schemes (collectively “Bank of England facilities”) such as the extended Long-Term Repo open market operations and the Special Liquidity Scheme (‘SLS’) whereby banks and building societies can exchange eligible securities for UK Treasury bills; and the creation of a credit guarantee scheme by HM Treasury, providing a government guarantee for certain short and medium term senior debt securities issued by eligible banks. During 2008 the Group has made use of these measures in order to maintain and improve a stable funding position.
In the context of this continued turbulence and uncertainty in the financial markets, combined with a deteriorating global economic outlook, the Group has also taken steps to strengthen its capital position in order to provide a buffer against further shocks arising from the financial systems and to ensure that it remains competitive. On 15 January 2009, in conjunction with the takeover of the Group by Lloyds TSB Group plc (Note 24), the Group raised £11,345m (net after costs) in preference and ordinary share capital.
On 16 January 2009, following completion of the acquisition of the Group by Lloyds Banking Group plc, the Group became a wholly owned subsidiary and became dependent upon the ultimate parent and its banking subsidiaries for its capital, liquidity and funding needs.
There is a risk despite the substantial measures taken so far by governments, that further deterioration in the markets could occur. In addition the economic conditions in the UK are deteriorating more quickly than previously anticipated placing further strain on the Lloyds Banking Group’s capital resources. The key dependencies on successfully funding the Lloyds Banking Group’s balance sheet include the continued functioning of the money and capital markets at their current levels; the continued access of the Lloyds Banking Group to central bank and Government sponsored liquidity facilities including access to HM Treasury’s credit guarantee scheme and access to the Bank of England’s various facilities; limited further deterioration in the Lloyds Banking Group’s credit ratings; and no significant or sudden withdrawal of deposits resulting in increased reliance on money markets or Government support schemes.
Based upon projections prepared by Lloyds Banking Group plc management which take into account the acquisition on 16 January 2009 of the Group (Note 24) together with the Lloyds Banking Group’s current ability to fund in the market and the assumption that announced Government sponsored schemes will continue to be available, the directors are satisfied that the Company and the Group have adequate resources to continue in business for the foreseeable future. The Group has received confirmation that it is the current intention of Lloyds Banking Group plc to ensure that the Company and its subsidiaries should have at all times for the foreseeable future access to adequate resources to continue to trade and meet their liabilities as they fall due. Accordingly, the financial statements of the Company and the Group have been prepared on a going concern basis.
b) Section 240 Statement The financial information for the year ended 31 December 2008 does not constitute the company's statutory accounts for that financial year within the meaning of section 240 of the Companies Act 1985 but is derived from the 2008 Annual Report & Accounts. Those accounts, which were prepared in accordance with International Financial Reporting Standards ('IFRS') and interpretations issued by the International Financial Reporting Interpretations Committee ('IFRIC') as adopted by the European Union were approved by the Board of Directors on 26 February 2009 and will be delivered to the Registrar of Companies in due course. Those accounts have been reported on by the company's auditors, their report is unqualified and does not contain statements under Section 237(2) or (3) of the Companies Act 1985.
c) Accounting Policies There have been no significant changes to the accounting policies as described in the HBOS plc Annual Report & Accounts 2007 (‘HBOS ARA 2007’), except Amendments to IAS 39 'Financial Instruments: Recognition and Measurement' and IFRS 7 'Financial Instruments: Disclosures', which are applicable for the year end 31 December 2008 and are relevant to the Group. The disclosures associated with these Amendments are set out in Note 13 and in the Treasury Business Review.
Financial Information HBOS plc
Preliminary Results 2008 64
In addition the Group is adopting the following pronouncements, all of which are applicable to the Group for the financial year to 31 December 2008: IFRIC 11 'Group and Treasury Share Transactions'; IFRIC 12 'Service Concession Arrangements' (not adopted by the European Union at the date of preparation of
the financial statements); and IFRIC 14 'The Limit on a Defined Benefit Asset, Minimum Funding Requirements and their Interaction'.
The application of these pronouncements has not affected the Group's consolidated financial statements.
Critical Accounting Judgements and Estimates The preparation of financial statements requires management to make judgements, estimates and assumptions that affect the reported amounts of assets, liabilities, income and expenses. Due to the inherent uncertainty in making estimates, actual results reported in future periods may be based on amounts which differ from those estimates. Judgements, estimates and assumptions are continually evaluated and are based on historical experience and other factors, including expectations of future events that are believed to be reasonable under the circumstances. Revisions to accounting estimates are recognised in the period in which the estimate is revised and in any future periods affected.
a) Critical Accounting Judgements
Designation of Financial Instruments The Group has classified its financial instruments in accordance with IAS 39 ‘Financial Instruments: Recognition and Measurement’. In some instances the classification is prescribed whilst in others the Group is able to exercise judgement in determining the classification as follows:
- Non-derivative financial assets, other than those held for trading, where there is no active market and which have fixed or determinable payments are classified as ‘loans and receivables’;
- The Group’s ‘trading’ portfolio is classified as ‘held for trading'. The Group exercises judgement in determining which financial instruments form part of its trading book. This is determined at acquisition by the purpose for which the instrument is acquired;
- The Group exercised judgement when determining that the ongoing market dislocation and deterioration of the world's financial markets that occurred during the third quarter of 2008 was a sufficiently rare circumstance to warrant a reclassification of certain financial assets from 'held for trading' to 'available for sale' for which the Group has the intention and ability to hold these assets for the foreseeable future. The Group also subsequently reclassified certain financial assets from 'available for sale' to 'loans and receivables'. In both cases, the Group has the intention and ability to hold the financial assets for the foreseeable future and the financial assets transferred meet the classification criteria of loans and receivables;
- Derivative instruments are automatically classified as ‘at fair value through the income statement’ unless they form part of an effective hedging relationship;
- Instruments that are deemed by the Group on initial recognition to eliminate a measurement mismatch or where they contain an embedded derivative which is not separated from the host contract are designated on initial recognition as ‘at fair value through the income statement’. In addition portfolios of assets, liabilities or both that are managed and the performance evaluated on a fair value basis in accordance with a documented risk or investment management strategy are designated on initial recognition ‘at fair value through the income statement’.
- In addition the venture capital exemption is taken for investments where significant influence or joint control is present and the investing area operates as a venture capital business. These investments are designated ‘at fair value through the income statement’. This policy is applied consistently across the Group’s portfolios. Judgement is applied when determining whether or not a business area operates as a venture capital business. The judgement is based on consideration of whether, in particular, the primary business activity is investing for current income, capital appreciation or both; whether the investment activities are clearly and objectively distinct from any other activities of the Group; and whether the investee operates as a separate business autonomous from the Group;
- Assets in support of the general insurance and long term assurance businesses are designated by the Group as 'at fair value through the income statement';
Financial Information HBOS plc
Preliminary Results 2008 65
- Investment contracts within the long term assurance business are designated by the Group as 'at fair value through the income statement';
- The Group has chosen not to designate any financial assets as ‘held to maturity’;
- All other financial assets are classified as ‘available for sale’; and
- All other financial liabilities are classified as ‘at amortised cost’.
Active Markets Asset backed securities not traded in an active market are valued using models. An active market is one where prices are readily and regularly available from an exchange, broker, pricing service, industry group or regulator and these prices represent actual and regularly occurring transactions on an arm's length basis. Where there are no regular transactions occurring (significant liquid markets) the market is not described as active. A significant increase in the spread between the amount sellers are 'asking' and buyers are 'bidding' or the presence of a relatively small number of 'bidding' parties, are indicators that a market may be inactive. The determination of whether a market is inactive requires judgement.
More details of the models used to value the securities not traded in an active market are given in the 'fair values' section in critical accounting estimates below.
Impairment of Investment Securities Investment securities are continually reviewed at the specific investment level for impairment. Impairment is recognised when there is objective evidence that a specific financial asset is impaired. Objective evidence of impairment might include a significant or prolonged decline in market value below the original cost of a financial asset and, in the case of debt securities, including those reclassified as ‘loans and receivables’, non-receipt of due interest or principal repayment, a breach of covenant within the security's terms and conditions or a measurable decrease in the estimated future cash flows since their initial recognition.
The disappearance of active markets, declines in market value and ratings downgrades do not in themselves constitute objective evidence of impairment and, unless a default has occurred on a debt security, the determination of whether or not objective evidence of impairment is present at the balance sheet date requires the exercise of management judgement.
Unarranged Overdraft Charges In the absence of a legal obligation, judgement is necessary in determining the existence of a constructive obligation. In respect of the claims made for refunds of unarranged overdraft charges, the judgement of the Group is that there is no constructive obligation pending the outcome of the legal case.
Syndications The Group has elected to treat loans and advances pending syndication as loans and receivables rather than account for them as trading assets. Accordingly these are recognised at the draw down date at the fair value as measured at the commitment date, plus directly attributable and incremental transaction costs.
Deferred Tax Deferred tax assets and liabilities require management judgement in determining the amounts to be recognised. In particular, when assessing the extent to which deferred tax assets should be recognised with consideration given to the timing, nature and level of future taxable income. The recognition of deferred tax assets relating to tax losses carried forward relies on profit projections and taxable profit forecasts prepared by management, where a number of assumptions are required based on the levels of growth in profits and the reversal of deferred tax balances.
b) Critical Accounting Estimates
Fair ValuesThe designation of financial instruments for measurement purposes is set out under the critical accounting judgements above and the valuation methodologies for financial instruments remain as disclosed in the accounting policy section in the HBOS ARA 2007.
Derivatives and other financial instruments classified as at fair value through the income statement or available for sale are recognised at fair value.
Debt securities measured at fair value and not traded in an active market, principally comprising asset backed securities ('ABS') in the Treasury division, are valued using valuation models that include non-market observable inputs. These models use observed issuance prices in related asset classes, market correlations, prepayment
Financial Information HBOS plc
Preliminary Results 2008 66
assumptions and external credit ratings. For each asset class within the ABS portfolio, the implied spread arrived at by using this methodology is applied to the securities within that asset class. Additional assessments are then made on possible deterioration in credit risk for each individual security and on additional liquidity considerations for particular asset classes.
Of the total debt securities carried at fair value on the balance sheet, the fair values of those calculated using models with inputs that are not observable in the market is £3,054m (2007 £17,790m).
For debt securities valuations using non-market observable inputs, the effect of a one hundred basis point move in credit spreads (which based upon experience is the only key sensitivity) would result in a pre-tax movement of £163m (2007 £185m) for assets classified at fair value through the income statement and a post-tax movement of £nil (2007 £(351)m, recognised in equity reserves, on assets classified as available for sale.
On ABS that were valued using models with non-observable market inputs, a £1,056m (2007 £78m) pre-tax negative fair value adjustment was recognised in the income statement within net trading income and a post-tax negative fair value adjustment of £3,572m (2007 £158m) on ABS classified as available for sale was recognised in equity reserves.
Retirement Benefit Obligations The expected cash flows used in the calculation of the defined benefit schemes' liabilities include a number of assumptions around mortality, inflation rates applicable to defined benefits and the average expected service lives of the employees. The selection of these assumptions and the selection of the discount rate have a material impact on the estimation of the pension liabilities. The discount rate used by the Group to calculate the defined benefit scheme liabilities is based upon a blended market yield at the balance sheet date of high quality bonds with a similar duration to that of the schemes' liabilities and is derived on a basis consistent with prior years.
Long Term Assurance Business The estimation of the Group's insurance and investment contracts with discretionary participating features ('DPF') liabilities and related value of in-force ('VIF') assets relies on a number of assumptions in forecasting future experience. The selection of appropriate assumptions requires the application of material judgement and is made with reference to historic trends, taking into account the analysis of actual versus expected experience as well as industry data. The Group also applies significant judgement when selecting the rates of persistency to be used in calculating the value of insurance and investment contracts with DPF and long term assurance contracts.
Effective Interest Rate The Group uses statistical and mathematical models to calculate the effective yield for loans and advances. The Group applies judgement when determining the expected life of these loans. The underlying products usually allow the customer to make early repayment before the contractual maturity date. In estimating the expected life of the loan, the Group takes into account a number of relevant considerations when the asset is initially recognised to estimate the cash flows from early redemptions including the type of product, previous experience of customer behaviour, credit scoring of the customer and anticipated future market conditions. The cash flows are adjusted in the light of actual experience; however the effective interest rate is not reassessed. If the estimated life of the Retail’s portfolio were to increase or decrease by one month then the carrying value of the Retail portfolio would increase or decrease by £6m (2007 £18m) respectively.
Impairment Losses on Loans and Advances The Group regularly reviews its loan portfolios carried at amortised cost to assess for impairment. This review is conducted across all asset types and impairment provisions are established to recognise incurred impairment losses within the loan portfolios. Impairment loss calculations involve the estimation of future cash flows of loans and advances based on observable data at the balance sheet date historical loss experience for assets with similar credit risk characteristics and other factors including, inter alia, future prospects of the customers, value of collateral held and reliability of information. These calculations may be undertaken on either a portfolio basis or individually for individually significant exposures. In applying the portfolio basis the Group makes use of various statistical modelling techniques which are specific to different portfolio types.
The actual amount of the future cash flows and their timing may differ significantly from the assumptions made for the purposes of determining the impairment provisions given the range of asset types, number of customers and current economic conditions. Consequently these allowances can be subject to variation.
Financial Information HBOS plc
Preliminary Results 2008 67
Goodwill Goodwill arises on the acquisition of a business. It is subject to a six monthly impairment review. This compares the recoverable amount, being the higher of a cash-generating unit’s fair value less costs to sell, and its value in use, with the carrying value. When this indicates that the carrying value is not recoverable it is written down through the income statement as goodwill impairment.
The recoverable amount of goodwill carried at 31 December 2008 has been based upon value in use. This calculation uses cash flow projections based upon the five year business plan, where the main assumptions used for planning purposes relate to the current economic outlook and opinions in respect of economic growth, unemployment, property markets, interest rates and credit quality. Cash flows thereafter are extrapolated using a growth rate of 2.2%, reflecting management's view of the expected future long term trend in growth rate of the economies concerned, predominantly being the UK, and the long term performance of the businesses concerned. The pre – tax discount rate used in discounting the projected cash flows has, in view of current credit conditions, been increased to within a range of 14.4% - 15.3% (2007 10-12.2%), reflecting, inter alia, the perceived risks within those businesses.
As at 31 December 2008 the carrying value of goodwill held on the balance sheet is £1,556m (2007 £1,940m). Goodwill has been impaired by £158m during the year. The unprecedented levels of market turmoil have adversely impacted the short-term profitability of the cash generating units. The Group has considered the impact upon the assumptions used and has conducted sensitivity analysis on the impairment tests. For example, an increase in the discount rate to 17% would result in an additional impairment to goodwill of £31m; alternatively if projected cash flows reduced by 20% an additional impairment of £118m would arise.
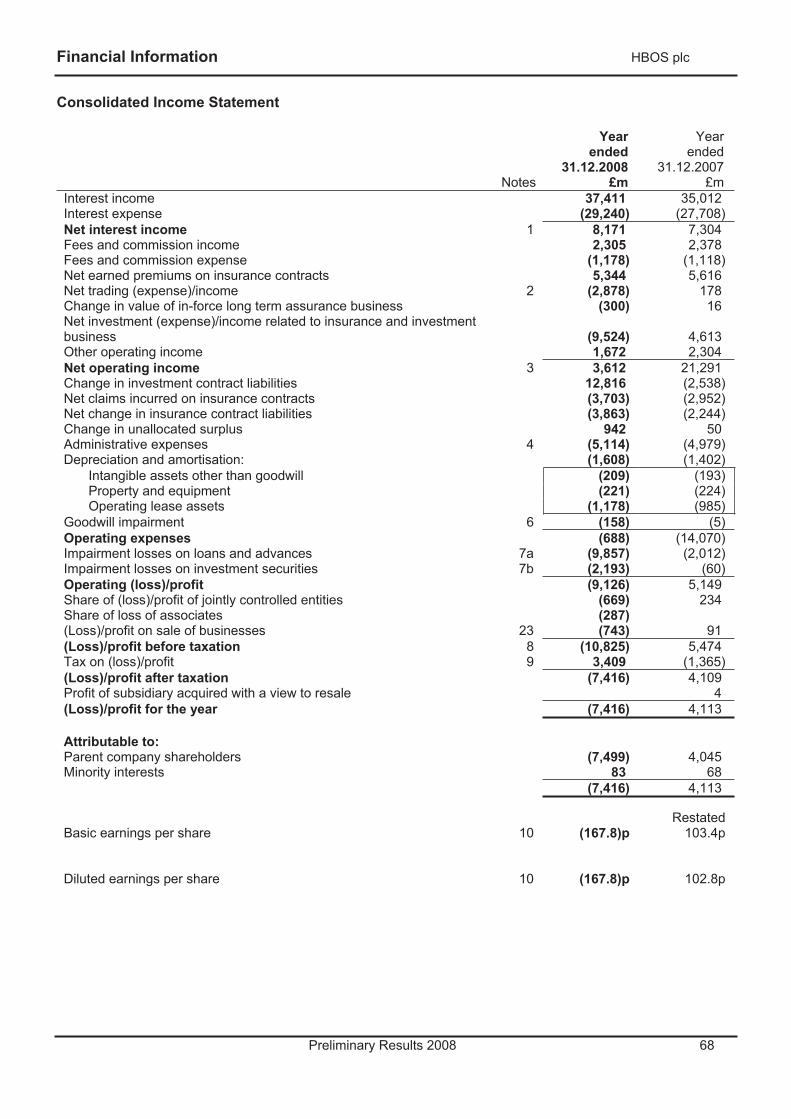
Financial Information HBOS plc
Preliminary Results 2008 68
Consolidated Income Statement
Notes
Yearended
31.12.2008 £m
Yearended
31.12.2007 £m
Interest income 37,411 35,012Interest expense (29,240) (27,708) Net interest income 1 8,171 7,304Fees and commission income 2,305 2,378Fees and commission expense (1,178) (1,118) Net earned premiums on insurance contracts 5,344 5,616Net trading (expense)/income 2 (2,878) 178Change in value of in-force long term assurance business (300) 16Net investment (expense)/income related to insurance and investment business (9,524) 4,613Other operating income 1,672 2,304Net operating income 3 3,612 21,291Change in investment contract liabilities 12,816 (2,538) Net claims incurred on insurance contracts (3,703) (2,952) Net change in insurance contract liabilities (3,863) (2,244) Change in unallocated surplus 942 50Administrative expenses 4 (5,114) (4,979) Depreciation and amortisation: (1,608) (1,402)
Intangible assets other than goodwill (209) (193) Property and equipment (221) (224) Operating lease assets (1,178) (985)
Goodwill impairment 6 (158) (5)Operating expenses (688) (14,070) Impairment losses on loans and advances 7a (9,857) (2,012) Impairment losses on investment securities 7b (2,193) (60) Operating (loss)/profit (9,126) 5,149Share of (loss)/profit of jointly controlled entities (669) 234Share of loss of associates (287) (Loss)/profit on sale of businesses 23 (743) 91(Loss)/profit before taxation 8 (10,825) 5,474Tax on (loss)/profit 9 3,409 (1,365) (Loss)/profit after taxation (7,416) 4,109Profit of subsidiary acquired with a view to resale 4(Loss)/profit for the year (7,416) 4,113
Attributable to: Parent company shareholders (7,499) 4,045Minority interests 83 68
(7,416) 4,113
Restated Basic earnings per share 10 (167.8)p 103.4p
Diluted earnings per share 10 (167.8)p 102.8p
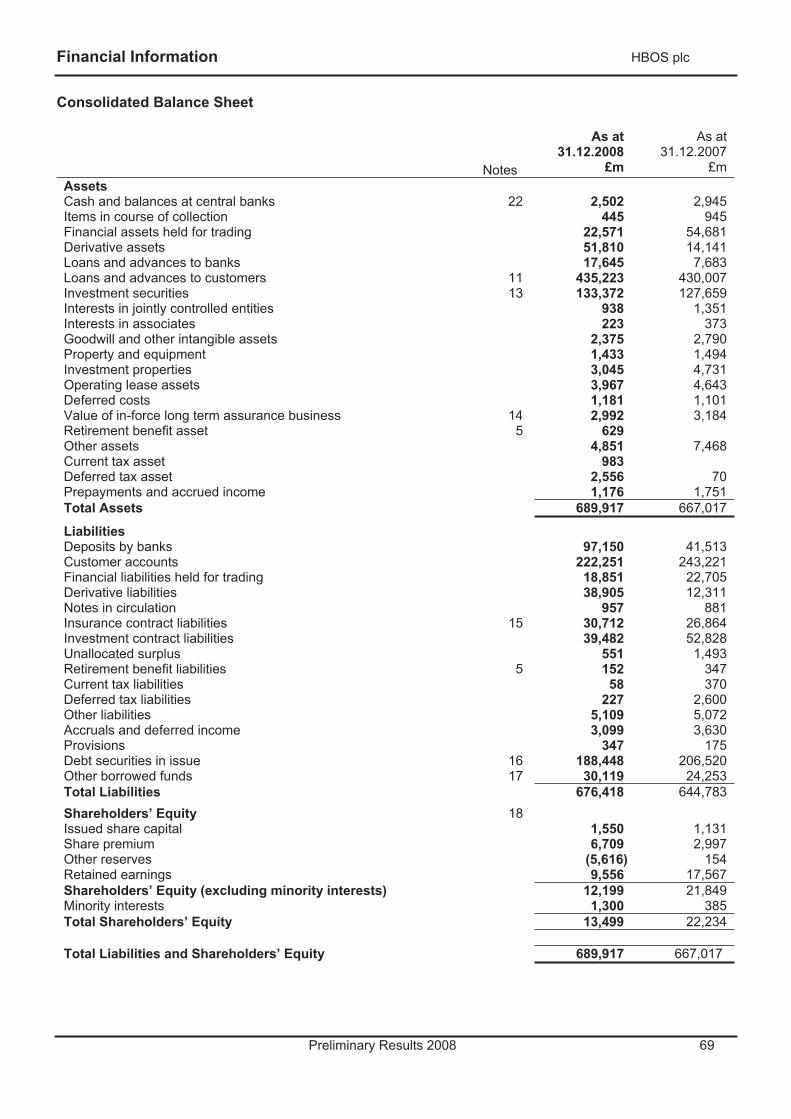
Financial Information HBOS plc
Preliminary Results 2008 69
Consolidated Balance Sheet
Notes
As at31.12.2008
£m
As at 31.12.2007
£mAssets Cash and balances at central banks 22 2,502 2,945Items in course of collection 445 945Financial assets held for trading 22,571 54,681Derivative assets 51,810 14,141Loans and advances to banks 17,645 7,683Loans and advances to customers 11 435,223 430,007 Investment securities 13 133,372 127,659 Interests in jointly controlled entities 938 1,351Interests in associates 223 373Goodwill and other intangible assets 2,375 2,790Property and equipment 1,433 1,494Investment properties 3,045 4,731Operating lease assets 3,967 4,643Deferred costs 1,181 1,101Value of in-force long term assurance business 14 2,992 3,184Retirement benefit asset 5 629Other assets 4,851 7,468Current tax asset 983Deferred tax asset 2,556 70Prepayments and accrued income 1,176 1,751Total Assets 689,917 667,017
LiabilitiesDeposits by banks 97,150 41,513Customer accounts 222,251 243,221 Financial liabilities held for trading 18,851 22,705Derivative liabilities 38,905 12,311Notes in circulation 957 881Insurance contract liabilities 15 30,712 26,864Investment contract liabilities 39,482 52,828Unallocated surplus 551 1,493Retirement benefit liabilities 5 152 347Current tax liabilities 58 370Deferred tax liabilities 227 2,600Other liabilities 5,109 5,072Accruals and deferred income 3,099 3,630Provisions 347 175Debt securities in issue 16 188,448 206,520 Other borrowed funds 17 30,119 24,253Total Liabilities 676,418 644,783 Shareholders’ Equity 18Issued share capital 1,550 1,131Share premium 6,709 2,997Other reserves (5,616) 154Retained earnings 9,556 17,567Shareholders’ Equity (excluding minority interests) 12,199 21,849Minority interests 1,300 385Total Shareholders’ Equity 13,499 22,234
Total Liabilities and Shareholders’ Equity 689,917 667,017
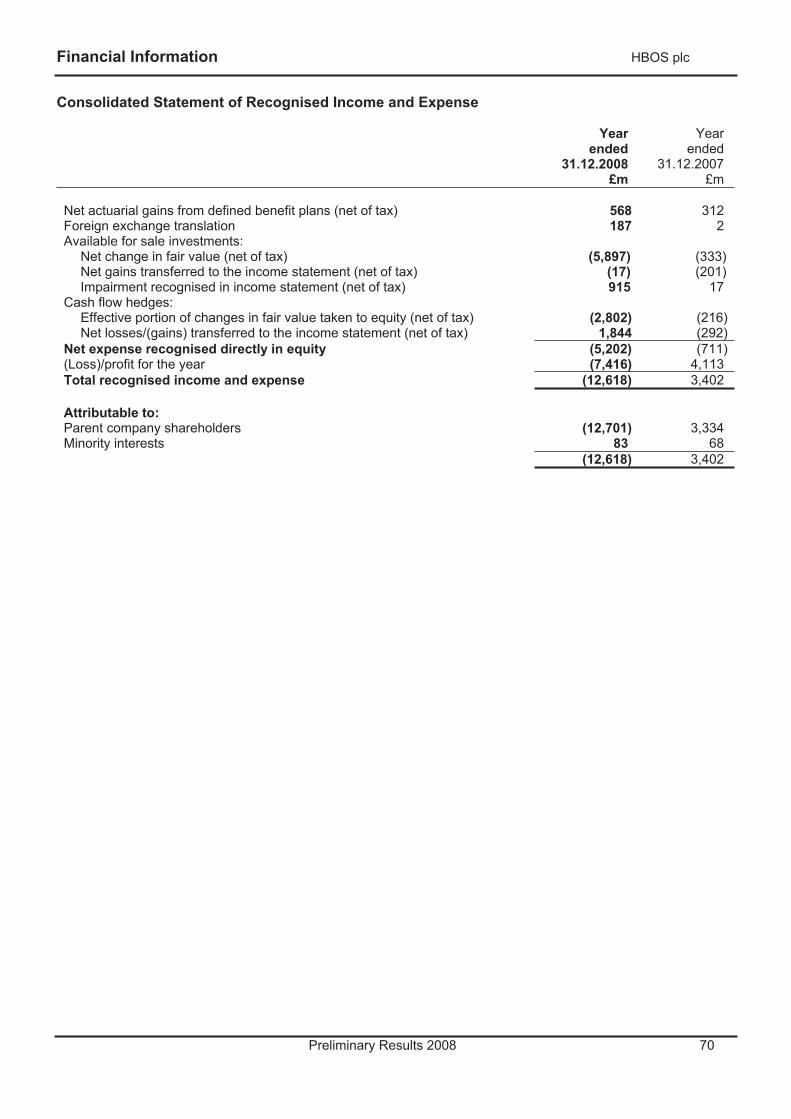
Financial Information HBOS plc
Preliminary Results 2008 70
Consolidated Statement of Recognised Income and Expense
Yearended
31.12.2008 £m
Yearended
31.12.2007 £m
Net actuarial gains from defined benefit plans (net of tax) 568 312Foreign exchange translation 187 2Available for sale investments:
Net change in fair value (net of tax) (5,897) (333) Net gains transferred to the income statement (net of tax) (17) (201) Impairment recognised in income statement (net of tax) 915 17
Cash flow hedges: Effective portion of changes in fair value taken to equity (net of tax) (2,802) (216)Net losses/(gains) transferred to the income statement (net of tax) 1,844 (292)
Net expense recognised directly in equity (5,202) (711)(Loss)/profit for the year (7,416) 4,113Total recognised income and expense (12,618) 3,402
Attributable to: Parent company shareholders (12,701) 3,334Minority interests 83 68
(12,618) 3,402
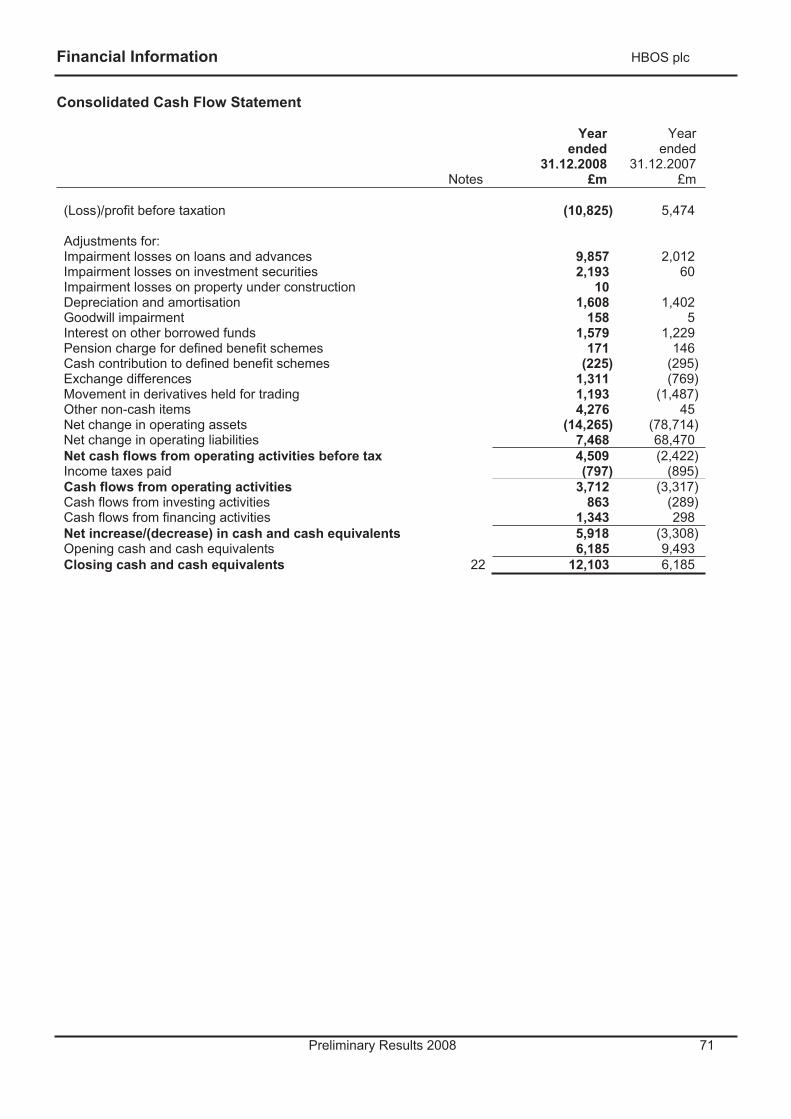
Financial Information HBOS plc
Preliminary Results 2008 71
Consolidated Cash Flow Statement
Notes
Yearended
31.12.2008 £m
Yearended
31.12.2007 £m
(Loss)/profit before taxation (10,825) 5,474
Adjustments for: Impairment losses on loans and advances 9,857 2,012Impairment losses on investment securities 2,193 60Impairment losses on property under construction 10Depreciation and amortisation 1,608 1,402Goodwill impairment 158 5Interest on other borrowed funds 1,579 1,229Pension charge for defined benefit schemes 171 146Cash contribution to defined benefit schemes (225) (295)Exchange differences 1,311 (769)Movement in derivatives held for trading 1,193 (1,487)Other non-cash items 4,276 45Net change in operating assets (14,265) (78,714)Net change in operating liabilities 7,468 68,470Net cash flows from operating activities before tax 4,509 (2,422)Income taxes paid (797) (895)Cash flows from operating activities 3,712 (3,317)Cash flows from investing activities 863 (289)Cash flows from financing activities 1,343 298Net increase/(decrease) in cash and cash equivalents 5,918 (3,308)Opening cash and cash equivalents 6,185 9,493Closing cash and cash equivalents 22 12,103 6,185
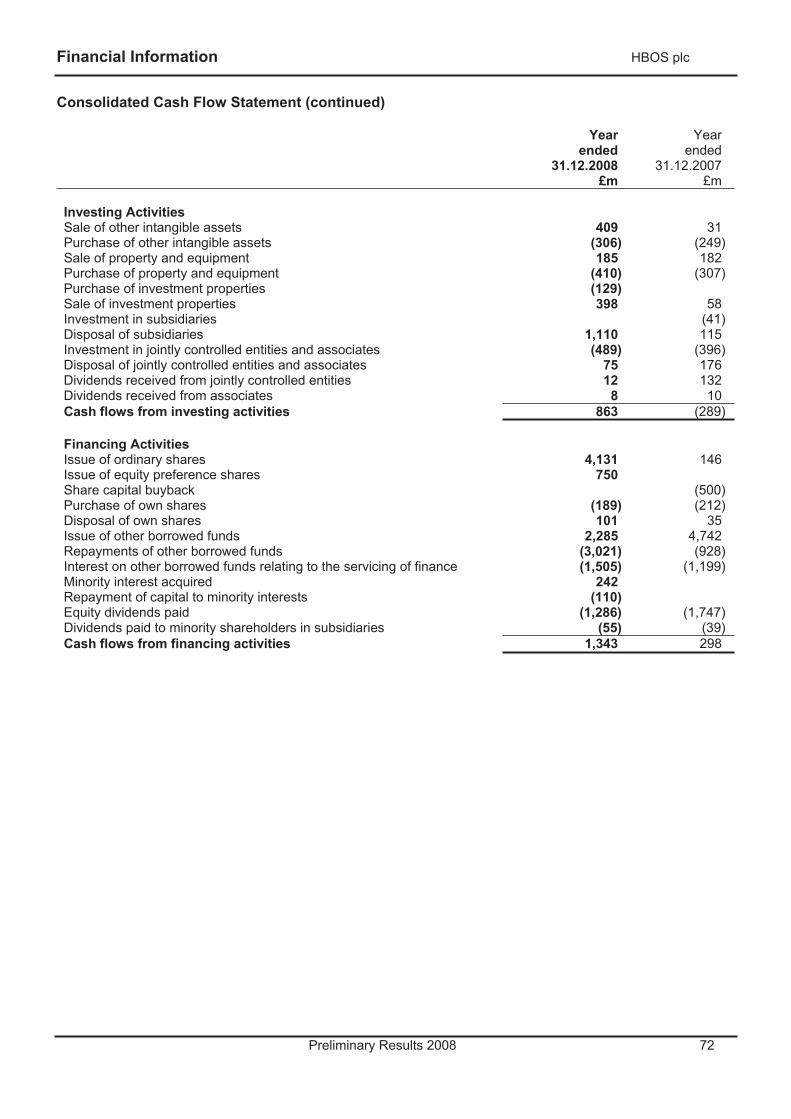
Financial Information HBOS plc
Preliminary Results 2008 72
Consolidated Cash Flow Statement (continued)
Yearended
31.12.2008 £m
Yearended
31.12.2007 £m
Investing Activities Sale of other intangible assets 409 31Purchase of other intangible assets (306) (249) Sale of property and equipment 185 182Purchase of property and equipment (410) (307) Purchase of investment properties (129) Sale of investment properties 398 58Investment in subsidiaries (41) Disposal of subsidiaries 1,110 115Investment in jointly controlled entities and associates (489) (396) Disposal of jointly controlled entities and associates 75 176Dividends received from jointly controlled entities 12 132Dividends received from associates 8 10Cash flows from investing activities 863 (289)
Financing Activities Issue of ordinary shares 4,131 146Issue of equity preference shares 750Share capital buyback (500) Purchase of own shares (189) (212) Disposal of own shares 101 35Issue of other borrowed funds 2,285 4,742Repayments of other borrowed funds (3,021) (928) Interest on other borrowed funds relating to the servicing of finance (1,505) (1,199) Minority interest acquired 242Repayment of capital to minority interests (110) Equity dividends paid (1,286) (1,747) Dividends paid to minority shareholders in subsidiaries (55) (39) Cash flows from financing activities 1,343 298
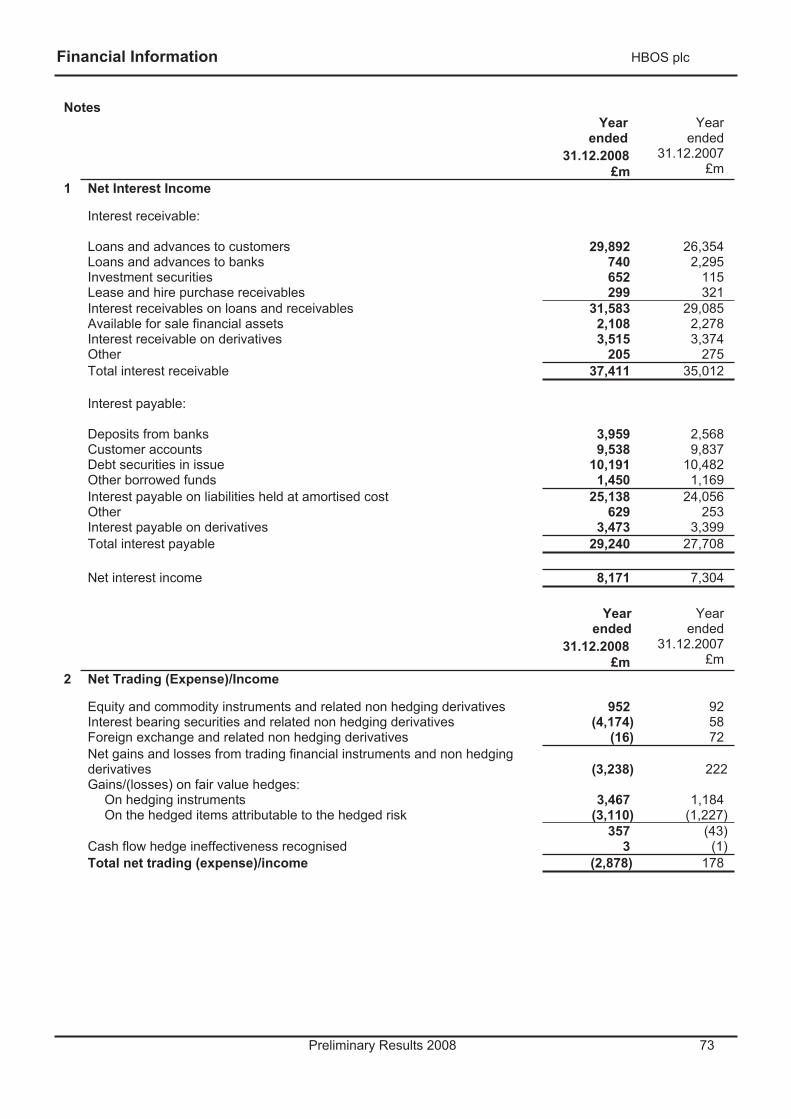
Financial Information HBOS plc
Preliminary Results 2008 73
NotesYear
ended31.12.2008
£m
Yearended
31.12.2007 £m
1 Net Interest Income
Interest receivable:
Loans and advances to customers 29,892 26,354 Loans and advances to banks 740 2,295 Investment securities 652 115 Lease and hire purchase receivables 299 321 Interest receivables on loans and receivables 31,583 29,085 Available for sale financial assets 2,108 2,278 Interest receivable on derivatives 3,515 3,374 Other 205 275 Total interest receivable 37,411 35,012
Interest payable:
Deposits from banks 3,959 2,568 Customer accounts 9,538 9,837 Debt securities in issue 10,191 10,482 Other borrowed funds 1,450 1,169 Interest payable on liabilities held at amortised cost 25,138 24,056 Other 629 253 Interest payable on derivatives 3,473 3,399 Total interest payable 29,240 27,708
Net interest income 8,171 7,304
Yearended
31.12.2008£m
Yearended
31.12.2007 £m
2 Net Trading (Expense)/Income
Equity and commodity instruments and related non hedging derivatives 952 92 Interest bearing securities and related non hedging derivatives (4,174) 58 Foreign exchange and related non hedging derivatives (16) 72 Net gains and losses from trading financial instruments and non hedging
derivatives (3,238) 222 Gains/(losses) on fair value hedges: On hedging instruments 3,467 1,184 On the hedged items attributable to the hedged risk (3,110) (1,227)
357 (43) Cash flow hedge ineffectiveness recognised 3 (1) Total net trading (expense)/income (2,878) 178
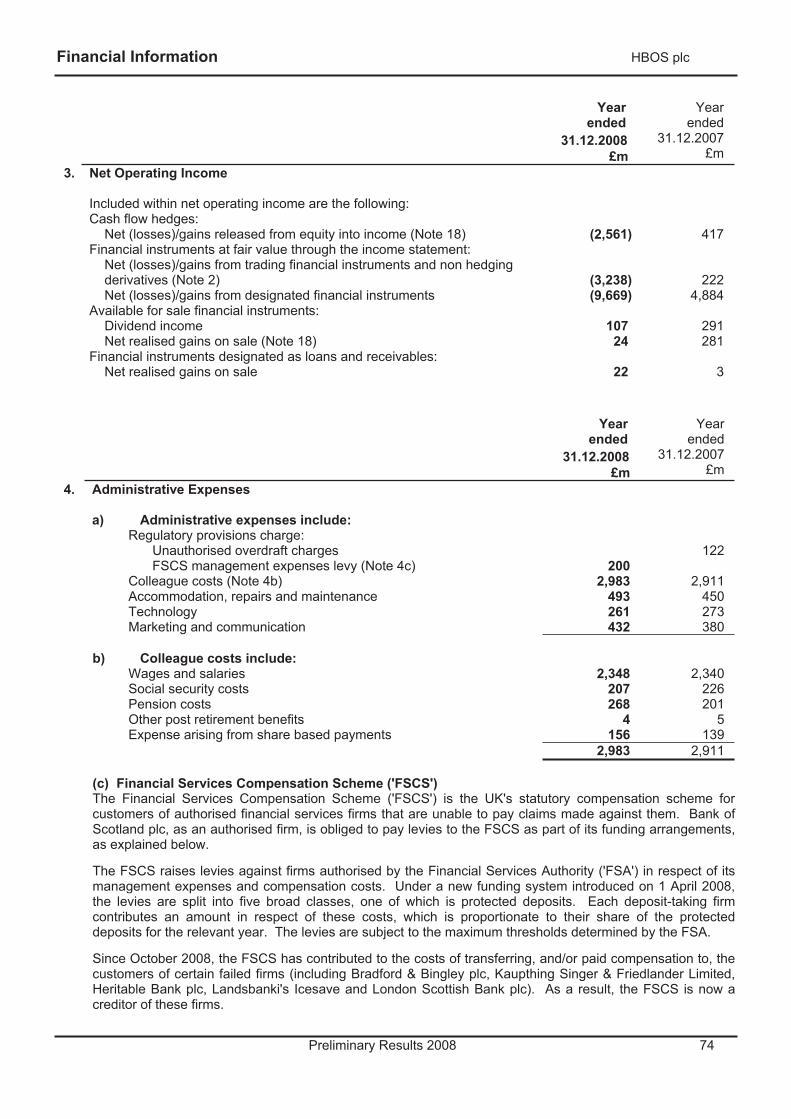
Financial Information HBOS plc
Preliminary Results 2008 74
Yearended
31.12.2008£m
Yearended
31.12.2007 £m
3. Net Operating Income
Included within net operating income are the following: Cash flow hedges: Net (losses)/gains released from equity into income (Note 18) (2,561) 417 Financial instruments at fair value through the income statement: Net (losses)/gains from trading financial instruments and non hedging
derivatives (Note 2) (3,238) 222 Net (losses)/gains from designated financial instruments (9,669) 4,884 Available for sale financial instruments: Dividend income 107 291 Net realised gains on sale (Note 18) 24 281 Financial instruments designated as loans and receivables: Net realised gains on sale 22 3
Yearended
31.12.2008£m
Yearended
31.12.2007 £m
4. Administrative Expenses
a) Administrative expenses include: Regulatory provisions charge: Unauthorised overdraft charges 122 FSCS management expenses levy (Note 4c) 200 Colleague costs (Note 4b) 2,983 2,911 Accommodation, repairs and maintenance 493 450 Technology 261 273 Marketing and communication 432 380
b) Colleague costs include: Wages and salaries 2,348 2,340 Social security costs 207 226 Pension costs 268 201 Other post retirement benefits 4 5 Expense arising from share based payments 156 139
2,983 2,911
(c) Financial Services Compensation Scheme ('FSCS') The Financial Services Compensation Scheme ('FSCS') is the UK's statutory compensation scheme for customers of authorised financial services firms that are unable to pay claims made against them. Bank of Scotland plc, as an authorised firm, is obliged to pay levies to the FSCS as part of its funding arrangements, as explained below.
The FSCS raises levies against firms authorised by the Financial Services Authority ('FSA') in respect of its management expenses and compensation costs. Under a new funding system introduced on 1 April 2008, the levies are split into five broad classes, one of which is protected deposits. Each deposit-taking firm contributes an amount in respect of these costs, which is proportionate to their share of the protected deposits for the relevant year. The levies are subject to the maximum thresholds determined by the FSA.
Since October 2008, the FSCS has contributed to the costs of transferring, and/or paid compensation to, the customers of certain failed firms (including Bradford & Bingley plc, Kaupthing Singer & Friedlander Limited, Heritable Bank plc, Landsbanki's Icesave and London Scottish Bank plc). As a result, the FSCS is now a creditor of these firms.
Financial Information HBOS plc
Preliminary Results 2008 75
To fund these activities, the FSCS has obtained interest-only finance from HM Treasury of £19.7bn (as at 16 December 2008), which is due to be refinanced in 2011. The FSCS expects the amounts owed to it by failed firms to be reduced as assets are realised or other payments are made to creditors. In turn, this will enable the FSCS to reduce its borrowings from HM Treasury. In the meantime, the FSCS will need to meet its anticipated obligations in respect of interest payments on its borrowings through management expenses levies on authorised firms.
The FSA, on behalf of the FSCS, has issued guidance regarding the levies to be made by the FSCS in 2009. This guidance indicates that the FSCS is expected to raise the next levy before 31 March 2009 and that the annual limit on the FSCS management expenses levy for 2008/9 has been set at £1bn. HBOS has accrued a charge of £200m in respect of forecast management expenses levies for the levy years 2008/2009 and 2009/2010 that are based upon its share of protected deposits as at 31 December 2007 and 2008 respectively.
When the existing borrowing with HM Treasury is refinanced in 2011, a repayment schedule for the outstanding principal will be agreed between HM Treasury and the FSCS, after which the FSCS will raise compensation costs levies against firms in respect of these amounts. These levies could be significant. However, no provision has been made for these costs to date as their amount is unknown and is not expected to be quantifiable until 2011 at the earliest.
5. Retirement Benefit Obligations The defined benefit and defined contribution pension schemes, as well as defined benefit post retirement
medical and concessionary mortgage plans, have not changed in the current year and remain as described in the Group's 2007 financial statements.
The Group’s IAS19 pension surplus across all defined benefit post employment plans as at 31 December 2008 comprises an asset of £629m and a deficit of £152m (gross of deferred tax) giving a net surplus of £477m. As at 31 December 2007, the IAS19 position was a deficit of £347m (gross of deferred tax).
The primary reason for the improvement is due to an increase in the discount rate used to value liabilities to 6.25% (from 5.7% at 31 December 2007), reflecting a significant increase in the yields available on AA-rate corporate bonds. There is also a decrease in inflation over the period to 3.0% (from 3.4% at 31 December 2007) so that the net discount rate has increased by 0.95%. This increase in net discount rate causes the value of liabilities to decrease.
There has also been a fall in asset values over the period, although the loss from this is lower than the gain from the decrease in liabilities.
The impact of decreasing the discount rate by 0.1% would be to increase the defined benefit liabilities at 31 December 2008 by around 2.3% and the impact of increasing the inflation rate assumption by 0.1% would be to increase the defined benefit liabilities by around 2.3%.
6. Goodwill Impairment The primary component of goodwill disposed of comprises £240m in respect of the sale of Bank of Western Australia Ltd and St Andrews Australia Pty Ltd to Commonwealth Bank of Australia (see Note 23).
The Group carries out semi-annual and, if necessary, other impairment reviews of cash-generating units to which goodwill is allocated as described in the accounting policy on goodwill. The critical accounting estimate in respect of goodwill explains the assumptions used and sensitivity of the impairment testing.
The goodwill impairment of £158m principally comprises:
£72m being the full write-down of goodwill held in respect of the acquisition of the ICC business banking division in Ireland and £50m being the write-down of goodwill relating to a specialist area of the UK credit card business to a recoverable amount, based on a value in use, of £20m. The write-downs have been triggered principally by deteriorating economic conditions.
Cumulative impairment losses charged to the income statement total £218m (2007 £60m, 2006 £55m and 2005 £nil).
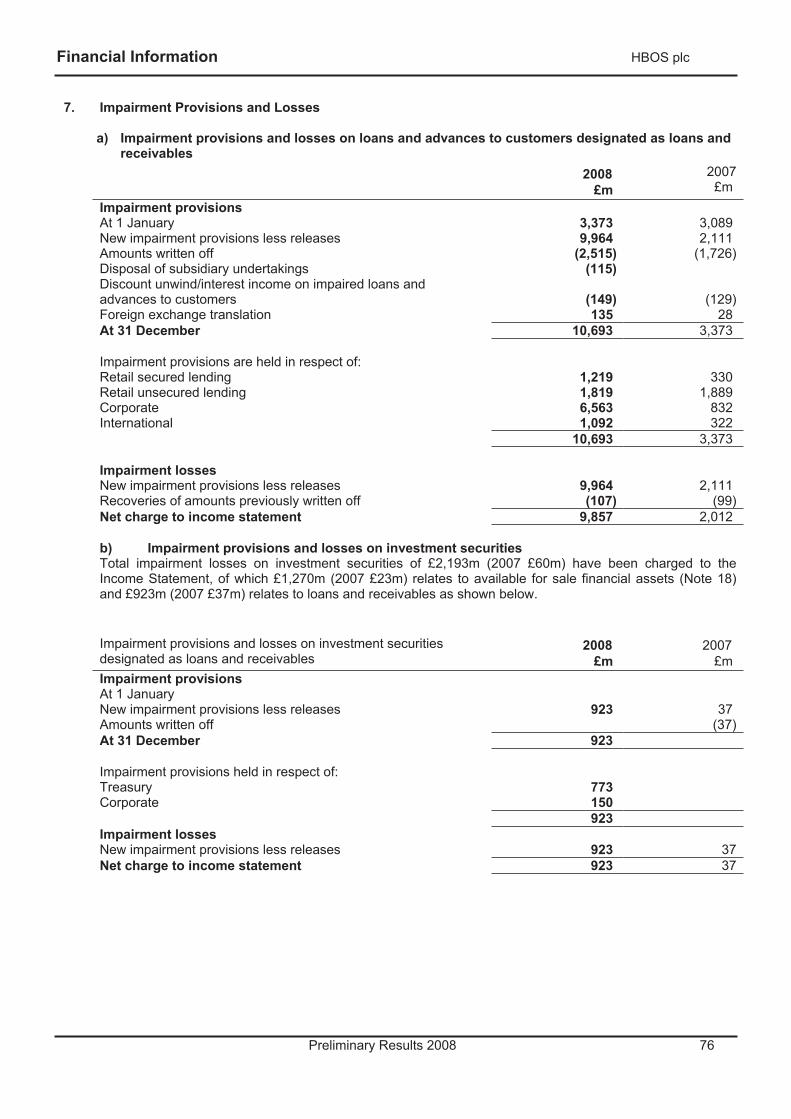
Financial Information HBOS plc
Preliminary Results 2008 76
7. Impairment Provisions and Losses
a) Impairment provisions and losses on loans and advances to customers designated as loans and receivables
2008£m
2007£m
Impairment provisions At 1 January 3,373 3,089 New impairment provisions less releases 9,964 2,111 Amounts written off (2,515) (1,726) Disposal of subsidiary undertakings (115) Discount unwind/interest income on impaired loans and
advances to customers (149) (129) Foreign exchange translation 135 28 At 31 December 10,693 3,373
Impairment provisions are held in respect of: Retail secured lending 1,219 330 Retail unsecured lending 1,819 1,889 Corporate 6,563 832 International 1,092 322
10,693 3,373
Impairment losses New impairment provisions less releases 9,964 2,111 Recoveries of amounts previously written off (107) (99) Net charge to income statement 9,857 2,012
b) Impairment provisions and losses on investment securities Total impairment losses on investment securities of £2,193m (2007 £60m) have been charged to the Income Statement, of which £1,270m (2007 £23m) relates to available for sale financial assets (Note 18) and £923m (2007 £37m) relates to loans and receivables as shown below.
Impairment provisions and losses on investment securities designated as loans and receivables
2008£m
2007£m
Impairment provisions At 1 January New impairment provisions less releases 923 37 Amounts written off (37) At 31 December 923
Impairment provisions held in respect of: Treasury 773Corporate 150
923 Impairment losses
New impairment provisions less releases 923 37 Net charge to income statement 923 37
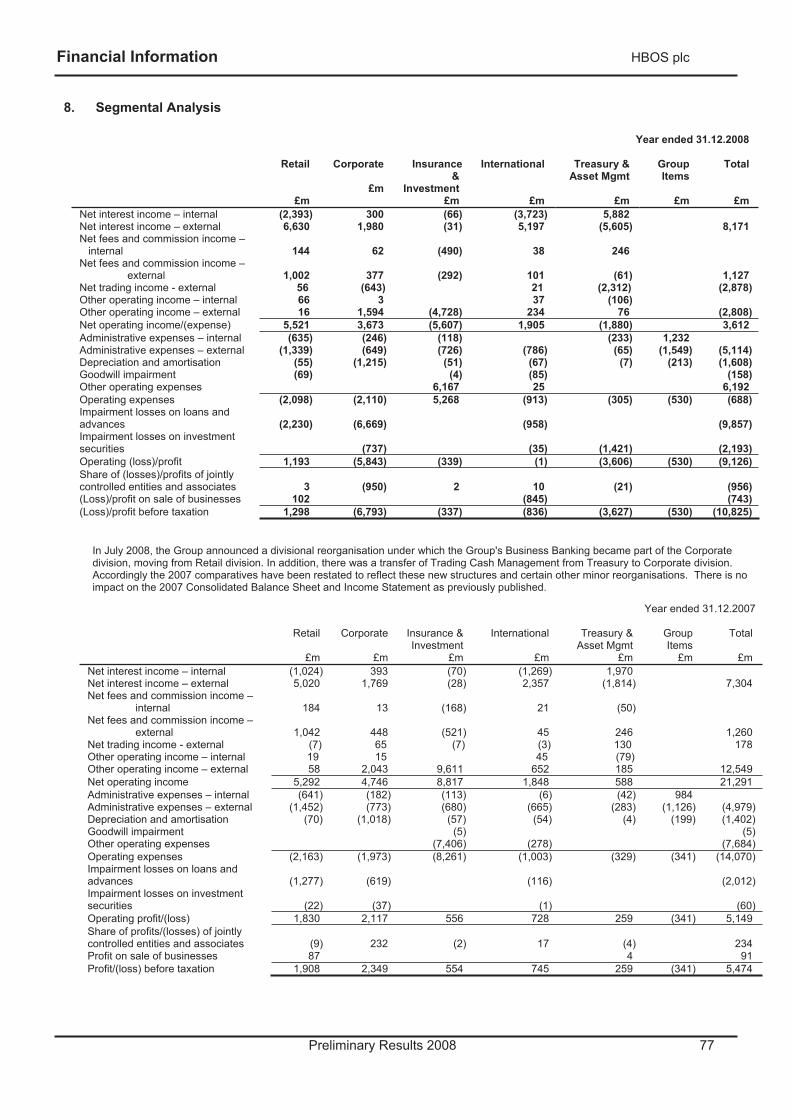
Financial Information HBOS plc
Preliminary Results 2008 77
8. Segmental Analysis
Year ended 31.12.2008
Retail
£m
Corporate
£m
Insurance &
Investment £m
International
£m
Treasury & Asset Mgmt
£m
Group Items
£m
Total
£m Net interest income – internal (2,393) 300 (66) (3,723) 5,882 Net interest income – external 6,630 1,980 (31) 5,197 (5,605) 8,171 Net fees and commission income –
internal 144 62 (490) 38 246 Net fees and commission income –
external 1,002 377 (292) 101 (61) 1,127 Net trading income - external 56 (643) 21 (2,312) (2,878) Other operating income – internal 66 3 37 (106) Other operating income – external 16 1,594 (4,728) 234 76 (2,808) Net operating income/(expense) 5,521 3,673 (5,607) 1,905 (1,880) 3,612 Administrative expenses – internal (635) (246) (118) (233) 1,232 Administrative expenses – external (1,339) (649) (726) (786) (65) (1,549) (5,114) Depreciation and amortisation (55) (1,215) (51) (67) (7) (213) (1,608) Goodwill impairment (69) (4) (85) (158) Other operating expenses 6,167 25 6,192 Operating expenses (2,098) (2,110) 5,268 (913) (305) (530) (688) Impairment losses on loans and
advances (2,230) (6,669) (958) (9,857) Impairment losses on investment
securities (737) (35) (1,421) (2,193) Operating (loss)/profit 1,193 (5,843) (339) (1) (3,606) (530) (9,126) Share of (losses)/profits of jointly
controlled entities and associates 3 (950) 2 10 (21) (956) (Loss)/profit on sale of businesses 102 (845) (743) (Loss)/profit before taxation 1,298 (6,793) (337) (836) (3,627) (530) (10,825)
In July 2008, the Group announced a divisional reorganisation under which the Group's Business Banking became part of the Corporate division, moving from Retail division. In addition, there was a transfer of Trading Cash Management from Treasury to Corporate division. Accordingly the 2007 comparatives have been restated to reflect these new structures and certain other minor reorganisations. There is no impact on the 2007 Consolidated Balance Sheet and Income Statement as previously published.
Year ended 31.12.2007
Retail
£m
Corporate
£m
Insurance &Investment
£m
International
£m
Treasury & Asset Mgmt
£m
Group Items
£m
Total
£m Net interest income – internal (1,024) 393 (70) (1,269) 1,970 Net interest income – external 5,020 1,769 (28) 2,357 (1,814) 7,304 Net fees and commission income –
internal 184 13 (168) 21 (50) Net fees and commission income –
external 1,042 448 (521) 45 246 1,260 Net trading income - external (7) 65 (7) (3) 130 178 Other operating income – internal 19 15 45 (79) Other operating income – external 58 2,043 9,611 652 185 12,549 Net operating income 5,292 4,746 8,817 1,848 588 21,291 Administrative expenses – internal (641) (182) (113) (6) (42) 984 Administrative expenses – external (1,452) (773) (680) (665) (283) (1,126) (4,979) Depreciation and amortisation (70) (1,018) (57) (54) (4) (199) (1,402) Goodwill impairment (5) (5) Other operating expenses (7,406) (278) (7,684) Operating expenses (2,163) (1,973) (8,261) (1,003) (329) (341) (14,070) Impairment losses on loans and
advances (1,277) (619) (116) (2,012) Impairment losses on investment
securities (22) (37) (1) (60) Operating profit/(loss) 1,830 2,117 556 728 259 (341) 5,149 Share of profits/(losses) of jointly
controlled entities and associates (9) 232 (2) 17 (4) 234 Profit on sale of businesses 87 4 91 Profit/(loss) before taxation 1,908 2,349 554 745 259 (341) 5,474
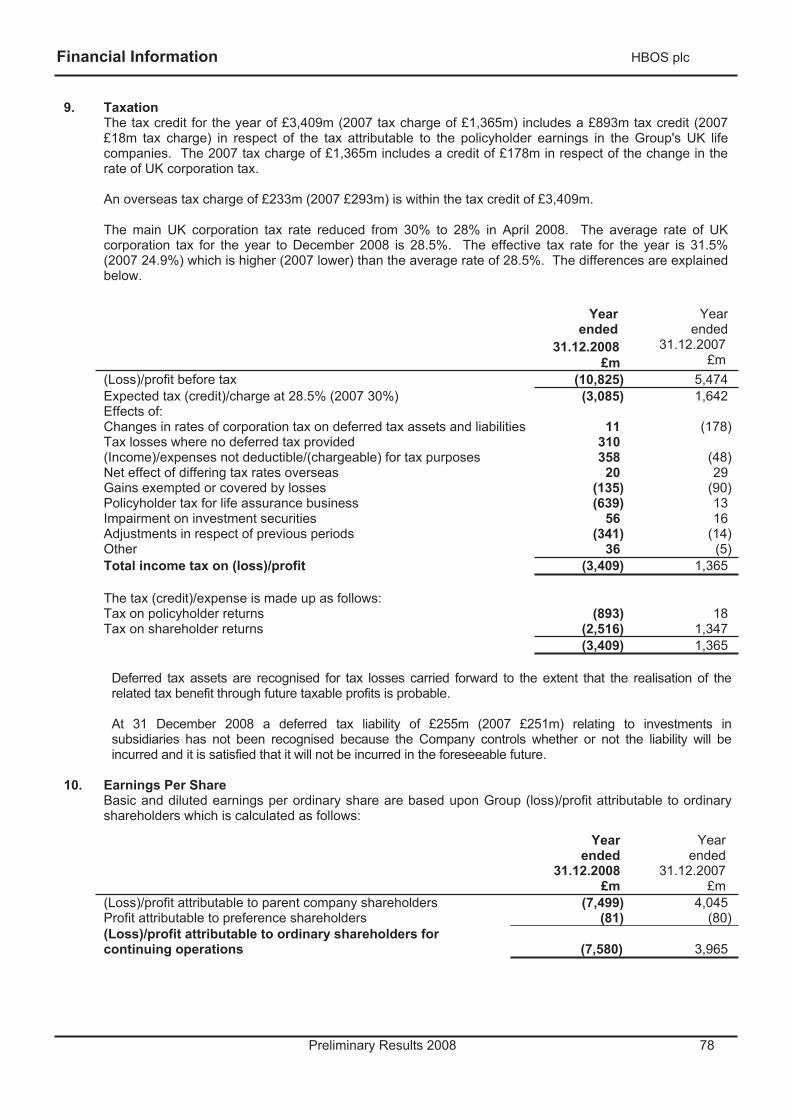
Financial Information HBOS plc
Preliminary Results 2008 78
9. Taxation The tax credit for the year of £3,409m (2007 tax charge of £1,365m) includes a £893m tax credit (2007
£18m tax charge) in respect of the tax attributable to the policyholder earnings in the Group's UK life companies. The 2007 tax charge of £1,365m includes a credit of £178m in respect of the change in the rate of UK corporation tax.
An overseas tax charge of £233m (2007 £293m) is within the tax credit of £3,409m.
The main UK corporation tax rate reduced from 30% to 28% in April 2008. The average rate of UK corporation tax for the year to December 2008 is 28.5%. The effective tax rate for the year is 31.5% (2007 24.9%) which is higher (2007 lower) than the average rate of 28.5%. The differences are explained below.
Yearended
31.12.2008£m
Yearended
31.12.2007 £m
(Loss)/profit before tax (10,825) 5,474 Expected tax (credit)/charge at 28.5% (2007 30%) (3,085) 1,642
Effects of: Changes in rates of corporation tax on deferred tax assets and liabilities 11 (178) Tax losses where no deferred tax provided 310 (Income)/expenses not deductible/(chargeable) for tax purposes 358 (48) Net effect of differing tax rates overseas 20 29 Gains exempted or covered by losses (135) (90) Policyholder tax for life assurance business (639) 13 Impairment on investment securities 56 16 Adjustments in respect of previous periods (341) (14) Other 36 (5)
Total income tax on (loss)/profit (3,409) 1,365
The tax (credit)/expense is made up as follows: Tax on policyholder returns (893) 18 Tax on shareholder returns (2,516) 1,347
(3,409) 1,365
Deferred tax assets are recognised for tax losses carried forward to the extent that the realisation of the related tax benefit through future taxable profits is probable.
At 31 December 2008 a deferred tax liability of £255m (2007 £251m) relating to investments in subsidiaries has not been recognised because the Company controls whether or not the liability will be incurred and it is satisfied that it will not be incurred in the foreseeable future.
10. Earnings Per ShareBasic and diluted earnings per ordinary share are based upon Group (loss)/profit attributable to ordinary shareholders which is calculated as follows:
Yearended
31.12.2008 £m
Yearended
31.12.2007 £m
(Loss)/profit attributable to parent company shareholders (7,499) 4,045 Profit attributable to preference shareholders (81) (80) (Loss)/profit attributable to ordinary shareholders for
continuing operations (7,580) 3,965
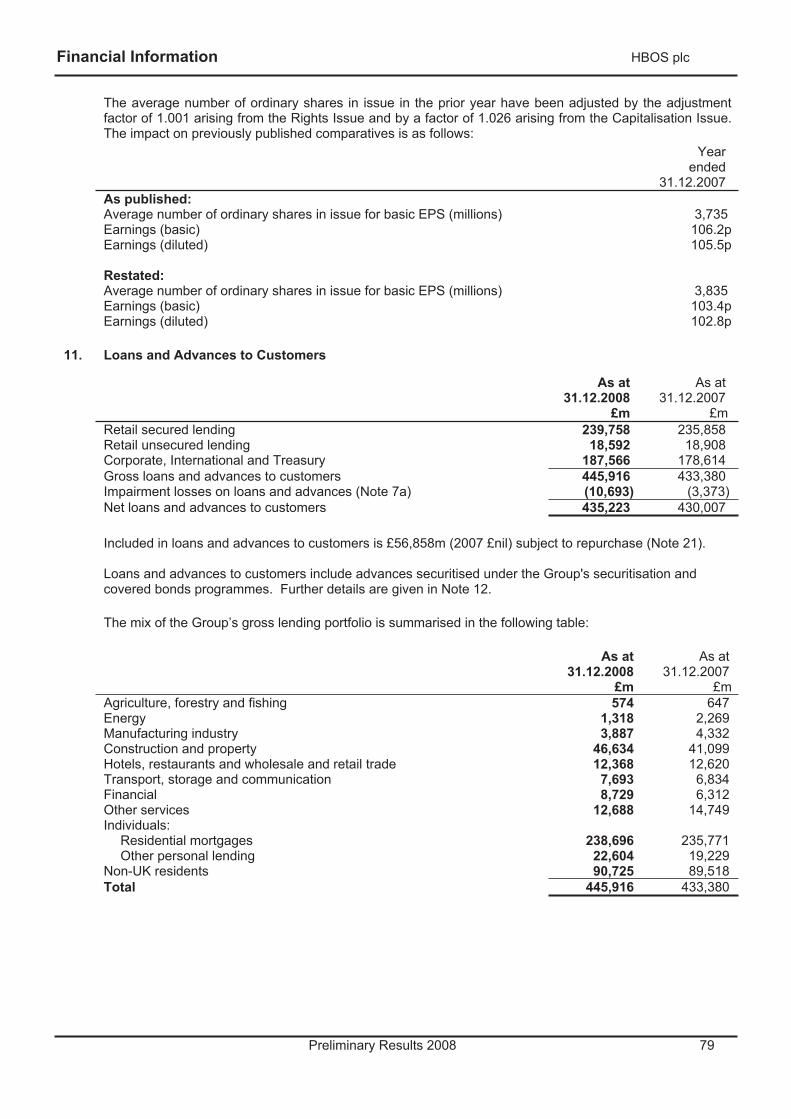
Financial Information HBOS plc
Preliminary Results 2008 79
The average number of ordinary shares in issue in the prior year have been adjusted by the adjustment factor of 1.001 arising from the Rights Issue and by a factor of 1.026 arising from the Capitalisation Issue. The impact on previously published comparatives is as follows:
Year ended
31.12.2007 As published:
Average number of ordinary shares in issue for basic EPS (millions) 3,735 Earnings (basic) 106.2p
Earnings (diluted) 105.5p
Restated: Average number of ordinary shares in issue for basic EPS (millions) 3,835 Earnings (basic) 103.4p Earnings (diluted) 102.8p
11. Loans and Advances to Customers
As at31.12.2008
£m
As at 31.12.2007
£m Retail secured lending 239,758 235,858 Retail unsecured lending 18,592 18,908 Corporate, International and Treasury 187,566 178,614 Gross loans and advances to customers 445,916 433,380 Impairment losses on loans and advances (Note 7a) (10,693) (3,373) Net loans and advances to customers 435,223 430,007
Included in loans and advances to customers is £56,858m (2007 £nil) subject to repurchase (Note 21).
Loans and advances to customers include advances securitised under the Group's securitisation and covered bonds programmes. Further details are given in Note 12.
The mix of the Group’s gross lending portfolio is summarised in the following table:
As at 31.12.2008
£m
As at 31.12.2007
£m Agriculture, forestry and fishing 574 647 Energy 1,318 2,269 Manufacturing industry 3,887 4,332 Construction and property 46,634 41,099 Hotels, restaurants and wholesale and retail trade 12,368 12,620 Transport, storage and communication 7,693 6,834 Financial 8,729 6,312 Other services 12,688 14,749 Individuals: Residential mortgages 238,696 235,771 Other personal lending 22,604 19,229 Non-UK residents 90,725 89,518 Total 445,916 433,380
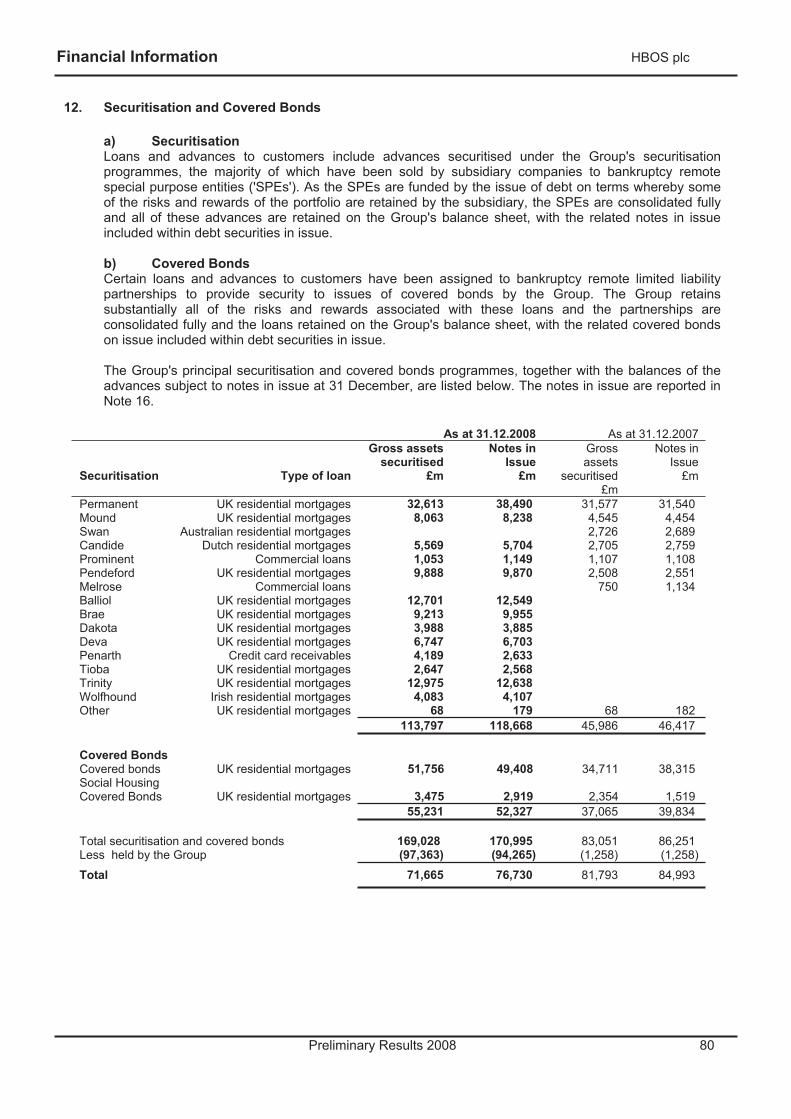
Financial Information HBOS plc
Preliminary Results 2008 80
12. Securitisation and Covered Bonds
a) Securitisation Loans and advances to customers include advances securitised under the Group's securitisation programmes, the majority of which have been sold by subsidiary companies to bankruptcy remote special purpose entities ('SPEs'). As the SPEs are funded by the issue of debt on terms whereby some of the risks and rewards of the portfolio are retained by the subsidiary, the SPEs are consolidated fully and all of these advances are retained on the Group's balance sheet, with the related notes in issue included within debt securities in issue.
b) Covered Bonds Certain loans and advances to customers have been assigned to bankruptcy remote limited liability partnerships to provide security to issues of covered bonds by the Group. The Group retains substantially all of the risks and rewards associated with these loans and the partnerships are consolidated fully and the loans retained on the Group's balance sheet, with the related covered bonds on issue included within debt securities in issue.
The Group's principal securitisation and covered bonds programmes, together with the balances of the advances subject to notes in issue at 31 December, are listed below. The notes in issue are reported in Note 16.
As at 31.12.2008 As at 31.12.2007
Securitisation Type of loan
Gross assets securitised
£m
Notes in Issue
£m
Grossassets
securitised £m
Notes in Issue
£m
Permanent UK residential mortgages 32,613 38,490 31,577 31,540 Mound UK residential mortgages 8,063 8,238 4,545 4,454 Swan Australian residential mortgages 2,726 2,689 Candide Dutch residential mortgages 5,569 5,704 2,705 2,759 Prominent Commercial loans 1,053 1,149 1,107 1,108 Pendeford UK residential mortgages 9,888 9,870 2,508 2,551 Melrose Commercial loans 750 1,134 Balliol UK residential mortgages 12,701 12,549 Brae UK residential mortgages 9,213 9,955 Dakota UK residential mortgages 3,988 3,885 Deva UK residential mortgages 6,747 6,703 Penarth Credit card receivables 4,189 2,633 Tioba UK residential mortgages 2,647 2,568 Trinity UK residential mortgages 12,975 12,638 Wolfhound Irish residential mortgages 4,083 4,107 Other UK residential mortgages 68 179 68 182
113,797 118,668 45,986 46,417
Covered Bonds Covered bonds UK residential mortgages 51,756 49,408 34,711 38,315 Social Housing Covered Bonds UK residential mortgages 3,475 2,919 2,354 1,519
55,231 52,327 37,065 39,834 Total securitisation and covered bonds 169,028 170,995 83,051 86,251 Less held by the Group (97,363) (94,265) (1,258) (1,258)
Total 71,665 76,730 81,793 84,993
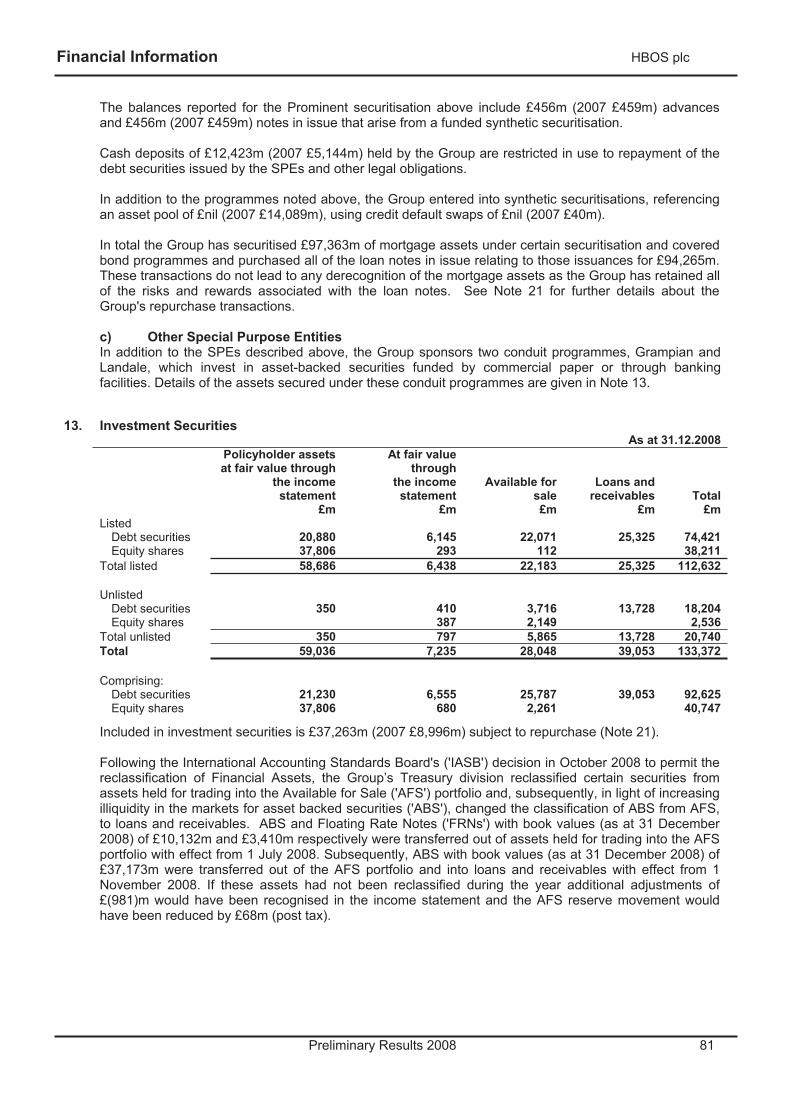
Financial Information HBOS plc
Preliminary Results 2008 81
The balances reported for the Prominent securitisation above include £456m (2007 £459m) advances and £456m (2007 £459m) notes in issue that arise from a funded synthetic securitisation.
Cash deposits of £12,423m (2007 £5,144m) held by the Group are restricted in use to repayment of the debt securities issued by the SPEs and other legal obligations.
In addition to the programmes noted above, the Group entered into synthetic securitisations, referencing an asset pool of £nil (2007 £14,089m), using credit default swaps of £nil (2007 £40m).
In total the Group has securitised £97,363m of mortgage assets under certain securitisation and covered bond programmes and purchased all of the loan notes in issue relating to those issuances for £94,265m. These transactions do not lead to any derecognition of the mortgage assets as the Group has retained all of the risks and rewards associated with the loan notes. See Note 21 for further details about the Group's repurchase transactions.
c) Other Special Purpose Entities In addition to the SPEs described above, the Group sponsors two conduit programmes, Grampian and Landale, which invest in asset-backed securities funded by commercial paper or through banking facilities. Details of the assets secured under these conduit programmes are given in Note 13.
13. Investment Securities As at 31.12.2008
Policyholder assets at fair value through
the income statement
£m
At fair value through
the income statement
£m
Available for sale£m
Loans and receivables
£mTotal
£mListed
Debt securities 20,880 6,145 22,071 25,325 74,421 Equity shares 37,806 293 112 38,211
Total listed 58,686 6,438 22,183 25,325 112,632
Unlisted Debt securities 350 410 3,716 13,728 18,204 Equity shares 387 2,149 2,536
Total unlisted 350 797 5,865 13,728 20,740 Total 59,036 7,235 28,048 39,053 133,372
Comprising:
Debt securities 21,230 6,555 25,787 39,053 92,625 Equity shares 37,806 680 2,261 40,747
Included in investment securities is £37,263m (2007 £8,996m) subject to repurchase (Note 21).
Following the International Accounting Standards Board's ('IASB') decision in October 2008 to permit the reclassification of Financial Assets, the Group’s Treasury division reclassified certain securities from assets held for trading into the Available for Sale ('AFS') portfolio and, subsequently, in light of increasing illiquidity in the markets for asset backed securities ('ABS'), changed the classification of ABS from AFS, to loans and receivables. ABS and Floating Rate Notes ('FRNs') with book values (as at 31 December 2008) of £10,132m and £3,410m respectively were transferred out of assets held for trading into the AFS portfolio with effect from 1 July 2008. Subsequently, ABS with book values (as at 31 December 2008) of £37,173m were transferred out of the AFS portfolio and into loans and receivables with effect from 1 November 2008. If these assets had not been reclassified during the year additional adjustments of £(981)m would have been recognised in the income statement and the AFS reserve movement would have been reduced by £68m (post tax).
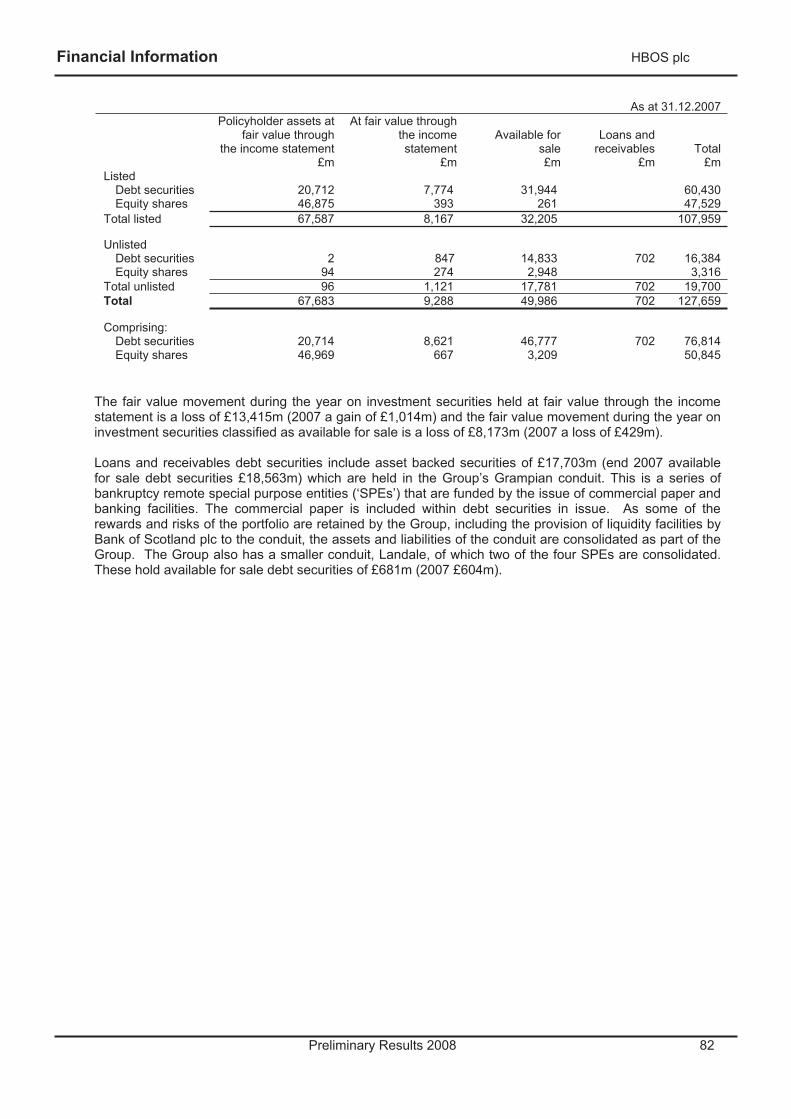
Financial Information HBOS plc
Preliminary Results 2008 82
As at 31.12.2007 Policyholder assets at
fair value through the income statement
£m
At fair value through the income statement
£m
Available for sale£m
Loans and receivables
£mTotal
£mListed
Debt securities 20,712 7,774 31,944 60,430 Equity shares 46,875 393 261 47,529
Total listed 67,587 8,167 32,205 107,959
Unlisted Debt securities 2 847 14,833 702 16,384 Equity shares 94 274 2,948 3,316
Total unlisted 96 1,121 17,781 702 19,700 Total 67,683 9,288 49,986 702 127,659
Comprising:
Debt securities 20,714 8,621 46,777 702 76,814 Equity shares 46,969 667 3,209 50,845
The fair value movement during the year on investment securities held at fair value through the income statement is a loss of £13,415m (2007 a gain of £1,014m) and the fair value movement during the year on investment securities classified as available for sale is a loss of £8,173m (2007 a loss of £429m).
Loans and receivables debt securities include asset backed securities of £17,703m (end 2007 available for sale debt securities £18,563m) which are held in the Group’s Grampian conduit. This is a series of bankruptcy remote special purpose entities (‘SPEs’) that are funded by the issue of commercial paper and banking facilities. The commercial paper is included within debt securities in issue. As some of the rewards and risks of the portfolio are retained by the Group, including the provision of liquidity facilities by Bank of Scotland plc to the conduit, the assets and liabilities of the conduit are consolidated as part of the Group. The Group also has a smaller conduit, Landale, of which two of the four SPEs are consolidated. These hold available for sale debt securities of £681m (2007 £604m).
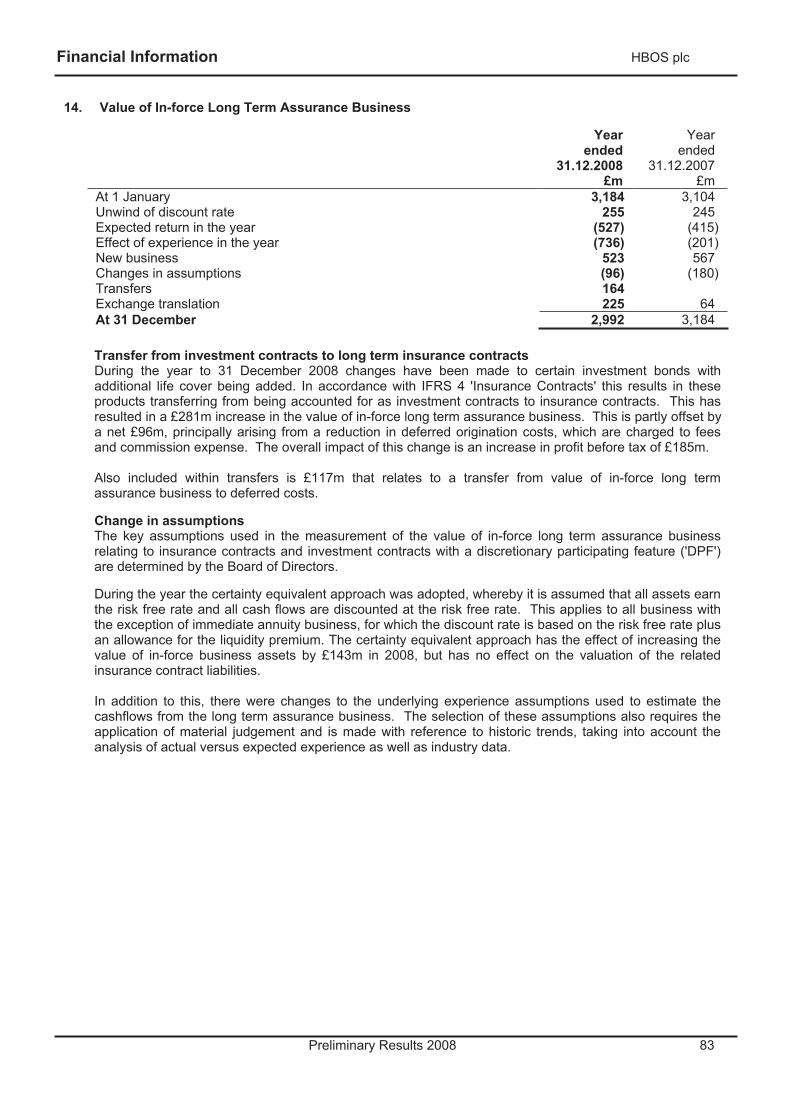
Financial Information HBOS plc
Preliminary Results 2008 83
14. Value of In-force Long Term Assurance Business
Yearended
31.12.2008 £m
Yearended
31.12.2007 £m
At 1 January 3,184 3,104 Unwind of discount rate 255 245 Expected return in the year (527) (415) Effect of experience in the year (736) (201) New business 523 567 Changes in assumptions (96) (180) Transfers 164 Exchange translation 225 64 At 31 December 2,992 3,184
Transfer from investment contracts to long term insurance contracts During the year to 31 December 2008 changes have been made to certain investment bonds with additional life cover being added. In accordance with IFRS 4 'Insurance Contracts' this results in these products transferring from being accounted for as investment contracts to insurance contracts. This has resulted in a £281m increase in the value of in-force long term assurance business. This is partly offset by a net £96m, principally arising from a reduction in deferred origination costs, which are charged to fees and commission expense. The overall impact of this change is an increase in profit before tax of £185m.
Also included within transfers is £117m that relates to a transfer from value of in-force long term assurance business to deferred costs.
Change in assumptions The key assumptions used in the measurement of the value of in-force long term assurance business relating to insurance contracts and investment contracts with a discretionary participating feature ('DPF') are determined by the Board of Directors.
During the year the certainty equivalent approach was adopted, whereby it is assumed that all assets earn the risk free rate and all cash flows are discounted at the risk free rate. This applies to all business with the exception of immediate annuity business, for which the discount rate is based on the risk free rate plus an allowance for the liquidity premium. The certainty equivalent approach has the effect of increasing the value of in-force business assets by £143m in 2008, but has no effect on the valuation of the related insurance contract liabilities.
In addition to this, there were changes to the underlying experience assumptions used to estimate the cashflows from the long term assurance business. The selection of these assumptions also requires the application of material judgement and is made with reference to historic trends, taking into account the analysis of actual versus expected experience as well as industry data.
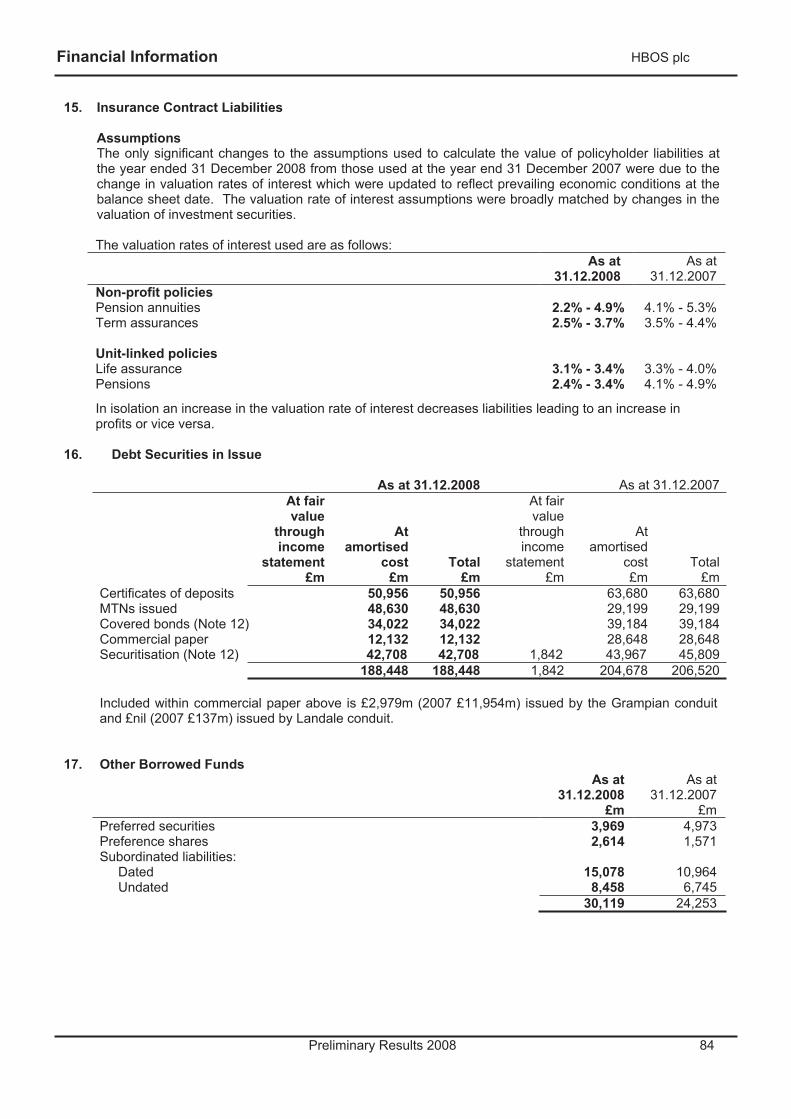
Financial Information HBOS plc
Preliminary Results 2008 84
15. Insurance Contract Liabilities
Assumptions The only significant changes to the assumptions used to calculate the value of policyholder liabilities at the year ended 31 December 2008 from those used at the year end 31 December 2007 were due to the change in valuation rates of interest which were updated to reflect prevailing economic conditions at the balance sheet date. The valuation rate of interest assumptions were broadly matched by changes in the valuation of investment securities.
The valuation rates of interest used are as follows:As at
31.12.2008 As at
31.12.2007 Non-profit policies Pension annuities 2.2% - 4.9% 4.1% - 5.3% Term assurances 2.5% - 3.7% 3.5% - 4.4%
Unit-linked policies Life assurance 3.1% - 3.4% 3.3% - 4.0% Pensions 2.4% - 3.4% 4.1% - 4.9%
In isolation an increase in the valuation rate of interest decreases liabilities leading to an increase in profits or vice versa.
16. Debt Securities in Issue
As at 31.12.2008 As at 31.12.2007At fair value
through income
statement £m
Atamortised
cost£m
Total£m
At fair value
through income
statement£m
Atamortised
cost £m
Total£m
Certificates of deposits 50,956 50,956 63,680 63,680 MTNs issued 48,630 48,630 29,199 29,199 Covered bonds (Note 12) 34,022 34,022 39,184 39,184 Commercial paper 12,132 12,132 28,648 28,648 Securitisation (Note 12) 42,708 42,708 1,842 43,967 45,809
188,448 188,448 1,842 204,678 206,520
Included within commercial paper above is £2,979m (2007 £11,954m) issued by the Grampian conduit and £nil (2007 £137m) issued by Landale conduit.
17. Other Borrowed Funds As at
31.12.2008 £m
As at 31.12.2007
£m Preferred securities 3,969 4,973 Preference shares 2,614 1,571 Subordinated liabilities: Dated 15,078 10,964 Undated 8,458 6,745
30,119 24,253
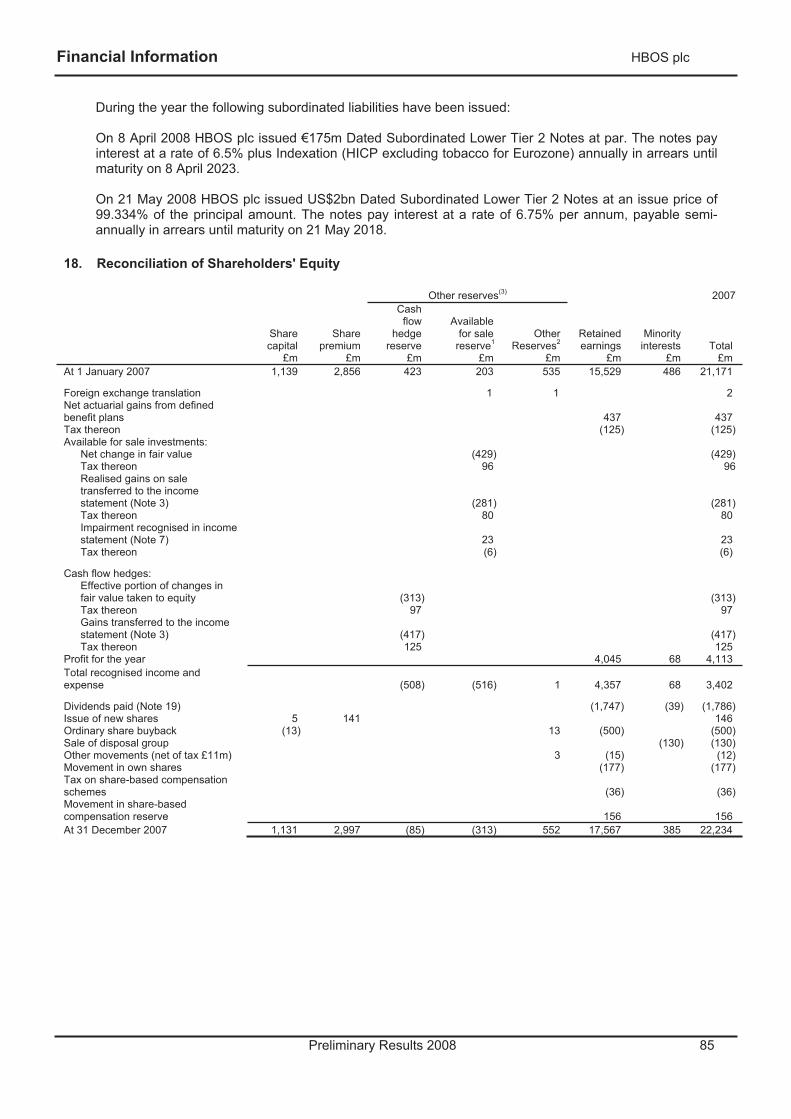
Financial Information HBOS plc
Preliminary Results 2008 85
During the year the following subordinated liabilities have been issued:
On 8 April 2008 HBOS plc issued €175m Dated Subordinated Lower Tier 2 Notes at par. The notes pay interest at a rate of 6.5% plus Indexation (HICP excluding tobacco for Eurozone) annually in arrears until maturity on 8 April 2023.
On 21 May 2008 HBOS plc issued US$2bn Dated Subordinated Lower Tier 2 Notes at an issue price of 99.334% of the principal amount. The notes pay interest at a rate of 6.75% per annum, payable semi-annually in arrears until maturity on 21 May 2018.
18. Reconciliation of Shareholders' Equity
Other reserves(3) 2007
Sharecapital
£m
Sharepremium
£m
Cashflow
hedgereserve
£m
Availablefor sale
reserve1
£m
OtherReserves2
£m
Retainedearnings
£m
Minority interests
£mTotal
£mAt 1 January 2007 1,139 2,856 423 203 535 15,529 486 21,171 Foreign exchange translation 1 1 2 Net actuarial gains from defined benefit plans
437 437
Tax thereon (125) (125) Available for sale investments:
Net change in fair value (429) (429) Tax thereon 96 96 Realised gains on sale transferred to the income statement (Note 3)
(281)
(281)Tax thereon 80 80 Impairment recognised in income statement (Note 7)
23
23
Tax thereon (6) (6) Cash flow hedges:
Effective portion of changes in fair value taken to equity
(313)
(313)
Tax thereon 97 97 Gains transferred to the income statement (Note 3)
(417)
(417)
Tax thereon 125 125 Profit for the year 4,045 68 4,113 Total recognised income and expense
(508) (516) 1 4,357 68 3,402
Dividends paid (Note 19) (1,747) (39) (1,786) Issue of new shares 5 141 146 Ordinary share buyback (13) 13 (500) (500) Sale of disposal group (130) (130) Other movements (net of tax £11m) 3 (15) (12) Movement in own shares (177) (177) Tax on share-based compensation schemes
(36) (36)
Movement in share-based compensation reserve
156 156
At 31 December 2007 1,131 2,997 (85) (313) 552 17,567 385 22,234
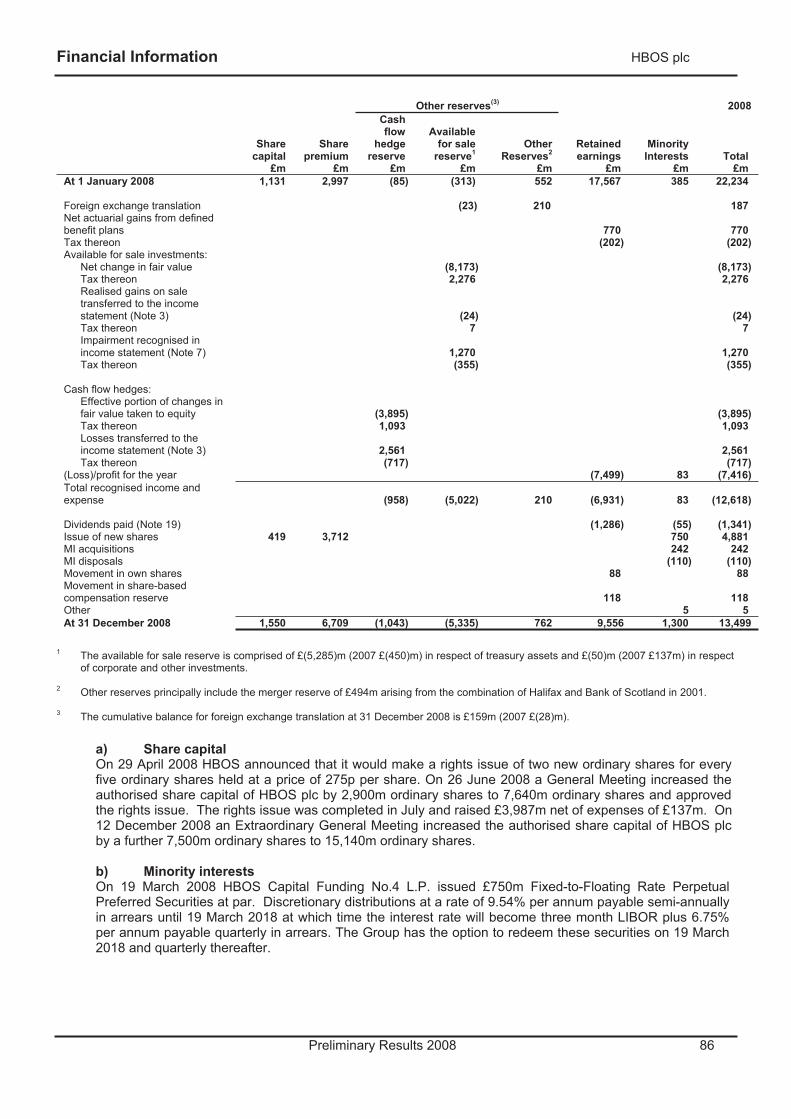
Financial Information HBOS plc
Preliminary Results 2008 86
Other reserves(3) 2008
Sharecapital
£m
Sharepremium
£m
Cashflow
hedge reserve
£m
Available for sale
reserve1
£m
Other Reserves2
£m
Retained earnings
£m
Minority Interests
£mTotal
£mAt 1 January 2008 1,131 2,997 (85) (313) 552 17,567 385 22,234 Foreign exchange translation (23) 210 187 Net actuarial gains from defined benefit plans
770 770
Tax thereon (202) (202) Available for sale investments:
Net change in fair value (8,173) (8,173) Tax thereon 2,276 2,276 Realised gains on sale transferred to the income statement (Note 3)
(24)
(24)Tax thereon 7 7 Impairment recognised in income statement (Note 7)
1,270
1,270
Tax thereon (355) (355)
Cash flow hedges: Effective portion of changes in fair value taken to equity (3,895)
(3,895)
Tax thereon 1,093 1,093 Losses transferred to the income statement (Note 3) 2,561
2,561
Tax thereon (717) (717) (Loss)/profit for the year (7,499) 83 (7,416) Total recognised income and expense (958) (5,022) 210 (6,931) 83 (12,618)
Dividends paid (Note 19) (1,286) (55) (1,341) Issue of new shares 419 3,712 750 4,881 MI acquisitions 242 242 MI disposals (110) (110) Movement in own shares 88 88 Movement in share-based compensation reserve
118 118
Other 5 5 At 31 December 2008 1,550 6,709 (1,043) (5,335) 762 9,556 1,300 13,499
1 The available for sale reserve is comprised of £(5,285)m (2007 £(450)m) in respect of treasury assets and £(50)m (2007 £137m) in respect of corporate and other investments.
2 Other reserves principally include the merger reserve of £494m arising from the combination of Halifax and Bank of Scotland in 2001.
3 The cumulative balance for foreign exchange translation at 31 December 2008 is £159m (2007 £(28)m).
a) Share capital On 29 April 2008 HBOS announced that it would make a rights issue of two new ordinary shares for every five ordinary shares held at a price of 275p per share. On 26 June 2008 a General Meeting increased the authorised share capital of HBOS plc by 2,900m ordinary shares to 7,640m ordinary shares and approved the rights issue. The rights issue was completed in July and raised £3,987m net of expenses of £137m. On 12 December 2008 an Extraordinary General Meeting increased the authorised share capital of HBOS plc by a further 7,500m ordinary shares to 15,140m ordinary shares.
b) Minority interests On 19 March 2008 HBOS Capital Funding No.4 L.P. issued £750m Fixed-to-Floating Rate Perpetual Preferred Securities at par. Discretionary distributions at a rate of 9.54% per annum payable semi-annually in arrears until 19 March 2018 at which time the interest rate will become three month LIBOR plus 6.75% per annum payable quarterly in arrears. The Group has the option to redeem these securities on 19 March 2018 and quarterly thereafter.
Financial Information HBOS plc
Preliminary Results 2008 87
19. DividendsA Capitalisation Issue took place on 6 October 2008 in lieu of an interim cash dividend to shareholders. The Capitalisation amount was £320m. Qualifying shareholders received new fully paid ordinary shares based on the capitalisation amount per ordinary share as at 3 October 2008 (6.07p), multiplied by the number of ordinary shares held at close of business on 3 October, divided by the Capitalisation Issue price of 232p, being the value per ordinary share agreed under the terms of the acquisition by Lloyds TSB Group plc (Note 24).
Yearended
31.12.2008 £m
Yearended
31.12.2007 £m
Ordinary dividends 2006 final dividend of 27.9 pence per ordinary share 1,048 2007 interim dividend of 16.6 pence per ordinary share 619 2007 final dividend paid of 32.3 pence per ordinary share 1,205
Preference dividends 81 801,286 1,747
20. Contingent Liabilities and Commitments
As at 31.12.2008
£m
As at 31.12.2007
£m Contingent liabilities Acceptances and endorsements 43 Guarantees and irrevocable letters of credit 4,898 6,891
4,898 6,934 Commitments Short term trade related transactions 137 115 Undrawn formal standby facilities, credit lines and other
commitments to lend: 83,320 99,66983,457 99,784
a) Unarranged overdraft charges
On 27 July 2007 it was announced that members of the Group, along with seven other major UK current account providers, had reached agreement with the OFT to commence legal proceedings in the High Court of England and Wales for a declaration (or declarations) to resolve legal uncertainties concerning the fairness and lawfulness of unarranged overdraft charges (the 'Test Case'). It was also announced that HBOS and those other providers will seek a stay of all current and potential future court proceedings which are brought against them in the UK concerning these charges and have obtained the consent of the Financial Ombudsman Service not to proceed with consideration of the merits of any complaints concerning these charges that are referred to them prior to the resolution of the Test Case. By virtue of a waiver granted by the FSA of its complaints handling rules, HBOS (and other banks, including the banks party to the Test Case) will not be dealing with or resolving customer complaints about unarranged overdraft charges while the waiver is in force. On 22 January 2009, the FSA confirmed that it is extending its waiver regarding unarranged overdraft charges complaints until 26 July 2009.
The first step in the Test Case was a trial of certain preliminary issues concerning the legal status and enforceability of contractual terms relating to unarranged overdraft charges. This preliminary trial concluded on 8 February 2008 and the judgment was handed down on 24 April 2008. The judgment held that the contractual terms relating to unarranged overdraft charges currently used by the Group (i) are not capable of being penalties, but (ii) are not exempt from assessment for fairness under the Unfair Terms in Consumer Contract Regulations 1999 ('UTCCRs').
Financial Information HBOS plc
Preliminary Results 2008 88
At a court hearing on 22 and 23 May 2008, the Judge granted HBOS and the other Test Case banks permission to appeal his decision that current unarranged overdraft charges are assessable for fairness under the UTCCRs. This appeal concluded on 5 November 2008. On 26 February 2009, the Court of Appeal dismissed the banks’ appeal and held that the charges are assessable for fairness. The banks will now be applying to the House of Lords for permission to appeal this judgment.
A further hearing took place in early July 2008, at which the Court was asked to consider whether terms and conditions previously used by the Test Case banks are capable of being penalties and whether the Judge's decision in April 2008 (that the banks' current contractual terms are capable of being assessed for fairness under the UTCCRs) can be applied to historic terms.
The Court handed down its judgment on 8 October 2008 on this second stage of the test case process. The Court ruled that charges applied under Halifax and Bank of Scotland's previously used terms and conditions cannot be penalties. However, the Court also ruled that the historic terms and conditions are not exempt from assessment for fairness under the UTCCRs. The banks intend to appeal this latter decision.
Further Court hearings will be required before the test case process is concluded.
A definitive outcome of the Test Case is unlikely to be known for at least twelve months.
Given the early stage of these proceedings and the uncertainty as to their outcome, in terms of a contingent liability it is not practicable at this time to estimate any potential financial effect.
b) Payment Protection Insurance ('PPI') The final report from the Competition Commission ('CC') into Payment Protection Insurance ('PPI') was received on 29 January 2009. The remedies published were broadly similar to those outlined in the CC's Provisional Decision with some changes to the sales process.
Whilst it is believed that many of the remedies could improve customer searching and enable switching, the inability to sell appropriate insurance products at a point when customers take on increased financial commitment, will likely result in lower levels of protection for UK consumers.
The Group is actively reviewing its customer propositions, in the light of the CC's Final Report, to ensure that the Group continues to offer a valuable protection product to customers.
The Group took the decision to launch a regular premium protection product. This was launched in early February 2009.
The Financial Ombudsman Service ('FOS') has been receiving a large number of complaints in relation to PPI sold by a number of providers and has written to the FSA suggesting an industry wide review of PPI sales standards. In response, the industry is working on a Statement of Principles to define a consistent way of handling sales complaints. The FSA is considering FOS' suggestions and a statement from the FSA in relation to its most recent thematic work in relation to PPI is expected in the first quarter of 2009.
Financial Information HBOS plc
Preliminary Results 2008 89
21. Securities Borrowing and Lending, Repurchase and Reverse Repurchase Agreements The Group enters into securities lending transactions and repurchase agreements, whereby cash and securities are temporarily received or transferred as collateral. Where the securities sold subject to repurchase or pledged as collateral are retained on the balance sheet the funds received under these arrangements are recognised as liabilities. These transactions are all in respect of standard securities borrowing and reverse repurchase agreements which are undertaken under standard market terms and conditions, or are in respect of securities exchange transactions under the Bank of England’s Special Liquidity Scheme. Assets and liabilities relating to such arrangements at 31 December are as follows:
Asset Related liability
As at 31.12.2008
£m
As at 31.12.2007
£m
As at 31.12.2008
£m
As at 31.12.2007
£mAssets subject to repurchase: Financial assets held for trading 4,369 4,711 3,425 4,523Loans and advances to customers (Note 11) 56,858 39,220Investment securities (Note 13) 37,263 8,996 31,682 7,841
98,490 13,707 74,327 12,364
In addition to the above, financial assets pledged as collateral as part of securities lending transactions amounted to £89,109m (2007 £11,918m).
Securities held as collateral under stock borrowed or under reserve repurchase agreements amounted to £76,018m (2007 £39,975m), of which £64,378m (£28,817m) had been resold or re-pledged by the Group as collateral for its own transactions. These securities are not recognised as assets, and the cash advanced is recognised within financial assets held for trading, loans and advances to banks and loans and advances to customers.
Financial Information HBOS plc
Preliminary Results 2008 90
22. Cash and Cash EquivalentsYear
ended31.12.2008
£m
Yearended
31.12.2007 Restated
£mCash and balances at central bank 2,502 2,945
Less: mandatory reserve deposits (296) (373) 2,206 2,572
Loans and advances to banks 17,645 7,683 Less: amounts with a maturity of three months or more (7,748) (4,070)
9,897 3,61312,103 6,185
Mandatory reserve deposits are held with local central banks in accordance with statutory requirements; these deposits are not available to finance the Group's day to day operations.
Included in total cash and cash equivalents at 31 December 2008 is £864m (2007 £658m) of cash held at the central bank as collateral against notes in circulation of £957m (2007 £881m).
Mandatory reserve deposits of £373m at 31 December 2007 have been reclassified from loans and advances to banks to cash and balances at central banks. In addition, total cash and cash equivalents at 31 December 2007 have been restated to include certain cash deposits held with the central Bank of Ireland of £853m (1 January 2007 £535m) and cash held at the central bank as collateral against notes in circulation of £881m (1 January 2007 £857m) which are available to finance the Group's day to day operations. The cashflow statements have been adjusted accordingly.
23. Sale of Businesses On 8 October 2008 the HBOS Group agreed the sale of part of its Australian operations, principally Bank of Western Australia Ltd and St Andrews Australia Pty Ltd, to Commonwealth Bank of Australia Limited.
The sale completed on 19 December 2008 and results in a pre-tax loss on disposal of £845m (including goodwill written-off of £240m) which is included as non-operating income within the (loss)/profit on sale of businesses for the year.
Under the share sale agreement HBOS plc has provided certain warranties to Commonwealth Bank of Australia, that all relevant, material circumstances and facts in relation to the sale have been disclosed and described in agreement. The share sale agreement provided for adjustments to the initial purchase price based on the risk weighted assets of Bank of Western Australia Limited and the net assets of St Andrews Australia Pty Limited. As a result, the loss on sale of these businesses may be subject to adjustment for the contingent element of the commitment receivable.
Following the sale HBOS retains a presence in Australia through Bank of Scotland International (Australia) Limited and Capital Finance Australia Limited which are engaged in corporate banking and asset finance activities respectively, together with the Bank of Scotland plc Sydney branch and therefore this sale does not constitute a discontinued activity.
As such, the performance of the businesses sold and the loss on disposal remains within the profit arising from continuing operations of the Group. These businesses are reported in the International division for segmental reporting purposes.
Financial Information HBOS plc
Preliminary Results 2008 91
24. Events After The Balance Sheet Date a) Lloyds Banking Group
On 18 September 2008, with the support of the UK Government, the boards of HBOS plc ('HBOS') and Lloyds TSB Group plc ('Lloyds TSB') announced that they had reached agreement on the terms of the recommended acquisition of HBOS by Lloyds TSB. The terms of the acquisition were subsequently amended, as announced on 13 October 2008, at the same time as the announcement of the participation by HBOS and Lloyds TSB in the Government's action plan to recapitalise some of the major UK banks. The acquisition was to be implemented by means of a scheme of arrangement, with a separate scheme of arrangements in relation to preference shares, under sections 895 to 899 of the Companies Act 2006.
On 12 January 2009 the Court of Session in Edinburgh, Scotland made an order sanctioning the scheme of arrangement for the acquisition and the preference share scheme of arrangement. The last day of trading in HBOS ordinary and preference shares was 14 January 2009.
On 15 January 2009 HBOS raised £11.5bn of capital (before costs and expenses) through an issue of £8.5bn of new ordinary shares under a placing with HM Treasury subject to clawback by existing shareholders, and an issue to HM Treasury of £3bn of new preference shares. Lloyds TSB raised £4.5bn (before costs and expenses) through an issue of £3.5bn of new ordinary shares under a placing with HM Treasury subject to clawback by existing shareholders, and an issue to HM Treasury of £1bn of new preference shares.
On 16 January 2009 the Lloyds TSB acquisition of HBOS completed following final court approval and Lloyds TSB was renamed Lloyds Banking Group plc. The exchange of HBOS shares for Lloyds Banking Group shares took place at an exchange ratio of 0.605 of a new Lloyds Banking Group share for every one HBOS share held. As a result, the UK Government through HM Treasury owned approximately 43.4% of the enlarged ordinary share capital of Lloyds Banking Group. In addition, each class of preference share issued by HBOS, including the preference shares issued to HM Treasury in the capital raising was replaced with an equal number of new Lloyds Banking Group preference shares.
HBOS ordinary and preference shares were de-listed from the Official List of the UK Listing Authority and admission to trading on the London Stock Exchange was cancelled on 19 January 2009 when trading in the new Lloyds Banking Group shares commenced.
b) Other As a result of the acquisition of the Group by Lloyds TSB, some of the share schemes vested in the period between 12 January 2009, being the date when the acquisition was approved by the Court of Session, and the 16 January 2009, the completion of the acquisition itself. The remainder of the share schemes will roll over into new Lloyds Banking Group Shares. These will continue until their original maturity date. As a non adjusting post balance sheet event there is no accounting impact on the primary statements as at 31 December 2008.
25. Ultimate Parent Undertaking From 16 January 2009, HBOS plc’s ultimate parent undertaking and controlling party is Lloyds Banking Group plc (formerly Lloyds TSB Group plc) which is incorporated in Scotland. Lloyds Banking Group plc will produce consolidated accounts for the year ended 31 December 2009. Copies of the annual report and accounts of Lloyds TSB Group plc for the year ended 31 December 2008 may be obtained from Lloyds Banking Group’s head office at 25 Gresham Street, London EC2V 7HN.
Copies of the annual report and accounts of HBOS plc for the year ended 31 December 2008 may be obtained from HBOS plc’s registered office at The Mound, Edinburgh, EH1 1YZ.
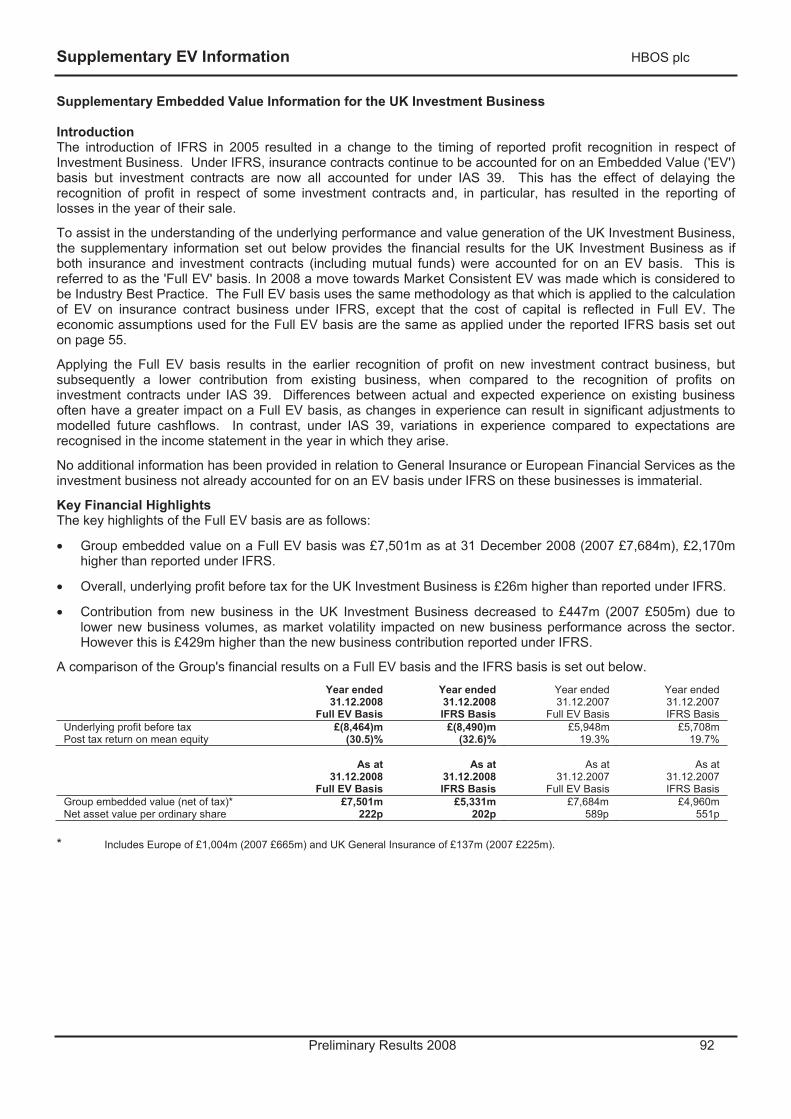
Supplementary EV Information HBOS plc
Preliminary Results 2008 92
Supplementary Embedded Value Information for the UK Investment Business
Introduction The introduction of IFRS in 2005 resulted in a change to the timing of reported profit recognition in respect of Investment Business. Under IFRS, insurance contracts continue to be accounted for on an Embedded Value ('EV') basis but investment contracts are now all accounted for under IAS 39. This has the effect of delaying the recognition of profit in respect of some investment contracts and, in particular, has resulted in the reporting of losses in the year of their sale.
To assist in the understanding of the underlying performance and value generation of the UK Investment Business, the supplementary information set out below provides the financial results for the UK Investment Business as if both insurance and investment contracts (including mutual funds) were accounted for on an EV basis. This is referred to as the 'Full EV' basis. In 2008 a move towards Market Consistent EV was made which is considered to be Industry Best Practice. The Full EV basis uses the same methodology as that which is applied to the calculation of EV on insurance contract business under IFRS, except that the cost of capital is reflected in Full EV. The economic assumptions used for the Full EV basis are the same as applied under the reported IFRS basis set out on page 55.
Applying the Full EV basis results in the earlier recognition of profit on new investment contract business, but subsequently a lower contribution from existing business, when compared to the recognition of profits on investment contracts under IAS 39. Differences between actual and expected experience on existing business often have a greater impact on a Full EV basis, as changes in experience can result in significant adjustments to modelled future cashflows. In contrast, under IAS 39, variations in experience compared to expectations are recognised in the income statement in the year in which they arise.
No additional information has been provided in relation to General Insurance or European Financial Services as the investment business not already accounted for on an EV basis under IFRS on these businesses is immaterial.
Key Financial Highlights The key highlights of the Full EV basis are as follows:
• Group embedded value on a Full EV basis was £7,501m as at 31 December 2008 (2007 £7,684m), £2,170m higher than reported under IFRS.
• Overall, underlying profit before tax for the UK Investment Business is £26m higher than reported under IFRS.
• Contribution from new business in the UK Investment Business decreased to £447m (2007 £505m) due to lower new business volumes, as market volatility impacted on new business performance across the sector. However this is £429m higher than the new business contribution reported under IFRS.
A comparison of the Group's financial results on a Full EV basis and the IFRS basis is set out below. Year ended 31.12.2008
Full EV Basis
Year ended 31.12.2008IFRS Basis
Year ended 31.12.2007
Full EV Basis
Year ended 31.12.2007IFRS Basis
Underlying profit before tax £(8,464)m £(8,490)m £5,948m £5,708m Post tax return on mean equity (30.5)% (32.6)% 19.3% 19.7%
As at 31.12.2008
Full EV Basis
As at 31.12.2008IFRS Basis
As at 31.12.2007
Full EV Basis
As at 31.12.2007IFRS Basis
Group embedded value (net of tax)* £7,501m £5,331m £7,684m £4,960m Net asset value per ordinary share 222p 202p 589p 551p
* Includes Europe of £1,004m (2007 £665m) and UK General Insurance of £137m (2007 £225m).
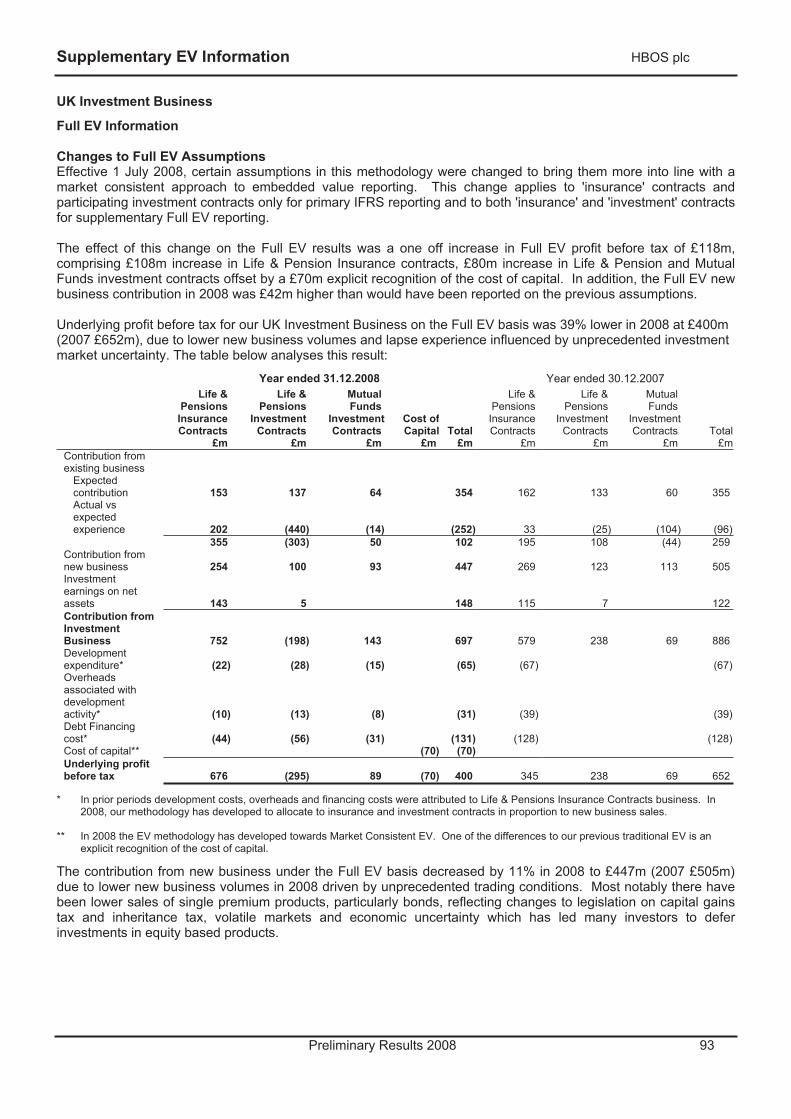
Supplementary EV Information HBOS plc
Preliminary Results 2008 93
UK Investment Business
Full EV Information
Changes to Full EV Assumptions Effective 1 July 2008, certain assumptions in this methodology were changed to bring them more into line with a market consistent approach to embedded value reporting. This change applies to 'insurance' contracts and participating investment contracts only for primary IFRS reporting and to both 'insurance' and 'investment' contracts for supplementary Full EV reporting.
The effect of this change on the Full EV results was a one off increase in Full EV profit before tax of £118m, comprising £108m increase in Life & Pension Insurance contracts, £80m increase in Life & Pension and Mutual Funds investment contracts offset by a £70m explicit recognition of the cost of capital. In addition, the Full EV new business contribution in 2008 was £42m higher than would have been reported on the previous assumptions.
Underlying profit before tax for our UK Investment Business on the Full EV basis was 39% lower in 2008 at £400m (2007 £652m), due to lower new business volumes and lapse experience influenced by unprecedented investment market uncertainty. The table below analyses this result:
Year ended 31.12.2008 Year ended 30.12.2007 Life &
Pensions Insurance Contracts
£m
Life &Pensions
Investment Contracts
£m
Mutual Funds
Investment Contracts
£m
Cost ofCapital
£mTotal
£m
Life & PensionsInsuranceContracts
£m
Life &Pensions
InvestmentContracts
£m
MutualFunds
InvestmentContracts
£mTotal
£mContribution from existing business
Expectedcontribution 153 137 64 354 162 133 60 355 Actual vs expectedexperience 202 (440) (14) (252) 33 (25) (104) (96))
355 (303) 50 102 195 108 (44) 259 Contribution from new business 254 100 93 447 269 123 113 505 Investmentearnings on net assets 143 5 148 115 7 122 Contribution from Investment Business 752 (198) 143 697 579 238 69 886 Developmentexpenditure* (22) (28) (15) (65) (67) (67))Overheads associated with developmentactivity* (10) (13) (8) (31) (39) (39))Debt Financing cost* (44) (56) (31) (131) (128) (128))Cost of capital** (70) (70)Underlying profit before tax 676 (295) 89 (70) 400 345 238 69 652
* In prior periods development costs, overheads and financing costs were attributed to Life & Pensions Insurance Contracts business. In 2008, our methodology has developed to allocate to insurance and investment contracts in proportion to new business sales.
** In 2008 the EV methodology has developed towards Market Consistent EV. One of the differences to our previous traditional EV is an explicit recognition of the cost of capital.
The contribution from new business under the Full EV basis decreased by 11% in 2008 to £447m (2007 £505m) due to lower new business volumes in 2008 driven by unprecedented trading conditions. Most notably there have been lower sales of single premium products, particularly bonds, reflecting changes to legislation on capital gains tax and inheritance tax, volatile markets and economic uncertainty which has led many investors to defer investments in equity based products.
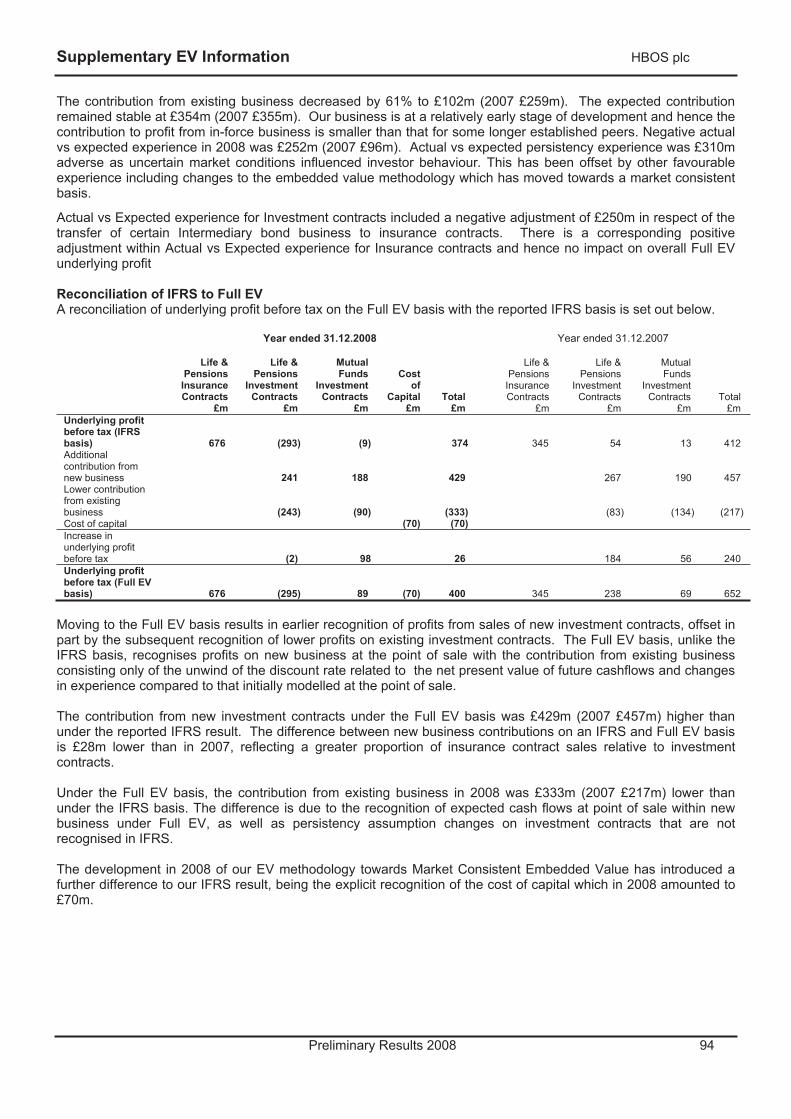
Supplementary EV Information HBOS plc
Preliminary Results 2008 94
The contribution from existing business decreased by 61% to £102m (2007 £259m). The expected contribution remained stable at £354m (2007 £355m). Our business is at a relatively early stage of development and hence the contribution to profit from in-force business is smaller than that for some longer established peers. Negative actual vs expected experience in 2008 was £252m (2007 £96m). Actual vs expected persistency experience was £310m adverse as uncertain market conditions influenced investor behaviour. This has been offset by other favourable experience including changes to the embedded value methodology which has moved towards a market consistent basis.
Actual vs Expected experience for Investment contracts included a negative adjustment of £250m in respect of the transfer of certain Intermediary bond business to insurance contracts. There is a corresponding positive adjustment within Actual vs Expected experience for Insurance contracts and hence no impact on overall Full EV underlying profit
Reconciliation of IFRS to Full EV A reconciliation of underlying profit before tax on the Full EV basis with the reported IFRS basis is set out below.
Year ended 31.12.2008 Year ended 31.12.2007
Life & Pensions
Insurance Contracts
£m
Life & Pensions
Investment Contracts
£m
MutualFunds
Investment Contracts
£m
Cost of
Capital £m
Total £m
Life & Pensions
Insurance Contracts
£m
Life & Pensions
Investment Contracts
£m
Mutual Funds
Investment Contracts
£mTotal
£mUnderlying profit before tax (IFRS basis) 676 (293) (9) 374 345 54 13 412 Additional contribution from new business 241 188 429 267 190 457 Lower contribution from existing business (243) (90) (333) (83) (134) (217) Cost of capital (70) (70) Increase in underlying profit before tax (2) 98 26 184 56 240 Underlying profit before tax (Full EV basis) 676 (295) 89 (70) 400 345 238 69 652
Moving to the Full EV basis results in earlier recognition of profits from sales of new investment contracts, offset in part by the subsequent recognition of lower profits on existing investment contracts. The Full EV basis, unlike the IFRS basis, recognises profits on new business at the point of sale with the contribution from existing business consisting only of the unwind of the discount rate related to the net present value of future cashflows and changes in experience compared to that initially modelled at the point of sale.
The contribution from new investment contracts under the Full EV basis was £429m (2007 £457m) higher than under the reported IFRS result. The difference between new business contributions on an IFRS and Full EV basis is £28m lower than in 2007, reflecting a greater proportion of insurance contract sales relative to investment contracts.
Under the Full EV basis, the contribution from existing business in 2008 was £333m (2007 £217m) lower than under the IFRS basis. The difference is due to the recognition of expected cash flows at point of sale within new business under Full EV, as well as persistency assumption changes on investment contracts that are not recognised in IFRS.
The development in 2008 of our EV methodology towards Market Consistent Embedded Value has introduced a further difference to our IFRS result, being the explicit recognition of the cost of capital which in 2008 amounted to £70m.
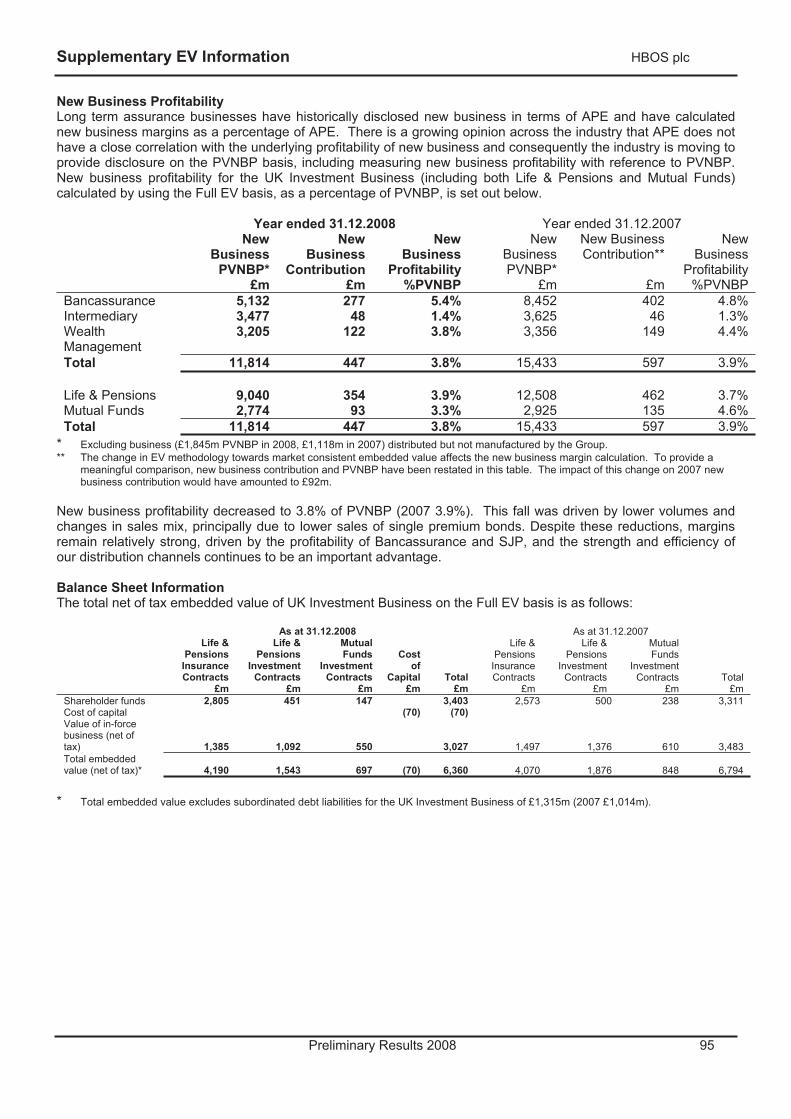
Supplementary EV Information HBOS plc
Preliminary Results 2008 95
New Business Profitability Long term assurance businesses have historically disclosed new business in terms of APE and have calculated new business margins as a percentage of APE. There is a growing opinion across the industry that APE does not have a close correlation with the underlying profitability of new business and consequently the industry is moving to provide disclosure on the PVNBP basis, including measuring new business profitability with reference to PVNBP. New business profitability for the UK Investment Business (including both Life & Pensions and Mutual Funds) calculated by using the Full EV basis, as a percentage of PVNBP, is set out below.
Year ended 31.12.2008 Year ended 31.12.2007 New
Business PVNBP*
£m
New Business
Contribution£m
New Business
Profitability%PVNBP
New Business PVNBP*
£m
New Business Contribution**
£m
New Business
Profitability%PVNBP
Bancassurance 5,132 277 5.4% 8,452 402 4.8%Intermediary 3,477 48 1.4% 3,625 46 1.3%WealthManagement
3,205 122 3.8% 3,356 149 4.4%
Total 11,814 447 3.8% 15,433 597 3.9%
Life & Pensions 9,040 354 3.9% 12,508 462 3.7%Mutual Funds 2,774 93 3.3% 2,925 135 4.6%Total 11,814 447 3.8% 15,433 597 3.9%
* Excluding business (£1,845m PVNBP in 2008, £1,118m in 2007) distributed but not manufactured by the Group. ** The change in EV methodology towards market consistent embedded value affects the new business margin calculation. To provide a
meaningful comparison, new business contribution and PVNBP have been restated in this table. The impact of this change on 2007 new business contribution would have amounted to £92m.
New business profitability decreased to 3.8% of PVNBP (2007 3.9%). This fall was driven by lower volumes and changes in sales mix, principally due to lower sales of single premium bonds. Despite these reductions, margins remain relatively strong, driven by the profitability of Bancassurance and SJP, and the strength and efficiency of our distribution channels continues to be an important advantage.
Balance Sheet Information The total net of tax embedded value of UK Investment Business on the Full EV basis is as follows:
As at 31.12.2008 As at 31.12.2007 Life &
Pensions Insurance Contracts
£m
Life & Pensions
Investment Contracts
£m
MutualFunds
Investment Contracts
£m
Cost of
Capital £m
Total £m
Life & Pensions
Insurance Contracts
£m
Life & Pensions
Investment Contracts
£m
MutualFunds
Investment Contracts
£mTotal
£mShareholder funds 2,805 451 147 3,403 2,573 500 238 3,311 Cost of capital (70) (70) Value of in-force business (net of tax) 1,385 1,092 550 3,027 1,497 1,376 610 3,483 Total embedded value (net of tax)* 4,190 1,543 697 (70) 6,360 4,070 1,876 848 6,794
* Total embedded value excludes subordinated debt liabilities for the UK Investment Business of £1,315m (2007 £1,014m).
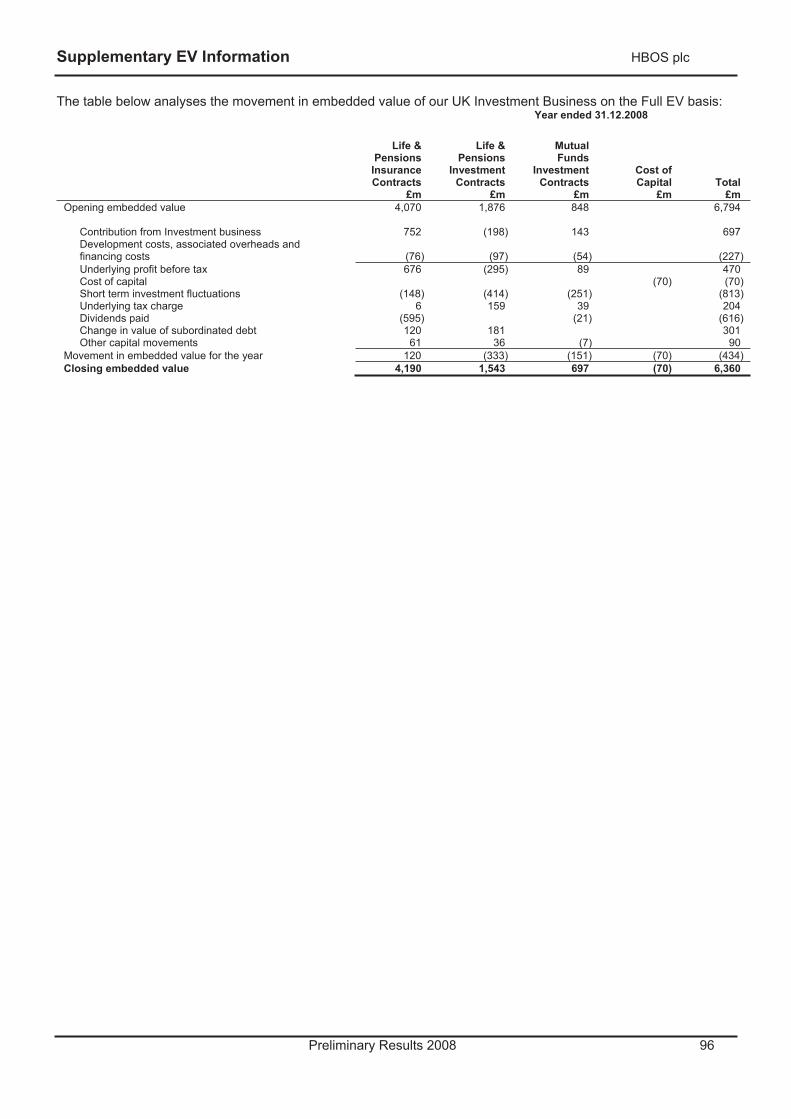
Supplementary EV Information HBOS plc
Preliminary Results 2008 96
The table below analyses the movement in embedded value of our UK Investment Business on the Full EV basis: Year ended 31.12.2008
Life &Pensions
Insurance Contracts
£m
Life &Pensions
Investment Contracts
£m
Mutual Funds
Investment Contracts
£m
Cost of Capital
£mTotal
£mOpening embedded value 4,070 1,876 848 6,794
Contribution from Investment business 752 (198) 143 697 Development costs, associated overheads and financing costs (76) (97) (54) (227)Underlying profit before tax 676 (295) 89 470 Cost of capital (70) (70) Short term investment fluctuations (148) (414) (251) (813) Underlying tax charge 6 159 39 204 Dividends paid (595) (21) (616) Change in value of subordinated debt 120 181 301 Other capital movements 61 36 (7) 90
Movement in embedded value for the year 120 (333) (151) (70) (434) Closing embedded value 4,190 1,543 697 (70) 6,360
Contacts HBOS plc
Preliminary Results 2008 97
Investor Relations Michael Oliver Director of Investor Relations 020 7356 2167 email: [email protected]
Douglas Radcliffe Senior Manager, Investor Relations 020 7356 1571 email: [email protected]
Media Shane O'Riordain Group Communications Director 020 7356 1849 email: shane.o'[email protected]
Leigh Calder Senior Manager, Media Relations 020 7356 1347 email: [email protected]