MAC 1140 Module 2 Linear Functions and Equations.
51
MAC 1140 Module 2 Linear Functions and Equations
-
Upload
marlene-osborne -
Category
Documents
-
view
242 -
download
0
Transcript of MAC 1140 Module 2 Linear Functions and Equations.
MAC 1140
Module 2
Linear Functions and Equations
2
Learning Objectives
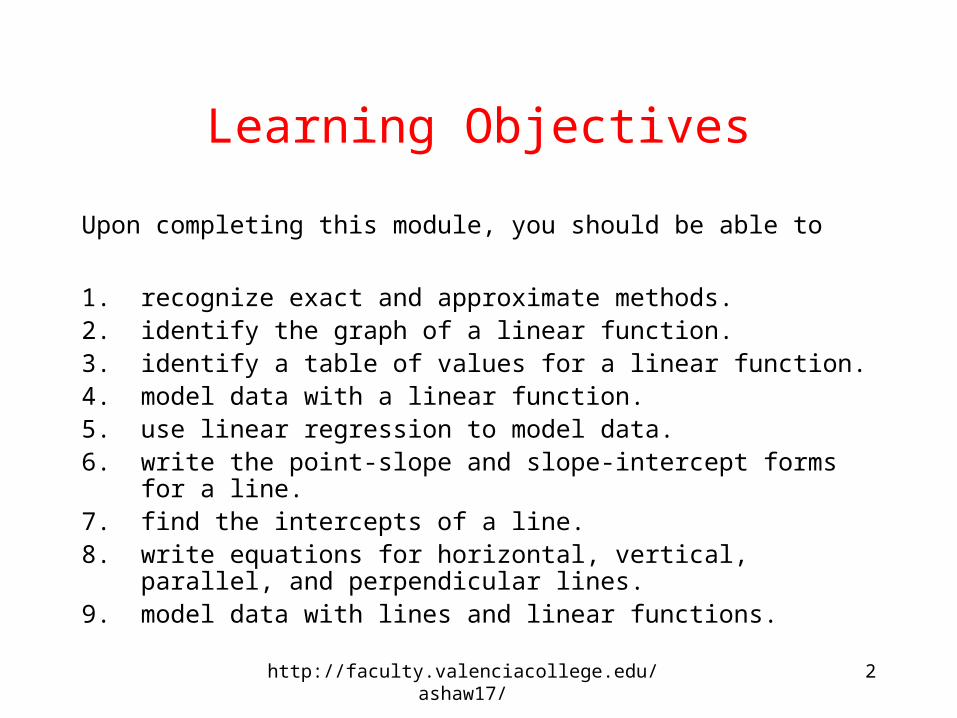
Upon completing this module, you should be able to
1. recognize exact and approximate methods.2. identify the graph of a linear function.3. identify a table of values for a linear function.4. model data with a linear function.5. use linear regression to model data.6. write the point-slope and slope-intercept forms for a line.7. find the intercepts of a line.8. write equations for horizontal, vertical, parallel, and
perpendicular lines.9. model data with lines and linear functions.
http://faculty.valenciacollege.edu/ashaw17/

3
Learning Objectives
10. understand interpolation and extrapolation.11. use direct variation to solve problems.12. understand basic terminology related to equations.13. recognize linear equations symbolically.14. solve linear equations graphically and numerically.15. understand the intermediate value property.16. solve problem involving percentages.17. apply problem-solving strategies.
http://faculty.valenciacollege.edu/ashaw17/
4
Linear Functions and Equations
2.12.1 Equations of LinesEquations of Lines
2.22.2 Linear EquationsLinear Equations
2.4 More Modeling with Functions2.4 More Modeling with Functions
There are three sections in this module:
http://faculty.valenciacollege.edu/ashaw17/

5
Let’s get started by looking at the difference
between an exact model and an approximate model.
http://faculty.valenciacollege.edu/ashaw17/
6
Example of an Exact Model
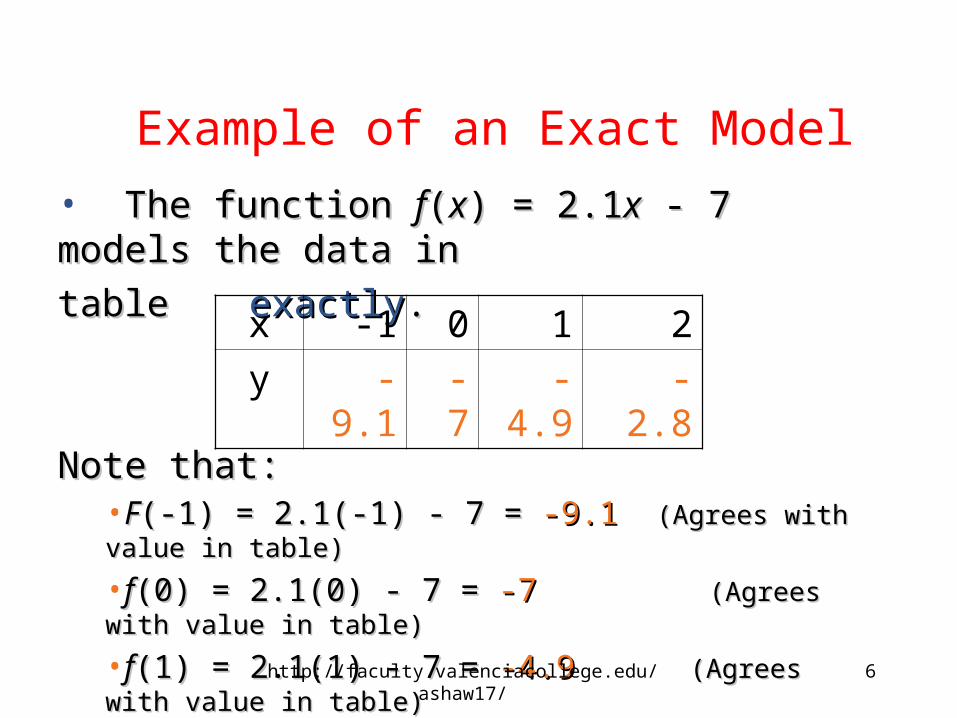
• The function The function ff((xx) = 2.1) = 2.1xx - 7 models the data in - 7 models the data in
table table exactlyexactly..
Note that:Note that:•FF(-1) = 2.1(-1) - 7 = (-1) = 2.1(-1) - 7 = -9.1-9.1 (Agrees with value in table)(Agrees with value in table)
•ff(0) = 2.1(0) - 7 = (0) = 2.1(0) - 7 = -7-7 (Agrees with value in table)(Agrees with value in table)
•ff(1) = 2.1(1) - 7 = (1) = 2.1(1) - 7 = -4.9-4.9 (Agrees with value in table)(Agrees with value in table)
•ff(2) = 2.1(2) - 7 = (2) = 2.1(2) - 7 = -2.8-2.8 (Agrees with value in table)(Agrees with value in table)
x -1 0 1 2
y -9.1 - 7 -4.9 -2.8
http://faculty.valenciacollege.edu/ashaw17/
7
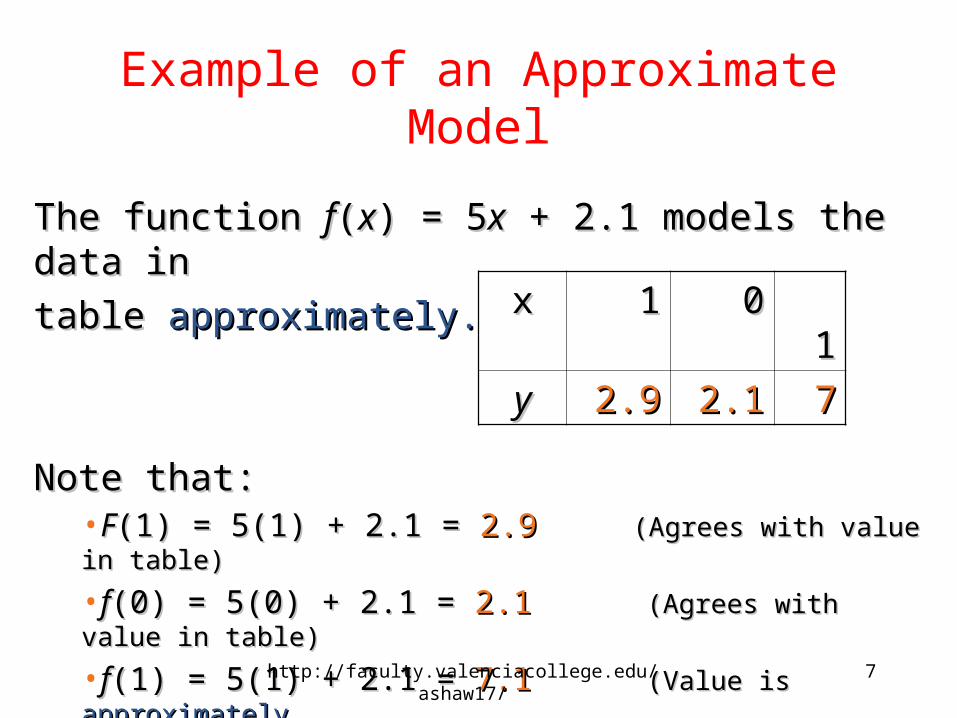
Example of an Approximate Model
The function The function ff((xx) = 5) = 5xx + 2.1 models the data in + 2.1 models the data in
table table approximately.approximately.
Note that:Note that:•FF(1) = 5(1) + 2.1 = (1) = 5(1) + 2.1 = 2.92.9 (Agrees with value in table)(Agrees with value in table)
•ff(0) = 5(0) + 2.1 = (0) = 5(0) + 2.1 = 2.1 2.1 (Agrees with value in table)(Agrees with value in table)
•ff(1) = 5(1) + 2.1 = (1) = 5(1) + 2.1 = 7.1 7.1 (Value is (Value is approximatelyapproximately
the value in the table, but not the value in the table, but not exactlyexactly.).)
xx 11 00 11
yy 2.92.9 2.12.1 77
http://faculty.valenciacollege.edu/ashaw17/
8
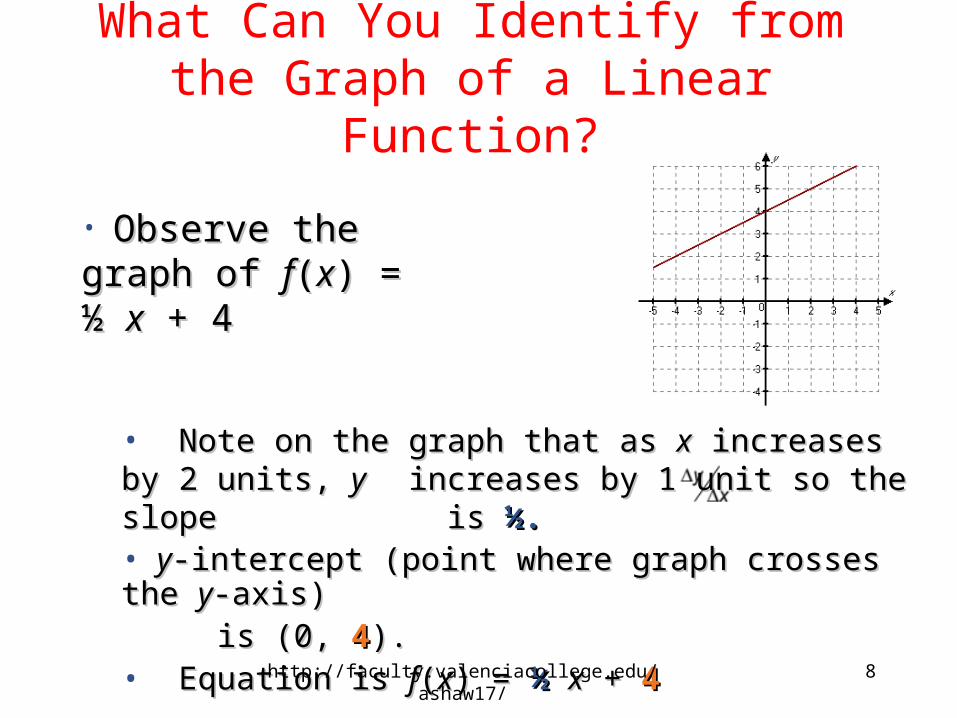
What Can You Identify from the Graph of a Linear Function?
• Observe the graph Observe the graph of of ff((xx) = ½ ) = ½ xx + 4 + 4
• Note on the graph that as Note on the graph that as xx increases by 2 units, increases by 2 units, y y increases by 1 unit so the slope is increases by 1 unit so the slope is ½.½.• yy-intercept (point where graph crosses the -intercept (point where graph crosses the yy-axis) -axis)
is (0, is (0, 44).).• Equation is Equation is ff((xx) = ) = ½½ xx + + 44
http://faculty.valenciacollege.edu/ashaw17/

9
Table of Values for Linear Functions
• ff((xx) = - ) = - 22xx + + 66• Note that as x increases by 3 units, y decreases by 6 Note that as x increases by 3 units, y decreases by 6 units so the slope is - units so the slope is - 6 6 / 3 = - 2/ 3 = - 2
-6-6
-6-6
-6-6
x y
-3 12
00 6
3 0
6 -6
http://faculty.valenciacollege.edu/ashaw17/
10
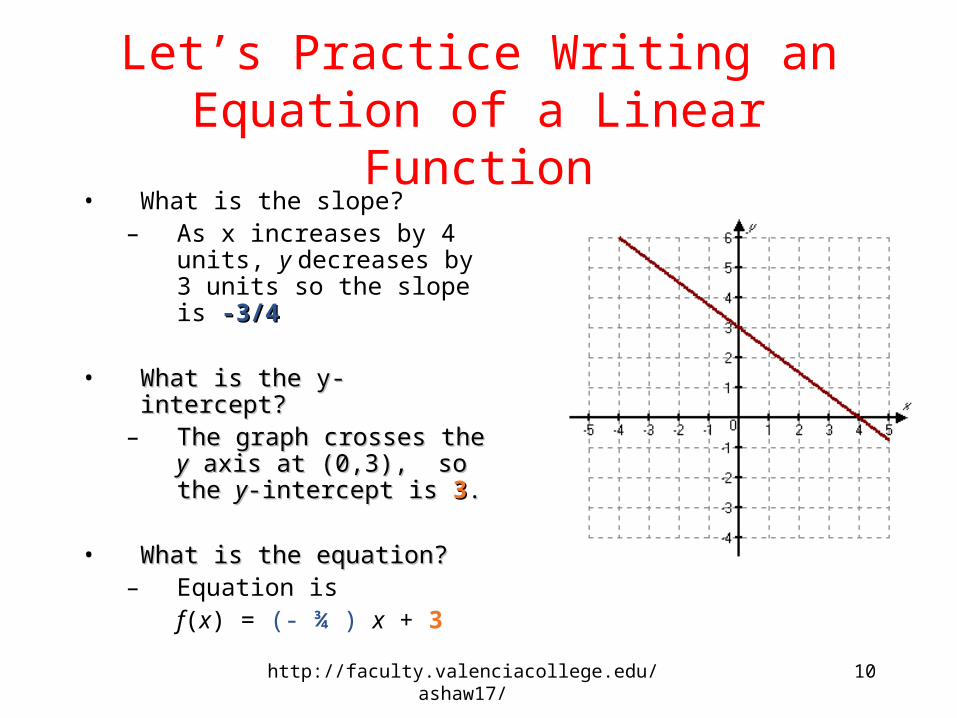
Let’s Practice Writing an Equation of a Linear Function
• What is the slope?– As x increases by 4
units, y decreases by 3 units so the slope is -3/4-3/4
• What is the y-intercept?What is the y-intercept?– The graph crosses the The graph crosses the yy
axis at (0,3), so the axis at (0,3), so the yy--intercept is intercept is 33..
• What is the equation?What is the equation?– Equation is
f(x) = (- ¾ ) x + 3
http://faculty.valenciacollege.edu/ashaw17/
11
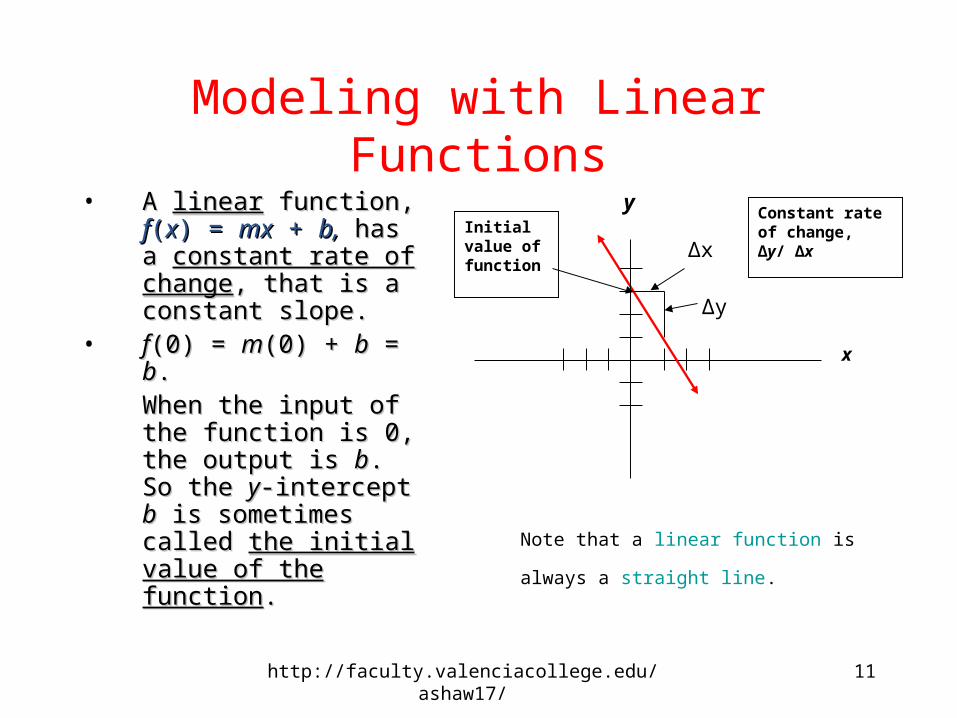
Modeling with Linear Functions
• A A linearlinear function, function, ff((xx) = ) = mxmx + + b,b, has a has a constant constant rate of changerate of change, that is a , that is a constant slope.constant slope.
• ff(0) = (0) = mm(0) + (0) + bb = = bb. . When the input of the When the input of the function is 0, the output function is 0, the output is is bb. So the . So the yy-intercept -intercept bb is sometimes called is sometimes called the initial value of the the initial value of the functionfunction..
Δx
Δy
x
yConstant rate of change, Δy/ ΔxInitial
value of function
Note that a linear function is always a
straight line.
http://faculty.valenciacollege.edu/ashaw17/

12
The Linear Function Model
• To model a quantity that is changing at a constant rate, the To model a quantity that is changing at a constant rate, the following may be used.following may be used.
ff((xx)) = (constant rate of change) = (constant rate of change)xx + initial amount+ initial amount
• BecauseBecause– constant rate of changeconstant rate of change corresponds to the corresponds to the slopeslope – initial amountinitial amount corresponds to the corresponds to the yy - - interceptintercept
this is simplythis is simply ff((xx)) = = mmxx + + bb
http://faculty.valenciacollege.edu/ashaw17/

13
Example of Modeling with a Linear Function
• A A 50-gallon50-gallon tank is initially full of water and being drained at a tank is initially full of water and being drained at a constant rate of 10 gallons per minuteconstant rate of 10 gallons per minute. Write a formula that . Write a formula that models the number of gallons of water in the tank after models the number of gallons of water in the tank after xx minutes.minutes.
• The water in the tank is changing at a constant rate, so the The water in the tank is changing at a constant rate, so the linear function model linear function model ff((xx)) = (constant rate of change) = (constant rate of change)xx + + initial amountinitial amount applies. applies.
• So So ff((xx) = (-) = (-10 gal/min10 gal/min) () (xx min) + min) + 50 gal50 gal. . Without specifically writing the units, Without specifically writing the units, this is this is ff((xx) = -10 ) = -10 xx + 50 + 50
1 2 3 4 5 6
403020
50
10
60
Time (minutes)
W
ater
(ga
llon
s)http://faculty.valenciacollege.edu/ashaw17/

14
What is a Scatterplot?• Scatterplot may be the most common and most effective
display for data. – In a scatterplot, you can see patterns, trends,
relationships, and even the occasional extraordinary value sitting apart from the others.
•This figure shows a positive association between the year since 1900 and the % of people who say they would vote for a woman president.•As the years have passed, the percentage who would vote for a woman has increased.
http://faculty.valenciacollege.edu/ashaw17/
15
The Linear Model
• The linear model is just an equation of a straight line through the data.
– The points in the scatterplot don’t all line up, but a straight line can summarize the general pattern.
– The linear model can help us understand how the values are associated.
http://faculty.valenciacollege.edu/ashaw17/
16
The Linear Model and the Predicted Value
• The model won’t be perfect, regardless of the line we draw.
• Some points will be above the line and some will be below.
• The estimate made from a model is the predicted value.
http://faculty.valenciacollege.edu/ashaw17/
17
The Least Square Regression Line
• We approximate our linear model with
f(x) = ax + b • This model says that our predictions from our
model follow a straight line.• If the model is a good one, the data values will
scatter closely around it.
http://faculty.valenciacollege.edu/ashaw17/
18
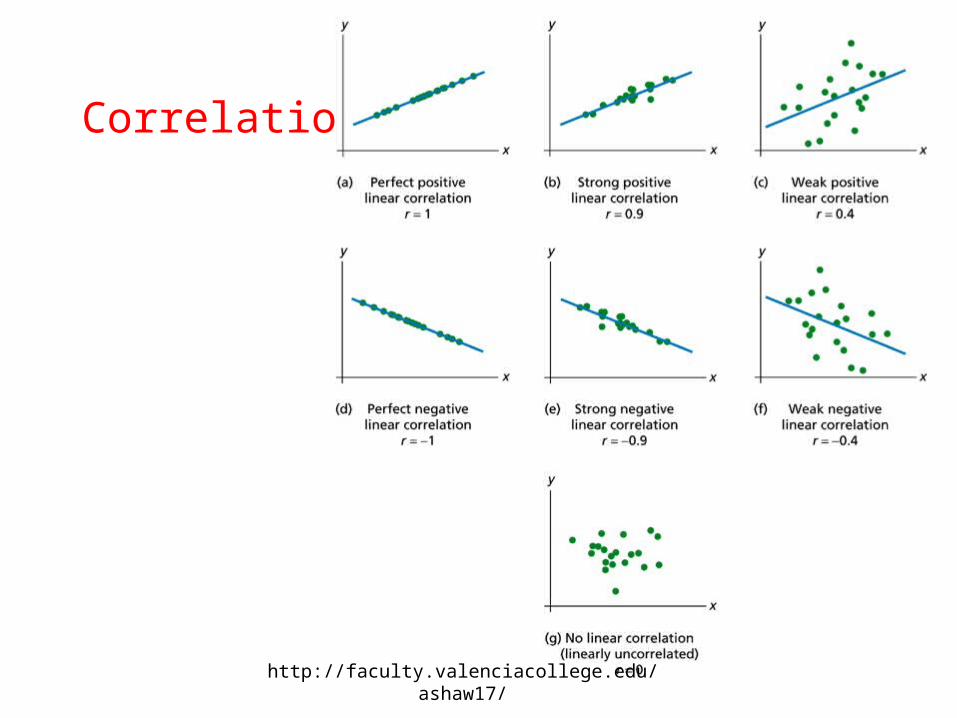
What is Correlation?
• Regression and correlation are closely related. Correlation measures the strength of the linear association between two variables: x and y.
• Correlation treats x and y symmetrically: – The correlation of x with y is the same as the correlation of
y with x. Correlation has no units.
• Correlation is always between -1 and +1. – Correlation can be exactly equal to -1 or +1, but these
values are unusual in real data because they mean that all the data points fall exactly on a single straight line.
– A correlation near zero corresponds to a weak linear association.
http://faculty.valenciacollege.edu/ashaw17/
19
Correlation
http://faculty.valenciacollege.edu/ashaw17/

20
How to Use Calculator to Find the Correlation Coefficient, r?
Here are the steps:Here are the steps:
1.1. Under Under STATSTAT EDITEDIT choose choose ““1: Edit1: Edit,,”” enter the values for both enter the values for both variables: x and y, under column title L1 and L2.variables: x and y, under column title L1 and L2.
2.2. Now, hit Now, hit 2nd2nd CATALOGCATALOG (on the zero key) to turn on the correlation (on the zero key) to turn on the correlation coefficientcoefficient’’s calculation feature of your TI-83/84+ calculator. Scroll s calculation feature of your TI-83/84+ calculator. Scroll down until you find down until you find Dia9nosticOnDia9nosticOn. Hit . Hit ENTERENTER twice. It should say twice. It should say Done. (From now on, your calculator will be able to find Done. (From now on, your calculator will be able to find correlation, unless the battery is dead.)correlation, unless the battery is dead.)
3.3. Under Under STATSTAT CALCCALC choose choose ““4: LinReg(ax+b)4: LinReg(ax+b),,”” enter enter ““L1,L2L1,L2”” and and hit hit ENTERENTER. (You now see not only . (You now see not only ““rr,,”” but also the but also the linear linear regression line y=ax+b.)regression line y=ax+b.)
Please go through the Calculator Tutorial on this topic.
http://faculty.valenciacollege.edu/ashaw17/
21
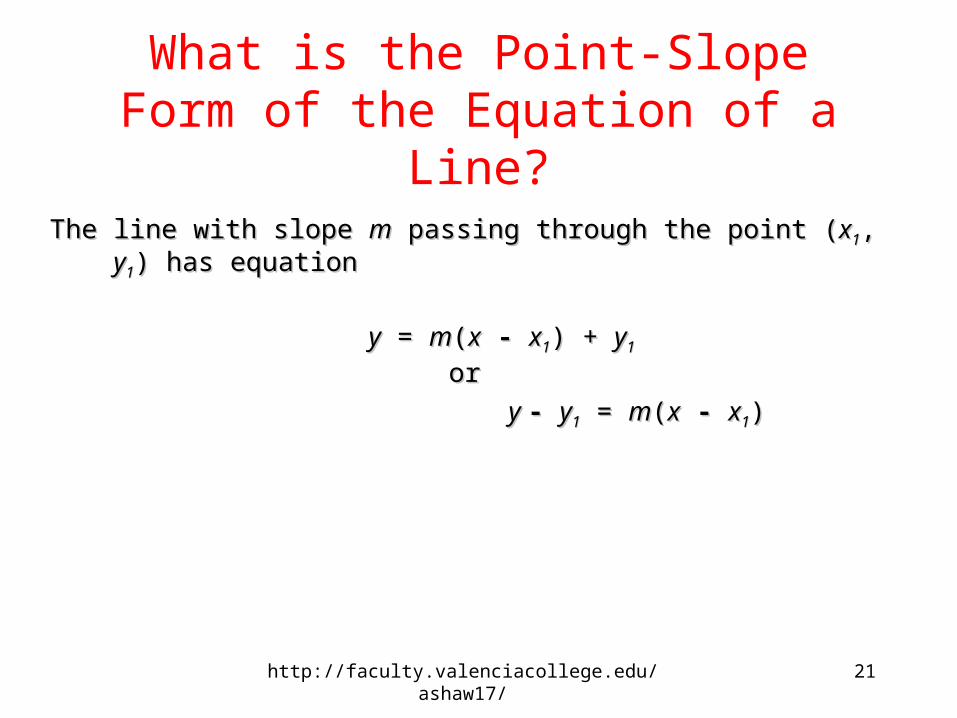
What is the Point-Slope Form of the Equation of a Line?
The line with slope The line with slope mm passing through the point ( passing through the point (xx11, , yy11) has equation ) has equation
yy = = mm((xx -- xx11) + ) + yy11
oror
y y -- yy11 = = mm((xx -- xx11))
http://faculty.valenciacollege.edu/ashaw17/

22
How to Write the Equation of the Line How to Write the Equation of the Line Passing Through the Points Passing Through the Points
((--4, 2) and (3, 4, 2) and (3, --5)5)• To write the equation of the line using To write the equation of the line using point-slope formpoint-slope form
yy = = m m ((xx -- xx11) + ) + yy11
the the slopeslope mm and a and a pointpoint ((xx11, , yy11) are needed.) are needed.
– Let (Let (xx11, , yy11) = () = (33, , --55).).– Calculate Calculate mm using the two given points. using the two given points.
– Equation is Equation is yy = = --11 ((xx -- 33 ) + () + (-5-5))– This simplifies to This simplifies to yy = = --xx + 3 + 3 + (-5)+ (-5)
yy = = --xx - 2 - 2
http://faculty.valenciacollege.edu/ashaw17/

23
Slope-Intercept Form
• The line with The line with slope slope mm and and yy-intercept -intercept bb is given byis given by
yy = = mm xx + + bb
http://faculty.valenciacollege.edu/ashaw17/

24
How to Write the Equation of a line passing through
the point (0,-2) with slope ½?½?
• Since the point (0, Since the point (0, --2) has an 2) has an xx-coordinate of 0, the point is a -coordinate of 0, the point is a yy-intercept. Thus -intercept. Thus bb = = --22
• Using Using slope-intercept formslope-intercept form
yy = = m xm x + + bb
the equation is the equation is
yy = (½ = (½) x) x - - 22
http://faculty.valenciacollege.edu/ashaw17/

25
What is the Standard Form for the Equation of a Line?
ax + by = cax + by = c
is standard form for the equation of a line.is standard form for the equation of a line.
http://faculty.valenciacollege.edu/ashaw17/
26
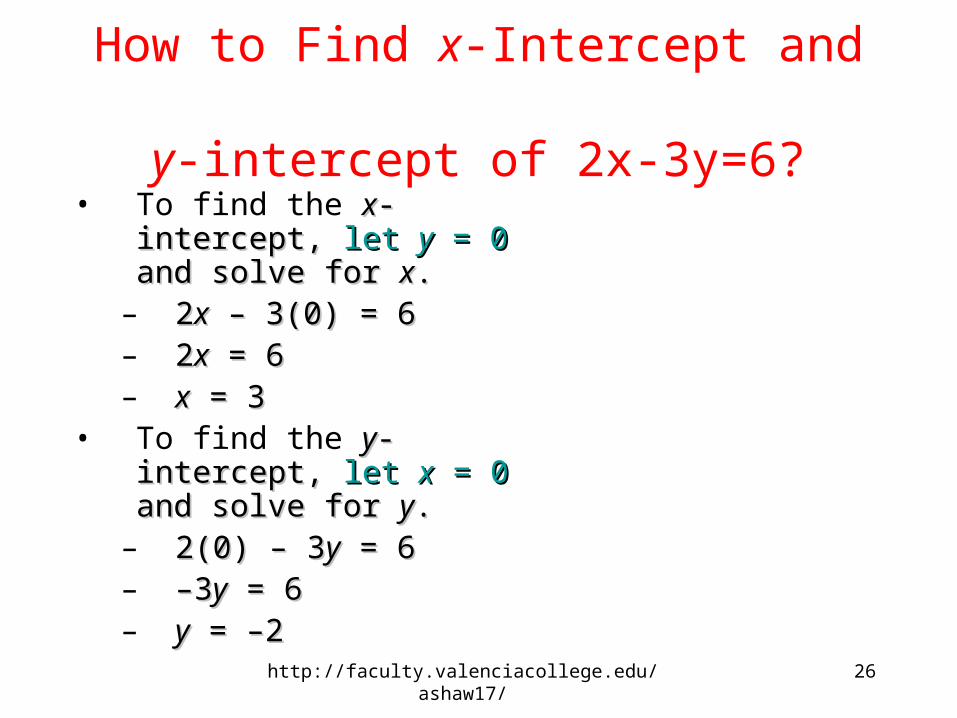
How to Find x-Intercept and y-intercept of 2x-3y=6?
• To find the xx-intercept, -intercept, let let yy = 0 = 0 and solve for and solve for xx..
– 22xx – 3(0) = 6 – 3(0) = 6– 22xx = 6 = 6– xx = 3 = 3
• To find the yy-intercept, -intercept, let let xx = 0 = 0 and solve for and solve for yy..
– 2(0) – 32(0) – 3yy = 6 = 6– ––33yy = 6 = 6– yy = –2 = –2
http://faculty.valenciacollege.edu/ashaw17/
27
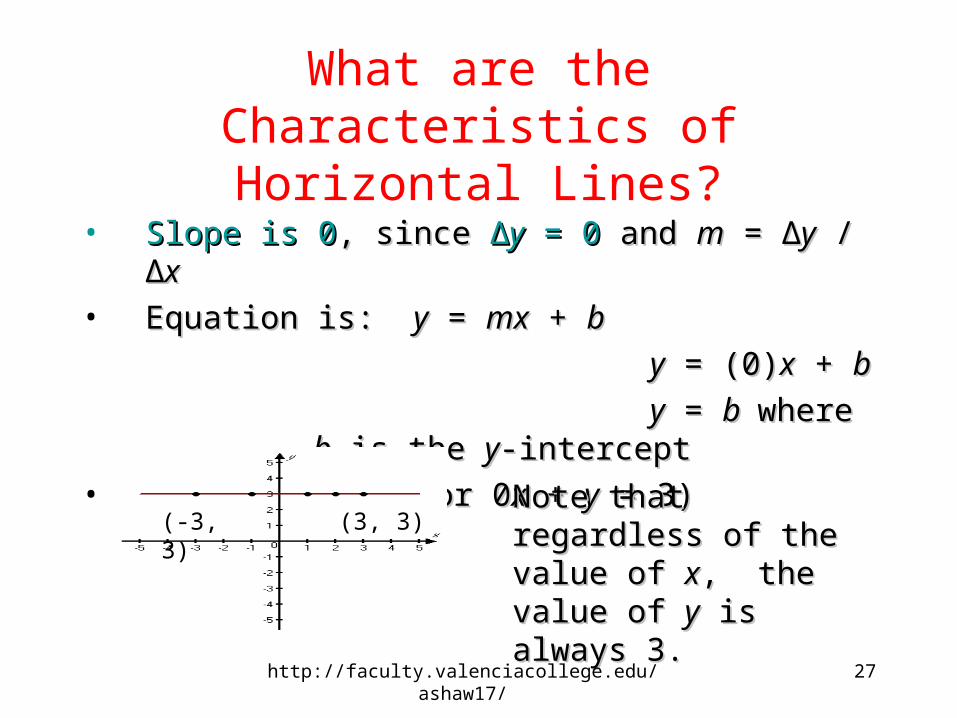
What are the Characteristics of Horizontal Lines?
• Slope is 0Slope is 0, since , since ΔΔyy = 0 = 0 and and mm = = ΔΔyy / / ΔΔxx • Equation is: Equation is: yy = = mxmx + + bb
yy = (0) = (0)xx + + bb
yy = = b b where where bb is the is the yy-intercept-intercept
• Example:Example: y = 3 y = 3 (or 0(or 0xx + + yy = 3) = 3)Note that regardless of Note that regardless of the value of the value of xx, the , the value of value of yy is always 3. is always 3.
(-3, 3) (3, 3)
http://faculty.valenciacollege.edu/ashaw17/
28
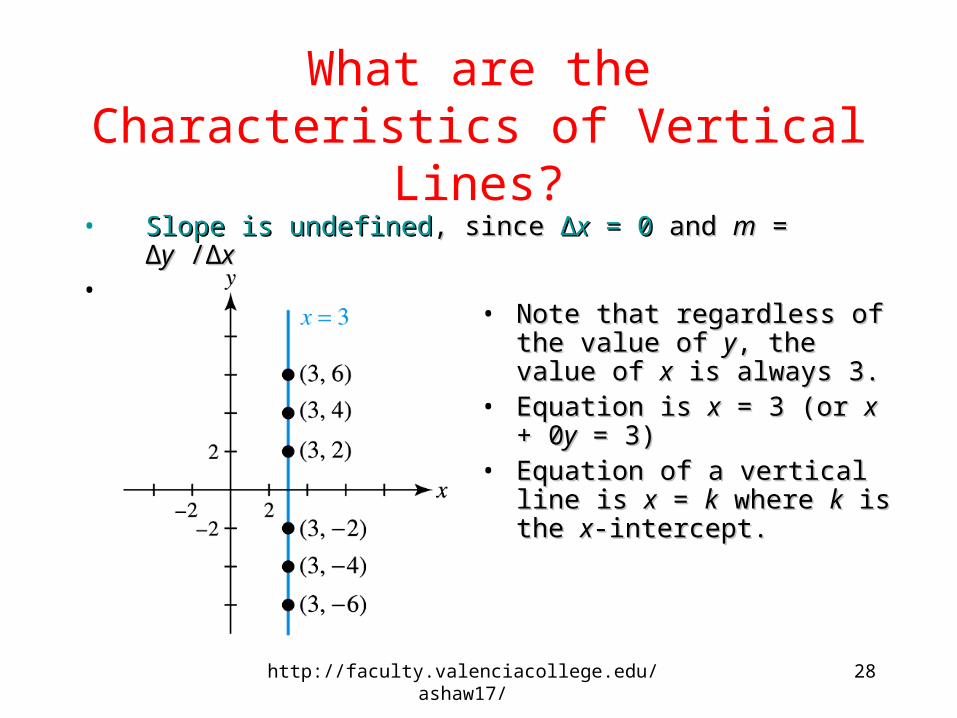
What are the Characteristics of Vertical Lines?
• Slope is undefinedSlope is undefined, since , since ΔΔxx = 0 = 0 and and mm = = ΔΔyy / /ΔΔxx • Example:Example:
• Note that regardless of the value Note that regardless of the value of of yy, the value of , the value of xx is always 3. is always 3.
• Equation is Equation is xx = 3 (or = 3 (or xx + 0 + 0yy = 3) = 3)• Equation of a vertical line is Equation of a vertical line is xx = = kk
where where kk is the is the xx-intercept.-intercept.
http://faculty.valenciacollege.edu/ashaw17/
29
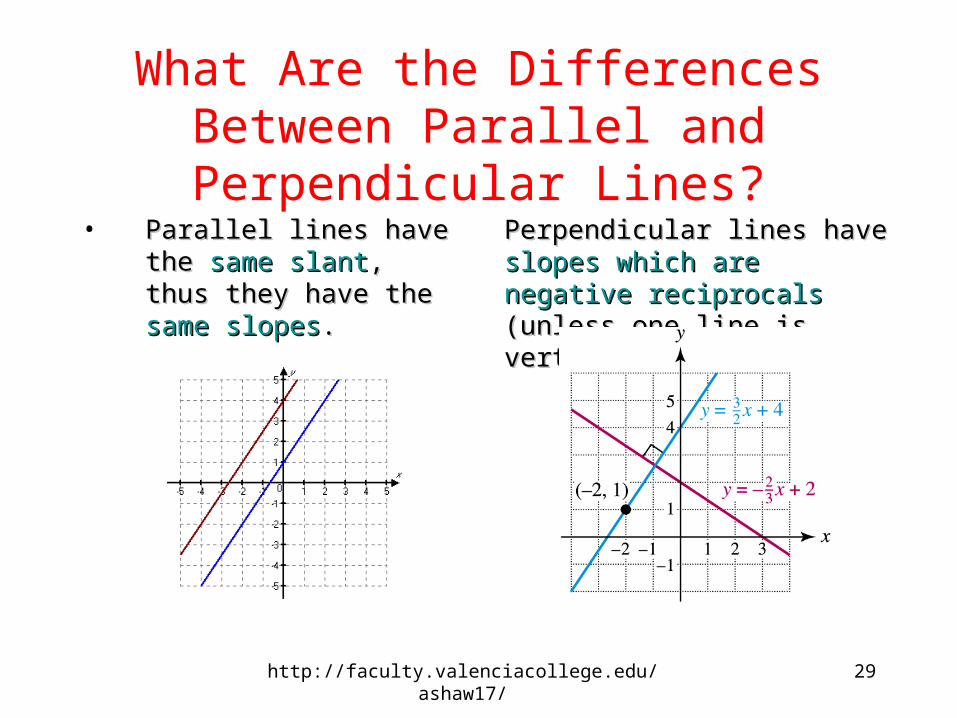
What Are the Differences Between Parallel and Perpendicular Lines?
• Parallel lines have the Parallel lines have the same slantsame slant, thus they , thus they have the have the same slopessame slopes..
Perpendicular lines have Perpendicular lines have slopes slopes which are negative reciprocalswhich are negative reciprocals (unless one line is vertical!)(unless one line is vertical!)
http://faculty.valenciacollege.edu/ashaw17/
30
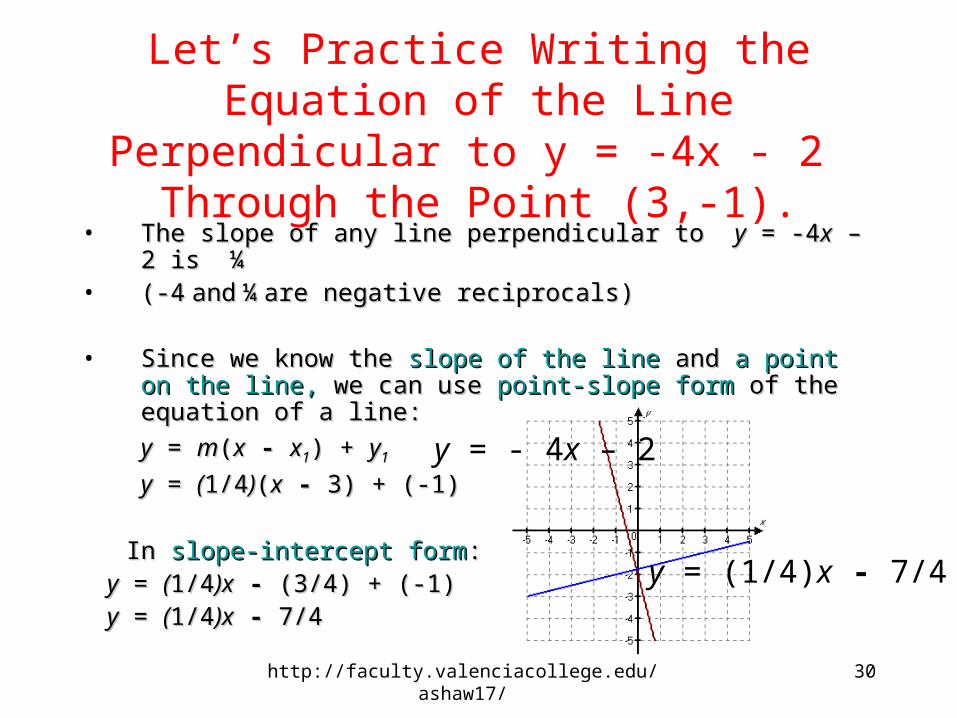
Let’s Practice Writing the Equation of the Line Perpendicular to y = -4x - 2
Through the Point (3,-1).• The slope of any line perpendicular to The slope of any line perpendicular to yy = -4 = -4xx – 2 is ¼ – 2 is ¼ • (-4(-4 andand ¼¼ are negative reciprocals) are negative reciprocals)
• Since we know the Since we know the slope of the lineslope of the line and and a point on the line,a point on the line, we can use we can use point-slope formpoint-slope form of the equation of a line: of the equation of a line:
yy = = mm((xx -- xx11) + ) + yy11
yy = = ((1/41/4))((xx -- 3) + (-1) 3) + (-1)
In In slope-intercept formslope-intercept form:: yy = = ((1/41/4)x)x -- (3/4) + (-1) (3/4) + (-1) yy = = ((1/41/4)x)x -- 7/4 7/4
y = - 4x – 2
y = (1/4)x - 7/4
http://faculty.valenciacollege.edu/ashaw17/
31
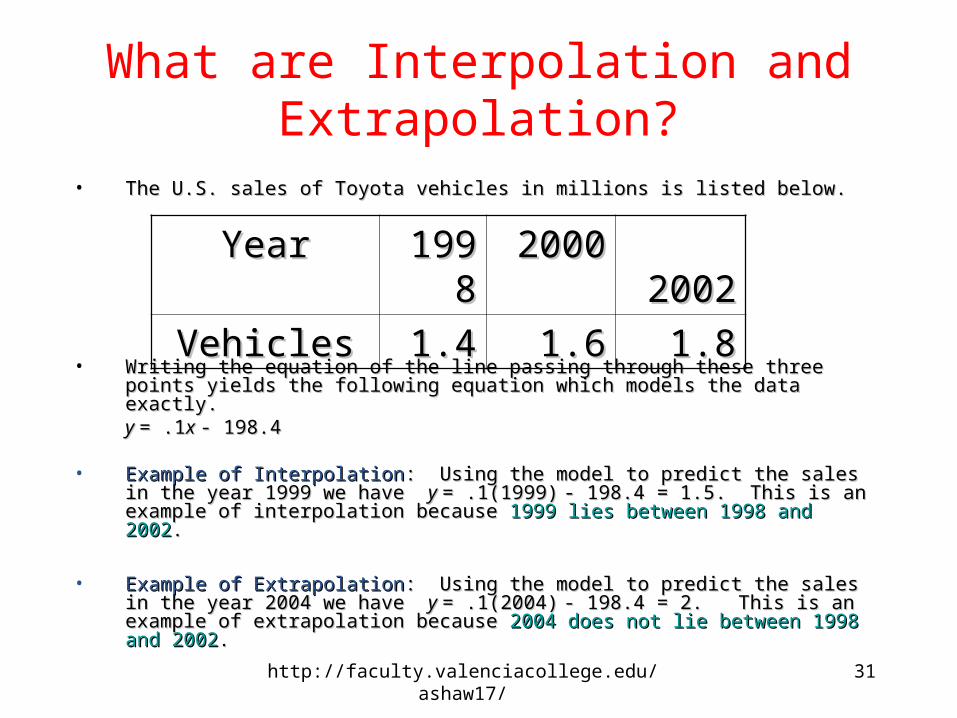
What are Interpolation and Extrapolation?
• The U.S. sales of Toyota vehicles in millions is listed below. The U.S. sales of Toyota vehicles in millions is listed below.
• Writing the equation of the line passing through these three points Writing the equation of the line passing through these three points yields the following equation which models the data exactly. yields the following equation which models the data exactly.
y y = .1= .1x x - 198.4- 198.4
• Example of InterpolationExample of Interpolation: Using the model to predict the sales in the : Using the model to predict the sales in the year 1999 we have year 1999 we have y y = .1(1999)= .1(1999) - 198.4 = 1.5. This is an example of - 198.4 = 1.5. This is an example of interpolation because interpolation because 1999 lies between 1998 and 20021999 lies between 1998 and 2002..
• Example of ExtrapolationExample of Extrapolation: Using the model to predict the sales in the : Using the model to predict the sales in the year 2004 we have year 2004 we have y y = .1(2004)= .1(2004) - 198.4 = 2. This is an example of - 198.4 = 2. This is an example of extrapolation because extrapolation because 2004 does not lie between 1998 and 20022004 does not lie between 1998 and 2002..
YearYear 19981998 20002000 20022002
VehiclesVehicles 1.41.4 1.61.6 1.81.8
http://faculty.valenciacollege.edu/ashaw17/
32
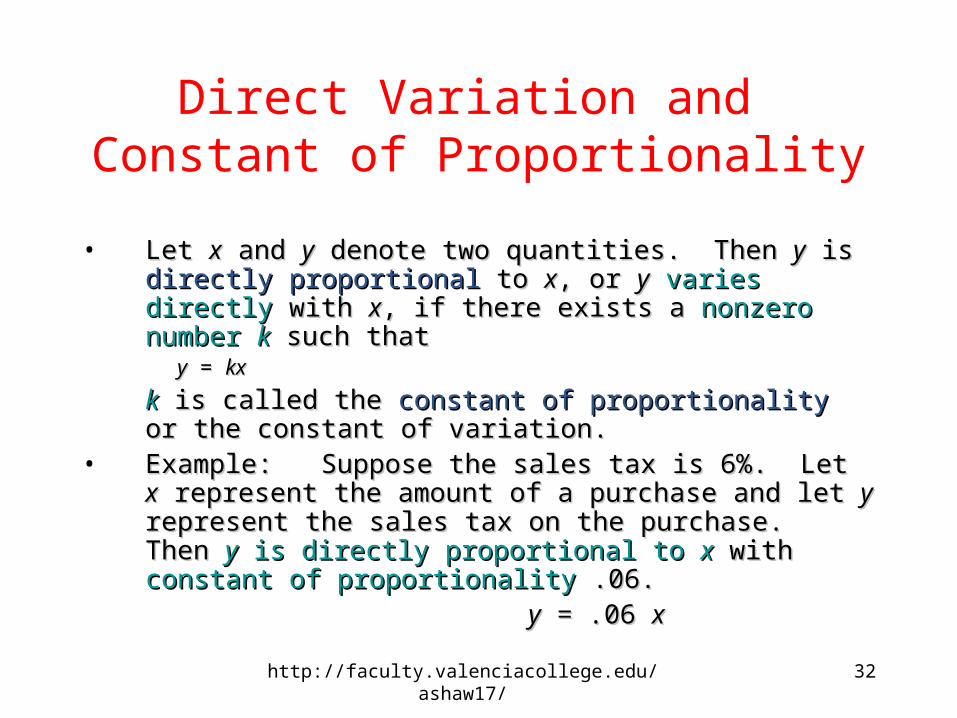
Direct Variation and Constant of Proportionality
• Let Let xx and and yy denote two quantities. Then denote two quantities. Then yy is is directly directly proportionalproportional to to xx, or , or yy varies directlyvaries directly with with xx, if there exists a , if there exists a nonzero number nonzero number kk such that such that
yy = = kxkx
kk is called the is called the constant of proportionalityconstant of proportionality or the constant of or the constant of variation.variation.
• Example: Suppose the sales tax is 6%. Let Example: Suppose the sales tax is 6%. Let xx represent the represent the amount of a purchase and let amount of a purchase and let yy represent the sales tax on the represent the sales tax on the purchase. Then purchase. Then yy is directly proportional to is directly proportional to xx with with constant of constant of proportionalityproportionality .06. .06.
yy == .06 .06 xx
http://faculty.valenciacollege.edu/ashaw17/

33
Here is an Example of Solving a Problem Involving Direct Variation
• Sales tax Sales tax yy on a purchase is on a purchase is directly proportionaldirectly proportional to the to the amount of the purchase amount of the purchase xx with the constant of proportionality with the constant of proportionality being the % of sales tax charged. If the sales tax on a $110 being the % of sales tax charged. If the sales tax on a $110 purchase was $8, purchase was $8, what is the sales tax ratewhat is the sales tax rate (constant of (constant of proportionality)? Find the tax on a $90 purchase. proportionality)? Find the tax on a $90 purchase.
– Since Since yy is directly proportional to is directly proportional to xx, , yy = = kxkx. To . To find find kk, we , we are given that when are given that when xx = $110, = $110, yy = $8, so = $8, so
• 8 8 = 110= 110kk and and kk = 8/110 = .0727. Thus the sales tax = 8/110 = .0727. Thus the sales tax rate is 7.27%.rate is 7.27%.
– To find the tax on a $90 purchase, To find the tax on a $90 purchase, • yy = .0727 = .0727xx so when so when xx = $90, = $90, yy = .0727($90) = $6.54 = .0727($90) = $6.54
http://faculty.valenciacollege.edu/ashaw17/
34
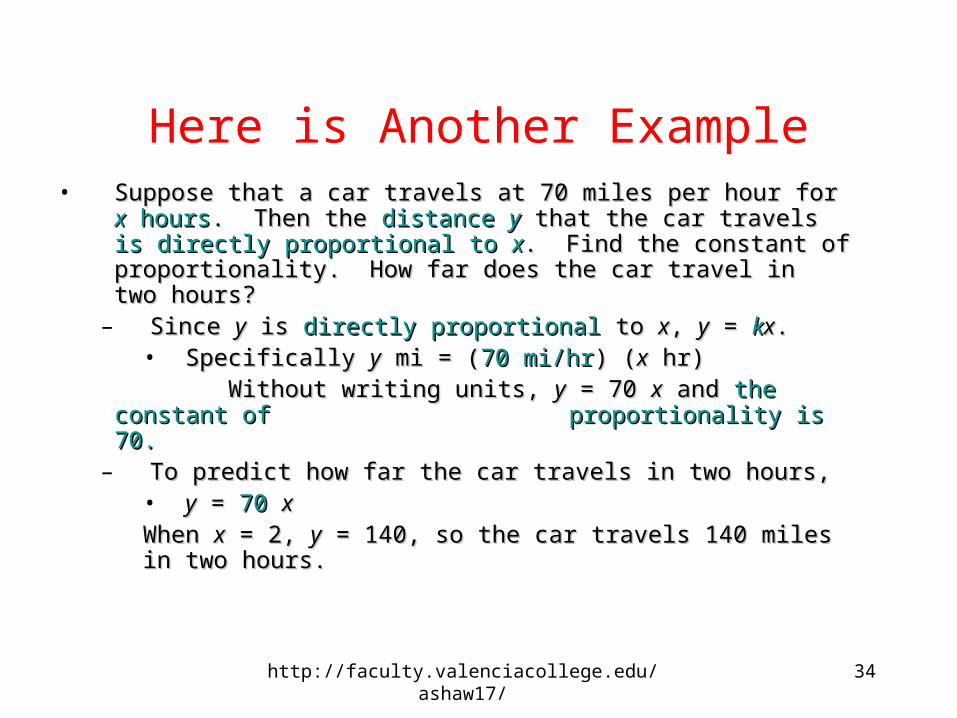
Here is Another Example• Suppose that a car travels at 70 miles per hour for Suppose that a car travels at 70 miles per hour for xx hours hours. .
Then the Then the distance distance yy that the car travels that the car travels is directly proportional is directly proportional to to xx. Find the constant of proportionality. How far does the . Find the constant of proportionality. How far does the car travel in two hours?car travel in two hours?
– Since Since yy is is directly proportionaldirectly proportional to to xx, , yy = = kkxx. . • Specifically Specifically yy mi = ( mi = (70 mi/hr70 mi/hr) () (xx hr) hr)
Without writing units, Without writing units, yy = 70 = 70 xx and and the constant of the constant of proportionality is 70. proportionality is 70.
– To predict how far the car travels in two hours, To predict how far the car travels in two hours, • yy = = 7070 xx
When When xx = 2, = 2, yy = 140, so the car travels 140 miles = 140, so the car travels 140 miles in two hours. in two hours.
http://faculty.valenciacollege.edu/ashaw17/
35
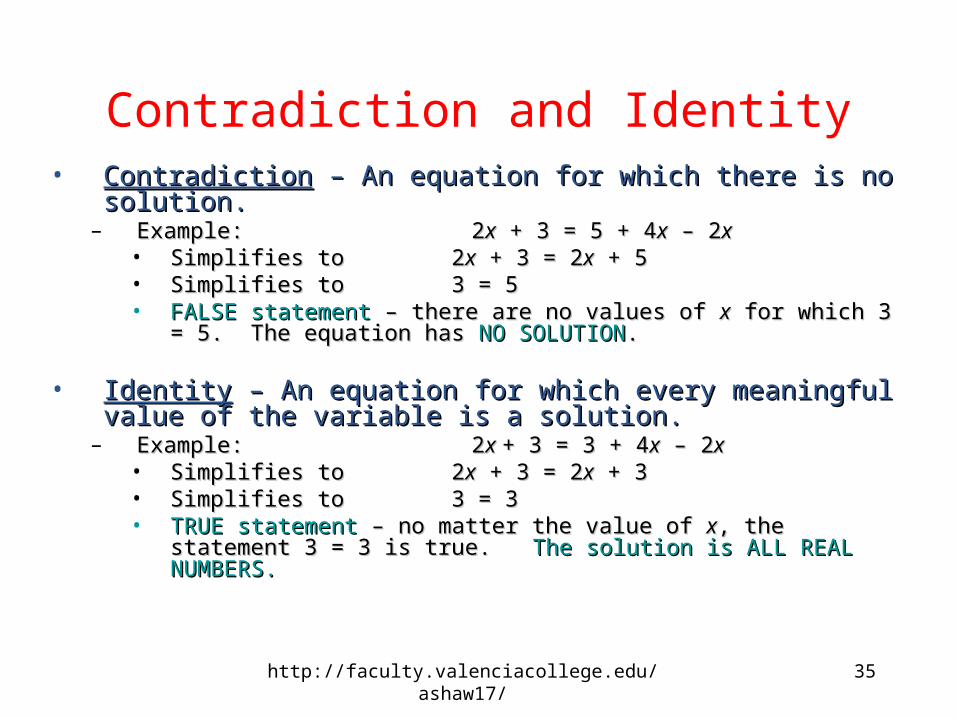
Contradiction and Identity• ContradictionContradiction – An equation for which there is no solution. – An equation for which there is no solution.
– Example: 2Example: 2xx + 3 = 5 + 4 + 3 = 5 + 4xx – 2 – 2xx• Simplifies to 2Simplifies to 2xx + 3 = 2 + 3 = 2xx + 5 + 5• Simplifies to 3 = 5 Simplifies to 3 = 5 • FALSE statementFALSE statement – there are no values of – there are no values of xx for which 3 = 5. for which 3 = 5.
The equation has The equation has NO SOLUTIONNO SOLUTION..
• IdentityIdentity – An equation for which every meaningful value of – An equation for which every meaningful value of the variable is a solution.the variable is a solution.
– Example: 2Example: 2x x + 3 = 3 + 4+ 3 = 3 + 4xx – 2 – 2xx• Simplifies to 2Simplifies to 2xx + 3 = 2 + 3 = 2xx + 3 + 3• Simplifies to 3 = 3 Simplifies to 3 = 3 • TRUE statementTRUE statement – no matter the value of – no matter the value of xx, the statement 3 = 3 , the statement 3 = 3
is true. is true. The solution is ALL REAL NUMBERS.The solution is ALL REAL NUMBERS.
http://faculty.valenciacollege.edu/ashaw17/
36
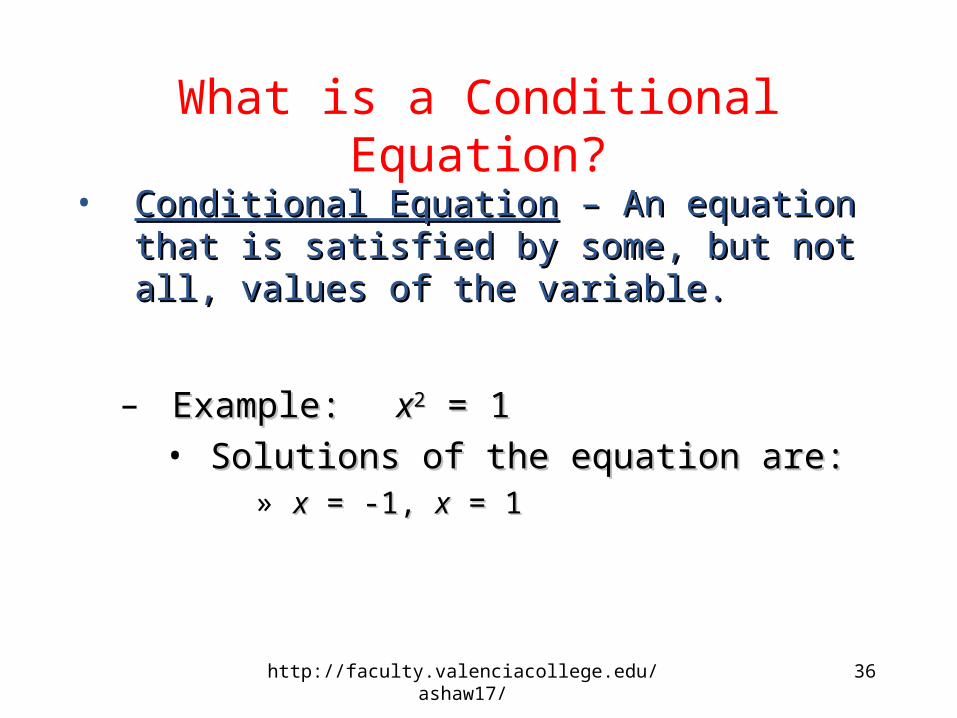
What is a Conditional Equation?
• Conditional EquationConditional Equation – An equation that is – An equation that is satisfied by some, but not all, values of the satisfied by some, but not all, values of the variable.variable.
– Example:Example: xx22 = 1 = 1• Solutions of the equation are: Solutions of the equation are:
» xx = -1, = -1, xx = 1 = 1
http://faculty.valenciacollege.edu/ashaw17/

37
Linear Equations in One Variable
• A A linear equation in one variable linear equation in one variable is an equation that can be is an equation that can be written in the form written in the form axax + + bb = 0 where a and b are real numbers = 0 where a and b are real numbers with with aa ≠≠ 0. (Note the power of x is always 1.) 0. (Note the power of x is always 1.)
• Examples of Examples of linear equationslinear equations in one variable: in one variable:– 55xx + 4 = 2 + 3 + 4 = 2 + 3xx simplifies to 2 simplifies to 2xx + 2 = 0 + 2 = 0
Note the power of x is always 1.Note the power of x is always 1.
– -1(-1(xx – 3) + 4(2 – 3) + 4(2xx + 1) = 5 simplifies to 7 + 1) = 5 simplifies to 7xx + 2 = 0 + 2 = 0 Note the power of x is always 1.Note the power of x is always 1.
• Examples of equations in one variable which are Examples of equations in one variable which are not not linear:linear:– xx22 = 1 = 1 (Note the power of x is NOT 1.)(Note the power of x is NOT 1.)
– (Note the power of x is NOT always 1.)(Note the power of x is NOT always 1.)
http://faculty.valenciacollege.edu/ashaw17/
38
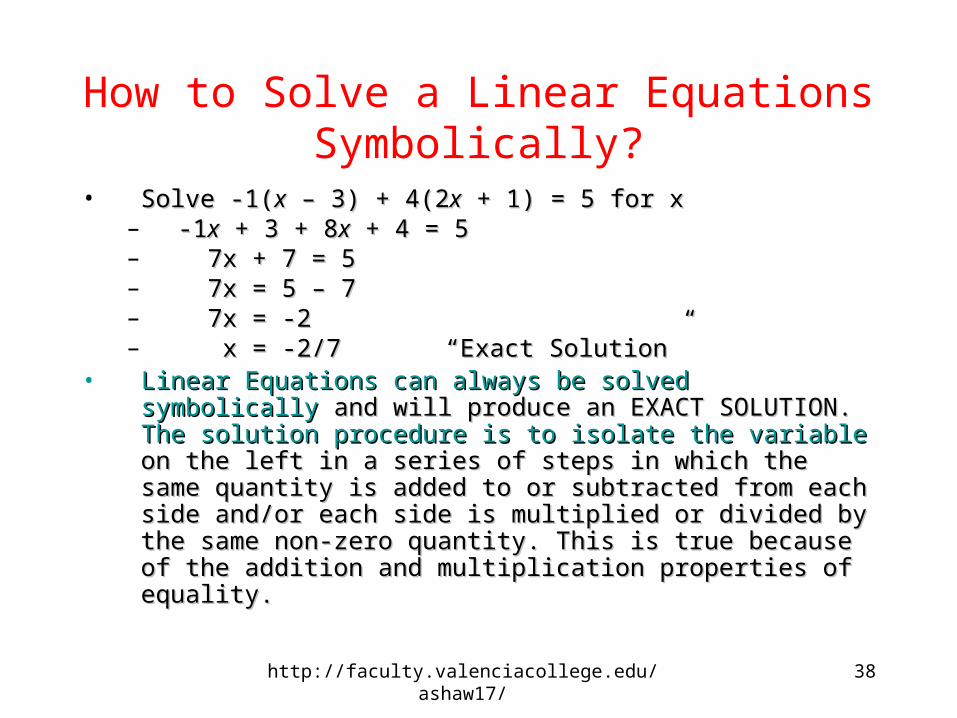
How to Solve a Linear Equations Symbolically?
• Solve -1(Solve -1(xx – 3) + 4(2 – 3) + 4(2xx + 1) = 5 for x + 1) = 5 for x– -1-1xx + 3 + 8 + 3 + 8xx + 4 = 5 + 4 = 5– 7x + 7 = 57x + 7 = 5– 7x = 5 – 77x = 5 – 7– 7x = -27x = -2– x = -2/7 x = -2/7 ““Exact SolutionExact Solution””
• Linear Equations can always be solved symbolicallyLinear Equations can always be solved symbolically and will and will produce an EXACT SOLUTION. produce an EXACT SOLUTION. The solution procedure is to The solution procedure is to isolate the variableisolate the variable on the left in a series of steps in which the on the left in a series of steps in which the same quantity is added to or subtracted from each side same quantity is added to or subtracted from each side and/or each side is multiplied or divided by the same non-and/or each side is multiplied or divided by the same non-zero quantity. This is true because of the addition and zero quantity. This is true because of the addition and multiplication properties of equality. multiplication properties of equality.
http://faculty.valenciacollege.edu/ashaw17/
39
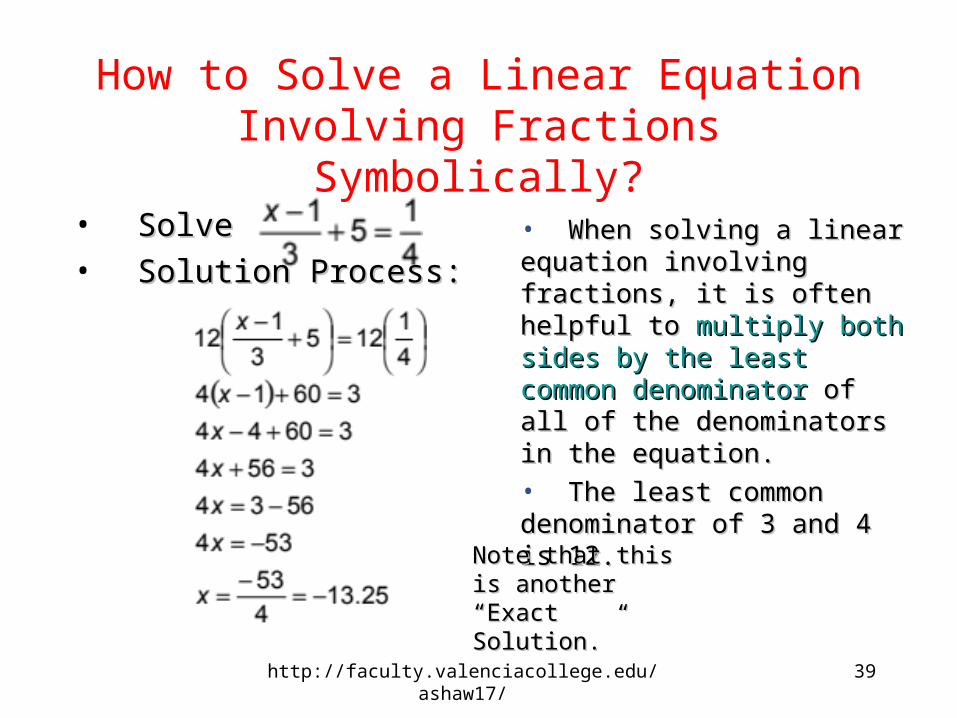
How to Solve a Linear Equation Involving Fractions Symbolically?
• SolveSolve• Solution Process:Solution Process:
• When solving a linear When solving a linear equation involving fractions, it is equation involving fractions, it is often helpful to often helpful to multiply both multiply both sides by the least common sides by the least common denominatordenominator of all of the of all of the denominators in the equation.denominators in the equation.• The least common The least common denominator of 3 and 4 is 12.denominator of 3 and 4 is 12.
Note that this is Note that this is another another ““Exact Exact Solution.Solution.””
http://faculty.valenciacollege.edu/ashaw17/

40
How to Solve a Linear Equation Graphically?
• SolveSolve
• Solution Process:Solution Process:– Graph Graph
in a window in which in a window in which the graphs intersect. the graphs intersect.
[[--20, 5, 1] by [20, 5, 1] by [--2, 2, 1]2, 2, 1]
http://faculty.valenciacollege.edu/ashaw17/

41
How to Solve a Linear Equation Graphically?(Cont.)
– Locate Locate points of intersectionpoints of intersection. . xx-coordinates of points of -coordinates of points of intersection are intersection are solutionssolutions to the equation. to the equation.
The solution to the equation is -13.25. The solution to the equation is -13.25.
This agrees exactly with the solution produced from the symbolic This agrees exactly with the solution produced from the symbolic method. Sometimes a graphical method will produce only an method. Sometimes a graphical method will produce only an approximate solutionapproximate solution..
[[--20, 5 1] by [20, 5 1] by [--2, 2, 1]2, 2, 1]
http://faculty.valenciacollege.edu/ashaw17/

42
Another Example
• SolveSolve[[--2, 15, 1] by [2, 15, 1] by [--2, 15, 1]2, 15, 1]
Approximate solutionApproximate solution (to (to
the nearest hundredth) is the nearest hundredth) is
8.20. The 8.20. The exact solutionexact solution of of
can be found by can be found by
solving solving symbolicallysymbolically..
http://faculty.valenciacollege.edu/ashaw17/

43
Intermediate Value Property
• Below is a table of values Below is a table of values
forfor ff((xx) = ) = xx33 – 3 – 3xx22 – 5 – 5Since Since ff is continuous is continuous, , and the points (3, and the points (3, ––5) 5) and (4,11) satisfy and (4,11) satisfy ff, we , we know that x assumes know that x assumes every value every value between between ––5 5 and 11and 11 at least once. at least once. Thus we know that the Thus we know that the graph graph has an has an xx-intercept -intercept between between xx = 3 and = 3 and xx = 4 = 4..
http://faculty.valenciacollege.edu/ashaw17/
44
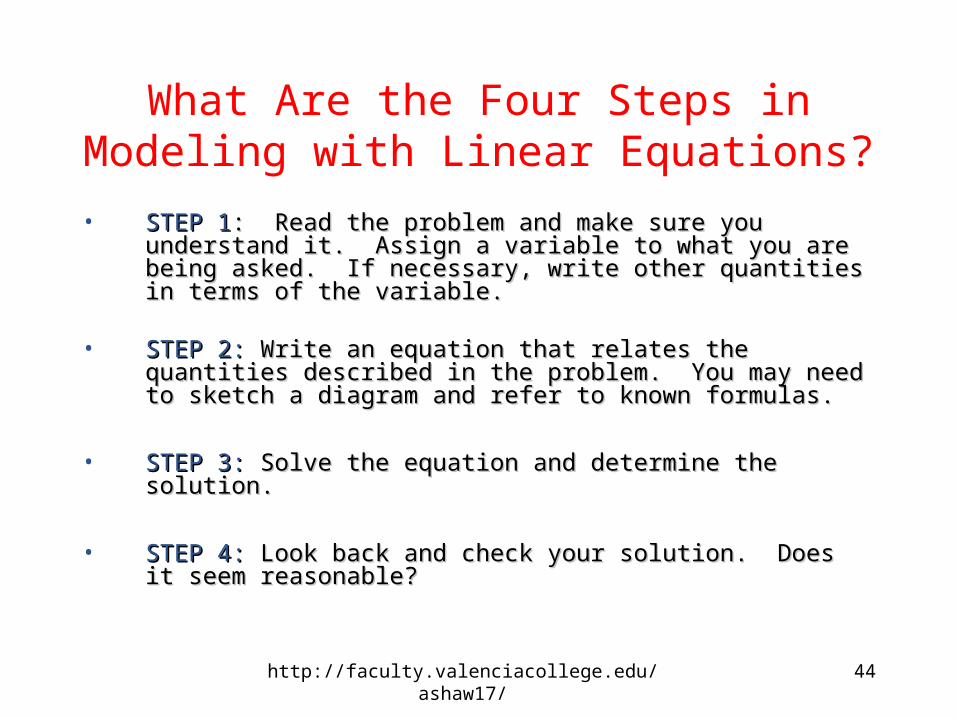
What Are the Four Steps in Modeling with Linear Equations?
• STEP 1STEP 1: Read the problem and make sure you understand it. : Read the problem and make sure you understand it. Assign a variable to what you are being asked. If necessary, write Assign a variable to what you are being asked. If necessary, write other quantities in terms of the variable. other quantities in terms of the variable.
• STEP 2:STEP 2: Write an equation that relates the quantities described in Write an equation that relates the quantities described in the problem. You may need to sketch a diagram and refer to known the problem. You may need to sketch a diagram and refer to known formulas.formulas.
• STEP 3:STEP 3: Solve the equation and determine the solution. Solve the equation and determine the solution.
• STEP 4:STEP 4: Look back and check your solution. Does it seem Look back and check your solution. Does it seem reasonable?reasonable?
http://faculty.valenciacollege.edu/ashaw17/

45
Example of Modeling with Linear Equations
• In 2 hours an athlete travels 18.5 miles by running at 11 miles per In 2 hours an athlete travels 18.5 miles by running at 11 miles per hour and then by running at 9 miles her hour. How long did the hour and then by running at 9 miles her hour. How long did the athlete run at each speed?athlete run at each speed?
• STEP 1: STEP 1: We are asked to find the time spent running at each We are asked to find the time spent running at each speed. If we let speed. If we let xx represent the time in hours running at 11 miles represent the time in hours running at 11 miles per hour, then 2 – per hour, then 2 – xx represents the time spent running at 9 miles represents the time spent running at 9 miles per hour.per hour.
xx: Time spent running at 11 miles per hour: Time spent running at 11 miles per hour2 – x2 – x: Time spent running at 9 miles per hour: Time spent running at 9 miles per hour
• STEP 2: STEP 2: Distance Distance dd equals rate equals rate rr times time times time tt: that is, : that is, dd = = rtrt. In . In this example we have two rates (speeds) and two times. The this example we have two rates (speeds) and two times. The total distance must sum to 18.5 miles. total distance must sum to 18.5 miles.
d d = = rr11tt11 ++ r r22tt22
18.5 = 1118.5 = 11xx + 9(2 – + 9(2 – xx))
http://faculty.valenciacollege.edu/ashaw17/
46
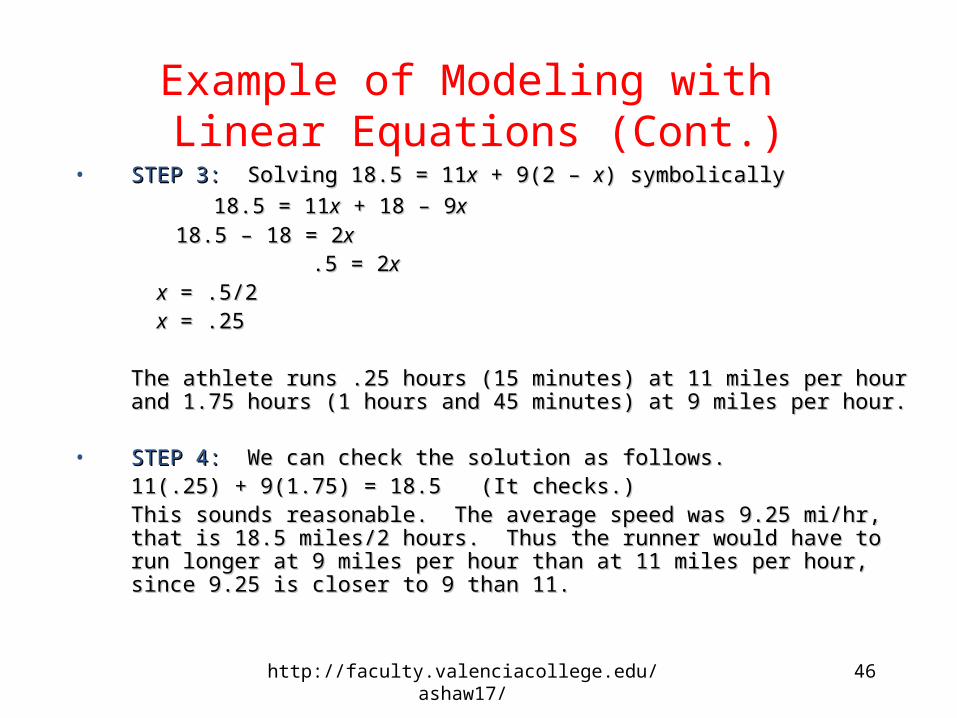
Example of Modeling with Linear Equations (Cont.)
• STEP 3: STEP 3: SolvingSolving 18.5 = 1118.5 = 11xx + 9(2 – + 9(2 – xx) symbolically) symbolically
18.5 = 1118.5 = 11xx + 18 – 9 + 18 – 9xx
18.5 – 18 = 218.5 – 18 = 2xx .5 = 2.5 = 2xx
xx = .5/2 = .5/2 xx = .25 = .25
The athlete runs .25 hours (15 minutes) at 11 miles per hour and 1.75 The athlete runs .25 hours (15 minutes) at 11 miles per hour and 1.75 hours (1 hours and 45 minutes) at 9 miles per hour.hours (1 hours and 45 minutes) at 9 miles per hour.
• STEP 4: STEP 4: We can check the solution as follows.We can check the solution as follows.11(.25) + 9(1.75) = 18.5 (It checks.)11(.25) + 9(1.75) = 18.5 (It checks.)
This sounds reasonable. The average speed was 9.25 mi/hr, that is 18.5 This sounds reasonable. The average speed was 9.25 mi/hr, that is 18.5 miles/2 hours. Thus the runner would have to run longer at 9 miles per miles/2 hours. Thus the runner would have to run longer at 9 miles per hour than at 11 miles per hour, since 9.25 is closer to 9 than 11. hour than at 11 miles per hour, since 9.25 is closer to 9 than 11.
http://faculty.valenciacollege.edu/ashaw17/

47
Let’s Try to Solve One More Linear
Equations Problem • Pure water is being added to a 25% solution of 120 milliliters of Pure water is being added to a 25% solution of 120 milliliters of
hydrochloric acid. How much water should be added to reduce it hydrochloric acid. How much water should be added to reduce it to a 15% mixture?to a 15% mixture?
• STEP 1: STEP 1: We need the amount of water to be added to 120 We need the amount of water to be added to 120 milliliters of 25% acid to make a 15% solution. Let this amount of milliliters of 25% acid to make a 15% solution. Let this amount of water be equal to water be equal to xx..
xx: Amount of pure water to be added: Amount of pure water to be addedxx + 120: Final volume of 15% solution + 120: Final volume of 15% solution
• STEP 2: STEP 2: The total amount of acid in the solution after adding the The total amount of acid in the solution after adding the water must equal the amount of acid before the water is added. water must equal the amount of acid before the water is added. The volume of pure acid after the water is added equals 15% of The volume of pure acid after the water is added equals 15% of xx + 120 milliliters, and the volume of pure acid before the water is + 120 milliliters, and the volume of pure acid before the water is added equals 25% of 120 milliliters. So we must solve the added equals 25% of 120 milliliters. So we must solve the equationequation
.15(.15(xx + 120) = .25(120) + 120) = .25(120)
http://faculty.valenciacollege.edu/ashaw17/
48
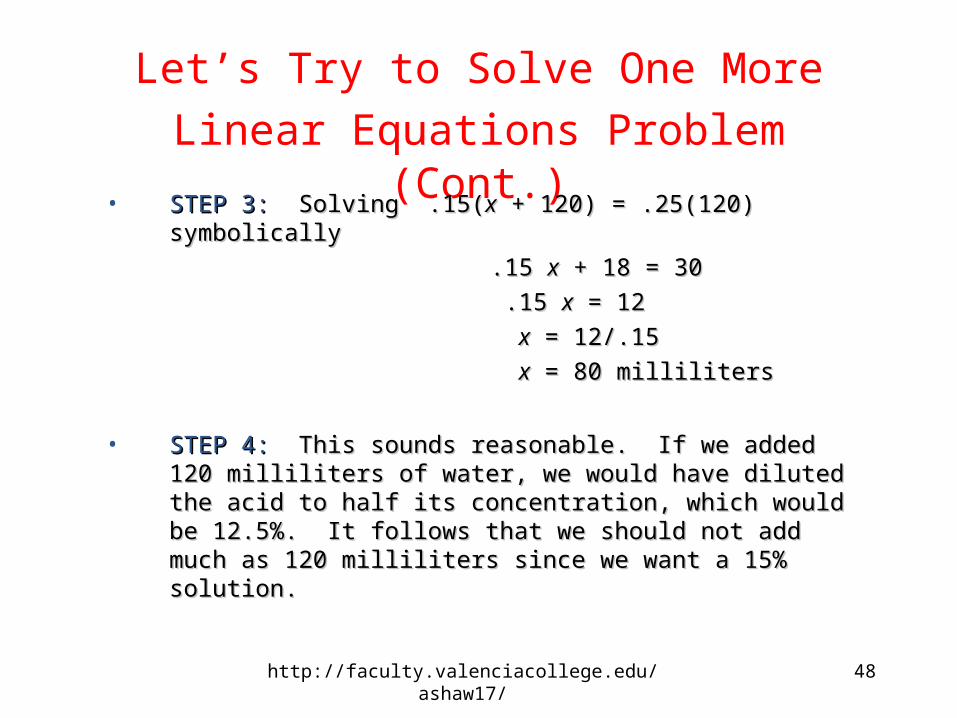
Let’s Try to Solve One More Linear
Equations Problem (Cont.)• STEP 3: STEP 3: Solving .15(Solving .15(xx + 120) = .25(120) symbolically + 120) = .25(120) symbolically
.15 .15 xx + 18 = 30 + 18 = 30
.15 .15 xx = 12 = 12
xx = 12/.15 = 12/.15
xx = 80 milliliters = 80 milliliters
• STEP 4: STEP 4: This sounds reasonable. If we added 120 milliliters of This sounds reasonable. If we added 120 milliliters of water, we would have diluted the acid to half its concentration, water, we would have diluted the acid to half its concentration, which would be 12.5%. It follows that we should not add much as which would be 12.5%. It follows that we should not add much as 120 milliliters since we want a 15% solution.120 milliliters since we want a 15% solution.
http://faculty.valenciacollege.edu/ashaw17/
49
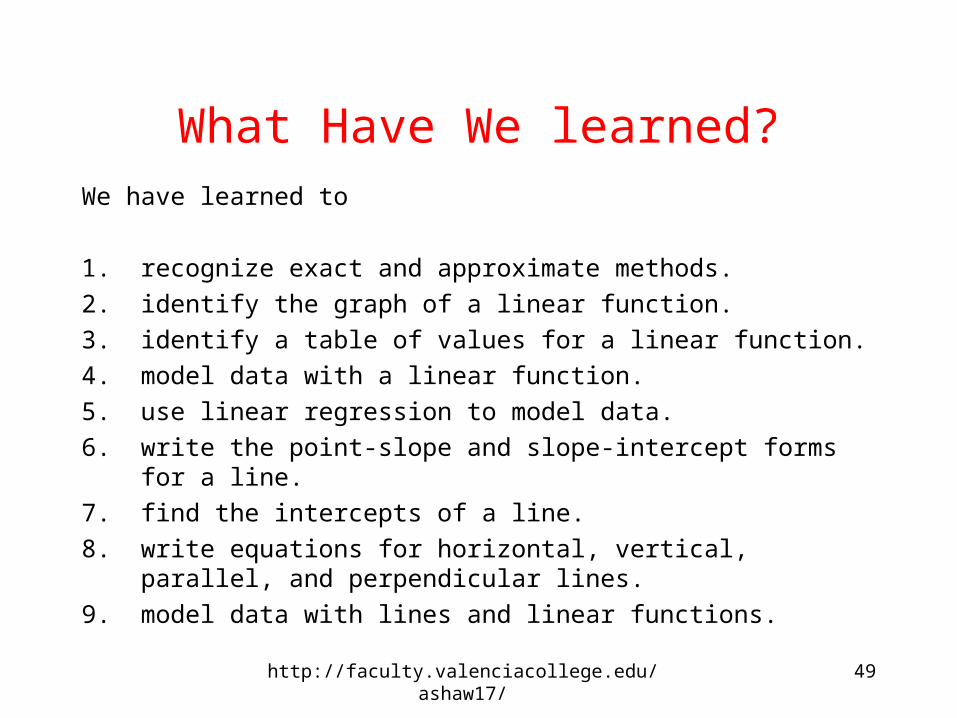
What Have We learned?We have learned to
1. recognize exact and approximate methods.
2. identify the graph of a linear function.
3. identify a table of values for a linear function.
4. model data with a linear function.
5. use linear regression to model data.
6. write the point-slope and slope-intercept forms for a line.
7. find the intercepts of a line.
8. write equations for horizontal, vertical, parallel, and perpendicular lines.
9. model data with lines and linear functions.
http://faculty.valenciacollege.edu/ashaw17/

50
What Have We Learned? (Cont.)
10. understand interpolation and extrapolation.11. use direct variation to solve problems.12. understand basic terminology related to equations.13. recognize linear equations symbolically.14. solve linear equations graphically and numerically.15. understand the intermediate value property.16. solve problem involving percentages.17. apply problem-solving strategies.
http://faculty.valenciacollege.edu/ashaw17/

51
Credit
Some of these slides have been adapted/modified in part/whole from the slides of the following textbook:
• Rockswold, Gary, Precalculus with Modeling and Visualization, 4th Edition• Rockswold, Gary, Precalculus with Modeling and Visualization, 5th Edition• Weiss, Neil A., Introductory Statistics, 8th Edition
http://faculty.valenciacollege.edu/ashaw17/


![Gro[ve] 1140 William Zenk](https://static.fdocuments.us/doc/165x107/568c526d1a28ab4916b6a0f4/grove-1140-william-zenk.jpg)